

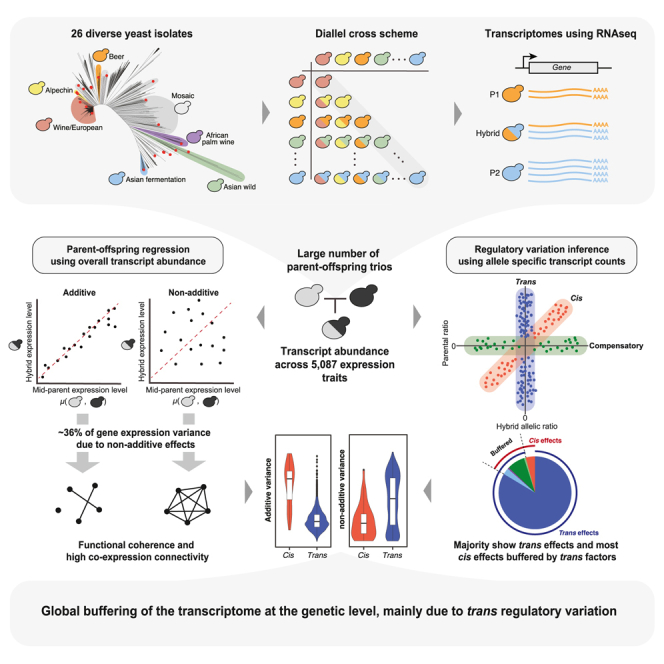
Summary
Gene expression variation, an essential step between genotype and phenotype, is collectively controlled by local (cis) and distant (trans) regulatory changes. Nevertheless, how these regulatory elements differentially influence gene expression variation remains unclear. Here, we bridge this gap by analyzing the transcriptomes of a large diallel panel consisting of 323 unique hybrids originating from genetically divergent Saccharomyces cerevisiae isolates. Our analysis across 5,087 transcript abundance traits showed that non-additive components account for 36% of the gene expression variance on average. By comparing allele-specific read counts in parent-hybrid trios, we found that trans-regulatory changes underlie the majority of gene expression variation in the population. Remarkably, most cis-regulatory variations are also exaggerated or attenuated by additional trans effects. Overall, we showed that the transcriptome is globally buffered at the genetic level mainly due to trans-regulatory variation in the population.
Keywords: diallel crosses, gene expression regulation, heritability, transcriptome buffering, yeast
Graphical abstract
Highlights
-
•
Diallel panel for dissecting genetic components underlying gene expression variation
-
•
Non-additive components account for 36% of gene expression trait heritability
-
•
Most cis-regulatory variation is buffered by additional trans-acting variants
-
•
Genes under trans-regulation show high non-additive variance and functional coherence
Tsouris et al. generated a large diallel hybrid panel using diverse natural yeast isolates and explored the gene expression variation across this population. They showed that the transcriptome is globally buffered at the genetic level, mainly due to genomic variants that act distantly (i.e., in trans) to the expression traits.
Introduction
Gene expression is an important molecular step translating genotypes into phenotypes, and its misregulation can have broad consequences in organismal traits.1,2,3,4 Dissecting the regulatory changes that underlie gene expression variation and its heritability can therefore provide important insights into the genetic basis of phenotypic diversity.5,6,7 Differences in gene expression between individuals are collectively influenced by variation in local regulatory elements (cis-acting) and distant regulatory genes (trans-acting).3 The interplay between cis- and trans-acting variants reflects the complex gene regulatory network and underlies the heritable gene expression variation in a population.
The identification of cis- and trans-regulatory variants in a population typically relies on statistical associations between genetic variants and gene expression levels through large-scale genomic and transcriptomic analyses. Mapping the loci involved in gene expression variation—i.e., expression quantitative trait loci (eQTL)—often requires a large population to have enough statistical power, especially to detect trans-eQTL due to the high number of possible positions to test compared to cis-eQTL.8,9 As a result, most human eQTL analyses using genome-wide association studies (GWASs) are limited to detecting only cis-acting variants.10,11,12 By contrast, transcriptomic surveys in model systems consistently show that trans-eQTL are more common than cis-eQTL and collectively explain a larger fraction of gene expression variance.13,14,15,16,17 However, even considering the effects of both cis- and trans-eQTL, the total phenotypic variance explained remained modest.8,14,15,18,19,20 Such variant-centric strategy overlooks the complex interaction between cis- and trans-regulatory variants acting on the same trait and could potentially lead to some extent to the observed missing heritability.18,21,22
Another way to identify cis- and trans-regulatory variation is through comparative analyses of allele-specific expression (ASE) patterns across purebred parental lines and their F1 hybrid.3 Although differences in allelic expression levels both within the hybrid and between parental lines indicate a cis-regulatory change, a trans-regulatory change will result in different expression levels in the parents but no difference in allelic expression within the hybrid because the trans-acting variants act equally on both alleles. ASE-based strategy has been extensively deployed to identify cis- and trans-regulatory divergence between species of Drosophila, mice, yeasts, several plants, and animals including primates,23,24,25,26,27,28,29,30,31,32,33,34,35,36 linking gene expression divergence to multiple morphological, developmental, and physiological differentiations at the interspecies level.27,29,31,32,33,34,35,36 Studies using intraspecific pairs of individuals also revealed cis- and trans-regulatory variation within the same species.37,38,39,40,41 Although the absolute proportion of cis- versus trans-regulatory changes varies depending on the studies, the consensus is that trans-factors often contribute more to intraspecies variation than interspecies divergence.42 Compared to eQTL analyses, ASE-based strategy focuses on the regulatory patterns at the gene level, better captures the biological reality, and is not affected by the statistical challenges as in GWAS. However, most ASE-based studies are often limited to one or a few parent-hybrid trios, where population-level variation is not considered.
A gene-centric view of the regulatory variation in a population should provide deeper insights into how cis and trans effects contribute to the heritability of gene expression. From this perspective, the ASE-based method has a unique advantage because heritability can be inferred based on parent-offspring regression, and both additive and non-additive components can be estimated with sufficiently large numbers of parent-hybrid trios. In comparison, variant-centric methods such as eQTL analysis focus mainly on the additive effect (narrow-sense heritability, or h2), whereas the total genetic effect on phenotypic variance (broad-sense heritability, or H2) remains elusive. Narrow-sense heritability estimated for gene expression traits in humans and other model systems is low, ranging from ∼0.06 to ∼0.30 depending on the studies,8,14,15,18,19 and evidences based on familial data in human suggest non-additive genetic component could explain part of the missing heritability in gene expression.18,21 In yeast, studies using a large biparental segregant panel with over 1,000 individuals showed similar estimates of narrow-sense heritability across gene expression traits compared to those from population-based estimates in humans.8,18,20 These estimates are lower than the h2 typically seen for organismal traits in segregant populations for the same cross,43 possibly suggesting a larger contribution of non-additive effects on gene expression. Identifying the regulatory variation at the population scale and reliably estimating the broad- and narrow-sense heritability is therefore needed to understand how regulatory changes contribute to additive and non-additive genetic components in gene expression.
Here, we bridge these gaps by generating high-quality transcriptomes across a large diallel panel consisting of 323 unique F1 hybrids, originating from 26 genetically divergent parental yeast isolates. Taking advantage of this diallel design, we estimated broad- and narrow-sense heritability on 5,087 transcript abundance traits. We showed that non-additive variance plays a major role in gene expression variation and accounts for 36% of the phenotypic variance on average. We calculated allele-specific read counts in parent-hybrid trios and characterized the regulatory patterns of ∼300,000 gene-trio combinations. We found that trans-regulatory changes underlie the majority of gene expression variation in the population, with most cis-regulatory variation also being exaggerated or attenuated by additional trans effects. We further showed that trans-regulatory variation is the main force driving the non-additive variance of gene expression traits.
Results
The transcription landscape across a diallel hybrid panel
We selected 26 genetically diverse natural isolates from the collection of 1,011 yeasts as the parental lines to generate a diallel hybrid panel44 (Figure 1A). The selected isolates originated from a wide range of environments (Figure 1B) and different geographical locations (Table S1) to broadly represent the genomic diversity in the species. The nucleotide divergence between each pair of parental lines ranges from 0.03% to 1.10%, with a mean divergence of 0.59% (Figure 1C). Stable haploids of the 26 parental lines were previously generated by replacing the HO locus with an antibiotic resistance cassette.45 We performed pairwise crosses and generated 351 genetically unique hybrids, including 325 heterozygous hybrids and 26 homozygous diploid parental types (Figure 1D; Table S2). We carried out RNA sequencing and obtained high-quality transcriptomes for 323 unique diploids, including all 26 homozygous parental lines, with a mean of 3.7 million reads per sample.
Figure 1.

Overview of the diallel design and the transcriptomic dataset
(A) Neighbor-joining tree based on the genetic diversity of 1,011 yeast isolates.44 Twenty-six parental isolates selected for the diallel panel are highlighted in red. Representative clades are annotated as in Peter et al.44 See Table S1 for detailed origins of the parental isolates.
(B) The ecological origin and distribution of the selected 26 parental isolates.
(C) Pairwise nucleotide diversity among the parental isolates. Mean divergence is indicated by the red dashed line.
(D) Schematics of the diallel crossing design. Homozygous parental diploids are highlighted in red. See Table S2 for detailed information about the generated hybrids.
(E) Schematics of the data acquisition strategy. For each hybrid, the transcript abundance (TPM) are measured for each annotated ORF, as well as allele-specific read counts across all discriminating sites in a given hybrid. Parental allele counts were extracted from the coverage data at the same sites.
(F) Final data metrics and numbers of accessory and core genes included for the subsequent analyses. See Table S3 for detailed annotations.
Using the previously established pangenome annotations,13,44 we obtained the overall and allele-specific expression levels (Figure 1E) (as transcripts per million [TPM]) for 6,186 genes that are expressed in at least half of the samples (TPM >0), consisting of 5,770 core genes that are invariably present in all 26 parental lines and 422 accessory genes, the majority of which (291/422) correspond to Saccharomyces paradoxus introgressed alleles (Figure 1F; Table S3; 1002 Yeast Genome datafile S1, see STAR Methods). We performed additional RNA sequencing for a subset of biological replicates, specifically for six heterozygous hybrids in duplicate and one parental diploid in triplicate (Table S2). Gene expression levels (TPM) correlate well between replicates, with correlation coefficients ranging from 0.92 to 0.99, with an average of 0.96 (Pearson’s R), indicating high reproducibility in our data (Figures S1A and S1B).
We previously generated a species-wide pan-transcriptomic dataset involving 969 natural isolates from the same strain collection.13 To evaluate the general gene expression behavior across the diallel hybrid panel against the previous population-level data, we calculated the mean expression level (i.e., abundance) and the mean absolute deviation across samples (i.e., dispersion) for each of the 6,186 genes in the final dataset. Both metrics showed good agreement between the diallel panel and the natural population, with a correlation coefficient of 0.79 for abundance and 0.72 for dispersion (Pearson’s R) (Figures S1C and S1D). These observations suggest that the diallel panel broadly captures the global gene expression variability of the population.
Non-additive genetic components contribute significantly to gene expression variation
Taking advantage of the diallel design, we calculated the H2 and h2 for each expression trait by estimating the combining abilities using Griffing’s model46 (STAR Methods). Briefly, for each heterozygous hybrid, the total expression level for a given gene can be decomposed into the average contributions of the parental lines (general combining ability [GCA]), the contribution due to the combination of the parents in a hybrid (specific combining ability [SCA]), and the residual variation that is unrelated to the parental origins. In this context, the additive variance component for a given trait corresponds to the fraction of phenotypic variance explained by the sum of GCA variance from the parents, whereas the non-additive component corresponds to the fraction of phenotypic variance due to the SCA variance. The H2 is therefore calculated as the sum of additive and non-additive genetic components, and the h2 corresponds to the additive component only. We obtained H2 and h2 estimates for 5,087 of the 6,186 expression traits (STAR Methods). Across these traits, the estimated H2 ranges from 0.08 to 0.99, with a median of 0.75, whereas the h2 ranges from 0.08 to 0.98, with a median of 0.31 (Figure 2A; Table S4). We applied an orthogonal strategy to estimate the h2 based on the genome-wide variants and the kinship matrix across all hybrids using a generalized linear model (STAR Methods). The resulting genome-wide additive heritability (h2g) is highly correlated with the h2 obtained based on the diallel model (Pearson’s R = 0.85, p < 2.2e−16) (Figure S2A).
Figure 2.

Broad- and narrow-sense heritability for genome-wide gene expression traits
(A) Distributions of broad- (gray) and narrow-sense heritability (white) estimates based on the diallel hybrid panel for 5,087 gene expression traits. Transcript abundance in white and gray, respectively. See Table S4 for all of the heritability estimates.
(B) Ternary plot showing the percentage of phenotypic variance controlled by additive, non-additive, and residual variance components. Dashed line marks the 50% threshold for each dimension.
(C) GSEA for additive, non-additive, and residual variance components, using standard GO BP terms. All terms with a nominal p < 0.05 are shown. Color scale corresponds to the normalized enrichment scores. Sizes of the circles indicate the number of genes annotated on each term. Full circle represents GO terms with an FDR <0.05. See Table S5 for detailed enrichment results.
(D) Mean pairwise expression profile correlation for genes in the same GO term with a nominal enrichment p < 0.05 for additive, non-additive, and residual variance components. Significant differences between enriched, and all terms are indicated with asterisks (n.s., non-significant; ∗∗∗Wilcoxon test p < 2.2e−16.
(E–M) Example hybrid-midparent and hybrid profile correlations for genes with high additive (E–G), non-additive (H–J), and residual (K–M) variance components. Example genes correspond to the top 2 leading edges in the GSEA results. Dashed red lines indicate the one-to-one correlation line (slope = 1) for visual guide. The heritability estimated is indicated for each example gene pair.
The distribution of different variance components is skewed toward the non-additive component (H2-h2) (Figure 2B). Non-additive variance component accounts for 36% of phenotypic variance on average, with approximately one-third of the genome (1,758 genes) mainly under non-additive control (H2-h2 > 0.5). By contrast, only 476 genes are mainly additive (h2 > 0.5). Genes that are mainly controlled by the residual variance (1,352 genes, 1 − H2 > 0.5) are characterized by an overall low phenotypic variance across the population (Figure S2B), suggesting variation due to expression stochasticity and random noise.
To explore the relationship between different variance components and gene functions, we ranked genes based on their additive, non-additive, and residual variance and performed gene set enrichment analyses (GSEAs) using standard Gene Ontology (GO) biological process (BP) terms. Genes that are highly additive are only significantly enriched for a couple of small terms related to protein transport to vacuole (GO: 0043328, GO: 0043162) (Figure 2C; Table S5). Highly non-additive genes showed the most significant enrichments, specifically for terms related to translation (GO: 0006421, GO: 0002181), ribosomal biogenesis (GO: 0042254, GO: 0042273), and sulfur amino acid biosynthesis (GO: 0000097, GO: 0009092, GO: 0009070) (Figure 2C; Table S5). No significant enrichment (false discovery rate [FDR] <5%) were found for genes that show high residual variance (Figure 2C; Table S5). These results show that genes under non-additive control may display higher functional coherence compared to the residual component, which is consistent with stochastic variation and noise.
To further evaluate the functional coherence among genes that are differentially affected by different variance components, we examined the expression correlation by calculating the pairwise expression profile similarity among genes that belonged to all GO terms with a nominal enrichment p < 0.05 for additive, non-additive, and residual variance components (Figure 2D). Compared to all GO terms, terms enriched for non-additive variance showed significantly higher pairwise gene expression profile similarity on average (one-sided Wilcoxon test, p < 2.2e−16), in contrast to terms that are enriched for additive or residual variance (Figure 2D). As examples, we took the top two leading edges (i.e., the top two genes that contribute most to the enrichment score) for GO terms with the lowest enrichment p value for each of the three variance component rankings (Figures 2E–2M). The top leading edges that are highly additive correspond to COS8 (H2 = 0.99, h2 = 0.95) and COS1 (H2 = 0.92, h2 = 0.89); both are ubiquitin cargos involved in protein transport to vacuole via the multivesicular body sorting pathway (GO: 0043328). Both genes show high additive effect as evidenced by the correlated expression levels between the hybrids and the mid-parent values (mean expression between the corresponding homozygous parental diploids) (Figures 2E and 2F). However, these two genes are not co-regulated across the hybrids, with a profile similarity of ∼0.46 between the gene pair (Pearson’s R) (Figure 2G). Top leading-edge genes that are highly non-additive correspond to RPS25A and RPS31, and both are ribosomal proteins involved in translation. Both of these genes are characterized by low correlations between the hybrid expression levels and the mid-parent values (Figures 2H and 2I). However, these two genes show highly correlated expression profiles, suggesting co-regulated expressions in the hybrids that are not predicted based on the parental mean. Finally, for genes that show high residual variance, the most significant GO term corresponds to RNA polymerase II transcriptional preinitiation complex assembly (GO: 0051123), with a nominal enrichment p = 0.001 and an FDR = 0.76. The top leading edges correspond to MED2, a subunit of the RNA polymerase II mediator complex, and TAF14, a DNA binding protein involved in RNA polymerase II transcription initiation and in chromatin modification. As expected, no correlation is observed between the hybrid expression level and the mid-parent value (Figures 2K and 2L) or between the expression profiles across hybrids (Figure 2M).
Overall, the diallel design allowed us to effectively decompose the variance components associated with the majority of gene expression traits. The estimated additive component (h2) using the diallel model is highly correlated with genome-wide additive effect (h2g) estimated orthogonally using genomic variants across individuals, indicating the validity of our approach. Compared to the residual variance, non-additive variance components contain more biological information and affect functionally coherent sets of genes. In general, non-additive genetic variance contributes significantly to gene expression variation, explaining 36% of the phenotypic variance on average.
Widespread transcriptomic buffering via cis-trans compensation
The genetic component of gene expression variation can be attributed to regulatory variants acting in cis and/or in trans. In principle, local DNA sequence variation that affects gene expression (e.g., mutations in promoter regions) are cis-acting, whereas trans-regulatory variants act distantly (e.g., transcription factors) and can occur anywhere in the genome. The diallel panel consists of pairwise combinations of a large number of parent-hybrid trios. For each trio, the regulatory variation in cis or trans can be determined by comparing the allelic expression in the hybrid to the corresponding expression levels in the parental lines. Specifically, for a given gene, if the expression difference between the two parental lines is due to cis-regulatory change, then the corresponding alleles will result in ASE in the hybrid (Figure 3A). Conversely, in the case of trans-regulatory change, no ASE would be observed because the trans-acting factor affects equally both alleles in the hybrid background (Figure 3B).
Figure 3.

Systematic characterization of regulatory variation across the population
(A and B) Schematic depiction for cis- (A) and trans- (B) regulatory variation and the resulting ASE patterns across parent (par.)-hybrid (hyb.) trios.
(C) Regulatory variation patterns identified across 285,777 gene-trio combinations. Log2 fold changes between alleles in the hybrid and between the parental lines at the same sites are indicated on x and y axes, respectively. Different regulatory patterns are color coded.
(D) Criteria for classifying different regulatory patterns based on 1- and 2-sample ASE test significance. See detailed description in STAR Methods.
(E) Number and distribution for different regulatory patterns across the whole dataset. Upper bar indicates the number of the null category versus other categories with significant regulatory changes. Pie chart indicates the proportions of all of the significant regulatory patterns, with the outer ring indicating cases that are under cis (red) or trans (blue) controls.
(F) Number of gene-trio combinations per regulatory category (left) and the number of unique genes affected in the corresponding groups (right). See detailed results in 1002 Yeast Genome datafile S2; see STAR Methods.
We determined the allele-specific read counts at each discriminating site within the gene open reading frame (ORF) in the heterozygous hybrids and in the corresponding parental lines. We removed low coverage sites (sum of hybrid allele counts <30 and sum of parental counts <60) and excluded cases in which one of the gene copies is absent in either one or both parents. We also excluded any trios that showed inconsistent chromosome-level allele balance patterns in the hybrid or between the parental lines (STAR Methods). In total, 179 unique parent-hybrid trios were retained for further analyses, comprising ∼1.2 million sites across 285,777 gene-trio combinations (1002 Yeast Genome datafile S2; see STAR Methods). The final data covered 5,089 genes, including 219 accessory genes from S. paradoxus introgression (1002 Yeast Genome datafile S2; see STAR Methods). On average, ∼1,600 genes contained at least one such discriminating site per trio (Figures S3A and S3B), for which the regulatory variation can be inferred by comparing the allelic ratio change in the hybrid to the parental ratio at the same sites.
For each of the 285,777 gene-trio combinations, we performed one-sample ASE tests both in the hybrid and between the parental pair by considering the allele counts across all sites within the same gene (STAR Methods). For cases that showed significant allelic ratio differences (|log2 fold-change| > 1 and FDR <0.05) in both the hybrid and the parents, two-sample ASE tests were subsequently performed to identify significant changes between the hybrid and parental allelic ratios (FDR <0.05) (STAR Methods). Based on the test results, we categorized cases into different regulatory patterns (Figures 3C and 3D). Overall, ∼76% (217,297 of 285,777) of all of the cases showed no significant allelic expression differences in either the hybrid or the parents and are classified as the null type, whereas ∼24% (68,480 of 285,777) displayed significant regulatory variation (Figure 3E). Among these 68,480 cases, ∼16% (11,227 of 68,480) showed evidence for cis effect, whereas ∼96% (65,679 of 68,480) showed trans effect, with ∼12% (8,423 of 68,480) showing significance for both (Figure 3E). Cases that are exclusively controlled by cis or trans effects represent ∼4% (2,804 of 68,480) and ∼84% (57,253 of 68,480), respectively (Figure 3F). Cases with combined cis and trans effects were further grouped into four distinct regulatory patterns (Figures 3C and 3D). In the “attenuating” group (∼0.9%, 590 of 68,480), the cis effect in the hybrid is decreased in magnitude compared to the parental expression levels by additional trans factors (Figure 3D). The “reinforcing” group (∼3%, 1,980 of 68,480) describes the opposite event, in which the cis effect in the hybrid is exaggerated in magnitude compared to the parental expression variation (Figure 3D). The “compensatory” group (∼8%, 5,403 of 68,480) corresponds to the majority of cases with both cis and trans effects. In these cases, the cis regulatory effect is completely canceled out by additional trans factors, resulting in significant ASE within the hybrid but no expression difference between the parents (Figure 3D). Finally, the “reverse” group corresponds to extreme cis/trans interaction events, in which the allelic variation in the hybrid is in the complete opposite direction from the parental variation (Figure 3D). These events are rare and represent 0.7% (450 of 68,480) of all of the cases with significant regulatory variation (Figures 3D–3F).
Globally, trans-regulatory variation is more common than cis, which is consistent with previous observations using eQTL analyses8,13 and ASE analyses.23,37,40,41,47 Remarkably, the majority of cis-regulatory variations are influenced by additional trans effect. Among all gene-trio combinations showing cis-regulatory variation, ∼75% (8,423 of 11,227) also show trans-regulatory changes, and most of such trans effects act in the opposite direction relative to the observed cis effect, specifically in the attenuating (590 of 11,227; ∼5%) and the compensatory (5,403 of 11,227; ∼48%) groups. These observations suggest that cis-regulatory variations are globally compensated in trans, resulting in a general buffering effect at the transcriptome level.
Regulatory variation in trans plays a major role in non-additive heritability
In our diallel scheme, the regulatory variation associated with each gene is characterized across multiple hybrid-parent trios, which allows us to probe how different regulatory changes at the individual level (i.e., any given gene-trio combination) affect global gene expression features such as heritability and different variance components across the full hybrid panel. In total, 3,791 genes (of 5,089 with discriminating sites) are characterized in at least 10 hybrids, which were further analyzed (Figure S4A; 1002 Yeast Genome datafile S2, see STAR Methods). For a given gene, the regulatory variation across different hybrids can be relatively conserved. For example, GTO1, encoding for a glutathione transferase, is most exclusively controlled in cis (Figure 4A). The cis-regulatory change is due to a single parental line, Y12, an isolate associated with Asian fermentation, in which GTO1 is known to be differentially overexpressed compared to other subpopulations.13 Another example with conserved regulatory variation is seen for CYC7, encoding for an isoform of cytochrome c, in which case, the regulatory variation among different hybrids is mainly trans-acting (Figure 4B). For cases with combined cis and trans effects such as the compensatory pattern, the regulatory variation across hybrids can be complex, such as the case for RPL4B, encoding for a ribosomal subunit (Figure 4C). In this case, although the majority of hybrids show a compensatory pattern, other patterns are also seen due to different combinations of cis- and trans-acting factors in different hybrids.
Figure 4.

Functional enrichments for genes with distinct regulatory patterns and associated examples
(A–C) Examples of genes that are mainly under cis (A), trans (B), and compensatory (C) regulatory controls. Log2 fold changes between alleles in the hybrid and between the parental lines at the same sites are shown. Different regulatory patterns are color coded.
(D) GSEA results for genes that are mainly under cis, trans, and compensatory regulatory controls. All GO terms with a nominal p < 0.05 are shown. Terms with significant enrichment (FDR <0.05) are shown as solid circles. Color scale corresponds to the normalized enrichment scores. Circle sizes indicate the number of genes associated with each term. See detailed enrichment results in Table S6.
We ranked genes based on the number of cis-only, trans-only, and compensatory cases across the hybrid panel and performed GSEA based on standard GO BP terms in order to see whether genes with similar cellular functions could display conserved regulatory patterns across the population. Significant enrichments were observed for the compensatory and the trans-only groups (Figure 4D). Genes that showed the most compensatory patterns are enriched for cytoplasmic translation (GO: 0002181) (Figure 4D; Table S5). However, genes that showed the most trans-only cases are enriched for cellular respiration–related processes (GO: 0022904, GO: 0042775, GO: 0045333, GO: 0006122), glycogen metabolic processes (GO: 0005977, GO: 0032787), and ribosome biogenesis (GO: 0042254) (Figure 4D; Table S5).We further categorized genes based on the major regulatory pattern present across hybrids (STAR Methods). We examined the behavior of genes across various global expression features (Figures 5A–5C) and genetic variance components (Figures 5D–5F). As expected, genes that are mainly under cis control show overall low expression abundance (Figure 5A), high expression dispersion (Figure 5B), and low connectivity (Figure 5C), all of which are features associated with genes that tend to show the most cis-eQTL based on our previous population-level transcriptomic analysis.13 Indeed, cis-regulated genes also show a significantly higher proportion of additive variance (h2) (Figure 5D). By contrast, genes that are mainly under trans control are highly expressed (Figure 5A), less dispersed than cis-controlled genes (Figure 5B), and highly connected on the global co-expression network (Figure 5C). Lastly, genes that show the most compensatory patterns display intermediate features compared to trans-controlled genes for expression abundance and connectivity (Figures 5A and 5C). However, this group of genes show the lowest expression dispersion, which is consistent with the cis-trans compensation effect (Figure 5B). In general, both compensatory and trans-controlled genes showed significantly higher proportions of non-additive variance (H2-h2) compared to genes that are mainly cis-regulated (Figure 5E). We further compared the hybrid expression abundance to the mid-parent value for each gene-trio combination and identified cases that deviated from the parental expectations across different regulatory variation groups (Figure S4B) (STAR Methods). The majority of cases with expression deviation is attributed to trans-regulatory changes (∼46%, 3,166/6,894) (Figure S4C). Nonetheless, the compensatory group showed higher proportions of cases with mid-parent deviation as well as a significantly higher magnitude of such deviation compared to the cis-only and trans-only groups (Figures S4C and S4D).
Figure 5.

Functional features associated with different regulatory variation patterns
(A–C) Global gene expression features and their associations with major regulatory patterns.
(A) Expression abundance as the mean log2(TPM + 1) across diallel panel.
(B) Expression dispersion calculated as the mean absolute deviation of log2(TPM + 1) across samples.
(C) Connectivity calculated as the weighted network connectivity across previous population-level pan-transcriptomic analyses with 969 natural isolates.13 The p values indicated correspond to 2-sided Wilcoxon tests.
(D–F) Variance components and their associations with major regulatory patterns.
(D) Additive variance component (h2).
(E) Non-additive variance component (H2-h2).
(F) Residual variance component (1−H2). The number of genes belonging to different regulation types are indicated on the x axis. See assigned major regulatory patterns for genes in Table S7.
Overall, our data suggest that trans-regulatory changes underlie highly connected, core cellular processes and are the major contributor to the non-additive variance component in gene expression. Cis-trans compensation events, although less frequent than trans-only cases, contribute significantly to non-additivity as well due to the higher magnitude of parent-hybrid expression deviation.
S. paradoxus introgression genes show more cis-regulation than their S. cerevisiae counterparts
Genes originating from S. paradoxus introgression constitute ∼30% of the S. cerevisiae accessory genome44 and contribute significantly to heritable gene expression variation at the population-wide pan-transcriptome landscape in the species.13 These introgressed genes are found mainly in specific subpopulations such as the Alpechin clade.44 In the diallel hybrid panel, two Alpechin isolates were included as parental lines (Table S1), which offered a unique opportunity to examine and compare the regulatory variation among alleles within (S. cerevisiae versus S. cerevisiae) and between species (S. cerevisiae versus S. paradoxus). In total, the regulatory variation for 219 unique introgressed genes were included in our dataset, corresponding to 3,192 gene-trio combinations (between species alleles) (1002 Yeast Genome datafile S2; see STAR Methods). Among the 219 introgressed genes, 202 also showed discriminating sites among their S. cerevisiae counterparts, corresponding to 11,871 gene-trio combinations (within species alleles) (1002 Yeast Genome datafile S2; see STAR Methods). The number of gene-trio combinations with between-species allele pairs is mainly associated with the two parental lines from the Alpechin clade, whereas the number of cases with within-species allele pairs is more randomly distributed across parental lines (Figure S5A). Globally, for the same set of 202 genes, between-species allele pairs show significantly more regulatory variation than within-species allele pairs (Figure 6A). This difference is due mainly to higher proportions of cis-regulatory changes observed for the between-species allele pairs, including all cis-trans interaction patterns (Figures 6A and S5B).
Figure 6.

Differential preference of regulatory patterns between introgressed and native alleles
(A) Distribution and proportions of different regulatory patterns for within- and between-species allele pairs.
(B) Chord diagram depicting the direction and number of switches in main regulatory modes from between-species to within-species allele pairs for the same genes. Outer axis indicates the number of gene events. Inner bands indicate the directional change, with the flow starting from between species (with inner band, color corresponds to the destination) to within species (without inner band). Open arcs indicate changed regulatory pattern, whereas closed arcs correspond to conserved regulatory pattern.
(C) Major switches observed in (B). Regulatory variation for between- and within-species allele pairs are shown. Log2 fold changes between alleles in the hybrid and between the parental lines at the same sites are indicated on x and y axes, respectively. Different regulatory patterns are color coded.
(D) Additive variance component associated with genes that show variable and conserved regulatory patterns for between- and within-species allele pairs. Wilcoxon test p value is shown.
(E) Connectivity associated with genes that show variable and conserved regulatory patterns for between- and within-species allele pairs. Wilcoxon test p value is shown. Assigned regulatory patterns and types of switches for between- and within-species alleles are found in Table S8.
To understand the global regulatory preferences for introgressed alleles and the native S. cerevisiae alleles at the gene level, we assigned the major regulatory pattern observed for between- and within-species allele pairs and compared the two assignments for the same gene (STAR Methods). In total, 116 of the 202 genes showed conserved regulatory patterns; the majority (99/116) of these cases are regulated in trans both for the introgressed alleles and the S. cerevisiae alleles (Figure 6B). The remaining 86 genes showed various types of switches of regulation mode between the introgressed alleles and the S. cerevisiae alleles (Figure 6B). Most remarkably, all of the mainly cis-regulated introgressed alleles showed mainly trans-regulatory variation for their S. cerevisiae counterparts (Figure 6B). For example, the COX6 gene encodes for the subunit VI of the cytochrome c oxidase and is essential for cellular respiration. The S. paradoxus introgressed allele shows lower expression levels due to cis-regulatory variation, whereas the S. cerevisiae alleles are either trans-regulated or show no expression differences (Figure S5C). The most important types of switches going from between-species to within-species allelic regulation modes are null to trans (30 genes), compensatory to trans (21 genes) and cis to trans (11 genes) (Figure 6C). Each of these switches affect the majority of genes within their respective regulation pattern found in the introgressed alleles, specifically with 30 null to trans of 46 null in total, 21 compensatory to trans of 32 compensatory in total, and 11 cis to trans of 12 cis-regulated genes in total (Figures 6B and 6C). Overall, genes with conserved regulatory patterns between the introgressed and the native alleles tend to show higher expression connectivity and lower additive phenotypic variance (h2) (Figures 6D and 6E). These observations suggest that heritable variation of gene expression related to introgression could be influenced by the functional integration of such genes to the global expression network (i.e., connectivity), in addition to their regulatory variation due to interspecies differences between S. paradoxus and S. cerevisiae.
Discussion
Gene expression variation is a key molecular intermediate in the phenotypic landscape of a species. Understanding how cis- and trans-regulatory changes differentially influence the heritability of gene expression variation is therefore essential to understanding the path from genome to traits. Taking advantage of a large diallel hybrid panel, we estimated the broad- and narrow-sense heritability (H2 and h2) across genome-wide gene expression traits and showed non-additive components explaining a higher proportion of the phenotypic variance compared to additive variance only (36% versus 31%, on average). We systematically characterized the gene-level regulatory patterns across the population and showed that trans-regulatory changes are the main driver underlying the non-additive variance.
It has been previously proposed that trans-regulatory changes may have a greater tendency than cis-variation to cause gene misexpression in the hybrid compared to the parental mean and therefore lead to non-additive variance.24,25,48,49,50 These observations were derived mainly from interspecies hybrids25,49 or chromosomal substitution lines50 in Drosophila, as well as hybrids between different Saccharomyces yeast species.24 However, our data, which tested multiple parental combinations for the same set of genes, show that trans-regulatory variation is equally likely to cause hybrid expression deviation from the parental mean than cis-variation at the intraspecific level. Although trans-regulatory variation appears to be the most important contributor of non-additive variance components in gene expression, the precise underlying mechanism is still unclear.
Our results suggest that there are two main paths toward high non-additive variance in gene expression due to trans effects. The first one is through cis-trans interactions, most notably the compensatory effect that completely mask the cis effect by additional trans factors. Indeed, according to our data, 75% of all cis effects are exaggerated or attenuated by additional trans variation, and 50% resulted in complete cis-trans compensation. All cis-trans interaction patterns show a greater tendency for hybrid misexpression and/or higher magnitude of such misexpression. This observation is also supported by previous analysis of the expression of ∼30 genes in a hybrid of two Drosophila species.49 Furthermore, we showed that genes under cis-trans compensation tend to show a higher fraction of non-additive variance. In principle, such effects will decrease the power of statistical association in eQTL analyses and will likely result in the missing heritability problem that is commonly observed for gene expression traits.
The second path to non-additive variance is through coordinated expression change in highly connected co-expression modules. Previously, we generated and analyzed the population-level pan-transcriptome across ∼1,000 natural yeast isolates.13 We showed that the global transcriptome landscape is consistent with a central, highly connected co-expression network, and an auxiliary, lowly connected network consists of subpopulation-specific expression signatures.13 The highly connected co-expression network is robust to genetic variation in the population and showed significantly less eQTL than the auxiliary level.13 Here, with the diallel hybrid panel, we show that genes with high non-additive variance tend to be highly connected in the global expression network and are often controlled in trans. Such non-additive variance is invisible to canonical association tests, which could partly explain the robustness of the co-expression modules to genetic variation in the population. Furthermore, our analyses on the set of 202 introgressed genes also support the link between connectivity and non-additive variance. Introgressed genes that are both trans-regulated between interspecies and intraspecies allele pairs show significantly higher connectivity and non-additive variance than cases with variable regulatory patterns.
Overall, our study highlights that the transcriptome is globally buffered at the genetic level. Highly connected co-expression modules are robust to genetic variation in the population, either through trans compensation of cis-regulatory variation or through coordinated trans-regulatory changes alone, with possible purging of cis-effect variants. Such a buffering effect could result in significant non-additive variance that is not detectable via GWAS and contribute to missing heritability.
Limitations of the study
In our diallel design, we sampled 26 parental isolates that are broadly representative of the species diversity of S. cerevisiae. However, the size of the parental population still remains modest, with several previously defined clades44 that were not represented here. In particular, the underrepresentation of certain clades could have an impact on the trends we observed, specifically on the regulatory patterns of introgressed genes because our observations were based mainly on two parental lines from the same clade (i.e., Alpechin isolates). Another limitation that reduced our final sample size was allele imbalance that affected one or multiple chromosomes in some of the hybrids. In our final dataset, only 179 hybrids were included for ASE analyses due to this allele imbalance, possibly reflecting some genome instability events (loss of heterozygosity or aneuploidy), inadvertently selected during the en masse crossing procedure. Finally, because our data were obtained using batch mid-log phase cultures in complete media, our conclusions may be biased when examining other culture conditions or cell states. Further experiments using single-cell analyses and/or across different conditions will undoubtedly yield a more complete picture of cis- versus trans-regulatory variation in a population.
STAR★Methods
Key resources table
| REAGENT or RESOURCE | SOURCE | IDENTIFIER |
|---|---|---|
| Biological samples | ||
| 331 batch mated diploids ho::NatMX / ho::KanMX | This study | Table S2 |
| Chemicals, peptides, and recombinant proteins | ||
| YPD (YEPD) Agar (Powder) | MP Biomedicals | 4001232 |
| G418 | Euromedex | EU0600-A |
| Nourseothricin | Jena Bioscience | AB-102L |
| YNB w/ Ammonium Sulfate | MP Biomedicals | 4027522 |
| SC Amino Acid mixture | MP Biomedicals | 114400022 |
| Glucose | Euromedex | UG3050 |
| Critical commercial assays | ||
| Dynabeads® mRNA Direct Kit | ThermoFisher | 61012 |
| NEBNext® Ultra™ II Directional RNA Library Prep Kit | NEB | E7765L |
| Qubit ™ dsDNA HS Assay Kit | Invitrogen | |
| High sensitivity DNA kit | Agilent | 5067-4626 |
| Deposited data | ||
| Raw RNA sequencing reads | This study | ENA: PRJEB64466 |
| Online Datafile S1 | This study | 1002yeastgenomes: http://1002genomes.u-strasbg.fr/files/Diallel_RNAseq/ASE Mendeley data: https://doi.org/10.17632/gycmf58tyy.1 |
| Online Datafile S2 | This study | 1002yeastgenomes: http://1002genomes.u-strasbg.fr/files/Diallel_RNAseq/ASE Mendeley data: https://doi.org/10.17632/gycmf58tyy.1 |
| Experimental models: Organisms/strains | ||
| Saccharomyces cerevisiae: 26 parental isolates MATa ho::KanMX | Fournier et al.45 | Table S1 |
| Saccharomyces cerevisiae: 26 parental isolates MATalpha ho::NatMX | Fournier et al.45 | Table S1 |
| Software and algorithms | ||
| STAR | Dobin et al.51 | https://github.com/alexdobin/STAR |
| subread | Liao et al.52 | https://github.com/ShiLab-Bioinformatics/subread |
| WGCNA | Langfelder and Horvath53 | https://cran.r-project.org/web/packages/WGCNA/index.html |
| lme4 | Bates et al.54 | https://cran.r-project.org/web/packages/lme4/index.html |
| PLINK | Purcell et al.55 | https://www.cog-genomics.org/plink/ |
| ldak | Zhang et al.56 | https://dougspeed.com/ldak/ |
| popkin | Ochoa et al.57 | https://cran.r-project.org/web/packages/popkin/index.html |
| hglm | Rönnegård et al.58 | https://cran.r-project.org/web/packages/hglm/index.html |
| gatk | Li et al.59 | https://gatk.broadinstitute.org/hc/en-us |
| ASEReadCounter | Castel et al.60 | https://gatk.broadinstitute.org/hc/en-us/articles/360037054312-ASEReadCounter |
| GenMap | Pockrandt et al.61 | https://github.com/cpockrandt/genmap |
| MBASED | Mayba et al.62 | https://bioconductor.org/packages/release/bioc/html/MBASED.html |
| fgsea | Korotkevich et al.63 | https://bioconductor.org/packages/release/bioc/html/fgsea.html |
| Custom codes for data processing | This study |
https://github.com/HaploTeam/diallel_RNAseq Zenodo: https://doi.org/10.5281/zenodo.10011210 |
Resource availability
Lead contact
Further information and requests for resources and reagents should be directed to and will be fulfilled by the lead contact, Jing Hou (jing.hou@unistra.fr).
Materials availability
All parental strains and hybrids generated in this study are available from the lead contact upon request.
Data and code availability
-
•
All RNA sequencing reads are available in the European Nucleotide Archive (ENA) under the accession number PRJEB64466.
-
•The 1002 Yeast Genome website http://1002genomes.u-strasbg.fr/files/Diallel_RNAseq/ASE provides access to:
-
•Datafile S1: Datafile1_raw_data_20230713.tab
-
•Datafile S2: Datafile2_ase_sum_20230609.tab
-
•
These data files have also been deposited on Mendeley Data with the following DOI: https://doi.org/10.17632/gycmf58tyy.1.
-
•
Original codes for data process are deposited at GitHub (https://github.com/HaploTeam/diallel_RNAseq) and publicly available as of the date of publication. The codes are deposited at Zenodo with DOI https://doi.org/10.5281/zenodo.10011210.
-
•
Any additional information required to reanalyze the data reported in this paper is available from the lead contact upon request.
Experimental model and subject details
All strains used here are derivatives of natural isolates of S. cerevisiae.44 Deletion of HO and generation of stable haploids were performed previously.45
Method details
Description of the parental strains and diallel scheme
A genetically diverse set of 26 parental strains was selected from the 1,011 strains collection with the focus of capturing as much of the genetic, ecological and geographical diversity of the species as possible (Table S1). Two stable haploid strains, MATa and MATalpha, carrying the KanMX or a NatMX cassettes in the HO locus respectively, were established for each parent, giving a total of 52 strains.45 Parental strains of opposite mating types were crossed by overlaying haploid cells in a matrix on YPD media (1% yeast extract, 2% peptone and 2% glucose) and incubating them at 30°C overnight. The cells were then transferred to YPD media with G418 (200 mg/mL) and nourseothricin (100 mg/mL) and incubated at 30°C overnight to select for hybrid cells. We then transferred the selected hybrids on YPD media with nourseothricin and G418 to remove any remaining haploid cells. All procedures were done using the replicating robot ROTOR (Singer Instruments). In total, we obtained 351 genetically unique hybrids.
We quantified the growth rates of each hybrid in liquid synthetic complete (SC) media with 2% glucose for 48 h (initial OD600nm: 0.1) using a 96-well microplate reader (Tecan Infinite F200 Pro). The hybrids were then grown in 96-format deepwell plates until mid-log phase (OD600nm–0.3). A 750 μL suspension of each sample was then transferred to a 96-well filter plate (Norgen, #40008) where the media was eliminated by applying vacuum (VWR, #16003-836). Immediately after the media was eliminated, we flash-froze the cells in liquid nitrogen and stored them at −80°C.
Sample preparation
We extracted the mRNA from the hybrids using the Dynabeads mRNA Direct Kit (ThermoFisher #61012). Cells were lysed with glass beads and incubated at 65°C for 2 min and mRNA was then selected with two rounds of hybridization of their polyA tails to magnetic beads coupled to oligo(dT) residues.
We prepared cDNA sequencing libraries using the NEBNext Ultra II Directional RNA Library Prep Kit (NEB, #E7765L) and following the manufacturer’s protocol. Briefly, 5 μL of purified mRNA is fragmented with a 15-min incubation at 94°C and then reverse transcribed to cDNA. Next, a NEBNext Adaptor is ligated to the cDNA and finally a unique combination of dual indexes (manufactured by IDT) is added to allow multiplexed sequencing. Finally, barcoded cDNA is amplified with 9 rounds of PCR (denaturation 10 s at 98°C, annealing/extension 75 s at 65°C). The amplified and barcoded cDNA fragments were eluted in 15 μL of 0.1X TE.
We quantified the concentration of the cDNA libraries with the Qubit dsDNA HS Assay Kit (Invitrogen ) in a 96-well plate using a microplate reader (Tecan Infinite F200 Pro) with an excitation frequency of 485 nm and emission of 528 nm. We pooled 1 μL of each library and fragment size was assessed with Bioanalyzer 2100 (Agilent) using the High sensitivity DNA kit (#5067-4626). Finally, we generated equimolar sequencing pools of 96 samples.
The pools were sequenced using 75 bp single-end with Nextseq 550 (Illumina) sequencer at the EMBL Genomics Core Facility. After demultiplexing, we obtained 3.7 million reads per sample on average. The number of reads obtained in each sample are found in Table S2.
Quantification of mRNA abundance
The raw reads of each sample were mapped to a custom reference genome using STAR51 with the following parameters.
--outSAMtype BAM SortedByCoordinate ∖
--outFilterType BySJout ∖
--outFilterMultimapNmax 20 ∖
--outFilterMismatchNmax 4 ∖
--alignIntronMin 20 ∖
--alignIntronMax 2000 ∖
--alignSJoverhangMin 8 ∖
--alignSJDBoverhangMin 1
We generated a custom reference genome containing the 16 chromosomes of the S. cerevisiae reference genome (R64_nucl) and all the accessory ORFs (n = 665) present in the parental strains as defined by the 1,011 yeast genomes project44 as additional chromosomes. In total, 323 hybrids had sufficient reads and were used in subsequent analyses. We counted the reads aligning to each gene of the reference (n = 6,285) and accessory (n = 665) genomes with the featureCounts function of the R package subread52 with the countMultiMappingReads = F parameter to eliminate multi-mapped reads. For a given hybrid, if accessory genes that have orthologs in the reference genome were annotated as absent, we merged their reads counts to those of their reference genome counterparts. We then normalized mRNA abundance to the gene level by calculating the transcripts per million (tpm) of each gene. This gave us a list of tpm values for 6917 genes. We filtered out genes that have a zero tpm value in more than half of all samples, leading to a final dataset of 6186 genes. Raw counts and tpm values can be found in Datafile S1.
Calculating gene-level expression features
We calculated the overall expression features for abundance, dispersion and connectivity for each gene across the diallel and across 969 natural isolates where the transcriptomes were characterized previously.13 The abundance and dispersion are calculated as previously described.13 Briefly, the expression abundance was calculated as the mean tpm levels across samples where the gene is present based on genome annotations. The dispersion corresponds to the mean absolute deviation of tpm levels across samples. The connectivity for a given gene is defined as the weighted network connectivity across all expressed genes. The connectivity is calculated using the softConnectivity function in the R package WGCNA53 with the transposed expression matrix as input. All expression features associated with each gene are integrated in Datafile S2.
Heritability estimations
In a diallel scheme with no selfs (homozygous parental lines) and no reciprocals (half-diallel),46 the phenotype of the hybrid from crossing the i × j th parental lines can be expressed as:
Where μ is the population mean, gi is the average contribution of all half siblings related to the i th parent, gj is the average contribution of all half siblings related to the j th parent (general combining abilities or GCA), and sij is the specific contribution of the i × j parental combination (specific combining abilities or SCA). Residual error is expressed as e.
We estimated these components with a linear mixed model using the lmer function from the R package lme4.54 We excluded all homozygous hybrids and heterozygous hybrids with chromosome level allele imbalance (Table S2). In total, 258 hybrids were included in the model. We defined the GCA components as fixed effects and SCA as random effect. For each expression trait, we extracted the GCA and SCA estimates using the fixef and ranef functions, respectively. Error component is extracted as the residual value of the fitted model using the resid function. The variance components are estimated as:
Where Va corresponds to the total additive variance, Vi is the non-additive variance due to interactions and dominance and Ve is the residual variance. The heritability is estimated as:
Where H2 is the broad-sense heritability and h2 is the narrow-sense heritability. All equations are derived from.64 The functions used for modeling and heritability calculations are available upon request as custom R scripts.
We applied an orthogonal strategy to estimate the narrow-sense heritability based on genome-wide kinship matrix (h2g). We first calculated the linkage disequilibrium using the SNP matrix and PLINK.55 We excluded SNPs with strong linkage disequilibrium (r2 > 0.8) due to the strong population structure of the diallel panel. We calculated the weights of each variant using ldak with the –cut-weights and –calc-weights-all arguments and the default parameters.56 All variants with non-zero weights were used to generate a filtered vcf matrix of 5,493 SNPs that was then recoded with the plink -make-bed command. The filtered and recoded matrix was used to calculate the kinship between individuals using the popkin function of the R package popkin57 with the default parameters. Finally, we used the hglm function of the hglm58 R package, with the default parameters, to calculate h2g from the kinship matrix and the tpm values. All heritability estimates are found in Table S4.
Quantifying allele specific counts in the hybrids and the corresponding parental pairs
To infer the heterozygous sites in every hybrid, the sequencing reads of each parent from Peter et al., 2018 were aligned to the R64_nucl reference genome using the bwa mem with the options –M –t 8 –v 3 command and SNPs were inferred using gatk HaplotypeCaller.59 The vcf files of the parents of each cross were combined to generate a vcf file containing the heterozygous biallelic sites in the hybrid. We used ASEReadCounter60 to quantify the number of reads carrying each allele of the heterozygous biallelic sites. To avoid regions that would cause mapping problems, we calculated the mappability of 75bp segments along the R64_nucl reference genome using GenMap61 genmap map –K 75 –E 2 and removed the sites with mappability values less than 1.
To quantify the read counts for the same discriminating sites in the parental samples, we calculated the depth of sequencing of the SNPs between the parent and the reference genome. The depth values were then scaled to the total number of reads for the hybrid, so that the depth values would be comparable across parents and the corresponding hybrid. We only considered sites with more than 30X coverage in the hybrids and more than 60X coverage in the sum of the parental pairs. In total, 1,864,327 sites were included for further analyses.
We calculated the chromosome-level allele balance across all hybrid samples as well as the corresponding parental pairs to identify systematic biases due to the presence of aneuploidy, loss-of-heterozygosity (LOH) or other large-scale chromosomal changes that could be frequent in S. cerevisiae cultures.65 We plotted the allele balance (read counts for one parental line against the other at discriminating sites) and manually verified cases with inconsistent allele balances. In total, 258 hybrids that did not show such allele imbalance were included in the linear mixed model for heritability estimation. For allele-specific expression analysis, we further removed parent-hybrid trios where only the parental alleles were imbalanced, resulting in a set of 179 parent-hybrid trios. In total, these 179 parent-hybrid trios comprised 1.2M discriminating sites and are further analyzed.
Allele-specific expression analyses across hybrid and their corresponding parental pair
We performed gene-level ASE analyses using the R package MBASED.62 For each gene, all discriminating sites were considered as phased and were included to calculated the allelic change both in the hybrid and between the parental pair as 1-sample ASE test using 106 simulations. Gene-level allele counts were approximated by averaging the counts at each site included in the test. The raw p-value were adjusted using the Benjamini-Hochberg method. For genes with more than 20 discriminating sites, only one site at each 100 bp window were sampled to remove redundancy due to overlapping reads. Significant 1-sample ASE test is considered when the adjusted p-value is less than 0.05 and the absolute log2 foldchange of the gene-level allele counts is higher than 1.
For genes where both the hybrid and parental 1-sample tests were significant, 2-sample tests were performed to identify significant ratio change between hybrid and parental ASE. We distinguished two scenarios. First, for cases where the signs of the log2 foldchanges in the parents and the hybrids are in the same direction, 2-sample tests were directly performed using the same sites and counts as the 1-sample tests. For cases there the signs were in opposite direction, the alleles in the hybrid were reverted before the test were performed. For 2-sample tests, 103 simulations were performed and the p-values were adjusted using the Benjamini-Hochberg method. Significant 2-sample ASE test is considered when the adjusted p-value is lower than 0.05. Criteria for assigning gene-level regulation changes are in Figure 3D. All ASE test results and the assigned regulation patterns are in Datafile S2.
Gene-set enrichment analyses
Gene-set enrichment analyses (GSEAs) were performed using the fgsea package in R.63 Standard GO terms associated with biological processes (BP) were used66 with term size limits between 5 and 500. GSEA on different variance components were performed using rankings based on additive, non-additive and residual variance with 100,000 simulations. Results are found in Table S5. For GSEA on genes with different regulatory changes, the rankings were based on the number of cases for a given assigned pattern divided by the total number of cases characterized for that gene. The same number of simulations were performed as for the variance components enrichments. Results are found in Table S6.
Assigning gene-level major regulatory patterns
We focused on cis only, trans only and compensatory assignments as they are the most major patterns observed across parent-hybrid trios. For a given gene, we calculated the number of regulatory patterns observed across trios. We assigned the gene-level regulatory pattern as “null” if the number of null patterns represent more than 95% of all characterized cases. For the remaining cases, we identified the most common regulatory change that is not null, then assigned that gene as mainly regulated by that pattern. All assignments are found in Table S7. We used the same criteria to assign the major regulatory groups for the within and between species allele pairs. Switches of the regulatory types are defined by comparing assigned types for between and within species pairs. All assignments are found in Table S8.
Acknowledgments
This work was supported by NIH grant no. R01 (GM147040-01), European Research Council (ERC) Consolidator grant no. 772505 (to J.S.), and French National Research Agency (ANR) Young Investigator grant no. ANR-22-CE12-0023-01 (to J.H.). It is also part of the Integrative Molecular and Cellular Biology (IMCBio), as part of the Interdisciplinary Thematic Institutes (ITI) 2021-to-2028 program of the University of Strasbourg, CNRS, and INSERM, supported by IdEx Unistra (ANR-10-IDEX-0002). J.S. is a Fellow of the University of Strasbourg Institute for Advanced Study and a member of the Institut Universitaire de France.
Author contributions
Conceptualization, J.S., J.H., and A.T.; investigation, A.T. and G.B.; formal analysis, A.T., J.S., and J.H.; methodology, software, and visualization, A.T. and J.H.; writing – original draft, J.S. and J.H.; writing – review and editing, J.S. and J.H.; funding acquisition, J.S. and J.H.; supervision, J.S. and J.H.
Declaration of interests
The authors declare no competing interests.
Published: December 4, 2023
Footnotes
Supplemental information can be found online at https://doi.org/10.1016/j.xgen.2023.100459.
Contributor Information
Joseph Schacherer, Email: schacherer@unistra.fr.
Jing Hou, Email: jing.hou@unistra.fr.
Supplemental information
References
- 1.Wu Y., Qi T., Wray N.R., Visscher P.M., Zeng J., Yang J. Joint analysis of GWAS and multi-omics QTL summary statistics reveals a large fraction of GWAS signals shared with molecular phenotypes. Cell Genom. 2023;3 doi: 10.1016/j.xgen.2023.100344. [DOI] [PMC free article] [PubMed] [Google Scholar]
- 2.Vande Zande P., Hill M.S., Wittkopp P.J. Pleiotropic effects of trans-regulatory mutations on fitness and gene expression. Science. 2022;377:105–109. doi: 10.1126/science.abj7185. [DOI] [PMC free article] [PubMed] [Google Scholar]
- 3.Hill M.S., Vande Zande P., Wittkopp P.J. Molecular and evolutionary processes generating variation in gene expression. Nat. Rev. Genet. 2021;22:203–215. doi: 10.1038/s41576-020-00304-w. [DOI] [PMC free article] [PubMed] [Google Scholar]
- 4.Albert F.W., Kruglyak L. The role of regulatory variation in complex traits and disease. Nat. Rev. Genet. 2015;16:197–212. doi: 10.1038/nrg3891. [DOI] [PubMed] [Google Scholar]
- 5.Oliveros W., Delfosse K., Lato D.F., Kiriakopulos K., Mokhtaridoost M., Said A., McMurray B.J., Browning J.W.L., Mattioli K., Meng G., et al. Systematic characterization of regulatory variants of blood pressure genes. Cell Genom. 2023;3 doi: 10.1016/j.xgen.2023.100330. [DOI] [PMC free article] [PubMed] [Google Scholar]
- 6.Schaub M.A., Boyle A.P., Kundaje A., Batzoglou S., Snyder M. Linking disease associations with regulatory information in the human genome. Genome Res. 2012;22:1748–1759. doi: 10.1101/gr.136127.111. [DOI] [PMC free article] [PubMed] [Google Scholar]
- 7.Schadt E.E., Lamb J., Yang X., Zhu J., Edwards S., GuhaThakurta D., Sieberts S.K., Monks S., Reitman M., Zhang C., et al. An integrative genomics approach to infer causal associations between gene expression and disease. Nat. Genet. 2005;37:710–717. doi: 10.1038/ng1589. [DOI] [PMC free article] [PubMed] [Google Scholar]
- 8.Albert F.W., Bloom J.S., Siegel J., Day L., Kruglyak L. Genetics of trans-regulatory variation in gene expression. Elife. 2018;7 doi: 10.7554/eLife.35471. [DOI] [PMC free article] [PubMed] [Google Scholar]
- 9.Kita R., Venkataram S., Zhou Y., Fraser H.B. High-resolution mapping of cis -regulatory variation in budding yeast. Proc. Natl. Acad. Sci. 2017;114:E10736–E10744. doi: 10.1073/pnas.1717421114. [DOI] [PMC free article] [PubMed] [Google Scholar]
- 10.GTEx Consortium The GTEx Consortium atlas of genetic regulatory effects across human tissues. Science. 2020;369:1318–1330. doi: 10.1126/science.aaz1776. [DOI] [PMC free article] [PubMed] [Google Scholar]
- 11.GTEx Consortium. Laboratory, Data Analysis &Coordinating Center LDACC—Analysis Working Group. Statistical Methods groups—Analysis Working Group. Enhancing GTEx eGTEx groups. NIH Common Fund. NIH/NCI. NIH/NHGRI. NIH/NIMH. NIH/NIDA. Biospecimen Collection Source Site—NDRI Genetic effects on gene expression across human tissues. Nature. 2017;550:204–213. doi: 10.1038/nature24277. [DOI] [PMC free article] [PubMed] [Google Scholar]
- 12.Battle A., Mostafavi S., Zhu X., Potash J.B., Weissman M.M., McCormick C., Haudenschild C.D., Beckman K.B., Shi J., Mei R., et al. Characterizing the genetic basis of transcriptome diversity through RNA-sequencing of 922 individuals. Genome Res. 2014;24:14–24. doi: 10.1101/gr.155192.113. [DOI] [PMC free article] [PubMed] [Google Scholar]
- 13.Caudal E., Loegler V., Dutreux F., Vakirlis N., Teyssonnière E., Caradec C., Friedrich A., Hou J., Schacherer J. Pan-transcriptome reveals a large accessory genome contribution to gene expression variation in yeast. Genomics. 2023 doi: 10.1038/s41588-024-01769-9. [DOI] [PMC free article] [PubMed] [Google Scholar]
- 14.Zhang G., Roberto N.M., Lee D., Hahnel S.R., Andersen E.C. The impact of species-wide gene expression variation on Caenorhabditis elegans complex traits. Nat. Commun. 2022;13:3462. doi: 10.1038/s41467-022-31208-4. [DOI] [PMC free article] [PubMed] [Google Scholar]
- 15.Ouwens K.G., Jansen R., Nivard M.G., van Dongen J., Frieser M.J., Hottenga J.J., Arindrarto W., Claringbould A., van Iterson M., Mei H., et al. A characterization of cis- and trans-heritability of RNA-Seq-based gene expression. Eur. J. Hum. Genet. 2020;28:253–263. doi: 10.1038/s41431-019-0511-5. [DOI] [PMC free article] [PubMed] [Google Scholar]
- 16.Võsa U., Claringbould A., Westra H.-J., Bonder M.J., Deelen P., Zeng B., Kirsten H., Saha A., Kreuzhuber R., Yazar S., et al. Large-scale cis- and trans-eQTL analyses identify thousands of genetic loci and polygenic scores that regulate blood gene expression. Nat. Genet. 2021;53:1300–1310. doi: 10.1038/s41588-021-00913-z. [DOI] [PMC free article] [PubMed] [Google Scholar]
- 17.Tsouris A., Brach G., Friedrich A., Hou J., Schacherer J. Diallel panel reveals a significant impact of low-frequency genetic variants on gene expression variation in yeast. bioRxiv. 2023 doi: 10.1038/s44320-024-00021-0. Preprint at. [DOI] [PMC free article] [PubMed] [Google Scholar]
- 18.Lloyd-Jones L.R., Holloway A., McRae A., Yang J., Small K., Zhao J., Zeng B., Bakshi A., Metspalu A., Dermitzakis M., et al. The Genetic Architecture of Gene Expression in Peripheral Blood. Am. J. Hum. Genet. 2017;100:228–237. doi: 10.1016/j.ajhg.2016.12.008. [DOI] [PMC free article] [PubMed] [Google Scholar]
- 19.Huan T., Liu C., Joehanes R., Zhang X., Chen B.H., Johnson A.D., Yao C., Courchesne P., O’Donnell C.J., Munson P.J., Levy D. A systematic heritability analysis of the human whole blood transcriptome. Hum. Genet. 2015;134:343–358. doi: 10.1007/s00439-014-1524-3. [DOI] [PMC free article] [PubMed] [Google Scholar]
- 20.Wright F.A., Sullivan P.F., Brooks A.I., Zou F., Sun W., Xia K., Madar V., Jansen R., Chung W., Zhou Y.-H., et al. Heritability and genomics of gene expression in peripheral blood. Nat. Genet. 2014;46:430–437. doi: 10.1038/ng.2951. [DOI] [PMC free article] [PubMed] [Google Scholar]
- 21.Powell J.E., Henders A.K., McRae A.F., Kim J., Hemani G., Martin N.G., Dermitzakis E.T., Gibson G., Montgomery G.W., Visscher P.M. Congruence of Additive and Non-Additive Effects on Gene Expression Estimated from Pedigree and SNP Data. PLoS Genet. 2013;9 doi: 10.1371/journal.pgen.1003502. [DOI] [PMC free article] [PubMed] [Google Scholar]
- 22.Manolio T.A., Collins F.S., Cox N.J., Goldstein D.B., Hindorff L.A., Hunter D.J., McCarthy M.I., Ramos E.M., Cardon L.R., Chakravarti A., et al. Finding the missing heritability of complex diseases. Nature. 2009;461:747–753. doi: 10.1038/nature08494. [DOI] [PMC free article] [PubMed] [Google Scholar]
- 23.Wittkopp P.J., Haerum B.K., Clark A.G. Evolutionary changes in cis and trans gene regulation. Nature. 2004;430:85–88. doi: 10.1038/nature02698. [DOI] [PubMed] [Google Scholar]
- 24.Metzger B.P.H., Wittkopp P.J., Coolon J.D. Evolutionary Dynamics of Regulatory Changes Underlying Gene Expression Divergence among Saccharomyces Species. Genome Biol. Evol. 2017;9:843–854. doi: 10.1093/gbe/evx035. [DOI] [PMC free article] [PubMed] [Google Scholar]
- 25.McManus C.J., Coolon J.D., Duff M.O., Eipper-Mains J., Graveley B.R., Wittkopp P.J. Regulatory divergence in Drosophila revealed by mRNA-seq. Genome Res. 2010;20:816–825. doi: 10.1101/gr.102491.109. [DOI] [PMC free article] [PubMed] [Google Scholar]
- 26.Goncalves A., Leigh-Brown S., Thybert D., Stefflova K., Turro E., Flicek P., Brazma A., Odom D.T., Marioni J.C. Extensive compensatory cis-trans regulation in the evolution of mouse gene expression. Genome Res. 2012;22:2376–2384. doi: 10.1101/gr.142281.112. [DOI] [PMC free article] [PubMed] [Google Scholar]
- 27.Shi X., Ng D.W.-K., Zhang C., Comai L., Ye W., Chen Z.J. Cis- and trans-regulatory divergence between progenitor species determines gene-expression novelty in Arabidopsis allopolyploids. Nat. Commun. 2012;3:950. doi: 10.1038/ncomms1954. [DOI] [PubMed] [Google Scholar]
- 28.Tirosh I., Reikhav S., Levy A.A., Barkai N. A Yeast Hybrid Provides Insight into the Evolution of Gene Expression Regulation. Science. 2009;324:659–662. doi: 10.1126/science.1169766. [DOI] [PubMed] [Google Scholar]
- 29.Mack K.L., Campbell P., Nachman M.W. Gene regulation and speciation in house mice. Genome Res. 2016;26:451–461. doi: 10.1101/gr.195743.115. [DOI] [PMC free article] [PubMed] [Google Scholar]
- 30.Wang H., Sawai A., Toji N., Sugioka R., Shibata Y., Suzuki Y., Ji Y., Hayase S., Akama S., Sese J., Wada K. Transcriptional regulatory divergence underpinning species-specific learned vocalization in songbirds. PLoS Biol. 2019;17 doi: 10.1371/journal.pbio.3000476. [DOI] [PMC free article] [PubMed] [Google Scholar]
- 31.Cooper R.D., Shaffer H.B. Allele-specific expression and gene regulation help explain transgressive thermal tolerance in non-native hybrids of the endangered California tiger salamander ( Ambystoma californiense ) Mol. Ecol. 2021;30:987–1004. doi: 10.1111/mec.15779. [DOI] [PubMed] [Google Scholar]
- 32.Payne C., Bovio R., Powell D.L., Gunn T.R., Banerjee S.M., Grant V., Rosenthal G.G., Schumer M. Genomic insights into variation in thermotolerance between hybridizing swordtail fishes. Mol. Ecol. 2022;16489 doi: 10.1111/mec.16489. [DOI] [PubMed] [Google Scholar]
- 33.Agoglia R.M., Sun D., Birey F., Yoon S.-J., Miura Y., Sabatini K., Pașca S.P., Fraser H.B. Primate cell fusion disentangles gene regulatory divergence in neurodevelopment. Nature. 2021;592:421–427. doi: 10.1038/s41586-021-03343-3. [DOI] [PMC free article] [PubMed] [Google Scholar]
- 34.Song J.H.T., Grant R.L., Behrens V.C., Kučka M., Roberts Kingman G.A., Soltys V., Chan Y.F., Kingsley D.M. Genetic studies of human–chimpanzee divergence using stem cell fusions. Proc. Natl. Acad. Sci. 2021;118 doi: 10.1073/pnas.2117557118. [DOI] [PMC free article] [PubMed] [Google Scholar]
- 35.Barr K.A., Rhodes K.L., Gilad Y. The relationship between regulatory changes in cis and trans and the evolution of gene expression in humans and chimpanzees. Genome Biol. 2023;24:207. doi: 10.1186/s13059-023-03019-3. [DOI] [PMC free article] [PubMed] [Google Scholar]
- 36.McGirr J.A., Martin C.H. Few Fixed Variants between Trophic Specialist Pupfish Species Reveal Candidate Cis -Regulatory Alleles Underlying Rapid Craniofacial Divergence. Mol. Biol. Evol. 2021;38:405–423. doi: 10.1093/molbev/msaa218. [DOI] [PMC free article] [PubMed] [Google Scholar]
- 37.Emerson J.J., Hsieh L.-C., Sung H.-M., Wang T.-Y., Huang C.-J., Lu H.H.-S., Lu M.-Y.J., Wu S.-H., Li W.-H. Natural selection on cis and trans regulation in yeasts. Genome Res. 2010;20:826–836. doi: 10.1101/gr.101576.109. [DOI] [PMC free article] [PubMed] [Google Scholar]
- 38.Verta J.-P., Jones F.C. Predominance of cis-regulatory changes in parallel expression divergence of sticklebacks. Elife. 2019;8 doi: 10.7554/eLife.43785. [DOI] [PMC free article] [PubMed] [Google Scholar]
- 39.Shen S.Q., Turro E., Corbo J.C. Hybrid Mice Reveal Parent-of-Origin and Cis- and Trans-Regulatory Effects in the Retina. PLoS One. 2014;9 doi: 10.1371/journal.pone.0109382. [DOI] [PMC free article] [PubMed] [Google Scholar]
- 40.Schaefke B., Emerson J.J., Wang T.-Y., Lu M.-Y.J., Hsieh L.-C., Li W.-H. Inheritance of Gene Expression Level and Selective Constraints on Trans- and Cis-Regulatory Changes in Yeast. Mol. Biol. Evol. 2013;30:2121–2133. doi: 10.1093/molbev/mst114. [DOI] [PubMed] [Google Scholar]
- 41.Wang D., Sung H.-M., Wang T.-Y., Huang C.-J., Yang P., Chang T., Wang Y.-C., Tseng D.-L., Wu J.-P., Lee T.-C., et al. Expression evolution in yeast genes of single-input modules is mainly due to changes in trans -acting factors. Genome Res. 2007;17:1161–1169. doi: 10.1101/gr.6328907. [DOI] [PMC free article] [PubMed] [Google Scholar]
- 42.Signor S.A., Nuzhdin S.V. The Evolution of Gene Expression in cis and trans. Trends Genet. 2018;34:532–544. doi: 10.1016/j.tig.2018.03.007. [DOI] [PMC free article] [PubMed] [Google Scholar]
- 43.Bloom J.S., Ehrenreich I.M., Loo W.T., Lite T.-L.V., Kruglyak L. Finding the sources of missing heritability in a yeast cross. Nature. 2013;494:234–237. doi: 10.1038/nature11867. [DOI] [PMC free article] [PubMed] [Google Scholar]
- 44.Peter J., De Chiara M., Friedrich A., Yue J.-X., Pflieger D., Bergström A., Sigwalt A., Barre B., Freel K., Llored A., et al. Genome evolution across 1,011 Saccharomyces cerevisiae isolates. Nature. 2018;556:339–344. doi: 10.1038/s41586-018-0030-5. [DOI] [PMC free article] [PubMed] [Google Scholar]
- 45.Fournier T., Abou Saada O., Hou J., Peter J., Caudal E., Schacherer J. Extensive impact of low-frequency variants on the phenotypic landscape at population-scale. Elife. 2019;8 doi: 10.7554/eLife.49258. [DOI] [PMC free article] [PubMed] [Google Scholar]
- 46.Griffing B. Concept of General and Specific Combining Ability in Relation to Diallel Crossing Systems. Aust. J. Biol. Sci. 1956;9:463. [Google Scholar]
- 47.Coolon J.D., McManus C.J., Stevenson K.R., Graveley B.R., Wittkopp P.J. Tempo and mode of regulatory evolution in Drosophila. Genome Res. 2014;24:797–808. doi: 10.1101/gr.163014.113. [DOI] [PMC free article] [PubMed] [Google Scholar]
- 48.Takahasi K.R., Matsuo T., Takano-Shimizu-Kouno T. Two types of cis - trans compensation in the evolution of transcriptional regulation. Proc. Natl. Acad. Sci. 2011;108:15276–15281. doi: 10.1073/pnas.1105814108. [DOI] [PMC free article] [PubMed] [Google Scholar]
- 49.Landry C.R., Wittkopp P.J., Taubes C.H., Ranz J.M., Clark A.G., Hartl D.L. Compensatory cis-trans Evolution and the Dysregulation of Gene Expression in Interspecific Hybrids of Drosophila. Genetics. 2005;171:1813–1822. doi: 10.1534/genetics.105.047449. [DOI] [PMC free article] [PubMed] [Google Scholar]
- 50.Lemos B., Araripe L.O., Fontanillas P., Hartl D.L. Dominance and the evolutionary accumulation of cis - and trans -effects on gene expression. Proc. Natl. Acad. Sci. 2008;105:14471–14476. doi: 10.1073/pnas.0805160105. [DOI] [PMC free article] [PubMed] [Google Scholar]
- 51.Dobin A., Davis C.A., Schlesinger F., Drenkow J., Zaleski C., Jha S., Batut P., Chaisson M., Gingeras T.R. STAR: ultrafast universal RNA-seq aligner. Bioinformatics. 2013;29:15–21. doi: 10.1093/bioinformatics/bts635. [DOI] [PMC free article] [PubMed] [Google Scholar]
- 52.Liao Y., Smyth G.K., Shi W. featureCounts: an efficient general purpose program for assigning sequence reads to genomic features. Bioinforma. Oxf. Engl. 2014;30:923–930. doi: 10.1093/bioinformatics/btt656. [DOI] [PubMed] [Google Scholar]
- 53.Langfelder P., Horvath S. WGCNA: an R package for weighted correlation network analysis. BMC Bioinf. 2008;9:559. doi: 10.1186/1471-2105-9-559. [DOI] [PMC free article] [PubMed] [Google Scholar]
- 54.Bates D., Mächler M., Bolker B., Walker S. Fitting Linear Mixed-Effects Models Using lme4. J. Stat. Softw. 2015;67 [Google Scholar]
- 55.Purcell S., Neale B., Todd-Brown K., Thomas L., Ferreira M.A.R., Bender D., Maller J., Sklar P., De Bakker P.I.W., Daly M.J., Sham P.C. PLINK: A Tool Set for Whole-Genome Association and Population-Based Linkage Analyses. Am. J. Hum. Genet. 2007;81:559–575. doi: 10.1086/519795. [DOI] [PMC free article] [PubMed] [Google Scholar]
- 56.Zhang Q., Privé F., Vilhjálmsson B., Speed D. Improved genetic prediction of complex traits from individual-level data or summary statistics. Nat. Commun. 2021;12:4192. doi: 10.1038/s41467-021-24485-y. [DOI] [PMC free article] [PubMed] [Google Scholar]
- 57.Ochoa A., Storey J.D. Estimating FST and kinship for arbitrary population structures. PLoS Genet. 2021;17 doi: 10.1371/journal.pgen.1009241. [DOI] [PMC free article] [PubMed] [Google Scholar]
- 58.Rönnegård L., Shen X., Alam M. hglm: A Package for Fitting Hierarchical Generalized Linear Models. R J. 2010;2:20. [Google Scholar]
- 59.Li H., Durbin R. Fast and accurate short read alignment with Burrows–Wheeler transform. Bioinformatics. 2009;25:1754–1760. doi: 10.1093/bioinformatics/btp324. [DOI] [PMC free article] [PubMed] [Google Scholar]
- 60.Castel S.E., Levy-Moonshine A., Mohammadi P., Banks E., Lappalainen T. Tools and best practices for data processing in allelic expression analysis. Genome Biol. 2015;16:195. doi: 10.1186/s13059-015-0762-6. [DOI] [PMC free article] [PubMed] [Google Scholar]
- 61.Pockrandt C., Alzamel M., Iliopoulos C.S., Reinert K. GenMap: ultra-fast computation of genome mappability. Bioinformatics. 2020;36:3687–3692. doi: 10.1093/bioinformatics/btaa222. [DOI] [PMC free article] [PubMed] [Google Scholar]
- 62.Mayba O., Gilbert H.N., Liu J., Haverty P.M., Jhunjhunwala S., Jiang Z., Watanabe C., Zhang Z. MBASED: allele-specific expression detection in cancer tissues and cell lines. Genome Biol. 2014;15:405. doi: 10.1186/s13059-014-0405-3. [DOI] [PMC free article] [PubMed] [Google Scholar]
- 63.Korotkevich G., Sukhov V., Budin N., Shpak B., Artyomov M.N., Sergushichev A. Fast gene set enrichment analysis. Bioinformatics. 2016 [Google Scholar]
- 64.Lynch M., Walsh B. 1998. Genetics and Analysis of Quantitative Traits (Sinauer Assoc) [Google Scholar]
- 65.Dutta A., Dutreux F., Schacherer J. Loss of Heterozygosity Spectrum Depends on Ploidy Level in Natural Yeast Populations. Mol. Biol. Evol. 2022;39:msac214. doi: 10.1093/molbev/msac214. [DOI] [PMC free article] [PubMed] [Google Scholar]
- 66.Gene Ontology Consortium. Carbon S., Douglass E., Good B.M., Unni D.R., Harris N.L., Mungall C.J., Basu S., Chisholm R.L., Dodson R.J., et al. The Gene Ontology resource: enriching a GOld mine. Nucleic Acids Res. 2021;49:D325–D334. doi: 10.1093/nar/gkaa1113. [DOI] [PMC free article] [PubMed] [Google Scholar]
Associated Data
This section collects any data citations, data availability statements, or supplementary materials included in this article.
Supplementary Materials
Data Availability Statement
-
•
All RNA sequencing reads are available in the European Nucleotide Archive (ENA) under the accession number PRJEB64466.
-
•The 1002 Yeast Genome website http://1002genomes.u-strasbg.fr/files/Diallel_RNAseq/ASE provides access to:
-
•Datafile S1: Datafile1_raw_data_20230713.tab
-
•Datafile S2: Datafile2_ase_sum_20230609.tab
-
•
These data files have also been deposited on Mendeley Data with the following DOI: https://doi.org/10.17632/gycmf58tyy.1.
-
•
Original codes for data process are deposited at GitHub (https://github.com/HaploTeam/diallel_RNAseq) and publicly available as of the date of publication. The codes are deposited at Zenodo with DOI https://doi.org/10.5281/zenodo.10011210.
-
•
Any additional information required to reanalyze the data reported in this paper is available from the lead contact upon request.