Abstract
Mitotic catastrophe (MC) is a novel form of cell death that plays an important role in the treatment and drug resistance of colon adenocarcinoma (COAD). However, MC related genes in COAD treatment and prognosis evaluation are rarely studied. In this study, the transcriptome data, somatic mutation and copy number variation data were obtained from The Cancer Genome Atlas (TCGA) database. The mitotic catastrophe related genes (MCRGs) were obtained from GENCARDS website. Differential gene analysis was conducted with LIMMA package. Univariate Cox regression analysis was used to identify prognostic related genes. Mutation analysis was performed and displayed by maftools package. RCircos package was used for localizing the position of genes on chromosomes. “Glmnet” R package was applied for constructing a risk model via the LASSO regression method. Consensus clustering analyses was implemented for clustering different subtypes. Functional enrichment analysis through Gene Ontology (GO) and Kyoto Encyclopedia of Genes and Genomes (KEGG) methods, immune infiltration analysis via single sample gene set enrichment analysis (ssGSEA), tumor mutation burden and drug sensitivity analysis by pRRophetic R package were also carried out for risk model or molecular subtype’s assessment. Additionally, the connections between the expression of hub genes and overall survival (OS) were obtained from online Human Protein Atlas (HPA) website. Real-Time Quantitative Polymerase Chain Reaction (RT‑qPCR) further validated the expression of hub genes. A total of 207 differentially expressed MCRGs were selected in the TCGA cohort, 23 of which were significantly associated with OS in COAD patients. Subsequently, we constructed risk score prognostic models with 5 hub MCRGs, including SYCE2, SERPINE1, TRIP6, LIMK1, and EEPD1. The high-risk patients suffered from poorer prognosis. Furthermore, we developed a nomogram that gathered age, sex, staging, and risk score to accurately forecast the clinical survival outcomes in 1, 3, and 5 years. The results of functional enrichment suggested a significant correlation between MCRGs characteristics and cancer progression, with important implications for the immune microenvironment. Moreover, patients who displayed high TMB and high risk score showed worse prognosis, and risk characteristics were associated with different chemotherapeutic agents. Finally, RT‑qPCR verified the increased expression of the five MCRGs in clinical samples. The five MCRGs in the prognostic signature were associated with prognosis, and could be treated as reliable prognostic biomarkers and therapeutic targets for COAD patients with distinct clinicopathological characteristics, thereby providing a foundation for the precise application of pertinent drugs in COAD patients.
Subject terms: Bioinformatics, Cancer genomics, Gastrointestinal cancer, Biomarkers, Risk factors
Introduction
Colon Adenocarcinoma (COAD), the most common histological subtype of Colorectal cancer (CRC), has one of the highest incidences and mortalities among malignant tumors1,2. Surgical resection and chemotherapy are the primary treatments3, but the adverse effects of chemotherapy can reduce patients’ quality of life and worsen their prognosis4. The occurrence and development of COAD is a complex, heterogeneous process that is influenced by genetic variation, cellular and external environmental factors, and no specific carcinogenic mechanism has been identified4. Worse still, the majority of COAD patients are metastatic when diagnosed, which results in about 14% possibility on 5-year survival rate although under systemic treatment5. At present, the pathogenesis of COAD has not been fully elucidated, so it is very important to find valuable molecular targets6–8, which can provide new treatments for patients with COAD.
Mitotic catastrophe (MC) is a newly recognized form of cell death that arises from dysregulation of the mitotic process and functions as an endogenous tumor suppressor mechanism9. MC is a complex signal cascade that drives cells to undergo mitosis and may serve as a new target for cancer therapy10. In recent years, the mechanism of MC occurrence and development has garnered much attention, and inducing MC in tumor cells has been used to optimize clinical treatment of tumors and reverse multidrug resistance in some tumors11,12. For instance, Jung et al.13 observed that induction of MC in oral cancer cells, could be a promising treating approach. Other studies also have shown associations between MC and favorable prognosis in colon cancer9, breast cancer14, and prostate cancer15. Despite these findings, the functions of MC-related genes (MCRGs) in the prognosis of COAD patients have not been reported.
In this study, we explored the expression of MCRGs and their prognostic value in COAD patients. The risk model based on selected MCRGs for predicting the prognosis of COAD patients showed better results and provided potential biomarkers for the treatment of COAD patients.
Methods
Data acquisition and processing
The transcriptome data of 447 patients with COAD and 41 normal samples and clinical information were downloaded from The Cancer Genome Atlas (TCGA) database (https://portal.gdc.cancer.gov/repository) accompanied with relevant somatic mutation and copy number variation (CNV) data. The MCRGs were obtained from GENCARDS (https://www.genecards.org/) (Table S1) and identified differentially expressed MCRGs between tumor samples and normal samples (Table S2) by the the Bioconductor Linear Model for Microarray Analysis (LIMMA) package (FDR < 0.05, |log2 FC|≥ 2)16. Then, univariate Cox regression analysis was used applying coxph function in survival package17 to identify differentially expressed MCRGs that were significantly associated with overall survival (OS) (Table S3, P < 0.05).
Mutation analysis of MCRGs
The mutation frequency and oncoplot waterfall plot of 23 prognosis-related MCRGs in COAD patients were generated by the “maftools” package. The R package "ggplot2" was also used to show the frequency of gene gain and loss. The location of CNV alteration of 23 MCRGs onchromosomes was drawn using the “RCircos” package in R.
Prognostic risk model construction for MCRGs
The five genes with the best prognosis were screened in the TCGA dataset using the LASSO regression in the “glmnet” R package. The risk score model was constructed by linear fitting, where the weight of each gene was determined by the regression coefficient obtained from the LASSO regression analysis.
The TCGA data set was divided into a 50% training set and a 50% testing set applying the function createDataPartition () in the caret R package, and all patients were divided into a high-risk group and a low-risk group according to the median risk score. The predictive accuracy of the risk score model was assessed by using the “survROC” R package for the receiver operating characteristic (ROC) curve, and the area under the curve18 was calculated at different time points (year 1, year 2 and year 3). Heat maps for both groups were created using the “pheatmap” R package.
Based on independent clinical characteristics (age, sex, TNM staging and risk signature) explored by univariate and multivariate Cox regression analyses, we constructed a multifactorial prognostic nomogram using the “rms” and “survival” R packages. Verification of the accuracy of the nomogram based on time-dependent ROC curves for 1, 3 and 5 years, predicted calibration curves, and the concordance index (c-index).
Consensus clustering analyses
Consensus clustering analyses were performed using the k-means algorithm in the “Consensus Cluster Plus” R package. The optimal number of subtypes was determined by assessing the consistent matrix and cumulative distribution function (CDF). Based on the transcription matrix of the five genes in the signature, two robust subtypes were identified. We used Kaplan–Meier analysis in the R “survminer” package to determine whether COAD subtypes exhibited significant survival differences.
Functional enrichment analysis and immune function status analysis
We used single sample gene set enrichment analysis (ssGSEA) in the Gene Set Variation Analysis (GSVA) package19 to calculate 23 types of immune cells infiltration, and detected differences in immune cell infiltrates between different subgroups using the Wilcoxon rank sum test. In addition, the two subtypes were analyzed by Gene Ontology (GO, http://www.geneontology.org/)20 and Kyoto Encyclopedia of Genes and Genomes (KEGG, https://www.kegg.jp/kegg/kegg1.html)21,22 using the R “clusterprofiler” package23.
Tumor mutation burden correlation
We evaluated the Tumor Mutation Burden (TMB) score of each COAD patient using somatic mutation analysis, and divided patients into low TMB and high TMB groups24. The overall survival25 of both groups was compared using Kaplan–Meier analysis. Similarly, we divided COAD patients into four groups according to TMB and risk score, and compared the OS of these four groups24.
The connections between MCRGs expression and OS in human protein atlas
To verify the expression and prognostic significance of MCRGs, we searched for hub genes on the Human Protein Atlas (HPA) website (https://www.proteinatlas.org/), and obtained immunohistochemical (IHC) staining images26. Then, Kaplan–Meier Plotter website (http://kmplot.com/) was performed to verify the prognosis of hub genes.
Drug sensitivity analysis
We used the “pRRophetic” R software package to calculate the half inhibitory concentration (IC50) values of tumor therapeutic drugs and evaluate the difference in efficacy between high and low risk groups. We also analyzed the correlation between IC50 and risk score using Spearman's correlation test. The lower IC50 value, the higher treatment sensitivity.
Collection of clinical specimens
Here, eight pairs of surgically excised colorectal cancer (CRC) and matched normal tissues were procured, immediately cryopreserved in liquid nitrogen, and stored at − 80 °C. None of the colorectal cancer patients had undergone any preoperative anti-tumor therapies. All patients provided informed consent, and the study was approved by the the Ethics Committee of Nantong Tumor Hospital (no. 2022-061). All methods were performed in accordance with the relevant guidelines and regulations.
Real-time quantitative polymerase chain reaction (RT‑qPCR)
Total RNA was extracted using TRIzol reagent (Invitrogen, Thermo Scientific, Shanghai, China) following the manufacturer's instructions. cDNA was synthesized using the QuantiTect Reverse Transcription Kit (QIAGEN, Valencia, CA, USA), and real-time PCR was performed using SYBR-Green (Takara, Otsu, Shiga, Japan). Relative gene expression levels were analyzed using the 2-ΔΔCt method and normalized to GAPDH. The primer sequences used for RT-qPCR were shown in Table 1. All samples were tested in triplicate.
Table 1.
The primer sequences in this study.
| GAPDH-F | TGACATCAAGAAGGTGGTGAAGCAG |
| GAPDH-R | GTGTCGCTGTTGAAGTCAGAGGAG |
| EEPD1-F | GTATGCAGGATTCCTATGGGAC |
| EEPD1-R | GAAGGTTAACAAGGGTCAGGTC |
| LIMK1-F | GATGTGAAGAATTCCATCCACG |
| LIMK1-R | GAATCAGCAGGTCAATCTCGTC |
| TRIP6-F | CTATAGGAGCCAGAGAGAGCC |
| TRIP6-R | CTTCTTCGTCAGCCTATCCAG |
| SERPINE1-F | AACGTGGTTTTCTCACCCTAT |
| SERPINE1-R | CAATCTTGAATCCCATAGCTGC |
| SYCE2-F | TCGGGAGGGATAGGAGGGACAG |
| SYCE2-R | TGGGAGAGGCGGCTTCAGATG |
Statistical analysis
All statistical analyses were performed using R package (version 4.0.4)23. The Wilcoxon test was used to compare statistical differences between the two groups. The Spearman test was used to calculate correlation coefficients. The log-rank test was used to determine the significance of Kaplan–Meier analysis of survival differences. P values < 0.05 were considered statistically significant.
Ethics statement
The studies involving human participants were reviewed and approved by the Ethics Committee of Nantong Tumor Hospital (no. 2022-061). The patients provided their written informed consent to participate in this study, complying with the current laws in China.
Results
The genetic and expression landscape of prognostic MCRGs in COAD samples
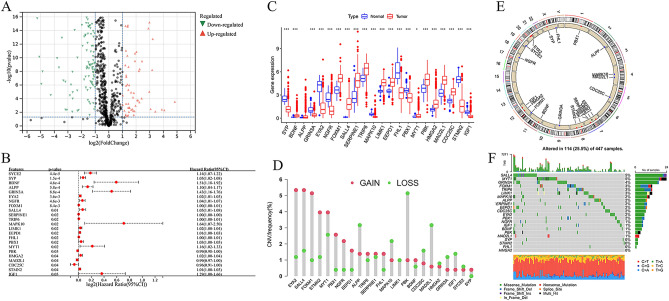
To identify prognostic MCRGs in COAD, 900 MCRGs were obtained from GENECARDS (Table S1). Combined with TCGA COAD databases, a total of 207/894 differentially expressed genes were selected in the Fig. 1A (Tables S2 and S3). Among them, SYCE2, SYP, BDNF, ALPP, GRIN3A, EYA2, NGFR, FOXM1, SALL4, SERPINE1, TRIP6, MAPK10, LIMK1, EEPD1, FHL1, PBX1, MYT1, PBK, HMGA2, MAD2L1, CDC25C, STMN2, and IGF1 were identified as candidate genes significantly associated with the OS of COAD patients (Fig. 1B). We examined the expression of these 23 prognostic MCRGs in COAD and normal tissues. Compared with normal tissues, the expression of BDNF, FOXM1, SALL4, SERPINE1, TRIP6, LIMK1, EEPD1, MYT1, PBK, HMGA2, MAD2L1, and CDC25C was increased, while SYP, GRIN3A, EYA2, NGFR, MAPK10, FHL1, PBX1, STMN2, and IGF1 expression was decreased in COAD (Fig. 1C).
Figure 1.
Genetic and expression variation of mitotic catastrophe-related genes (MCRGs) in colon adenocarcinoma (COAD). (A) Volcano plot of differentially expressed MCRGs. (B) Forest plot of univariate Cox analysis showing the 23 MCRGs significantly associated with OS in colon cancer patients. (C) Expression of 23 MCRGs in COAD and normal colon tissues. The upper and lower ends of the boxes indicate the interquartile range of values. Lines in the boxes represent medians. *P < 0.05, ***P < 0.001. (D) Copy number variation (CNV) frequencies of the 23 MCRGs in the COAD cohort. (E) Location of CNV alterations in 23 MCRGs on 23 chromosomes in the cohort. (F) Mutation frequencies and classification of 23 MCRGs in COAD.
We also investigated the frequency of CNV alterations in 23 prognostic MCRGs. The result showed that EYA2, SALL4, FOXM1, STMN2, MYT1, PBX1, NGFR, EEPD1, TRIP6, SERPINE1, FHL1, BDNF, and SYP had copy number amplification. While ALPP, MAPK10, LIMK1, PBK, CDC25C, MAD2L1, HMGA2, GRIN3A, and IGF1 had widespread deletion frequencies (Fig. 1D). Moreover, the CNV alterations of these prognostic MCRGs were located on chromosomes (Fig. 1E). The landscape showed that 114 patients (25.3%) displayed genetic mutations, and the most common variant was missense mutation, mainly C > T mutation (Fig. 1F).
Development of an MC-related prognostic gene model in the TCGA cohort
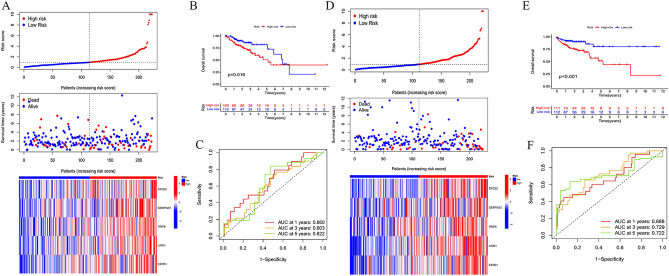
In the TCGA cohort, we developed a prognostic gene model related to MC by identifying five hub genes (SYCE2, SERPINE1, TRIP6, LIMK1, and EEPD1) with prognostic value through LASSO analysis (Fig. S1). We used the formula Risk score = 0.972240964SYCE2 + 0.208393835SERPINE1 + 0.244958765TRIP6 + 0.583762591LIMK1 + 0.511535266 * EEPD1 to divide the 446 COAD samples into high-risk and low-risk populations. The training and testing sets confirmed that the survival time was decreased as the risk scores of these five genes increased (Fig. 2A,D). Additionally, the Kaplan–Meier curve showed that high-risk scores had worse overall survival probability than those with low-risk scores (Fig. 2B,E), and ROC curves predicted the sensitivity and specificity of the MCRGs signature, which reached 0.660, 0.603, 0.622 (in the training set), and 0.688, 0.729, 0.722 (in the test set) in 1-, 3-, and 5-year, respectively (Fig. 2C,F). In the entire set, fewer deaths were observed in the low-risk group, and the prognosis of the low-risk group was better than that of the high-risk group (Fig. S2A,B). ROC curves reached 0.674, 0.662, and 0.692 for 1-, 3-, and 5-year survival, respectively, demonstrating the predictive performance of the risk signature in the entire set (Fig. S2C).
Figure 2.
Construction and internal validation of a prognostic model for MCRGs. (A) Heat map of risk score distribution, survival status and MCRG expression for high-risk and low-risk patients in the training set. (B) Survival curves of high- and low-risk patients in the training set. (C) ROC curves for the prognostic model of MCRGs in the training set predicting overall survival at 1, 3 and 5 years. (D) Heat map of risk score distribution, survival status and MCRG expression for high-risk and low-risk patients in the test set. (E) Survival curves of high- and low-risk patients in the test set. (F) ROC curves for the prognostic model of MCRGs in the test set predicting overall survival at 1, 3 and 5 years.
Nomogram construction and validation
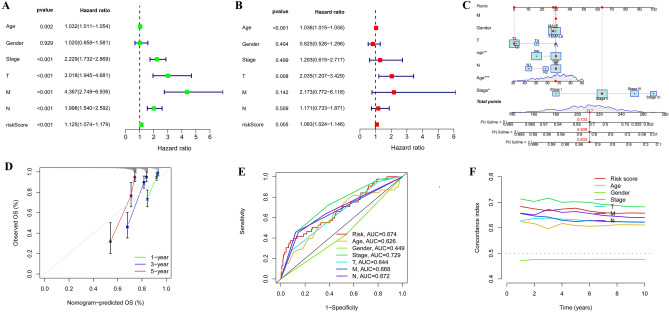
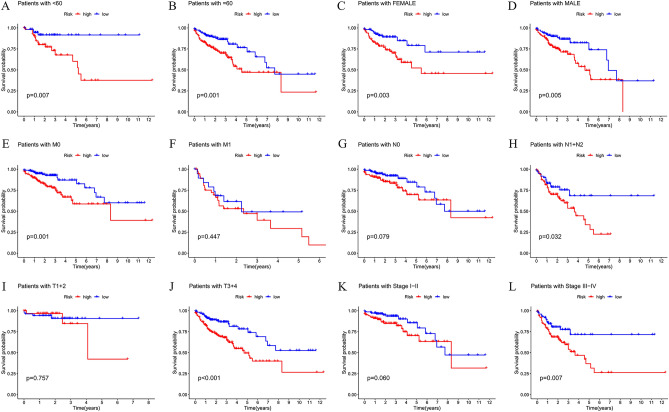
We conducted univariate and multivariate Cox regression analyses on the TCGA dataset, which revealed that our risk signature and clinical variables such as age, stage, T stage, M stage, and N stage were independent prognostic factors that affected COAD patients (Fig. 3A–B). To validate our findings, we designed a nomogram that displayed relatively good predictions for the 3-year and 5-year overall survival rates in the entire cohort (Fig. 3C–D). We also evaluated the performance of our signature by calculating the AUC values of various clinical factors, including age, stage, T stage, M stage, and N stage, and found that our signature had a higher C-index advantage (Fig. 3E–F). These results indicated that our MCRGs signature was a superior clinical target for predicting the OS of COAD patients. Furthermore, our survival analysis of clinical characteristics based on the MCRGs showed that our signature could significantly distinguish patients with different age groups, genders, M and N stages, T stages, and stages III + IV (Fig. 4, P < 0.05), suggesting that our model has the potential to predict different clinical signs.
Figure 3.
Construction of predictive nomogram. (A–B) Forest plot of univariate and multivariate Cox regression analysis of patient prognosis. (C–D) A designed nomogram predicted overall patient survival at 1, 3, and 5 years and calibration curves. (E) The ROC curves show the prediction efficiency of the nomogram in the TCGA cohort. (F) C-index for age, sex, stage, T-stage, M-stage, N-stage, and risk score.
Figure 4.
Analysis of survival differences between high- and low-risk population subgroups in the TCGA cohort. OS analysis of risk scores in high-risk and low-risk patients with patient age > 60 years (A), < = 60 years (B), female (C), male (D), M0 stage (E), M1 stage (F), N0 stage (G), N1 + N2 stage (H), T1 + 2 stage (I), T3 + 4 stage (J), I–II stage (K), and III–IV stage (L).
Characteristic genotype analysis
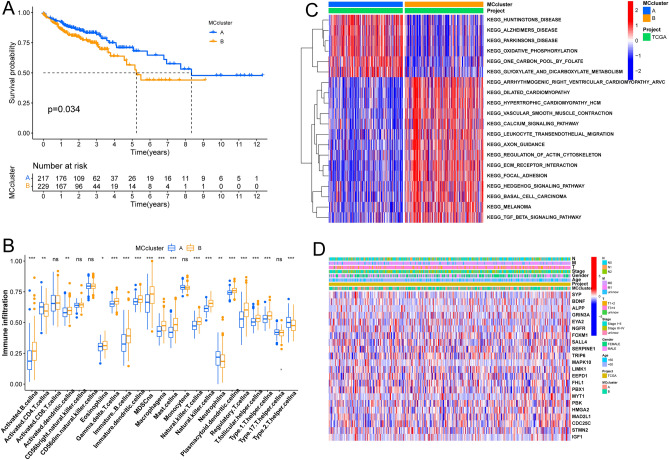
Based on the selected k value and the cophenetic correlation coefficient, we classified all patients with COAD into two subtypes (clusters A and B) (Fig. S3A–C), which were then further analyzed using Principal component analysis (PCA) to reveal the subtypes based on MCRGs (Fig. S3D). Results showed that patients in cluster B had worse overall survival in COAD than those in cluster A (Fig. 5A), and the differences in immune cell fraction between the two clusters were further highlighted by the boxplot (Fig. 5B). GSVA analysis revealed that cluster A was enriched in huntingtons disease, alzheimers disease, and oxidative phosphorylation, while cluster B was enriched in arrhythmogenic right ventricular cardiomyopathy (ARVC), dilated cardimyopathy, hypertrophic cardiomyopathy (HCM), and calcium signaling pathway (Fig. 5C). In addition, based on clinical features (N stage, M stage, T stage, stage, gender, age and MC cluster), we constructed a heatmap of the MCRGs that took into account the complex cluster and risk score (Fig. 5D).
Figure 5.
Defining molecular subtypes of COAD patients and their characteristics based on 5 MCRGs (A) OS survival curves were analyzed in 2 different subtypes of patients. (B) Differences in infiltration scores of 23 immune markers in high and low risk groups based on ssGSEA algorithm. (C) GSVA enrichment analysis of 2 COAD subtypes. (D) Clinicopathological characteristics of 2 different subtypes and heat map of DEPRGs expression. *P < 0.05, **P < 0.01, ***P < 0.001, ns, no significance.
Immune function, enrichment analysis, and risk signature variability
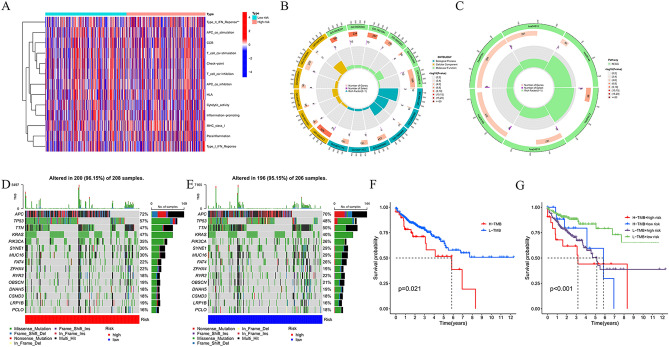
To comprehensively explore the immune function between different risk groups and immune cell infiltration, we generated a heatmap (Fig. 6A). Additionally, we performed Gene Ontology (GO) enrichment analysis to explore the underlying molecular mechanisms of the MCRGs-based model, which mainly involved cell differentiation and cell polarity (Fig. 6B). Through KEGG analysis, we found that the model was mainly involved in ECM-receptor interaction, Wnt signaling pathway, Human papillomavirus infection, PI3K-Akt signaling pathway, and Focal adhesion (Fig. 6C).
Figure 6.
Mechanisms related to MCRG risk signature in COAD. (A) Heat map of immune cell inflammation in high- and low-risk populations. (B) Gene Ontology (GO). (C) KEGG analysis. (D) Frequency and type of gene mutations in high-risk group. € Frequency and type of gene mutations in the low-risk group. (F) OS survival curve analysis in low TMB group and high TMB group. (G) OS survival curve analysis between different TMB subgroups in high and low risk groups.
Through the waterfall plots, we revealed that the mutation profiles of high-risk patients were higher than those of the low-risk group, except for TTN (Fig. 6D–E).
Based on the TMB scores, we detected the prognosis and found that high TMB scores were associated with worse survival (Fig. 6F). Furthermore, we validated that the MC risk signature was better at predicting OS outcomes than TMB scores. Patients with high and low TMB scores in the high-risk groups (H-TMB of high risk and L-TMB of high risk) displayed poorer OS than patients with high- and low-TMB scores in the low-risk groups (Fig. 6G).
The protein expression of 5 hub MCRGs and prognostic evaluation
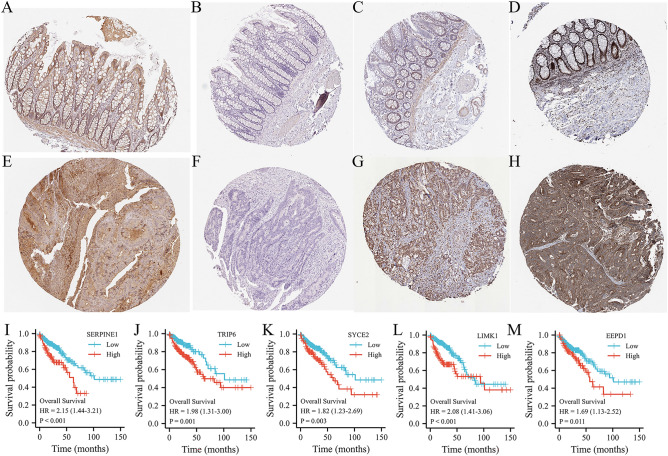
Through HPA database for immunohistochemical data of SYCE2, SERPINE1, TRIP6, and LIMK1, and EEPD1. We found that these genes were all highly expressed in COAD tissues (Fig. 7A–D) in comparing with normal tissues (Fig. 7E–H). Then, we used the Kaplan–Meier Plotter website to verify the prognostic value of the 5 hub genes. The expression of these 5 genes were related to inferior OS (Fig. 7I–M).
Figure 7.
The expression of 4 MCRGs from risk signatures in HPA databse. (A–D) Immunohistochemistry of 4 MCRGs (SYCE2, SERPINE1, TRIP6 and LIMK1) in COAD tissues43. Immunohistochemistry of 4 MCRGs (SYCE2, SERPINE1, TRIP6 and LIMK1) in normal colon tissues. (I–M) Survival curve analysis of 5 MCRGs in Kaplan–Meier Plotter.
Relationships between MCRGs and chemotherapy drug sensitivity
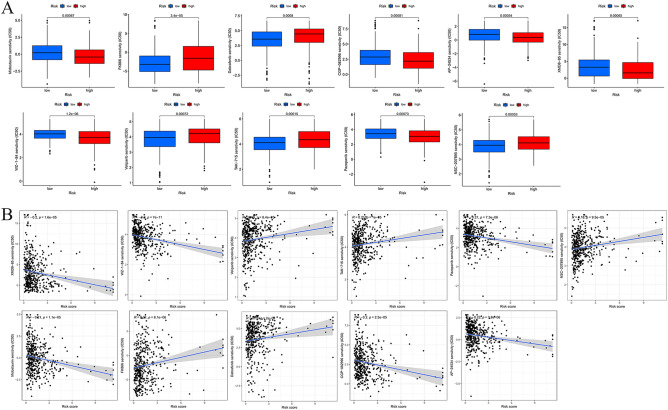
Figure 8A illustrated the results of the drug sensitivity test. Potential chemotherapy drugs were identified by measuring the IC50 between the low-risk and high-risk groups. COAD patients in the high-risk subtype were evidently sensitive to chemotherapy drugs such as AP-24534, CGP-082996, Dabrafenib, FK866, Midostaurin, NSC-207895, Pazopanib, TAK-715, Veliparib, WZ-1–84, and XMD8-85 (all P < 0.05). While low-risk groups were sensitive to FK866, Veliparib, Dabrafenib, TAK-75 and NSC-207895. Moreover, we confirmed the association between the risk signature and chemotherapy drugs (Fig. 8B).
Figure 8.
Drug sensitivity analysis. (A) Differences in IC50 of AP-24534, CGP-082996, Dabrafenib, FK866, Midostaurin, NSC-207895, Pazopanib, TAK-715, Veliparib, WZ-1-84 and XMD8-85 in high and low risk groups. (B) Correlation analysis of MCRG risk score and drug IC50.
MCRGs expression was high in CRC tissues
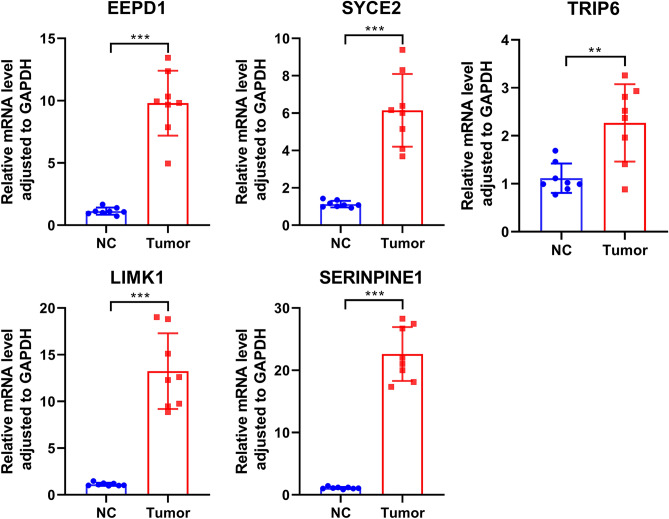
To validate the expression profile of MCRGs in clinical patients, we examined the expression of oncogenes (SYCE2, SERPINE1, TRIP6, LIMK1, and EEPD1) by RT-qPCR in 8 pairs of clinical samples from CRC patients. According to the qPCR results, the oncogenes were expressed at high levels in CRC tissues (Fig. 9).
Figure 9.
The expression levels of the oncogenes (SYCE2, SERPINE1, TRIP6, LIMK1 and EEPD1) were up-regulated in CRC tissues as shown by qRT-PCR results (n = 8). ** P ≤ 0.01, *** P ≤ 0.001. The results were presented as mean ± SEM.
Discussion
As a malignancy with high mortality rate and unfavorable prognosis, the development of colon adenocarcinoma (COAD) can be influenced by various factors3. Among them, (MCRGs have been shown to be essential in the prevention, treatment, and drug resistance of many cancers, including COAD11,12,27,28. However, the study of MCRGs in cancer development has been limited to individual MCRGs, and there is a lack of systematic and comprehensive exploration of the combined effects of a large number of MCRGs on cancer14,29,30. In this study, we screened 23 prognosis-associated MCRGs in the TCGA-COAD cohort and revealed variations of MCRGs in COAD at the transcriptional and genetic levels. Then, we developed a risk prognostic model consisting of five MCRGs in combination with the survival status of COAD patients. This model could independently predict the survival status of patients with different clinicopathological features and revealed the underlying mechanisms and associated factors, such as the immune microenvironment and mutational status. The drug sensitivity analysis confirmed the association between risk characteristics and chemotherapeutic agents, potentially providing a basis for more precise application of relevant drugs.
Mitotic catastrophe is a regulated anti-proliferative process that occurs during defective or failed mitosis, and is an oncosuppressive mechanism that maintains genomic stability10. It remains unknown how MCRGs are expressed in COAD and whether they are associated with survival time in patients. Based on the expression of MCRGs, screening for biomarkers with prognostic value is expected, which could provide a reliable assessment tool for COAD patients with poor prognosis. Using LASSO Cox regression analysis, an independent prognostic gene model based on five MCRGs (SYCE2, SERPINE1, TRIP6, LIMK1, and EEPD1) was constructed to predict the overall survival25 of COAD patients with different clinicopathological characteristics. Surprisingly, many MCRG-based prognostic models have not been developed so far. The 5 prognostic MCRGs identified in our study have been mentioned in relevant prognostic studies. For example, Ye et al.31 reported a 9-gene prognostic model including SYCE2 in gastric cancer, which was able to accurately predict the overall survival of gastric cancer patients. High expression of SERPINE1 is significantly associated with poor prognosis in various cancers, including COAD32, gastric cancer33,34, ovarian cancer25, and breast cancer35. Similarly, Wei et al.36 developed a 6-gene prediction model including SERPINE1 to predict the survival outcome of breast cancer patients at 1, 3, and 5 years, and its accuracy and reliability were validated. During tumorigenesis and progression, studies have confirmed that LIMK1 is upregulated in various tumors, is associated with patient prognosis, and is closely associated with changes in the biological behavior of several human tumors37–39. Recent findings also suggest that LIMK1 may be a valuable and promising biomarker for the diagnosis of CRC39. EEPD1 is also overexpressed in various solid tumors, including colon cancer, but related studies have focused more on its role in DNA damage40. It was found that DNA damage may lead to mitotic catastrophe and that tumor cells are more susceptible to mitotic abnormalities than normal cells41. These examples evince that our findings are consistent with prior studies. Interestingly, we also divulge novel discoveries that lay the groundwork for future MCRG studies in COAD.
The signature prognostic model stemming from our study significantly correlated with clinical traits, immune cells, TMB, cancer-related pathways, and drug sensitivity. To our knowledge, this is the first comprehensive analysis of the connection between MC, gene mutations, and the immune microenvironment in COAD. The growth of cancer is influenced by multiple factors and various genes. A composite multigene prognostic model will furnish an optimized risk score using regression methods. The ROC method demonstrated that risk scores have high sensitivity and specificity as prognostic factors. The nomogram also signifies that it is a critical independent prognostic risk factor among clinical variables. Our results showed that samples were adequately distributed into two independent subtypes and significantly linked with survival, with notable variances in the immune microenvironment regarding the proportion of some immune cells between the two subtypes, such as activated B cell, CD4+ T cell, MDSC, among others. Few studies have delved into the correlation between MCRG and immunotherapy. Nevertheless, several prognostic models have been scrutinized concerning the immune microenvironment. For instance, SERPINE1 is linked with the reconstruction of the tumor microenvironment and infiltration of immune cells in the progression of colon cancer42. Moreover, LIMK1 is also related to multiple tumor-infiltrating immune cells in CRC, notably CD4+ T cells and macrophage39.
Additionally, the cancer-associated genomes between high- and low-risk scoring groups are profoundly involved in cellular processes, furnishing insights into MCRG-linked mechanistic alterations in COAD. The GO- and KEGG-enriched 5-gene marker pathway was substantially associated with the development and progression of colon cancer, proposing that this marker could be utilized as a prognostic marker for clinical diagnosis. Our study showed high mutations in the high-risk group and poor prognosis in patients with high tumor mutation burden, especially in patients with high risk scores, suggesting crosstalk between mutations and MCRG in COAD. Mitotic catastrophes are entangled in the antitumor effects of various chemotherapeutic agents, including microtubule modulators, CHK1 inhibitors, PARPs inhibitors, WEE1 inhibitors, PLKs inhibitors, among others. We confirmed the correlation between CMCRG risk profile and chemotherapeutic agents. Mitotic catastrophe is a popular target for the development of novel anticancer drugs, particularly considering its avoidance for tumor resistance. On the one hand, tumor cells typically have an abnormal genome number, making them particularly susceptible to mitotic catastrophe-inducing drugs. On the other hand, some currently available chemotherapy regimens that induce apoptosis have been discovered to be effective in triggering mitotic catastrophe at lower doses.
Conclusion
In conclusion, our study revealed a 5-gene signature associated with the prognosis of colon cancer patients that can serve as a potentially reliable prognostic biomarker and therapeutic target for COAD patients with different clinicopathological features, and potentially provide a basis for more precise application of relevant drugs.
Supplementary Information
Acknowledgements
Not applicable.
Author contributions
Conceptualization, Y.L. and Y.Z.; Formal analysis, S.H. and L.H.; Investigation, Y.L. and R.S.; Methodology, S.Z.; Project administration, H.C.; Software, Y.L. and Y.Z.; Supervision, H.C.; Validation, H.C.; Visualization, all authors; Writing—original draft, Y.L.; Writing—review and editing, Y.Z. and H.C.
Funding
The present study was supported by Scientific research project of Jiangsu Provincial Health Commission (Z2021078) and the Project of Health Committee of Nantong (MS2023056 and QNZ2023055).
Data availability
Publicly available datasets were analyzed in this study. These data can be found here: all relevant raw data used in the study can be accessed from TCGA (https://portal.gdc.cancer.gov/repository) and GENCARDS (https://www.genecards.org/).
Competing interests
The authors declare no competing interests.
Footnotes
The original online version of this Article was revised: In the original version of this Article, Affiliations were not listed in the correct order. Full information regarding the corrections made can be found in the correction for this Article.
Publisher's note
Springer Nature remains neutral with regard to jurisdictional claims in published maps and institutional affiliations.
These authors contributed equally: Yinglei Liu, Yamin Zhao and Siming Zhang.
Change history
2/27/2024
A Correction to this paper has been published: 10.1038/s41598-024-54131-8
Contributor Information
Xingdan Wang, Email: wangxingdan1017@163.com.
Hongjian Chen, Email: chenhongjian2011@163.com.
Supplementary Information
The online version contains supplementary material available at 10.1038/s41598-024-51918-7.
References
- 1.Siegel R, et al. Cancer statistics, 2022. CA: Cancer J. Clin. 2022;72(1):7–33. doi: 10.3322/caac.21708. [DOI] [PubMed] [Google Scholar]
- 2.Ferlay J, et al. Estimating the global cancer incidence and mortality in 2018: GLOBOCAN sources and methods. Int. J. Cancer. 2019;144(8):1941–1953. doi: 10.1002/ijc.31937. [DOI] [PubMed] [Google Scholar]
- 3.Sung H, et al. Global cancer statistics 2020: GLOBOCAN estimates of incidence and mortality worldwide for 36 cancers in 185 countries. CA: Cancer J. Clin. 2021;71(3):209–249. doi: 10.3322/caac.21660. [DOI] [PubMed] [Google Scholar]
- 4.Dekker E, et al. Colorectal cancer. Lancet (London, England) 2019;394(10207):1467–1480. doi: 10.1016/s0140-6736(19)32319-0. [DOI] [PubMed] [Google Scholar]
- 5.Siegel RL, et al. Cancer statistics, 2022. CA Cancer J. Clin. 2022;72(1):7–33. doi: 10.3322/caac.21708. [DOI] [PubMed] [Google Scholar]
- 6.Ma S, et al. RCN3 expression indicates prognosis in colorectal cancers. Oncologie. 2022;24(4):823–833. doi: 10.32604/oncologie.2022.025411. [DOI] [Google Scholar]
- 7.Liu A, et al. Forkhead Box P4 promotes the proliferation of cells in colorectal adenocarcinoma. Oncologie. 2023;25(5):543–552. doi: 10.1515/oncologie-2023-0009. [DOI] [Google Scholar]
- 8.Chen L, et al. Expression of eIF6 and its relationship with cell proliferation in colorectal adenocarcinoma. Oncologie. 2023;25(4):395–402. doi: 10.1515/oncologie-2023-0007. [DOI] [Google Scholar]
- 9.Mc Gee MM. Targeting the mitotic catastrophe signaling pathway in cancer. Med. Inflamm. 2015;2015:146282. doi: 10.1155/2015/146282. [DOI] [PMC free article] [PubMed] [Google Scholar]
- 10.Vitale I, et al. Mitotic catastrophe: A mechanism for avoiding genomic instability. Nat. Rev. Mol. Cell Biol. 2011;12(6):385–392. doi: 10.1038/nrm3115. [DOI] [PubMed] [Google Scholar]
- 11.Denisenko TV, et al. Mitotic catastrophe and cancer drug resistance: A link that must to be broken. Drug Resist. Updat. 2016;24:1–12. doi: 10.1016/j.drup.2015.11.002. [DOI] [PubMed] [Google Scholar]
- 12.Wang X, et al. An antimitotic and antivascular agent BPR0L075 overcomes multidrug resistance and induces mitotic catastrophe in paclitaxel-resistant ovarian cancer cells. PLoS One. 2013;8(6):e65686. doi: 10.1371/journal.pone.0065686. [DOI] [PMC free article] [PubMed] [Google Scholar]
- 13.Jung M, et al. In vitro induction of mitotic catastrophe as a therapeutic approach for oral cancer using the ethanolic extract of Juniperus squamata. Oncol. Rep. 2021 doi: 10.3892/or.2021.8054. [DOI] [PubMed] [Google Scholar]
- 14.Yoon YN, et al. MASTL inhibition promotes mitotic catastrophe through PP2A activation to inhibit cancer growth and radioresistance in breast cancer cells. BMC Cancer. 2018;18(1):716. doi: 10.1186/s12885-018-4600-6. [DOI] [PMC free article] [PubMed] [Google Scholar]
- 15.Schecher S, et al. Cyclin K dependent regulation of Aurora B affects apoptosis and proliferation by induction of mitotic catastrophe in prostate cancer. Int. J. Cancer. 2017;141(8):1643–1653. doi: 10.1002/ijc.30864. [DOI] [PubMed] [Google Scholar]
- 16.Ritchie ME, et al. limma powers differential expression analyses for RNA-sequencing and microarray studies. Nucleic Acids Res. 2015;43(7):e47. doi: 10.1093/nar/gkv007. [DOI] [PMC free article] [PubMed] [Google Scholar]
- 17.Therneau TM, Lumley T. Package ‘survival’. R Top Doc. 2015;128(10):28–33. [Google Scholar]
- 18.Stuart T, et al. Comprehensive integration of single-cell data. Cell. 2019;177(7):1888–1902.e21. doi: 10.1016/j.cell.2019.05.031. [DOI] [PMC free article] [PubMed] [Google Scholar]
- 19.Hänzelmann S, Castelo R, Guinney J. GSVA: gene set variation analysis for microarray and RNA-seq data. BMC Bioinform. 2013;14:7. doi: 10.1186/1471-2105-14-7. [DOI] [PMC free article] [PubMed] [Google Scholar]
- 20.Harris MA, et al. The gene ontology (GO) database and informatics resource. Nucleic Acids Res. 2004;32(Database issue):D258-61. doi: 10.1093/nar/gkh036. [DOI] [PMC free article] [PubMed] [Google Scholar]
- 21.Laboratories, K. KGML (KEGG Markup Language). https://www.kegg.jp/kegg/xml
- 22.Kanehisa M, Goto S. KEGG: Kyoto encyclopedia of genes and genomes. Nucleic Acids Res. 2000;28(1):27–30. doi: 10.1093/nar/28.1.27. [DOI] [PMC free article] [PubMed] [Google Scholar]
- 23.Wu T, et al. clusterProfiler 4.0: A universal enrichment tool for interpreting omics data. Innovation (Cambridge (Mass.)) 2021;2(3):100141. doi: 10.1016/j.xinn.2021.100141. [DOI] [PMC free article] [PubMed] [Google Scholar]
- 24.Chen H, et al. Identification of a pyroptosis-related prognostic signature in breast cancer. BMC Cancer. 2022;22(1):429. doi: 10.1186/s12885-022-09526-z. [DOI] [PMC free article] [PubMed] [Google Scholar]
- 25.Nakatsuka E, et al. Plasminogen activator inhibitor-1 is an independent prognostic factor of ovarian cancer and IMD-4482, a novel plasminogen activator inhibitor-1 inhibitor, inhibits ovarian cancer peritoneal dissemination. Oncotarget. 2017;8(52):89887–89902. doi: 10.18632/oncotarget.20834. [DOI] [PMC free article] [PubMed] [Google Scholar]
- 26.Zhou L, et al. Constructing a new prognostic signature of gastric cancer based on multiple data sets. Bioengineered. 2021;12(1):2820–2835. doi: 10.1080/21655979.2021.1940030. [DOI] [PMC free article] [PubMed] [Google Scholar]
- 27.Drápela S, et al. The CHK1 inhibitor MU380 significantly increases the sensitivity of human docetaxel-resistant prostate cancer cells to gemcitabine through the induction of mitotic catastrophe. Mol. Oncol. 2020;14(10):2487–2503. doi: 10.1002/1878-0261.12756. [DOI] [PMC free article] [PubMed] [Google Scholar]
- 28.Zhang L, et al. MCDB: A comprehensive curated mitotic catastrophe database for retrieval, protein sequence alignment, and target prediction. Acta Pharm. Sinica. B. 2021;11(10):3092–3104. doi: 10.1016/j.apsb.2021.05.032. [DOI] [PMC free article] [PubMed] [Google Scholar]
- 29.Izdebska M, Gagat M, Grzanka A. Overexpression of lamin B1 induces mitotic catastrophe in colon cancer LoVo cells and is associated with worse clinical outcomes. Int. J. Oncol. 2018;52(1):89–102. doi: 10.3892/ijo.2017.4182. [DOI] [PMC free article] [PubMed] [Google Scholar]
- 30.Bo T, et al. Mitochondrial fission promotes radiation-induced increase in intracellular Ca level leading to mitotic catastrophe in mouse breast cancer EMT6 cells. Biochem. Biophys. Res. Commun. 2020;522(1):144–150. doi: 10.1016/j.bbrc.2019.11.027. [DOI] [PubMed] [Google Scholar]
- 31.Ye Z, et al. Bioinformatics analysis reveals an association between cancer cell stemness, gene mutations, and the immune microenvironment in stomach adenocarcinoma. Front. Genet. 2020;11:595477. doi: 10.3389/fgene.2020.595477. [DOI] [PMC free article] [PubMed] [Google Scholar]
- 32.Zeng C, Chen Y. HTR1D, TIMP1, SERPINE1, MMP3 and CNR2 affect the survival of patients with colon adenocarcinoma. Oncol. Lett. 2019;18(3):2448–2454. doi: 10.3892/ol.2019.10545. [DOI] [PMC free article] [PubMed] [Google Scholar]
- 33.Li L, et al. FN1, SPARC, and SERPINE1 are highly expressed and significantly related to a poor prognosis of gastric adenocarcinoma revealed by microarray and bioinformatics. Sci. Rep. 2019;9(1):7827. doi: 10.1038/s41598-019-43924-x. [DOI] [PMC free article] [PubMed] [Google Scholar]
- 34.Chen S, et al. SERPINE1 overexpression promotes malignant progression and poor prognosis of gastric cancer. J. Oncol. 2022;2022:2647825. doi: 10.1155/2022/2647825. [DOI] [PMC free article] [PubMed] [Google Scholar]
- 35.Jevrić M, et al. Association of uPA and PAI-1 tumor levels and 4G/5G variants of PAI-1 gene with disease outcome in luminal HER2-negative node-negative breast cancer patients treated with adjuvant endocrine therapy. BMC Cancer. 2019;19(1):71. doi: 10.1186/s12885-018-5255-z. [DOI] [PMC free article] [PubMed] [Google Scholar]
- 36.Xue W, et al. Establishment and analysis of an individualized EMT-related gene signature for the prognosis of breast cancer in female patients. Dis. Mark. 2022;2022:1289445. doi: 10.1155/2022/1289445. [DOI] [PMC free article] [PubMed] [Google Scholar]
- 37.Kang X, et al. LIMK1 promotes peritoneal metastasis of gastric cancer and is a therapeutic target. Oncogene. 2021;40(19):3422–3433. doi: 10.1038/s41388-021-01656-1. [DOI] [PMC free article] [PubMed] [Google Scholar]
- 38.Huang J, et al. Up-regulation of LIMK1 expression in prostate cancer is correlated with poor pathological features, lymph node metastases and biochemical recurrence. J. Cell. Mol. Med. 2020;24(8):4698–4706. doi: 10.1111/jcmm.15138. [DOI] [PMC free article] [PubMed] [Google Scholar]
- 39.Liu X, et al. LIMK1: A promising prognostic and immune infiltration indicator in colorectal cancer. Oncol. Lett. 2022;24(1):234. doi: 10.3892/ol.2022.13354. [DOI] [PMC free article] [PubMed] [Google Scholar]
- 40.Nickoloff J, et al. Metnase and EEPD1: DNA repair functions and potential targets in cancer therapy. Front. Oncol. 2022;12:808757. doi: 10.3389/fonc.2022.808757. [DOI] [PMC free article] [PubMed] [Google Scholar]
- 41.Sazonova E, et al. A link between mitotic defects and mitotic catastrophe: Detection and cell fate. Biol. Direct. 2021;16(1):25. doi: 10.1186/s13062-021-00313-7. [DOI] [PMC free article] [PubMed] [Google Scholar]
- 42.Wang S, et al. SERPINE1 associated with remodeling of the tumor microenvironment in colon cancer progression: A novel therapeutic target. BMC Cancer. 2021;21(1):767. doi: 10.1186/s12885-021-08536-7. [DOI] [PMC free article] [PubMed] [Google Scholar]
- 43.Yoshihara K, et al. Inferring tumour purity and stromal and immune cell admixture from expression data. Nat. Commun. 2013;4:2612. doi: 10.1038/ncomms3612. [DOI] [PMC free article] [PubMed] [Google Scholar]
Associated Data
This section collects any data citations, data availability statements, or supplementary materials included in this article.
Supplementary Materials
Data Availability Statement
Publicly available datasets were analyzed in this study. These data can be found here: all relevant raw data used in the study can be accessed from TCGA (https://portal.gdc.cancer.gov/repository) and GENCARDS (https://www.genecards.org/).


