

Abstract
This paper describes a method for the real-time counting and extraction of DNA molecules at the single-molecule level by nanopore technology. As a powerful tool for electrochemical single-molecule detection, nanopore technology eliminates the need for labeling or partitioning sample solutions at the femtoliter level. Here, we attempt to develop a DNA filtering system utilizing an α-hemolysin (αHL) nanopore. This system comprises two droplets, one filling with and one emptying DNA molecules, separated by a planar lipid bilayer containing αHL nanopores. The translocation of DNA through the nanopores is observed by measuring the channel current, and the number of translocated molecules can also be verified by quantitative polymerase chain reaction (qPCR). However, we found that the issue of contamination seems to be an almost insolvable problem in single-molecule counting. To tackle this problem, we tried to optimize the experimental environment, reduce the volume of solution containing the target molecule, and use the PCR clamp method. Although further efforts are still needed to achieve a single-molecule filter with electrical counting, our proposed method shows a linear relationship between the electrical counting and qPCR estimation of the number of DNA molecules.
Introduction
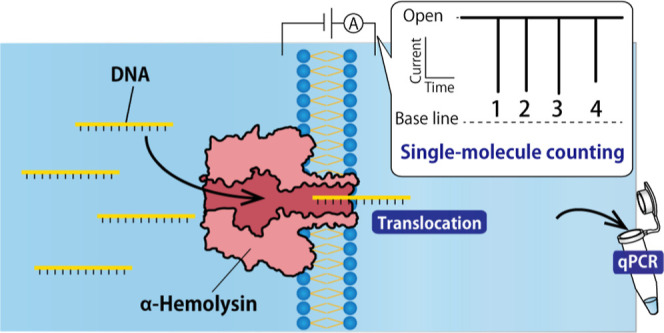
The use of nanopore technology as a powerful tool for electrochemical single-molecule detection at the femtoliter level without the need for labeling or partitioning sample solutions has been well established.1−3 The basic configuration for nanopore measurements involves connecting two separated electrolytes through a nanopore, with an ion current generated by applying a voltage (Figure 1). The migration of analytes through the pore subsequently produces a characteristic ion current blockage, which can be utilized to identify the analyte through electrical means. The inner diameter of biological nanopores typically ranges from sub-nanometer to several nanometers.4−8 α-Hemolysin (αHL), a toxin produced by Staphylococcus aureus, has been widely utilized to detect single-stranded nucleic acid molecules since its initial reported use by Kasianowicz et al. in 1996, due to its ability to reproducibly form rigid nanopores with diameters of around 1.4 nm.9 Researchers in the field of nanopore technology have been particularly focused on the application of nanopores for DNA sequencing,10−14 with a DNA sequencer becoming commercially available in 2015 and being updated with the use of the Escherichia coli transport channel CsgG15 in 2016.
Figure 1.
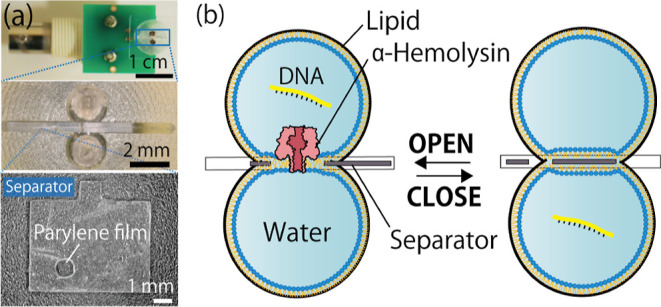
(a) Photograph of the microdevice used for lipid bilayer preparation. Two chambers are separated by a separator with a parylene film. (b) Illustration of the droplet contact method and collection of single molecules of DNA. Immediately after a single molecule of DNA passes through the αHL pore in the lipid bilayer, the separator is slid across to intercept the bilayer.
In previous research, we have applied αHL nanopores in the context of DNA computing technology,16−21 utilizing them in the decoding of oligonucleotides. DNA computing involves the performance of logical operations or arithmetic calculations using DNA molecules.22−26 To accomplish this, we prepared water-in-oil droplets27−30 for each of the input DNA, computational DNA, and output DNA and used αHL nanopores to translocate the DNA molecules between the droplets.18 Specifically, the input DNA in the input droplet moves into the computational droplet, and the output DNA in the computational droplet moves into the output droplet, molecule by molecule, through the pore. In the case of single-molecule detection using nanopore technology, the target molecules are counted in real-time as they pass through the pore and are quantified according to the number of passing molecules per unit time.16,31 Our previous research using nanopore experiments has led us to consider the nanopore system as a valuable tool for counting and collecting single molecules in real time. In this study, we utilized a nanopore system with the αHL nanopore as a molecular filtering device. The αHL nanopore was reconstituted in a lipid bilayer that separated the measurement solution into two compartments, and single-stranded DNA (ssDNA) was passed through the pore, moving from the sample droplet (cis-side compartment) to the collecting droplet (trans-side compartment). The translocation of ssDNA could be monitored through pulsed blockage signals, with the number of signals corresponding to the number of translocated ssDNA molecules. This device has the potential to allow for real-time counting of a specific number of molecules and the simultaneous extraction of a specific number of molecules by collecting the droplet on the trans side. To evaluate the reliability of the nanopore filter system, the number of ssDNA molecules in the collected solution was verified through a quantitative polymerase chain reaction (qPCR) assay.
Experimental Section
Reagents and Chemicals
In this study, we used the following reagents: 1,2-diphytanoyl-sn-glycero-3-phosphocholine (DPhPC; Avanti. Polar Lipids, AL, USA); 1,2-dioleoyl-sn-glycero-3-phospho-rac-(1-glycerol) (DOPG; Avanti. Polar Lipids); n-decane (Wako Pure Chemical Industries, Osaka, Japan); 3-morpholinopropane-1-sulfonic acid (MOPS; Nacalai Tesque, Kyoto, Japan); potassium chloride (KCl; Nacalai Tesque), sodium chloride (NaCl; Nacalai Tesque), ammonium chloride (NH4Cl; Wako Pure Chemical Industries), lithium chloride (LiCl; Nacalai Tesque), calcium chloride (CaCl2; Nacalai Tesque), magnesium chloride (MgCl2; Nacalai Tesque), and streptavidin (Wako Pure Chemical Industries). Buffered electrolyte solutions were prepared using ultrapure water (MilliQ; Merck Millopore, Burlington, MA, USA). Wild-type αHL (Sigma-Aldrich, St. Louis, MO, USA, and List Biological Laboratories, Campbell, CA, USA) was obtained as a monomeric polypeptide, isolated from S. aureus. For use, samples were diluted to the designated concentration using a buffered electrolyte solution and stored at 4 °C. High-performance liquid chromatography-grade DNA oligonucleotides and peptide nucleic acid (PNA) were synthesized by Eurofins Genomics (Tokyo, Japan) and PANAGEN (Daejeon, South Korea), respectively, and stored at −20 °C. TBE buffer (10×) was obtained from Takara Bio (Shiga, Japan) and was diluted 10-fold for gel electrophoresis. TB Green Premix Ex Taq II (Takara Bio) and KOD SYBR qPCR Mix (TOYOBO, Osaka, Japan) were used for the real-time polymerase chain reaction (real-time PCR).
Planar Bilayer Membranes for Nanopore Filter Experiments Prepared with the Droplet Contact Method Using a Microdevice
As shown in our previous reports,4,17,32 we prepared planar bilayer membranes (pBLMs) by the droplet contact method using a microdevice in which an infinity symbol-shaped micro chamber is separated into two micro chambers by a 5 μm thick parylene film with a single hole of 100 μm diameter (Figure 1). For electrical measurements of nanopores, Ag/AgCl electrodes were prepared at the bottom of each chamber. We basically used a brand new device for each experiment.
pBLM formation using this device was performed with the following procedure. First, 10 mg/mL DPhPC solution (in n-decane) (0.9 μL) was poured into both chambers. Next, the buffer solution (4.7 μL) with 100 nM αHL was added into one of the chambers which was connected to the ground terminal. Then, the buffer solution (4.7 μL) with 160 nM target DNA was added into the other chamber. A few minutes after adding the buffer solution, the pBLM spontaneously formed by contacting two lipid monolayers.
Contact Bubble Bilayer Method Using Glass Pipettes
The contact bubble bilayer (CBB) method33,34 was performed under an inverted microscope (IX71; Olympus, Tokyo, Japan), and images were recorded using a digital camera (MS-200; Bio Craft, Tokyo, Japan). Glass pipettes for bubble formation and perfusion inside the bubble were fabricated by pulling a borosilicate glass capillary (BF100-50-10; OD/ID; 1.0/0.5 mm, Sutter Instrument, Novato, CA) with a micropipette puller (PC-100; Narishige, Tokyo, Japan). Then, the tips of the pipettes were cut to obtain a tip diameter of around 30 μm and lightly polished using a micro-forge (MF-900; Narishige). First, 10 mg/mL DPhPC solution (in n-decane) (100 μL) was put on a slide glass. Next, two glass pipettes, one filled with the buffer solution with 100 nM αHL and the other filled with the buffer solution containing 100 nM target DNA were immersed into the DPhPC solution. Then, two water bubbles were formed from the pipettes by applying pressure inside the pipettes. Finally, the pBLM was formed by manipulating the pipettes so the two water bubbles came into contact. The pipette position was controlled by micromanipulators (UM-3C; Narishige) under the microscope. The pressure in the pipette was regulated by a micro injector (IM-9B; Narishige). Ag/AgCl electrodes were placed in both glass pipettes. The ionic current was measured by applying a transmembrane potential of +180 mV.
Nanopore Filter Experiments
We prepared 30 pM PNA, 10 pM target DNA, 100 nM αHL, [0.1 M NH4Cl solution with 1 mM MOPS at pH 7.0], and [1 M NH4Cl solution with 10 mM MOPS at pH 7.0] for the nanopore filter experiments. After forming pBLMs, αHL nanopores were spontaneously reconstituted into the pBLM, and this nanopore-integrated pBLM acted as a nanopore filter by translocating DNA. The reconstitution of nanopores and the translocation of DNA were confirmed by measuring the ionic current. When αHL nanopores were reconstituted into the pBLMs, step-like increases in current were obtained. Then, blockage signals were observed when DNA translocated through the nanopores. We counted signals with a blocking ratio of over 95% as the target DNA signals in experiments without PNA. With PNA, we identified signals with a blocking ratio more than around 70% as target signals. After confirming the translocation of DNA, the solution in which DNA flowed was collected. We added 0.5 μL of lipid/oil to the cis-side chamber, and gently collected a droplet in the trans-side chamber using a gel loading tip with a 0.3 mm tip diameter (Thermo Fisher Scientific, Waltham, MA, USA). To check that the membrane was not ruptured, a voltage of −180 mV was maintained throughout the collection experiments.
Real-Time PCR for Identifying the Number of DNA Molecules Collected in the Nanopore Filter Experiments
The number of DNA molecules in the collected solution was confirmed by a real-time PCR assay. In this study, we performed SYBR Green real-time PCR with two different reaction volumes (25 and 50 μL), and the chemical components of each reaction solution were as below. The 25 μL reaction solution contained 12.5 μL of TB Green Premix Ex Taq II, target DNA (nanopore filtered or specific concentration), 0.4 μM primers, 94 mM KCl, and 0.94 mM MOPS (pH 7.0). The 50 μL reaction solution contained 25 μL of KOD SYBR qPCR Mix, DNA (nanopore filtered or specific concentration), 0.2 μM primers, 94 mM NH4Cl, and 0.94 mM MOPS (pH 7.0). Thermal Cycler Dice Real Time System Lite (Takara Bio) was used for all real-time PCR tests. The DNA amplification cycles for each reaction volume were performed by the following protocols: 40 cycles at 95 °C (5 s) and 60 °C (30 s) for the use of the 25 μL reaction solution (TB Green Premix Ex Taq II) and cycles at 98 °C (10 s), 57 °C (20 s), and 68 °C (30 s) for the use of the 50 μL reaction solution (KOD SYBR qPCR Mix). Real-time PCR data were obtained after the reaction, and the crossing point (CP) was calculated by the Thermal Cycler Dice system software. For generation of standard quantitation curves using 10 to 105 copies of the target DNA, the Ct values were plotted proportionally to the logarithm of the input copy number. Negative controls were included in each run.
Polyacrylamide Gel Electrophoresis for Analysis of PCR Products
Amplification products of real-time PCR were analyzed by denaturing polyacrylamide gel electrophoresis (PAGE, containing 19/1 acrylamide/bis (w/w)) on 8% gels in 1× TBE buffer (89 mM Tris-borate, 2 mM ethylenediaminetetraacetic acid, pH 8.3) at a constant power of 7.5 W for 30 min at room temperature. After electrophoresis, the gel was stained with diluted SYBR Green II solution (Takara Bio) for 30 min. Then, the images were obtained using an LED trans illuminator (Bio Craft).
PCR Clamp Using PNA Molecules
A duplex of PNA (5′TGATTCTCAGCCCTTCGC3′) and the target DNA were prepared by mixing them at a specific concentration ratio, followed by annealing in a 95 °C heat block for 5 min and annealing to room temperature over 20 h. SYBR Green real-time PCR amplifications were performed with the 50 μL reaction solution including 25 μL KOD SYBR qPCR Mix, the PNA-DNA duplexes (nanopore filtered or specific concentration), 0.2 μM primers, 94 mM NH4Cl, and 0.94 mM MOPS (pH 7.0). The DNA amplification protocol of 45 cycles at 94 °C (0 s), 70 °C (5 s), 57 °C (5 s), and 65 °C (10 s) was conducted with the real-time PCR equipment.
Measurement of PNA Concentration to Check PNA Adsorption on the Surface of Microtubes and Pipet Tips
The PNA concentrations were measured using a UV–vis spectroscopy microvolume spectrophotometer (Nanodrop; Thermo Fisher Scientific).
Channel Current Measurements and Data Analysis
Channel currents were monitored using a patch-clamp amplifier (PICO2; Tecella, Foothill Ranch, CA, USA) with a 7.9 kHz low-pass filter at a sampling frequency of 40 kHz. These settings were carefully chosen to enable the detection of DNA translocations in the experiments.35,36 Constant transmembrane potentials of +180 and +150 mV were applied to the cis-side droplet in the case of DNA and PNA-DNA duplex measurements, respectively. When αHL nanopores were reconstituted into the pBLMs, current increases were observed due to ion passage through the nanopores. Current blockages were also observed when DNA molecules translocated through the nanopores. Analysis of channel current signals was performed using Clampfit software ver. 10.7 (Molecular Devices, CA, USA).
Results and Discussion
Separation of DNA by Nanopore Filters and Quantification with qPCR
Single DNA molecules were translocated through the αHL nanopore in the droplet contact device (Figure 1). To facilitate the subsequent PCR reaction, a droplet solution containing electrolytes and buffer (typically 1 M KCl, 10 mM MOPS, pH 7.0) was collected, with dilution by 1/2 in the PCR solution. We first attempted to create calibration curves of the target DNA under these solution conditions. The target DNA and PCR primers were selected from a random sequence using Primer3Plus (https://primer3plus.com/). We confirmed the formation of secondary structures and self-pairing of all primers using Primer3Plus. The design parameters of primers and target DNAs were determined as follows: the lengths of primers and target DNAs were 17 to 25 and 70 to 80 nt, respectively. The GC-content and Tm value were 40 to 60% and 60 to 65 °C, respectively. As a result, six different target DNA sequences were designed (Table S1). Then, we performed qPCR assays for all sequences. When using DNA #1, #2, #3, #4, #5, and #6 at low concentrations of less than 105 molecules, nonspecific amplification such as primer dimers was observed, and we did not obtain linear calibration curves. Even primers designed using mathematical models sometimes form nonspecific products in negative controls and require PCR optimization.37,38
As an initial trial, the nanopore filter experiment was performed using six different types of ssDNA, DNA #1–6, under conventional conditions for nanopore sensing. Clear blocking signals of ssDNA (160 nM) translocation events were observed for the buffer condition of 1 M KCl, 10 mM MOPS, pH 7.0. The result for DNA #2 serves as a typical example for all DNA #1–6. First, we pipetted out the solution in the trans-side chamber after observing 30 blockage signals (identified as the translocation of 30 target DNA molecules) (Figure 2a). Then, we quantified the copy number of the DNA in the solution by qPCR assays. As a result, we obtained amplification curves of DNA #2 comparable to a positive control experiment using 106 molecules of the DNA (Figure 2b). As the 30 molecules of DNA were detected to be more than 30,000 times the number of molecules, we concluded that the preparation of calibration curves and DNA contamination were significant issues in this experiment. In the following section, we aimed to solve these problems regarding (i) the difficulty in obtaining calibration curves in the low-concentration range and (ii) the lack of a negative control and contamination of the target DNA.
Figure 2.

(a) Schematic illustration of the nanopore filter experiments. After observing 30 blockage signals, the solution in the chamber connected to the recording terminal of a patch-clamp amplifier was collected. Then, the DNA was quantified by qPCR assay. (b) Amplification curves obtained from the filtered target DNA and 106 molecules of the target DNA by real-time PCR assay. Similar Ct values were obtained from these samples. (c) Amplification curves obtained from 102 molecules of the target DNA in different salt solutions. DNA amplification was observed only when using NH4Cl and MilliQ with the PCR solution. (d) Calibration curves of the Ct value versus the molecular number with 94 mM NH4Cl and MilliQ with the PCR solution. The Ct value can fit linearly with the natural logarithmic value of the DNA number. The literature value was referenced from N. Jothikumar et al., J. Virol. Methods, 2006.39
Problem (i): Optimization of Experimental Conditions for Generating the Calibration Curve in the qPCR Assay
To generate a calibration curve in the low-concentration range, we utilized a new DNA #7 as the target DNA instead of DNA #1 to #6. DNA #7 originated from hepatitis E virus genomes, and its calibration curve was previously obtained in the range of 10–106 molecules (Table S2 and Figure 2c).39 The length of the primers for DNA #7 was shorter than those for DNA #1 to #6, resulting in less complementarity between the primers, which inhibited the generation of primer dimers. However, 100 molecules of DNA #7 were not amplified when using a 94 mM KCl buffer that was transferred from the nanopore experiments, which required high electrolyte concentrations to ensure ion conductance. We therefore optimized the buffer conditions of the nanopore filter by changing the electrolytes. In general, the optimal experimental conditions for PCR experiments are known;40 generally, the pH in the PCR buffer is 8 to 9.5, and 1 to 4 mM Mg2+ is needed as a cofactor for polymerase. The optimal concentrations of Na+ (enhances primer annealing) and NH4+ (improves the specificity of primers) are 50 and 20 mM, respectively.
We then tested PCR experiments using six different electrolytes (KCl, NaCl, NH4Cl, LiCl2, CaCl2, and MgCl2) in the PCR solution. The salt concentration and number of DNA #7 were 94 mM and 100 molecules, respectively. We only obtained an amplification of the target DNA with use of the NH4Cl solution (Figure 2d). NH4+ ions compete with hydrogen bonds between DNA strands and destabilize weak hydrogen bonds between mismatched primer/template base pairs.40 Hybridization of the specific primer and target DNA was promoted by NH4+ ions, which enabled amplification from 100 target molecules. Although the Ct value using the NH4Cl solution was slightly higher than that using only the PCR solution, we decided to use NH4Cl as the electrolyte because electrolytes must be added to the solution to obtain ionic currents in the nanopore filter experiments. We prepared a calibration curve of the Ct value vs molecular number to calibrate the DNA number when using a 94 mM NH4Cl solution (Figure 2c). The Ct value versus the natural logarithmic value of the DNA number was linearly fit with a high correlation factor (R2) (mean R2 value of 0.97), with a gradient of −1.3. Moreover, we confirmed that the target DNA was amplified by qPCR experiments from the melting curve analysis and gel electrophoresis (Figure S1).
Problem (ii): Investigation of Contaminated Pathways and Implementation of Negative Control Experiments
Improvement of the Experimental Environment
Since DNA contamination was strongly suspected, we investigated the contamination pathways and attempted to reduce it. First, we investigated DNA contamination from the ambient atmosphere. To prevent contamination from the air, we improved the experimental environment as follows:
-
1.
Separation of the experimental space: We divided the operation area into a place to handle the template DNA (outside of a laminar flow cabinet) and a place to use other solutions (inside the laminar flow cabinet) to prevent contamination of the template DNA, as reported previously.41
-
2.
Consideration of experimental instruments: Since DNA solution and aerosol may enter the pipette,41 we utilized micropipette tips with a hydrophobic porous filter to handle the PCR solutions. Thus, the DNA solution and aerosol were blocked by the filter in the pipette tip, preventing contamination. In addition, we used segregated pipettes for handling the PCR solution and the template DNA.
-
3.
Decontamination of work-areas: Before using the laminar flow cabinet, exposure to ultraviolet (UV) light was carried out for 15 min to degrade DNA molecules in the cabinet. UV lights are classified into UV-A (wavelength: 315–400 nm), UV-B (wavelength: 280–315 nm), and UV-C (wavelength: under 280 nm) according to their wavelength. Since DNA absorbs wavelengths of light between 240 and 280 nm,42 we exposed the work area to UV light that includes UV-C. In addition, a decontamination reagent for DNA (PCR Clean; Minerva Biolabs Berlin, Germany) and sodium hypochlorite solution43 were sprayed on work areas before experiments. We evaluated the effect of these improvements by comparing the PCR results of the negative control, where the target DNA was not added, before and after these improvements. As a result, although a Ct value of 33.96 was obtained before these improvements, which indicates 21 DNA molecules were included in the solution, no amplification of DNA was observed after improving the experimental environment (Figure 3a). Thus, DNA contamination from the air was completely prevented by these improvements of the work area. The number of contaminated DNA molecules from the air (21 molecules) was much smaller than the result of the nanopore filter experiments (106 molecules). This result suggests that there is another pathway of contamination other than the air.
Figure 3.

(a) Amplification curves of the negative control before and after improvements. In the improved situation, there was no DNA amplification after 45 cycles. (b) DNA numbers obtained from controlled experiments. The DNA numbers increased with increasing concentration of DNA added to the droplet. (c) Amplification curves with and without an applied negative transmembrane potential (−180 mV) and negatively charged lipid in the oil. The Ct value were 14.0, 17.9, and 15.6 for the normal, −180 mV, and the negatively charged lipid conditions, respectively.
Prevention of ssDNA Permeation through the Lipid Bilayer Using a Negatively Charged Lipid Membrane
We next investigated DNA contamination during the nanopore filter experiments. To confirm DNA contamination during the experiment, we performed controlled experiments without nanopores as follows: we prepared only pBLMs with two droplets, one containing the target DNA with a concentration of 500 nM, 1 nM, 1 pM, 1 fM, or 0 M (droplet-A) and the other without the target DNA (droplet-B). We then sampled from droplet-B 10 min after the pBLM was formed. The pBLM formation was confirmed by measuring the membrane capacitance, which we monitored to ensure that pBLMs did not rupture during the experiments. The number of molecules in the collected droplet-B was evaluated by the qPCR assay. The number of DNA molecules in droplet-B increased with an increase in the DNA concentration added to droplet-A (Figure 3b). The DNA molecules were considered to be contaminants passed from another droplet through the oil/lipid mixture, in addition to those from the air (21 molecules mentioned above). We assume that there may be multiple pathways of contamination, with n-decane being one of the possibilities. To prevent DNA contamination through the oil/lipid solution, the types of phospholipids were investigated. DOPG, a negatively charged phospholipid, was used because electrostatic repulsion between DNA and DOPG was expected. DOPG and DPhPC (1:1, mol/mol) in n-decane were mixed to form the pBLM as a membrane of solely DOPG was not stable. As a result of the controlled experiment performed with 500 nM target DNA, contamination of 107 DNA molecules was still observed (Figure 3b). Moreover, the applied potential was inverted and applied as −180 mV to the collecting side (droplet-B) to prevent electrophoretic transport of DNA molecules; however, we did not observe a critical improvement in the DNA decontamination (Figure 3c). The DNA contaminations therefore could not be prevented by changing the phospholipids and the applied potential.
Problem (ii): Nanopore Filter Experiments Using the CBB Method
The results suggest that DNA contamination may originate from the lipid membrane and lipid/oil solution. The thin layer of a lipid membrane may constitute the primary pathway for contamination. To investigate this further, we employed the CBB method to form pBLMs (Figure 4a).33,34 This method involves the formation of pBLMs by bringing two water-in-oil emulsions, prepared by bubbling water into an oil/lipid mixture with glass micropipettes, into contact. The size of these emulsions is significantly smaller (approximately 50 μm in diameter) than the droplets used in the DCM (approximately 2000 μm in diameter, Figure 4b), leading to a reduction in the number of DNA molecules present in the droplets by a factor of several ten thousand. If 100 nM target DNA is used, the numbers of molecules in a droplet of the DCM method and in an emulsion of the CBB method are calculated to be roughly 3 × 10¹¹ and 4 × 10⁶ molecules, respectively. The contact area between the emulsions and the oil/lipid mixture was around 5 μm in diameter (with a contact area of about 2 × 10⁻⁵ mm2). In contrast, the DCM experiments employed a parylene hole with a 100 μm diameter to separate the two droplets and reduce the lipid membrane area (with a contact area of about 4 × 10⁻³ mm2). As a control experiment, the pBLM was formed by bringing two water-in-oil emulsions into contact, one with and one without the 100 nM target DNA. After 10 min, the water-in-oil emulsion was collected by aspiration and the DNA number was evaluated by qPCR assay. Unfortunately, even this method yielded 109 DNA molecules (Figure 4c). The reason for this contamination may be attributed to the dissolution of DNA molecules in the oil/lipid mixture during the preparation of the emulsions, as well as the collection of contaminated oil/lipid mixture during the collection of the emulsions.
Figure 4.
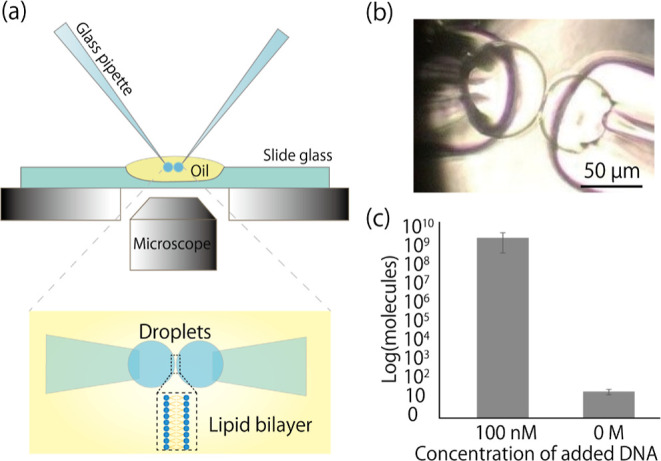
(a) Schematic illustration of the CBB system. A lipid bilayer is formed by the contact of two water droplets bubbled from glass pipettes on the microscope. (b) Microscopic image during pBLM formation by the CBB method. The diameters of the emulsion and the lipid bilayer were around 50 and 5 μm, respectively. (c) Control data of the nanopore filter experiments using the CBB method. One droplet contained 100 nM (1011 molecules) or 0 M target DNA. 10 min after forming pBLMs, another droplet was collected, and the number of the target DNA was quantified by qPCR assay.
Problem (ii): Nanopore Filter Applied with the PCR Clamp Method
After conducting several experiments, as previously discussed, it became apparent that it was difficult to eliminate DNA contamination at the single-molecule level via the oil/lipid mixture. We subsequently attempted to utilize a PCR clamp method44,45 for exclusion of DNA contamination (as depicted in Figure 5a).
Figure 5.

(a) Schematic illustration of the nanopore filter using PNA-DNA duplexes. Because the contaminated DNA is hydrolyzed with PNA, PCR amplification is inhibited. (b) Typical recorded channel current obtained by translocating PNA-DNA duplexes through the αHL nanopore. (c) Number of DNA molecules obtained from controlled experiments with and without 3 nM PNA. (d) Amplification curves and the quantitated DNA numbers for the nanopore-filtered DNA solution and the control experiment with 10 pM DNA and 30 pM PNA. The R2 value is 0.9.
The mechanism is as follows: the PNA probe (5′-TGATTCTCAGCCCTTCGC-3′) (as depicted in Figure S2), which possesses positive charges and a complementary sequence to the center of the target DNA, is hybridized with the target DNA. As the PNA-DNA duplexes translocate through the nanopore, they unzip46,47 and the target DNA moves to another droplet. In contrast, the PNA-DNA duplex structure is maintained when PNA-DNA duplexes are contaminated in the oil/lipid mixture. While the translocated target DNA is amplified, the contaminated PNA-DNA duplexes are not amplified, thus inhibiting PCR and allowing for exclusion and disregard of DNA contamination. Prior to conducting experiments, we defined the clamping efficiency (ηc) as the inhibitory efficiency of PCR by the PNA-DNA duplex.
| 1 |
where ni and na are the number of initial PNA-DNA duplexes and amplified DNA, respectively. We prepared a solution in which PNA and DNA were mixed at a molar ratio of 1:1 and diluted the solution to contain between 10 and 105 PNA-DNA duplexes. We then performed qPCR assays and evaluated the amplified copy number (as listed in Table S3). Although the ηc was greater than 90% at high concentrations, the ηc at low concentrations was lower than at higher numbers of PNA-DNA duplexes. We subsequently determined that this decrease in efficiency may be attributed to PNA adsorption on the surface of microtubes and pipette tips during pipetting, as determined through UV–vis spectroscopy measurements of PNA concentration before and after dilution (Table S4). To address this issue, we altered the PNA/DNA concentration ratio to 3:1, 10:1, and 100:1 (mol/mol) and reevaluated the clamping efficiency. As a result, the clamping efficiency improved at every concentration ratio and reached saturation at a molar ratio greater than 3:1 (as summarized in Table S5).
We next confirmed that PNA-DNA duplexes could successfully translocate with unzipping through αHL nanopores, as evidenced by the observation of blockage signals indicating such translocation (as depicted in Figure 5b). It is important to note that PNA itself does not possess charged phosphate groups, and the electrophoretic force acting on PNA is significantly weaker than on DNA.48 Consequently, few PNA translocation signals would be expected in nanopore experiments. In order to investigate contamination through the oil/lipid mixture in the device, we performed a control experiment using only pBLM without nanopores. PNA (3 nM) and target DNA (1 nM) were added to droplet-A. After 10 min, the solution of droplet-B was collected, and the copy number of DNA analyzed via qPCR assay. The results indicated that DNA contamination was reduced by 99.98% in comparison to when PNA was not added (as depicted in Figure 5c). Despite this reduction, 105 contaminant molecules were still present even in these conditions. To further reduce the number of contaminated DNA molecules for single-molecule separation, we lowered the added DNA concentration from 1 nM to 10 pM, as this reduced contamination when testing the CBB method. Under these conditions, the amount of contaminated DNA was dramatically reduced; only four DNA molecules were obtained from the droplet, within an acceptable range for tolerance (as depicted in Figure 5d).
Building upon these results, we next sought to conduct the nanopore filter experiment. It is important to note that utilizing solutions with low DNA concentrations in nanopore experiments can result in a reduction of translocation frequency.31 To address this, we employed asymmetric salt conditions in the droplets to enhance the frequency of translocation. In the nanopore filter experiments, we counted the different number of blockage signals that corresponded to the translocation of 29, 46, and 89 DNA molecules and subsequently analyzed the droplet-B via qPCR. The results indicated that the DNA numbers obtained were 67, 184, and 222 from each experiment (as shown in Figure 5d) with a Tm value of 83.3 ± 0.10 °C, indicating the elimination of the amplification from other artifacts, and a correlation between the nanopore-filtered and quantitated DNA numbers was observed (as depicted in Figure 5d). It was found that the quantification of DNA numbers via qPCR yielded higher results than those obtained through nanopore filtration. This discrepancy may be attributed to the migration of unclamped DNA in droplet-A (calculated to be around 105 molecules, Table S5) to droplet-B by a number of factors, including lipid/oil, air, or the collection step. While the results obtained through qPCR and filtration were not entirely congruent, a correlation coefficient of 0.9 with a linear relationship was observed, and the difference in values was less than 50% in the region from 0 to 100 molecules (see Text S1).
Conducting the nanopore filter experiments necessitated the use of a brand new, uncontaminated device for each experiment to prevent contamination. Additionally, in order to count and collect the molecules that passed through the nanopore, we needed to (i) form a stable lipid bilayer within the device without rupturing it, (ii) reconstitute a single nanopore within the lipid bilayer, and (iii) collect the solution from the chamber without disrupting the integrity of the lipid bilayer. In this study, we performed a total of 68 nanopore filter experiments. Of these, 60 experiments (88%) resulted in membrane rupture or failure to form a stable bilayer, and 4 experiments (6%) resulted in the formation of a lipid bilayer but with the presence of more than one pore or no pore at all. Only in 4 experiments (6%) were we able to successfully collect the solution from the nanopore filter. The current challenges associated with conducting nanopore filter experiments thus highlight the need for technological advancements to make nanopores a viable filter system.
Conclusions
Biological nanopores have garnered significant attention as highly sensitive DNA and RNA sensors and have already been implemented as DNA sequencers.49−51 In this study, we focused on the single-molecule sensitivity of biological nanopore sensors and developed a biological nanopore filtering system capable of counting the number of filtered DNA molecules from the blockage signals. For the development of a nanopore filter system with single-molecule accuracy, it is essential to completely prevent DNA contamination. We here investigated two different pathways of DNA contamination: from the air and through the oil/lipid mixture. To prevent DNA contamination from the air, we implemented “area separation,” “improvement of experimental instrumentation,” and “decontamination of work areas” and were able to successfully reduce DNA contamination from the air. However, despite our efforts to reduce DNA contamination through the oil/lipid mixture by using negatively charged phospholipids, applying reversed transmembrane potentials, and forming pBLMs via the CBB method, DNA contamination was not significantly reduced. We then attempted to eliminate the contamination by utilizing PNA-DNA duplexes that were not amplified in a PCR assay. In this system, PNA-DNA duplexes are unzipped when passing through the nanopores, resulting in the filtered solution containing only single-stranded target DNA. In contrast, PNA-DNA duplexes contaminated through the oil/lipid mixture preserve their duplex structure. The PCR amplification of PNA-DNA duplexes is inhibited by the PCR clamp mechanism, thereby allowing only the filtered target DNAs to be amplified. Using this system, we observed a linear relationship between the number of counted molecules and the qPCR assay in the range of 0–100 molecules in the solution.
Acknowledgments
This research was partially supported by JSPS KAKENHI grant numbers 15H00803 (R.K.), 19H00901 (R.K.), 19K15418 (K.S.), 21H05229 (R.K.), and 22KJ1231 (N.T.) and the JST FOREST Program Grant Number JPMJFR2028 (K.S.).
Supporting Information Available
The Supporting Information is available free of charge at https://pubs.acs.org/doi/10.1021/acs.analchem.3c00573.
Results of melting curve analysis and gel electrophoresis of DNA #7, design of the PNA probe, sequence of DNAs, sequence of DNA #7 primers, clamp efficiency of PNA, PNA concentration before and after dilution, and comparison of nanopore filters and qPCR (PDF)
Author Contributions
A.T. and N.T. contributed equally to this work. R.K. conceived the original idea. T.A. performed all experiments, and T.A. and N.T. conducted the analyses. A.T., N.T., K.S., and R.K. wrote the entire manuscript. All authors have given approval to the final version of the manuscript.
The authors declare no competing financial interest.
Supplementary Material
References
- Tan C. S.; Fleming A. M.; Ren H.; Burrows C. J.; White H. S. γ-Hemolysin Nanopore Is Sensitive to Guanine-to-Inosine Substitutions in Double-Stranded DNA at the Single-Molecule Level. J. Am. Chem. Soc. 2018, 140, 14224–14234. 10.1021/jacs.8b08153. [DOI] [PMC free article] [PubMed] [Google Scholar]
- Shoji K.; Kawano R.; White R. J. Spatially Resolved Chemical Detection with a Nanoneedle-Probe-Supported Biological Nanopore. ACS Nano 2019, 13, 2606–2614. 10.1021/acsnano.8b09667. [DOI] [PubMed] [Google Scholar]
- Denuga S.; Whelan D. E.; O’Neill S. P.; Johnson R. P. Capture and analysis of double-stranded DNA with the α-hemolysin nanopore: Fundamentals and applications. Electrochem. Sci. Adv. 2022, 2, e2200001 10.1002/elsa.202200001. [DOI] [Google Scholar]
- Watanabe H.; Gubbiotti A.; Chinappi M.; Takai N.; Tanaka K.; Tsumoto K.; Kawano R. Analysis of pore formation and protein translocation using large biological nanopores. Anal. Chem. 2017, 89, 11269–11277. 10.1021/acs.analchem.7b01550. [DOI] [PubMed] [Google Scholar]
- Miyagi M.; Takiguchi S.; Hakamada K.; Yohda M.; Kawano R. Single polypeptide detection using a translocon EXP2 nanopore. Proteomics 2022, 22, e2100070 10.1002/pmic.202100070. [DOI] [PubMed] [Google Scholar]
- Mayer S. F.; Cao C.; Dal Peraro M. Biological nanopores for single-molecule sensing. iScience 2022, 25, 104145. 10.1016/j.isci.2022.104145. [DOI] [PMC free article] [PubMed] [Google Scholar]
- Zhang M.; Chen C.; Zhang Y. J.; Geng J. Biological nanopores for sensing applications. Proteins: Struct., Funct., Bioinf. 2022, 90, 1786–1799. 10.1002/prot.26308. [DOI] [PubMed] [Google Scholar]
- Cao C.; Long Y. T. Biological Nanopores: Confined Spaces for Electrochemical Single-Molecule Analysis. Acc. Chem. Res. 2018, 51, 331–341. 10.1021/acs.accounts.7b00143. [DOI] [PubMed] [Google Scholar]
- Kasianowicz J. J.; Brandin E.; Branton D.; Deamer D. W. Characterization of individual polynucleotide molecules using a membrane channel. Proc. Natl. Acad. Sci. U.S.A. 1996, 93, 13770–13773. 10.1073/pnas.93.24.13770. [DOI] [PMC free article] [PubMed] [Google Scholar]
- Stoddart D.; Franceschini L.; Heron A. J.; Bayley H.; Maglia G. DNA stretching and optimization of nucleobase recognition in enzymatic nanopore sequencing. Nanotechnology 2015, 26, 084002. 10.1088/0957-4484/26/8/084002. [DOI] [PMC free article] [PubMed] [Google Scholar]
- Stoddart D.; Heron A. J.; Klingelhoefer J.; Mikhailova E.; Maglia G.; Bayley H. Nucleobase Recognition in ssDNA at the Central Constriction of the alpha-Hemolysin Pore. Nano Lett. 2010, 10, 3633–3637. 10.1021/nl101955a. [DOI] [PMC free article] [PubMed] [Google Scholar]
- Stoddart D.; Heron A. J.; Mikhailova E.; Maglia G.; Bayley H. Single-nucleotide discrimination in immobilized DNA oligonucleotides with a biological nanopore. Proc. Natl. Acad. Sci. U.S.A. 2009, 106, 7702–7707. 10.1073/pnas.0901054106. [DOI] [PMC free article] [PubMed] [Google Scholar]
- Cherf G. M.; Lieberman K. R.; Rashid H.; Lam C. E.; Karplus K.; Akeson M. Automated forward and reverse ratcheting of DNA in a nanopore at 5-Å precision. Nat. Biotechnol. 2012, 30, 344–348. 10.1038/nbt.2147. [DOI] [PMC free article] [PubMed] [Google Scholar]
- Manrao E. A.; Derrington I. M.; Laszlo A. H.; Langford K. W.; Hopper M. K.; Gillgren N.; Pavlenok M.; Niederweis M.; Gundlach J. H. Reading DNA at single-nucleotide resolution with a mutant MspA nanopore and phi29 DNA polymerase. Nat. Biotechnol. 2012, 30, 349–353. 10.1038/nbt.2171. [DOI] [PMC free article] [PubMed] [Google Scholar]
- Goyal P.; Krasteva P. V.; Van Gerven N.; Gubellini F.; Van den Broeck I.; Troupiotis-Tsailaki A.; Jonckheere W.; Pehau-Arnaudet G.; Pinkner J. S.; Chapman M. R.; et al. Structural and mechanistic insights into the bacterial amyloid secretion channel CsgG. Nature 2014, 516, 250–253. 10.1038/nature13768. [DOI] [PMC free article] [PubMed] [Google Scholar]
- Hiratani M.; Ohara M.; Kawano R. Amplification and Quantification of an Antisense Oligonucleotide from Target microRNA Using Programmable DNA and a Biological Nanopore. Anal. Chem. 2017, 89, 2312–2317. 10.1021/acs.analchem.6b03830. [DOI] [PubMed] [Google Scholar]
- Yasuga H.; Kawano R.; Takinoue M.; Tsuji Y.; Osaki T.; Kamiya K.; Miki N.; Takeuchi S. Logic Gate Operation by DNA Translocation through Biological Nanopores. PLoS One 2016, 11, e0149667 10.1371/journal.pone.0149667. [DOI] [PMC free article] [PubMed] [Google Scholar]
- Yasuga H.; Inoue K.; Kawano R.; Takinoue M.; Osaki T.; Kamiya K.; Miki N.; Takeuchi S. Serial DNA relay in DNA logic gates by electrical fusion and mechanical splitting of droplets. PLoS One 2017, 12, e0180876 10.1371/journal.pone.0180876. [DOI] [PMC free article] [PubMed] [Google Scholar]
- Kawano R. Nanopore Decoding of Oligonucleotides in DNA Computing. Biotechnol. J. 2018, 13, 1800091. 10.1002/biot.201800091. [DOI] [PubMed] [Google Scholar]
- Hiratani M.; Kawano R. DNA logic operation with nanopore decoding to recognize microRNA patterns in small cell lung cancer. Anal. Chem. 2018, 90, 8531–8537. 10.1021/acs.analchem.8b01586. [DOI] [PubMed] [Google Scholar]
- Takeuchi N.; Hiratani M.; Kawano R. Pattern Recognition of microRNA Expression in Body Fluids Using Nanopore Decoding at Subfemtomolar Concentrations. JACS Au 2022, 2, 1829–1838. 10.1021/jacsau.2c00117. [DOI] [PMC free article] [PubMed] [Google Scholar]
- Adleman L. M. Molecular computation of solutions to combinatorial problems. Science 1994, 266, 1021–1024. 10.1126/science.7973651. [DOI] [PubMed] [Google Scholar]
- Benenson Y.; Paz-Elizur T.; Adar R.; Keinan E.; Livneh Z.; Shapiro E. Programmable and autonomous computing machine made of biomolecules. Nature 2001, 414, 430–434. 10.1038/35106533. [DOI] [PubMed] [Google Scholar]
- Chen Y. Q.; Song Y. Y.; Wu F.; Liu W. T.; Fu B. S.; Feng B. K.; Zhou X. A DNA logic gate based on strand displacement reaction and rolling circle amplification, responding to multiple low-abundance DNA fragment input signals, and its application in detecting miRNAs. Chem. Commun. 2015, 51, 6980–6983. 10.1039/c5cc01389e. [DOI] [PubMed] [Google Scholar]
- Benenson Y.; Gil B.; Ben-Dor U.; Adar R.; Shapiro E. An autonomous molecular computer for logical control of gene expression. Nature 2004, 429, 423–429. 10.1038/nature02551. [DOI] [PubMed] [Google Scholar]
- Park K. S.; Seo M. W.; Jung C.; Lee J. Y.; Park H. G. Simple and Universal Platform for Logic Gate Operations Based on Molecular Beacon Probes. Small 2012, 8, 2203–2212. 10.1002/smll.201102758. [DOI] [PubMed] [Google Scholar]
- Hwang W. L.; Holden M. A.; White S.; Bayley H. Electrical behavior of droplet interface bilayer networks: Experimental analysis and Modeling. J. Am. Chem. Soc. 2007, 129, 11854–11864. 10.1021/ja074071a. [DOI] [PubMed] [Google Scholar]
- Tsuji Y.; Kawano R.; Osaki T.; Kamiya K.; Miki N.; Takeuchi S. Droplet Split-and-Contact Method for High-Throughput Transmembrane Electrical Recording. Anal. Chem. 2013, 85, 10913–10919. 10.1021/ac402299z. [DOI] [PubMed] [Google Scholar]
- Heron A. J.; Thompson J. R.; Cronin B.; Bayley H.; Wallace M. I. Simultaneous Measurement of Ionic Current and Fluorescence from Single Protein Pores. J. Am. Chem. Soc. 2009, 131, 1652–1653. 10.1021/ja808128s. [DOI] [PubMed] [Google Scholar]
- Funakoshi K.; Suzuki H.; Takeuchi S. Lipid Bilayer Formation by Contacting Monolayers in a Microfluidic Device for Membrane Protein Analysis. Anal. Chem. 2006, 78, 8169–8174. 10.1021/ac0613479. [DOI] [PubMed] [Google Scholar]
- Zhang H. L.; Hiratani M.; Nagaoka K.; Kawano R. MicroRNA detection at femtomolar concentrations with isothermal amplification and a biological nanopore. Nanoscale 2017, 9, 16124–16127. 10.1039/c7nr04215a. [DOI] [PubMed] [Google Scholar]
- Ohara M.; Takinoue M.; Kawano R. Nanopore Logic Operation with DNA to RNA Transcription in a Droplet System. ACS Synth. Biol. 2017, 6, 1427–1432. 10.1021/acssynbio.7b00101. [DOI] [PubMed] [Google Scholar]
- Iwamoto M.; Oiki S. Contact Bubble Bilayers with Flush Drainage. Sci. Rep. 2015, 5, 9110. 10.1038/srep09110. [DOI] [PMC free article] [PubMed] [Google Scholar]
- Iwamoto M.; Oiki S. Membrane Perfusion of Hydrophobic Substances Around Channels Embedded in the Contact Bubble Bilayer. Sci. Rep. 2017, 7, 6857. 10.1038/s41598-017-07048-4. [DOI] [PMC free article] [PubMed] [Google Scholar]
- Meller A.; Nivon L.; Branton D. Voltage-driven DNA translocations through a nanopore. Phys. Rev. Lett. 2001, 86, 3435–3438. 10.1103/PhysRevLett.86.3435. [DOI] [PubMed] [Google Scholar]
- Mathe J.; Visram H.; Viasnoff V.; Rabin Y.; Meller A. Nanopore unzipping of individual DNA hairpin molecules. Biophys. J. 2004, 87, 3205–3212. 10.1529/biophysj.104.047274. [DOI] [PMC free article] [PubMed] [Google Scholar]
- Garafutdinov R. R.; Galimova A. A.; Sakhabutdinova A. R. The influence of quality of primers on the formation of primer dimers in PCR. Nucleosides, Nucleotides Nucleic Acids 2020, 39, 1251–1269. 10.1080/15257770.2020.1803354. [DOI] [PubMed] [Google Scholar]
- Garafutdinov R. R.; Galimova A. A.; Sakhabutdinova A. R. Polymerase chain reaction with nearby primers. Anal. Biochem. 2017, 518, 126–133. 10.1016/j.ab.2016.11.017. [DOI] [PubMed] [Google Scholar]
- Jothikumar N.; Cromeans T. L.; Robertson B. H.; Meng X. J.; Hill V. R. A broadly reactive one-step real-time RT-PCR assay for rapid and sensitive detection of hepatitis E virus. J. Virol. Methods 2006, 131, 65–71. 10.1016/j.jviromet.2005.07.004. [DOI] [PubMed] [Google Scholar]
- Elizabeth Van Pelt-Verkuil A. v. B.; Heys J. P.. Principles and Technical Aspects of PCR Amplification; Springer Science + Business Media B.V., 2018. [Google Scholar]
- Dieffenbach C. W.; Dveksler G. S. SETTING UP A PCR LABORATORY. Genome Res. 1993, 3, S2–S7. 10.1101/gr.3.2.S2. [DOI] [PubMed] [Google Scholar]
- Grskovic B.; Zrnec D.; Popovic M.; Petek M. J.; Primorac D.; Mrsic G. Effect of ultraviolet C radiation on biological samples. Croat. Med. J. 2013, 54, 263–271. 10.3325/cmj.2013.54.263. [DOI] [PMC free article] [PubMed] [Google Scholar]
- Hawkins C. L.; Davies M. J. Hypochlorite-induced damage to DNA, RNA, and polynucleotides: Formation of chloramines and nitrogen-centered radicals. Chem. Res. Toxicol. 2002, 15, 83–92. 10.1021/tx015548d. [DOI] [PubMed] [Google Scholar]
- Araki T.; Shimizu K.; Nakamura K.; Nakamura T.; Mitani Y.; Obayashi K.; Fujita Y.; Kakegawa S.; Miyamae Y.; Kaira K.; et al. Usefulness of Peptide Nucleic Acid (PNA)-Clamp Smart Amplification Process Version 2 (SmartAmp2) for Clinical Diagnosis of KRAS Codon12 Mutations in Lung Adenocarcinoma. J. Mol. Diagn. 2010, 12, 118–124. 10.2353/jmoldx.2010.090081. [DOI] [PMC free article] [PubMed] [Google Scholar]
- Chiou C. C.; Luo J. D.; Chen T. L. Single-tube reaction using peptide nucleic acid as both PCR clamp and sensor probe for the detection of rare mutations. Nat. Protoc. 2006, 1, 2604–2612. 10.1038/nprot.2006.428. [DOI] [PubMed] [Google Scholar]
- Perera R. T.; Fleming A. M.; Peterson A. M.; Heemstra J. M.; Burrows C. J.; White H. S. Unzipping of A-Form DNA-RNA, A-Form DNA-PNA, and B-Form DNA-DNA in the alpha-Hemolysin Nanopore. Biophys. J. 2016, 110, 306–314. 10.1016/j.bpj.2015.11.020. [DOI] [PMC free article] [PubMed] [Google Scholar]
- Ciuca A.; Asandei A.; Schiopu I.; Apetrei A.; Mereuta L.; Seo C. H.; Park Y.; Luchian T. Single-Molecule, Real-Time Dissecting of Peptide Nucleic Acid-DNA Duplexes with a Protein Nanopore Tweezer. Anal. Chem. 2018, 90, 7682–7690. 10.1021/acs.analchem.8b01568. [DOI] [PubMed] [Google Scholar]
- Dragomir I. S.; Bucataru I. C.; Schiopu I.; Luchian T. Unzipping Mechanism of Free and Polyarginine-Conjugated DNA-PNA Duplexes, Preconfined Inside the alpha-Hemolysin Nanopore. Anal. Chem. 2020, 92, 7800–7807. 10.1021/acs.analchem.0c00976. [DOI] [PubMed] [Google Scholar]
- Ju Y.; Pu M. J.; Sun K.; Song G. Q.; Geng J. Nanopore Electrochemistry for Pathogen Detection. Chem.—Asian J. 2022, 17, e202200774 10.1002/asia.202200774. [DOI] [PubMed] [Google Scholar]
- Sun K.; Liu Y.; Zhou X.; Yin C. L.; Zhang P. J.; Yang Q. Q.; Mao L. F.; Shentu X. P.; Yu X. P. Nanopore sequencing technology and its application in plant virus diagnostics. Front. Microbiol. 2022, 13, 939666. 10.3389/fmicb.2022.939666. [DOI] [PMC free article] [PubMed] [Google Scholar]
- Werner D.; Acharya K.; Blackburn A.; Zan R. X.; Plaimart J.; Allen B.; Mgana S. M.; Sabai S. M.; Halla F. F.; Massawa S. M.; et al. MinION Nanopore Sequencing Accelerates Progress towards Ubiquitous Genetics in Water Research. Water 2022, 14, 2491. 10.3390/w14162491. [DOI] [Google Scholar]
Associated Data
This section collects any data citations, data availability statements, or supplementary materials included in this article.