

Abstract
Background
Phenotypic frailty syndrome identifies older adults at greater risk for adverse health outcomes. Despite the critical role of mitochondria in maintaining cellular function, including energy production, the associations between muscle mitochondrial energetics and frailty have not been widely explored in a large, well-phenotyped, older population.
Methods
The Study of Muscle, Mobility and Aging (SOMMA) assessed muscle energetics in older adults (N = 879, mean age = 76.3 years, 59.2% women). 31Phosporous magnetic resonance spectroscopy measured maximal production of adenosine triphosphate (ATPmax) in vivo, while ex vivo high-resolution respirometry of permeabilized muscle fibers from the vastus lateralis measured maximal oxygen consumption supported by fatty acids and complex I- and II-linked carbohydrates (e.g., Max OXPHOSCI+CII). Five frailty criteria, shrinking, weakness, exhaustion, slowness, and low activity, were used to classify participants as robust (0, N = 397), intermediate (1-2, N = 410), or frail (≥ 3, N = 66). We estimated the proportional odds ratio (POR) for greater frailty, adjusted for multiple potential confounders.
Results
One-SD decrements of most respirometry measures (e.g., Max OXPHOSCI+CII, adjusted POR = 1.5, 95%CI [1.2,1.8], p = 0.0001) were significantly associated with greater frailty classification. The associations of ATPmax with frailty were weaker than those between Max OXPHOSCI+CII and frailty. Muscle energetics was most strongly associated with slowness and low physical activity components.
Conclusions
Our data suggest that deficits in muscle mitochondrial energetics may be a biological driver of frailty in older adults. On the other hand, we did observe differential relationships between measures of muscle mitochondrial energetics and the individual components of frailty.
Supplementary Information
The online version contains supplementary material available at 10.1007/s11357-023-01002-1.
Keywords: Phenotypic frailty, Mitochondria, Muscle energetics, Aging
Introduction
Frailty is a state of decreased physiologic reserves and resilience which increases an individual’s vulnerability to adverse health outcomes. While different definitions of frailty exist, we focus on the “physical frailty phenotype” or “phenotypic frailty” as defined by Fried [1, 2]. Phenotypic frailty operationalizes the measurement of frailty as a syndrome assessing five components: shrinking, exhaustion, weakness, slowness, and low physical activity. The phenotype discriminates healthier agers from those with high vulnerability to stressors—which precipitate adverse events, including hospitalizations, disability, and death [3–7]. More recent work has focused on identifying underlying biological pathways of frailty to suggest pathophysiologies that might be amenable to intervention [1, 8]. The presence of lower physical activity and greater feelings of exhaustion in frail older adults suggest that frailty may be related to insufficient cellular energy and that age-related declines in skeletal muscle mitochondrial energetics may be an underlying biological driver of frailty [1, 8, 9].
Skeletal muscle mitochondrial energetics includes multiple biochemical pathways: respiration through the electron transport system (ETS) and oxidative phosphorylation (OXPHOS) act in concert to produce ATP to support metabolic activity of cells [10]. Muscle energetics have been measured in older adults using numerous methodologies; the current report utilizes both in vivo and ex vivo muscle energetic measures from the Study of Muscle, Mobility and Aging (SOMMA) [11]. In vivo 31Phosporous magnetic resonance spectroscopy (31P MRS) of the quadriceps following a short bout of exercise captures a phosphorous spectrum that enables the calculation of maximal rate of adenosine triphosphate (ATPmax) generation in post-exercise recovery. Ex vivo assessment was also applied, where high-resolution respirometry of permeabilized muscle fibers (hereafter referred to as “respirometry”) was used to determine oxygen consumption (O2 flux) or oxidative phosphorylation (OXPHOS) supported by specific energy substrate combinations (i.e., fatty acids and complex I- and II-linked carbohydrates).
In older adult quadricep muscle, typically the vastus lateralis, we and others have employed both high-resolution respirometry and 31P MRS to show that greater muscle mitochondrial energetics associated with better muscle and physical performance [10–16]. The few studies that have linked frailty to muscle mitochondrial energetics have been small [9, 17, 18]. Notwithstanding, they suggest that there is a connection between muscle energetics and human frailty in aging. We sought to test the hypothesis that lower muscle mitochondrial energetics is associated with greater frailty. We also sought to determine if these measures were associated with specific frailty components. The expansive dataset from the SOMMA cohort [19] lends itself to this cross-sectional investigation of in vivo and ex vivo measures of muscle mitochondrial energetics and their relationship with phenotypic frailty.
Methods
Study cohort and recruitment
Details related to the design of the Study of Muscle, Mobility and Aging (SOMMA) have been published [19]. We used SOMMA data (https://sommaonline.ucsf.edu/) from the baseline visit collected between April 2019 and December 2021; 879 older adults aged 70 or older were recruited at University of Pittsburgh and Wake Forest University School of Medicine. Exclusion criteria included the following: inability to walk 400 m or climb a flight of stairs; gait speed ≤ 0.6 m/s; had BMI ≥ 40 kg/m2; an active malignancy or advanced chronic disease that would prevent completing baseline assessments or limit their likelihood of providing follow-up data; contraindication to a muscle biopsy; the presence of magnetic resonance (MR) incompatible implants; or a diagnosis of dementia or claustrophobia. All participants provided written informed consent. The Western IRB-Copernicus Group (WCG) Institutional Review Board approved the SOMMA (WCGIRB #20180764).
General baseline questionnaires and measures
SOMMA baseline assessments [19] were obtained over three visits and included questionnaires that surveyed a range of demographic information from participants, including age based on self-reported date of birth, self-reported sex, race, ethnicity, education (≤ high school or other, some college, college graduate, post college), marital status, drinking (drinks per week), and smoking history (ever vs never), medical history, and height at age 25. The total number of prescription medications taken within the last 30 days was recorded by inventory on prescription bottles. Self-reported mobility was assessed by the mobility assessment tool-short form (MAT-sf), in which a participant rates their ability to complete a number of mobility tasks demonstrated in an animated video [20]. Height was measured on stadiometers and mass on digital scales; body mass index (BMI) was calculated as weight divided by square of height (kg/m2). Participants underwent whole-body magnetic resonance (MR) scans that were analyzed using AMRA Researcher (AMRA Medical AB, Linköping, Sweden) to calculate the volumes of abdominal subcutaneous and visceral adipose tissue (ASAT; VAT) [21, 22]. Maximal grip strength in both hands was determined in duplicate trials with an adjustable, hydraulic, isometric dynamometer (Jamar) [23]. Walking speed (m/s) was calculated from 4-m usual pace that is part of the Short Physical Performance Battery (SPPB) [24, 25]. Physical activity was measured by the Community Healthy Activities Model Program for Seniors (CHAMPS) questionnaire; we calculated total time reported on energy expenditure across all intensities of activities (min/week) and the corresponding calorie expenditure (kcal/week) [26]. Depressive symptomology was assessed by the Center of Epidemiologic Studies Depression Scale, 10-item version (CESD-10) [27]. Whole body muscle mass was measured using deuterated creatine (D3Cr) method as previously described [28, 29]. From the self-reported medical history, a modified Rochester Epidemiology Project [30] multimorbidity score (0-11) was calculated. This score included these age-related conditions: cancer (excluding non-melanoma skin), chronic kidney disease or renal failure, atrial fibrillation, lung disease (i.e., chronic obstructive pulmonary disease, bronchitis, asthma, or emphysema), coronary heart disease (i.e., blocked artery or myocardial infarction), heart failure, dementia, ≥ 10 score on CESD-10 (consistent with depressive symptoms), diabetes, stroke, and aortic stenosis.
Phenotypic frailty index
The frailty phenotype was defined closely following the criteria by Fried et al. from the Cardiovascular Health Study (CHS) [2] (Supp. Table 1), with frailty defined as three or more of the following components present: shrinking, weakness, slowness, low physical activity, and exhaustion. The presence of each frailty component was defined as: shrinking—the lowest sex-specific quintile of D3Cr muscle mass/weight; weakness—maximal grip strength in the lowest quintile, stratified by sex and BMI quartile; slowness—the slowest quintile of walking speed, stratified by sex and median height; low physical activity—the lowest sex-specific quintile of energy expenditure from the CHAMPS; and exhaustion—answering “at least 3–4 days per week” to either of two questions from the CESD-10 (“I felt that everything I did was an effort” and “I could not get going”). Participants who were unable (N = 2) or refused (N = 1) the grip strength measurement due to health and safety reasons were considered to have weakness. SOMMA did not assess unintentional weight loss over the previous year—which is a component in the CHS frailty definition. D3Cr muscle mass/weight was used in lieu. Two secondary shrinking definitions were explored in sensitivity analyses: a cut point of BMI < 20 and the highest quintile of height loss since age 25. Participants with none of the components were considered robust, 1–2 components were intermediate, and 3 or more components were frail. For those missing data on 1–2 of the components, the frailty index was extrapolated based on the mean of the non-missing components.
Permeabilized muscle fibers for high-resolution respirometry measures
Participants were instructed to take prescription medications as usual with water except for oral medications or insulin for diabetes which they took after tissue sampling. If participants were asked to withhold aspirin, they were asked to stop taking it 3 days prior to tissue collection. Percutaneous muscle biopsy of vastus lateralis was performed as previously described [13, 31]. Myofiber bundles of 2–3mg were teased apart, chemically permeabilized with saponin, and washed in the presence of the myosin II ATPase inhibitor blebbistatin (25μM; to inhibit muscle contraction). Here, we used two standardized substrate uncoupler inhibitor titration (SUIT) protocols [11], run in duplicate, with steady-state respiration normalized to wet weight, to assess the activity of mitochondrial electron transport system in permeabilized muscle fiber (PMF) bundles with Oxygraph 2K instruments (Oroboros Inc., Innsbruck, Austria). All assays were run at 37 °C in MiR05 supplemented with blebbistatin (25 μM), and O2 concentrations were between 400 and 200μM. Data were collected and analyzed with Datlab 7.4.
Two protocols were used. In protocol 1, respirometry measures include complex I–supported leak respiration (leak or state 4) which was determined through the addition of pyruvate (5 mM) and malate (2 mM). Sequential additions of adenosine diphosphate (ADP; 25 μM, 200 μM, 4.2 mM) were added to induce complex I–supported oxidative phosphorylation (Submax OXPHOSCI and OXPHOSCI), and glutamate (10 mM) was added to elicit maximal complex I–supported OXPHOS (Max OXPHOSCI). Succinate (10 mM) was added, eliciting maximal complex I- and II–supported OXPHOS (Max OXPHOSCI+CII). Carbonyl cyanide-p-trifluoromethoxyphenylhydrazone (FCCP) was titrated (0.5–3.0 μM) until maximal uncoupled complex I- and II–supported electron transfer system (Max ETS) capacity was achieved. In protocol 2, respirometry measures differed from protocol 1 by the addition of palmitoylcarnitine (25 μM) in place of pyruvate, an ADP final concentration of 4.0 mM, and no uncoupling with FCCP was assessed. The nomenclature of these respirometry measures from protocol 1 and 2 is summarized (Supp. Table 2). Respiratory control ratio (RCR) is defined as the ratio of ADP-stimulated respiration to non-ADP (leak) respiration. The average RCR was 7.1 ± 2.9 for protocol 1 (N = 747) and 3.5 ± 1.7 for protocol 2 (N = 547).
31P MRS
31Phosphorous magnetic resonance spectroscopy (31P MRS) of the quadriceps was used to determine the in vivo rate of phosphocreatine (PCr) recovery following an acute bout of knee extensor exercise as previously described [11]. In brief, a 12″ 31P/1H dual-tuned, surface RF coil (PulseTeq, Limited) was used with standard one pulse experiments to capture the phosphorous spectra (levels of PCr, Pi, PDE, and ATP peak areas) of the quadriceps with a 3 Tesla MR magnet (Siemen’s Medical System—Prisma [Pittsburgh] or Skyra [Wake Forest]). The software jMRUI v.6.0 was used to determine relative changes in PCr as described [11]. ATPmax was calculated by fitting the post-exercise recovery of PCr, assuming a resting PCr concentration of 24.5 mM [32].
Statistical analyses
Characteristics were summarized across the three-category frailty variable (robust, intermediate, frail). Tests for linear trend of characteristics across frailty categories included linear regression for normally distributed continuous variables and two-sided Jonckheere-Terpstra for skewed and categorical variables. We tested for interaction with sex for all muscle mitochondrial measures by including the main effects (sex and the muscle mitochondrial measures) and their product (sex*muscle mitochondrial measure); all p-interaction > 0.10. Spearman’s correlation coefficients were used to quantify the bivariate relationships between MAT-sf and phenotypic frailty scores.
Associations of muscle mitochondrial energetics with frailty scores were examined with linear regression models. Muscle mitochondrial energetics was presented as adjusted means along with their 95% confidence intervals (CI) across the three categories of frailty. Where we presented results on linear trend across frailty categories, frailty was used as an independent, ordinal variable in models; some tests were performed comparing categories to the reference (robust). Results from models with 1 unit increase in frailty (and by each component) were shown as beta coefficients with 95% CI. We also estimated the proportional odds ratio (POR) for greater frailty status, expressed per 1 standard deviation (SD) decrement of muscle mitochondrial energetics. Each measure was examined in a separate model; the proportionality assumption was met for all models, allowing us to report a single odds ratio that reflects the likelihood of being a greater frailty category. We report two sets of adjusted models: model 1 adjusted for technician/site; model 2 adjusted for technician/site, age, self-reported sex, race, education, marital status, adiposity (ASAT and VAT), height, smoking, alcohol use, and number of multimorbidity conditions. At one site, one technician performed all respirometry measures while several technicians (N = 6) contributed at the other site. To control for both site and technician, we created a categorical variable that grouped site and technicians, enabling a singular but combined adjustment. Analyses were completed in SAS version 9.4.
Analysis sample
Of the 879 participants who enrolled in SOMMA and completed baseline measurements (Fig. 1), only six participants did not have usable data for both high-resolution respirometry of permeabilized muscle fibers and 31P MRS of quadriceps. Some (N = 61) did not have respirometry performed, and others (N = 34) were missing this measure due to safety reasons, leaving a total of 778 participants with frailty and respirometry data. A few (N = 20) were missing 31P MRS data which resulted in a total of 853 participants with the 31P MRS measures and frailty assessment.
Fig. 1.

SOMMA participants with data for frailty and muscle mitochondrial energetics. Participants with missing data for these measures were due to *safety reasons preventing sampling and testing, or the data could not be calculated. CESD-10, 10-Item Center for Epidemiological Studies Depression Scale; CHAMPS, Community Health Activities Model Program for Seniors; D3Cr, D3-creatine dilution method; 31P MRS, phosphorous magnetic resonance spectroscopy; respirometry, high-resolution respirometry; SOMMA, Study of Muscle, Mobility and Aging
Results
At baseline, 397 (45.5%) SOMMA older adults were categorized as robust, 410 (47.0%) were intermediate, and 66 (7.6%) were frail (Table 1). As expected, the individual measurements used to define the frailty index were related to frailty level. Those with greater levels of frailty had lower muscle mass, weaker grip strength, slower 4-m walk speed, lower physical activity, and were more likely to report exhaustion. Those with greater levels of frailty had less education, lower alcohol use, greater adiposity (ASAT, VAT, BMI), older age, greater multimorbidity, and higher number of medications. There was no significant interaction (p-interaction > 0.10 for all) detected when we assessed the interaction of sex and the muscle mitochondrial energetics’ measures. We also show the muscle mitochondrial bioenergetic capacities across MAT-sf scores and by frailty status (Supplementary Figure 2).
Table 1.
Baseline characteristics of SOMMA participants (aged ≥ 70 years) by frailty status
| Characteristics | Frailty status | Overall (N = 873) | p trend | ||
|---|---|---|---|---|---|
| Robust (N = 397) | Intermediate (N = 410) | Frail (N = 66) | |||
| Phenotypic frailty components: | |||||
| Shrinking: D3Cr muscle mass, kg/wt | 23.36 ± 6.57 | 21.37 ± 6.29 | 18.13 ± 4.81 | 22.05 ± 6.48 | < .0001 |
| Weakness: Grip strength, kg | 29.23 ± 8.67 | 24.72 ± 8.83 | 19.89 ± 7.42 | 26.40 ± 9.11 | < .0001 |
| Slowness: 4m walk speed, m/s | 1.13 ± 0.19 | 0.99 ± 0.18 | 0.80 ± 0.10 | 1.04 ± 0.20 | < .0001 |
| Low activity: Physical activitya, cal/wk | 4727.01 ± 2836.26 | 3201.42 ± 3086.28 | 1441.47 ± 1521.84 | 3762.13 ± 3045.12 | < .0001 |
| Exhaustion: “yes” | 0 | 9 (2.2) | 5 (8.3) | 14 (1.6) | < .0001 |
| Site: | 0.12 | ||||
| Pittsburgh | 207 (52.1) | 203 (49.5) | 26 (39.4) | 436 (49.9) | |
| Wake Forest | 190 (47.9) | 207 (50.5) | 40 (60.6) | 437 (50.1) | |
| Age, years | 75.34 ± 4.44 | 76.81 ± 5.05 | 79.52 ± 6.17 | 76.34 ± 5.01 | < .0001 |
| Women | 232 (58.4) | 244 (59.5) | 40 (60.6) | 516 (59.1) | 0.69 |
| Non-Hispanic White | 339 (85.4) | 343 (83.7) | 54 (81.8) | 736 (84.3) | 0.38 |
| Not Married | 170 (43.0) | 216 (52.8) | 41 (63.1) | 427 (49.1) | < .001 |
| Education: | < .0001 | ||||
| ≤ High school/ other | 30 (7.6) | 73 (18.1) | 17 (26.6) | 120 (13.9) | |
| Some college | 88 (22.2) | 104 (25.7) | 16 (25.0) | 208 (24.1) | |
| College graduate | 108 (27.3) | 102 (25.3) | 13 (20.3) | 223 (25.8) | |
| Post college work | 170 (42.9) | 125 (30.9) | 18 (28.1) | 313 (36.2) | |
| Never smoked | 223 (56.3) | 229 (56.1) | 38 (59.4) | 490 (56.5) | 0.84 |
| Alcohol, drinks/wk | 3.39 ± 4.61 | 2.28 ± 4.08 | 1.76 ± 5.48 | 2.76 ± 4.47 | < .0001 |
| ASAT volume, L | 7.08 ± 2.99 | 8.04 ± 3.24 | 8.58 ± 3.48 | 7.64 ± 3.19 | < .0001 |
| VAT volume, L | 3.88 ± 2.16 | 4.46 ± 2.34 | 4.86 ± 2.44 | 4.22 ± 2.29 | < .0001 |
| Body mass index, kg/m2 | 26.64 ± 4.19 | 28.29 ± 4.68 | 29.06 ± 4.96 | 27.60 ± 4.57 | < .0001 |
| Height loss since age 25, m | 0.04 ± 0.03 | 0.04 ± 0.04 | 0.05 ± 0.05 | 0.04 ± 0.04 | < .0001 |
| Multimorbidity, (0-11) | 0.73 ± 0.78 | 0.82 ± 0.89 | 1.14 ± 1.11 | 0.80 ± 0.86 | 0.04 |
| Rx medications, past 30 days, (0–20) | 3.69 ± 2.98 | 4.85 ± 3.59 | 5.80 ± 3.95 | 4.39 ± 3.42 | < .0001 |
All characteristics reported as mean ± SD or N (%). P value for trends across frailty status (robust, intermediate, frail) for each characteristic
D3Cr D3 creatine, ASAT abdominal subcutaneous adipose tissue, VAT visceral adipose tissue.
aPhysical activity derived from Community Health Model Activities Program for Seniors (CHAMPS) questionnaire where total energy expenditure of all exercises was summed
Lower skeletal muscle mitochondrial energetics, whether determined by in vivo or ex vivo measures, associated with greater frailty in minimally (site or technician) adjusted models (Model 1, Table 2). The fully adjusted results (model 2) were similar to the minimally adjusted with a few exceptions. Mean values of LeakCI, Max ETSCI+CII, OXPHOSCI+FAO, Max OXPHOSCI+CII+FAO, and ATPmax became non-significant after further adjustment (Table 2; Fig. 2). These data show that lower muscle mitochondrial energetics is associated with greater frailty in older adults independent of site/technician, age, sex, race, education, marital status, adiposity, height, smoking, alcohol use, and multimorbidity burden. To assess the likelihood of increasing frailty with decreasing levels of muscle energetics, we used proportional odds models. We found that every 1 SD decrement of most measures of muscle mitochondrial energetics was associated with a higher likelihood of greater frailty (Fig. 3). Most of these associations retained statistical significance in fully adjusted models.
Table 2.
Adjusted means of muscle mitochondrial energetics by frailty in participants (age ≥ 70 yrs)
| M | N | Beta (95% CI) | Adjusted means (95% CI) | p trend | |||
|---|---|---|---|---|---|---|---|
| Per 1 unit | Robust (0) | Intermediate (1–2) | Frail (3+) | ||||
| LeakCI | 1 | 747 | − 0.28 (− 0.44, − 0.13)*** | 5.24 (5.03, 5.46) | 4.77 (4.56, 4.99)** | 4.47 (3.93, 5.02)* | < 0.001 |
| 2 | 687 | − 0.15 (− 0.32, 0.02) | 5.13 (4.91, 5.36) | 4.84 (4.62, 5.06) | 4.78 (4.19, 5.38) | 0.08 | |
| Submax OXPHOSCI | 1 | 612 | − 0.71 (− 1.08, − 0.35)*** | 12.85 (12.38, 13.33) | 12.05 (11.53, 12.57)* | 10.36 (8.98, 11.74)*** | < 0.001 |
| 2 | 569 | − 0.50 (− 0.92, − 0.09)* | 12.74 (12.24, 13.24) | 12.23 (11.68, 12.78) | 10.91 (9.41, 12.40)* | 0.03 | |
| OXPHOSCI | 1 | 747 | − 2.21 (− 3.03, − 1.38)*** | 32.50 (31.33, 33.66) | 29.48 (28.32, 30.64)*** | 25.27 (22.30, 28.23)*** | < 0.0001 |
| 2 | 687 | − 1.37 (− 2.29, − 0.46)** | 31.86 (30.67, 33.05) | 30.01 (28.82, 31.20)* | 27.24 (24.04, 30.44)** | < 0.01 | |
| Max OXPHOSCI | 1 | 743 | − 2.24 (− 3.11, − 1.37)*** | 35.90 (34.67, 37.13) | 32.80 (31.58, 34.01)*** | 28.52 (25.41, 31.64)*** | < 0.0001 |
| 2 | 684 | − 1.40 (− 2.37, − 0.43)** | 35.32 (34.05, 36.58) | 33.33 (32.07, 34.59)* | 30.53 (27.15, 33.91)* | < 0.01 | |
| Max OXPHOSCI+CII | 1 | 745 | − 4.05 (− 5.37, − 2.73)*** | 63.52 (61.65, 65.39) | 57.22 (55.36, 59.08)*** | 51.22 (46.47, 55.97)*** | < 0.0001 |
| 2 | 686 | − 2.82 (− 4.25, − 1.38)*** | 62.72 (60.85, 64.59) | 58.14 (56.27, 60.00)** | 54.40 (49.39, 59.42)** | 0.0001 | |
| Max ETSCI+CII | 1 | 612 | − 3.24 (− 5.12, − 1.37)*** | 82.39 (79.95, 84.83) | 79.02 (76.37, 81.68) | 69.47 (62.42, 76.53)*** | < 0.01 |
| 2 | 570 | − 1.88 (− 3.90, 0.15) | 81.51 (79.06, 83.95) | 79.99 (77.30, 82.67) | 72.18 (64.84, 79.51)* | 0.06 | |
| LeakCI+FAO | 1 | 547 | − 0.12 (− 0.29, 0.05) | 4.58 (4.35, 4.82) | 4.48 (4.26, 4.71) | 3.71 (3.07, 4.35)* | 0.06 |
| 2 | 505 | − 0.01 (− 0.20, 0.17) | 4.44 (4.19, 4.69) | 4.49 (4.26, 4.72) | 3.89 (3.23, 4.54) | 0.47 | |
| OXPHOSCI+FAO | 1 | 547 | − 0.59 (− 1.00, − 0.17)** | 13.41 (12.83, 13.99) | 12.34 (11.80, 12.88)** | 11.46 (9.89, 13.02)* | < 0.01 |
| 2 | 505 | − 0.34 (− 0.80, 0.11) | 13.23 (12.61, 13.85) | 12.49 (11.92, 13.06) | 12.02 (10.40, 13.64) | 0.06 | |
| Max OXPHOSCI+FAO | 1 | 546 | − 1.25 (− 2.06, − 0.43)** | 29.31 (28.16, 30.46) | 27.06 (25.99, 28.14)** | 25.07 (21.97, 28.16)* | 0.001 |
| 2 | 504 | − 0.76 (− 1.64, 0.13) | 28.94 (27.74, 30.14) | 27.32 (26.21, 28.43) | 26.44 (23.28, 29.60) | 0.04 | |
| Max OXPHOSCI+CII+FAO | 1 | 545 | − 2.68 (− 4.20, − 1.17)*** | 60.19 (58.04, 62.34) | 55.60 (53.59, 57.61)** | 51.54 (45.76, 57.31)** | < 0.001 |
| 2 | 504 | − 1.16 (− 2.75, 0.43) | 58.84 (56.69, 61.00) | 56.25 (54.27, 58.24) | 55.23 (49.58, 60.88) | 0.08 | |
| ATPmax | 1 | 812 | − 0.02 (− 0.03, − 0.01)*** | 0.56 (0.54, 0.57) | 0.53 (0.52, 0.54)** | 0.50 (0.46, 0.54)** | < 0.001 |
| 2 | 752 | − 0.01 (− 0.02, 0.00) | 0.55 (0.54, 0.57) | 0.53 (0.52, 0.55) | 0.53 (0.49, 0.57) | 0.13 | |
Model 1 was adjusted for technician/site; model 2 was adjusted for model 1 + age, sex, race, education, marital status, adiposity, height, smoking, alcohol, and multimorbidity. T-distribution was used to compare a specific frailty category to the referent (0 = robust) or per 1 unit increase in frailty
CI/II complex I/II, OXPHOS oxidative phosphorylation, ETS electron transport system, FAO fatty-acid oxidation, PCr phosphocreatine, ATPmax maximal adenosine triphosphate
* < 0.05; **< 0.01; ***< 0.001
Fig. 2.
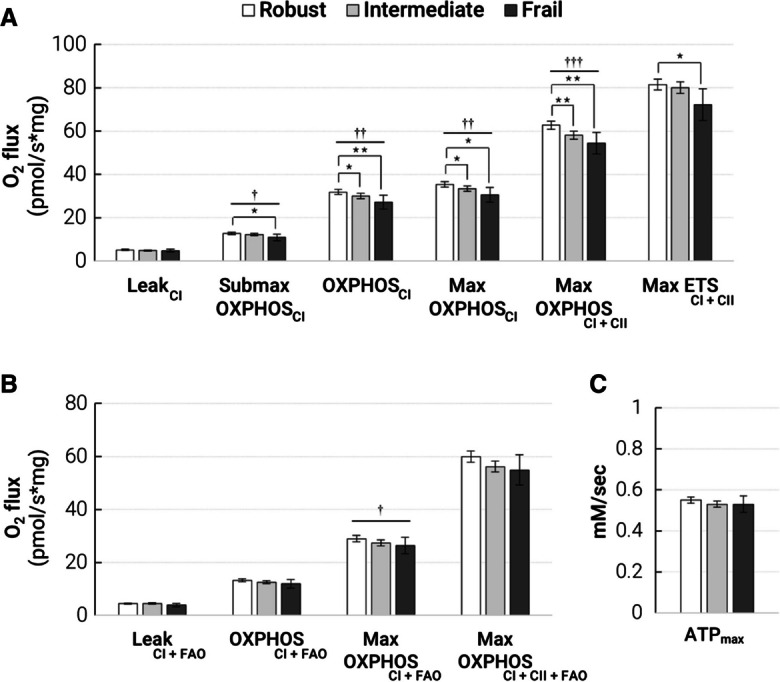
Lower muscle mitochondrial energetics is associated with greater frailty in SOMMA older adults. Multivariate-adjusted means (age, sex, race, education, marital status, adiposity, height, smoking, alcohol, multimorbidity) of muscle mitochondrial measures in SOMMA older adults (age ≥ 70 years) by frailty status are shown with 95% confidence intervals (CI). A Oxidative phosphorylation (OXPHOS) measured with protocol 1 (carbohydrates) in permeabilized myofibers by high-resolution respirometry, N ≥ 569 for all measures. B OXPHOS measured with protocol 2 (carbohydrates and fatty acid (FAO)), N ≥ 504 for all measures. C P31 MRS measure of maximal adenosine triphosphate production (ATPmax), N ≥ 534. Significance levels for the comparison of the referent group (robust) to the intermediate and frail groups are denoted as *p < 0.05; **p < 0.01; ***p < 0.001. The p-trend across the three groups were denoted with †p < 0.05; ††p < 0.01; †††p < 0.001. Details of adjusted means and variable names are available in Supplementary Tables 2 and 3
Fig. 3.

Older adults with lower muscle mitochondrial energetics have higher odds of greater frailty. Measures of association are proportional odds ratios (POR). Model 1 associations were adjusted for technician or site. Model 2 associations were adjusted for model 1 plus age, sex, race, education, marital status, adiposity, height, smoking, alcohol, and number of conditions. Panel shows POR of greater frailty by 1 SD decrement of A respirometry protocol 1 measures, N ≥ 569, B respirometry protocol 2 measures, N ≥ 504, and C ATPmax by 31P MRS, N ≥ 534. Use Supplementary Table 2 for variable name reference
To understand which frailty components may have the strongest relationships with muscle mitochondrial energetics, we also determined the means for each of the muscle mitochondrial variables according to the presence or absence of each individual frailty component (i.e., shrinking, weakness, exhaustion, slowness, and low physical activity). The fully adjusted means are shown (Fig. 4) with statistics reported for both the minimally (model 1; denoted with *) versus fully adjusted (model 2; denoted with †) models. Muscle mitochondrial energetics differed most consistently based on the presence versus absence of slowness (walking speed) and low physical activity (CHAMPS questionnaire). Notably, the measure of OXPHOSCI differed by the presence of nearly all the frailty components except exhaustion—though this may have been due to very small number of participants (N = 9) endorsing this component. This data suggests that the associations of muscle mitochondrial energetics and frailty could be primarily driven by lower muscle energetics associated with low physical activity and/or low gait speed.
Fig. 4.

Muscle mitochondrial energetics is differentially associated with phenotypic frailty components. Comparisons were between older adults with an absence versus presence of each frailty component. The bar chart shows fully adjusted means of each group with 95% confidence intervals (CI) from model 2 (site or technician, age, sex, race, education, marital status, adiposity, height, smoking, alcohol, and number of multimorbidities with corresponding p-values: † < 0.05, † † < 0.01, and † † † < 0.001. p values from model 1 (site or technician) were also included: *< 0.05, **< 0.01, ***< 0.001, and ****< 0.0001. A Protocol 1 respirometry supported by complex I- and II-linked carbohydrates, B protocol 2 respirometry supported by complex I- and II–linked carbohydrates and fatty-acids, and C 31P MRS measure of ATPmax. The N reported is an approximation, as different participants could be missing various respirometry or 31P MRS measures
In sensitivity analyses, we explored two alternative definitions of the shrinking component based on low BMI (< 20) and greater height loss and found little overlap in participants identified (Supp. Figure 1). In fact, none overlapped between all three definitions of shrinking. The frailty index using low muscle mass resulted in higher correlations with the mobility assessment tool-short form (MAT-sf) scores (r = − 0.38) than when definitions with low BMI (r = − 0.32) or greater height loss (r = − 0.32, all p < 0.001) were used (Supp. Table 3).
Discussion
Frailty may stem from individuals having diminished or scarcer energy reserves in musculoskeletal systems [8, 33, 34], where some older adults could become frail sooner due to an accelerated onset of muscle and physical decline. This study is one of the first to employ a comprehensive assessment of in vivo and ex vivo skeletal muscle mitochondria energetics in a large group (N = 879) of older women and men with wide-ranging function. Whether muscle mitochondrial energetics were assessed by in vivo ATPmax or ex vivo OXPHOS (supported by fatty acids and/or complex I- and II–linked carbohydrates), we found that our data largely supported this conclusion: lower skeletal muscle mitochondrial energetics associated with greater phenotypic frailty in older adults. To our knowledge, we are also the first to observe that these associations were driven by older adults with the presence of two specific frailty components: slowness and low physical activity. Many of these associations were independent of suspected confounders, including key demographics (i.e., age, race, sex, marital status, education), smoking, alcohol, body composition (i.e., height, abdominal subcutaneous, and visceral adipose tissue), and the burden of age-related conditions. Our data here substantiate Fried et al. [1] who discussed frailty as a state of reduced energy production and utilization; frailty is more than a phenotype and likely represents a state of compromised physiological dynamics.
Phenotypic frailty and ex vivo muscle mitochondrial energetics (respirometry)
The hypothesis that muscle mitochondrial activity and functional declines in aging contribute to the etiology of sarcopenia has been supported by a range of studies where we and others have described associations between muscle mitochondrial energetics and physical performance [10–16, 35–37]. Albeit not in the context of frailty in older adults, we and others have also demonstrated that muscle mitochondrial energetics affect walk speed [13, 14, 37], but there is less evidence supporting its relationship with grip strength [15] and muscle mass.[35] A strength of this current study is that SOMMA older adults have a wide range of function; on average, these older adults had slower gait speed and lower grip strength than the studies aforementioned [13–15]. We have shown, in a smaller study, that compared to young inactive women, frail older women have reduced muscle mitochondrial respiration due to decreased mitochondrial content [18]. Our data in this study are consistent with these antecedents. After adjusting for potential confounders and mediators, muscle mitochondrial energetics remained strongly associated with only slowness and low physical activity but not weakness and shrinking. However, the analysis does not account for older adults with only one component present versus those with multiple components. Our fully adjusted means showed a difference of approximately 5–6 pmol/s*mg between older adults with the presence of slowness or low activity versus those without. Exercise training in women with obesity [38] and older adults [15] can improve, on average, approximately 10–15 pmol/s*mg of maximal muscle mitochondrial respiration (e.g., Max OXPHOSCI+CII, Max OXPHOSCI+CII+FAO, Max ETS) [39]. In the unadjusted means (not reported), the differences were approximately 10 pmol/s*mg, and this observation supported the importance of adjusting for potential confounders (i.e., sex, adiposity, multimorbidity burden). Taken together, adjusting for confounders and the overlap in older adults with a different number of components could contribute to the lower difference (5–6 pmol/s*mg) observed in these individual component analyses. Our data show that the differences in muscle mitochondrial energetics noted between those with or without low activity and slowness have comparable physiological relevance in the context of how much exercise can improve these metrics in older adults [15].
We measured muscle mitochondrial energetics supported by (1) carbohydrate and (2) fatty acid (FA) with carbohydrate energy substrates. There were some differences between both respirometry protocols in the association with frailty that warrant consideration. Aside from palmitoylcarnitine, the FA with carbohydrate respirometry protocol differed from the carbohydrate protocol in that it lacked pyruvate, which may explain the more robust difference in carbohydrate-associated respiration across frailty categories. Alternatively, as an explanation for the more subtle group differences with the FA with carbohydrate respirometry protocol, the addition of palmitoylcarnitine may have corrected for deficits in carnitine metabolism, which is essential to fatty acid oxidation and associated with frailty [8, 33]. Reports of elevated fatty acids in circulation and deposited within muscle, a feature highly predictive of mobility loss, support this [40, 41].
We measured submaximal OXPHOSCI by titrating adenosine diphosphate (ADP) within a physiological range (20–165 μm) which provides an estimate of ADP sensitivity [42]. The study that established this ADP titration method showed that muscle mitochondrial ADP insensitivity and mitochondrial reactive oxygen species (ROS) production increases with age [42]. In another study, aged mice also exhibited higher ADP insensitivity and ROS production than young mice which was linked to muscle fatigue [43]. Potential causes of age-associated insensitivity to ADP remain unknown but could be connected to age-related changes in OXPHOS components, ADP and substrate transport, and oxidative stress damage. Our outcomes, which were adjusted by age, showed that frail older adults have lower submaximal OXPHOSCI, suggesting that ADP insensitivity along with its potential affectors contribute to frailty.
Interestingly, the lower odds of frailty in submaximal OXPHOSCI (POR = 1.35) compared to Max OXPHOSCI+CII (POR = 1.65), suggest a role of OXPHOS regulation in frailty. Maximal OXPHOSCI+CII was achieved with the addition of succinate, the excessive oxidation of which is known to suppress FAO. Among all the measures of muscle mitochondrial respiration that was lower in frail older adults, our data show that decrements in maximal OXPHOSCI+CII were related to the greatest likelihood of frailty (POR = 1.65). Succinate metabolism results in higher oxygen consumption without a commensurate increase in proton shuttling to the intermembrane space compared to complex I–linked substrates. We speculate that the high odds of frailty predicted by this measure may be due to dysregulation of mitochondrial membrane potential, or related changes in mitochondrial dynamics, calcium homeostasis, or activation of the permeability transition pore (mPTP) [44, 45]. This was supported by the observation that Max ETSCI+CII was not as highly predictive of frailty (POR = 1.31), a respiratory state that is measured after the addition of FCCP, which dissipates membrane potential. Succinate is also known to increase ROS production through succinate-driven reverse electron flow or transfer (RET), a process dependent on substrate availability [46]. RET remains narrowly understood with some studies showing that it contributes to disease pathology and basic physiology of mitochondrial function [47, 48]. More research is needed to resolve the most likely mechanisms responsible for lower muscle mitochondrial energetics in frail individuals. Inclusion of oxidative stress measures in future human frailty studies could also help reveal if impaired ADP sensitivity or heightened RET problematically increases ROS production—which has long been suspected to progress frailty [49].
Phenotypic frailty and in vivo muscle mitochondrial energetics (31P MRS)
Numerous studies have used in vivo measures of muscle mitochondrial energetics by 31P MRS to study frailty in humans, an approach which does not require a muscle biopsy. In a study of active older adults, those with sarcopenia had reduced ATP/ADP at rest and lower ATP/PCR during exercise when compared to non-sarcopenic lean adults [50]. In another study of active older adults, prefrail participants had decreased ATPmax and lower protein expression of muscle mitochondrial respiratory complexes compared to non-frail participants [17]. ATPmax provides an estimate of the maximum ATP production of the mitochondria based on the rate PCr recovery following a short exercise bout. In this study, we posit that the less robust relationship between in vivo ATPmax and frailty status (POR = 1.30) than observed for maximum oxygen consumption (e.g., Max OXPHOSCI+CII POR = 1.65, Max OXPHOSCI+CII+FAO POR = 1.40) could be that these differences in ATPmax across groups are an underestimate of the actual difference. The estimate of ATPmax assumed that ATP and PCr concentrations are constant across study participants. There is some evidence that these concentrations may differ at rest and during exercise in older adults [51, 52], and a recent study showed that the rate of substrate decline, not substrate concentrations, differed during exercise in older adults with frailty compared to those without [9]. A lower ATP or PCr concentration in frail individuals would lead to greater differences in the calculated ATPmax for a given PCr recovery rate [53]. The more modest relationship between in vivo ATPmax and frailty than observed for the respiration measures may indicate a few things. Perhaps when compared to other aspects of mitochondrial biology that are implicated in the ATPmax assessment, such as redox homeostasis, intermediate metabolite regulation, or calcium metabolism, the activity of the ETS captured by respirometry assessment seems to be more important. The direct comparison of these aspects of muscle mitochondrial biology and how they may differentially relate to frailty warrants further study.
Our study reveals the importance of understanding how different physical frailty phenotype components likely have varying relationships with different underlying biological drivers. This is a critical insight that has, to date, remained narrowly explored and yet is important if molecular therapeutic targets are to be identified to treat frailty. Important to note, a caveat to this cross-sectional analysis, including how frailty components were operationalized, is that it suggests that lower physical activity, a frailty component, precedes frailty development. However, it should be acknowledged that some of these associations are potentially bidirectional—for example, studies have shown that physical activity levels explain the differences of muscle mitochondrial energetics in older adults [10, 54]. Aside from muscle mitochondrial energetics, the three components—shrinking, weakness, and perhaps exhaustion—are most likely explained by other biological factors involved in these components of frailty. Reductions in mitochondrial content [17, 18], denervation and myofiber cross-sectional area [18], reduction in genes involved in fatty acid oxidation [17, 33], and reactive oxygen species emission [18] have all been identified as potential contributors to the frailty phenotype.
Skeletal muscle mitochondrial content has been correlated with mitochondrial oxidative capacity in other studies [55, 56], but we did not measure mitochondrial content in the present study. Therefore, the associations between mitochondrial energetics and frailty could be conceivably attributed to mitochondrial content, intrinsic mitochondrial functional properties, or a combination of both. Despite this limitation, the key metric most relevant for cellular bioenergetics is the total oxidative capacity, which was the outcome measured in this analysis. Other studies have also used creatine kinase (CK) energetic clamps to account for the physiological flux of substrate-product by titrating the extra-mitochondrial ATP/ADP ratio while measuring mitochondrial respiration in vitro [57, 58]. Energetic clamp approaches to measure respiration at subsaturated ADP levels may provide a closer analog to in vivo ATPmax measurements, which represent ATP production under conditions that better represent steady-state energy demand. Our data show weak associations of in vivo ATPmax with frailty which may be better resolved in future studies by including similar CK energetic clamps in the ex vivo respiration measures. These analyses focused on the physical frailty phenotype, and we acknowledge that the definitions of frailty are varied and include other physiological and cognitive reserves across multiple organ systems beyond the muscle. Many studies have used unintentional weight loss or lower body mass index (BMI) in frailty scores, but data on unintentional weight loss was absent here; therefore, after exploring alternative definitions for shrinking, low muscle mass was elected for its stronger correlations with physical performance assessments (e.g., MAT-sf) along with the rationale that it would most closely approximate sarcopenia—the original target of the “shrinking” component [2]. The analyses adjusted for multimorbidity burden but not prescription medications which could pose a limitation to our results. Future studies should explore the specific impact of different medications on mitochondrial respiration which would enable controlling for this in future analyses. We also recognize the limitation that the SOMMA cohort is predominantly non-Hispanic white, and the study’s inclusion criteria limit generalizability of our results. Nevertheless, the cohort is extremely well-phenotyped demographically and clinically. The SOMMA cohort enabled including both in vivo and ex vivo measures of muscle mitochondrial energetics, and participants expressed a wide range of physical and muscle functional outcomes.
In conclusion, we showed that poorer muscle mitochondrial energetics had a significant association with worse phenotypic frailty. Functional metrics in future frailty definitions may better reflect stress responses (e.g., recovery from surgery or illness). We anticipate that the efforts underway to better define vulnerability to stress seen in frail older adults by measuring resilience could also strengthen the relevance of measured biological drivers. Future work should include longitudinal assessments that would enable testing if changes in muscle mitochondrial energetics predict the onset or progression in frailty in older adults, which if it does would provide grounds for targeting the improvement of muscle mitochondrial energetics in older adults to delay frailty. While the other aspects of muscle mitochondria we mentioned (i.e., fiber type, reactive oxygen species emission) may be influential in precipitating frailty, we showed here that lower muscle mitochondrial energetics in older adults could be important in the etiology of frailty in aging.
Supplementary information
(DOCX 226 kb)
Acknowledgements
We would like to gratefully acknowledge all the SOMMA clinical, research, and administrative staff in a list previously published [19].
Author contribution
Using Contributor Roles Taxonomy (CRediT), TM led the writing team for the original draft; HNB and TLB were co-analysts who led formal analyses. Key conceptualization to this study involved ABN, SBK, PMCa, and TLB. HNB managed data curation. PMCa, PAK, SRB, DJM, and SVR provided the most critical writing review and edits that led to the improvement of the manuscript. DJM, PAK, DG, and PMCo all contributed with scientific validation and verification while DEF, FGST, and SRB proofread multiple drafts of the manuscript. SRC, PMCa, ABN, SBK, and RTH enabled the study with either funding acquisition, project administration, supervision, and/or conceptualization to the study. All authors reviewed and approved of this manuscript.
Funding
The National Institute on Aging (NIA) funded the Study of Muscle, Mobility and Aging (SOMMA; R01AG059416). In part, infrastructure support for SOMMA was funded by the NIA Claude D. Pepper Older American Independence Centers at the University of Pittsburgh and Wake Forest University School of Medicine, P30AG024827 and P30AG021332 respectively. SOMMA infrastructure support from the Clinical and Translational Science Institutes is funded by the National Center for Advancing Translational Science at Wake (UL1TR001420). PMCo is supported by R01AG060153. DJM’s contribution was also supported by P01 AG001751. SRB’s contribution was supported by NIA R03 AG067937 and K76 AG074903. DEF has funding support from NIA R01 AG058883.
Data availability
This manuscript analysis dataset is available on request at (https://sommaonline.ucsf.edu/).
Declarations
Conflict of interest
SRC and PMCa are consultants to Bioage Labs. PMCa is a consultant to and owns stock in MyoCorps. All other authors report no potential competing or conflicts of interests.
Footnotes
Publisher’s note
Springer Nature remains neutral with regard to jurisdictional claims in published maps and institutional affiliations.
References
- 1.Fried LP, Cohen AA, Xue QL, Walston J, Bandeen-Roche K, Varadhan R. The physical frailty syndrome as a transition from homeostatic symphony to cacophony. Nat Aging. 2021;1:36–46. doi: 10.1038/s43587-020-00017-z. [DOI] [PMC free article] [PubMed] [Google Scholar]
- 2.Fried LP, Tangen CM, Walston J, Newman AB, Hirsch C, Gottdiener J, et al. Frailty in older adults: evidence for a phenotype. J Gerontol - Ser A Biol Sci Med Sci. 2001;56:146–157. doi: 10.1093/gerona/56.3.m146. [DOI] [PubMed] [Google Scholar]
- 3.Rockwood K, Song X, MacKnight C, Bergman H, Hogan DB, McDowell I, et al. A global clinical measure of fitness and frailty in elderly people. C Can Med Assoc J. 2005;173:489–495. doi: 10.1503/cmaj.050051. [DOI] [PMC free article] [PubMed] [Google Scholar]
- 4.Bandeen-Roche K, Xue QL, Ferrucci L, Walston J, Guralnik JM, Chaves P, et al. Phenotype of frailty: characterization in the women’s health and aging studies. J Gerontol - Ser A Biol Sci Med Sci. 2006;61:262–266. doi: 10.1093/gerona/61.3.262. [DOI] [PubMed] [Google Scholar]
- 5.Cawthon PM, Marshall LM, Michael Y, Dam TT, Ensrud KE, Barrett-Connor E, et al. Frailty in older men: prevalence, progression, and relationship with mortality. J Am Geriatr Soc. 2007;55:1216–1223. doi: 10.1111/j.1532-5415.2007.01259.x. [DOI] [PubMed] [Google Scholar]
- 6.Rockwood K, Blodgett JM, Theou O, Sun MH, Feridooni HA, Mitnitski A, et al. A frailty index based on deficit accumulation quantifies mortality risk in humans and in mice. Sci Rep. 2017;7:1–10. doi: 10.1038/srep43068. [DOI] [PMC free article] [PubMed] [Google Scholar]
- 7.Hanlon P, Jani BD, Butterly E, Nicholl B, Lewsey J, McAllister DA, et al. An analysis of frailty and multimorbidity in 20,566 UK Biobank participants with type 2 diabetes. Commun Med. 2021;1:1–9. doi: 10.1038/s43856-021-00029-9. [DOI] [PMC free article] [PubMed] [Google Scholar]
- 8.Ferrucci L, Zampino M. A mitochondrial root to accelerated ageing and frailty. Nat Rev Endocrinol. 2020;16:133–134. doi: 10.1038/s41574-020-0319-y. [DOI] [PMC free article] [PubMed] [Google Scholar]
- 9.Lewsey SC, Weiss K, Schär M, Zhang Y, Bottomley PA, Jake Samuel T, et al. Exercise intolerance and rapid skeletal muscle energetic decline in human age-associated frailty. JCI Insight. 2020;5:1–15. doi: 10.1172/jci.insight.141246. [DOI] [PMC free article] [PubMed] [Google Scholar]
- 10.Distefano G, Standley RA, Zhang X, Carnero EA, Yi F, Cornnell HH, et al. Physical activity unveils the relationship between mitochondrial energetics, muscle quality, and physical function in older adults. J Cachexia Sarcopenia Muscle. 2018;9:279–294. doi: 10.1002/jcsm.12272. [DOI] [PMC free article] [PubMed] [Google Scholar]
- 11.Mau T, Lui L-Y, Distefano G, Kramer PA, Ramos SV, Toledo FGS, et al. Mitochondrial energetics in skeletal muscle are associated with leg power and cardiorespiratory fitness in the study of muscle, mobility and aging. J Gerontol Ser A. 2022;78:1367–1375. doi: 10.1093/gerona/glac238. [DOI] [PMC free article] [PubMed] [Google Scholar]
- 12.Conley KE, Jubrias SA, Esselman PC. Oxidative capacity and ageing in human muscle. J Physiol. 2000;526:203–210. doi: 10.1111/J.1469-7793.2000.T01-1-00203.X. [DOI] [PMC free article] [PubMed] [Google Scholar]
- 13.Coen PM, Jubrias SA, Distefano G, Amati F, Mackey DC, Glynn NW, et al. Skeletal muscle mitochondrial energetics are associated with maximal aerobic capacity and walking speed in older adults. J Gerontol - Ser A Biol Sci Med Sci. 2013;68:447–455. doi: 10.1093/gerona/gls196. [DOI] [PMC free article] [PubMed] [Google Scholar]
- 14.Gonzalez-Freire M, Scalzo P, D’Agostino J, Moore ZA, Diaz-Ruiz A, Fabbri E, et al. Skeletal muscle ex vivo mitochondrial respiration parallels decline in vivo oxidative capacity, cardiorespiratory fitness, and muscle strength: the Baltimore Longitudinal Study of Aging. Aging Cell. 2018:17. 10.1111/acel.12725. [DOI] [PMC free article] [PubMed]
- 15.Grevendonk L, Connell NJ, McCrum C, Fealy CE, Bilet L, Bruls YMH, et al. Impact of aging and exercise on skeletal muscle mitochondrial capacity, energy metabolism, and physical function. Nat Commun. 2021;12:1–17. doi: 10.1038/s41467-021-24956-2. [DOI] [PMC free article] [PubMed] [Google Scholar]
- 16.Short KR, Bigelow ML, Kahl J, Singh R, Coenen-Schimke J, Raghavakaimal S, et al. Decline in skeletal muscle mitochondrial function with aging in humans. Proc Natl Acad Sci USA. 2005;102:5618–5623. doi: 10.1073/pnas.0501559102. [DOI] [PMC free article] [PubMed] [Google Scholar]
- 17.Andreux PA, Van Diemen MPJ, Heezen MR, Auwerx J, Rinsch C, Jan Groeneveld G, et al. Mitochondrial function is impaired in the skeletal muscle of pre-frail elderly. Sci Rep. 2018;8:1–12. doi: 10.1038/s41598-018-26944-x. [DOI] [PMC free article] [PubMed] [Google Scholar]
- 18.Sonjak V, Jacob KJ, Spendiff S, Vuda M, Perez A, Miguez K, et al. Reduced mitochondrial content, elevated reactive oxygen species, and modulation by denervation in skeletal muscle of prefrail or frail elderly women. J Gerontol - Ser A Biol Sci Med Sci. 2019;74:1887–1895. doi: 10.1093/gerona/glz066. [DOI] [PubMed] [Google Scholar]
- 19.Cummings SR, Newman AB, Coen PM, Hepple RT, Collins R, Kennedy K, et al. The Study of Muscle, Mobility and Aging (SOMMA): a unique cohort study about the cellular biology of aging and age-related loss of mobility. J Gerontol Ser A. 2023; 10.1093/gerona/glad052. [DOI] [PMC free article] [PubMed]
- 20.Rejeski WJ, Rushing J, Guralnik JM, Ip EH, King AC, Manini TM, et al. The MAT-sf: identifying risk for major mobility disability. J Gerontol - Ser A Biol Sci Med Sci. 2015;70:641–646. doi: 10.1093/gerona/glv003. [DOI] [PMC free article] [PubMed] [Google Scholar]
- 21.Karlsson A, Rosander J, Romu T, Tallberg J, Grönqvist A, Borga M, et al. Automatic and quantitative assessment of regional muscle volume by multi-atlas segmentation using whole-body water-fat MRI. J Magn Reson Imaging. 2015;41:1558–1569. doi: 10.1002/jmri.24726. [DOI] [PubMed] [Google Scholar]
- 22.West J, Romu T, Thorell S, Lindblom H, Berin E, Holm ACS, et al. Precision of MRI-based body composition measurements of postmenopausal women. PLoS One. 2018:13. 10.1371/JOURNAL.PONE.0192495. [DOI] [PMC free article] [PubMed]
- 23.Fiatarone MA, Marks EC, Ryan ND, Meredith CN, Lipsitz LA, Evans WJ. High-intensity strength training in nonagenarians: effects on skeletal muscle. JAMA J Am Med Assoc. 1990;263:3029–3034. doi: 10.1001/jama.1990.03440220053029. [DOI] [PubMed] [Google Scholar]
- 24.Guralnik JM, Simonsick EM, Ferrucci L, Glynn RJ, Berkman LF, Blazer DG, et al. A short physical performance battery assessing lower extremity function: association with self-reported disability and prediction of mortality and nursing home admission. J Gerontol. 1994:49. 10.1093/geronj/49.2.M85. [DOI] [PubMed]
- 25.NIH. Short Physical Performance Battery (SPPB) | National Institute on Aging n.d. https://www.nia.nih.gov/research/labs/leps/short-physical-performance-battery-sppb (accessed May 23, 2023).
- 26.Stewart AL, Mills KM, King AC, Haskell WL, Gillis D, Ritter PL. CHAMPS physical activity questionnaire for older adults: outcomes for interventions. Med Sci Sports Exerc. 2001;33:1126–1141. doi: 10.1097/00005768-200107000-00010. [DOI] [PubMed] [Google Scholar]
- 27.Irwin M, Artin KH, Oxman MN. Screening for depression in the older adult: criterion validity of the 10-item Center for Epidemiological Studies Depression Scale (CES-D) Arch Intern Med. 1999;159:1701–1704. doi: 10.1001/archinte.159.15.1701. [DOI] [PubMed] [Google Scholar]
- 28.Shankaran M, Czerwieniec G, Fessler C, Wong PY, Killion S, Turner SM, et al. Dilution of oral D 3 -creatine to measure creatine pool size and estimate skeletal muscle mass: development of a correction algorithm. J Cachexia Sarcopenia Muscle. 2018;9:540–546. doi: 10.1002/jcsm.12278. [DOI] [PMC free article] [PubMed] [Google Scholar]
- 29.Cawthon PM, Orwoll ES, Peters KE, Ensrud KE, Cauley JA, Kado DM, et al. Strong relation between muscle mass determined by d3-creatine dilution, physical performance, and incidence of falls and mobility limitations in a prospective cohort of older men. J Gerontol - Ser A Biol Sci Med Sci. 2019;74:844–852. doi: 10.1093/gerona/gly129. [DOI] [PMC free article] [PubMed] [Google Scholar]
- 30.Espeland MA, Crimmins EM, Grossardt BR, Crandall JP, Gelfond JAL, Harris TB, et al. Clinical trials targeting aging and age-related multimorbidity. J Gerontol - Ser A Biol Sci Med Sci. 2017;72:355–361. doi: 10.1093/gerona/glw220. [DOI] [PMC free article] [PubMed] [Google Scholar]
- 31.Evans WJ, Phinney SDYV. Suction applied to a muscle biopsy maximizes sample size. Med Sci Sports Exerc. 1982;14:101–102. doi: 10.1249/00005768-198201000-00018. [DOI] [PubMed] [Google Scholar]
- 32.Amara CE, Marcinek DJ, Shankland EG, Schenkman KA, Arakaki LSL, Conley KE. Mitochondrial function in vivo: spectroscopy provides window on cellular energetics. Methods. 2008;46:312–318. doi: 10.1016/j.ymeth.2008.10.001. [DOI] [PMC free article] [PubMed] [Google Scholar]
- 33.Rattray NJW, Trivedi DK, Xu Y, Chandola T, Johnson CH, Marshall AD, et al. Metabolic dysregulation in vitamin E and carnitine shuttle energy mechanisms associate with human frailty. Nat Commun. 2019;10:1–12. doi: 10.1038/s41467-019-12716-2. [DOI] [PMC free article] [PubMed] [Google Scholar]
- 34.Migliavacca E, Tay SKH, Patel HP, Sonntag T, Civiletto G, McFarlane C, et al. Mitochondrial oxidative capacity and NAD+ biosynthesis are reduced in human sarcopenia across ethnicities. Nat Commun. 2019:10. 10.1038/s41467-019-13694-1. [DOI] [PMC free article] [PubMed]
- 35.Joseph AM, Adhihetty PJ, Buford TW, Wohlgemuth SE, Lees HA, Nguyen LMD, et al. The impact of aging on mitochondrial function and biogenesis pathways in skeletal muscle of sedentary high- and low-functioning elderly individuals. Aging Cell. 2012;11:801–809. doi: 10.1111/j.1474-9726.2012.00844.x. [DOI] [PMC free article] [PubMed] [Google Scholar]
- 36.Menshikova EV, Ritov VB, Fairfull L, Ferrell RE, Kelley DE, Goodpaster BH. Effects of exercise on mitochondrial content and function in aging human skeletal muscle. J Gerontol - Ser A Biol Sci Med Sci. 2006;61:534–540. doi: 10.1093/gerona/61.6.534. [DOI] [PMC free article] [PubMed] [Google Scholar]
- 37.Tian Q, Mitchell BA, Zampino M, Fishbein KW, Spencer RG, Ferrucci L. Muscle mitochondrial energetics predicts mobility decline in well-functioning older adults: the Baltimore Longitudinal Study of Aging. Aging Cell. 2022:21. 10.1111/acel.13552. [DOI] [PMC free article] [PubMed]
- 38.Mendham AE, Goedecke JH, Zeng Y, Larsen S, George C, Hauksson J, et al. Exercise training improves mitochondrial respiration and is associated with an altered intramuscular phospholipid signature in women with obesity. Diabetologia. 2021;64:1642–1659. doi: 10.1007/s00125-021-05430-6. [DOI] [PMC free article] [PubMed] [Google Scholar]
- 39.Gnaiger E. Capacity of oxidative phosphorylation in human skeletal muscle. New perspectives of mitochondrial physiology. Int J Biochem Cell Biol. 2009;41:1837–1845. doi: 10.1016/j.biocel.2009.03.013. [DOI] [PubMed] [Google Scholar]
- 40.Ahiawodzi P, Djousse L, Ix JH, Kizer JR, Tracy RP, Arnold A, et al. Non-esterified fatty acids and risks of frailty, disability, and mobility limitation in older adults: the Cardiovascular Health Study. J Am Geriatr Soc. 2020;68:2890–2897. doi: 10.1111/jgs.16793. [DOI] [PMC free article] [PubMed] [Google Scholar]
- 41.Beavers KM, Beavers DP, Houston DK, Harris TB, Hue TF, Koster A, et al. Associations between body composition and gait-speed decline: results from the Health, Aging, and Body Composition study1-4. Am J Clin Nutr. 2013;97:552–560. doi: 10.3945/ajcn.112.047860. [DOI] [PMC free article] [PubMed] [Google Scholar]
- 42.Holloway GP, Holwerda AM, Miotto PM, Dirks ML, Verdijk LB, van Loon LJC. Age-associated impairments in mitochondrial ADP sensitivity contribute to redox stress in senescent human skeletal muscle. Cell Rep. 2018;22:2837–2848. doi: 10.1016/j.celrep.2018.02.069. [DOI] [PubMed] [Google Scholar]
- 43.Pharaoh G, Brown J, Ranjit R, Ungvari Z, Van Remmen H. Reduced adenosine diphosphate sensitivity in skeletal muscle mitochondria increases reactive oxygen species production in mouse models of aging and oxidative stress but not denervation. JCSM Rapid Commun. 2021;4:75–89. doi: 10.1002/rco2.29. [DOI] [PMC free article] [PubMed] [Google Scholar]
- 44.Bellanti F, Lo BA, Vendemiale G. Mitochondrial impairment in sarcopenia. Biology (Basel) 2021;10:1–16. doi: 10.3390/biology10010031. [DOI] [PMC free article] [PubMed] [Google Scholar]
- 45.Leduc-Gaudet JP, Hussain SNA, Barreiro E, Gouspillou G. Mitochondrial dynamics and mitophagy in skeletal muscle health and aging. Int J Mol Sci. 2021:22. 10.3390/ijms22158179. [DOI] [PMC free article] [PubMed]
- 46.Heinen A, Aldakkak M, Stowe DF, Rhodes SS, Riess ML, Varadarajan SG, et al. Reverse electron flow-induced ROS production is attenuated by activation of mitochondrial Ca2+-sensitive K+ channels. Am J Physiol Heart Circ Physiol. 2007;293:1400–1407. doi: 10.1152/ajpheart.00198.2007. [DOI] [PubMed] [Google Scholar]
- 47.Scialò F, Fernández-Ayala DJ, Sanz A. Role of mitochondrial reverse electron transport in ROS signaling: potential roles in health and disease. Front Physiol. 2017;8:428. doi: 10.3389/fphys.2017.00428. [DOI] [PMC free article] [PubMed] [Google Scholar]
- 48.Onukwufor JO, Berry BJ, Wojtovich AP. Physiologic implications of reactive oxygen species production by mitochondrial complex I reverse electron transport. Antioxidants. 2019;8:285. doi: 10.3390/antiox8080285. [DOI] [PMC free article] [PubMed] [Google Scholar]
- 49.Álvarez-Satta M, Berna-Erro A, Carrasco-Garcia E, Alberro A, Saenz-Antoñanzas A, Vergara I, et al. Relevance of oxidative stress and inflammation in frailty based on human studies and mouse models. Aging (Albany NY) 2020;12:9982–9999. doi: 10.18632/aging.103295. [DOI] [PMC free article] [PubMed] [Google Scholar]
- 50.Waters DL, Mullins PG, Qualls CR, Raj DSC, Gasparovic C, Baumgartner RN. Mitochondrial function in physically active elders with sarcopenia. Mech Ageing Dev. 2009;130:315–319. doi: 10.1016/j.mad.2009.01.006. [DOI] [PMC free article] [PubMed] [Google Scholar]
- 51.Lanza IR, Befroy DE, Kent-Braun JA. Age-related changes in ATP-producing pathways in human skeletal muscle in vivo. J Appl Physiol. 2005;99:1736–1744. doi: 10.1152/japplphysiol.00566.2005. [DOI] [PubMed] [Google Scholar]
- 52.Krumpolec P, Klepochová R, Just I, Tušek Jelenc M, Frollo I, Ukropec J, et al. Multinuclear MRS at 7T uncovers exercise driven differences in skeletal muscle energy metabolism between young and seniors. Front Physiol. 2020:11. 10.3389/fphys.2020.00644. [DOI] [PMC free article] [PubMed]
- 53.Song J, Yu Z, Gordin ML, Wang D. Advanced sulfur cathode enabled by highly crumpled nitrogen-doped graphene sheets for high-energy-density lithium-sulfur batteries. Nano Lett. 2016;16:864–870. doi: 10.1021/acs.nanolett.5b03217. [DOI] [PubMed] [Google Scholar]
- 54.Zhang X, Kunz HE, Gries K, Hart CR, Polley EC, Lanza IR. Preserved skeletal muscle oxidative capacity in older adults despite decreased cardiorespiratory fitness with ageing. J Physiol. 2021;599:3581–3592. doi: 10.1113/JP281691. [DOI] [PMC free article] [PubMed] [Google Scholar]
- 55.Larsen S, Nielsen J, Hansen CN, Nielsen LB, Wibrand F, Stride N, et al. Biomarkers of mitochondrial content in skeletal muscle of healthy young human subjects. J Physiol. 2012;590:3349–3360. doi: 10.1113/jphysiol.2012.230185. [DOI] [PMC free article] [PubMed] [Google Scholar]
- 56.McLaughlin KL, Hagen JT, Coalson HS, Nelson MAM, Kew KA, Wooten AR, et al. Novel approach to quantify mitochondrial content and intrinsic bioenergetic efficiency across organs. Sci Rep. 2020;10:1–15. doi: 10.1038/s41598-020-74718-1. [DOI] [PMC free article] [PubMed] [Google Scholar]
- 57.Glancy B, Barstow T, Willis WT. Linear relation between time constant of oxygen uptake kinetics, total creatine, and mitochondrial content in vitro. Am J Phys Cell Physiol. 2008;294:79–87. doi: 10.1152/ajpcell.00138.2007. [DOI] [PubMed] [Google Scholar]
- 58.Fisher-Wellman KH, Davidson MT, Narowski TM, Te LC, Koves TR, Muoio DM. Mitochondrial diagnostics: a multiplexed assay platform for comprehensive assessment of mitochondrial energy fluxes. Cell Rep. 2018;24:3593–3606.e10. doi: 10.1016/j.celrep.2018.08.091. [DOI] [PMC free article] [PubMed] [Google Scholar]
Associated Data
This section collects any data citations, data availability statements, or supplementary materials included in this article.
Supplementary Materials
(DOCX 226 kb)
Data Availability Statement
This manuscript analysis dataset is available on request at (https://sommaonline.ucsf.edu/).