

Summary
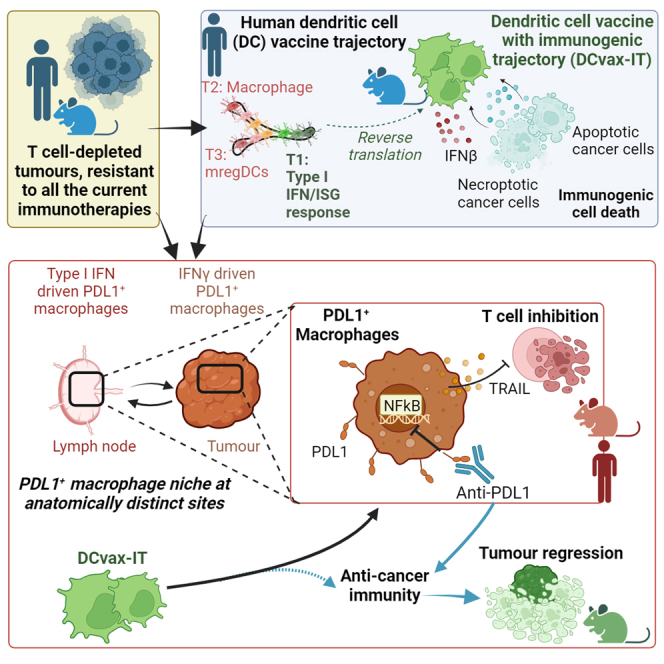
Current immunotherapies provide limited benefits against T cell-depleted tumors, calling for therapeutic innovation. Using multi-omics integration of cancer patient data, we predict a type I interferon (IFN) responseHIGH state of dendritic cell (DC) vaccines, with efficacious clinical impact. However, preclinical DC vaccines recapitulating this state by combining immunogenic cancer cell death with induction of type I IFN responses fail to regress mouse tumors lacking T cell infiltrates. Here, in lymph nodes (LNs), instead of activating CD4+/CD8+ T cells, DCs stimulate immunosuppressive programmed death-ligand 1-positive (PD-L1+) LN-associated macrophages (LAMs). Moreover, DC vaccines also stimulate PD-L1+ tumor-associated macrophages (TAMs). This creates two anatomically distinct niches of PD-L1+ macrophages that suppress CD8+ T cells. Accordingly, a combination of PD-L1 blockade with DC vaccines achieves significant tumor regression by depleting PD-L1+ macrophages, suppressing myeloid inflammation, and de-inhibiting effector/stem-like memory T cells. Importantly, clinical DC vaccines also potentiate T cell-suppressive PD-L1+ TAMs in glioblastoma patients. We propose that a multimodal immunotherapy and vaccination regimen is mandatory to overcome T cell-depleted tumors.
Keywords: programmed cell death-1, PD-1, damage-associated molecular patterns, DAMPs, tumor-associated antigens, TAAs, apoptosis, necroptosis, mature regulatory DCs, mregDC, single-cell omics, immune-checkpoint blockers, ICB, nuclear factor κB, NF-κB
Graphical abstract
Highlights
-
•
Multi-omics analyses predict a highly immunogenic type I IFNHIGH DC vaccine state
-
•
DC vaccines fail because they facilitate PD-L1+ TAMs in lymph nodes and tumors
-
•
PD-L1+ TAMs suppress CD8+ T cell responses to disrupt DC vaccine efficacy
-
•
Targeting PD-L1+ TAMs via PD-L1 blockade improves DC vaccine-driven tumor control
Sprooten et al. use human-to-mouse reverse translation to create DC vaccines. Counterintuitively, these induce an accumulation of CD8+ T cell-suppressive PD-L1+ macrophages in lymph nodes and tumors, such that vaccination and co-blockade of PD-L1 (but not PD-1) is mandatory for tumor suppression. This pathway is also operational in DC vaccinated cancer patients.
Introduction
Cancer immunotherapy with immune-checkpoint blockade (ICB) has improved the outlook for many patients.1 However, not all cancers respond to current immunotherapies.1 This is especially applicable to T cell-depleted tumors because they are non-immunogenic2,3,4,5 and hence contain less CD8+ T cells but abundant tumor-associated macrophages (TAMs) with anti-inflammatory (M2-like) activity.6,7,8,9
The immune control of poorly immunogenic tumors4 can be potentiated by dendritic cell (DC) vaccines designed to elicit antigen-specific immunogenic responses.4,8,10 Such vaccines typically utilize patient-derived autologous DCs that are pulsed with cancer antigens and stimulated with maturation stimuli ex vivo before they are reinjected into the patient.11,12 DCs are endowed with the unique capacity to cross-present antigens to CD4+/CD8+ T cells in lymph nodes (LNs).13,14
Unfortunately, these pro-immunogenic capacities of DC vaccines have not consistently translated into the clinic.11,15 Recently, the lack of efficacy of ICBs against T cell-depleted tumors has spurred the interest in multimodal immunotherapy regimens integrating next-generation DC vaccines.4,12,15,16 Hence, the overarching aim of this study was to use a human multi-omics cancer data-driven framework to inform the design of a next-generation DC vaccine with a highly immunogenic maturation trajectory (DCvax-IT) through a reverse translational approach. We wanted to tailor this DC vaccine against ICB non-responsive, T cell-depleted tumors and then decipher the exact immunological mechanisms regulating the anti-tumor effects of DCvax-IT. Finally, we aimed at confirming our preclinical observations in clinical settings as proof of concept for the future design of trials integrating DC vaccines.
Results
Dysregulated danger signaling, defective type I interferon production, and DC depletion distinguishes the human T cell-depleted tumors
For a reverse translational approach, we first needed to extract the most dysregulated immune-pathways from human T cell-depleted tumors. Hence, we analyzed tumor immune landscapes in The Cancer Genome Atlas (TCGA).17 Previously, an immunogenomics analysis had identified six pan-cancer immune-landscape classes (C1–C6; Figure 1A).16 We reanalyzed these classes across 3,546 patients spanning 13 cancer types, for major immune cell fractions or ratios, and T cell receptor (TCR) richness (Figure 1A).4,17 C4/C5 tumors showed the most striking depletion of CD4+/CD8+ T cells, TCR richness, and DCs (Figure 1A). Simultaneously, C4/C5 tumors exhibited high ratios of macrophages to CD8+ T cells and M2 (anti-inflammatory) to M1 (pro-inflammatory) macrophages (Figure 1A).
Figure 1.

T cell-depleted tumors and maturation trajectories of human DC vaccines
(A) CIBERSORT deconvolution across TCGA cancer types. Population abundances were row normalized (C1, n = 1,313; C2, n = 1,210, C3, n = 688; C4, n = 222, C5, n = 2; C6, n = 111).
(B) Overall survival of cancer patients’ transcriptome profiled before ICBs treatment (anti-PD-1/CTLA4/PD-L1 ICBs, or combinations thereof) sub-grouped in T cell-depleted C4/C5 tumors (n = 667) and immunogenic C2/C3/C6 tumors (n = 474). Statistics: log rank test.
(C) GISTIC 2.0 analysis with indicated 12 genes. Statistical significance: false discovery rate (FDR) < 0.05 (random permutations to background score distribution, BH adjusted). Bladder cancer, n = 136; breast cancer, n = 880; colorectal adenocarcinomas, n = 585; glioblastoma multiforme, n = 580; head and neck cancer, n = 310; kidney cancer, n = 497; acute myeloid leukemia, n = 200; lung adenocarcinoma, n = 357; lung squamous cell carcinoma, n = 344; ovarian cancer, n = 563; endometrial cancer, n = 496.
(D–J) Single-cell trajectory reconstruction exploration and mapping (STREAM) DC vaccine trajectory of 93 DC vaccines from 18 prostate adenocarcinoma patients vaccinated with five to eight vaccines. (D) Overview of STREAM DC vaccine trajectory. (E and F) Pseudo-time inferred from DC vaccines’ transcriptome based on variable genes. Principal graph initiated with epg_alpha = 0.01, epg_mu = 0.2, epg_lambda = 0.03, and epg_n_nodes = 5. Dots depict individual DC vaccines and dot color represents (E) patient number or (F) DC vaccine batch/cycle (chi-squared test of independence of variables). (G and H) Signature scores overlaid on the graph as streamplots. Type I IFN/ISG-response signature (G) or mature regulatory DC signature (H) were used as color intensity. (I and J) Patient outcomes were overlaid on the graph as streamplots. PSA doubling time at week 48 (I) and intensity of IFNγ production of peripheral blood mononuclear cell after antigen restimulation (J) were used as color intensity. Here, “n” represents different patients (biological replicates). See also Figure S1.
Importantly, in an integrated multi-cancer dataset of 704 patients (spanning five cancer types) treated with ICBs,18 overall survival of patients with C4/C5 tumors was significantly shorter compared to those bearing immunogenic C2/C3/C6 tumors (Figure 1B). This highlighted the suitability of TCGA C4/C5 tumors as transcriptomic representatives of ICB-resistant non-immunogenic tumors, which we will refer to as T cell-depleted tumors.
Next, we investigated transcriptomic anticorrelations between pairs of ligand-receptor, cell-receptor, or cell-ligand in TCGA C4/C5 tumors.18,19 Such inverse correlations, representing immune dysregulation, were visually illustrated by node-to-node connecting arrows in a network (Figure S1A).18,19 TCGA C4/C5 tumors exhibited an inverse correlation between various pairs relevant for danger signaling20 (e.g., the TLR4 and type I interferon [IFN] pathways) (Figure S1A). Next, we pursued copy number variation (CNV) analyses for loci-centric amplification or deletion events of genes short-listed in the aforementioned network in pan-cancer TCGA data.21 This revealed that type I IFN-related genes (IFNA1/2, IFNB1) were under the highest pan-cancer deletion pressures (Figure 1C). Altogether, these data indicated that human T cell-depleted tumors harbor various immune disparities and dysregulated danger signaling.
Type I IFN response distinguishes the most immunogenic and clinically efficacious maturation state of human DC vaccines
Previous clinical trials usually applied DC vaccines stimulated with IFNs (IFNα/β/γ, inducing IFN-stimulated genetic [ISG] response) and/or TLR4-agonists (such as bacterial liposaccharide [LPS]), although with limited success.22 We analyzed the DC vaccine transcriptomes from a clinical trial in which TLR4/IFN-stimulated DC vaccines were used against ICB-resistant (T cell-depleted) tumors. In this trial, 18 prostate cancer patients were treated with six to eight cycles of autologous monocyte-derived DC (moDC) vaccines pulsed with TCRγ alternate reading frame protein (TARP) antigen and stimulated with LPS + IFNγ (Figure 1D).23 The bulk transcriptome of each DC vaccine could be correlated with patient responses (i.e., prostate-specific antigen [PSA] doubling time, as time-to-tumor progression [TTP]) and IFNγ production by TARP antigen-pulsed peripheral blood mononuclear cells (PBMCs). We performed a pseudo-time trajectory analysis24 on transcriptomes of 93 DC vaccines (Figure 1D), revealing that these DC vaccines followed three rather distinct trajectories (T1, T2, or T3) (Figures 1E and 1F). These trajectories distinguished different patients (Figure 1E) but were independent from DC batches/cycles (Figure 1F). Next, we performed a REACTOME pathway enrichment per trajectory and found T1 enriched for type I IFN response and immunogenic/pro-inflammatory signaling (IRF3, IFI44L, MAVS, CCR7, GBP4/5, MX2, RELB, OASL, HLA-DRA, CD40, TNFSF4) (Figures S1B and S1C), T2 enriched for macrophage-like pathways (phagocytosis, scavenger receptor pathway, M2 macrophages; CD68, CXCL1, CXCL12, CCL26, CEACAM3, CCL2, CCR1) (Figures S1B and S1D), and T3 enriched for hyper-maturation and immune-checkpoint signaling (CLEC10A, TLR5, TGFA, SIGLEC6/9/12, CD36, IL12R, IL13RA1, ENTPD1, IL1R1, CMTM6, TNFRSF10B, REL, S1PR1) (Figures S1B and S1E).
T1 might correspond to a specific ISG-response+ DC vaccine subset, T2 a macrophage-like phenotype,14 and T3 a maturation-associated regulatory (mreg)-DC program.14,25 To validate this interpretation, we applied published ISG-response signature (Table S1) and an mregDC-signature (Table S1) to these trajectories.25,26 Indeed, the ISG-response signature was preponderant in T1 (Figure 1G), while the mregDC-signature was most abundant in T3 (Figure 1H).
Next, we aligned these trajectories with tumoral (TTP or PSA doubling time) (Figure 1I) and antigen-specific (PBMC) patient responses (Figure 1J). We found that the T1 trajectory correlated with strong antigen-specific responses and longer TTP, contrasting with T2 and T3 trajectories, which associated to weak antigen-specific responses and a shorter TTP (Figures 1I and 1J). These data suggested that a potential DCvax-IT approach should favor a type I IFN/ISG-responseHIGH state over macrophage-like or mregDC-like states.
Murine TC1 tumors phenocopy immune disparities of human T cell-depleted tumors
To formulate a preclinical DCvax-IT, it appeared necessary to delineate a syngeneic murine tumor model mimicking the major immune-disparities of human T cell-depleted tumors. Therefore, we conducted an analysis of tumor transcriptomes from 11 commonly used (subcutaneous) murine tumor models in immuno-oncology27 (Figure 2A). This involved genetic signatures (Table S1) for pro-lymphocytic IFNγ/effector signaling, macrophages, type I IFN/ISG response, or DCs.27,28 This revealed that the triple-oncogene-driven c-H-Ras+HPV16-E6+HPV16-E7+TC1 tumors29 recapitulated most features of human T cell-depleted tumors (negligible IFNγ/effector signaling, type I IFN/ISG response, and DCs vs. enrichment of the macrophage signature) (Figure 2A).
Figure 2.

Optimization of DCvax-IT for T cell-depleted tumors
(A) Metagene expression for indicated signatures in different subcutaneous tumors (from GEO: GSE85509).
(B) Flow cytometry analysis of CD45+ fraction from subcutaneous MC38/TC1 tumors on day 23 after injection (percentage of CD8+ of CD3+ cells, n = 6; two-tailed Student’s t test).
(C) Tumor volume of TC1-tumor-bearing mice treated with anti-PD-1/CTLA4 on day 9/16 after injection (n = 6; area under curve; one-way ANOVA, Kruskal-Wallis test).
(D) Survival of WT, Ripk3−/−, and Mlkl−/− TC1 cells 24/48 h after treatment (three or four repeats).
(E) Cell death of WT and Mlkl−/− TC1 cells 48 h after treatment. p values depict comparison WT vs. Mlkl−/− TC1 cells (n = 3; two-way ANOVA, Sidak’s multiple comparisons test).
(F) Schematic overview of the vaccine formulation process.
(G and H) Functional analysis of DCs untreated or stimulated with LPS, IFNβ, or with untreated or dying TC1s (with/without IFNβ). (G) Flow cytometry of DC maturation (MHCII+ CD86+ frequency of CD11c+). p values depict comparison vs. UT DCs (n = 3; one-way ANOVA, Dunnett’s multiple comparisons test). (H) IFN-signature expression (qPCR). p values depict comparison vs. UT DCs (n = 3; one sample t test).
(I) Flow cytometry of frequency of PD-L1+PD-L2+CD200+ of CD11c+ cells (moDCs alone/cocultured with untreated/dying WT/Mlkl−/− TC1 cells). p values depict comparison vs. UT moDCs (n = 4, LPS/IFNβ n = 3; one-way ANOVA, Fischer least significant difference [LSD]).
(J) Flow cytometry of frequency of CD11b+F4/80+ in moDCs (alone/cocultured with untreated/dying WT/Mlkl−/− TC1 cells) or bone-marrow-derived macrophages (BMDMs). p values depict comparison vs. BMDMs (n = 3; one-way ANOVA, Dunnett’s multiple comparisons test).
(K) Cytokine secretion via cytokine array. From all values, the background was subtracted. Normalization was done using moDCs + untreated cancer cells (n = 3). Here, “n” represents biological replicates and error bars represent SEM. See also Figures S2 and S3.
Next, we pursued tumor immunophenotyping to validate the choice of TC1 tumors and selected the immunogenic MC38 tumors30 for comparison (Figure 2A). Compared to MC38 tumors, TC1 tumors had significantly lower CD8+CD3+ T cell infiltrates (Figure 2B), lower CD8+ T cell-to-TAMs (CD11b+F4/80+) ratio (Figure S2A), and a higher CD8+ T cell death (Figure S2B). This was further supported by TC1 tumors being non-responsive to PD-1/cytotoxic T lymphocyte-associated protein (CTLA)-4 blockade, or a combination thereof (Figure 2C). Finally, in line with defective type I IFN/TLR danger signaling in human C4/C5 tumors, TC1 cancer cells failed to secrete IFNα/β upon stimulation with agonists of TLR4 (LPS), TLR7 (imiquimod), RIG-I (5′ppp-dsRNA), STING/cGAS (2′3′cGAMP), and immunogenic (doxorubicin) or non-immunogenic (cisplatin) chemotherapy (Figures S2C and S2D). This underscored the suitability of TC1 tumors as preclinical representatives of human T cell-depleted C4/C5 tumors.
TC1-cells undergo apoptotic or necroptotic immunogenic cell death with antigen release
We explored the possibility of providing damage-associated molecular pattern (DAMP)-based danger signaling and antigen-release-based DC pulsing via immunogenic cell death (ICD).10,15 ICD is well established to potentiate anticancer DC vaccines.31 However, it is currently debatable which underlying cell death pathway (i.e., apoptotic vs. necroptotic) has the strongest potentiating effect.32
To distinguish apoptosis vs. necroptosis, we utilized death receptor-driven necroptotic (combination of tumor necrosis factor [TNF]/TRAIL, BV6, and zVAD-fmk) vs. apoptotic stimuli (combination of TNF/TRAIL and BV6).33,34 TNF or TRAIL were comparatively used to account for their distinct pro-inflammatory activity.35 The death of wild-type (WT) TC1 cells in response to necroptotic stimuli was avoided by RIPK1 inhibitor, Nec1s.36 WT TC1 cells did not respond to apoptotic stimuli (Figure 2D). To overcome this, we used CRISPR-Cas9-driven knockout of two necroptosis regulators (i.e., Ripk3 or Mlkl) (Figures S2E and S2F).34 Ripk3−/−TC1 cells were resistant to both necroptotic and apoptotic stimuli (Figure 2D). Instead, Mlkl−/− TC1 cells showed resistance to necroptotic but susceptibility to apoptotic stimuli (Figure 2D). WT TC1 cells underwent necroptotic cell death (Figure 2E) based on the following findings: the absence of caspase-3/7 activity (Figure S2G), non-sustained annexin V staining (Figures S2H and S2I), and phosphorylation of MLKL (Figures S2L and S2M) (hereafter referred to as necroptoticTC1). Conversely, Mlkl−/− TC1 cells underwent apoptotic cell death (Figure 2E) as indicated by significant caspase-3/7 activity (Figure S2G), sustained annexin V staining (Figures S2J and S2K), and the absence of MLKL phosphorylation (Figures S2L and S2M) (hereafter referred to as apoptoticTC1). We did not explicitly use Casp8−/− TC1 cells as necroptotic system because Casp8−/− or Casp8−/−Casp9−/− (but not Casp9−/−) TC1 cells (Figure S2N) underwent Nec1s-inhibitable cell death upon apoptotic stimuli (Figure S2O), thereby making the latter redundant.
Finally, we analyzed the ICD-like DAMP-profiles.32 Both apoptoticTC1 and necroptoticTC1 showed surface-calreticulinHIGH CD47LOW cells (Figure S2P), as well as the release of ATP (Figures S2Q and S2R), HMGB1 (Figure S2S), and the TC1-specific E7 antigen (Figure S2S). Thus, TC1 cells showed proficient DAMP-based apoptotic/necroptotic ICD coupled with antigen release.
DCvax-IT co-integrating ICD and IFNβ stimulation favor type I IFN responses over macrophage-like or mregDC-like phenotypes
We based our DC vaccines on bone-marrow-derived moDCs (Figure 2F). We compared different types of IFN (IFNα/β/γ)37 for their potential to induce DC maturation (MHC-II+CD86+CD11c+) (for flow cytometry gating strategy, see Dataset S1) and secretion of the ISG-factor CXCL10. LPS served as a positive control. IFNβ induced the most pronounced DC maturation (Figure S2T) and CXCL10 secretion (Figure S2U). We selected 2.5 ng/mL IFNβ for the rest of the study since it achieved sufficient maturation, CXCL10 release and upregulated several ISGs in DCs: Irf7, Rsad, Mx1, Cxcl9, or Cxcl10 (Figure S2V).
We pulsed moDCs with apoptotic/necroptoticTC1, with or without IFNβ-stimulation (Figure 2F), and checked for successful pulsing (efferocytosis of apoptotic/necroptoticTC1 by DCs), DC maturation, bulk IFN/ISG-response genetic signature, macrophage-like/mregDC-like phenotype, and increase in CCR7+DCs (necessary for LN homing). After pulsing with apoptoticTC1, we already saw promising DC stimulation (i.e., efferocytosis of TC1 cells) (Figure S3A) and DC maturation (Figure 2G), which was further enhanced by IFNβ (Figures 2G and S3B). Costimulation with IFNβ was useful for necroptoticTC1 since it outperformed DC maturation by necroptoticTC1 alone (Figures 2G, S3C, and S3D). Also, the combination of ICD and IFNβ increased CCR7+ DCs (Figures S3E and S3F).
Next, to confirm type I IFN/ISG response, we investigated the induction of the ISG-signature (metagene for Irf7, Rsad, Mx1, Cxcl9, and Cxcl10) in cocultures of DC + TC1 + IFNβ. The IFNβ-induced ISG response was either maintained or potentiated in the cocultures (Figure 2H). Moreover, TNF-elicited apoptosis/necroptosis was better at preserving or potentiating ISG response than TRAIL-induced cell death (Figure 2H). Altogether, these data drove us to prioritize cocultures of DCs, TNF-driven apoptosis/necroptosis, and IFNβ for the DCvax-IT formulation. We checked for the presence of macrophages-like (CD11b+F4/80+) and mregDCs-like (programmed death-ligand 1 [PD-L1]+PD-L2+CD200+CD11c+25) phenotypes (for flow cytometry gating strategy, see Dataset S1) in DCvax-IT. LPS stimulation alone favored the acquisition of mregDC-like phenotype (Figure 2I). However, the presence of dead cancer cells avoided the mregDC-like phenotype (Figure 2I). Moreover, compared to bone-marrow-derived macrophages, apoptoticTC1/necroptoticTC1 DCvax-IT contained few CD11b+F4/80+ macrophages (Figure 2J).
Finally, we explored the DCvax-IT secretome using an antibody array combined with gene-set enrichment analysis (GSEA)-based Gene Ontology biological pathway analyses. The secretome of necroptoticTC1 + DCs was more inflammatory than that of apoptoticTC1 + DCs (Figures 2K, S3G, and S3H). Costimulation with IFNβ strongly induced an array of pro-inflammatory cytokines (Figures 2K, S3I, and S3K) with the notable exception of IFNγ (Figure 2K). Thus, our preclinical DCvax-IT resembled the human DC vaccines with an immunogenic trajectory.
Type I IFN response distinguishes the most immunogenic DC vaccine in vivo
Next, we wondered whether the trajectories of DC vaccines can be validated in vivo. Three distinct mouse DC preparations were conceived to recapitulate human DC vaccine trajectories, i.e., the ISG-response+ DC vaccine (DCs stimulated with IFNβ), mregDC-like vaccine (DCs stimulated with LPS), and a macrophage-like vaccine (monocytes differentiated with M-CSF + IL4). These preparations were pulsed with antigenic peptides from TC1 cells (E6/E7 peptides) and prophylactically injected into mice to elicit an immune response that protects against later rechallenge with TC1 cells. PBS injection was used as a negative control. The ISG-response+ DC vaccine significantly protected from tumor challenge (compared to PBS treatment) (Figure 3A). By comparison, mregDC-like vaccine protected fewer mice from tumor challenge and macrophage-like vaccine completely failed to confer immune protection (Figure 3A). Thus, DC vaccines favoring a type I IFN/ISG-responseHIGH state have the highest immunogenic potential.
Figure 3.

DCvax-IT fails against T cell-depleted tumors in a curative setup
(A–C) Tumor-free survival of mice vaccinated with two prophylactic DC vaccines (day 0/7), followed by subcutaneous TC1 challenge. p values depict comparison vs. PBS-treated mice. (A) Comparison of indicated DC vaccines to PBS-treated mice (PBS, n = 5; all vaccines; n = 5, log rank, Mantel-Cox test). (B) Comparison of indicated DC vaccines to PBS-treated mice (PBS, n = 9; necroptotic/apoptotic DCvax-IT, n = 6; pro-inflammatory cytokine/hyper-inflammatory DC vaccines, n = 5, log rank [Mantel-Cox] test). (C) Comparison of indicated DC vaccines to PBS-treated mice (PBS, n = 6; apoptosis/necroptosis DCvax-IT, n = 5, log rank [Mantel-Cox] test).
(D) TC1-tumor-bearing mice treated with DCvax-IT (day 9/16 after injection). Comparison to PBS-treated mice (n = 12, area under curve; Kruskal-Wallis test).
(E and F) Flow cytometry analysis of CD45+ fraction from untreated/DCvax-IT-treated TC1 tumors (day 23 after tumor injection). Frequency of (E) CD8+ T cells or (F) CD8+ T cells to TAM ratio. Comparison to PBS-treated mice (UT, n = 3; necroptosis DCvax-IT, n = 4; apoptosis DCvax-IT, n = 3, one-way ANOVA, Dunnett’s multiple comparisons test).
(G) Frequency of Celltracker CM-Dil+CD11c+ cells in LNs of vaccinated mice. p values depict comparison vs. PBS-treated mice (UT, n = 4, necroptosis/apoptosis DCvax-IT, n = 6, one-way ANOVA, Kruskal-Wallis test).
(H) TC1-tumor-bearing mice treated with cisplatin (day 9/16) alone or in combination with DCvax-IT (day 11/18) and after TC1-injection. p values depict comparison vs. cisplatin-treated mice (n = 8; area under curve, one-way ANOVA, Dunnett’s multiple comparisons test).
(I) MC38-tumor-bearing mice treated with DCvax-IT (day 9/16) after MC38-injection. p values vs. PBS-treated mice (PBS, n = 8; apoptosis DCvax-IT, n = 10, area under curve, Mann-Whitney test). Here, “n” represents biological replicates and error bars represent SEM. See also Figure S3.
DCvax-IT induces type I IFN sensing-dependent anticancer immunity in vivo
Next, we assessed the immunogenicity of DCvax-IT in the prophylactic setting (Figure 3B). Two injections with both apoptoticTC1/necroptoticTC1 DCvax-IT efficiently protected mice from tumor challenge within 1 week (Figure 3B) and tumor-free mice also resisted a second rechallenge with TC1 cancer cells (Figure S3L). This in vivo immunogenicity of DCvax-IT was superior to some other frequently used maturation formulations of DC vaccines (Figure 3B), namely, pro-inflammatory cytokine-based DC vaccines (DCs co-stimulated with IL1β, IL6, PGE2, and TNF)38,39,40,41 or hyperinflammatory DC vaccines (DCs co-stimulated with LPS and IFNγ).42,43,44,45,46
Next, we wondered if type I IFN sensing via receptor complex of IFNAR1::IFNAR2 on DCs was necessary for the induction of anticancer immunity. Hence, we re-tested apoptoticTC1/necroptoticTC1 DCvax-IT with Ifnar1−/− DCs. Efferocytosis of apoptoticTC1/necroptoticTC1 by Ifnar1−/− DCs was efficient (Figures S3M and S3N) but Ifnar1−/− DC maturation was not proficient (Figure S3O). Accordingly, mice vaccinated with Ifnar1−/− DCs-based DCvax-IT failed to resist tumor challenge (Figure 3C). In conclusion, DCvax-IT efficiently induced anticancer immunity in a fashion that relied on the ability of the DC to sense IFNβ.
Curative DCvax-IT fails against T cell-depleted tumors but acts against T cell-infiltrated tumors
We evaluated DCvax-IT in a therapeutic setting, in mice bearing TC1 tumors (Figure 3D). However DCvax-IT failed to slow down the growth of TC1 tumors (Figure 3D), to increase CD8+ T cell infiltration (Figure 3E), or to shift the CD8+ T cell-to-TAM ratio (Figure 3F).
We wondered whether DCvax-IT failed to reach the tumor-draining LN, because moDCs exhibit limited LN-homing,10 particularly with preexisting tumors.47,48 Hence, we fluorescently labeled the DCvax-IT with CellTracker CM-DiI and injected them into mice to evaluate their accumulation in inguinal/axillary LNs draining the subcutaneous injection site (Figure 3G). There was significant LN-enrichment of CM-DiI+ DCvax-IT (Figure 3G), which was similar in tumor-free and TC1-tumor-bearing mice (Figure S3P). Moreover, the LN-enriched CM-DiI+ DCvax-IT retained their IFN response in vivo, as suggested by high phosphorylated-signal transducer and activator of transcription 1 (STAT1),49 which exceeded that found in CM-DiINEGATIVE DCs (Figure S3Q).
Next, we investigated if TC1 tumors can be overcome by combinatorial chemotherapy. However combining DCvax-IT with cisplatin, a chemotherapy with immunotherapy-synergizing properties in TC1 tumors,7,50 did not add therapeutic efficacy (Figure 3H).
We investigated the possibility that the non-immunogenicity of TC1 tumors could explain their resistance to DCvax-IT. Hence, we therapeutically applied DCvax-IT against the T cell-enriched MC38 tumors, which are responsive to ICBs (Figure S3R). We focused on apoptoticMC38 DCvax-IT because MC38 cells were only susceptible to apoptosis (Figures S3S and S3T).51 Here, we observed that DCs efficiently executed efferocytosis (Figures S3U and S3V) and phenotypically matured (Figure S3W) when exposed to apoptoticMC38 plus IFNβ. Interestingly, apoptoticMC38 DCvax-IT significantly reduced MC38-tumor growth (Figure 3I). Thus, despite the high immunogenicity and proficient LN-homing abilities of DCvax-IT, T cell-depleted (but not T cell-infiltrated) tumors were resistant to DCvax-IT.
TC1 tumors preferentially accumulate anti-inflammatory PD-L1+ TAMs
To improve the efficacy of DCvax-IT, it appeared critical to identify the dominant immunoresistance pathway operating in TC1 tumors. Differential gene expression (DGE) analyses comparing the bulk transcriptomes of TC1 and MC38 tumors (Figure 2A) indicated that TC1 tumors preferentially expressed genes embedded in anti-inflammatory pathways relevant to myeloid cells and TAMs (Figure 4A; Table S2).52 To confirm this at single-cell resolution, we accessed published single-cell RNA sequencing (scRNA-seq) data of TC1 tumors53 (Figure 4B). Here, we pursued a cell-to-cell interaction with CellChat.54 TAMs established the densest interactions with all other tumoral immune/stromal cells, as indicated by the broadest width of connecting nodes (Figure 4C). Immunophenotyping confirmed that, as compared to MC38 tumors, TC1 tumors contained a higher M2-to-M1 TAM ratio (Figure S4A) and low M1-like MHC-IIHIGHCD206LOW TAMs (Figure S4B). Also, TC1 tumors contained more TAMs than DCs (Figure S4C).
Figure 4.

TC1 tumors enrich CD8+ T cell-suppressive PD-L1+ macrophages
(A) Volcano plot of gene expression between MC38 and TC1 tumors (GEO: GSE85509).
(B) Uniform manifold approximation and projection (UMAP) of untreated TC-1 tumor scRNA-seq data (GSM7103827).
(C) Inferred cell-cell communication by CellChat from dataset in (B) (bandwidth indicates intensity of cell-to-cell communication).
(D) Macrophages as density over expression of indicate gene levels from dataset in (B).
(E) CD45+ cell fraction from TC1 tumors (day 23 after injection). Frequency of TAMs (n = 6; two-tailed paired t test).
(F) Flow cytometry analysis of PD-L1+, CSF1R+, CD206+ (gating on unstained samples) on TAM from TC1 tumors isolated on day 23 post injection.
(G) UMAP of TC1-tumor scRNA-seq data indicating normalized Cd274 expression (log1p-transformed reads per 10,000).
(H–J) Flow cytometry of T cell recovery after cocultures with TAMs from TC1 tumors (day 23 post injection), pre-incubated with/without anti-PD-L1 for 48 h, together with paired spleen-derived T cells. (H) TAM/T cell coculture experimental setup. (I and J) Frequency of (I) CD8+ T cells and (J) CD4+ T cells (n = 3; two-tailed paired t test).
(K) Relative information flow (CellChat) of Cd274+ and Cd274− macrophages (1,006 cells) from dataset in (B).
(L) TNF, TRAIL, FASLG expression of indicated TAMs from TC1 tumors (isolated on day 23 post injection) (n = 5; two-way ANOVA; Sidak’s multiple comparisons test).
(M) Flow cytometry analysis of live T cell recovery, as per experimental setup in (H) and (J) but pre-incubated with/without anti-TNF/anti-TRAIL for 48 h, together with paired spleen-derived T cells (n = 5; two-way ANOVA).
(N) Flow cytometry analysis of Efluor 780+ dead/dying cell in untreated/anti-PD-L1-treated TC1-derived TAMs (isolated on day 23 post injection) (n = 4; two-tailed paired t test).
(O) DGE of Cd274+ macrophages (blue) vs. Cd274− macrophages (red) from dataset in (B). The x axis: log2 fold change of PD-L1+ to PD-L1−. Size of circles: −log10-transformed p values.
(P) Percentage TAM survival from TC1 tumors (day 23 post injection) treated with different inhibitors (n = 4; one-way ANOVA; Dunnett’s multiple comparisons test). Here, “n” represents biological replicates. See also Figure S4.
Several TAM-associated targets are currently explored as potential therapeutic targets; e.g., CSF1R, CCR2, CX3CR1, SIRPA, TIE2 (Tek), PD-L1 (Cd274), PD-L2 (Pdcd1lg2), CD40, IDO1, and PD-1 (Pdcd1).6,8,52 To prioritize among these, we used the differential TC1-specific myeloid genes (Figure 4A) as input for a correlation GSEA against a reference murine macrophage transcriptome.55 This predicted Csf1r, Cd274, Cd40, Tek, and Pdcd1lg2 as the top five targets (Figure S4D). On the scRNA-seq level, TC1-tumor-infiltrating TAMs most highly expressed Csf1r, followed by Cd274 (Figure 4D). Tumor immunophenotyping emphasized that TC1 tumors were dominated by immunoregulatory (MHC-IILOW) TAMs expressing significant PD-L1 (PD-LI+MHC-IILOW) rather than CSF1R (CSF1R+MHC-IILOW) (Figure 4E). In TC1 tumors, PD-LI+MHC-IILOW TAMs were strongly enriched and were distinct from CSF1R+MHC-IILOW TAMs or the standard M2-like CD206+MHC-IILOW TAMs (Figure 4F). Such distinct PD-L1+ TAMs were also observed in LLC tumors (another T cell-depleted tumor) (Figure S4E). Of note, most of the Cd274 originate from TAMs (Figure 4G) and accordingly there were more PD-L1+ TAMs than PD-L1+ DCs/cDC1/cDC2 (Figure S4F). Moreover, Cd274+ TAMs exhibited stronger interactions than Cd274− TAMs, reflecting higher activity (Figure S4G). Thus, TC1 tumors enrich M2-like PD-L1+ TAMs.
PD-L1+ TAMs limit CD8+ T cell responses via TRAIL signaling
PD-L1+ TAMs can limit T cell responses through a thus-far elusive mechanism.56 We isolated TAMs from TC1 tumors and splenic lymphocytes from the same mice and cocultured them with or without PD-L1 blockade (Figure 4H). The presence of TAMs reduced the recovery of live CD8+/CD4+ T cells, and PD-L1 blockade partially but significantly improved the recovery of live T lymphocytes (Figues 4I and 4J). This phenotype was PD-L1 specific, rather than dependent on PD-L1 and PD-1 interactions,57 because PD-1 blockade failed to increase T cell recovery (Figures S4H and S4I).
To understand the mechanism behind this, we interrogated the TC1-tumor scRNA-seq data for death receptor ligands within cell-to-cell interaction networks (Cd274+ TAMs vs. Cd274− TAMs). This analysis indeed indicated the presence of such ligands (Tnf, Tweak, and fatty acid synthase ligand [Faslg]) in Cd274+ TAMs (Figure 4K). Such extrinsic ligands are well established to limit CD8+ T cells.58,59 Flow cytometric analysis revealed that PD-L1+ TAMs contained higher levels of TNF/TRAIL (but not FASLG) than PD-L1− TAMs, (Figure 4L). Importantly in TAM:T cell cocultures, the blockade of TRAIL, but not TNF, rescued the recovery of CD8+T cells (Figure 4M). This suggested that PD-L1+ TAMs limit CD8+ T cell responses via TRAIL signaling.
PD-L1 blockade reduces accumulation of PD-L1+ TAMs
We wondered how PD-L1 blockade antagonized TAMs to allow recovery of T cells.60,61 PD-L1 blockade did not significantly affect the M2-like (MHC-IILOWCD206HIGH) vs. M1-like (MHC-IIHIGHCD206LOW) ratio in bone-marrow-derived macrophages (Figure S4J) or TAMs (Figure S4K). PD-L1 reportedly facilitates various pro-survival pathways.60,61,62,63,64 Accordingly, a substantial fraction of TAMs died upon PD-L1 blockade (Figure 4N). Our scRNA-seq analysis of TC1 tumors found that Cd274+ TAMs expressed various pro-survival genes (Nfkbia, Rel, Socs3, Junb, Fos, Nfkb1, Map4k4, Mapk6) (Figure 4O).60,61,62,63,64 Remarkably, an ex vivo screening of TC1-tumoral TAMs with pharmacological inhibitors of nuclear factor κB (NF-κB), Janus kinase (JAK)/STAT, extracellular signal-regulated kinase (ERK), or phosphatidylinositol 3-kinase (PI3K) highlighted that NF-κB inhibition most proficiently reduced TAM survival (Figure 4P). Hence, we wondered if PD-L1 blockade was modulating the NF-κB pathway in macrophages. Hence, we used a J774 macrophage reporter system for NF-κB signaling. Indeed, PD-L1 blockade suppressed LPS-driven NF-κB activation (Figure S4L). Thus, PD-L1 blockade reduces PD-L1+ TAM survival.
DCvax-IT and PD-L1 blockade together suppress TC1 tumors by overcoming TAMs
We evaluated whether treating TC1 tumors with PD-L1 blockade can suppress tumor growth irrespective of DCvax-IT (Figure 5A). PD-L1 blockade indeed slightly (but not significantly) suppressed TC1-tumor growth (Figure 5A). In contrast, the combination of PD-L1 blockade with apoptoticTC1/necroptoticTC1 DCvax-IT significantly reduced TC1-tumor growth (Figure 5A). This synergistic anti-tumor effect was also found in LLC tumors (Figure S4M).
Figure 5.

DCvax-IT-mobilized PD-L1+ macrophages in LNs are blunted by DCvax-IT and anti-PD-L1 ICB
(A) TC1-tumor-bearing mice treated with DCvax-IT (day 9/6) and/or anti-PD-L1 (day 10/17). p values depict comparison vs. PBS-treated mice (PBS, n = 12; apoptosis/necroptosis DCvax-IT + anti-PD-L1, n = 12; area under curve, one-way ANOVA Kruskal-Wallis test).
(B) TC1-tumor-bearing mice treated with DCvax-IT (day 9/16) and/or anti-PD-L1 (day 10/17) in combination with clodronate liposomes (CLs). p values depict comparison vs. CL-treated mice (CL/apoptosis DCvax-IT/necroptosis DCvax-IT, n = 5; anti-PD-L1/apoptosis DCvax-IT + anti-PD-L1/necroptosis DCvax-IT + anti-PD-L1, n = 6; area under curve, one-way ANOVA, Dunnett’s multiple comparisons test).
(C–H) Lymph node analysis of TC1-tumor-bearing mice, 3 days post treatment with DCvax-IT (with/without anti-PD-L1). (C) Frequency of PD-L1+ of CD11b+F4/80+ cells. p values depict comparison vs. PBS-treated mice unless otherwise specified (n = 3–4; unpaired t test). (D) Frequency of M1 (MHC-IIHIGHCD206LOW), M2 (MHC-IILOWCD206HIGH), or M0 (MHC-IILOWCD206LOW) macrophages. ∗p values depict comparison vs. M0 from PBS-treated mice. $p values depict comparison vs. M1 from PBS-treated mice (n = 6; two-tailed Student’s t test). (E) IFNγ+CD8+ T cells-to-TAMs ratio. p values depict comparison vs. PBS-treated mice (PBS/apoptosis DCvax-IT + anti-PD-L1, n = 3; anti-PD-L1/apoptosis DCvax-IT/necroptosis DCvax-IT + anti-PD-L1, n = 4, one-way ANOVA, Fischer’s LSD test). (F) IFNγ+CD4+ T cells-to-TAMs ratio. p values depict comparison vs. PBS-treated mice (PBS, n = 3; anti-PD-L1/apoptosis DCvax-IT/apoptosis DCvax-IT + anti-PD-L1/necroptosis DCvax-IT + anti-PD-L1, n = 4, one-way ANOVA, Fischer’s LSD test). (G) IL2+CD8+ T cells-to-TAMs ratio. p values depict comparison vs. PBS-treated mice (biological replicates; PBS/apoptosis DCvax-IT + anti-PD-L1, n = 3; anti-PD-L1/apoptosis DCvax-IT/necroptosis DCvax-IT + anti-PD-L1, n = 4, one-way ANOVA, Fischer’s LSD test). (H) IL2+CD4+ T cells-to-TAMs ratio. p values depict comparison to PBS-treated mice (PBS, n = 3; anti-PD-L1/apoptosis DCvax-IT/apoptosis DCvax-IT + anti-PD-L1/necroptosis DCvax-IT + anti-PD-L1, n = 4, one-way ANOVA, Fischer’s LSD test).
(I and J) Frequency of PD-L1+ cells of CD11b+ F4/80+ cells after coculturing BMDMs with (I) WT or (J) Ifnar1−/− DCvax-IT for 48 h. p values depict comparison vs. untreated DCs (n = 3; one-way ANOVA, Dunnett’s multiple comparisons test).
(K and L) TC1-tumor-bearing mice treated with (K) Ccr7−/− (L) or Ifnar1−/− DCvax-IT (day 9/16) and with anti-PD-L1 (day 10/17). p values depict comparison vs. PBS-treated mice (n = 6; area under curve; one-way ANOVA, Kruskal-Wallis test). Here, “n” represents biological replicates and error bars represent SEM. See Figures S4 and S5.
Since the TAM modulation via PD-L1 was independent of PD-1, and more dominant than CSF1R, we combined PD-1 or CSF1R blockade with DCvax-IT. Unlike PD-L1 blockade (Figure 5A), neither PD-1 (Figure S4N) nor CSF1R (Figure S4O) blockade could synergize with DCvax-IT. Of note, CSF1R blockade did not suppress TC1-tumor growth despite achieving significant depletion of CSF1R+ TAMs (Figure S4P), although without disturbing the general TAM compartment (Figure S4Q).
The results positioned PD-L1+ macrophages as the key immuno-resistance barrier to DCvax-IT. To explore this conjecture, we depleted the macrophages with clodronate liposomes (CLs) (Figure 5B)65 CL was used at a carefully titrated dose that depleted macrophages (Figure S4R) but not DCs (Figure S4S). CL based macrophage depletion non-significantly reduced the therapeutic response to PD-L1 blockade (Figure S4T). However, macrophage depletion was sufficient to significantly enhance the anti-tumor effect of DCvax-IT (Figure 5B). This combinatorial synergism between CL and DCvax-IT could not be further improved by PD-L1 blockade (Figure 5B).
Accordingly, under macrophage depletion, DCvax-IT boosted the intra-tumoral infiltration of CD8+ T cells (Figure S4U). This stimulus to CD8+ T cell infiltration was not further potentiated by PD-L1 blockade (Figure S4U). Of note, these data were not confounded by anti-PD-L1 antibody-driven Fc receptor crosslinking and NK cell-mediated antibody dependent cellular cytotoxicity66 because depletion of NK cells via anti-NK1.1 antibody67 (Figure S4V) or usage of anti-PD-L1 antibody engineered to possess a D265A mutation that minimizes its binding to Fc receptors68 (Figure S4W) did not disrupt the synergism between PD-L1 blockade and DCvax-IT. In conclusion, DCvax-IT plus PD-L1 blockade suppressed TC1 tumors by antagonizing TAMs.
DCvax-IT induces PD-L1+ macrophages in LNs and simultaneous PD-L1 blockade blunts them
Modus operandi of DC vaccines involves anti-tumor priming of LN T cells.10,15,69 However, little is known about their impact on LN-associated macrophages (LAMs). Since DCvax-IT showed good LN homing, we investigated whether they might induce PD-L1+ LAMs. We immunophenotyped the inguinal/axillary LNs of tumor-bearing mice (Figure 5C). While DCvax-IT did not directly cause a mobilization of macrophages (Figure S5A) or cDC1/cDC2 (Figures S5B and S5C) in LNs, it did induce an enrichment of PD-L1+ LAMs (Figure 5C). Here, for immunophenotyping, we used a PD-L1 antibody recognizing another non-overlapping epitope than the therapeutic anti-PD-L1 antibody. A similar expansion was not observed for CSF1R+ LAMs (Figure S5D), PD-L1+cDC1/cDC2 (Figures S5E and S5F). However, DCvax-IT plus PD-L1 blockade strongly reduced the accumulation of not only PD-L1+ LAMs (Figure 5C) but also macrophages (Figure S5A), cDC1/cDC2 (Figures S5B and S5C), CSF1R+ LAMs (Figure S5D), and PD-L1+cDC1/cDC2 (Figures S5E and S5F). The reduction of PD-L1+ LAMs was observed at both percentages and absolute counts (Figure S5G). PD-L1 blockade plus DCvax-IT caused significant reduction in both M1-like/M2-like LAMs thereby “re-wiring” the compartment toward M0-like phenotype (MHC-IILOWCD206LOW) (Figure 5D). There was no clear increase in phenotypic-maturation of cDC1/cDC2 (Figures S5H and S5I). PD-L1+ LAM enrichment also happened after vaccination with other DC preparations (especially the pro-inflammatory cytokine-based preparations) but not after PD-1 blockade (Figure S5J). DCvax-IT-induced increase in PD-L1+ LAMs was also confirmed for LLC tumors (Figure S5K) but not for MC38 tumors (Figure S5L). Furthermore, combination with PD-L1 blockade prevented the accumulation of these LAMs in LLC tumors (Figure S5K).
Next, we analyzed the LN-associated T cells. None of the treatments caused an increase in CD4+/CD8+ T cells (Figures S5M and S5N). DCvax-IT or PD-L1 blockade alone did not increase IFNγ+CD4+/CD8+ T cells (Figures 5E and 5F) or IL2+CD4+/CD8+ T cells (Figures 5G and 5H). However, DCvax-IT plus PD-L1 blockade strongly mobilized IFNγ+CD4+/CD8+ T cells (Figures 5E and 5F) and IL2+CD4+/CD8+ T cells in LN (Figures 5G and 5H).
Subsequently, we wondered whether DCvax-IT was directly inducing PD-L1 on macrophages. Coculturing macrophages with DCvax-IT resulted in more PD-L1+ macrophages (Figure 5I) but not CSF1R+ macrophages (Figure S5O). Since DCvax-IT secreted several type I IFN/ISG-response-driven cytokines (Figure 2K) that can induce PD-L1,61,70 we ablated this pathway via Ifnar1−/− DCvax-IT. Ifnar1−/− DCvax-IT failed to induce PD-L1 on macrophages (Figure 5J). In contrast to WT DCvax-IT, Ccr7−/− DCvax-IT (Figure 5K) or Ifnar1−/− DCvax-IT (Figure 5L) failed to synergize with PD-L1 blockade to mediate TC1-tumor reduction. This confirmed that DCvax-IT induces PD-L1+ LAMs, which limits effector CD4+/CD8+ T cells, thus creating an immuno-resistant macrophage niche.
DCvax-IT mobilizes PD-L1+ TAMs and combination with anti-PD-L1 ICB blunts them to promote anti-tumor T cell immunity
We wondered whether DCvax-IT also enhanced PD-L1+ TAMs to weaken anti-tumor T cells. Indeed, DCvax-IT caused a significant enrichment of TAMs (Figure 6A) and PD-L1+ TAMs (Figure 6B). Accordingly, DCvax-IT plus PD-L1 blockade prevented the accumulation of TAMs (Figure 6A) and PD-L1+ TAMs (Figure 6B). This reduction was detected for both relative and absolute counts (Figure S6A). An increase in the CD8+ T cell-to-TAM ratio was also observed (Figure 6C). Moreover, ELISA-based analysis of TAM lysates confirmed that combinatorial PD-L1 blockade caused a reduction of PD-L1 protein (Figure S6B). We did not see any differences in the abundance of DCs, cDC1/cDC2, PD-L1+cDC1/cDC2 (Figures S6C–S6G), or their phenotypic maturation (Figures S6H–S6J). Similarly, there was no increase in PD-L1+ fibroblasts (Figure S6K), PD-L1+ endothelial cells (Figure S6L), or other tumoral cells (Figure S6M). Also, TC1 cancer cells did not express PD-L1/PD-L2 (Figure S6N). The DCvax-IT-induced increase in PD-L1+ TAMs was cross-confirmed in LLC tumors (Figure S6O) but not MC38 tumors (Figure S6P). Expectedly, in DCvax-IT-treated LLC tumors, PD-L1 blockade blunted PD-L1+ TAMs (Figure S6O). This emphasized the immunosuppressive relevance of PD-L1+ TAMs.
Figure 6.

DCvax-IT-mobilized PD-L1+ macrophages in tumors are blunted by DCvax-IT and anti-PD-L1 ICB
(A–C) Tumor infiltrating leukocyte (TIL) analysis of CD45+ fraction from TC1 tumors (isolated on day 23 post injection) treated with DCvax-IT (day 9/16) and/or anti-PD-L1 (day 10/17). (A) Percentage of TAMs (CD11b+F4/80+), (B) percentage of PD-L1+ TAMs, (C) CD8+-to-TAM ratio. (A–C) p values depict comparison vs. PBS-treated mice unless otherwise specified (n = 3–9; Mann-Whitney test).
(D–K) TIL analysis of CD45+ fraction from TC1 tumor (day 23 post injection) treated with DCvax-IT (day 9/16) with/without anti-PD-L1 (day 10/17). Normalized by tumor-weight. (D) CD8+ T cells-to-TAM ratio. (E) Th1-to-Th2 ratio. (F) KI67+CD8+-to-dead CD8+ ratio. (G) IFNγ+CD8+ T cells. (H) IL2+CD8+ T cells. (I) CD127+CD62−CD8+ T cells. (J) CD107a+CD8+ T cells. (K) TCF+CD8+ cells. (D, E, F, and I–K) p values depict comparison vs. PBS-treated mice unless otherwise specified (n = 3–5; Mann-Whitney test). (G and H) p values depict comparison vs. PBS-treated mice unless otherwise specified (n = 3–4; one-way ANOVA, Kruskal-Wallis test).
(L–N) TC1-tumor-bearing mice treated with DCvax-IT (day 9/11), with anti-PD-L1 (day 10/11) and with anti-CD8 1 day pre-injection and every other day until 500 mm3. p values depict comparison vs. PBS-treated mice unless otherwise specified. (M) %MHCIIlowCD206high of CD11b+F4/80+ in CD45+ fraction from TC1 tumor (day 23 post injection) (n = 3; two-tailed Student’s test). (N) Tumor volume curve (n = 7; area under curve; one-way ANOVA, Kruskal-Wallis test).
(O) TC1-tumor-bearing mice treated with DCvax-IT (day 9/16) and/or anti-PD-L1 ICB (day 10/17) in combination with anti-IFNγ antibody (day 8, 12, 15, 19, 22). p values depict comparison vs. PBS-treated mice (n = 4, area under curve, one-way ANOVA). Here, “n” represents biological replicates and error bars represent SEM. See also Figure S6.
Consequently, only DCvax-IT plus PD-L1 blockade caused a significant augmentation of CD8+ T cells (Figure 6D). In contrast, all conditions caused a non-significant increase in CD4+ T cell infiltrates (Figure S7A). Similarly, only the combinatorial regimen skewed the tumoral milieu toward higher Th1-to-Th1 ratio (Figure 6E), increased the ratio of proliferating Ki67+CD8+ T cells over dead/dying CD8+ T cells (Figure 6F), and enhanced effector CD8+ T cells,2,4,71 i.e., effector IFNγ+ (Figure 6G) or IL2+ (Figure 6H) CD8+ T cells, effector-memory CD127+CD62L−CD8+ T cells (Figure 6I), and cytotoxic CD107a+CD8+ T cells (Figure 6J). The combination treatment also increased exhausted PD-1+TIM3+CD8+ T cells (Figure S7B) and stem-like memory T cell factor (TCF1)+CD8+ T cells (Figure 6K) without increasing terminally differentiated eomesodermin (EOMES)+TCF1−CD8+ T cells (Figure S7C).
To confirm the antagonistic relationship between M2-like TAMs vs. CD8+ T lymphocytes, we depleted CD8+ T cells via antibodies (Figure 6L). Interestingly, TC1 tumors depleted of CD8+ T cells (Figure S7D) contained more M2-like TAMs (Figure 6M) and less M1-like TAMs (Figure S7E). This was accompanied by accelerated tumor growth (Figure S7F). Expectedly, the anti-tumor effect of DCvax-IT plus PD-L1 blockade disappeared in the absence of CD8+ T cells (Figure 6N). Tumor T cell-derived IFNγ is a dominant inducer of PD-L1-signaling.61 Accordingly, antibody-based neutralization of IFNγ also disrupted the synergism of DCvax-IT and PD-L1 blockade (Figure 6O).
Finally, we confirmed the pro-CD8+ T cell role for DCvax-IT’s type I IFN response and LN homing by immunophenotyping the tumors after the administration of Ifnar1−/− DCvax-IT or Ccr7−/− DCvax-IT plus PD-L1 blockade. Despite combination with PD-L1 blockade, Ccr7−/− DCvax-IT, or Ifnar1−/− DCvax-IT (Figure S7G) did not increase the number of tumor-infiltrating CD8+ T cells. This confirmed that DCvax-IT mobilizes PD-L1+ macrophage niche spanning both tumors and LNs thereby suppressing T cell immunity such that combination with PD-L1 blockade prevents the accumulation of these TAMs and revives anti-tumor T cells.
PD-L1 and TAM co-association is a negative prognostic niche in human cancers that specifically predicts clinical response to PD-L1 blockade
Bioinformatics analysis with 21 scRNA-seq datasets spanning 13 cancer types, 287 patients, and two species showed that TAMs where the most dominant source of CD274 (Figure 7A) among various tumoral cells. We also explored the correlation of CD274 with M1 vs. M2-like macrophages across the pan-cancer immune-landscape classes in TCGA. Interestingly, the more immunogenic C1/C2/C6 tumors showed a higher correlation between CD274 and M1 macrophages (Figure 7B). Conversely, T cell-depleted C4/C5 tumors displayed a better correlation between CD274 and M2-like macrophages (Figure 7B). Finally, in terms of survival impact, a TCGA-based pan-cancer multi-variate prognostic analysis (19 cancer types, 8,493 patients) emphasized that, in most cancers, co-enrichment of CD274 and macrophages associated with an increased hazard ratio (i.e., shorter overall survival) (Figure 7C).
Figure 7.

PD-L1+ macrophages are mobilized by DC vaccines in GBM patients
(A) Expression of CD274/cd274 (PD-L1) across indicated datasets (n = 287 patients).
(B) Correlation between CD274 vs. M1/M2 macrophage fraction in TCGA cancer types (C1, n = 1,313; C2, n = 1,210, C3, n = 688; C4, n = 222, C5, n = 2; C6, n = 111).
(C) Z scores of CoxPH regression of CD274HIGH macrophagesHIGH subgroups, correcting for age, gender, tumor-stage (bladder cancer/BLCA, n = 408; breast cancer/BRCA, n = 1,100; colon adenocarcinoma/COAD, n = 458; GBM, n = 153; head and neck cancer human papillomavirus−/HNSC-HPV−, n = 422; head and neck cancer human papillomavirus+/HNSC-HPV+, n = 98; kidney chromophobe/KICH, n = 66; kidney renal clear cell carcinoma/KIRC, n = 533; kidney renal papillary cell carcinoma/KIRP, n = 290; low-grade glioma/LGG, n = 516; liver cancer/LIHC, n = 371; lung adenocarcinoma/LUAD, n = 515; lung squamous cell carcinoma/LUSC, n = 501; ovarian cancer/OV, n = 303; pancreatic adenocarcinoma/PAAD, n = 179; pheochromocytoma/PCPG, n = 181; prostate adenocarcinoma/PRAD, n = 498; rectum adenocarcinoma/READ, n = 166; sarcoma/SARC, n = 260; melanoma/SKCM, n = 471; stomach adenocarcinoma/STAD, n = 415; thyroid carcinoma/THCA, n = 509; uveal melanoma/UVM, n = 80, Mantel-Cox test).
(D and E) log2(metagene expression) of CD274, CD163, CD14, and CD68. (D) Responders vs. non-responders to anti-PD-L1 (atezolizumab/durvalumab) (responders, n = 185 and non-responders, n = 269, where ureter/renal pelvis cancer n = 4, urothelial cancer n = 345, bladder cancer n = 31, esophageal cancer n = 72, renal cell carcinoma n = 2; Mann-Whitney U test). (E) Responders vs. non-responders to anti-PD-1 (nivolumab/pembrolizumab) (responders, n = 183 and non-responders, n = 323, where lung cancer n = 19, GBM n = 19, ureter/renal pelvis cancer n = 7, gastric cancer n = 45, colorectal cancer n = 5, melanoma n = 415, bladder cancer n = 59, hepatocellular carcinoma n = 22, breast cancer n = 14, renal cell carcinoma n = 31, head and neck cancer n = 110; Mann-Whitney U test).
(F–J) Analysis of CD45+ fraction of primary and DC vaccinated GBM patients (NCT03395587). Tumor material from day of resection at first diagnosis (primary) or at recurrence after vaccination. (F) Overview of NCT03395587. (G) Frequency of CD4+/CD8+ of CD3+ cells. (H) Frequency of IFNγ+ of CD4+/CD8+CD3+ T cells. (G and H) Primary, n = 6; progress vaccine, n = 5, two-way ANOVA, Bonferroni’s multiple comparison.
(I) Mean fluorescent intensity of CD163 on CD14+ cells. Primary, n = 15; recurrent DC vaccine, n = 5; two-tailed Student’s t test.
(J and K) Immunohistochemistry of tumor slide from unvaccinated and DC vaccinated GBM patients (NCT03395587). (J) Representative images. (K) Correlation between TAM and T cell counts (n = 37 tumor regions from eight unvaccinated/vaccinated, Spearman’s correlation).
(L) Mean fluorescent intensity of PD-L1 on CD14+ cells. Primary, n = 15; recurrent DC vaccine, n = 5; two-tailed Student’s t test.
(M) Bromodeoxyuridine incorporation in cocultures of PBMC-derived lymphocytes (CD14 depleted PBMC) and TAMs obtained from primary GBM samples with/without anti-PD-L1 blocking (n = 3; area-under-curve-driven two-tailed paired t test). Here, “n” represents different patients (biological replicates) and error bars represent SEM. See also Figure S7.
Next, we determined if an M2-like PD-L1+ TAM metagene in pre-treatment tumor transcriptomes can distinguish clinical responders from non-responders in an immunotherapy cohort integrating treatments with either PD-L1 blockade (454 patients, five cancer types) or PD-1 blockade (761 patients, 11 cancer types). Importantly, PD-L1+ TAM metagene was significantly more expressed in patients responding to PD-L1 blockade (Figure 7D) than PD-1 blockade (Figure 7E). This correlation emphasized the interaction of TAMs with PD-L1 across a variety of different cancers.
DC vaccines mobilize lymphocyte-suppressive PD-L1+ TAMs in glioblastoma
The preclinical observation of DC vaccine-induced T cell-suppressive PD-L1+ TAMs called for functional validation in DC vaccinated patients. A cancer type distribution analysis of C4/C5 tumors confirmed that T cell-depleted tumors often are glioblastoma (GBM)/low-grade gliomas (LGGs) (Figure S7H).4,72,73
We accessed samples from the GlioVax clinical trial38 (Table S3). GlioVax is a randomized phase II trial enrolling newly diagnosed GBM patients treated with tumor lysate-loaded DC vaccines combined with radiochemotherapy (Figure 7F).38 DC vaccines indeed increased CD4+/CD8+ T cells (Figure 7G) and effector IFNγ+CD4+/CD8+ T cells (Figure 7H) within GBM tissues from vaccinated patients. Interestingly, the DC vaccine also caused a significant increase in M2-like CD163+CD14+CD45+ TAMs (Figure 7I). Moreover, the CD163+ TAMs and CD8+ T cells also showed spatially disconnected localizations (Figure 7J). Accordingly, a correlation analysis across 37 tumor regions from eight unvaccinated/vaccinated GBM patients highlighted an antagonistic relationship between TAMs and CD8+ T cells, which increased upon vaccination (Figure 7K).
In accord with our preclinical data, DC vaccination increased the frequency of PD-L1+CD163+ TAMs (Figure 7L) in GBM tissues. In the next step, we isolated GBM-infiltrating human PD-L1+ TAMs and cocultured them at different densities with human allogeneic PBMC-derived lymphocytes in the presence or absence of PD-L1 blockade (Figure 7M). Remarkably, PD-L1 blockade stimulated lymphocyte proliferation, but only in the presence of PD-L1+ TAMs, and this effect increased with higher densities of PD-L1+ TAMs (Figure 7M). Of note, human GBM-infiltrating M2-like TAMs expressed significantly higher PD-L1 than CSF1R (Figure S7I). Altogether, these findings suggest that DC vaccination can elicit lymphocyte-suppressive PD-L1+ TAMs in human GBM.
Discussion
In this study, we found that the biggest limitation of human DC vaccines was not their maturation per se but their divergent functional states. In fact, we pinpointed the most immunogenic DC vaccine state (i.e., type I IFN/ISG responseHIGH), which is also associated with efficient antigen-directed immunity and favorable tumor responses in patients. Using this information, we designed a preclinical DCvax-IT. Although some studies have investigated the single-DC vaccine transcriptome,23,74 to the best of our knowledge, none has used these data to drive the creation of an optimized preclinical DC vaccine.
Contrary to our expectations, DCvax-IT was suboptimal, because it facilitated the surge of PD-L1+ LAMs via type I IFN/ISG response, rather than facilitating effector T cells. In parallel, DCvax-IT fueled preexisting T cell-suppressive PD-L1+ TAMs. This created a strong immunosuppressive PD-L1+ macrophage niche across both these anatomically distinct sites, which played a key role in DCvax-IT immunoresistance. Intriguingly PD-L1+ macrophages suppressed CD8+ T cells via TRAIL signaling. Fortunately, this immunosuppressive niche could be neutralized by PD-L1 blockade. In fact, it required a DCvax-IT plus PD-L1 blockade combination to neutralize PD-L1+ LAMs in LNs and PD-L1+ TAMs in the tumors, to unleash “systemic” anticancer T cell activity. The combination of DCvax-IT and PD-L1 blockade helped control the immuno-depleted TC1/LLC tumors. PD-L1 blockade reduced the accumulation of PD-L1+ macrophages (possibly by modulating NF-κB signaling75).
These results have major implications for changing the fundamental outlook of how anticancer DC vaccines work. Currently, the literature consensus agrees that LNs serve solely as the sites of efficacious T cell priming for cancer antigens by the DCs. Our observations add some additional notions to this vision. Indeed, our findings suggest that DC vaccine-driven T cell-suppressive pathways are fueled by PD-L1+ LAMs, and, together with simultaneous fueling of PD-L1+ TAMs, this PD-L1 signaling counters the efficacy of DC vaccines. Moreover, it appears that this pathway is actionable, opening room for combinatorial immunotherapy opportunities.76,77 Although anti-PD-L1 ICB is part of the clinically approved immunotherapy toolkit,57,78 the proposal to combine DC vaccines with ICBs targeting PD-L1 (instead of PD-1) is important because almost all current clinical trials integrating ICBs with DC vaccines are prioritizing PD-1 blockage.76
Of note, we could confirm that DC vaccines potentiated lymphocyte-suppressive PD-L1+ TAMs in patients with GBM, a prototypical T cell-depleted tumor. This, along with the data that the association of TAMs and PD-L1 has negative prognostic value and that a PD-L1+ TAMs signature predicts positive patient responses to PD-L1 blockade, suggests that DC vaccine-driven PD-L1+ TAMs could be used to predict poor clinical responses. This claim is substantiated by a recent clinical study documenting that DC vaccines showed higher efficacy in breast cancer patients with PD-L1− tumors.79
In conclusion, our study shows that a type I IFNHIGHDC vaccine state is necessary but not sufficient for inducing therapy-relevant anticancer immune responses. This is because DC vaccines paradoxically induce a self-inhibitory niche of T cell-suppressive PD-L1+ macrophages in LNs and tumors that form a barrier to efficacious activation of T cell immunity. This creates a DC vaccine-driven immuno-resistant niche that opens avenues for combinatorial immunotherapy.
Limitations of the study
More research is needed to fully decipher the molecular pathways behind PD-L1+ TAM-driven CD8+ T cell death and PD-L1 blockade driven suppression of TAM survival. Also, it would be relevant to test whether our proposed mechanisms work in GBM tumor models in mouse. Finally, a prospective trial combining DC vaccines with PD-L1 blockade in cancer patients will be necessary to fully confirm the clinical relevance of our proposed PD-L1+ LAM/TAM pathway and DC vaccine’s maturation trajectories.
STAR★Methods
Key resources table
| REAGENT or RESOURCE | SOURCE | IDENTIFIER |
|---|---|---|
| Antibodies | ||
| Alexa Fluor 488 anti-mouse CCR7 (clone:4B12) | Biolegend | Cat#120110 RRID:AB_492841 |
| APC/Cyanine7 anti-mouse CD3 (clone:17A2) | Biolegend | Cat#100222 RRID:AB_2242784 |
| BV750 anti-mouse CD3 (clone:17A2) | Biolegend | Cat#100249 RRID:AB_2734148 |
| PE/Cyanine7 anti-mouse CD4 (clone: GK1.5) | Biolegend | Cat#100422 RRID:AB_312707 |
| PE anti-mouse CD4 (clone: GK1.5) | Biolegend | Cat#100408 RRID:AB_312693 |
| BUV563 anti-mouse CD4 (clone:GK1.5) | BD Biosciences | Cat#612923 RRID:AB_2870208 |
| BV711 anti-mouse CD8a (clone: 53–6.7) | Biolegend | Cat#100759 RRID:AB_2563510 |
| Pacific Blue anti-mouse CD8a (clone: 53–6.7) | Biolegend | Cat#100725 RRID:AB_493425 |
| PE anti-mouse/human CD11b (clone:M1/70) | Biolegend | Cat#101208 RRID:AB_312791 |
| APC anti-mouse/human CD11b (clone:M1/70) | Biolegend | Cat#101212 RRID:AB_312795 |
| BUV661 anti-mouse CD11b (clone:ICRF44) | BD Biosciences | Cat#612977 RRID:AB_2870249 |
| APC anti-mouse CD11c (clone: N418) | Biolegend | Cat#117310 RRID:AB_313779 |
| Pacific Blue anti-mouse CD11c (clone: N418) | Biolegend | Cat#117322 RRID:AB_755988 |
| FITC anti-mouse CD11c (clone: N418) | Biolegend | Cat#117305 RRID:AB_313774 |
| Pacific blue anti-mouse CD31 (clone 390) | Biolegend | Cat#102421 RRID:AB_10613457 |
| BV570 anti-mouse CD45 (clone:30-F11) | Biolegend | Cat#103136 RRID:AB_2562612 |
| PE/Cyanine7 anti-mouse CD47 (clone: miap301) | Biolegend | Cat#127523 RRID:AB_2629544 |
| BUV395 anti-mouse CD86 (clone:GL-1) | BD Biosciences | Cat#564199 RRID:AB_2738664 |
| APC/Cyanine7 anti-mouse CD86 (clone:GL-1) | Biolegend | Cat#105030 RRID:AB_2244452 |
| PerCP anti-mouse CD86 (clone: GL-1) | Biolegend | Cat#105026 RRID:AB_893417 |
| PE/Cyanine7 anti-mouse CD90.2 (clone 30-H12) | Biolegend | Cat#105325 RRID:AB_2303142 |
| PE/Cyanine7 anti-mouse CD172a (clone: P84) | Biolegend | Cat#144008 RRID:AB_2563546 |
| PE anti-mouse CD200 (clone: OX-90) | Biolegend | Cat#123808 RRID:AB_2073942 |
| APC anti-mouse CD206 (clone:C068C2) | Biolegend | Cat#141708 RRID:AB_10900231 |
| BV785 anti-mouse CD206 (clone:C068C2) | Biolegend | Cat#141729 RRID:AB_2565823 |
| PerCP/Cyanine5.5 anti-mouse CSF1R (clone: AFS98) | Biolegend | Cat#135525 RRID:AB_2566461 |
| BV605 anti-mouse CSF1R (clone: AFS98) | Biolegend | Cat#135517 RRID:AB_2562760 |
| PE anti-FASL (clone KAY-10) | Biolegend | Cat#106805 RRID:AB_2246643 |
| FITC anti-mouse F4/80 (clone:QA17A29) | Biolegend | Cat#157310 RRID:AB_2876535 |
| Pacific blue anti-mouse F4/80 (clone:BM8) | Biolegend | Cat#123124 RRID:AB_893475 |
| BUV737 anti-mouse F4/80 (clone: T45-2342) | BD Biosciences | Cat#749283 RRID:AB_2873658 |
| APC IFNy anti-mouse (clone: XMG1.2) | Biolegend | Cat#505810 RRID:AB_315404 |
| PE anti-mouse IL2 (clone: JES6-5H4) | Biolegend | Cat#503808 RRID:AB_315302 |
| FITC anti-mouse MHCII (clone: M5/114.15.2) | Biolegend | Cat#107606 RRID:AB_313321 |
| BV650 anti-mouse MHCII (clone:M5/114.15.2) | Biolegend | Cat#107641 RRID:AB_2565975 |
| BUV615 anti-mouse PD1 (clone: RPM1-30) | BD Biosciences | Cat#752354 RRID:AB_2875871 |
| FITC anti-mouse PD1 (clone 29F.1A12) | Biolegend | Cat#135214 RRID:AB_10680238 |
| PE anti-mouse PD1 (clone RMP1-30) | Biolegend | Cat#109103 RRID:AB_313420 |
| APC anti-mouse PDL1 (clone 10F.9G2) | Biolegend | Cat#124312 RRID:AB_10612741 |
| Percp/Cyanine5.5 anti-mouse PDL2 (clone: TY25) | Biolegend | Cat#107218 RRID:AB_2728126 |
| Percp/Cyanine5.5 anti-mouse Siglec-H (clone:551) | Biolegend | Cat#129614 RRID:AB_10643995 |
| FITC anti-mouse TNF (clone: MP6-XT22) | Biolegend | Cat#506304 RRID:AB_315425 |
| PE anti-mouse pSTAT1 (clone: pY701) | BD Biosciences | Cat#562069 RRID:AB_11151907 |
| Pe/cyanine7 anti-mouse TRAIL (clone N2B2) | Biolegend | Cat#109311 RRID:AB_2721675 |
| BV510 anti-mouse XCR1 (clone: ZET) | Biolegend | Cat#148218 RRID:AB_2565231 |
| Alexa Fluor 488 anti-mouse FOXP3 (clone:MF-14) | Biolegend | Cat#126406 RRID:AB_1089113 |
| PE/Cyanine7 anti-mouse GATA3 (clone: TWAJ) | Thermo Fischer Scientific | Cat#25-9966-42 RRID:AB_2573568 |
| PE/Cyanine5 anti-mouse CD62L (clone: MEL-14) | Biolegend | Cat#104410 RRID:AB_313097 |
| PE anti-mouse TCF1/7 (clone: S33-966) | BD Biosciences | Cat#564217 RRID:AB_2687845 |
| Alexa Fluor 700 anti-mouse CD107a (clone:1D4B) | Biolegend | Cat#121628 RRID:AB_2783063 |
| BV786 anti-mouse Tbet (clone: O4-46) | BD Biosciences | Cat#564141 RRID:AB_2738615 |
| BV650 anti-mouse KI-67 (clone:11F6) | Biolegend | Cat#151215 RRID:AB_2876504 |
| BV450 anti-mouse EOMES (clone: Dan11mag) | Thermo Fischer Scientific | Cat#48-4875-82 RRID:AB_2574062 |
| BUV737 anti-mouse CD127 (clone: SB/199) | BD Biosciences | Cat#612841 RRID:AB_2870163 |
| BUV395 anti-mouse TIM3 (clone:5D12/TIM-3) | BD Biosciences | Cat#747620 RRID:AB_2744186 |
| anti-mouse calreticulin (clone: B44) | abcam | Cat#ab2907 RRID:AB_303402 |
| Alexa Fluor 488 anti-rabbit IgG | abcam | Cat#ab150077 RRID:AB_2630356 |
| APC/Cyanine7 anti-human CD3 (clone: OKT3) | Biolegend | Cat#317342 RRID:AB_2563410 |
| Alexa Fluor 594 anti-human CD3 (clone: UCHT1) | Biolegend | Cat#300446 RRID:AB_2563236 |
| PE/Cyanine7 anti-human CD4 (clone: okt/04) | Biolegend | Cat#317414 RRID:AB_571959 |
| Alexa Fluor 597 anti-human CD8 (clone: RPA-T8) | Biolegend | Cat#301056 RRID:AB_2563232 |
| PE/Dazzle anti-human CD8 (clone: Sk1) | Biolegend | Cat#344744 RRID:AB_2566515 |
| VioGreen anti-human CD8 (clone:BW135/80) | Miltenyi Biotec | Cat#130-113-726 RRID:AB_2726267 |
| BV570 anti-human CD45RO (clone: UCHL1) | Biolegend | Cat#304226 RRID:AB_2563818 |
| Pacific blue anti-human IFNy (clone:4S. B3) | Biolegend | Cat#502532 RRID:AB_2561398 |
| FITC anti-human CD45 (clone: REA747) | Miltenyi Biotec | Cat#130-110-769 RRID:AB_2658236 |
| FITC anti-human CD163 (clone: REA812 | Miltenyi Biotec | Cat#130-112-290 RRID:AB_2655475 |
| Percp anti-human CD45 (clone:2D1) | Biolegend | Cat#368506 RRID:AB_2566358 |
| APC anti-human CD14 (clone:63D3) | Biolegend | Cat#367118 RRID:AB_2566792 |
| PE/Dazzle anti-human CSF1R (clone: AFS98) | Biolegend | Cat#135528 RRID:AB_2566523 |
| PE anti-human PDL1 (clone:M1H1) | BD Biosciences | Cat#557924 RRID:AB_647198 |
| Alexa Fluor 488 isotype control (clone: MOPC-21) | BD Biosciences | Cat#557702 RRID:AB_396811 |
| Alexa Fluor 647 isotype control (clone: MOPC-21) | BD Biosciences | Cat#557783 RRID:AB_396871 |
| PE isotype control (clone:27–35) | BD Biosciences | Cat#555058 RRID:AB_395678 |
| PE/Cyanine5 isotype control (clone: P3.6.2.8.1) | Thermo Fischer Scientific | Cat#46-4714-82 AB_1834453 |
| FcX (truStain/CD16/32) anti-mouse (clone: 93) | Biolegend | Cat#101320 RRID:AB_1574975 |
| anti-mouse MLKL (clone:3H1) | Sigma Aldrich | Cat#MABC604 RRID:AB_2820284 |
| anti-mouse pMLKL (clone: EPR9515(2)) | Abcam | Cat#ab196436 RRID:AB_2687465 |
| anti-mouse RIPK1 (clone: D94C12) | Cell signaling | Cat#3493T RRID:AB_2305314 |
| anti-mouse RIPK3 | Biorad | Cat#AHP1797 RRID:AB_2178676 |
| anti-mouse HMGB1 (clone: EPR3507 | Abcam | Cat#ab79823 RRID:AB_1603373 |
| anti-mouse PD-L1 (clone 10F.2H11) | BioxCell | Cat#BE0361 RRID:AB_2927503 |
| anti-mouse PD-L1 (clone D4H1Z) | Cell signaling | Cat#60475 RRID:AB_2924680 |
| anti-mouse PD-L2 (clone 168633) | R&D systems | Cat#MAB1022 RRID:AB_2268067 |
| anti-HPV-E7 (clone: 8C9) | Thermo Fischer Scientific | Cat# 28-0006 RRID:AB_2533057 |
| anti-human/mouse/rat caspase8 | Thermo Fischer Scientific | Cat#PA5-77888 RRID:AB_2735575 |
| anti-human CD163 (clone OTI2G12) | Abcam | Cat#ab156769 |
| AF647 anti-human CD8 (clone EP1150y) | Abcam | Cat#ab196193 RRID:AB_869025 |
| anti-mouse IgG | abcam | Cat#ab150113 RRID:AB_2576208 |
| anti-Bovine/human/mouse/sheep/rat caspase9 | Thermo Fischer Scientific | Cat#PA5-16358 RRID:AB_10985523 |
| anti-mouse PARP (clone:46D11) | Cell signaling | Cat# 9532S RRID:AB_659884 |
| anti-mouse Actin (clone: AC-74) | Sigma Aldrich | Cat#A5316 RRID:AB_476743 |
| anti-mouse Actin | Abcam | Cat#ab49900 RRID:AB_867494 |
| anti-mouse Actin (clone: AC-15) | Sigma Aldrich | Cat#A5441 RRID:AB_476744 |
| anti-rabbit IgG | Cell signaling | Cat#7074S RRID:AB_2099233 |
| anti-mouse IgG | Cell signaling | Cat#7076S RRID:AB_330924 |
| anti-rat IgG2a | Biolegend | Cat#400502 RRID:AB_326523 |
| anti-mouse TNF | Invitrogen | Cat#16-7423-81 RRID:AB_469261 |
| anti-mouse TRAIL | R&D systems | Cat#AF721 RRID:AB_2205069 |
| anti-mouse PDL1 D265A mutated | invivogen | Cat#pdl1-mab15 |
| anti-mouse CSF1R (clone: AFS98) | BioXCell | Cat#BP0213 RRID:AB_2687699 |
| Chemicals, peptides, and recombinant proteins | ||
| Recombinant Murine TNF | Miltenyi Biotec | Cat#130-101-687 |
| Recombinant Murine IFNβ | R&D systems | Cat#8234-MB-010 |
| Recombinant Murine IL4 | Peprotech | Cat#214-14 |
| Recombinant Murine M-CSF | Peprotech | Cat#315-02 |
| Recombinant Murine GM-CSF | Peprotech | Cat#315-03 |
| Recombinant Murine IL2 | Peprotech | Cat#210-12 |
| Recombinant Murine IFNγ | Peprotech | Cat#315-05 |
| Recombinant Murine PGE2 | Merk life science | Cat#P5640 |
| Recombinant Murine IL6 | Peprotech | Cat#216-16 |
| Recombinant Murine ILIβ | Peprotech | Cat#211-11B |
| lipopolysaccharide Escherichia coli | Invivogen | Cat#tlrl-eblps |
| imiquimod | Invivogen | Cat#tlrl-imqs |
| 5′ppp-dsRNA/lyovec | Invivogen | Cat#tlrl-3prnaclv |
| 2′3′ cGAMP | Invivogen | Cat#tlrl-nacga23 |
| Cisplatin | Sigma | Cat#P4394 |
| Doxorubicin | Merck | Cat#D1515 |
| NP-40 cell lysis buffer | Thermo Fischer Scientific | Cat#FNN0021 |
| Phenylmethylsulfonyl fluoride (PMSF) | Thermo Fischer Scientific | Cat#1083709 |
| Pierce ™ Protease Inhibitor Mini Tablets | Thermo Fischer Scientific | Cat#A32953 |
| Pierce ™ Phosphatase Inhibitor Mini Tablets | Thermo Fischer Scientific | Cat#A32957 |
| Pierce ™ ECL Western Blotting Substrate | Thermo Fischer Scientific | Cat#32106 |
| Bovine serum albumin (BSA) | Sigma | Cat#A2153-50G |
| Criterion™ XT Bis-Tris Precast Gels | Biorad | Cat#3450124 |
| Cell Staining Buffer | Biolegend | Cat#420201 |
| Western Blot Stripping Buffer | abcam | Cat#ab270550 |
| BV-6 | Selleckchem | Cat#S7597 |
| Z-Val-Ala-Asp (OMe)-FMK | Bachem | Cat#4027403 |
| Necrostatin-1s | Bioke | Cat#17802S |
| pHrodo™ iFL Red STP Ester | Thermo Fischer Scientific | Cat#P36011 |
| recombinant HPV-E6 antigen (VYDFAFRDL) | LifeTein | N/A |
| recombinant HPV-E6 antigen (DKKQRFHNI) | LifeTein | N/A |
| recombinant HPV-E7 antigen (RAHYNIVTF) | LifeTein | N/A |
| recombinant HPV-E7 antigen (LCVQSTHVD) | LifeTein | N/A |
| Cytofix/cytoperm™ fixation/permeabilization solution kit | BD Biosciences | Cat#554714 |
| True-nuclear™ transcription factor buffer set | Biolegend | Cat#424401 |
| Dynabeads® Mouse T-activator CD3/CD28 | Thermo Fischer Scientific | Cat#11456D |
| Brefeldin A Solution (1000x) | Thermo Fischer Scientific | Cat#00-4506-51 |
| Cytofix | BD Biosciences | Cat#554655 |
| SYBRgreen | Highqu | Cat#QPD0150 |
| Bromodeoxyuridine | BD Biosciences | Cat#550891 |
| MACS tissue storage solution | Miltenyi Biotec | Cat#130-100-008 |
| phorbol myristate acetate | Sigma-Aldrich | Cat#P8139 |
| Ionomycin | Sigma-Aldrich | Cat#I9657 |
| Brefeldin A | Biolegend | Cat#420601 |
| Clodronate liposomes | Liposoma | N/A |
| CellTracker CM-Dil dye | Thermo Fischer Scientific | Cat#C7000 |
| anti-mouse PDL1 (clone: MIH5) | JJP Biologics, Warsaw, Poland. Louis Boon | N/A |
| anti-mouse CTLA4 (clone:4F10) | JJP Biologics, Warsaw, Poland. Louis Boon | N/A |
| anti-mouse PD1 (clone: RMP1-14 | JJP Biologics, Warsaw, Poland. Louis Boon | N/A |
| anti-mouse IFNy (clone: XMG 1.2) | JJP Biologics, Warsaw, Poland. Louis Boon | N/A |
| anti-mouse NK1.1 (clone:PK136) | JJP Biologics, Warsaw, Poland. Louis Boon | N/A |
| anti-mouse CD8 (clone: YTS169) | JJP Biologics, Warsaw, Poland. Louis Boon | N/A |
| Fixable Viability Dye eFluor™ 780 | Thermo Fischer Scientific | Cat#65-0865-14 |
| Zombie Aqua™ Fixable Viability Kit A | Biolegend | Cat#423102 |
| ZOMBI NIR™ fixable viability kit | Biolegend | Cat#423106 |
| Edit-R Lentiviral CAG-Blast-Cas9 Nuclease Particles | Dharmacon Horizon discovery | Cat#VCAS10129 |
| Edit-R CRISPR-Cas9 Synthetic tracrRNA | Dharmacon Horizon discovery | Cat#U-002005-50 |
| LY294002 | Tebu-bio | Cat#1543664 |
| PD98059 | Tebu-bio | Cat#T2623 |
| SC75741 | Tebu-bio | Cat#T6661 |
| S-ruxolitinib | Tebu-bio | Cat#T6156 |
| Critical commercial assays | ||
| Caspase-Glo kit | Promega | Cat#G8091 |
| RealTime-Glo Annexin V Apoptosis and Necrosis assay | Promega | Cat#JA1011 |
| MTS assay kit | abcam | Cat#ab197010 |
| ELITEN ATP assay system kit | Promega | Cat#FF2000 |
| Bicinchoninic Acid (BCA) Pierce Protein Assay Kit | Thermo Fischer Scientific | Cat#23227 |
| Purelink RNA Mini Kit | Thermo Fischer Scientific | Cat#12183025 |
| QuantiTect Reverse Transcription kit | Qiagen | Cat#205313 |
| Proteome Profiler Mouse Cytokines Array Kit Panel A | R&D systems | Cat#ARY006 |
| pan-T cell isolation kit II | Miltenyi Biotec | Cat#130-095-130 |
| Murine tumor dissociation kit | Miltenyi Biotec | Cat#130-096-730 |
| anti-F4/80 microbeads | Miltenyi Biotec | Cat#130-110-443 |
| Human tumor dissociation kit | Miltenyi Biotec | Cat#130-095-929 |
| anti-human CD45 microbeads | Miltenyi Biotec | Cat#130-045-801 |
| anti-mouse CD45 microbeads | Miltenyi Biotec | Cat#130-110-618 |
| CXCL10 ELISA | R&D systems | Cat#DY466 |
| IFN alfa ELISA | Invivogen | Cat#luex-mifna |
| PDL1 ELISA | R&D systems | Cat#DY1019 |
| IFN beta ELISA | Invivogen | Cat#mifnbv2 |
| APC conjugation kit | abcam | Cat#ab201807 |
| Other | ||
| Rational selection of syngeneic preclinical tumor models for immunotherapeutic drug discovery | Mosely et al.27 | GEO: GSE85509 |
| Analysis of DC vaccines used for phase II clinical trial in prostate carcinoma patients | Castiello et al.23 | GEO: GSE85698 |
| High Dimensional Analysis Delineates Myeloid and Lymphoid Compartment Remodeling during Successful Immune Checkpoint Cancer Therapy | Gubin et al.80 | GEO: GSE119352 |
| Checkpoint blockade immunotherapy induces dynamic changes in PD-1-CD8+ tumor-infiltrating T cells | Kurtulus et al.81 | GEO: GSE122969 |
| Defining T cell states associated with response to checkpoint immunotherapy in melanoma | Sade-Feldman et al.82 | GEO: GSE120575 |
| Single cell RNA-seq analysis of head and neck cancer | Puram et al.83 | GEO: GSE103322 |
| Combination immunotherapy can rescue CD8+ T cell dysfunction and maintain memory phenotype in cancer | Wang et al.84 | GEO: GSE120909 |
| Single-cell analysis reveals new evolutionary complexity in uveal melanoma | Durante et al.85 | GEO: GSE139829 |
| Dysfunctional CD8+ T cells form a proliferative, dynamically regulated compartment within human melanoma [scRNA-seq] | Li et al.86 | GEO: GSE123139 |
| Immune landscape of viral- and carcinogen-derived head and neck cancer | Cillo et al.87 | GEO: GSE139324 |
| Ensemble learning for classifying single-cell data and projection across reference atlases | Wang et al.88 | GEO: GSE141982 |
| Tumor cell biodiversity drives microenvironmental reprogramming in liver cancer | Ma et al.89 | GEO: GSE125449 |
| Identification of grade and origin specific cell populations in serous epithelial ovarian cancer by single cell RNA-seq | Shih et al.90 | GEO: GSE118828 |
| Single cell RNA sequencing of lung adenocarcinoma | Kim et al.91 | GEO: GSE131907 |
| Peripheral clonal expansion of T lymphocytes associates with tumor infiltration and response to cancer immunotherapy | Wu et al.92 | GEO: GSE139555 |
| Mutagenesis sensitizes murine models of triple negative breast cancer to immunotherapy | Hollern et al.93 | GEO: GSE136206 |
| Integrating microarray-based spatial transcriptomics and single-cell RNA-seq reveals tissue architecture in pancreatic ductal adenocarcinomas | Moncada et al.94 | GEO: GSE111672 |
| single cell RNA-seq analysis of adult and pediatric IDH-wildtype Glioblastomas | Neftel et al.95 | GEO: GSE131928 |
| Single-Cell Analyses Inform Mechanisms of Myeloid-Targeted therapies in colon cancer | Zhang et al.96 | GEO: GSE146771 |
| Single-cell RNA-seq of melanoma ecosystems reveals sources of T cells exclusion linked to immunotherapy clinical outcomes | Jerby-Arnon et al.97 | GEO: GSE115978 |
| T cell landscape of non-small cell lung cancer revealed by deep single-cell RNA sequencing | Guo et al.98 | GEO: GSE99254 |
| Single-cell RNA-seq of six thousand purified CD3+ T cells from human primary TNBCs | Savas et al.99 | GEO: GSE110686 |
| Clonal replacement of tumor-specific T cells following PD-1 blockade [single cells] | Yost et al.100 | GEO: GSE123813 |
| Experimental models: Cell lines | ||
| TC1 | Yang et al.34 | N/A |
| TC1 Mlkl −/− | Yang et al.34 | N/A |
| TC1 Ripk3 −/− | Yang et al.34 | N/A |
| TC1 Caspase8 −/− | This paper | N/A |
| TC1 Caspase9 −/− | This paper | N/A |
| TC1 Caspase8/9 −/− | This paper | N/A |
| LLC | Celus et al.101 | N/A |
| J774-Dual™ | N/A | Cat#j774d-nfis |
| MC38 | Kerafast | Cat#ENH204-FP |
| Experimental models: Organisms/strains | ||
| Mouse:C57BL/6J | the Jackson Laboratory | JAX: 000664 |
| Mouse: B6.129S2-Ifnar1tm1Agt/Mmjax | the Jackson Laboratory | JAX:010830 |
| Mouse: B6.129P2(C)-Ccr7tm1Rfor/J | the Jackson Laboratory | JAX:006621 |
| Oligonucleotides | ||
| murine CXCL10_forward | IDT | CGATGACGGGCCAGTGAGAA |
| murine CXCL10_reverse | IDT | CAGCCACTTGAGCGAGGACT |
| murine CXCL9_forward | IDT | AAACAGTTTGCCCCAAGCCC |
| murine CXCL9_reverse | IDT | CGAGTCCGGATCTAGGCAGG |
| murine RSAD2_forward | IDT | CGACAGCTTCGATGAGCAGG |
| murine RSAD2_reverse | IDT | ACACCTCTTTGTGACGCTCCA |
| murine MX1_forward | IDT | GGGGTCTTGACCAAGCCTGA |
| murine MX1_reverse | IDT | ACCGGCTGTCTCCCTCTGATA |
| murine IRF_forward | IDT | TGCTGAGCGAAGAGAGCGAA |
| murine IRF_reverse | IDT | CCTGCCATGCTGCATAGGGT |
| murine ACTIN_forward | IDT | CATTGCTGACAGGATGCAGAAGG |
| murine ACTIN_reverse | IDT | TGCTGGAAGGTGGACAGTGAGG |
| Recombinant DNA | ||
| crRNA Caspase 8 | Dharmacon™, Horizon Discovery | CCAGATTTCTCCCTACAGGT |
| crRNA Caspase 9 | Dharmacon™, Horizon Discovery | CTGTCCCATAGACAGCACCC |
| Software and algorithms | ||
| GraphPad Prism 8 | GraphPad Software | https://www.graphpad.com/ |
| FlowJo | BD Biosciences | https://flowjo.com |
| Image Lab 6.1 | Biorad, Image Lab | https://www.bio-rad.com/en-be/product/image-lab-software?ID=KRE6P5E8Z#fragment-6 |
| Biorender | Biorender | https://biorender.com/ |
| Phyton (version 3.9.7) | Phyton | https://www.python.org/ |
| Gistic | Broad institute | https://portals.broadinstitute.org/tcga/gistic/browseGisticByGene |
| Morpheus | Broad institute | https://software.broadinstitute.org/morpheus/ |
| Stream | Human Cell atlas data portal | https://data.humancellatlas.org/analyze/methods/stream |
| qupath | qupath | https://qupath.github.io/ |
| msigdb_v7.2_GMTs | Broad institute | https://www.gsea-msigdb.org/ |
| Scanpy 1.9.3. | Scanpy | https://genomebiology.biomedcentral.com/articles/10.1186/s13059-017-1382-0 |
| UMAP-learn 0.5.3 | PyPI | https://arxiv.org/abs/1802.03426 |
| Matplotlib 3.7.1 | matplotlib | https://matplotlib.org/ |
Resource availability
Lead contact
Further information and requests for resources and reagents should be directed to and will be fulfilled by the lead contact, Abhishek Garg (abhishek.garg@kuleuven.be)
Materials availability
This study did not generate new unique reagents. Beyond that, all major resources or materials used are described in the “Key Resources” table above.
Data and code availability
-
•
No original code was generated for this study.
-
•
This paper has analyzed existing, publicly available data. These accession numbers or relevant publications/database sources for the datasets are listed in the key resources table.
-
•
Any additional information required to reanalyze the data reported in this paper is available from the lead contact upon request.
Experimental model and study participant details
Human subjects and ethics
Human samples were derived from glioblastoma patients included in the GlioVax trial (NCT03395587) with the informed consent of the patients and approval by the ethical committee of University Hospital Düsseldorf (MC-LKP-921 and 3005). Further trial details have been described elsewhere.38
Mice models
Wild type C57BL/6j were obtained from the KU Leuven breeding facility. The Ifnar1−/− mice (B6.129S2-Ifnar1tm1Agt/Mmjax)(The Jackson Laboratory #010830) were a kind gift from the lab of Roos Vandenbroucke (VIB-UGent) and the Ccr7−/− mice (B6.129P2(C)-Ccr7tm1Rfor/J) (The Jackson Laboratory #006621) were a kind gift from the lab of Bart Lambrecht (VIB-UGent). All subcutaneous tumor experiments were done using 7- to 12-week-old female/male mice, maintained in the conventional mouse facility. Experiments were approved by the animal ethics committee at KU Leuven (project P114/2019 and p195/2020) following the European directive 2010/63/EU as amended by the Regulation (EU) 2019/1010 and the Flemish government decree of 17 February 2017.
Cell lines
TC1 wild type, Ripk3−/−, Mlkl−/− were a kind gift from the lab of Oliver Kepp (Université Paris).34 LLC and MC38 cancer cells were a kind gift from the laboratory of Massimiliano Mazzone (VIB-KULeuven). J774-Dual cells were purchased from Invivogen. Cells were cultured at 37°C under 5% CO2 in DMEM media containing 2 mM L-glutamine, 3.7 g/L sodium bicarbonate, 4.5 g/L glucose and 1.0 mM sodium pyruvate) with 10% heat-inactivated fetal bovine serum (30 min at 56°C; FBS), penicillin 100 U/ml streptomycin 100 μg/mL DMEM and split when 90% confluency was reached through enzymatic dissociation (Trypsin).
Cell line creation
3 mL of the LentiGuide Cas9 lentiviral particles were added into the well, to reach an MOI of 0.3 TU/cell, and the plate was gently shaken before being placed back into the incubator. Thereafter, 48 h later, the supernatant was replaced with 2 mL fresh medium and lentiviral transduced cells were now ready for transfection of synthetic guide RNA. The synthetic guide RNA complex was prepared by adding equal quantity of crRNA targeting Casp8 + crRNA targeting Casp9 + tracrRNA, all at final concentrations of 25 nM, in 100 μL serum-free DMEM and these were incubated for 5 min at room temperature. Transfection reagents were prepared in a separate tube by diluting 10 μL of DharmaFECT 1 in 100 μL of serum-free DMEM and incubated for 5 min. The crRNA:tracrRNA complex and DharmaFECT 1 working solution were mixed and incubated for another 20 min adding to lentiviral-transduced cells, which were incubated for another 48 h to reach efficient gene knockout. The transfected cells were then sorted to single cell clones into 96-well plates by a FACSAria cell sorter (BD Bioscience). Two weeks later, visible clones were picked and duplicated for seed reservation as well as western blotting detection of Casp8 (Thermofischer #PA5-77888) and Casp9(Thermofischer #PA5-16358) expression to confirm the knock-out phenotype.
Method details
Cell death analysis
Cell death induction
For cell death induction cells were seeded in the appropriate dish as such that they reached an 80% confluency the next day. Necroptosis was induced in TC1 WT by 100 ng/mL tumor necrosis factor (TNF) (Miltenyi #130-101-687), 1μM BV6 (Selleckchem #S7597 and 20μM Z-Val-Ala-Asp (OMe)-FMK (zVaD) (Bachem #4027403). For apoptosis, TC1 Mlkl−/−, MC38 or LLC cells were pre-treated with 10μM BV6 for 3h and subsequently 100 ng/mL TNF was added. When applicable, a pre-treatment of 30μM of Necrostatin-1s (Bioke #17802S) for 3h was used to inhibit necroptosis.
MTT assay
TC1 WT and Mlkl−/− cells were seeded in a 96 well plate at a density of 5 000 cells per well 24h before cell death induction. Cell survival was obtained using the thiazolyl blue tetrazolium bromide (MTT) reagent (Abcam #ab197010). Absorbance was read on a microplate reader (Flexstation) at 490 nm at 24h and 48h after cell death induction.
RealTime-Glo Annexin V Apoptosis and Necrosis Assay
A total of 5 000 cells TC1 WT and Mlkl−/− cells were plated in 96-well plates in 100 μL DMEM and incubated for 24h. Necroptotic and apoptotic stimuli cocktails were added to the plates. Apoptosis and necroptosis were detected using the RealTime-Glo Annexin V Apoptosis and Necrosis Assay (Promega #JA1011) including CellTox green (Promega #G8741). Bioluminescence and fluorescence at excitation 485nm and emission 530nm were measured at different time points; 1, 3, 6, 9, 20, 24, 27, 30 and 48 h on a microplate reader (Flexstation). Fold changes to untreated (control) were taken. Percentage of cell death at 48h was estimated using following formula: Dead (%) = ((RFU TNF well/total RFU TNF well) − (RFU control well/total RFU control well)) × 100% as previously described.102
Caspase 3/7 activity
Cells were seeded in a 96-well plate at a density of 3000 cells/well. Cell death was induced, and the Caspase 3/7 activity was measured at 24h and 48h using the caspase-glo kit (Promega #G8091). A fold change to untreated cells was taken to obtain caspase 3/7 activity.
Western Blot
For intracellular proteins, 800 000 cells were seeded in 10cm dishes 24h before cell death induction. Cells were scraped and collected at 1, 3, 6, 24 or 48 h after cell death induction. Cells were centrifuged at 1500rpm for 5 min and the pellet was resuspended in 100μL NP-40 lysis buffer (Thermo Fischer #FNN0021) with protease (Thermo Fischer #A32953) and phosphatase inhibitors (Thermo Fischer #A32957). For secreted proteins, cells were 2 500 000 cells seeded in a 15cm dishes and media was collected 24h after cell death induction. Floating cells were removed by centrifugation. The supernatant was concentrated using Amicon Ultra-15 centrifuge filter units (Merck #UFC901024). A Bicinchoninic acid assay (BCA) for colorimetric quantification of total protein was done with a BCA protein assay kit (Thermo Fischer Scientific #23227) and a protein mixture of 90 μg was loaded onto the gel. Following proteins were detected; MLKL (clone 3H1), phosphorylated MLKL (pMLKL) (clone EPR9515(2)), RIPK1 (clone D94C12), RIPK3 (polyclonal), HMGB1(clone EPR3507), HPV-E7 (clone 8C9), PARP (clone 46D11), PD-L1 (clone D4H1Z), PD-L2 (clone 168633), and β-Actin (clone AC-74 and AC-15). The primary antibodies were diluted in 5% BSA+TBST with a dilution factor of 1/1000. As secondary antibody, we used the anti-rabbit antibody labelled with HRP (Cell Signaling #7074S) or anti-mouse antibody labelled with HRP (Cell Signaling #7076S) diluted in 5% BSA+TBST with a dilution factor of 1/2000. The antibody’s tethering to the proteins on the membranes were detected using the ECL substrate and the resulting precipitate was detected with the ChemiDoc MP imaging system. For detection of MLKL and HPV-E7, the membranes were stripped for 15 min at room temperature using stripping buffer (Abcam #Ab270550) with a dilution factor of 1/2000 and same procedure as described above was used to detect the protein of interest. The precision plus protein dual color standards (Biorad #161037) was used as a ladder.
ATP secretion
Media of TC1 WT and Mlkl−/− cells after cell death induction was harvested at 6, 24 and 48h. The presence of ATP in the media was analyzed using the ATP assay system (Promega #FF2000). A fold change to untreated cells was taken to obtain ATP release.
Flow cytometry-based detection of calreticulin and CD47
A total of 200 000 TC1 WT and Mlkl−/− cells were plated in 12-well plates in 1 mL of DMEM and incubated for 24h. Cell death was induced for 48h. Then the cells were collected, washed with PBS, and transferred to 5mL flow cytometry tubes. The cells were re-suspended in 50 μL of FACS buffer (0.5% BSA and PBS solution) and 1/100 anti-calreticulin primary antibody (clone B44). After 30 min incubation in the dark on ice, cells were washed with 1mL of FACS buffer, centrifuged and the supernatant was discarded. Then, cells were again re-suspended in 50 μL of FACS buffer with 1/500 of Goat Anti-Rabbit Alexa Fluor 488 (polyclonal) for CRT, anti-CD47 (clone miap301) antibody and Fixable Viability Dye eFluor 780. After 30 min incubation on ice in the dark, cells were fixed with cytofix (BD Bioscience #554655).
J774 reporter assay
J774-Dual cells (Invivogen) were treated with 1000 pg/mL LPS-EB (Invivogen# tlrl-eblps) and/or 10 ng/ml anti-PDL1(Polpharma Biologics; clone M1H5) for 48 h. NF-κB activity was checked in media by adding 100 μL of Quanti-Blue (Invivogen) to 100 μL of (separately recovered) J774 media. Absorbance was examined at an optical density of 655 nm, 4 to 8 h after Quanti-Blue addition by microplate reader (Biotek).
In vitro assays
DC vaccine formation
For DC vaccine creation, bone marrow derived DCs were stimulated with dying cancer cells in a 1:1 ratio or with TC1 antigens (i.e., Human Papillomavirus (HPV) e6/e7 epitopes: VYDFAFRDL/DKKQRFHNI, RAHYNIVTF/LCVQSTHVD)), with or without 2.5 ng/mL interferon beta (IFNβ) (R&D systems #8234-MB-010) for 48h. Where indicated, DCs were stimulated with 1000 pg/ml lipopolysaccharide Escherichia coli (LPS-EB) (Invivogen #tlrl-eblps) as a positive control. In the relevant conditions, DCs were treated with 1000 pg/mL LPS-EB and 5 ng/mL IFNγ, 1000 pg/mL LPS-EB alone or with 4 ng/mL IL1β, 1 μg/mL PGE2, 2 ng/mL IL6 and 25 ng/ml TNF instead of IFNβ. After 48h, DCs were harvested by scraping and washed with PBS for injection; 1000 000 DCs per 100μL PBS or for further analysis. Media of the DC cultures was also collected for further analysis, ELISA, cytokine array.
Flow cytometry
Before staining procedure, FC receptor of all samples was blocked using TruStain FcX (Biolegend #101320) for 15min. Cells were further stained with the indicated antibodies listed in Key resource table, diluted in 0.5% BSA, for 1h and fixed with cytofix (BD Bioscience #554655). In the case of intracellular markers, cells were fixed and permeabilized with the Cytofix/Cytoperm Kit (BD Bioscience #554714). For the staining of transcription factors, the true-nuclear transcription factor buffer (Biolegend #42441) set was used. After fixation, cells were maintained in 0.5% BSA. For intracellular cytokine staining, the cells were stimulated with Dynabeads Mouse T activator CD3/CD28 (Thermo Fisher Scientific #11456D). After 1h at 37°C 5% CO2, 2μL Brefeldin A (Thermo Fisher Scientific #00-4506-51) was added. Cells were then placed at 37°C 5% CO2 for 4h, transferred to 4°C overnight and then stained for intracellular cytokines. Flow cytometry was performed on the Attune NxT (Thermo Fisher Scientific), FACSCanto (BD Bioscience) or the ID7000 (SONY). Cell doublets were excluded based on FSC-A/FSC-H. Flow cytometry data was analyzed using FlowJo.
DC vaccine - TAM cocultures
DC vaccines were harvested as previously described. DC vaccines were cocultures with TC1-tumor derived TAMs in a 1:1 ratio. After 48h cocultures were scraped to collect the cells, centrifuged, and washed with PBS. Single cell suspension was stained with fluorescently labelled antibodies diluted in FACS buffer (0.5% BSA and PBS solution) for 1h on ice and then washed with the same buffer. Cells were fixed with cytofix (BD Bioscience #554655). Following fluorochrome-conjugated antibody clones were used to analyze the isolated lymph nodes by flow cytometry; MHCII (clone M5/114.15.2), PDL1 (clone 10F.9G2), CD86 (clone GL1), F4/80 (clone T45-2342), CSF1R (clone AFS98), CD11b (clone ICRF44) and CD206 (clone C068C2).
T cell - TAM cocultures
TC1 derived TAMs and matched T cells (derived from the spleen) were harvested as described above. TAMs were plated in media alone or with 10 μg/ml anti-PDL1(Polpharma Biologics), 10 μg/ml anti-PD1(Polpharma Biologics), 10 μg/ml anti-TNF (Invitrogen #16-7423-81) or 10 μg/ml anti-Trail (R&D systems #AF721), for 24h. TAMs were scraped and washed and cocultured with their matched T cells in a 1:1 ratio with 100 IU/mL IL-2 for 48h. Then cocultures were scraped to collect the cells, centrifuged, and washed with PBS. Single cell suspension was stained with fluorescently labelled antibodies diluted in FACS buffer (0.5% BSA and PBS solution) for 1h on ice and then washed with the same buffer. Cells were fixed with cytofix (BD Bioscience #554655). The following fluorochrome-conjugated antibody clones were used: CD3 (clone 17A2), CD4 (clone GK1.5) and CD8a (clone 53–6.7).
TAM viability
TC1 derived TAMs and matched T cells (derived from the spleen) were harvested as described above. TAMs were plated at a density of 30.000 cells/well in a 96 well plate and incubated with 10 μg/ml anti-PDL1(Polpharma Biologics), 5μM LY294002 (Tebu-bio #1543664), 5μM PD98059 (Tebu-bio #T2623), 5μM SC75741 (Tebu-bio #T6661) or 5μM S-ruxolitinib (Tebu-bio #T6156). After 48h, cell viability was measured by performing an MTT.
Enzyme-linked immunoassay (ELISA)
Derived media of DC vaccines as described above was used to perform a CXCL10 ELISA (R&D systems#DY466. For IFNα and β secretion, TC1 cells were treated with 1 μg/ml LPS (Invivogen# tlrl-eblps), 100 μg/ml imiquimod (Invivogen #tlrl-imqs), 10 μg/ml 5′ppp-dsRNA/lyovec (Invivogen #tlrl-3prnaclv), 2′3′ cGAMP (Invivogen #tlrl-nacga23) 25μM doxorubicin (Merck #D1515) or 100μM cisplatin (Merck #PHR1624) for 24h. An ELISA for PDL1 (R&D systems #DY1019), IFN alfa (Invivogen #luex-mifnav2) and beta (Invivogen #luex-mifnbv2) was performed according to manufacturer’s protocol.
Quantitative polymerase chain reaction (qPCR)
The RNA of DC vaccines was extracted using the Purelink RNA Mini Kit (ThermoFischer #12183025). Using the QuantiTect Reverse Transcription kit (Qiagen #205313) cDNA was synthesized from RNA. The qPCR was performed on the StepOnePlus Real-Time PCR system (Applied Biosystems) using SYBRgreen (Highqu #QPD0150) with the following primers: Irf7, Rsad, Mx1, Cxcl9, Cxcl10 and Actin (all primers were ordered at Integrated DNA Technologies, sequences available in material 1). Fold change was determined using the 2ˆΔΔCT method compared to the house keeping gene, Actin, and untreated DCs.
Antibody array
Derived media of DC vaccines as described above was used for a mouse cytokine array panel A (R&D systems #ARY006) was used. Cytokine array was performed according to the manufacturer’s protocol. Arrays were read on the ChemiDoc (Biorad). Dot intensities were determined using Image Lab (Biorad). From all values, the background was subtracted. Normalization was done using DCs stimulated with live cancer cells. Fold-change values derived from above antibody array for different immunological factors, cytokines or chemokines per treatment condition were used to run a GSEA analysis using WebGestalt (WEB-based Gene SeT AnaLysis Toolkit), which is a functional enrichment analysis web tool.103 This GSEA analysis was run with Mus musculus as reference organism for Gene Ontology Biological Process term enrichment with the following analyses parameters: minimum number of genes for a category, 3; maximum number of genes for a category, 2000; significance level, top 10; number of permutations, 1000; p, 1; collapse method, mean; number of categories expected from set cover, 10.
Efferocytosis assay
30 000 bone marrow derived dendritic cells were plated in white clear bottom 96 well plate (Corning #3610) per well. Untreated or dying cancer cells were collected 24h after cell death induction. Cells were stained with 20 μg/mL pHRodo (ThermoFischer #P35373) for 1h and washed with FBS. Cells were added to BMDCs in a 1:1 ratio. Plates were kept at 37°C under 5% CO2 or at 4°C as a negative control. Fluorescence at excitation 490nm and emission 520nm were measured at different time points; 8, 20, 24, 30, 40 and 48 h after co-incubation on a microplate reader (BioTek). For the efferocytosis index calculations, fluorescent intensity values at 37°C were subtracted by the appropriate 4°C negative control.
5-Bromo-2′-deoxyuridine assay (BrdU-assay)
Isolated glioblastoma TAMs were plated with graded cell numbers from 20.000 to 100 cells in a dilutional series in 200 μL/well in a 96-flat-bottom plate and incubated overnight at 37°C and 5% CO2. The following day, 1x10⁵ cells/well allogeneic CD14-depleted PBMC were added in 100 μL resulting in a final volume of 200 μL per well. Additionally, anti-PD-L1 (500 ng/mL) was added to some of the cultures to analyze its effect on macrophage-stimulated T cellT-cell proliferation. X-Vivo 15 media as well as PBMC (1x10⁵ cells) or macrophages (2x10⁵ cells) alone were used as negative controls. After five days of culture, cells were "pulsed" with 20 μL BrdU/well (BD Bioscience #550891) previously diluted 1:100 in X-Vivo-15 medium and incubated for 16 to 24 h at 37°C and 5% CO2 to allow the base analogue BrdU to be incorporated in place of thymidine during the cell division of the proliferating cells. After incubation, cells were washed and fixed with 200 μL/well FixDenat for 30 min, followed by an incubation with 100 μL/well of a 1:100 diluted anti-BrdU antibody for 90 min, during which the peroxidase-conjugated antibody binds to the BrdU incorporated into the newly synthesized DNA. After discarding the antibody, cells were washed three times with 200 μL/well washing buffer diluted 1:10 in distilled water to remove non-specifically bound antibody. Cells were then incubated for a maximum of 30 min with 100 μL/well of a substrate solution (tetramethylbenzidine - TMB), which is converted to a blue dye by the peroxidase bound to the BrdU-anti-BrdU complex. The optical density was analyzed using an ELISA reader (660 nm versus 490 nm).
Cell isolation
Murine bone marrow-derived dendritic cells and macrophages
Bone marrow was isolated from wild type C57BL/6j, Ifnar−/− or Ccr7−/− mice. Both the femur and tibia were flushed using PBS and the cell suspension was centrifuged for 5 min at 1500rpm. The pellet was resuspended in red blood cell lysis buffer (Merck life science), incubated for 5 min and centrifuged. Cells were resuspended in RPMI supplemented with 100 u/mL penicillin, 100 μg/L streptomycin, and 10% heat-inactivated fetal bovine serum (FBS). Bone marrow derived cells were differentiated into macrophages by adding 25 ng/mL M-CSF (Peprotech #315-02) into the media for 6 days. For differentiation into DCs, 20 ng/mL GM-CSF (Peprotech #315-03) and 10 ng/mL IL4 (Peprotech #214-14) was added to the media for 7 days, with the exception of the macrophage-like vaccine which was stimulated with 20 ng/mL GM-CSF (Peprotech #315-02) and 10 ng/mL IL4 (Peprotech #214-14). Media was replenished after 3 days. Differentiation of dendritic cells and macrophages was confirmed by flow cytometry with respectively following fluorochrome-conjugated antibody clones were used; CD11b (clone M1/70), CD11c (clone N418) and CD11b (clone M1/70), F4/80 (clone BM8).
Murine splenocytes and T cells
Splenocytes were obtained from the spleen from wild type C57BL/6j mice. Spleens were minced and filtered through a 70-micron cell strainer. Cells were incubated in red blood cell lysis buffer for 5 min and centrifugated. For T cell isolation, splenocytes were purified using the negative selection pan-T cell isolation kit II (Miltenyi #130-095-130). Cells were maintained in RPMI supplemented with 100 u/mL penicillin, 100 μg/L streptomycin,10% heat-inactivated fetal bovine serum (FBS) and 100 IU/mL IL-2 (Peprotech #210-12). Following fluorochrome-conjugated antibody clones were used to confirm isolation of T cells by flow cytometry; CD3 (clone 17A2), CD4 (clone GK1.5) and CD8a (clone 53–6.7).
Murine lymph node isolation
3 days after DCvax-IT vaccination, mice were sacrificed, and the axillary and inguinal lymph nodes of both sides were isolated. To create a single cell suspension, lymph nodes were minced and filtered through a 70-micron cell strainer and analyzed by flow cytometry immediately. Following fluorochrome-conjugated antibody clones were used to analyze the isolated lymph nodes by flow cytometry; CD11c (clone N418), XCR1 (clone ZET), CD172A (clone P84), MHCII (clone M5/114.15.2), PDL1 (clone 10F.9G2), PD1 (clone RMP1-30), CD86 (clone GL1), F4/80 (clone T45-2342), CSF1R (clone AFS98), CD11b (clone ICRF44) and CD206 (clone C068C2).
Murine tumor infiltrating leukocytes (TILs) and tumor-associated macrophages (TAMs)
Tumors were isolated on day 23 after tumor injection. A single cell suspension was made, using the tumor dissociation kit (Miltenyi #130-096-730). TILs were isolated through magnetic bead separation via CD45 (Miltenyi #130-110-618). The CD45 negative population was collected for further flow cytometry analysis. For TAM isolation, anti-F4/80 microbeads (Miltenyi #130-110-443) were used. Isolated TILs and TAMs were either maintained in RPMI supplemented with 100 u/mL penicillin, 100 μg/L streptomycin, 10% heat-inactivated fetal bovine serum (FBS) or stained for flow cytometry immediately. Following fluorochrome-conjugated antibody clones were used; FOXP3 (clone MF-14), GATA3 (clone TWAJ), CD62L (clone MEL-14), TCF1/7 (clone S33-966), CD107a (clone 1D4B), TOX (clone REA473), Tbet (clone O4-46), CD3 (clone 17A2), CD8a (clone 53–6.7), Ki-67 (clone 11F6), CD45 (clone 30-F11), Eomes (clone Dan11mag), CD127 (clone SB/199), PD1 (clone RMP1-30), CD4 (clone GK1.5), TIM3 (clone 5D12/TIM-3), IL2 (clone JES6-5H4), TNFα (clone MP6-XT22), IFNγ (clone XMG1.2), PDL1 (clone 10F.9G2 or 10F.2H11), PD1 (clone 29F.1A12), Siglec H (clone 551), CD11c (clone N418), XCR1 (clone ZET), CD172A (clone P84), MHCII (clone M5/114.15.2), PDL1 (clone 10F.9G2), PD1 (clone RMP1-30), CD86 (clone GL1), F4/80 (clone T45-2342), CSF1R (clone AFS98), CD11b (clone ICRF44), CD206 (clone C068C2), TNF (clone MP6-XT22), TRAIL (clone N2B2), FASL (clone KAY-10), CD31 (clone 390) and CD90.2 (clone 30-H12).
Human TIL isolation
For TIL isolation, surgically resected tumor samples of GBM patients at first diagnosis (primary GBM) or at recurrence after dendritic cell vaccination were collected and stored in MACS tissue storage solution (Miltenyi #130-100-008) for a maximum of 24 h at 4°C. TILs were isolated from tumor samples by the tumor dissociation kit (Miltenyi #130-095-929) and magnetic bead isolation using CD45+ beads (Miltenyi #130-045-801). For flow cytometric analysis, the CD45+ cells were stained for T cell and TAM characterizing markers: CD3 (clone OKT3 or UCHT1), CD4 (clone okt/04 or REA636)), CD8 (clone RPA-T8 or Sk1 or BW135/80), CD45RO (clone UCHL1), CD45 (clone REA747), CD163 (clone REA812), CD45PcP (clone 2D1), CD14 (clone 63D3), CSF1R (clone AFS98), CD274 (clone M1H1), isotype control (clone X40 or MOPC-21 or 27–35 or P3.6.2.8.1) for 15 min at 4°C, washed with phosphate-buffered saline (PBS), fixed with 4% d1) paraformaldehyde (PFA) and analyzed on a Cytoflex flow cytometer, using CytExpert 2.3 software (Beckman-Coulter).
For detection of interferon-γ, TILs were stimulated in X-Vivo 15 media (Lonza #BE02-060F) with 5 ng/mL phorbol myristate acetate (PMA) (Sigma-Aldrich #P8139) and 500 ng/mL Ionomycin (Sigma-Aldrich #I9657) for 5 h in the presence of 5 μg/mL Brefeldin A (BioLegend#420601) at 37°C and 5% CO2 in a humidified atmosphere. After stimulation, cells were washed with PBS, stained for CD3, CD4, CD8 and CD45RO for 15 min at 4°C, washed with PBS and fixed for 15 min with 4% PFA. Subsequently, cells were permeabilized with 0.05% saponin in PBS (Sigma-Aldrich), stained intracellularly with: IFNγ (clone 4S.B3), CD3 (clone OKT3 or UCHT1), CD4 (clone okt/04 or REA636)), CD8 (clone RPA-T8 or Sk1 or BW135/80) and isotype control (clone X40 or MOPC-21 or 27–35 or P3.6.2.8.1) for 15 min and subjected to flow cytometric analysis.
Human CD14+ CD163+ macrophages
To separate macrophages from tumor-infiltrating leukocytes, cells were adjusted to a cell titer of 2.5x 10⁷cells/mL in 0.5% HSA/D-PBS and stained with monoclonal antibodies directed against CD14 (clone 63D3) and CD163 (clone REA812). First, myeloid cells were identified by their typical FSC vs. SSC. Doublets are excluded via an SSC (W) vs. SSC (H) gating. Finally, within this single cell population, cells were gated based on their CD14 and CD163 expression, thereby targeting the double-positive population using an unstained control. This population was then sorted with a MoFlo XDP Sorter (Beckmann Coulter) into a 5 mL round bottom tube containing 1mL 100% FCS.
Immunohistochemistry
Human glioblastoma tissues from patients enrolled in the GlioVax Trial were obtained from the Department of Neuropathology, University Hospital Duesseldorf, and prepared as follows: Human tumor samples of primary as well as vaccinated patients after tumor recurrence were taken during surgery and fixed with buffered formaldehyde solution for up to 24 h. All tissues were subsequently washed and embedded in paraffin for archival storage. Samples from paraffin blocks were cut into 4-μm-thick sections (HM315 Microtom; Microm International GmbH, Walldorf, Germany), mounted on polylysine-coated microscope slides (Menzel, Bielefeld, Germany), air-dried thoroughly and stored until use. Paraffin was removed from sections by immersing two times for 10 min in 98.5% isomeric xylene (Carl Roth, Karlsruhe, Germany). To rehydrate the tissue, slides were immersed in decreasing concentrations of graded ethanol (2 × 5 min 100%, 5 min 96% and 5 min 70%), washed in deionized water and transferred to phosphate-buffered saline (PBS; Sigma Aldrich, Darmstadt, Germany). Antigen retrieval was achieved by cooking the slides 3 × 5min in Tris/ethylenediamine tetraacetic acid (EDTA) retrieval buffer at pH 9 (Sigma Aldrich). Slides cooled down to room temperature and transferred into PBS. For permeabilization, slides were incubated with a 0.3% Triton X-100 solution (Sigma Aldrich) for 10 min at room temperature. Unspecific Binding of was blocked by using FcR-Block (Miltenyi Biotec, Bergisch Gladbach, Germany) and 5% BSA-Solution (Sigma Aldrich).
Immunofluorescence Staining was performed with rabbit-anti-human CD8 – AF647 (clone EP1150y; 1:100; abcam, Cambridge, UK) and a primary mouse-anti-human CD163 (clone OTI2G12; 1:200; abcam) over night at 4°C. Secondary goat-anti-mouse Alexa Fluor 488 staining (#ab150113; 1:500; abcam) was performed for 2h at RT. Nuclear staining was performed with Hoechst 33342 (1 μg/mL – Life Technologies, Carlsbad, California, US). Quenching of autofluorescence was achieved by treatment with Background BackDrop Suppressor Red, Green, and Blue (molecular probes, Life Technologies) for 5 min at RT. Slides were mounted with the water-soluble mounting medium Fluoromount G (Life Technologies). A Zeiss inverted microscope was used for documentation (LSM800; Zeiss, Oberkochen, Germany). Several areas of vital tumor tissue infiltrated with immune cell subsets were selected for the scoring. Five to ten high power fields (HPF; 200× magnification) were assessed per sample quantifying the presence of the infiltration with CD8+ T cells or CD163+ macrophages.
In vivo experiments
Mouse experiments
Seven to twelve-week-old female/male C57BL/6J mice were subcutaneously (s.c) injected with 1x10⁶ TC1 LLC or MC38 cells. For prophylactic vaccinations, 1x10⁶ DCs were injected s.c twice (one week apart), before TC1-tumor inoculation. Mice were rechallenged with 1x10⁶ TC1 cells after 30 days. For curative vaccinations, 1x10⁶ DCs were injected s.c on day 9 and 16 after TC1 inoculation. When applicable, mice were cotreated with 250 μg of anti-PDL1 (clone MIH5; Polpharma Biologics) or D265A mutated anti-PDL1(Invivogen; described in Baudino et al. 2008104), anti-CTLA4 (clone 4F10; Polpharma Biologics), anti-CSF1R (AFS98; BioXCell), or anti-PD1(RMP1-14; Polpharma Biologics), on day 10 and 17 via intraperitoneal (i.p.) injections. For CD8 depletion experiments, mice were given 200 μg of anti-CD8 (clone YTS169; Polpharma Biologics), i.p. one day before tumor inoculation and then every other day until the tumor reached 500 mm3. When applicable, cisplatin (8 mg/kg) (Sigma #p4394) was given on day 9 and 16. As indicated, 200μL clodronate liposomes (Liposoma) was given one day before tumor injected and every 2/3 days subsequently. Anti-NK1.1 and anti-IFNγ treatment regimens were derived from Hua et al. 2022.67 500μg of anti-NK1.1 was administrated three consecutive days before the start of treatment followed by weekly injections. 250 μg of anti-IFNγ was given twice a week starting one day before treatment. Mice were monitored and weighed every other day and tumor volume was determined by height x width x length.
CM-DIL
DC vaccines were stained with 1μL/106 DCs of CellTracker CM-Dil dye (Thermofischer #C7000) prior to DC vaccination. 72 h after vaccination mice were euthanized and both the left and right axillary and inguinal lymph nodes were isolated. Single cell suspension was stained with the following fluorochrome-conjugated antibody clones: CD11b (clone M1/70), CD11c (clone N418), F4/80 (clone QA17A29), XCR1 (clone ZET), CD172A (P84), pSTAT1(pY701) and Siglec-H (551).
In silico analyses
Transcriptomic analysis with The Cancer Genome Atlas (TCGA) datasets
Immuno-transcriptomic analyses
We used the bulk transcriptomes of TCGA as pre-processed by the Toil-recompute project105 in Xena106 Immune cell proportions were inferred using the Quantiseq approach for immune cell deconvolution.107 Filtering by Overlapping the Thorsson immune subtype class labels17 from TCGA pan-cancer analyses (C1 to C6; see results for more details), resulted in 9126 samples in total. Overall Z score normalized enrichment analyses was performed for each respective immune cell-fractions or as ratios per immune subtype class, specified in the figure legends and the text. Survival endpoints were obtained from the same Xena Toil-Recompute TCGA data hub. A radar plot representation visualizing the Spearman’s correlations between CD274 gene expression levels in M1 or M2 macrophage fractions, was built using all patients from same TCGA data for which C1-C6 immune subtype class labels were available.
Extracellular network analyses
The extracellular network analyses was performed following the CRI iAtlas portal tools and methodology.18 Herein, this network analyses uses a database of well-established ligand-receptor, cell-receptor, and cell-ligand pairs previously published elsewhere19 and retrieved via FANTOM519). Therefore, the network is built based on three criteria i.e., selected TCGA immune subtype class labels, Abundance threshold (%) and Concordance or Discordance threshold. Since the aim of the analyses was to reveal features of T cell-hostile tumors, it was hence restricted to only C4/C5 TCGA class-labels. Hence, abundance threshold creates a selection threshold for the nodes in the network wherein the abundance threshold is the frequency of samples in the upper 2 tertiles of cell-abundance or gene expression-distributions. Here we used the default abundance threshold of 66%. Finally, concordance threshold values are relevant for the inclusion of the edges in the network between any two relevant nodes. Concordance threshold is computed based on a contingency table consisting of the ternary values of the two applicable nodes for an edge. However, we pre-programmed this threshold to capture discordance probability i.e., an edge with a concordance score of 0.5 that is considered discordant because the analyses with threshold of 0.5 captures information on one node being highly expressed while the other being lowly expressed (thus, discordant, or uncorrelated) rather than both being simultaneously highly or lowly expressed.
GISTIC analysis
For genes derived from above extracellular network analyses (TNF, EDN3, IL13, EDN1, CX3CL1, VEGFB, IFNA2, IFNB1, IFNG, HMGB1, IL1A, IL1B), we performed high resolution copy number variation (CNV) analyses using the TCGA’s genomic data via the GISTIC toolset poral21 (https://portals.broadinstitute.org/tcga/home). we used the Gene-Centric GISTIC Analyses wherein, amplifications and deletion tendencies were separately analyzed per gene across a standardized pan-cancer TCGA dataset (i.e., 2013-08-16 TCGA Pan-Cancer data set), consisting of data from 4934 primary tumor samples passing GISTIC’s default’s quality control criteria from following cancer-types: bladder cancer (136), breast cancer (880), colorectal adenocarcinomas (585), glioblastoma multiforme (580), head and neck squamous cell cancer (310), kidney clear cell carcinoma (497), acute myeloid leukemia (200), lung adenocarcinoma (357), lung squamous cell carcinoma (344), ovarian serous carcinoma (563), and uterine endometrial carcinoma (496).
Prognostic impact analysis
For prognostic analyses i.e., impact of co-association between CD274 and macrophage immune-fractions (TIMER-derived) on overall survival in multiple TCGA cancer-datasets spanning 19 cancer-types and 8493 patients, we utilized the TIMER2.0 portal.108,109 the “Outcome module” was used for estimating the prognostic impact along with corrections for multiple covariates (stage, age, gender) in a multivariable Cox proportional hazard model. The hazard ratio from the Cox model was then computed into z-scores herein Z score >0 meant negative prognostic impact (shorter survival) while Z score <0 meant positive prognostic impact (prolonged survival). For this analyses, the following TCGA cancer datasets were utilized (number of patients in brackets): BLCA (n = 408), BRCA (n = 1100), COAD (n = 458), GBM (n = 153), HNSC-HPV- (n = 422), HNSC-HPV+ (n = 98), KICH (n = 66), KIRC (n = 533), KIRP (n = 290), LGG (n = 516), LIHC (n = 371), LUAD (n = 515), LUSC (n = 501), OV (n = 303), PAAD (n = 179), PCPG (n = 181), PRAD (n = 498), READ (n = 166), SARC (n = 260), SKCM (n = 471), STAD (n = 415), THCA (n = 509), UVM (n = 80).
Immuno-oncology clinical trials analyses
Gene expression data for 12 clinical trials spanning 1142 patients in 5 cancer-types,110,111,112,113,114,115,116,117,118,119,120,121 was downloaded from the Synapse server associated with the CRI iAtlas portal (syn24200710).18 We applied the immune subtype classifier (C1-C6) from the original paper (https://github.com/CRI-iAtlas/ImmuneSubtypeClassifier) on the normalized gene expression data to infer the immune subtypes. Cancer immune subtypes C2/3/6 and C4/5 were merged as separate categories and differences in patient survival (OS) were investigated using lifelines 0.27.0 in Python 3.9.5. Statistical significance was investigated using the log rank test.
Transcriptomics analyses for murine subcutaneous tumors’ bulk-RNAseq data
Affymetrix Mouse Exon 1.0 ST Array data, profiled from subcutaneous tumors based on B16-F10, TC1, CT26, MC38, LL2/LLC, RENCA, 4T1, TRAMPC1, EL4, P815 or PAN02 murine cancer cell lines implanted in syngeneic mice backgrounds, was derived from an existing published study (i.e., GSE85509)27 and analyzed for expression levels of following metagene-signatures: pro-lymphocytic IFNγ/effector signaling, macrophages, type I IFN/ISG-response, or DCs,27,28 and represented as a row-normalized heatmap.
In another case, for differential gene-expression (DGE) analyses, above transcriptomics data for TC1-tumours and MC38-tumours were analyzed in R 4.2.0, using the package oligo 1.60.0.122 All corresponding CEL files were imported and RMA-corrected, then summarized to the gene level for which identifiers were mapped based on the NetAffx CSV files provided by Affymetrix (MoEx-1_0-st-v1.na28.mm9.transcript.csv). For the pairwise comparison between TC1 and MC38, we used limma 3.52.2123 and applied t-tests with empirical Bayesian shrinkage of variance. pP-values were adjusted in accordance with the Benjamini-Hochberg method.
Finally, for Correlation gene-set enrichment analyses (GSEA) analyses, following assorted genes specifically enriched in the TC1-tumours (compared to MC38-tumours) from above DGE analyses, that we further annotated as myeloid/macrophage-signaling relevant based on literature were utilized: Dkk2, Figf, Akr1c18, Ptgs1, Ereg, Thbs1, Thbs2, Ptgs2, Aspa, Pla2g7, Pdpn, Pla2g4a, Areg, Cd80, Nox4, Abca1, Cd33, Il1rl1, P2ry5, Axl, Mrc1, Gas2, Ctsl. Correlation GSEA analyses of this gene-set (gene-set 1) versus well-established translationally-relevant markers of tumor-associated macrophages (Cx3cr1, Ccr2, Tek, Csf1r, Cd274, Pdcd1, Sirpa, Ido1, Pdcd1lg2, Cd40124,125) (gene-set 2) was performed against the background of a reference murine macrophage transcriptomic-profile, using the standardized work-flow of Immuno-Navigator portal.55
Maturation trajectory analyses for single-DC vaccine’s transcriptomes
Trajectory analyses of monocytic-derived DC vaccines micro-array transcriptomes was performed using the Gene Expression Omnibus (https://www.ncbi.nlm.nih.gov/geo/) dataset (GSE85698).23 This study included 93 DC vaccines that were administered to 18 prostate carcinoma (PDAC) patients. Each patient received multiple lots of autologous DC. Vaccination regimen included 5 vaccinations (one every 3 weeks) with boost vaccinations in case of response. At least 2 vaccines per patient are included. Normalized microarray expression dataset was extracted from GEO portal and further processed to filter mitochondrial genes and non-protein coding genes. Microarray’s duplicated annotation probes was collapsed by per-gene average ratio of probe’s expression values. Initial dimensionality reduction to further calculate trajectory inference was performed using high variable genes with additional threshold parameters of loess fraction 0.1 and number of genes ≤ 4000. Hence UMAP dimensionality reduction was based on the top 9 principal components which covered 99.9% of genetic variance and was computed on a 2-dimensional scale of 4 neighbors. Trajectory inference was performed using STREAM (Huidong Chen et al., Nature Comm, 2019) on the precomputed dimensionality reduction using “seed elastic principal graph” algorithm with default parameters except for 4 neighbors and “ap” clustering algorithm. Further branch pruning was performed using “elastic principal graph” with default parameters except for epg_alpha 0.01, epg_mu 0.2, epg_lambda 0.03, epg_n_nodes 5 and incr_n_nodes 3. Signature expression of several signatures was calculated on per DC vaccine sample of average expression genetic profiles. Leaf markers were calculated using “detect leaf markers” function against root S0 group using default parameters except for cutoff_zscore 1.0, cutoff_pvalue 1.0, min_num_cells 5 and percentile_expr 99. Pathway analysis for each leaf marker genes was computed using gseapy with signal to noise methodology of gene set permutation type for a maximum of 2000 permutations, including Reactome pathways between 1 and 2000 genes. Top ranked and biologically relevant Reactome pathways were plotted based on this Normalized Enrichment Score (NES) and FDR values.
Analysis of TC1-tumor’s single-cell RNA-sequencing (scRNAseq) datasets
Single-cell gene expression for untreated TC-1 tumors (GSM7103827) was downloaded from the gene expression omnibus.53 Objects were pre-processed with Scanpy 1.9.3. Cells with less than 200 counts were removed, genes expressed in less than 10 cells were also discarded. Counts were normalized to 10000 cells per cell and log transformed. Highly variable genes with at least 0.0125 expression, max mean 3 and minimal dispersion of 0.5, resulting in 2281 cells and 4015 highly variable genes. Cells that could not be reliably annotated were removed, reducing the cell count from 2281 to 1838. Cells were annotated using the BioTuring cell type prediction approach (HaiTam v3, Talk2data https://talk2data.bioturing.com/predict). UMAPs were calculated using UMAP-learn 0.5.3 through Scanpy. Differential gene expression was obtained with Scanpy’s rank_genes_groups function. Corresponding fold changes and associated p values were plotted as lollipop plots using Matplotlib 3.7.1. Raw expression data was loaded through Seurat 4.3.0.1 and SeuratDisk 0.0.0.9020 in R 4.3.1 and queried for inferred interactions with CellChat 1.6.1. Macrophages were assigned to the PD-L1 positive class using expression of Cd274 > 0.
Analysis of cancer patient’s single-cell RNA-sequencing (scRNAseq) datasets
For analyses of CD274 or Cd274 expression at single-cell resolution on pan-tumor level, various scRNAseq pan-tumor maps from existing peer-reviewed literature were accessed from the Tumor Immune Single Cell Hub,126 a large-scale curated database integrating single-cell transcriptomic data from >2 million single-cells (with a uniform/standardized workflow accounting for quality control and batch-effects) across >75 high-quality tumor-derived datasets. We used the Gene Exploration module of TISCH to short-list scRNASeq datasets with stable expression profiling available for at least most of the following tumor-associated cells: CD4+T cells, CD8+T exhausted cells, NK cells, CD8+T cells in general, fibroblasts, endothelial cells, B cells, malignant/cancer cells, DCs and macrophages. This delineated 21 eligible single-cell (sc)RNAseq datasets spanning 13 diverse cancer-types (SARC, CRC, SKCM, HNSC, UVM, Glioma/GBM, CHOL, OV, LIHC, NSCLC, BRCA, PAAD, BCC), 287 patients and 2 species (humans or mice), further accessible here: GSE119352, GSE122969, GSE120575, GSE103322, GSE120909, GSE139829, GSE123139, GSE139324, GSE141982, GSE125449, GSE118828, GSE131907, GSE139555, GSE136206, GSE111672, GSE131928, GSE146771, GSE115978, GSE99254, GSE110686, GSE123813. Across these datasets, we derived average gene expression of CD274 or Cd274 across an entire cell-type cluster per scRNAseq dataset and integrated all the values to create row-normalized heatmaps.
Predictive analyses of PDL1+TAMs signature in immuno-oncology clinical trials
Pre-treatment tumor-derived gene expression data for 454 cancer patients (185 responders vs. 269 non-responders) treated with anti-PDL1 ICB (atezolizumab or durvalumab) spanning 5 cancer-types (4 patients with ureter/renal pelvis cancer, 345 with urothelial cancer, 31 with bladder cancer, 72 with esophageal cancer and 2 with renal cell carcinoma), or 761 cancer patients (504 responders vs. 257 non-responders) treated with anti-PD1 ICB (nivolumab or pembrolizumab) spanning 11 cancer-types (39 patients with lung cancer, 14 with glioblastoma, 7 with ureter/renal pelvis cancer, 45 with gastric cancer, 5 with colorectal cancer, 415 with melanoma, 59 with bladder cancer, 22 with hepatocellular carcinoma, 14 with breast cancer, 31 with renal cell carcinoma, and 110 with head & neck cancer) were accessed from the ROC Plotter server.127,128 We interrogated the impact of a PDL1+TAM metagene (composed of CD68, CD163, CD14, CD274) on tumor-level objective response rate (ORR)-based responders vs. non-responders for either anti-PDL1 or anti-PD1 ICB treatments. Analyses was restricted to pre-treatment transcriptome while excluding any statistical outliers. Statistical significance was investigated using the Mann-Whitney U test.
Quantification and statistical analysis
The statistical details of all the analyses are reported either in the figure legends, figures and/or methods sections, including statistical analysis performed, statistical significance thresholds/values and in most cases the counts/number of data-points. All the statistical tests used herein were always two-tailed unless otherwise explicitly mentioned. Gene signatures were estimated by considering the average expression of all the genes within that signature, unless otherwise mentioned. Details about used software for analysis can be found in the key resources table.
Acknowledgments
We thank R. Vandenbroucke (UGent) for Ifnar1−/−C57BL/6 mice and B. Lambrechts (UGent) for Ccr7−/−C57BL/6 mice. We acknowledge AdLight Microscopy Core Facility (UKD) and KU Leuven Flow/Mass cytometry core facility. This study is supported by Research Foundation Flanders (G0B4620N, A.D.G.; EOS grant, 30837538/DECODE, A.D.G./J.B.), KU Leuven (C14/19/098; C3/21/037, A.D.G.), Kom op tegen Kanker (KOTK/2018/11509/1, S.D.V./A.D.G.) and VLIR-UOS (iBOF/21/048/‘MIMICRY’, A.D.G./S.T.). I.V. and J.S. are supported by FWO-SB PhD Fellowship (1S06821N) and KOTK EvDS PhD fellowship (projectID: 12699). S.T. is supported by FWO Senior Clinical Investigator award. M.C.S., M.R., and R.V.S. were supported by Federal Ministry of Education and Research (BMBF; grant #01KG1424). V.M. is supported by FWO PhD fellowship (11l7523N). G.K. is supported by Ligue Contre le Cancer, Agence National de la Recherche (ANR); AMMICa US23/CNRS UMS3655; Association pour la Recherche sur le Cancer; Cancéropôle Île-de-France; Fondation pour la Recherche Médicale; Elior donation; Equipex Onco-Pheno-Screen; European Joint Programme on Rare Diseases (EJPRD); ERC Advanced Investigator Award (ERC-2021-A.D.G., ICD-Cancer, 101052444), EU Horizon 2020 Projects Oncobiome, Prevalung (101095604) and Crimson; Institut National Du Cancer; Institut Universitaire de France; Labex Immuno-Oncology (ANR-18-IDEX-0001); Cancer Research ASPIRE Award (Mark Foundation); RHU Immunolife; Seerave Foundation; SIRIC Stratified Oncology Cell DNA Repair and Tumor Immune Elimination (SOCRATE); SIRIC Cancer Research and Personalized Medicine (CARPEM); and IdEx Université de Paris ANR-18-IDEX-0001.
Author contributions
J.S. was lead experimental researcher. S.N. and D.M.B. did bioinformatics/biostatistics. I.V., J.G., R.S.L., A.C., V.M., P.L., L.Z., O.K., G.K., L.B., A.Z.Z., M.R., A.C., and S.S. performed crucial experiments. A.D., M.K., J.F., M.S., M.R., C.K.T., and R.V.S. analyzed GBM-patient samples. G.K. rewrote sizable manuscript portions. S.D.V., J.B., and S.T. helped with data interpretation and manuscript writing. A.D.G. and R.V.S. supplied senior supervision and critical manuscript revision. A.D.G. was principal investigator, coordinated and supervised the entire project, and wrote the manuscript.
Declaration of interests
A.D.G. received honoraria/funding from Boehringer Ingelheim, Miltenyi Biotec, Novigenix, SOTIO, and IsoPlexis.
Published: January 16, 2024
Footnotes
Supplemental information can be found online at https://doi.org/10.1016/j.xcrm.2023.101377.
Supplemental information
References
- 1.Sharma P., Allison J.P. Dissecting the mechanisms of immune checkpoint therapy. Nat. Rev. Immunol. 2020;20:75–76. doi: 10.1038/s41577-020-0275-8. [DOI] [PubMed] [Google Scholar]
- 2.Blank C.U., Haining W.N., Held W., Hogan P.G., Kallies A., Lugli E., Lynn R.C., Philip M., Rao A., Restifo N.P., et al. Defining “T cell exhaustion”. Nat. Rev. Immunol. 2019;19:665–674. doi: 10.1038/s41577-019-0221-9. [DOI] [PMC free article] [PubMed] [Google Scholar]
- 3.Thommen D.S., Schumacher T.N. T cell dysfunction in cancer. Cancer Cell. 2018;33:547–562. doi: 10.1016/j.ccell.2018.03.012. [DOI] [PMC free article] [PubMed] [Google Scholar]
- 4.Naulaerts S., Datsi A., Borras D.M., Antoranz Martinez A., Messiaen J., Vanmeerbeek I., Sprooten J., Laureano R.S., Govaerts J., Panovska D., et al. Multiomics and spatial mapping characterizes human CD8+ T cell states in cancer. Sci. Transl. Med. 2023;15 doi: 10.1126/scitranslmed.add1016. [DOI] [PubMed] [Google Scholar]
- 5.Borras D.M., Verbandt S., Ausserhofer M., Sturm G., Lim J., Laureano R.S., Vanmeerbeek I., Sprooten J., Hong Y., Wall R., et al. Single cell dynamics of tumour specificity vs. bystander activity in CD8+T cells define the diverse immune landscapes in colorectal cancer. Cell Discov. 2023;9 doi: 10.1038/s41421-023-00605-4. [DOI] [PMC free article] [PubMed] [Google Scholar]
- 6.Nakamura K., Smyth M.J. Myeloid immunosuppression and immune checkpoints in the tumor microenvironment. Cell. Mol. Immunol. 2020;17:1–12. doi: 10.1038/s41423-019-0306-1. [DOI] [PMC free article] [PubMed] [Google Scholar]
- 7.Beyranvand Nejad E., Labrie C., Abdulrahman Z., van Elsas M.J., Rademaker E., Kleinovink J.W., van der Sluis T.C., van Duikeren S., Teunisse A.F.A.S., Jochemsen A.G., et al. Lack of myeloid cell infiltration as an acquired resistance strategy to immunotherapy. J. Immunother. Cancer. 2020;8 doi: 10.1136/jitc-2020-001326. [DOI] [PMC free article] [PubMed] [Google Scholar]
- 8.Goswami S., Anandhan S., Raychaudhuri D., Sharma P. Myeloid cell-targeted therapies for solid tumours. Nat. Rev. Immunol. 2023;23:106–120. doi: 10.1038/s41577-022-00737-w. [DOI] [PubMed] [Google Scholar]
- 9.Vanmeerbeek I., Borras D.M., Sprooten J., Bechter O., Tejpar S., Garg A.D. Early memory differentiation and cell death resistance in T cells predicts melanoma response to sequential anti-CTLA4 and anti-PD1 immunotherapy. Gene Immun. 2021;22:108–119. doi: 10.1038/s41435-021-00138-4. [DOI] [PubMed] [Google Scholar]
- 10.Perez C.R., De Palma M. Engineering dendritic cell vaccines to improve cancer immunotherapy. Nat. Commun. 2019;10:5408. doi: 10.1038/s41467-019-13368-y. [DOI] [PMC free article] [PubMed] [Google Scholar]
- 11.Anguille S., Smits E.L., Lion E., van Tendeloo V.F., Berneman Z.N. Clinical use of dendritic cells for cancer therapy. Lancet Oncol. 2014;15:e257–e267. doi: 10.1016/S1470-2045(13)70585-0. [DOI] [PubMed] [Google Scholar]
- 12.van Beek J.J.P., Flórez-Grau G., Gorris M.A.J., Mathan T.S.M., Schreibelt G., Bol K.F., Textor J., de Vries I.J.M. Human pDCs Are Superior to cDC2s in Attracting Cytolytic Lymphocytes in Melanoma Patients Receiving DC Vaccination. Cell Rep. 2020;30:1027–1038.e4. doi: 10.1016/j.celrep.2019.12.096. [DOI] [PubMed] [Google Scholar]
- 13.Wculek S.K., Cueto F.J., Mujal A.M., Melero I., Krummel M.F., Sancho D. Dendritic cells in cancer immunology and immunotherapy. Nat. Rev. Immunol. 2020;20:7–24. doi: 10.1038/s41577-019-0210-z. [DOI] [PubMed] [Google Scholar]
- 14.Kvedaraite E., Ginhoux F. Human dendritic cells in cancer. Sci. Immunol. 2022;7 doi: 10.1126/sciimmunol.abm9409. [DOI] [PubMed] [Google Scholar]
- 15.Garg A.D., Coulie P.G., Van den Eynde B.J., Agostinis P. Integrating Next-Generation Dendritic Cell Vaccines into the Current Cancer Immunotherapy Landscape. Trends Immunol. 2017;38:577–593. doi: 10.1016/j.it.2017.05.006. [DOI] [PubMed] [Google Scholar]
- 16.Fucikova J., Hensler M., Kasikova L., Lanickova T., Pasulka J., Rakova J., Drozenova J., Fredriksen T., Hraska M., Hrnciarova T., et al. An autologous dendritic cell vaccine promotes anticancer immunity in ovarian cancer patients with low mutational burden and cold tumors. Clin. Cancer Res. 2022;28:3053–3065. doi: 10.1158/1078-0432.CCR-21-4413. [DOI] [PubMed] [Google Scholar]
- 17.Thorsson V., Gibbs D.L., Brown S.D., Wolf D., Bortone D.S., Ou Yang T.-H., Porta-Pardo E., Gao G.F., Plaisier C.L., Eddy J.A., et al. The immune landscape of cancer. Immunity. 2018;48:812–830.e14. doi: 10.1016/j.immuni.2018.03.023. [DOI] [PMC free article] [PubMed] [Google Scholar]
- 18.Eddy J.A., Thorsson V., Lamb A.E., Gibbs D.L., Heimann C., Yu J.X., Chung V., Chae Y., Dang K., Vincent B.G., et al. CRI iAtlas: an interactive portal for immuno-oncology research. F1000Res. 2020;9:1028. doi: 10.12688/f1000research.25141.1. [DOI] [PMC free article] [PubMed] [Google Scholar]
- 19.Ramilowski J.A., Goldberg T., Harshbarger J., Kloppmann E., Lizio M., Satagopam V.P., Itoh M., Kawaji H., Carninci P., Rost B., Forrest A.R.R. A draft network of ligand-receptor-mediated multicellular signalling in human. Nat. Commun. 2015;6:7866. doi: 10.1038/ncomms8866. [DOI] [PMC free article] [PubMed] [Google Scholar]
- 20.Garg A.D., Agostinis P. Cell death and immunity in cancer: From danger signals to mimicry of pathogen defense responses. Immunol. Rev. 2017;280:126–148. doi: 10.1111/imr.12574. [DOI] [PubMed] [Google Scholar]
- 21.Mermel C.H., Schumacher S.E., Hill B., Meyerson M.L., Beroukhim R., Getz G. GISTIC2.0 facilitates sensitive and confident localization of the targets of focal somatic copy-number alteration in human cancers. Genome Biol. 2011;12:R41. doi: 10.1186/gb-2011-12-4-r41. [DOI] [PMC free article] [PubMed] [Google Scholar]
- 22.Sprooten J., Agostinis P., Garg A.D. Type I interferons and dendritic cells in cancer immunotherapy. Int. Rev. Cell Mol. Biol. 2019;348:217–262. doi: 10.1016/bs.ircmb.2019.06.001. [DOI] [PubMed] [Google Scholar]
- 23.Castiello L., Sabatino M., Ren J., Terabe M., Khuu H., Wood L.V., Berzofsky J.A., Stroncek D.F. Expression of CD14, IL10, and Tolerogenic Signature in Dendritic Cells Inversely Correlate with Clinical and Immunologic Response to TARP Vaccination in Prostate Cancer Patients. Clin. Cancer Res. 2017;23:3352–3364. doi: 10.1158/1078-0432.CCR-16-2199. [DOI] [PMC free article] [PubMed] [Google Scholar]
- 24.Chen H., Albergante L., Hsu J.Y., Lareau C.A., Lo Bosco G., Guan J., Zhou S., Gorban A.N., Bauer D.E., Aryee M.J., et al. Single-cell trajectories reconstruction, exploration and mapping of omics data with STREAM. Nat. Commun. 2019;10:1903. doi: 10.1038/s41467-019-09670-4. [DOI] [PMC free article] [PubMed] [Google Scholar]
- 25.Maier B., Leader A.M., Chen S.T., Tung N., Chang C., LeBerichel J., Chudnovskiy A., Maskey S., Walker L., Finnigan J.P., et al. A conserved dendritic-cell regulatory program limits antitumour immunity. Nature. 2020;580:257–262. doi: 10.1038/s41586-020-2134-y. [DOI] [PMC free article] [PubMed] [Google Scholar]
- 26.Echebli N., Tchitchek N., Dupuy S., Bruel T., Peireira Bittencourt Passaes C., Bosquet N., Le Grand R., Bourgeois C., Favier B., Cheynier R., et al. Stage-specific IFN-induced and IFN gene expression reveal convergence of type I and type II IFN and highlight their role in both acute and chronic stage of pathogenic SIV infection. PLoS One. 2018;13 doi: 10.1371/journal.pone.0190334. [DOI] [PMC free article] [PubMed] [Google Scholar]
- 27.Mosely S.I.S., Prime J.E., Sainson R.C.A., Koopmann J.-O., Wang D.Y.Q., Greenawalt D.M., Ahdesmaki M.J., Leyland R., Mullins S., Pacelli L., et al. Rational selection of syngeneic preclinical tumor models for immunotherapeutic drug discovery. Cancer Immunol. Res. 2017;5:29–41. doi: 10.1158/2326-6066.CIR-16-0114. [DOI] [PubMed] [Google Scholar]
- 28.Sprooten J., Vankerckhoven A., Vanmeerbeek I., Borras D.M., Berckmans Y., Wouters R., Laureano R.S., Baert T., Boon L., Landolfo C., et al. Peripherally-driven myeloid NFkB and IFN/ISG responses predict malignancy risk, survival, and immunotherapy regime in ovarian cancer. J. Immunother. Cancer. 2021;9 doi: 10.1136/jitc-2021-003609. [DOI] [PMC free article] [PubMed] [Google Scholar]
- 29.Smahel M., Sobotková E., Bubeník J., Símová J., Zák R., Ludviková V., Hájková R., Kovarík J., Jelínek F., Povýsil C., et al. Metastatic MHC class I-negative mouse cells derived by transformation with human papillomavirus type 16. Br. J. Cancer. 2001;84:374–380. doi: 10.1054/bjoc.2000.1615. [DOI] [PMC free article] [PubMed] [Google Scholar]
- 30.Efremova M., Rieder D., Klepsch V., Charoentong P., Finotello F., Hackl H., Hermann-Kleiter N., Löwer M., Baier G., Krogsdam A., Trajanoski Z. Targeting immune checkpoints potentiates immunoediting and changes the dynamics of tumor evolution. Nat. Commun. 2018;9:32. doi: 10.1038/s41467-017-02424-0. [DOI] [PMC free article] [PubMed] [Google Scholar]
- 31.Garg A.D., Vandenberk L., Koks C., Verschuere T., Boon L., Van Gool S.W., Agostinis P. Dendritic cell vaccines based on immunogenic cell death elicit danger signals and T cell-driven rejection of high-grade glioma. Sci. Transl. Med. 2016;8:328ra27. doi: 10.1126/scitranslmed.aae0105. [DOI] [PubMed] [Google Scholar]
- 32.Galluzzi L., Vitale I., Warren S., Adjemian S., Agostinis P., Martinez A.B., Chan T.A., Coukos G., Demaria S., Deutsch E., et al. Consensus guidelines for the definition, detection and interpretation of immunogenic cell death. J. Immunother. Cancer. 2020;8 doi: 10.1136/jitc-2019-000337. [DOI] [PMC free article] [PubMed] [Google Scholar]
- 33.Galluzzi L., Vitale I., Aaronson S.A., Abrams J.M., Adam D., Agostinis P., Alnemri E.S., Altucci L., Amelio I., Andrews D.W., et al. Molecular mechanisms of cell death: recommendations of the Nomenclature Committee on Cell Death 2018. Cell Death Differ. 2018;25:486–541. doi: 10.1038/s41418-017-0012-4. [DOI] [PMC free article] [PubMed] [Google Scholar]
- 34.Yang H., Ma Y., Chen G., Zhou H., Yamazaki T., Klein C., Pietrocola F., Vacchelli E., Souquere S., Sauvat A., et al. Contribution of RIP3 and MLKL to immunogenic cell death signaling in cancer chemotherapy. OncoImmunology. 2016;5 doi: 10.1080/2162402X.2016.1149673. [DOI] [PMC free article] [PubMed] [Google Scholar]
- 35.Yi F., Frazzette N., Cruz A.C., Klebanoff C.A., Siegel R.M. Beyond cell death: new functions for TNF family cytokines in autoimmunity and tumor immunotherapy. Trends Mol. Med. 2018;24:642–653. doi: 10.1016/j.molmed.2018.05.004. [DOI] [PMC free article] [PubMed] [Google Scholar]
- 36.Takahashi N., Duprez L., Grootjans S., Cauwels A., Nerinckx W., DuHadaway J.B., Goossens V., Roelandt R., Van Hauwermeiren F., Libert C., et al. Necrostatin-1 analogues: critical issues on the specificity, activity and in vivo use in experimental disease models. Cell Death Dis. 2012;3:e437. doi: 10.1038/cddis.2012.176. [DOI] [PMC free article] [PubMed] [Google Scholar]
- 37.Sprooten J., Ceusters J., Coosemans A., Agostinis P., De Vleeschouwer S., Zitvogel L., Kroemer G., Galluzzi L., Garg A.D. Trial watch: dendritic cell vaccination for cancer immunotherapy. OncoImmunology. 2019;8 doi: 10.1080/2162402X.2019.1638212. [DOI] [PMC free article] [PubMed] [Google Scholar]
- 38.Rapp M., Grauer O.M., Kamp M., Sevens N., Zotz N., Sabel M., Sorg R.V. A randomized controlled phase II trial of vaccination with lysate-loaded, mature dendritic cells integrated into standard radiochemotherapy of newly diagnosed glioblastoma (GlioVax): study protocol for a randomized controlled trial. Trials. 2018;19:293. doi: 10.1186/s13063-018-2659-7. [DOI] [PMC free article] [PubMed] [Google Scholar]
- 39.Wu X., Xu F., Liu J., Wang G. Comparative study of dendritic cells matured by using IL-1β, IL-6, TNF-α and prostaglandins E2 for different time span. Exp. Ther. Med. 2017;14:1389–1394. doi: 10.3892/etm.2017.4649. [DOI] [PMC free article] [PubMed] [Google Scholar]
- 40.Brabants E., Heyns K., De Smet S., Devreker P., Ingels J., De Cabooter N., Debacker V., Dullaers M., VAN Meerbeeck J.P., Vandekerckhove B., Vermaelen K.Y. An accelerated, clinical-grade protocol to generate high yields of type 1-polarizing messenger RNA-loaded dendritic cells for cancer vaccination. Cytotherapy. 2018;20:1164–1181. doi: 10.1016/j.jcyt.2018.06.006. [DOI] [PubMed] [Google Scholar]
- 41.Nava S., Dossena M., Pogliani S., Pellegatta S., Antozzi C., Baggi F., Gellera C., Pollo B., Parati E.A., Finocchiaro G., Frigerio S. An optimized method for manufacturing a clinical scale dendritic cell-based vaccine for the treatment of glioblastoma. PLoS One. 2012;7 doi: 10.1371/journal.pone.0052301. [DOI] [PMC free article] [PubMed] [Google Scholar]
- 42.Biscari L., Kaufman C.D., Farré C., Huhn V., Pacini M.F., Balbi C.B., Gómez K.A., Pérez A.R., Alloatti A. Immunization With Lipopolysaccharide-Activated Dendritic Cells Generates a Specific CD8+ T Cell Response That Confers Partial Protection Against Infection With Trypanosoma cruzi. Front. Cell. Infect. Microbiol. 2022;12 doi: 10.3389/fcimb.2022.897133. [DOI] [PMC free article] [PubMed] [Google Scholar]
- 43.Frasca L., Nasso M., Spensieri F., Fedele G., Palazzo R., Malavasi F., Ausiello C.M. IFN-gamma arms human dendritic cells to perform multiple effector functions. J. Immunol. 2008;180:1471–1481. doi: 10.4049/jimmunol.180.3.1471. [DOI] [PubMed] [Google Scholar]
- 44.Chiang C.L.-L., Kandalaft L.E., Tanyi J., Hagemann A.R., Motz G.T., Svoronos N., Montone K., Mantia-Smaldone G.M., Smith L., Nisenbaum H.L., et al. A dendritic cell vaccine pulsed with autologous hypochlorous acid-oxidized ovarian cancer lysate primes effective broad antitumor immunity: from bench to bedside. Clin. Cancer Res. 2013;19:4801–4815. doi: 10.1158/1078-0432.CCR-13-1185. [DOI] [PMC free article] [PubMed] [Google Scholar]
- 45.Jin Y., Mu Y., Zhang S., Li P., Wang F. Preparation and evaluation of the adjuvant effect of curdlan sulfate in improving the efficacy of dendritic cell-based vaccine for antitumor immunotherapy. Int. J. Biol. Macromol. 2020;146:273–284. doi: 10.1016/j.ijbiomac.2019.12.256. [DOI] [PubMed] [Google Scholar]
- 46.Chieochansin T., Thepmalee C., Grainok J., Junking M., Yenchitsomanus P.-T. Cytolytic Activity of Effector T-lymphocytes Against Hepatocellular Carcinoma is Improved by Dendritic Cells Pulsed with Pooled Tumor Antigens. Sci. Rep. 2019;9 doi: 10.1038/s41598-019-54087-0. [DOI] [PMC free article] [PubMed] [Google Scholar]
- 47.Imai K., Minamiya Y., Koyota S., Ito M., Saito H., Sato Y., Motoyama S., Sugiyama T., Ogawa J.-I. Inhibition of dendritic cell migration by transforming growth factor-β1 increases tumor-draining lymph node metastasis. J. Exp. Clin. Cancer Res. 2012;31:3. doi: 10.1186/1756-9966-31-3. [DOI] [PMC free article] [PubMed] [Google Scholar]
- 48.Ito M., Minamiya Y., Kawai H., Saito S., Saito H., Nakagawa T., Imai K., Hirokawa M., Ogawa J.i. Tumor-derived TGFbeta-1 induces dendritic cell apoptosis in the sentinel lymph node. J. Immunol. 2006;176:5637–5643. doi: 10.4049/jimmunol.176.9.5637. [DOI] [PubMed] [Google Scholar]
- 49.Ivashkiv L.B., Donlin L.T. Regulation of type I interferon responses. Nat. Rev. Immunol. 2014;14:36–49. doi: 10.1038/nri3581. [DOI] [PMC free article] [PubMed] [Google Scholar]
- 50.Bruchard M., Geindreau M., Perrichet A., Truntzer C., Ballot E., Boidot R., Racoeur C., Barsac E., Chalmin F., Hibos C., et al. Recruitment and activation of type 3 innate lymphoid cells promote antitumor immune responses. Nat. Immunol. 2022;23:262–274. doi: 10.1038/s41590-021-01120-y. [DOI] [PubMed] [Google Scholar]
- 51.Yu Y.-Q., Thonn V., Patankar J.V., Thoma O.-M., Waldner M., Zielinska M., Bao L.-L., Gonzalez-Acera M., Wallmüller S., Engel F.B., et al. SMYD2 targets RIPK1 and restricts TNF-induced apoptosis and necroptosis to support colon tumor growth. Cell Death Dis. 2022;13:52. doi: 10.1038/s41419-021-04483-0. [DOI] [PMC free article] [PubMed] [Google Scholar]
- 52.Vanmeerbeek I., Govaerts J., Laureano R.S., Sprooten J., Naulaerts S., Borras D.M., Laoui D., Mazzone M., Van Ginderachter J.A., Garg A.D. The Interface of Tumour-Associated Macrophages with Dying Cancer Cells in Immuno-Oncology. Cells. 2022;11 doi: 10.3390/cells11233890. [DOI] [PMC free article] [PubMed] [Google Scholar]
- 53.Zhu J., Naulaerts S., Boudhan L., Martin M., Gatto L., Van den Eynde B.J. Tumour immune rejection triggered by activation of α2-adrenergic receptors. Nature. 2023;618:607–615. doi: 10.1038/s41586-023-06110-8. [DOI] [PubMed] [Google Scholar]
- 54.Jin S., Guerrero-Juarez C.F., Zhang L., Chang I., Ramos R., Kuan C.-H., Myung P., Plikus M.V., Nie Q. Inference and analysis of cell-cell communication using CellChat. Nat. Commun. 2021;12:1088. doi: 10.1038/s41467-021-21246-9. [DOI] [PMC free article] [PubMed] [Google Scholar]
- 55.Vandenbon A., Dinh V.H., Mikami N., Kitagawa Y., Teraguchi S., Ohkura N., Sakaguchi S. Immuno-Navigator, a batch-corrected coexpression database, reveals cell type-specific gene networks in the immune system. Proc. Natl. Acad. Sci. USA. 2016;113:E2393–E2402. doi: 10.1073/pnas.1604351113. [DOI] [PMC free article] [PubMed] [Google Scholar]
- 56.Shan T., Chen S., Chen X., Wu T., Yang Y., Li S., Ma J., Zhao J., Lin W., Li W., et al. M2-TAM subsets altered by lactic acid promote T-cell apoptosis through the PD-L1/PD-1 pathway. Oncol. Rep. 2020;44:1885–1894. doi: 10.3892/or.2020.7767. [DOI] [PMC free article] [PubMed] [Google Scholar]
- 57.Wei S.C., Duffy C.R., Allison J.P. Fundamental mechanisms of immune checkpoint blockade therapy. Cancer Discov. 2018;8:1069–1086. doi: 10.1158/2159-8290.CD-18-0367. [DOI] [PubMed] [Google Scholar]
- 58.Zhu J., Powis de Tenbossche C.G., Cané S., Colau D., van Baren N., Lurquin C., Schmitt-Verhulst A.-M., Liljeström P., Uyttenhove C., Van den Eynde B.J. Resistance to cancer immunotherapy mediated by apoptosis of tumor-infiltrating lymphocytes. Nat. Commun. 2017;8:1404. doi: 10.1038/s41467-017-00784-1. [DOI] [PMC free article] [PubMed] [Google Scholar]
- 59.Janssen E.M., Droin N.M., Lemmens E.E., Pinkoski M.J., Bensinger S.J., Ehst B.D., Griffith T.S., Green D.R., Schoenberger S.P. CD4+ T-cell help controls CD8+ T-cell memory via TRAIL-mediated activation-induced cell death. Nature. 2005;434:88–93. doi: 10.1038/nature03337. [DOI] [PubMed] [Google Scholar]
- 60.Hartley G.P., Chow L., Ammons D.T., Wheat W.H., Dow S.W. Programmed Cell Death Ligand 1 (PD-L1) Signaling Regulates Macrophage Proliferation and Activation. Cancer Immunol. Res. 2018;6:1260–1273. doi: 10.1158/2326-6066.CIR-17-0537. [DOI] [PubMed] [Google Scholar]
- 61.Cha J.-H., Chan L.-C., Li C.-W., Hsu J.L., Hung M.-C. Mechanisms Controlling PD-L1 Expression in Cancer. Mol. Cell. 2019;76:359–370. doi: 10.1016/j.molcel.2019.09.030. [DOI] [PMC free article] [PubMed] [Google Scholar]
- 62.Escors D., Gato-Cañas M., Zuazo M., Arasanz H., García-Granda M.J., Vera R., Kochan G. The intracellular signalosome of PD-L1 in cancer cells. Signal Transduct. Targeted Ther. 2018;3:26. doi: 10.1038/s41392-018-0022-9. [DOI] [PMC free article] [PubMed] [Google Scholar]
- 63.Gato-Cañas M., Zuazo M., Arasanz H., Ibañez-Vea M., Lorenzo L., Fernandez-Hinojal G., Vera R., Smerdou C., Martisova E., Arozarena I., et al. PDL1 Signals through Conserved Sequence Motifs to Overcome Interferon-Mediated Cytotoxicity. Cell Rep. 2017;20:1818–1829. doi: 10.1016/j.celrep.2017.07.075. [DOI] [PubMed] [Google Scholar]
- 64.Cao H., Xiang Y., Zhang S., Chao Y., Guo J., Ho J.W.K., Huang Y., Liu P., Sugimura R. PD-L1 regulates inflammatory macrophage development from human pluripotent stem cells by maintaining interferon-gamma signal. bioRxiv. 2022 Preprint at. [Google Scholar]
- 65.Nguyen T., Du J., Li Y.C. A protocol for macrophage depletion and reconstitution in a mouse model of sepsis. STAR Protoc. 2021;2 doi: 10.1016/j.xpro.2021.101004. [DOI] [PMC free article] [PubMed] [Google Scholar]
- 66.de Taeye S.W., Bentlage A.E.H., Mebius M.M., Meesters J.I., Lissenberg-Thunnissen S., Falck D., Sénard T., Salehi N., Wuhrer M., Schuurman J., et al. Fcγr binding and ADCC activity of human igg allotypes. Front. Immunol. 2020;11:740. doi: 10.3389/fimmu.2020.00740. [DOI] [PMC free article] [PubMed] [Google Scholar]
- 67.Hua Y., Vella G., Rambow F., Allen E., Antoranz Martinez A., Duhamel M., Takeda A., Jalkanen S., Junius S., Smeets A., et al. Cancer immunotherapies transition endothelial cells into HEVs that generate TCF1+ T lymphocyte niches through a feed-forward loop. Cancer Cell. 2022;40:1600–1618.e10. doi: 10.1016/j.ccell.2022.11.002. [DOI] [PMC free article] [PubMed] [Google Scholar]
- 68.Schofield D.J., Percival-Alwyn J., Rytelewski M., Hood J., Rothstein R., Wetzel L., McGlinchey K., Adjei G., Watkins A., Machiesky L., et al. Activity of murine surrogate antibodies for durvalumab and tremelimumab lacking effector function and the ability to deplete regulatory T cells in mouse models of cancer. mAbs. 2021;13 doi: 10.1080/19420862.2020.1857100. [DOI] [PMC free article] [PubMed] [Google Scholar]
- 69.Sabado R.L., Balan S., Bhardwaj N. Dendritic cell-based immunotherapy. Cell Res. 2017;27:74–95. doi: 10.1038/cr.2016.157. [DOI] [PMC free article] [PubMed] [Google Scholar]
- 70.Zerdes I., Matikas A., Bergh J., Rassidakis G.Z., Foukakis T. Genetic, transcriptional and post-translational regulation of the programmed death protein ligand 1 in cancer: biology and clinical correlations. Oncogene. 2018;37:4639–4661. doi: 10.1038/s41388-018-0303-3. [DOI] [PMC free article] [PubMed] [Google Scholar]
- 71.McLane L.M., Abdel-Hakeem M.S., Wherry E.J. CD8 T cell exhaustion during chronic viral infection and cancer. Annu. Rev. Immunol. 2019;37:457–495. doi: 10.1146/annurev-immunol-041015-055318. [DOI] [PubMed] [Google Scholar]
- 72.Pombo Antunes A.R., Scheyltjens I., Lodi F., Messiaen J., Antoranz A., Duerinck J., Kancheva D., Martens L., De Vlaminck K., Van Hove H., et al. Single-cell profiling of myeloid cells in glioblastoma across species and disease stage reveals macrophage competition and specialization. Nat. Neurosci. 2021;24:595–610. doi: 10.1038/s41593-020-00789-y. [DOI] [PubMed] [Google Scholar]
- 73.Woroniecka K., Chongsathidkiet P., Rhodin K., Kemeny H., Dechant C., Farber S.H., Elsamadicy A.A., Cui X., Koyama S., Jackson C., et al. T-Cell Exhaustion Signatures Vary with Tumor Type and Are Severe in Glioblastoma. Clin. Cancer Res. 2018;24:4175–4186. doi: 10.1158/1078-0432.CCR-17-1846. [DOI] [PMC free article] [PubMed] [Google Scholar]
- 74.Maurer D.M., Adamik J., Santos P.M., Shi J., Shurin M.R., Kirkwood J.M., Storkus W.J., Butterfield L.H. Dysregulated NF-κB-Dependent ICOSL Expression in Human Dendritic Cell Vaccines Impairs T-cell Responses in Patients with Melanoma. Cancer Immunol. Res. 2020;8:1554–1567. doi: 10.1158/2326-6066.CIR-20-0274. [DOI] [PMC free article] [PubMed] [Google Scholar]
- 75.Liu X., Hogg G.D., DeNardo D.G. Rethinking immune checkpoint blockade: “Beyond the T cell”. J. Immunother. Cancer. 2021;9 doi: 10.1136/jitc-2020-001460. [DOI] [PMC free article] [PubMed] [Google Scholar]
- 76.Laureano R.S., Sprooten J., Vanmeerbeerk I., Borras D.M., Govaerts J., Naulaerts S., Berneman Z.N., Beuselinck B., Bol K.F., Borst J., et al. Trial watch: Dendritic cell (DC)-based immunotherapy for cancer. OncoImmunology. 2022;11 doi: 10.1080/2162402X.2022.2096363. [DOI] [PMC free article] [PubMed] [Google Scholar]
- 77.Garg A.D. The dynamic interface of genetics and immunity: toward future horizons in health & disease. Gene Immun. 2023;24:155–158. doi: 10.1038/s41435-023-00213-y. [DOI] [PubMed] [Google Scholar]
- 78.Chae Y.K., Arya A., Iams W., Cruz M.R., Chandra S., Choi J., Giles F. Current landscape and future of dual anti-CTLA4 and PD-1/PD-L1 blockade immunotherapy in cancer; lessons learned from clinical trials with melanoma and non-small cell lung cancer (NSCLC) J. Immunother. Cancer. 2018;6:39. doi: 10.1186/s40425-018-0349-3. [DOI] [PMC free article] [PubMed] [Google Scholar]
- 79.Santisteban M., Solans B.P., Hato L., Urrizola A., Mejías L.D., Salgado E., Sánchez-Bayona R., Toledo E., Rodríguez-Spiteri N., Olartecoechea B., et al. Final results regarding the addition of dendritic cell vaccines to neoadjuvant chemotherapy in early HER2-negative breast cancer patients: clinical and translational analysis. Ther. Adv. Med. Oncol. 2021;13 doi: 10.1177/17588359211064653. [DOI] [PMC free article] [PubMed] [Google Scholar]
- 80.Gubin M.M., Esaulova E., Ward J.P., Malkova O.N., Runci D., Wong P., Noguchi T., Arthur C.D., Meng W., Alspach E., et al. High-Dimensional Analysis Delineates Myeloid and Lymphoid Compartment Remodeling during Successful Immune-Checkpoint Cancer Therapy. Cell. 2018;175:1014–1030.e19. doi: 10.1016/j.cell.2018.09.030. [DOI] [PMC free article] [PubMed] [Google Scholar]
- 81.Kurtulus S., Madi A., Escobar G., Klapholz M., Nyman J., Christian E., Pawlak M., Dionne D., Xia J., Rozenblatt-Rosen O., et al. Checkpoint Blockade Immunotherapy Induces Dynamic Changes in PD-1-CD8+ Tumor-Infiltrating T Cells. Immunity. 2019;50:181–194.e6. doi: 10.1016/j.immuni.2018.11.014. [DOI] [PMC free article] [PubMed] [Google Scholar]
- 82.Sade-Feldman M., Yizhak K., Bjorgaard S.L., Ray J.P., de Boer C.G., Jenkins R.W., Lieb D.J., Chen J.H., Frederick D.T., Barzily-Rokni M., et al. Defining T Cell States Associated with Response to Checkpoint Immunotherapy in Melanoma. Cell. 2018;175:998–1013.e20. doi: 10.1016/j.cell.2018.10.038. [DOI] [PMC free article] [PubMed] [Google Scholar]
- 83.Puram S.V., Tirosh I., Parikh A.S., Patel A.P., Yizhak K., Gillespie S., Rodman C., Luo C.L., Mroz E.A., Emerick K.S., et al. Single-Cell Transcriptomic Analysis of Primary and Metastatic Tumor Ecosystems in Head and Neck Cancer. Cell. 2017;171:1611–1624.e24. doi: 10.1016/j.cell.2017.10.044. [DOI] [PMC free article] [PubMed] [Google Scholar]
- 84.Wang B., Zhang W., Jankovic V., Golubov J., Poon P., Oswald E.M., Gurer C., Wei J., Ramos I., Wu Q., et al. Combination cancer immunotherapy targeting PD-1 and GITR can rescue CD8+ T cell dysfunction and maintain memory phenotype. Sci. Immunol. 2018;3 doi: 10.1126/sciimmunol.aat7061. [DOI] [PubMed] [Google Scholar]
- 85.Durante M.A., Rodriguez D.A., Kurtenbach S., Kuznetsov J.N., Sanchez M.I., Decatur C.L., Snyder H., Feun L.G., Livingstone A.S., Harbour J.W. Single-cell analysis reveals new evolutionary complexity in uveal melanoma. Nat Commun. 2020;11:496. doi: 10.1038/s41467-019-14256-1. [DOI] [PMC free article] [PubMed] [Google Scholar]
- 86.Li H., van der Leun A.M., Yofe I., Lubling Y., Gelbard-Solodkin D., van Akkooi C.J., van den Braber M., Rozeman E.A., Haanen J.B.A.G., Blank C.U., et al. Dysfunctional CD8 T Cells Form a Proliferative, Dynamically Regulated Compartment within Human Melanoma. Cell. 2019;176:775–789.e18. doi: 10.1016/j.cell.2018.11.043. [DOI] [PMC free article] [PubMed] [Google Scholar]
- 87.Cillo A.R., Kürten C.H.L., Tabib T., Qi Z., Sayali O., Wang T., Liu A., Duvvuri U., Kim S., Soose R.J., et al. Immune Landscape of Viral- and Carcinogen-Driven Head and Neck Cancer. Immunity. 2020;52:183–199.e9. doi: 10.1016/j.immuni.2019.11.014. [DOI] [PMC free article] [PubMed] [Google Scholar]
- 88.Wang L., Catalan F., Shamardani K., Babikir H., Diaz A. Ensemble learning for classifying single-cell data and projection across reference atlases. Bioinformatics. 2020;36:3585–3587. doi: 10.1093/bioinformatics/btaa137. [DOI] [PMC free article] [PubMed] [Google Scholar]
- 89.Ma L., Hernandez M.O., Zhao Y., Mehta M., Tran B., Kelly M., Rae Z., Hernadez J.M., Davis J.L., Martin S.P., et al. Tumor Cell Biodiversity Drives Microenvironmental Reprogramming in Liver Cancer. Cancer Cell. 2019;36:418–430.e6. doi: 10.1016/j.ccell.2019.08.007. [DOI] [PMC free article] [PubMed] [Google Scholar]
- 90.Shih A.J., Menzin A., Whyte J., Lovecchio J., Liew A., Khalili H., Bhuiya T., Gregersen P.K., Lee A.T. Identification of grade and origin specific cell populations in serous epithelial ovarian cancer by single cell RNA-seq. PLoS One. 2018;13 doi: 10.1371/journal.pone.0206785. [DOI] [PMC free article] [PubMed] [Google Scholar]
- 91.Kim N., Kim H.K., Lee K., Hong Y., Cho J.H., Choi J.W., Lee J., Suh Y., Ku B.M., Eum H.H., et al. Single-cell RNA sequencing demonstrates the molecular and cellular reprogramming of metastatic lung adenocarcinoma. Nat Commun. 2020;11:2285. doi: 10.1038/s41467-020-16164-1. [DOI] [PMC free article] [PubMed] [Google Scholar]
- 92.Wu T.D., Madireddi S., de Almeida P.E., Banchereau R., Chen Y.J., Chitre A.S., Chiang E.Y., Ifitkhar H., O’Gorman W., Au-Yeung A., et al. Peripheral T cell expansion predicts tumour infiltration and clinical response. Nature. 2020;579:274–278. doi: 10.1038/s41586-020-2056-8. [DOI] [PubMed] [Google Scholar]
- 93.Hollern D.P., Xu N., Thennavan A., Glodowski C., Garcia-Recio S., Mott K.R., He X., Garay J.P., Carey-Ewend K., Marron D., et al. Cells and T Follicular Helper Cells Mediate Response to Checkpoint Inhibitors in High Mutation Burden Mouse Models of Breast Cancer. Cell. 2019;179:1191–1206.e21. doi: 10.1016/j.cell.2019.10.028. [DOI] [PMC free article] [PubMed] [Google Scholar]
- 94.Moncada R., Barkley D., Wagner F., Chiodin M., Devlin J.C., Baron M., Hajdu C.H., Simeone D.M., Yanai I. Integrating microarray-based spatial transcriptomics and single-cell RNA-seq reveals tissue architecture in pancreatic ductal adenocarcinomas. Nat. Biotechnol. 2020;38:333–342. doi: 10.1038/s41587-019-0392-8. [DOI] [PubMed] [Google Scholar]
- 95.Neftel C., Laffy J., Filbin M.G., Hara T., Shore M.E., Rahme G.J., Richman A.R., Silverbush D., Shaw M.L., Hebert C.M., et al. An Integrative Model of Cellular States, Plasticity, and Genetics for Glioblastoma. Cell. 2019;178:835–849.e21. doi: 10.1016/j.cell.2019.06.024. [DOI] [PMC free article] [PubMed] [Google Scholar]
- 96.Zhang L., Li Z., Skrzypczynska K.M., Fang Q., Zhang W., O’Brien S.A., He Y., Wang L., Zhang Q., Kim A., et al. Single-Cell Analyses Inform Mechanisms of Myeloid-Targeted Therapies in Colon Cancer. Cell. 2020;181:442–459.e29. doi: 10.1016/j.cell.2020.03.048. [DOI] [PubMed] [Google Scholar]
- 97.Jerby-Arnon L., Shah P., Cuoco M.S., Rodman C., Su M., Melms J.C., Leeson R., Kanodia A., Mei S., Lin J., et al. A Cancer Cell Program Promotes T Cell Exclusion and Resistance to Checkpoint Blockade. Cell. 2018;175:984–997.e24. doi: 10.1016/j.cell.2018.09.006. [DOI] [PMC free article] [PubMed] [Google Scholar]
- 98.Guo X., Zhang Y., Zheng L., Zheng C., Song J., Zhang Q., Kang B., Liu Z., Jin L., Xing R., et al. Global characterization of T cells in non-small-cell lung cancer by single-cell sequencing. Nat. Med. 2018;24:978–985. doi: 10.1038/s41591-018-0045-3. [DOI] [PubMed] [Google Scholar]
- 99.Savas P., Virassamy B., Ye C., Salim A., Mintoff C.P., Caramia F., Salgado R., Byrne D.J., Teo Z.L., Dushyanthen S., et al. Single-cell profiling of breast cancer T cells reveals a tissue-resident memory subset associated with improved prognosis. Nat. Med. 2018;24:986–993. doi: 10.1038/s41591-018-0078-7. [DOI] [PubMed] [Google Scholar]
- 100.Yost K.E., Satpathy A.T., Wells D.K., Qi Y., Wang C., Kageyama R., McNamara K.L., Granja J.M., Sarin K.Y., Brown R.A., et al. Clonal replacement of tumor-specific T cells following PD-1 blockade. Nat. Med. 2019;25:1251–1259. doi: 10.1038/s41591-019-0522-3. [DOI] [PMC free article] [PubMed] [Google Scholar]
- 101.Celus W., Oliveira A.I., Rivis S., Van Acker H.H., Landeloos E., Serneels J., Trusso Cafarello S., Van Herck Y., Mastrantonio R., Köhler A., et al. Plexin-A4 Mediates Cytotoxic T-cell Trafficking and Exclusion in Cancer. Cancer Immunol. Res. 2022;10:126–141. doi: 10.1158/2326-6066.CIR-21-0061. [DOI] [PMC free article] [PubMed] [Google Scholar]
- 102.Degterev A., Zhou W., Maki J.L., Yuan J. Assays for necroptosis and activity of RIP kinases. Methods Enzymol. 2014;545:1–33. doi: 10.1016/B978-0-12-801430-1.00001-9. [DOI] [PubMed] [Google Scholar]
- 103.Liao Y., Wang J., Jaehnig E.J., Shi Z., Zhang B. WebGestalt 2019: gene set analysis toolkit with revamped UIs and APIs. Nucleic Acids Res. 2019;47:W199–W205. doi: 10.1093/nar/gkz401. [DOI] [PMC free article] [PubMed] [Google Scholar]
- 104.Baudino L., Shinohara Y., Nimmerjahn F., Furukawa J.i., Nakata M., Martínez-Soria E., Petry F., Ravetch J.V., Nishimura S.i., Izui S. Crucial role of aspartic acid at position 265 in the CH2 domain for murine IgG2a and IgG2b Fc-associated effector functions. J. Immunol. 2008;181:6664–6669. doi: 10.4049/jimmunol.181.9.6664. [DOI] [PubMed] [Google Scholar]
- 105.Vivian J., Rao A.A., Nothaft F.A., Ketchum C., Armstrong J., Novak A., Pfeil J., Narkizian J., Deran A.D., Musselman-Brown A., et al. Toil enables reproducible, open source, big biomedical data analyses. Nat. Biotechnol. 2017;35:314–316. doi: 10.1038/nbt.3772. [DOI] [PMC free article] [PubMed] [Google Scholar]
- 106.Goldman M.J., Craft B., Hastie M., Repečka K., McDade F., Kamath A., Banerjee A., Luo Y., Rogers D., Brooks A.N., et al. Visualizing and interpreting cancer genomics data via the Xena platform. Nat. Biotechnol. 2020;38:675–678. doi: 10.1038/s41587-020-0546-8. [DOI] [PMC free article] [PubMed] [Google Scholar]
- 107.Finotello F., Mayer C., Plattner C., Laschober G., Rieder D., Hackl H., Krogsdam A., Loncova Z., Posch W., Wilflingseder D., et al. Correction to: Molecular and pharmacological modulators of the tumor immune contexture revealed by deconvolution of RNA-seq data. Genome Med. 2019;11:50. doi: 10.1186/s13073-019-0655-5. [DOI] [PMC free article] [PubMed] [Google Scholar]
- 108.Li T., Fu J., Zeng Z., Cohen D., Li J., Chen Q., Li B., Liu X.S. TIMER2.0 for analysis of tumor-infiltrating immune cells. Nucleic Acids Res. 2020;48:W509–W514. doi: 10.1093/nar/gkaa407. [DOI] [PMC free article] [PubMed] [Google Scholar]
- 109.Li T., Fan J., Wang B., Traugh N., Chen Q., Liu J.S., Li B., Liu X.S. TIMER: A Web Server for Comprehensive Analysis of Tumor-Infiltrating Immune Cells. Cancer Res. 2017;77:e108–e110. doi: 10.1158/0008-5472.CAN-17-0307. [DOI] [PMC free article] [PubMed] [Google Scholar]
- 110.Zhao J., Chen A.X., Gartrell R.D., Silverman A.M., Aparicio L., Chu T., Bordbar D., Shan D., Samanamud J., Mahajan A., et al. Immune and genomic correlates of response to anti-PD-1 immunotherapy in glioblastoma. Nat. Med. 2019;25:462–469. doi: 10.1038/s41591-019-0349-y. [DOI] [PMC free article] [PubMed] [Google Scholar]
- 111.Liu D., Schilling B., Liu D., Sucker A., Livingstone E., Jerby-Arnon L., Zimmer L., Gutzmer R., Satzger I., Loquai C., et al. Integrative molecular and clinical modeling of clinical outcomes to PD1 blockade in patients with metastatic melanoma. Nat. Med. 2019;25:1916–1927. doi: 10.1038/s41591-019-0654-5. [DOI] [PMC free article] [PubMed] [Google Scholar]
- 112.Gide T.N., Quek C., Menzies A.M., Tasker A.T., Shang P., Holst J., Madore J., Lim S.Y., Velickovic R., Wongchenko M., et al. Distinct Immune Cell Populations Define Response to Anti-PD-1 Monotherapy and Anti-PD-1/Anti-CTLA-4 Combined Therapy. Cancer Cell. 2019;35:238–255.e6. doi: 10.1016/j.ccell.2019.01.003. [DOI] [PubMed] [Google Scholar]
- 113.Kim S.T., Cristescu R., Bass A.J., Kim K.-M., Odegaard J.I., Kim K., Liu X.Q., Sher X., Jung H., Lee M., et al. Comprehensive molecular characterization of clinical responses to PD-1 inhibition in metastatic gastric cancer. Nat. Med. 2018;24:1449–1458. doi: 10.1038/s41591-018-0101-z. [DOI] [PubMed] [Google Scholar]
- 114.Miao D., Margolis C.A., Gao W., Voss M.H., Li W., Martini D.J., Norton C., Bossé D., Wankowicz S.M., Cullen D., et al. Genomic correlates of response to immune checkpoint therapies in clear cell renal cell carcinoma. Science. 2018;359:801–806. doi: 10.1126/science.aan5951. [DOI] [PMC free article] [PubMed] [Google Scholar]
- 115.Riaz N., Havel J.J., Makarov V., Desrichard A., Urba W.J., Sims J.S., Hodi F.S., Martín-Algarra S., Mandal R., Sharfman W.H., et al. Tumor and Microenvironment Evolution during Immunotherapy with Nivolumab. Cell. 2017;171:934–949.e16. doi: 10.1016/j.cell.2017.09.028. [DOI] [PMC free article] [PubMed] [Google Scholar]
- 116.Hugo W., Zaretsky J.M., Sun L., Song C., Moreno B.H., Hu-Lieskovan S., Berent-Maoz B., Pang J., Chmielowski B., Cherry G., et al. Genomic and Transcriptomic Features of Response to Anti-PD-1 Therapy in Metastatic Melanoma. Cell. 2016;165:35–44. doi: 10.1016/j.cell.2016.02.065. [DOI] [PMC free article] [PubMed] [Google Scholar]
- 117.Van Allen E.M., Miao D., Schilling B., Shukla S.A., Blank C., Zimmer L., Sucker A., Hillen U., Foppen M.H.G., Goldinger S.M., et al. Genomic correlates of response to CTLA-4 blockade in metastatic melanoma. Science. 2015;350:207–211. doi: 10.1126/science.aad0095. [DOI] [PMC free article] [PubMed] [Google Scholar]
- 118.Cloughesy T.F., Mochizuki A.Y., Orpilla J.R., Hugo W., Lee A.H., Davidson T.B., Wang A.C., Ellingson B.M., Rytlewski J.A., Sanders C.M., et al. Neoadjuvant anti-PD-1 immunotherapy promotes a survival benefit with intratumoral and systemic immune responses in recurrent glioblastoma. Nat. Med. 2019;25:477–486. doi: 10.1038/s41591-018-0337-7. [DOI] [PMC free article] [PubMed] [Google Scholar]
- 119.Choueiri T.K., Figueroa D.J., Fay A.P., Signoretti S., Liu Y., Gagnon R., Deen K., Carpenter C., Benson P., Ho T.H., et al. Correlation of PD-L1 tumor expression and treatment outcomes in patients with renal cell carcinoma receiving sunitinib or pazopanib: results from COMPARZ, a randomized controlled trial. Clin. Cancer Res. 2015;21:1071–1077. doi: 10.1158/1078-0432.CCR-14-1993. [DOI] [PubMed] [Google Scholar]
- 120.Hoffman-Censits J.H., Grivas P., Van Der Heijden M.S., Dreicer R., Loriot Y., Retz M., Vogelzang N.J., Perez-Gracia J.L., Rezazadeh A., Bracarda S., et al. IMvigor 210, a phase II trial of atezolizumab (MPDL3280A) in platinum-treated locally advanced or metastatic urothelial carcinoma (mUC) J. Clin. Oncol. 2016;34:355. [Google Scholar]
- 121.Atkins M.B., McDermott D.F., Powles T., Motzer R.J., Rini B.I., Fong L., Joseph R.W., Pal S.K., Sznol M., Hainsworth J.D., et al. IMmotion150: A phase II trial in untreated metastatic renal cell carcinoma (mRCC) patients (pts) of atezolizumab (atezo) and bevacizumab (bev) vs and following atezo or sunitinib (sun) J. Clin. Oncol. 2017;35:4505. [Google Scholar]
- 122.Carvalho B.S., Irizarry R.A. A framework for oligonucleotide microarray preprocessing. Bioinformatics. 2010;26:2363–2367. doi: 10.1093/bioinformatics/btq431. [DOI] [PMC free article] [PubMed] [Google Scholar]
- 123.Ritchie M.E., Phipson B., Wu D., Hu Y., Law C.W., Shi W., Smyth G.K. limma powers differential expression analyses for RNA-sequencing and microarray studies. Nucleic Acids Res. 2015;43:e47. doi: 10.1093/nar/gkv007. [DOI] [PMC free article] [PubMed] [Google Scholar]
- 124.Duan Z., Luo Y. Targeting macrophages in cancer immunotherapy. Signal Transduct. Targeted Ther. 2021;6:127. doi: 10.1038/s41392-021-00506-6. [DOI] [PMC free article] [PubMed] [Google Scholar]
- 125.Liu Y., Wang R. Immunotherapy Targeting Tumor-Associated Macrophages. Front. Med. 2020;7 doi: 10.3389/fmed.2020.583708. [DOI] [PMC free article] [PubMed] [Google Scholar]
- 126.Sun D., Wang J., Han Y., Dong X., Ge J., Zheng R., Shi X., Wang B., Li Z., Ren P., et al. TISCH: a comprehensive web resource enabling interactive single-cell transcriptome visualization of tumor microenvironment. Nucleic Acids Res. 2021;49:D1420–D1430. doi: 10.1093/nar/gkaa1020. [DOI] [PMC free article] [PubMed] [Google Scholar]
- 127.Fekete J.T., Győrffy B. ROCplot.org: Validating predictive biomarkers of chemotherapy/hormonal therapy/anti-HER2 therapy using transcriptomic data of 3,104 breast cancer patients. Int. J. Cancer. 2019;145:3140–3151. doi: 10.1002/ijc.32369. [DOI] [PubMed] [Google Scholar]
- 128.Kovács S.A., Győrffy B. Transcriptomic datasets of cancer patients treated with immune-checkpoint inhibitors: a systematic review. J. Transl. Med. 2022;20:249. doi: 10.1186/s12967-022-03409-4. [DOI] [PMC free article] [PubMed] [Google Scholar]
Associated Data
This section collects any data citations, data availability statements, or supplementary materials included in this article.
Supplementary Materials
Data Availability Statement
-
•
No original code was generated for this study.
-
•
This paper has analyzed existing, publicly available data. These accession numbers or relevant publications/database sources for the datasets are listed in the key resources table.
-
•
Any additional information required to reanalyze the data reported in this paper is available from the lead contact upon request.