

Abstract
We investigate how selection of psychiatric cases by phenotypic criteria can alter the strength and specificity of their genetic risk by examining samples from national Swedish registries for five disorders: major depression (MD, N = 158,557), drug use disorder (DUD, N = 69,841), bipolar disorder (BD, N = 13,530)) ADHD (N = 54,996) and schizophrenia (N = 11,227)). We maximized the family genetic risk score (FGRS) for each disorder and then the specificity of the FGRS in six disorder pairs by univariable and multivariable regression. We use split-half methods to divide our cases for each disorder into deciles for prediction of genetic risk magnitude and quintiles for prediction of specificity by FGRS differences between two disorders. We utilized seven predictor groups: demography/sex, # registrations, site of diagnosis, severity, comorbidity, treatment, and educational/social variables. The ratio of the FGRS in the upper vs two lower deciles from our multivariable prediction model was, in order, DUD – 12.6, MD – 4.9, BD – 4.5, ADHD – 3.3 and schizophrenia 1.4. From the lowest to highest quintile, our measures of genetic specificity increased more than five-fold for i) MD vs. Anxiety Disorders, ii) MD vs BD, iii) MD versus alcohol use disorder (AUD), iv) BD vs schizophrenia and v) DUD vs AUD. This increase was nearly two-fold for ADHD vs DUD. We conclude that the level of genetic liability for our psychiatric disorders could be substantially enriched by selection of cases with our predictors. Specificity of genetic risk could also be substantially impacted by these same predictors.
INTRODUCTION
The magnitude and specificity of genetic risk for psychiatric and substance use disorders in a given population are generally considered to be fixed, an inherent feature of the condition. We challenge these assumptions, demonstrating that criteria for case selection can substantially influence both these key features of genetic liability.
This is not an entirely new idea. Familial/genetic risks for cases of major depression (MD), bipolar disorder (BD), alcohol use disorder (AUD), drug use disorder (DUD), and ADHD are greater in cases with an early onset, high levels of recurrence and/or a history of hospitalization [1–7]. Risk for MD is higher in relatives of probands with melancholic symptoms [8], while risk for schizophrenia (SZ) in relatives is lower in those exposed to certain environmental risks [9]. In efforts to maximize the genetic signal for MD in a genome wide association study, the CONVERGE study sampled only recurrent female cases with hospital based care [10].
In this report, we initially examine, in the large Swedish national registers, a wide range of predictors that influence genetic risk—as assessed by the family-genetic risk score (FGRS)—for five representative disorders: MD, DUD, BD, ADHD and SZ. We explore the pattern of predictors across these disorders in univariable analyses and then conduct multivariable analyses, with a split-half design, to develop predictive models to maximize genetic risk.
Then, we examine, across six diverse pairs of disorders—MD and Anxiety Disorders (AD), AUD and Drug Use Disorders (DUD), BD and SZ, DUD and AUD, and ADHD and DUD—to determine how well predictors can maximize the specificity of the genetic risk for the first versus second pair of disorders. For example, in first univariable and then multivariable analyses, we develop selection criteria for MD cases to maximize the specificity of the genetic risk for MD vs. BD.
METHODS
We collected information on individuals from Swedish population-based registers with national coverage linking each person’s unique personal identification number which, to preserve confidentiality, was replaced with a serial number by Statistics Sweden. We secured ethical approval for this study from the Regional Ethical Review Board in Lund (No. 2008/409 and later amendments). Participant consent was not required.
We created five different datasets consisting of all individuals registered with any of the five disorders: MD, DUD, BD, ADHD, and SZ. We restricted our samples to individuals born in Sweden from 1972 and onwards to Swedish-born parents whom we could follow at least 7 years from their date of first registration. Since we have data until 2018–12–31, individuals had to be registered prior to 2011–12–31. For the SZ database, we extended our sample back to 1950 to obtain an adequate sample size. Our MD database excluded all individuals with a BD diagnosis [see appendix Tables 1 and 2 for further details].
Our datasets also included familial genetic risk scores (FGRS) for each disorder as a dependent variable. The FGRS are calculated from morbidity risks for disorders in 1st – 5th degree relatives, controlling for cohabitation effects [see appendix Table 3] and thus arise from phenotypes in extended relatives, not from molecular data. We standardize the FGRS against the entire population. Thus, an FRGS of +0.50 indicates a genetic risk half a standard deviation (SD) above the population mean.
Furthermore, in our datasets we included a range of predictors divided into 7 groups: demography/sex, number of registrations, site of diagnosis, severity, comorbidity, treatment, and educational and social variables [see appendix table 2 for their definitions and descriptive results for these predictors in appendix Table 4]. To explore the pattern of predictors for the FGRS across these disorders, we first performed univariable linear regression models for all our predictors. We then split the samples randomly into a training and a test set. A multivariable regression model was performed in the training set and then was applied to the test set. We created a risk score based on the deciles of the predictions in the test set and used it as a predictor variable. We evaluate the risk score by the r2 of the model, the linear slope of the regression of deciles onto FGRS and the ratio of the FRGS from the highest to the two lowest deciles.
Then, to examine the specificity of genetic risk, we created six different datasets with the following pairs of disorders: MD and Anxiety Disorders (AD), MD and Alcohol Use Disorders (AUD), MD and BD, BD and SZ, DUD and AUD, and ADHD and DUD. The datasets consisted of all individuals registered with disorder 1 in the pair. Furthermore, we censored individuals with an onset of disorder 2 prior to disorder 1. Otherwise, we used the same restrictions and included the same predictors as described above. To explore how well our set of predictors would maximize the specificity of the genetic risk, we first calculated the difference between the two FGRSs in the pair (e.g., for the MD/AD dataset that included individuals registered for MD, we calculated this signed difference: FGRSMD - FGRSAD). Then we used this difference score as the dependent variable in a series of linear regression models. We utilized the same approach as above for examining genetic risk, only now using quintiles of the predictors in the evaluation of the multivariable model. We used SAS 9.4 software [11] for all analyses.
RESULTS
Maximizing genetic risk
As outlined in the top section of Table 1, the sample sizes of our diagnostic groups varied from 11,227 for SZ to 158,557 for MD with mean follow-up periods ranging from 10 to 18 years. These groups displayed the expected sex ratio and the mean FGRS for the disorder ranging from +0.35 for MD to +0.87 for ADHD.
Table 1.
Descriptive results for our samples and univariable models predicting the magnitude, in affected individuals, of FGRSMD, FGRSDUD, FGRSBD, FGRSADHD, and FGRSsz
| Major depression (N = 158,557) | Drug use disorder (N = 69,841) | Bipolar disorder (N = 13,530) | ADHD (N = 54,996) | Schizophrenia (N = 11,227) | ||||||
|---|---|---|---|---|---|---|---|---|---|---|
| Year of birth | 1982 (7.0) | 1985 (6.3) | 1982 (6.4) | 1991 (7.8) | 1966 (9.8) | |||||
| Females | 65.3% | 27.5% | 66.9% | 35.7% | 38.1% | |||||
| Age at registration | 25.9 (6.5) | 22.2 (5.0) | 26.3 (6.2) | 17.8 (8.2) | 33.9 (9.9) | |||||
| Years of follow up | 10.2 (3.3) | 11.6 (4.2) | 10.0 (3.5) | 9.8 (3.1) | 17.7 (7.9) | |||||
| Age at end of follow-up | 36.2 (7.0) | 34.0 (6.3) | 36.4 (6.4) | 27.8 (7.8) | 52.6 (9.8) | |||||
| FGRS | 0.350 (1.1) | 0.664 (1.5) | 0.664 (1.9) | 0.869 (1.7) | 0.732 (2.8) | |||||
| Univariable | % r2 | Univariable | % r2 | Univariable | % r2 | Univariable | % r2 | Univariable | % r2 | |
| Males | 0.033 (0.022; 0.045) * | 0.02% | −0.105 (−0.130; −0.079) * | 0.09% | 0.150 (0.082; 0.218) * | 0.14% | −0.185 (−0.215; −0.155) * | 0.27% | −0.100 (−0.206; 0.008) | 0.03% |
| Year of birth | 0.006 (0.005; 0.007) * | 0.12% | −0.006 (−0.008; −0.004) * | 0.06% | 0.004 (−0.001; 0.009) | 0.02% | −0.001 (−0.003; 0.000) | 0.00% | 0.002 (−0.003; 0.008) | 0.01% |
| Age at registration | −0.009 (−0.010; −0.008) * | 0.28% | −0.008 (−0.011; −0.006) * | 0.07% | −0.015 (−0.020; −0.010) * | 0.26% | 0.001 (−0.001; 0.003) * | 0.00% | −0.012 (−0.017; −0.006) * | 0.17% |
| Number of registrations | 0.72% | 3.16% | 1.53% | 1.17% | 0.20% | |||||
| 1 | Ref | Ref | Ref | Ref | Ref | |||||
| 2 | 0.072 (0.056; 0.088) * | 0.187 (0.154; 0.221) * | 0.154 (0.033; 0.275) | 0.133 (0.064; 0.202) * | 0.077 (−0.156; 0.311) | |||||
| 3–5 | 0.154 (0.140; 0.168) * | 0.323 (0.291; 0.354) * | 0.303 (0.203; 0.404) * | 0.276 (0.221; 0.332) * | 0.167 (−0.027; 0.360) | |||||
| 6–10 | 0.223 (0.206; 0.240) * | 0.513 (0.474; 0.553) * | 0.320 (0.217; 0.424) * | 0.418 (0.363; 0.472) * | 0.156 (−0.031; 0.342) | |||||
| 11 + | 0.288 (0.266; 0.309) * | 0.758 (0.725; 0.792) * | 0.606 (0.521; 0.690) * | 0.565 (0.517; 0.613) * | 0.326 (0.178; 0.476) * | |||||
| Treatment | ||||||||||
| Antipsychotics | 0.148 (0.132; 0.163) * | 0.21% | 0.306 (0.236; 0.375) * | 0.54% | 0.051 (0.017; 0.085) * | 0.02% | 0.222 (0.049; 0.395) | 0.06% | ||
| Antidepressants | 0.197 (0.182; 0.212) * | 0.40% | −0.077 (−0.175; 0.021) | 0.02% | 0.140 (0.112; 0.169) * | 0.17% | 0.002 (−0.103; 0.107) | 0.00% | ||
| Mood stabilizers | 0.140 (0.115; 0.165) * | 0.08% | 0.359 (0.286; 0.432) * | 0.69% | 0.019 (−0.026; 0.063) | 0.00% | 0.013 (−0.112; 0.139) | 0.00% | ||
| ECT treatment | 0.201 (0.145; 0.258) * | 0.03% | 0.137 (0.012; 0.262) | 0.03% | 0.137 (−0.117; 0.392) | 0.01% | ||||
| Site of diagnosis | 0.07% | 0.00% | 0.32% | 0.15% | 0.09% | |||||
| Primary Care/Med | Ref | Ref | Ref | Ref | Ref | |||||
| Specialist Care/Crime | 0.056 (0.044; 0.068) * | 0.005 (−0.021; 0.031) | 0.067 (−0.027; 0.162) | 0.224 (0.173; 0.275) * | 0.091 (−0.161; 0.343) | |||||
| Inpatient Care/Pres | 0.081 (0.058; 0.103) * | −0.002 (−0.095; 0.090) | 0.321 (0.209; 0.437) * | 0.129 (0.011; 0.246) | 0.250 (0.009; 0.491) | |||||
| Prescription | 0.225 (0.174; 0.276) * | |||||||||
| Severity by ICD Code | 0.03% | |||||||||
| Mild | −0.025 (−0.048; −0.002) | |||||||||
| Moderate | 0.038 (0.021; 0.055) * | |||||||||
| Severe | 0.056 (0.024; 0.088) * | |||||||||
| Psychotic | −0.078 (−0.158; 0.001) | |||||||||
| Other | Ref | |||||||||
| Comorbidity | ||||||||||
| Major depression | 0.140 (0.117; 0.164) * | 0.20% | −0.187 (−0.260; −0.115) * | 0.19% | 0.090 (0.060; 0.119) * | 0.06% | −0.040 (−0.161; 0.081) | 0.00% | ||
| Anxiety disorder | 0.158 (0.146; 0.171) * | 0.38% | 0.243 (0.220; 0.266) * | 0.63% | −0.264 (−0.336; −0.192) * | 0.38% | 0.087 (0.059; 0.116) * | 0.06% | −0.068 (−0.181; 0.045) | 0.01% |
| Bipolar disorder | 0.059 (0.014; 0.104) | 0.01% | 0.061 (0.007; 0.114) | 0.01% | −0.064 (−0.213; 0.086) | 0.01% | ||||
| OCD | 0.084 (0.058; 0.110) * | 0.03% | −0.014 (−0.086; 0.057) | 0.00% | −0.107 (−0.237; 0.023) | 0.02% | −0.052 (−0.120; 0.017) | 0.00% | −0.160 (−0.411; 0.091) | 0.01% |
| Other nonaffective psychoses | 0.048 (0.013; 0.082) | 0.00% | 0.188 (0.141; 0.236) * | 0.09% | 0.129 (0.038; 0.220) | 0.06% | −0.090 (−0.167; −0.013) | 0.01% | 0.016 (−0.102; 0.135) | 0.00% |
| Schizophrenia | 0.063 (−0.007; 0.134) | 0.00% | 0.130 (0.038; 0.221) | 0.01% | −0.057 (−0.265; 0.150) | 0.00% | −0.116 (−0.286; 0.055) | 0.00% | ||
| ADHD | 0.193 (0.177; 0.210) * | 0.33% | 0.322 (0.295; 0.350) * | 0.76% | −0.015 (−0.088; 0.055) | 0.00% | −0.143 (−0.367; 0.078) | 0.01% | ||
| Suicide attempt | 0.133 (0.117; 0.150) * | 0.16% | 0.265 (0.238; 0.292) * | 0.53% | −0.009 (−0.080; 0.061) | 0.00% | 0.104 ( 0.064; 0.144) * | 0.05% | −0.064 (−0.181; 0.053) | 0.01% |
| Drug use disorder | 0.148 (0.132; 0.164) * | 0.21% | −0.011 (−0.082; 0.060) | 0.00% | 0.105 (0.072; 0.137) * | 0.07% | −0.133 (−0.252; −0.014) | 0.04% | ||
| Alcohol use disorder | 0.122 (0.104; 0.140) * | 0.11% | 0.322 (0.299; 0.345) * | 0.96% | −0.058 (−0.137; 0.021) | 0.02% | 0.048 (0.006; 0.089) | 0.01% | −0.091 (−0.211; 0.029) | 0.02% |
| Criminal behavior | 0.118 (0.103; 0.133) * | 0.15% | 0.479 (0.456; 0.501) * | 2.43% | 0.039 (−0.037; 0.116) | 0.01% | 0.108 (0.075; 0.141) * | 0.70% | 0.003 (−0.105; 0.110) | 0.00% |
| School/Social measures | ||||||||||
| Low school grades | 0.079 (0.074; 0.084) * | 0.64% | 0.274 (0.264; 0.284) * | 4.05% | −0.026 (−0.053; 0.001) | 0.03% | 0.130 (0.112; 0.142) * | 0.76% | - | |
| Deprivation (0–15) | 0.001 (0.001; 0.002) * | 0.09% | 0.008 (0.008; 0.009) * | 2.22% | 0.001 (0.000; 0.003) | 0.04% | 0.006 (0.006; 0.007) * | 0.82% | - | |
| Deprivation at Reg | 0.001 (0.001; 0.001) * | 0.06% | 0.006 (0.006 0.006) * | 1.49% | 0.000 (−0.001; 0.001) | 0.00% | 0.004 (0.003; 0.004) * | 0.43% | 0.002 (0.000; 0.003) | 0.06% |
FGRS Family Genetic Risk Score.
Bold indicates a nominally significant predictor at p < 0.05.
= Significant at Bonferroni corrected level of: 0.0017 (MD); 0.0025 (DUD); 0.0020 (BD, ADHD) and 0.0023 (SZ); Five most predictive variables—as assessed by r2 for each disorder are underlined.
We examined up to 35 predictors of genetic risk for MD, DUD, BD, ADHD, and SZ, organized into 7 groups: demography/sex, # registrations, site of diagnosis, severity, comorbidity, treatment, and educational and social variables (Table 1). For each predictor, we show the univariable beta estimate and the effect size (r2). The five strongest predictors for each disorder are highlighted in red.
Of the many interesting features of these results, we note eight. First, sex is a modest FGRS predictor with significantly higher FGRS in males for MD and BD and females for DUD and ADHD. Second, early age at onset is modestly associated with increased genetic risk for all disorders but is amongst the strongest predictors for SZ only. Third, the number of registrations is amongst the five most robust predictors of all of our FGRS, stronger for DUD, BD, and ADHD and weaker for MD and SZ. Fourth, site of diagnosis significantly predicts genetic risk for all disorders except DUD, with the largest increase seen for in-patient care for MD, BD, and SZ and for specialist out-patient care for ADHD. Ascertainment for ADHD via stimulant prescription was associated with a moderately higher ADHD FGRS. Fifth, for MD only, clinical severity was coded by ICD-10 and modestly predicted higher FGRS.
Sixth, a range of comorbidities predicts a higher FGRS for MD, the strongest being AD and ADHD. For DUD, the strongest effect by far was for criminal behavior (CB) followed by ADHD, and AUD. For BD the strongest effect is for AD, the diagnosis of which was associated with a reduction in FGRS. Similarly, for SZ, the strongest effect is for DUD which has a negative effect on SZ FGRS. For ADHD, the effects of comorbidity were generally weak, with modest increases in FGRS most associated with diagnoses of CB, DUD, and SA.
Seventh, four treatment effects stood out as robust predictors: antidepressants for MD, mood stabilizers and antipsychotics for BD and antipsychotics for SZ. Electroconvulsive therapy (ECT) was weakly but significantly associated with genetic risk for MD.
Eighth, low school grades had a relatively strong impact on FGRS for DUD and ADHD, with a weaker effect on MD. Community deprivation when growing up and/or at first diagnosis were weakly and positively associated with genetic risk for all disorders examined. Of note, this class of variables included three of the five strongest predictors of FGRS for both SUD and ADHD.
Multivariable analyses and construction of aggregate risk scores
The multivariable analyses for our five disorders are seen in Appendix Table 5. As expected, given considerable correlations among a number of our predictors, predictive effects for most of the variables declined, often substantially. We fitted our multivariable model to a random half of each of our patient samples and then took that model and fitted it to the second random half, dividing each patient group into deciles by the resulting score.
The mean predicted FGRS by decile from our models for each of our disorders are seen in Fig. 1, along with three measures of the predictive strength—the r2 of the model, the linear slope of the regression of deciles onto FGRS score and the ratio of the FRGS from the highest to the two lowest deciles. The rise of mean FGRS is constant and relatively linear for our common disorders—MD, DUD, and ADHD—but “noisier” for BD and especially SZ where sample sizes were much smaller. Using the global index of the r2 of the model, the prediction of genetic risk was strongest for DUD, followed by ADHD, BD, MD and weakest for SZ.
Fig. 1. The relationship between the decile of Family-Genetic Risk Score (FGRS) from our multivariable analyses (using a split-half training and test sample) predicting the strength of the genetic risk for, respectively (from upper left to lower right) major depression (MD), drug use disorder (DUD), bipolar disorder (BD), ADHD and schizophrenia (SZ).
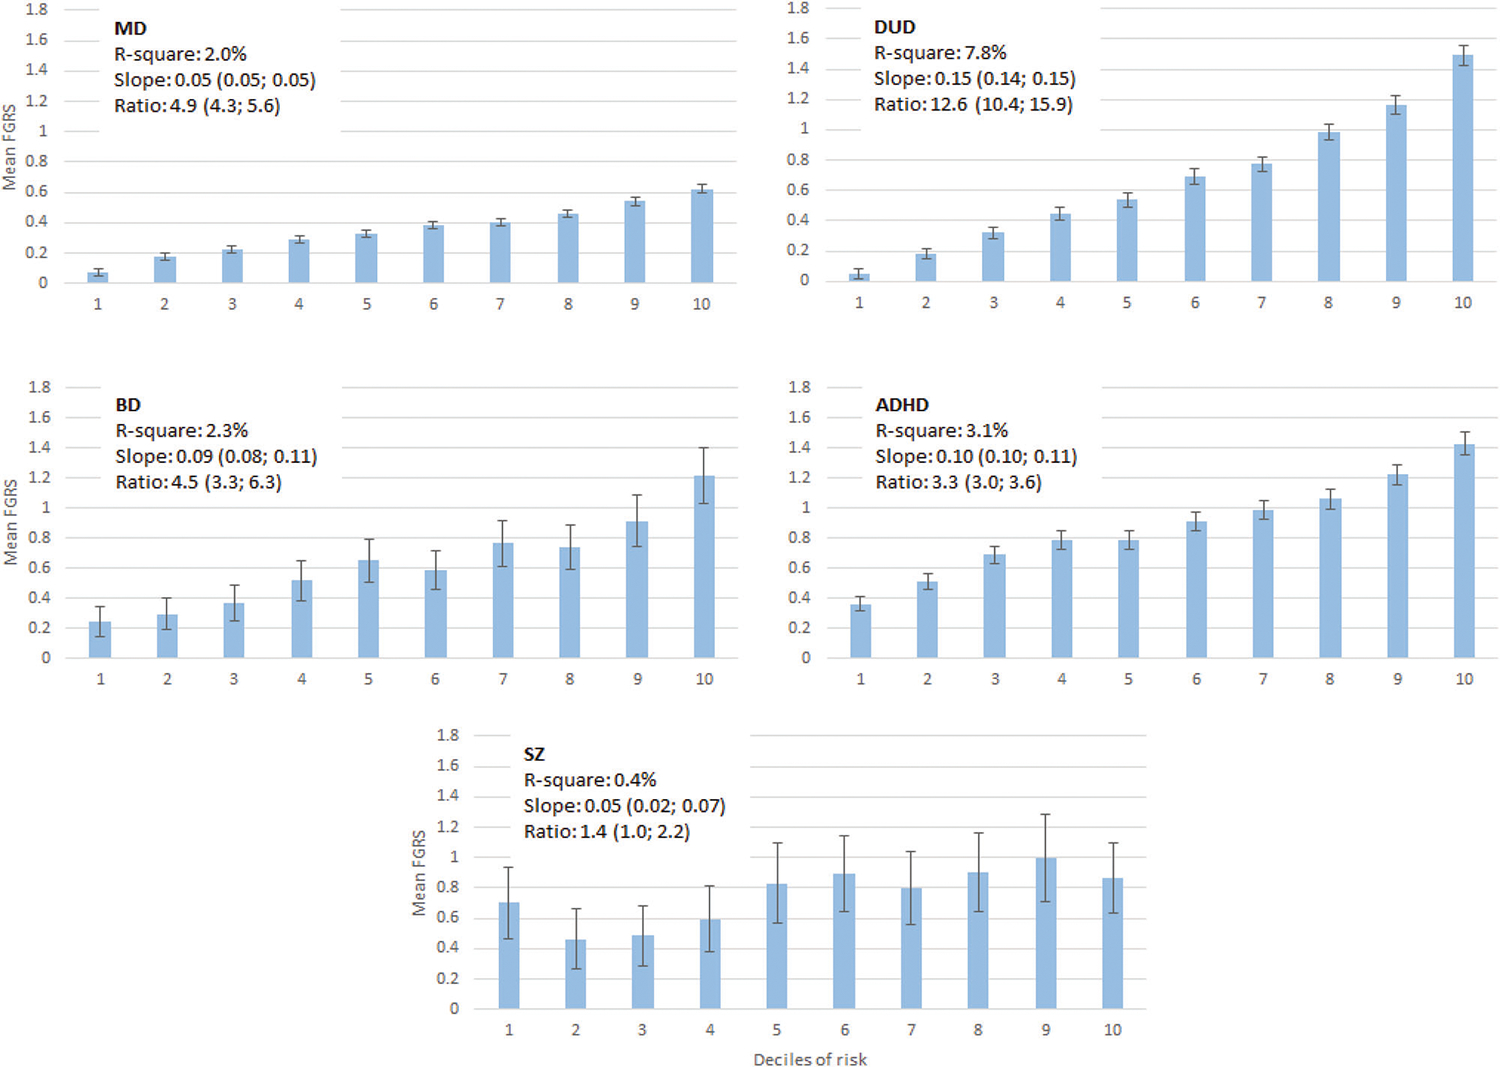
The y-axis in each figure represents the mean FGRS (±95%CIs) for affected individuals in each decile. The x-axis represents the decile of the score from our multivariable regression predicting the strength of the genetic risk. The FGRS is a standardized measure of genetic risk obtained from extended pedigrees so that an FGRS score of 1.0 reflects a mean genetic risk of a set of affected individuals 1.0 SD above the population mean. Above each graph, we present three figures that capture, in different ways, the predictive power of our multivariable prediction formula: r2, the linear slope of the mean FGRS estimates across the deciles, and the ratio of FGRS of the top decile divided by the two lower deciles.
Maximizing specificity of risk
Table 2a, b provide an overview of the ability of our predictors to discriminate the FGRS of six pairs of disorders. For all pairs, we examined all individuals with the first of the disorders, seeking to maximize, with our predictors, the difference, in that sample, between the FGRS for the first and second disorder. We worked through our findings for our first pair—MD and AD—and review more briefly the remaining analyses.
Table 2.
(a) Descriptive results for our samples and univariable models predicting the specificity of the FGRS in three pairs of disorders: major depression (MD) vs. anxiety disorders (AD), major depression vs. bipolar disorder (BD) and major depression vs. alcohol use disorder (AUD). (b) Descriptive results for our samples and univariable models predicting the specificity of the FGRS in three pairs of disorders: bipolar disorder (BD vs. schizophrenia (SZ), drug use disorder (DUD) vs. alcohol use disorder (AUD) and ADHD vs. drug use disorder (DUD).
| (a) | MD vs AD | MD vs BD | MD vs AUD | |||
|---|---|---|---|---|---|---|
| N | 115,441 | 172,841 | 152,015 | |||
| Year of Birth | 1983 (6.8) | 1982 (6.7) | 1982 (6.7) | |||
| Females | 63.8% | 65.8% | 66.3% | |||
| Age at Registration | 25.3 (6.4) | 25.8 (6.5) | 25.8 (6.5) | |||
| Years of follow up | 10.6 (3.4) | 10.3 (3.3) | 10.3 (3.3) | |||
| Age at end of follow-up | 35.9 (6.8) | 36.2 (6.9) | 36.1 (6.7) | |||
| Rates Disorder 2 | 65.4% | 8.3% | 6.9% | |||
| Polycorric Correlation of FGRSs | 0.557 (0.003) | 0.308 (0.003) | 0.253 (0.003) | |||
| Mean FGRS Disorder 1 | 0.336 (1.1) | 0.365 (1.1) | 0.346 (1.1) | |||
| Mean FGRS Disorder 2 | 0.279 (1.1) | 0.144 (1.2) | 0.174 (1.1) | |||
| Mean difference in FGRS | 0.058 (1.06) | 0.220 (1.44) | 0.172 (1.40) | |||
| Univariable | % r2 | Univariable | % r2 | Univariable | % r2 | |
| Males | 0.006 (−0.007; 0.018) | 0.00% | −0.014 (−0.028; 0.000) | 0.00% | 0.013 (−0.002; 0.027) | 0.00% |
| Year of Birth | 0.003 (0.002; 0.004) * | 0.04% | 0.002 (0.001; 0.003) * | 0.01% | 0.003 (0.001; 0.004) * | 0.01% |
| Age At Registration | −0.003 (−0.004; −0.002) * | 0.04% | −0.003 (−0.004; −0.002) * | 0.02% | −0.003 (−0.004; −0.002) * | 0.02% |
| Number of registrations | 0.05% | 0.18% | 0.32% | |||
| 1 | Ref | Ref | Ref | |||
| 2 | 0.004 (−0.014; 0.021) | 0.062 (0.042; 0.082) * | 0.042 (0.021; 0.063) * | |||
| 3–5 | 0.027 (0.011; 0.043) * | 0.104 (0.087; 0.122) * | 0.112 (0.093; 0.130) * | |||
| 6–10 | 0.043 (0.023; 0.062) * | 0.148 (0.127; 0.170) * | 0.181 (0.159; 0.204) * | |||
| 11 + | 0.083 (0.058; 0.107) * | 0.180 (0.154; 0.207) * | 0.246 (0.218; 0.274) * | |||
| Treatment | ||||||
| Antipsychotics | −0.015 (−0.033; 0.003) | 0.00% | −0.059 (−0.076; −0.041) * | 0.03% | −0.031 (−0.052; −0.011) | 0.01% |
| Antidepressants | 0.022 (0–006; 0.039) | 0.01% | 0.121 (0.102; 0.141) * | 0.09% | 0.115 (0.096; 0.134) * | 0.09% |
| Mood stabilizers | 0.025 (−0.005; 0.054) | 0.00% | −0.148 (−0.171; −0.125) * | 0.09% | −0.015 (−0.048; 0.018) | 0.00% |
| ECT treatment | 0.079 (−0.0137; 0.144) | 0.00% | −0.052 (−0.107; 0.003) | 0.00% | 0.100 (0.027; 0.173) | 0.00% |
| Site of diagnosis | 0.00% | 0.00% | 0.01% | |||
| Primary Care/Med | Ref | Ref | Ref | |||
| Specialist Care/Crime | 0.002 (−0.011; 0.016) | −0.008 (−0.022; 0.007) | 0.001 (−0.015; 0.017) | |||
| Inpatient Care/Pres | 0.058 (0.050; 0.065) | −0.025 (−0.051; 0.001) | −0.058 (−0.086; −0.029) * | |||
| Severity by ICD Code | 0.00% | 0.01% | 0.01% | |||
| Mild | 0.000 (−0.025; 0.028) | −0.033 (−0.061; −0.005) | −0.014 (−0.043; 0.015) | |||
| Moderate | 0.004 (−0.014; 0.023) | 0.001 (−0.019; 0.022) | 0.001 (−0.020; 0.023) | |||
| Severe | 0.003 (.0.032; 0.038) | −0.011 (−0.048; 0.027) | −0.018 (−0.059; 0.023) | |||
| Psychotic | −0.048 (−0.135; 0.039) | −0.203 (−0.295; −0.111) * | 0.015 (−0.087; 0.117) | |||
| Other | Ref | |||||
| Comorbidity | ||||||
| Major Depression | ||||||
| Anxiety Disorder | 0.116 (0.100; 0.132)* | 0.12% | 0.035 (0.019; 0.051) * | 0.01% | ||
| Bipolar Disorder | ||||||
| OCD | −0.068 (−0.102; −0.034) * | 0.01% | 0.063 (0.031; 0.094) * | 0.01% | 0.100 (0.067; 0.133) * | 0.02% |
| Other Nonaffective Psychoses | −0.026 (−0.065; 0.014) | 0.00% | −0.145 (−0.184; −0.106) * | 0.03% | −0.095 (−0.141; −0.049) * | 0.01% |
| Schizophrenia | −0.058 (−0.137; 0.020) | 0.00% | −0.077 (−0.160; 0.006) | 0.00% | −0.049 (−0.141; −0.044) | 0.00% |
| ADHD | 0.003 (−0.016; 0.021) | 0.00% | 0.066 (0.047; 0.086) * | 0.03% | −0.047 (−0.068; −0.025) * | 0.01% |
| Suicide Attempt | −0.012 (−0.031; 0.001) | 0.00% | 0.035 (0.016; 0.055) * | 0.01% | −0.136 (−0.158; −0.115) * | 0.10% |
| Drug Use Disorder | −0.046 (−0.065; −0.028) * | 0.02% | 0.035 (0.017; 0.054) * | 0.01% | −0.276 (−0.297; −0.254) * | 0.42% |
| Alcohol Use Disorder | −0.060 (−0.080; −0.039) * | 0.03% | 0.038 (0.017; 0.059) * | 0.01% | ||
| Criminal Behavior | −0.045 (−0.062; −0.028) * | 0.02% | 0.040 (0.022; 0.059) * | 0.01% | −0.313 (−0.333; −0.293) * | 0.62% |
| School/Social Measures | ||||||
| Low School Grades | −0.047 (−0.052; −0.041) * | 0.24% | 0.060 (0.054; 0.066) * | 0.22% | −0.132 (−0.138; −0.126) * | 1.12% |
| Deprivation (0–15) | −0.001 (−0.001; −0.001) * | 0.05% | 0.000 (−0.000; 0.001) | 0.00% | −0.004 (−0.004; −0.003) * | 0.43% |
| Deprivation at Reg | −0.000 (−0.001; −0.000) * | 0.01% | 0.000 (0.000; 0.001) * | 0.01% | −0.002 (−0.002; −0.002) * | 0.21% |
| (b) | BD vs SZ | DUD vs AUD | ADHD vs DUD | |||
| N | 13,401 | 62,495 | 48,754 | |||
| Year of Birth | 1982 (6.4) | 1985 (6.1) | 1992 (7.4) | |||
| Females | 67.2% | 27.9% | 35.9% | |||
| Age at Registration | 26.3 (6.2) | 21.8 (4.8) | 16.9 (7.7) | |||
| Years of follow up | 10.0 (3.4) | 11.5 (4.1) | 9.9 (3.1) | |||
| Age at end of follow-up | 36.3 (6.4) | 33.5 (6.1) | 26.8 (7.4) | |||
| Rates Disorder 2 | 1.5% | 23.8% | 18.4% | |||
| Polycorric Correlation of FGRSs | 0.275 (0.017) | 0.561 (0.004) | 0.377 (0.005) | |||
| Mean FGRS Disorder 1 | 0.667 (1.9) | 0.635 (1.5) | 0.871 (1.7) | |||
| Mean FGRS Disorder 2 | 0.155 (1.4) | 9,538 (1.3) | 0.421 (1.3) | |||
| Mean difference in FGRS | 0.512 (2.18) | 0.097 (1.36) | 0.450 (1.81) | |||
| Univariable | % r2 | Univariable | % r2 | Univariable | % r2 | |
| Males | 0.113 (0.035; 0.192) | 0.06% | −0.026 (−0.050; −0.003) | 0.01% | −0.130 (−0.163; −0.096) | 0.12% |
| Year of Birth | 0.004 (−0.002; 0.010) | 0.01% | −0.000 (−0.002; 0.001) | 0.00% | −0.001 (−0.004; 0.001) | 0.00% |
| Age At Registration | −0.009 (−0.015; −0.003) | 0.07% | −0.002 (−0.004; 0.001) | 0.00% | 0.002 (0.000; 0.004) | 0.01% |
| Number of registrations | 0.88% | 0.19% | 0.73% | |||
| 1 | Ref | Ref | Ref | |||
| 2 | 0.056 (−0.084; 0.196) | 0.029 (−0.003; 0.061) | 0.082 (0.004; 0.160) | |||
| 3–5 | 0.272 (0.156; 0.389) * | 0.085 (0.056; 0.115) * | 0.166 (0.104; 0.229) * | |||
| 6–10 | 0.316 (0.196; 0.437) * | 0.140 (0.102; 0.177) * | 0.228 (0.167; 0.289) * | |||
| 11 + | 0.507 (0.409; 0.604) * | 0.151 (0.119; 0.183) * | 0.426 (0.372; 0.480) * | |||
| Treatment | ||||||
| Antipsychotics | 0.207 (0.127; 0.287) * | 0.19% | −0.136 (−0.176; −0.095) * | 0.90% | ||
| Antidepressants | −0.055 (−0.168; 0.058) | 0.01% | 0.049 (0.017; 0.081) | 0.02% | ||
| Mood stabilizers | 0.377 (0.294; 0.461) * | 0.58% | −0.055 (−0.109; −0.001) | 0.01% | ||
| ECT treatment | 0.083 (−0.062; 0.228) | 0.01% | ||||
| Site of diagnosis | 0.03% | 0.02% | 0.08% | |||
| Primary Care/Med | Ref | Ref | Ref | |||
| Specialist Care/Crime | −0.003 (−0.112; 0.106) | 0.019 (−0.005; 0.043) | 0.094 (0.036; 0.152) * | |||
| Inpatient Care/Pres | 0.100 (−0.030; 0.230) | 0.170 (0.083; 0.256) * | −0.080 (−0.213; 0.052) | |||
| Prescription | 0.152 (0.094; 0.210) * | |||||
| Comorbidity | ||||||
| Major Depression | −0.151 (−0.234; −0.068) * | 0.09% | 0.031 (0.009; 0.053) | 0.01% | 0.041 (0.008; 0.074) | 0.01% |
| Anxiety Disorder | −0.220 (−0.303; −0.137) * | 0.20% | 0.039 (0.017; 0.060) * | 0.02% | −0.036 (−0.068; −0.004) | 0.01% |
| Bipolar Disorder | −0.009 (−0.052; 0.034) | 0.00% | −0.025 (−0.088; 0.039) | 0.00% | ||
| OCD | −0.201 (−0.351; -0.052) | 0.05% | −0.048 (−0.116; 0.019) | 0.00% | −0.032 (−0.108; 0.043) | 0.00% |
| Other Nonaffective Psychoses | −0.172 (−0.279; −0.065) * | 0.07% | 0.014 (−0.031; 0.060) | 0.00% | −0.207 (−0.313; −0.101) * | 0.03% |
| Schizophrenia | 0.040 (−0.059; 0.128) | 0.00% | −0.139 (−0.384; 0.108) | 0.00% | ||
| ADHD | −0.049 (−0.130; 0.032) | 0.01% | 0.064 (0.038; 0.090) * | 0.04% | ||
| Suicide Attempt | −0.042 (−0.123; 0.040) | 0.01% | 0.025 (−0.001; 0..051) | 0.01% | −0.129 (−0.179; −0.079) * | 0.05% |
| Drug Use Disorder | −0.062 (−0.143; 0.021) | 0.02% | ||||
| Alcohol Use Disorder | −0.018 (−0.109; 0.073) | 0.00% | −0.234 (−0.290; −0.179) * | 0.14% | ||
| Criminal Behavior | −0.030 (−0.119; 0.058) | 0.00% | 0.060 (0.039; 0.082) * | 0.05% | −0.319 (−0.360; 0.279) * | 0.49% |
| School/Social Measures | ||||||
| Low School Grades | −0.027 (−0.058; 0.005) | 0.02% | 0.042 (0.032; 0.051) * | 0.12% | −0.061 (−0.076; −0.048) * | 0.16% |
| Deprivation (0–15) | 0.000 (−0.001; 0.002) | 0.00% | 0.002 (0.001; 0.002) * | 0.11% | 0.002 (−0.002; −0.001) * | 0.04% |
| Deprivation at Reg | −0.000 (−0.002; 0.001) | 0.00% | 0.001 (0.001; 0.002) * | 0.11% | −0.001 (−0.002; −0.001) * | 0.05% |
FGRS Family Genetic Risk Score.
= Significant at Bonferroni corrected level of: 0.0016; Bold = Significant at p < 0.05; Five most predictive variables—as assessed by r2 for each disorder are underlined.
*= Significant at Bonferroni corrected level of: 0.0021 (DUD vs AUD); 0.0018 (BD vs SZ and ADHD vs DUD); Bold = Significant at p < 0.05. Five most predictive variables—as assessed by r2 for each disorder are underlined.
The FGRS scores for MD and AD are relatively highly correlated in our sample (r = +0.56) and the mean difference in their FGRS in MD patients was only 0.06, quite modest. So, increasing specificity for the MD genetic signal was likely a difficult task. Of the 28 predictors examined in Table 2a, 14 nominally predicted MD-AD FGRS differences. Of the five largest effects, three (for low school grades, deprivation growing up, and age at first registration) predicted smaller FGRS differences, while two (number of registrations, and year of birth) predicted larger differences. Receiving ECT or antidepressants increased the MD-AD FGRS differences, while having diagnoses of OCD, AUD, DUD, and CB decreased FGRS differences.
As seen in appendix Tables 6 and 7, we then performed a multivariable analysis of these predictors, and obtained, in a random half, our best predictive formula which we examined in the other half. As seen in Fig. 2, we indeed had a limited ability to separate, in MD patients, their genetic risks for MD and AD. In the highest quintile, the absolute difference in FGRS was only 0.14, and we could explain only 0.3% of the total variance in our model. But our algorithm had some impact on risk specificity, as in our lower two quintiles, the mean FGRS for MD and AD were virtually identical.
Fig. 2. The relationship between the quintile of the Family-Genetic Risk Score (FGRS) difference from our multivariable analyses (using a split-half training and test sample) predicting the difference in genetic risk for, the following six pairs of disorders (from upper left to lower right): Major Depression vs. Anxiety Disorders (MD vs AD), Major Depression vs. Bipolar Disorder (MD vs BD), Major Depression vs. Alcohol Use Disorder (MD vs. AUD), Bipolar Disorder vs Schizophrenia (BD vs SZ), Drug Use Disorder vs. Alcohol Use Disorder (DUD vs AUD) and ADHD vs. Drug Use Disorder.
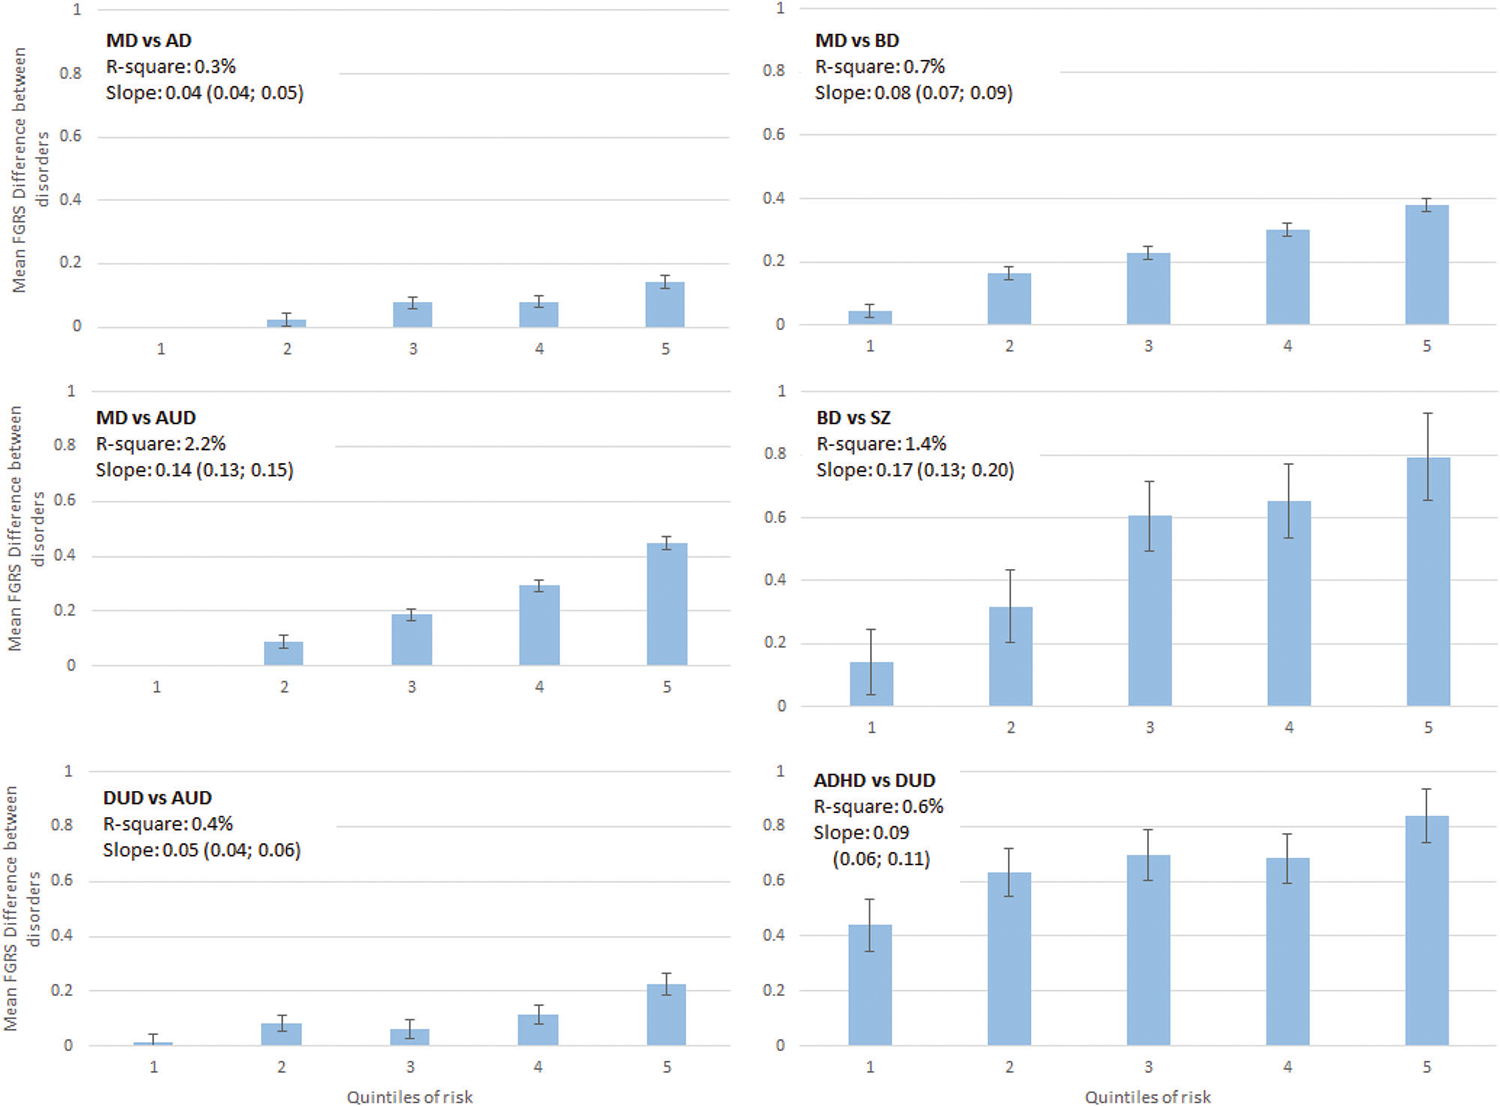
In these comparisons, we examine individuals affected with the first of the pair of disorders and predict clinical features that will maximize the difference in FGRS of the two disorders. The y-axis in each figure represents the mean difference in the FGRS scores (±95%CIs) for the two disorders. The x-axis represents the quintile of the score from our multivariable regression predicting the differences in the genetic risk. Above each graph, we present two figures that capture, in different ways, the predictive power of our multivariable prediction formula: r2 and the linear slope of the mean FGRS estimates across the quintiles.
Turning to our next two models (MD vs BD and MD vs AUD), the correlations between the FGRS for both pairs were much lower than between MD and AD and the mean FGRS differences much larger. Therefore, it is reasonable to think that our specificity predictions might be more successful. As seen in our univariable analyses in Table 2a, many more of the predictors significantly differentiated genetic risks in the MD-BD and MD-AUD pairings. For example, number of MD registrations predicted differences with the BD and AUD FGRS much better than it did in the AD analyses. Comorbidities with DUD and CB and poor school grades were particularly potent at predicting higher AUD FGRS in the MD-AUD pairing. As expected, our predicted models for MD vs. DB and MD vs AUD predicted more than twice and more than seven times the variance as our MD vs AD analyses with considerably steeper slopes (Fig. 2).
For two of the final three models (BD vs SZ and ADHD vs DUD), the FGRSs for the two disorders were moderate and mean differences between them substantial. The third—DUD vs AUD—resembled the AD-MD pairing as their FGRS correlations were relatively high and mean FGRS differences modest.
The prediction of differences in the FGRS for BD and SZ in a cohort of BD patients was relatively successful as, in the highest quintile, we found a quite large FGRS difference of 0.79 (0.66–93). Number of BD registrations, receipt of mood stabilizers and comorbidity with AD were the strongest predictors. The predicted r2 was the second highest in our 6 analyses and the slope across quintiles was the steepest.
In the ADHD-DUD analyses, the r2 and slope were intermediate in value. The most unusual feature was how large the ADHD and DUD FGRS differences were even in the lowest quintile from our predictive model. But like the BD vs SZ model, the highest quintile showed a much higher ADHD than DUD FGRS [0.84 (0.74–94)]. As expected, the pattern of our DUD vs. AUD model resembled that found for our MD vs. AD analyses, with a modest slope and r2 value.
DISCUSSION
While numerous prior studies have found clinical features associated with the level of genetic risk in particular psychiatric disorders [1–9], we are the first, to our knowledge, to examine systematically a diverse set of clinical indices in large epidemiological patient cohorts, and from them develop predictive models. We use these models not only to try to maximize genetic risk but also to increase the specificity of genetic risk.
Of the many findings in this manuscript, we focus on five. First, utilizing potential predictors available in the Swedish registries, we developed a multivariate predictor score which could meaningfully divide our clinical samples by level of genetic risk. Quantitatively, our predictive ability varied across disorders being greatest for DUD and weakest for SZ. For four of the five disorders examined, the mean FGRS in the upper decile was more than three times that in the lowest two deciles, a level of “genetic enrichment” that could be actionable for research purposes. The poor performance of our FGRS prediction for SZ was unexpected and could not be explained only by its low prevalence, which was similar to that of BD.
Second, which classes of variables were most predictive of genetic risk across our five disorders? Of the clinical features, number of registrations was overall the most predictive of genetic risk followed by kinds of treatment and then site of diagnosis. Age at first registration had weaker effects than was expected from the prior literature [1, 4, 6]. Comorbidities varied in their impact across disorders as would be expected from the genetic correlations of the pairs of disorders considered. For example, an AD diagnosis predicted MD FGRS because both are genetically closely related internalizing disorders [12, 13]. A diagnosis of AUD predicted DUD and ADHD FGRS most likely because all three of these disorders are externalizing syndromes which have shared genetic risks [14–17]. We examined two genetically influenced non-psychiatric traits/conditions: CB and low educational achievement. Consistent with prior studies that both are closely related to externalizing psychopathology [16, 18–21] these variables were particularly predictive of FGRS for DUD and ADHD. Finally, we included psychosocial deprivation which has a complex etiology including important social factors but can also arise from gene-environment correlation [22] and was predictive of the FGRS for DUD, ADHD and SZ.
Third, the overall pattern of our results predicting specificity of genetic risk was consistent with expectations. Predicting differences in genetic risk for pairs of disorders that—like MD & AD and DUD & AUD—are quite closely genetically related is difficult because few of variables examined strongly distinguished them. By contrast, for disorders with modest shared genetic effects, like MD and AUD, a number of our variables could robustly discriminate between the two FGRS. Contrary to the findings from molecular genetic studies of a close genetic relationship between BD and SZ [21, 23, 24], we were able to differentiate genetic risk for the two disorders with considerable success.
Fourth, it is noteworthy that despite similar prevalence, our ability to predict the FGRS for SZ was much poorer than that observed for BD. The general pattern was clear—all of the strong predictors for FGRSBD, including recurrence, treatment, site of diagnosis, and comorbidities were predictive of FGRSSZ, but consistently at considerably lower levels. This was especially striking for frequency of recurrence which, in univariable analyses, predicted more than seven times the variance in FGRSBD than FGRSSZ. The variability in genetic risk in our cohort of BD patients was much better indexed by our predictors than was the case for SZ—suggesting, indirectly, that more of the clinical variability in SZ than in BD derives from non-genetic sources.
Fifth, in what kinds of research designs would this information be especially helpful? Most obviously, our findings could be particularly impactful for genetic designs seeking to study cases enriched for genetic liability, an approach that already in use in genome-wise association studies [10] based on much more limited data. Another design for which these results would be based on the selection, for a range of possible comparisons, of subsets of patients with MD, BD or SZ estimated to be at high versus low genetic risk.
Limitations
Our findings should be considered in the context of three potential methodological limitations. First, our results are specific to the population in Sweden and the associated available health registry data. The degree to which these results replicate in other samples needs to be empirically explored. Second, the validity of findings are dependent on the quality of diagnoses in the Swedish national registries which for SZ and BD, have been supported by validation of the hospital diagnoses [25] [26, 27], for MD and AD diagnoses by their prevalence, sex ratio, correlations in relatives and associations with known psychosocial risk factors [28–30] and for DUD and AUD by high rates of concordance across ascertainment methods [31] [19] and patterns of resemblance in relatives [32, 33].
Third, the FGRS, a family phenotype-based method to assess quantitative genetic risk, has been now widely published, [34–40] with prior reports demonstrating that this score is not highly sensitive to the various assumptions involved in its calculation, that the correction for cohabitation performs appropriately, and the method agrees well with other similar, but statistically distinct, approaches [41].
Conclusions
We sought in this paper to challenge the idea that the magnitude and specificity of the genetic risk for a psychiatric disorder is an inherent feature of the condition and hence largely independent of the method of ascertainment. Instead, we showed that the level of genetic risk for five diverse psychiatric disorders could be substantially impacted by selection on clinical features, treatment, site of diagnosis, comorbidity, and academic achievement. Specificity of genetic risk could also be meaningfully impacted by these same predictors, enabling researchers to select cases with considerably lower or high genetic risk for other disorders. The magnitude and specificity of genetic risk for psychiatric illness can differ substantially for subsets of cases depending on various selection criteria.
Supplementary Material
FUNDING
This project was supported by grants AA023534 and DA030005 from the National Institutes of Health and the Swedish Research Council (2020–01175).
Footnotes
COMPETING INTERESTS
The authors declare no competing interests.
ADDITIONAL INFORMATION
Supplementary information The online version contains supplementary material available at https://doi.org/10.1038/s41380-023-02156-2.
Reprints and permission information is available at http://www.nature.com/reprints
DATA AVAILABILITY
KS MD PhD had full access to all the data in the study and takes responsibility for the integrity of the data and the accuracy of the data analysis.
REFERENCES
- 1.Weissman MM, Wickramaratne P, Merikangas KR, Leckman JF, Prusoff BA, Caruso KA, et al. Onset of major depression in early adulthood. Increased familial loading and specificity. Arch Gen Psychiatry. 1984;41:1136–43. [DOI] [PubMed] [Google Scholar]
- 2.Sullivan PF, Neale MC, Kendler KS. Genetic epidemiology of major depression: review and meta-analysis. Am J Psychiatry. 2000;157:1552–62. [DOI] [PubMed] [Google Scholar]
- 3.Rajagopal VM, Duan J, Vilar-Ribó L, Grove J, Zayats T, Ramos-Quiroga JA, et al. Differences in the genetic architecture of common and rare variants in childhood, persistent and late-diagnosed attention-deficit hyperactivity disorder. Nat Genet. 2022;54:1117–24. [DOI] [PMC free article] [PubMed] [Google Scholar]
- 4.Kendler KS, Gatz M, Gardner CO, Pedersen NL. Age at onset and familial risk for major depression in a Swedish national twin sample. Psychol Med. 2005;35:1573–9. [DOI] [PubMed] [Google Scholar]
- 5.Faraone SV. Genetics of adult attention-deficit/hyperactivity disorder. Psychiatr Clin North Am. 2004;27:303–21. [DOI] [PubMed] [Google Scholar]
- 6.Leboyer M, Henry C, Paillere-Martinot ML, Bellivier F. Age at onset in bipolar affective disorders: a review. Bipolar Disord. 2005;7:111–8. [DOI] [PubMed] [Google Scholar]
- 7.Kendler KS, Ohlsson H, Sundquist K, Sundquist J. Clinical features of drug abuse that reflect genetic risk. Psychol Med. 2014;44:2547–56. [DOI] [PMC free article] [PubMed] [Google Scholar]
- 8.Kendler KS. The diagnostic validity of melancholic major depression in a population- based sample of female twins. Arch Gen Psychiatry. 1997;54:299–304. [DOI] [PubMed] [Google Scholar]
- 9.Kendler KS, Klee A. Bruno Schulz’s 1933 Monograph: On the Hereditary Etiology of Schizophrenia. Schizophr Bull. 2022;48:S45–S55. [DOI] [PMC free article] [PubMed] [Google Scholar]
- 10.CONVERGE consortium. Sparse whole-genome sequencing identifies two loci for major depressive disorder. Nature. 2015;523:588–91. [DOI] [PMC free article] [PubMed] [Google Scholar]
- 11.SAS Institute I. SAS/STAT® Online Documentation, Version 9.4. Cary, N.C.: SAS Institute, Inc. (2012). [Google Scholar]
- 12.Kendler KS, Aggen SH, Knudsen GP, Roysamb E, Neale MC, Reichborn-Kjennerud T. The Structure of Genetic and Environmental Risk Factors for Syndromal and Subsyndromal Common DSM-IV Axis I and All Axis II Disorders. Am J Psychiatry. 2011;168:29–39. [DOI] [PMC free article] [PubMed] [Google Scholar]
- 13.Grotzinger AD, Mallard TT, Akingbuwa WA, Ip HF, Adams MJ, Lewis CM, et al. Genetic architecture of 11 major psychiatric disorders at biobehavioral, functional genomic and molecular genetic levels of analysis. Nat Genet. 2022;54:548–59. [DOI] [PMC free article] [PubMed] [Google Scholar]
- 14.Kendler KS, Prescott CA, Myers J, Neale MC. The structure of genetic and environmental risk factors for common psychiatric and substance use disorders in men and women. Arch Gen Psychiatry. 2003;60:929–37. [DOI] [PubMed] [Google Scholar]
- 15.Heath AC, Martin NG, Lynskey MT, Todorov AA, Madden PA. Estimating two-stage models for genetic influences on alcohol, tobacco or drug use initiation and dependence vulnerability in twin and family data. Twin Res. 2002;5:113–24. [DOI] [PubMed] [Google Scholar]
- 16.Faraone SV, Larsson H. Genetics of attention deficit hyperactivity disorder. Mol Psychiatry. 2019;24:562–75. [DOI] [PMC free article] [PubMed] [Google Scholar]
- 17.Hatoum AS, Johnson EC, Colbert SM, Polimanti R, Zhou H, Walters RK, et al. The addiction risk factor: a unitary genetic vulnerability characterizes substance use disorders and their associations with common correlates. Neuropsychopharmacology. 2022;47:1739–45. [DOI] [PMC free article] [PubMed] [Google Scholar]
- 18.Kendler KS, Sundquist K, Ohlsson H, Palmer K, Maes H, Winkleby MA, et al. Genetic and familial environmental influences on the risk for drug abuse: a national Swedish adoption study. Arch Gen Psychiatry. 2012;69:690–7. [DOI] [PMC free article] [PubMed] [Google Scholar]
- 19.Kendler KS, Ji J, Edwards AC, Ohlsson H, Sundquist J, Sundquist K. An Extended Swedish National Adoption Study of Alcohol Use Disorder. JAMA Psychiatry. 2015;72:211–8. [DOI] [PMC free article] [PubMed] [Google Scholar]
- 20.Pettersson E, Larsson H, Lichtenstein P. Common psychiatric disorders share the same genetic origin: a multivariate sibling study of the Swedish population. Mol Psychiatry. 2016;21:717–21. [DOI] [PubMed] [Google Scholar]
- 21.Bulik-Sullivan B, Finucane HK, Anttila V, Gusev A, Day FR, Loh PR, et al. An atlas of genetic correlations across human diseases and traits. Nat Genet. 2015;47:1236–41. [DOI] [PMC free article] [PubMed] [Google Scholar]
- 22.Abdellaoui A, Hugh-Jones D, Yengo L, Kemper KE, Nivard MG, Veul L, et al. Genetic correlates of social stratification in Great Britain. Nat Hum Behav. 2019;3:1332–42. [DOI] [PubMed] [Google Scholar]
- 23.Lee SH, Ripke S, Neale BM, Faraone SV, Purcell SM, Perlis RH, et al. Genetic relationship between five psychiatric disorders estimated from genome-wide SNPs. Nat Genet. 2013;45:984–94. [DOI] [PMC free article] [PubMed] [Google Scholar]
- 24.Brainstorm C, Anttila V, Bulik-Sullivan B, Finucane HK, Walters RK, Bras J, et al. Analysis of shared heritability in common disorders of the brain. Science. 2018;360:1313. [DOI] [PMC free article] [PubMed] [Google Scholar]
- 25.Lichtenstein P, Bjork C, Hultman CM, Scolnick E, Sklar P, Sullivan PF. Recurrence risks for schizophrenia in a Swedish national cohort. Psychological Med. 2006;36:1417–25. [DOI] [PubMed] [Google Scholar]
- 26.Sellgren C, Landen M, Lichtenstein P, Hultman CM, Langstrom N. Validity of bipolar disorder hospital discharge diagnoses: file review and multiple register linkage in Sweden. Acta Psychiatr Scand. 2011;124:447–53. [DOI] [PubMed] [Google Scholar]
- 27.Ekholm B, Ekholm A, Adolfsson R, Vares M, Osby U, Sedvall GC, et al. Evaluation of diagnostic procedures in Swedish patients with schizophrenia and related psychoses. Nord J Psychiatry. 2005;59:457–64. [DOI] [PubMed] [Google Scholar]
- 28.Kendler KS, Ohlsson H, Lichtenstein P, Sundquist J, Sundquist K. The Genetic Epidemiology of Treated Major Depression in Sweden. Am J Psychiatry. 2018;175:1137–44. [DOI] [PubMed] [Google Scholar]
- 29.Sundquist J, Ohlsson H, Sundquist K, Kendler KS. Common Adult Psychiatric Disorders in Swedish Primary Care (Where Most Mental Health Patients are Treated). BMC Psychiatry. 2017;17:235. [DOI] [PMC free article] [PubMed] [Google Scholar]
- 30.Kendler KS, Abrahamsson L, Ohlsson H, Sundquist J, Sundquist K. An Extended Swedish Adoption Study of Anxiety Disorder and Its Cross-Generational Familial Relationship With Major Depression. Am J Psychiatry. 2022;179:640–9. [DOI] [PubMed] [Google Scholar]
- 31.Kendler KS, Lönn SL, Salvatore J, Sundquist J, Sundquist K. The Origin of Spousal Resemblance for Alcohol Use Disorder. JAMA Psychiatry. 2018;75:280–6. [DOI] [PMC free article] [PubMed] [Google Scholar]
- 32.Prescott CA, Kendler KS. Genetic and environmental contributions to alcohol abuse and dependence in a population-based sample of male twins. Am J Psychiatry. 1999;156:34–40. [DOI] [PubMed] [Google Scholar]
- 33.Tsuang MT, Lyons MJ, Eisen SA, Goldberg J, True W, Lin N, et al. Genetic influences on DSM-III-R drug abuse and dependence: a study of 3,372 twin pairs. Am J Med Genet. 1996;67:473–7. [DOI] [PubMed] [Google Scholar]
- 34.Kendler KS, Ohlsson H, Sundquist J, Sundquist K. Family Genetic Risk Scores and the Genetic Architecture of Major Affective and Psychotic Disorders in a Swedish National Sample. JAMA Psychiatry. 2021;78:735–43. [DOI] [PMC free article] [PubMed] [Google Scholar]
- 35.Kendler KS, Ohlsson H, Sundquist J, Sundquist K. The patterns of family genetic risk scores for eleven major psychiatric and substance use disorders in a Swedish national sample. Transl Psychiatry. 2021;11:1–8. [DOI] [PMC free article] [PubMed] [Google Scholar]
- 36.Kendler K, Ohlsson H, Sundquist J, Sundquist K. The Impact of Sex, Age at Onset, Recurrence, Mode of Ascertainment and Medical Complications on the Family Genetic Risk Score Profiles for Alcohol Use Disorder. Psychol Med. 2023;53:1732–40. In press; [DOI] [PubMed] [Google Scholar]
- 37.Kendler KS, Ohlsson H, Mościcki EK, Sundquist J, Edwards AC, Sundquist K. Genetic Liability to Suicide Attempt, Suicide Death and Psychiatric and Substance Use Disorders on the Risk for Suicide Attempt and Suicide Death: A Swedish National Study. Psychol Med. 2023;53:1639–48. In press; [DOI] [PMC free article] [PubMed] [Google Scholar]
- 38.Kendler KS, Ohlsson H, Bacanu S, Sundquist J, Edwards AC, Sundquist K. Differences in Genetic Risk Score Profiles for Drug Use Disorder, Major Depression and ADHD as a Function of Sex, Age at Onset, Recurrence, Mode of Ascertainment and Treatment. Psychol Med. 2023;53:3448–60. In press; [DOI] [PMC free article] [PubMed] [Google Scholar]
- 39.Kendler KS, Ohlsson H, Sundquist J, Sundquist K. The Moderation of the Genetic Risk for Alcohol and Drug Use Disorders in a Swedish National Sample by the Genetic Aptitude for Educational Attainment. Psychol Med. 2023;53:3077–84. In press; [DOI] [PMC free article] [PubMed] [Google Scholar]
- 40.Kendler KS, Rosmalen JGM, Ohlsson H, Sundquist J, Sundquist K. A distinctive profile of family genetic risk scores in a Swedish national sample of cases of fibromyalgia, irritable bowel syndrome, and chronic fatigue syndrome compared to rheumatoid arthritis and major depression. Psychol Med. 2022;1–8. [DOI] [PMC free article] [PubMed] [Google Scholar]
- 41.Hujoel ML, Gazal S, Loh P-R, Patterson N, Price AL. Liability threshold modeling of case–control status and family history of disease increases association power. Nat Genet. 2020;52:541–7. [DOI] [PMC free article] [PubMed] [Google Scholar]
Associated Data
This section collects any data citations, data availability statements, or supplementary materials included in this article.
Supplementary Materials
Data Availability Statement
KS MD PhD had full access to all the data in the study and takes responsibility for the integrity of the data and the accuracy of the data analysis.