

Abstract
Broca’s area is crucially involved in language processing. The sub-regions of Broca’s area (pars triangularis, pars opercularis) presumably are connected via corticocortical pathways. However, growing evidence suggests that the thalamus may also be involved in language and share some of the linguistic functions supported by Broca’s area. Functional connectivity is thought to be achieved via corticothalamic/thalamocortical white matter pathways. Our study investigates structural connectivity between Broca’s area and the thalamus, specifically ventral anterior nucleus and pulvinar. We demonstrate that Broca’s area shares direct connections with these thalamic nuclei and suggest a local Broca’s area—thalamus network potentially involved in linguistic processing. Thalamic connectivity with Broca’s area may serve to selectively recruit cortical regions storing multimodal features of lexical items and to bind them together during lexical–semantic processing. In addition, Broca’s area—thalamic circuitry may enable cortico–thalamo–cortical information transfer and modulation between BA 44 and 45 during language comprehension and production.
Keywords: Broca’s area, Thalamus, Ventral anterior nucleus, Pulvinar, White matter, Tractography, Language
1. Introduction
Neural networks supporting language processing extend further than proposed by the classical language models (Assaf et al., 2006; Binder, Frost, Hammeke, Rao, & Cox, 1996; Crosson et al., 2007). Recent studies show that functions believed to be supported by classical language regions (Broca’s and Wernicke’s areas) are more numerous and advanced than had been proposed. Specifically, Broca’s area and adjacent cortices are not simply a speech production region of the brain, but rather a sophisticated neural cluster involved in semantic, phonological, and syntactic processing, action understanding and imitation, and working memory (Amunts et al., 2004; Hagoort, Hald, Bastiaansen, & Petersson, 2004; Heim, Eickhoff, & Amunts, 2008; Heim, Friederici, Schiller, Ruschemeyer, & Amunts, 2009; Ullman, 2004; Rizzolatti & Craighero, 2004; Cabeza & Nyberg, 2000). Devlin et al. (2003) found an anterior to posterior gradient in Broca’s area, with the anterior portion more involved in semantic than phonological processing and the posterior portion more involved in phonological than semantic processing, further illustrating the functional complexity of this cortical region. Electrophysiology, neuroimaging and lesion studies also indicate the importance of subcortical structures, specifically the thalamus, in many cognitive processes including language (Crosson, Moberg, Boone, Rothi, & Raymer, 1997; Johnson & Ojemann, 2000; Kraut et al., 2002; Slotnick et al., 2002). Our knowledge of language systems and their organization suggests that substrates supporting similar functions are organized into functional networks with structural connectivity between systems components. Communication between these regions is putatively enabled through shared neural circuitry to support processing of specific types of information.
Hence, it is reasonable to conclude that Broca’s area and the thalamus may participate in common language processes and that they may therefore be structurally connected. The present study limits its investigation of structural connectivity between Broca’s area and the thalamus to two thalamic nuclei: the ventral anterior nucleus and the pulvinar. These nuclei were selected as Broca’s area connectivity targets because: (1) they have been previously implicated to be involved in language processing, (2) they demonstrate involvement in linguistic functions similar to those served by BA 44 and 45. Specifically, object naming and category member generation were shown to activate anterior Broca’s area (BA 45), as well as the pulvinar (Amunts et al., 2004). The ventral anterior nucleus has been implicated to be involved in speech production (Schaltenbrand, 1965, 1975; Graff-Radford, Damasio, Yamada, Eslinger, & Damasio, 1985; Alexander & LoVerme, 1980; Nadeau & Crosson, 1997; Raymer, Moberg, Crosson, Nadeau, & Rothi, 1997), a function commonly attributed to BA 44 (Amunts et al., 2004; Hagoort et al., 2004). Lesions of the dominant ventral anterior (VA) nucleus or of the pulvinar often result in semantic paraphasias and word finding difficulties further implicating these thalamic nuclei in language processing (Crosson et al., 1997; Raymer et al., 1997).
Based on this evidence, we believe that it would be well warranted to investigate whether the sub-regions of Broca’s area (i.e., pars triangularis, pars opercularis) and thalamic nuclei are connected such that they could be members of circuitry relatively local neural network. The degree of similarity of clinical language deficits resulting from damage to the ventral anterior thalamus and to the pulvinar suggests that these thalamic nuclei may be part of a single network involved in language processing (Crosson, 2013). We hypothesize that both ventral anterior nucleus and the pulvinar share direct structural connectivity with Broca’s area. Our prior work (Ford et al., 2013) showed direct connectivity between Broca’s area and the thalamus, with fibers entering near the anterior-medial border of the ventral anterior nucleus. However, no fibers entering the posterior thalamus, or more specifically the pulvinar, were found. It seems plausible given the evidence implicating its involvement in language processing, that the pulvinar may also be part of the network involving Broca’s area and the thalamus. Indeed, from what we know about the frontal cortex in the macaque, almost all frontal regions are connected to the pulvinar as well as the ventral anterior nucleus (Goldman-Rakic & Porrino, 1985), though the trajectory of these fibers was not defined. In addition, Romanski and colleagues demonstrated direct connectivity between macaque areas 44 and 45 and the central/lateral medial pulvinar (Romanski, Giguere, Bates, & Goldman-Rakic, 1997). Dense reciprocal connectivity between macaque area 45, ventral anterior nucleus, and pulvinar was also demonstrated by Akert and Hartmann-von Monakow (1979). A potential problem with our previous work was that the thalamus in its entirety was used as a target for tractography. We hypothesize that by using masks of the specific nuclei, it would be possible to trace fibers to both nuclei using diffusion-weighted tractography and that fibers between Broca’s area and the pulvinar might course through the internal medullary lamina to reach the pulvinar. This would explain why we could not see these fibers in our prior work (Ford et al., 2013), when the entire thalamus was used as a mask. Hence, we used diffusion-weighted tractography to infer pathways connecting Broca’s area with these specific thalamic nuclei and characterized the connectivity strength of these inferred pathways using quantitative tractography measures.
2. Methods
2.1. Participants
We acquired neuroimaging data in ten healthy volunteers (5 M, average age = 26.6 years, st. dev. = 4.79 years). All of the participants were right-handed, native English speakers with no known neurological disorders. Written informed consent was obtained from all participants in compliance with Institutional Review Board guidelines of the University of Florida and the North Florida/South Georgia Malcom Randall Veteran’s Affairs Medical Center.
2.2. Image acquisition and processing
All scans were collected on a Philips Achieva 3T scanner (Amsterdam, Netherlands) using a 32-channel SENSE head coil. Structural T1-weighted scans were collected with 130–1.0 mm sagittal slices, FOV = 240 mm (AP)—180 mm (FH), matrix = 256 × 192, TR = 9.90 ms, TE = 4.60 ms, FA = 8, voxel size = 1.0 mm × 0.94 mm × 0.94 mm. Diffusion-weighted images were acquired using single shot spin-echo echo planar imaging (EPI) with 60 × 2.0 mm axial slices (no gap), FOV = 224 mm (AP) × 224 mm (RL), matrix = 112 × 112, TR = 9509 ms, TE = 55 ms, FA = 90, voxel size = 2.0 × 2.0 × 2.0 mm, and time of acquisition = 5 min 42 s. The diffusion weighting gradients were isotropically distributed over a sphere using a 64-direction acquisition scheme with b = 1000 s/mm2. Six low b-value (b = 100 s/mm2) volumes were also collected. Two volumes with no diffusion weighting (b = 0) were also acquired using these parameters.
MR data were processed with in-house software written in Interactive Data Language (IDL; Exelis Visual Information Systems, Boulder, CO) and FMRIB Software Library (www.fmrib.ox.ac.uk/fsl). The data were first corrected for motion and eddy current distortions using FSL Diffusion Toolbox (FDT, version 2.0). The image intensity attenuation for each voxel was fitted as a linear decay to a rank-2 tensor dependent on the diffusion weightings, then the average diffusivity (AD) and fractional anisotropy (FA) values were calculated from the resulting tensor at each voxel (Basser & Jones, 2002). To infer fiber tract streamlines, the displacement probability of water self-diffusion in each voxel is estimated using the Mixture of Wischarts method distributions (Jian & Vemuri, 2007a, 2007b) for an average diffusion displacement of 6 lm then the maximum displacement probability within tissue in each voxel is identified. This method allows the tracking of crossing and branching fibers, and makes the current algorithm superior to traditional streamline tracking techniques based on the rank-2 tensor models (Basser, Mattiello, & LeBihan, 1994; Jian, Vemuri, Ozarslan, Carney, & Mareci, 2007). Tractography was performed by seeding each 2 × 2 × 2 mm voxel in the brain with a sub-voxel grid with 64 evenly-spaced seed points (Fig. 1). The purpose of subdividing acquisition voxels in this manner was done to be able to resolve multiple fiber orientations (i.e., crossing or kissing fibers) on sub-voxel level in order to better model the underlying neural anatomy. From each seed point, one streamline is launched bidirectionally for each estimated displacement probability maximum contained in that voxel using the FACT algorithm (Mori, Crain, Chacko, & van Zijl, 1999). Each streamline front is propagated by stepping 0.25 voxel width in the direction of the maximum that is most inline with the streamline’s present direction of travel. In order to prevent streamlines from looping back, angular deviation of the track is limited to 65 degrees. If the estimated track exceeds this threshold, the streamline is stopped. In other words, all possible pathways from each seed point are established to their termination, yielding a large image (~.25 TB) which can be further interrogated by defining masks (i.e., regions of interest), allowing pathways to be established between regions of interest.
Fig. 1.
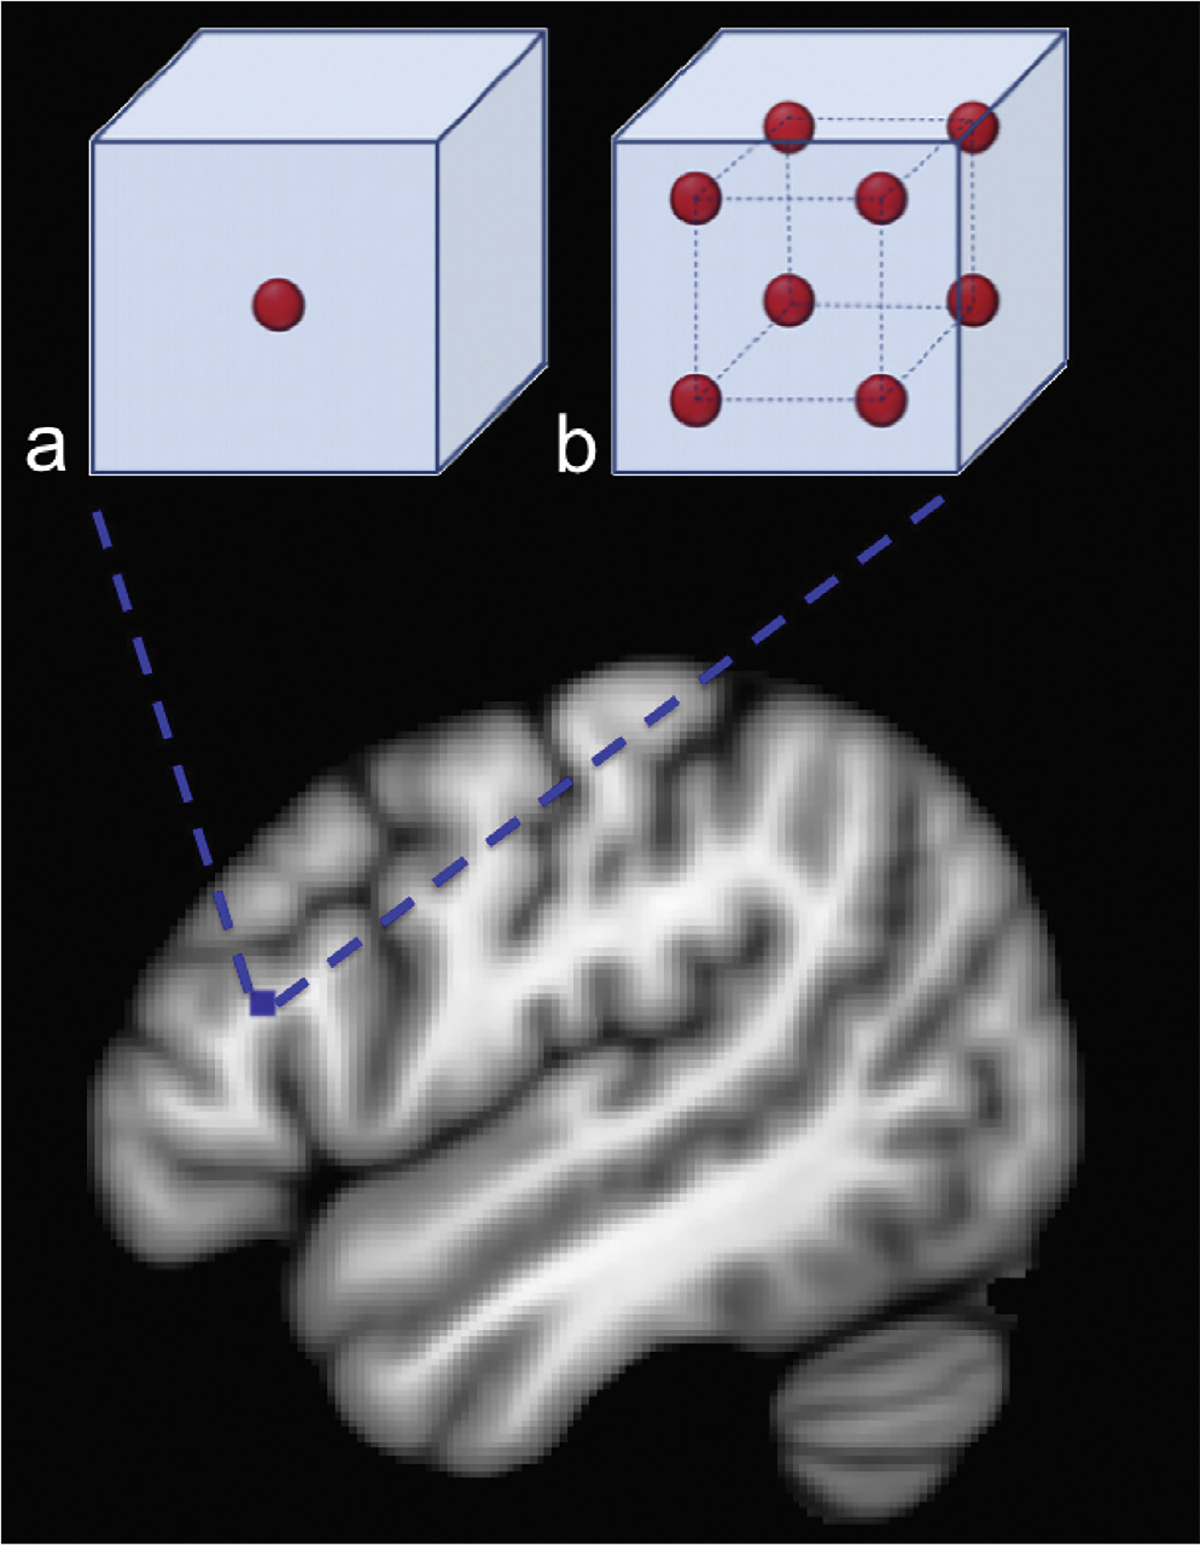
Schematic rendering of the sub-voxel seeding grid. A single voxel in Broca’s area is enlarged to depict a simplified version of the sub-voxel seeding grid. (a) Seed density of 13 seed per voxel; (b) seed density of 23 seeds per voxel. The present study used 43 seeds per voxel. A reduced seed density is shown here for ease of visualization.
2.3. Regions of interest
2.3.1. Cortical regions of interest
We identified two cortical regions corresponding to pars opercularis and pars triangularis. Cortical masks of pars triangularis and pars opercularis were drawn on the T1-weighted images and registered to diffusion space using FSL FLIRT module (Jenkinson & Smith, 2001). The lateral-most sagittal slice of the frontal cortex of the skull-stripped T1-weighted scan was used as the lateral border of the cortical masks. The medial border was defined by the first sagittal slice traversing the insular cortex. The dorsal border of the masks was defined by the inferior frontal sulcus while by the ventral border was be the Sylvian fissure. The anterior border of the pars triangularis mask was defined by a coronal plane through the anterior margin of the anterior horizontal ramus of the Sylvian fissure and its posterior border was defined by the anterior ascending ramus of the Sylvian fissure. The anterior border of the pars opercularis mask was drawn by following the posterior border of the pars triangularis mask leaving one voxel distance between the two masks to ensure that they are non-overlapping. The posterior border of pars opercularis mask was defined by the inferior precentral sulcus. Fig. 2 depicts our cortical regions of interest in standard template space of Montreal Neurological Institute (MNI152).
Fig. 2.
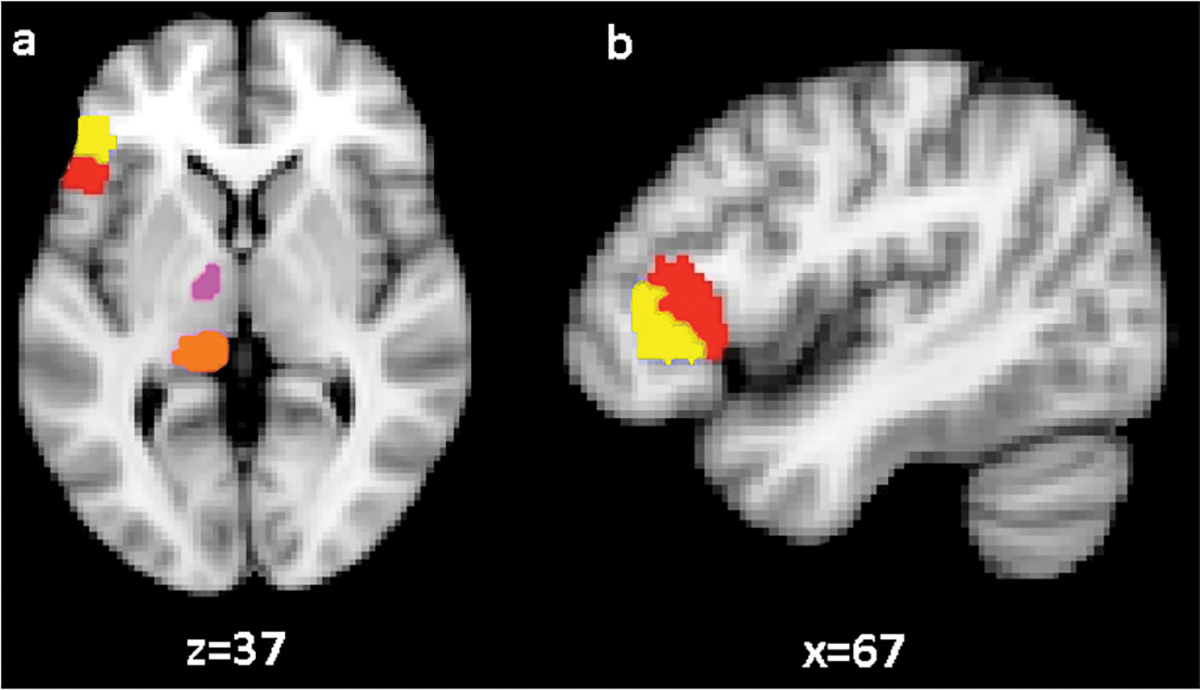
Cortical and subcortical regions of interest depicted in MNI152 standard template space. (a) Horizontal view (z = 37) depicting pars opercularis (red), pars triangularis (yellow), ventral anterior nucleus (pink), and pulvinar (orange). (b) Sagittal view shows (x = 67) pars opercularis (red) and pars triangularis (yellow) masks.
2.3.2. Thalamic regions of interest
To create masks of the ventral anterior nucleus and pulvinar we used a previously developed three-dimensional deformable brain atlas for direct brain stimulation (DBS) targeting (Sudhyadhom, Okun, Foote, Rahman, & Bova, 2012). In addition, we used the Schaltenbrand and Wahren (1977) to adjust the borders of masks generated by the atlas. Fig. 2 depicts our subcortical regions of interest in standard template space.
2.3.3. Exclusion masks
For each dataset we created an exclusion mask to ensure that we do not include extraneous pathways into our calculations. The exclusion mask consisted of four planes placed as follows. First we used a mid-sagittal exclusion plane to ensure that only pathways within the left hemisphere are being traced. Next a coronal plane was placed two slices posteriorly to the pulvinar mask to exclude any pathways coursing through to posterior perisylvian, posterior parietal, and occipital lobes. The third plane was an axial plane placed two slices below the pulvinar mask to exclude pathways within inferior temporal lobe and brainstem. The last exclusion plane was an axial plane placed two slices above the corpus callosum.
2.4. Tractography analysis
In order to trace pathways between cortical and subcortical regions of interest, we intersected whole brain tractography results in each participant’s native acquisition space with their individually created pars opercularis and pars triangularis masks to infer fiber bundles passing through each of these regions. Next, we intersected the resulting tracts with ventral anterior nucleus and pulvinar masks to compute pathways connecting pars opercularis and pars triangularis with each subcortical region. When tracing pathways between pars opercularis and pars triangularis and ventral anterior nucleus, we applied two exclusion masks in order to ensure that our tracing approach infers only the pathways of interest. The first exclusion mask consisted of four exclusion planes as described above. In addition, we also used the pulvinar mask for exclusion to ensure that pathways between Broca’s area terminate in the ventral anterior nucleus rather than passing through it on their way to pulvinar. An important consideration of the application of these exclusion masks is that they eliminate all potential pathways connecting Broca’s area and pulvinar and focus solely on pathways between Broca’s area and ventral anterior nucleus. It is true that pathways connecting Broca’s area and pulvinar may give off collaterals to the ventral anterior nucleus as they pass through this nucleus on the way to the pulvinar. These pathways, however, would be represented by tractography results delineating pathways between Broca’s area and both ventral anterior nucleus and pulvinar (also referred to as fibers en passage below).
Pathways between pars opercularis and pars triangularis and the pulvinar were traced in a similar fashion. We intersected pathways from pars opercularis and pars triangularis with the pulvinar mask and applied exclusion masks. The first mask was the four-plane exclusion mask and the second exclusion mask was the ventral anterior nucleus mask. The ventral anterior nucleus mask was used as an exclusion to ensure that Broca’s area pathways connected directly to pulvinar and did not enter via ventral anterior nucleus.
Finally we traced the en passage pathways between Broca’s area, ventral anterior nucleus, and the pulvinar. These fibers are believed to be penetrating the ventral anterior nucleus on their way to the pulvinar. In order to trace these pathways, we first intersected whole brain tractography results with the ventral anterior nucleus mask. Next, the resulting pathways were intersected with pars opercularis (or pars triangularis) and pulvinar masks. This was done to ensure that the pathways course through all three regions of interest (pars opercularis or pars triangularis), ventral anterior nucleus and the pulvinar). In addition, a four-plane exclusion mask described above was applied to exclude extraneous pathways.
2.5. Quantitative tractography measures
After calculating the streamline tracts along the pathways, we quantified the strength of fiber connectivity for the resulting tracts using measures of tract volume. Tract volume represents the number of voxels occupied by each of the streamline tracts multiplied by the volume of each voxel (measured in mm3).
We used IBM SPSS Statistics v 20.0 to perform paired t-test comparisons of tract volumes to determine whether there are statistically significant differences in this descriptive measure between the pathways connecting Broca’s area, ventral anterior nucleus, and pulvinar.
To correct for multiple comparisons we applied the family-wise error (FWE) rate correction with p-value ≥ (0.05). This p-value was selected based on the fact that we computed a single measure (tract volume) for each pathway connecting pars opercularis/triangularis with thalamic nuclei. We included an asterisk next to the p-values that passed the multiple comparison correction in Section 3.
3. Results
3.1. Broca’s area—ventral anterior nucleus pathways
In order to infer pathways connecting Broca’s area and ventral anterior nucleus of the thalamus, we intersected pathways originating in pars opercularis and pars triangularis with the ventral anterior nucleus, and applied the pulvinar mask and the four-plane mask as exclusion masks. Table 1 represents the resulting tract volumes of these fiber bundles for each of our ten participants. The average tract volume for pathways connecting pars opercularis and ventral anterior nucleus is 2879.5 mm3 (st. dev. = 2078 mm3). The average tract volume for pathways connecting pars triangularis and ventral anterior nucleus is 3606.5 mm3 (st. dev. = 2353.13 mm3). We note that for most of our participants pathways between pars opercularis and ventral anterior nucleus are smaller in volume than those between pars triangularis and ventral anterior nucleus (with the exception of participants 1, 4, 6), although this difference was not statistically significant (tstat = −1.30, df = 9, p = 0.23). We believe that smaller tract volumes may reflect additional complexity of tracing pathways originating in pars opercularis. Pathways originating in pars opercularis must travel a more circuitous route around the circular sulcus to reach the thalamus. This added complexity in pathway trajectory requires larger turning angles in order to infer the underlying fiber architecture. Pathways with large turning angles are typically harder to trace using diffusion tractography due to the loop check restrictions used to ensure that pathways do not loop back onto themselves. Thus, smaller tract volumes for pathways connecting pars opercularis and ventral anterior nucleus may represent underlying structural complexity and resulting tracking difficulty.
Table 1.
Tract volumes for pathways connecting Broca’s area and ventral anterior nucleus of the thalamus.
| Broca’s area ventral anterior nucleus of the thalamus pathways (tract volumes) | ||
|---|---|---|
|
| ||
| Participant | Pars opercularis - ventral anterior nucleus tract volume (mm3) | Pars triangularis - ventral anterior nucleus tract volume (mm3) |
|
| ||
| 1 | 6119 | 3900 |
| 2 | 1973 | 3925 |
| 3 | 1532 | 2041 |
| 4 | 910 | 4598 |
| 5 | 2153 | 721 |
| 6 | 3164 | 2923 |
| 7 | 4810 | 5924 |
| 8 | 1639 | 3255 |
| 9 | 6050 | 8307 |
| 10 | 445 | 471 |
| Average | 2879.5 | 3606.5 |
| St. dev. | 2078 | 2353.13 |
Fig. 3 depicts projections between pars opercularis (a) and pars triangularis (b) and ventral anterior nucleus in a representative dataset (participant 1). Supplementary Fig. 1 depicts these pathways in all ten participants. Projections from both pars triangularis and pars opercularis course medially, passing over and around the anterior superior portion of circular sulcus, and after passing by the insula, follow a nearly ninety-degree turn to then travel posteriorly within the anterior limb of the internal capsule toward the thalamus. Projections from pars triangularis and pars opercularis enter ventral anterior nucleus in all participants.
Fig. 3.
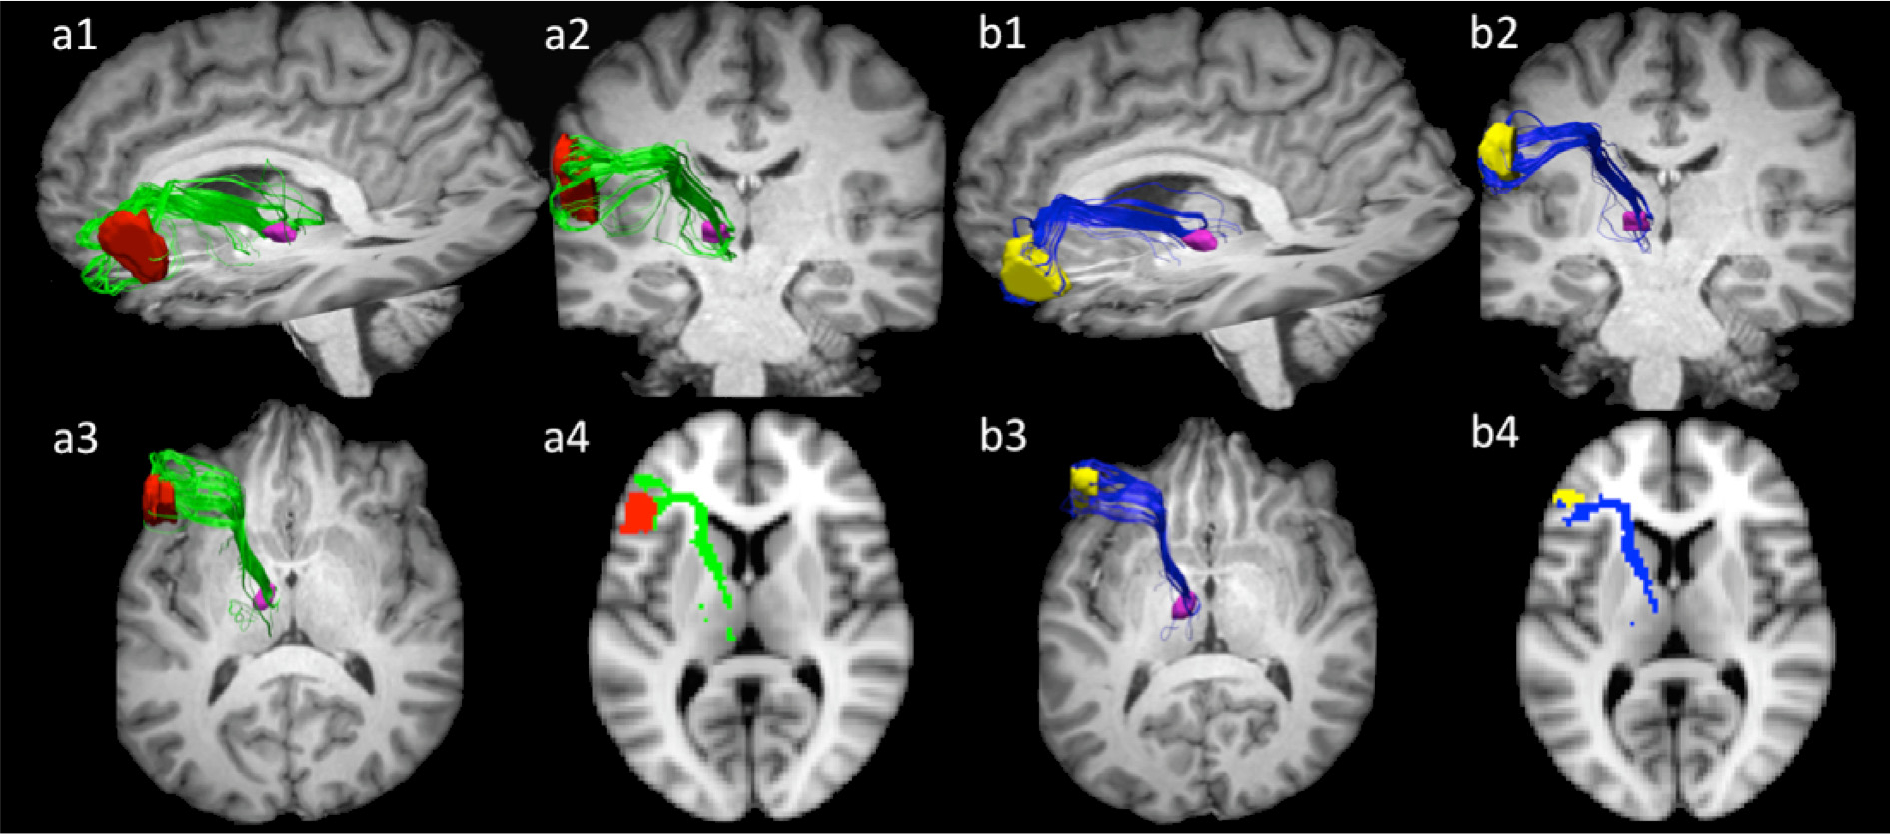
Projections connecting pars opercularis (a) and pars triangularis, (b) with ventral anterior nucleus in participant 1. Sub-figures 1–3 represent sagittal, coronal, and axial views of the 3-dimensional view tracts in their respective orientations. Sub-figure 4 represents a 2-dimentional rendering of the pathways registered to the MNI152 standard template space z = 38. Projections from both pars triangularis and pars opercularis course medially, passing over and around the anterior superior portion of circular sulcus, and after passing by the insula, follow a nearly ninety-degree turn to then travel posteriorly within the anterior limb of the internal capsule toward the ventral anterior nucleus of the thalamus. Pars opercularis mask is depicted in red, pars triangularis in yellow, and ventral anterior nucleus is pink. Pars opercularis—ventral anterior nucleus are depicted in green, while pars triangularis—ventral anterior nucleus pathways are rendered in blue.
Results from most of our participants show that the pathways project to the anterior medial portion of the ventral anterior nucleus (participants 1, 2, 3, 4, 7, 8, 9, 10). A few participants deviate from this trend. In particular, results for participant 5 show that pathways connecting Broca’s area and ventral anterior nucleus enter the nucleus at the anterior lateral portion (Supplementary Fig. 1(5a and 5b)).
Another pattern of connectivity can be seen in Supplementary Fig. 1(2b) depicting pathways connecting pars triangularis and ventral anterior nucleus. Most of the pathways enter the anterior medial portion of the nucleus, while a second smaller portion of the pathway descends down into the nucleus at a more lateral and superior location. Lateral superior portion of the nucleus is also the target of projections for participant 6. In particular, we observe that in Supplementary Fig. 1(6a and 6b) the pathways from pars opercularis project to the superior lateral extent of the nucleus, similar to that in Supplementary Fig. 1(2b). In addition, we note that pathways connecting pars opercularis (tract volume = 445 mm3) and pars triangularis (tract volume = 471 mm3) with ventral anterior nucleus for participant 10 are much smaller than those of the other nine participants. After re-examining this dataset for artifacts that could explain poor tracking results we did not find any peculiarities in the quality of the data. One potential explanation of the tracking results for this participant could be differences in individual anatomy. In particular, the turning angles that the pathways travel may be generally too large to fit our loop check restrictions for this participant and as a result only a few streams within the pathways can be traced.
A closer examination of pathways connecting pars opercularis/triangularis and ventral anterior nucleus also reveals that in some participants a small portion these cortico-thalamic and/or thalamocortical pathways travel around ventral anterior nucleus and enter more posterior extent of this region of interest. In particular, for participants 1, 3, 5, and 7 we note that pathways connecting pars opercularis and ventral anterior nucleus exhibit this trend. A small portion of the pathways travel medial and posterior to the nucleus and enter the posterior border ventral anterior thalamus. Similarly, for participants 1, 2, 3, 4, 5, 7, 8, 9 this trend is also present for pathways connecting pars triangularis and ventral anterior nucleus.
3.2. Broca’s area—pulvinar nucleus pathways
To infer pathways connecting Broca’s area and pulvinar we intersected pathways originating in pars opercularis and pars triangularis with the pulvinar mask and applied both ventral anterior nucleus mask and the four-plane mask as exclusions. Table 2 represents tract volumes of the resulting fiber bundles. The average tract volume for pathways connecting pars opercularis and pulvinar is 3725.5 mm3 (st. dev. = 2620.33 mm3). The average tract volume for fibers connecting pars triangularis and pulvinar is 4964.10 mm3 (st. dev. = 2254.78 mm3). Pathways connecting pars opercularis and pulvinar are statistically significantly smaller in volume than those connecting pars triangularis and pulvinar (though participants 1, 4, 6 are exceptions to this significant difference) (paired two-tailed t-test: tstat = −2.44, df = 9, p = 0.04*). In addition, we note that tract volumes of the pathways connecting Broca’s area and pulvinar are on average larger than Broca’s area ventral anterior nucleus pathways (pars opercularis—pulvinar tract volume = 3725.5 mm3, pars triangularis—pulvinar tract volume = 4964.10 mm3, pars opercularis—ventral anterior nucleus tract volume = 2879. 5 mm3, pars triangularis—ventral anterior nucleus tract volume = 3606.5 mm3). This trend however, did not reach statistical significance when we applied a two-tailed paired t-test to tract volume distributions (pars opercularis tstat = −1.28, df = 9, p = 0.23; pars triangularis tstat = −2.05, df = 9, p = 0.07).
Table 2.
Tract volumes for pathways connecting Broca’s area and pulvinar.
| Broca’s area pulvinar pathways (tract volumes) | ||
|---|---|---|
|
| ||
| Participant | Pars opercularis - pulvinar tract volume (mm3) | Pars triangularis - pulvinar tract volume (mm3) |
|
| ||
| 1 | 9826 | 8319 |
| 2 | 2181 | 5193 |
| 3 | 2166 | 3316 |
| 4 | 5877 | 7908 |
| 5 | 3075 | 1740 |
| 6 | 1748 | 2354 |
| 7 | 4596 | 6533 |
| 8 | 2741 | 5637 |
| 9 | 4280 | 5349 |
| 10 | 765 | 3292 |
| Average | 3725.5 | 4964.1 |
| St. dev. | 2620.33 | 2254.78 |
Fig. 4 depicts projections between pars opercularis (a) and pars triangularis (b) and the pulvinar in a representative dataset (participant 1). Supplementary Fig. 2 depicts these pathways in all ten participants. Pathways connecting Broca’s area and the pulvinar have similar trajectories to pathways connecting Broca’s area with ventral anterior nucleus of the thalamus. In particular, pathways originating in pars opercularis or pars triangularis travel medially around the circular sulcus and by the insular cortex. From there the pathways bend at a nearly 90 degree angle and course posteriorly toward the pulvinar through the anterior limb of the internal capsule. Upon reaching the thalamus, these fibers travel through the internal medullary lamina to reach the pulvinar. We note that for all of our participants pathways from Broca’s area terminate in the anterior superior portion of the pulvinar similar in location to the area that has been previously implicated to be involved in object naming (Crosson et al., 1986; Johnson & Ojemann, 2000).
Fig. 4.
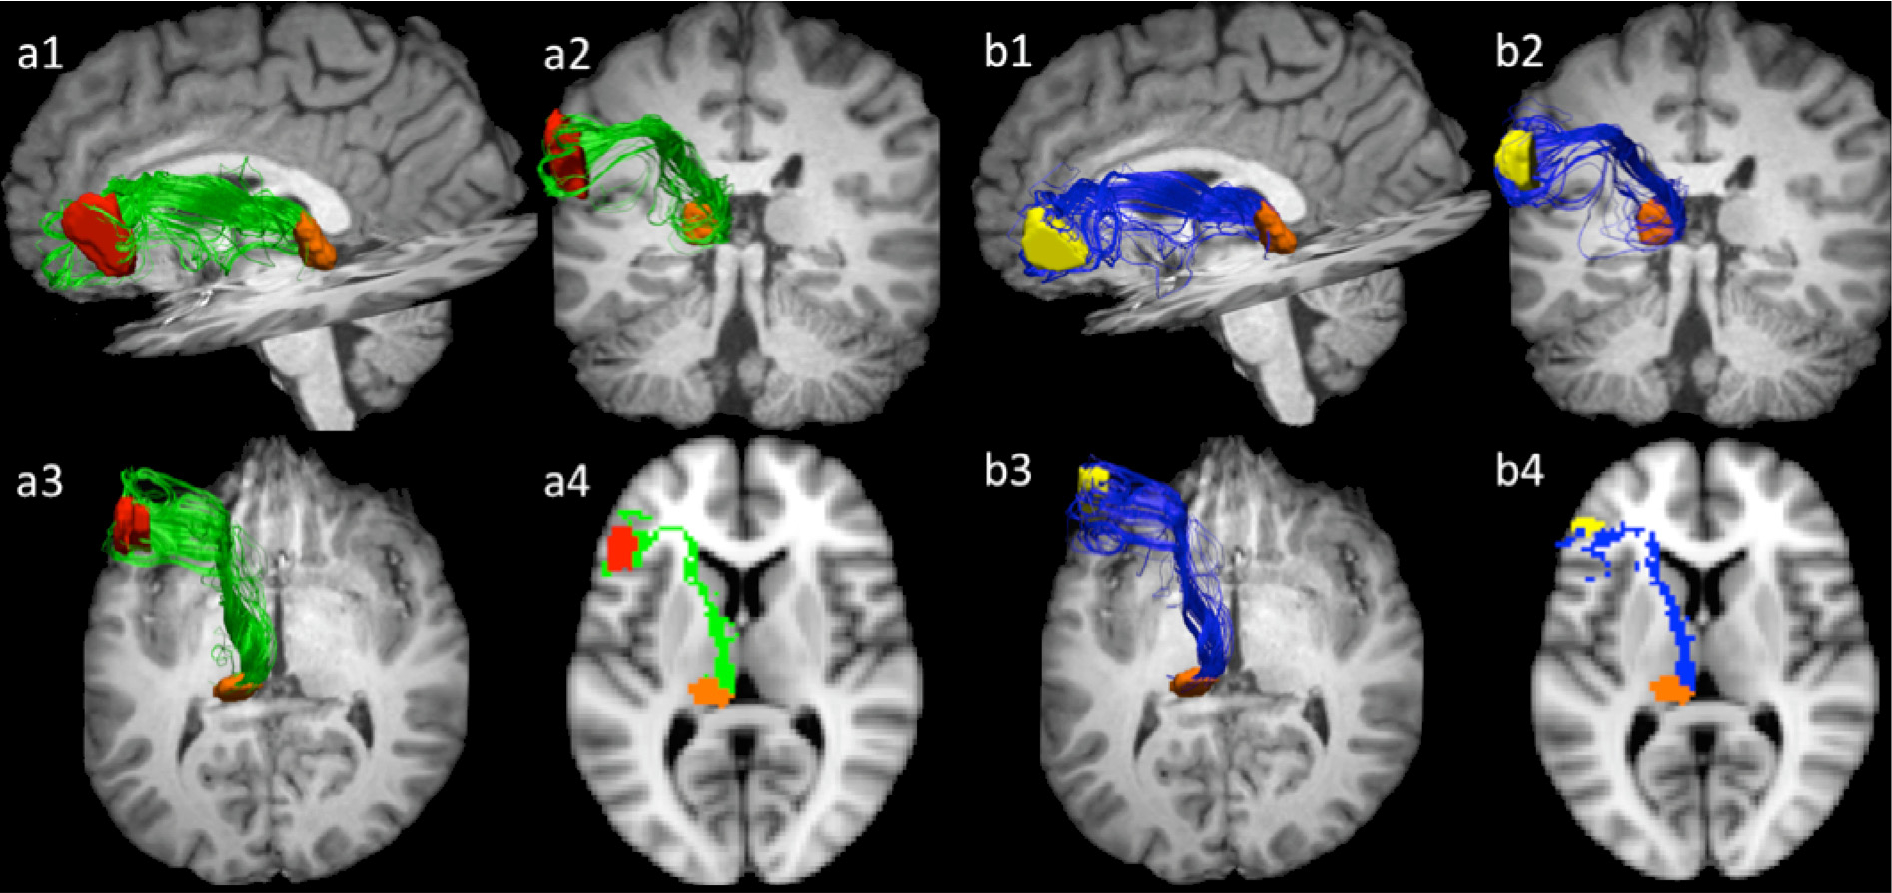
Projections connecting pars opercularis (a) and pars triangularis, (b) with pulvinar in participant 1. As in Fig. 3, sub-figures 1–3 represent 3-dimensional renderings of the tracts, viewed from the standard sagittal, coronal, and axial orientations. Sub-figure 4 represents a 2-dimentional rendering of the pathways registered to the MNI152 standard template space z = 38. Pathways originating in pars opercularis or pars triangularis travel medially around the circular sulcus and by the insular cortex. From there the pathways bend at a nearly 90 degree angle and course posteriorly toward the pulvinar through the anterior limb of the internal capsule. Upon reaching the thalamus, these fibers travel through the internal medullary lamina to reach the pulvinar. Pars opercularis mask is depicted in red, pars triangularis in yellow, and pulvinar is orange. Pars opercularis—pulvinar are depicted in green, while pars triangularis—pulvinar pathways are rendered in blue.
3.3. Broca’s area—ventral anterior nucleus—pulvinar nucleus pathways
In order to trace the en passage pathways connecting Broca’s area and the pulvinar and passing through the ventral anterior nucleus, we first traced the pathways originating in ventral anterior nucleus and then intersected resulting tracts with Broca’s area (pars opercularis and pars triangularis separately) and pulvinar masks. Resulting tracts contained inferred fiber bundles connecting all three regions of interest. The four-plane exclusion mask was also applied to exclude any extraneous pathways. Table 3 represents tract volumes for these pathways for each of our participants.
Table 3.
Tract volumes for pathways connecting Broca’s area with ventral anterior nucleus and pulvinar.
| Broca’s area - ventral anterior nucleus - pulvinar pathways | ||
|---|---|---|
|
| ||
| Participant | Pars opercularis -ventral anterior nucleus - pulvinar tract volume (mm3) | Pars triangularis - ventral anterior nucleus -pulvinar tract volume (mm3) |
|
| ||
| 1 | 3599 | 2564 |
| 2 | 268 | 2425 |
| 3 | 763 | 1239 |
| 4 | 178 | 3027 |
| 5 | 1261 | 675 |
| 6 | 0 | 845 |
| 7 | 1978 | 3325 |
| 8 | 941 | 1859 |
| 9 | 189 | 2053 |
| 10 | 539 | 1915 |
| Average | 971.6 | 1992.7 |
| St. dev. | 1101.15 | 882.38 |
The average tract volume for pathways connecting pars opercularis with ventral anterior nucleus and the pulvinar is 971.60 mm3 (st. dev. = 1101.15 mm3). The average tract volume for tracts connecting pars triangularis with ventral anterior nucleus and pulvinar is 1992.70 mm3 (st. dev. = 882.38 mm3). In addition, pathways connecting pars opercularis with ventral anterior nucleus and the pulvinar are significantly smaller in volume than those connecting pars triangularis with these subcortical nuclei, though participants 1 and 6 are exceptions to this significant difference) (paired two-tailed t-test: tstat = −2.72, df = 9, p = 0.02*).
Pathways connecting Broca’s area with the two thalamic nuclei are significantly smaller in volume than pathways between Broca’s area with either the ventral anterior nucleus or the pulvinar exclusively. Specifically, the distribution of tract volumes of the pars opercularis en passage pathways has significantly smaller volumes than the tract volume distributions for pathways connecting pars opercularis and ventral anterior nucleus and for pathways connecting pars opercularis and the pulvinar (paired two-tailed t-test: tstat = 3.44, df = 9, p = 0.0074*, and tstat = 4.46, df = 9, p = 0.0016*, respectively). Tract volumes of the pars triangularis en passage pathways are significantly smaller than tract volumes of connections between pars triangularis and ventral anterior nucleus and pars triangularis and the pulvinar (paired two-tailed t-test: tstat = 2.58, df = 9, p = 0.03*; and tstat = 6.10, df = 9, p = 0.0002*, respectively).
Fig. 5 depicts projections between pars opercularis (a) and pars triangularis (b), ventral anterior nucleus, and the pulvinar in a representative dataset (participant 1). Supplementary Fig. 3 depicts these pathways in all ten participants. Pathways connecting pars opercularis/pars triangularis with ventral anterior nucleus and the pulvinar course medially and then posterior-inferiorly through the anterior limb of the capsule to first reach the ventral anterior nucleus. From there pathways track posteriorly through the internal medullary lamina of the thalamus toward the anterior superior portion of the pulvinar. In addition, we note that in the majority of our participants (particularly, participant 1, 3, 5, 6, 7, 9) we observe a second branch of the pathway tracking between the pulvinar and the cortex without passing through the ventral anterior nucleus. One possible explanation for the presence of two branches is that the first branch (between pars opercularis/triangularis, ventral anterior nucleus, and the pulvinar) represents the cortico-thalamic portion of this Broca’s area thalamocortical network, while the second branch (connecting the pulvinar with pars opercularis/triangularis) represents thalamo-cortical projections. Unfortunately, there is no method to deduce directionality of white matter bundles using diffusion tractography and further studies are necessary to explore this hypothesis.
Fig. 5.
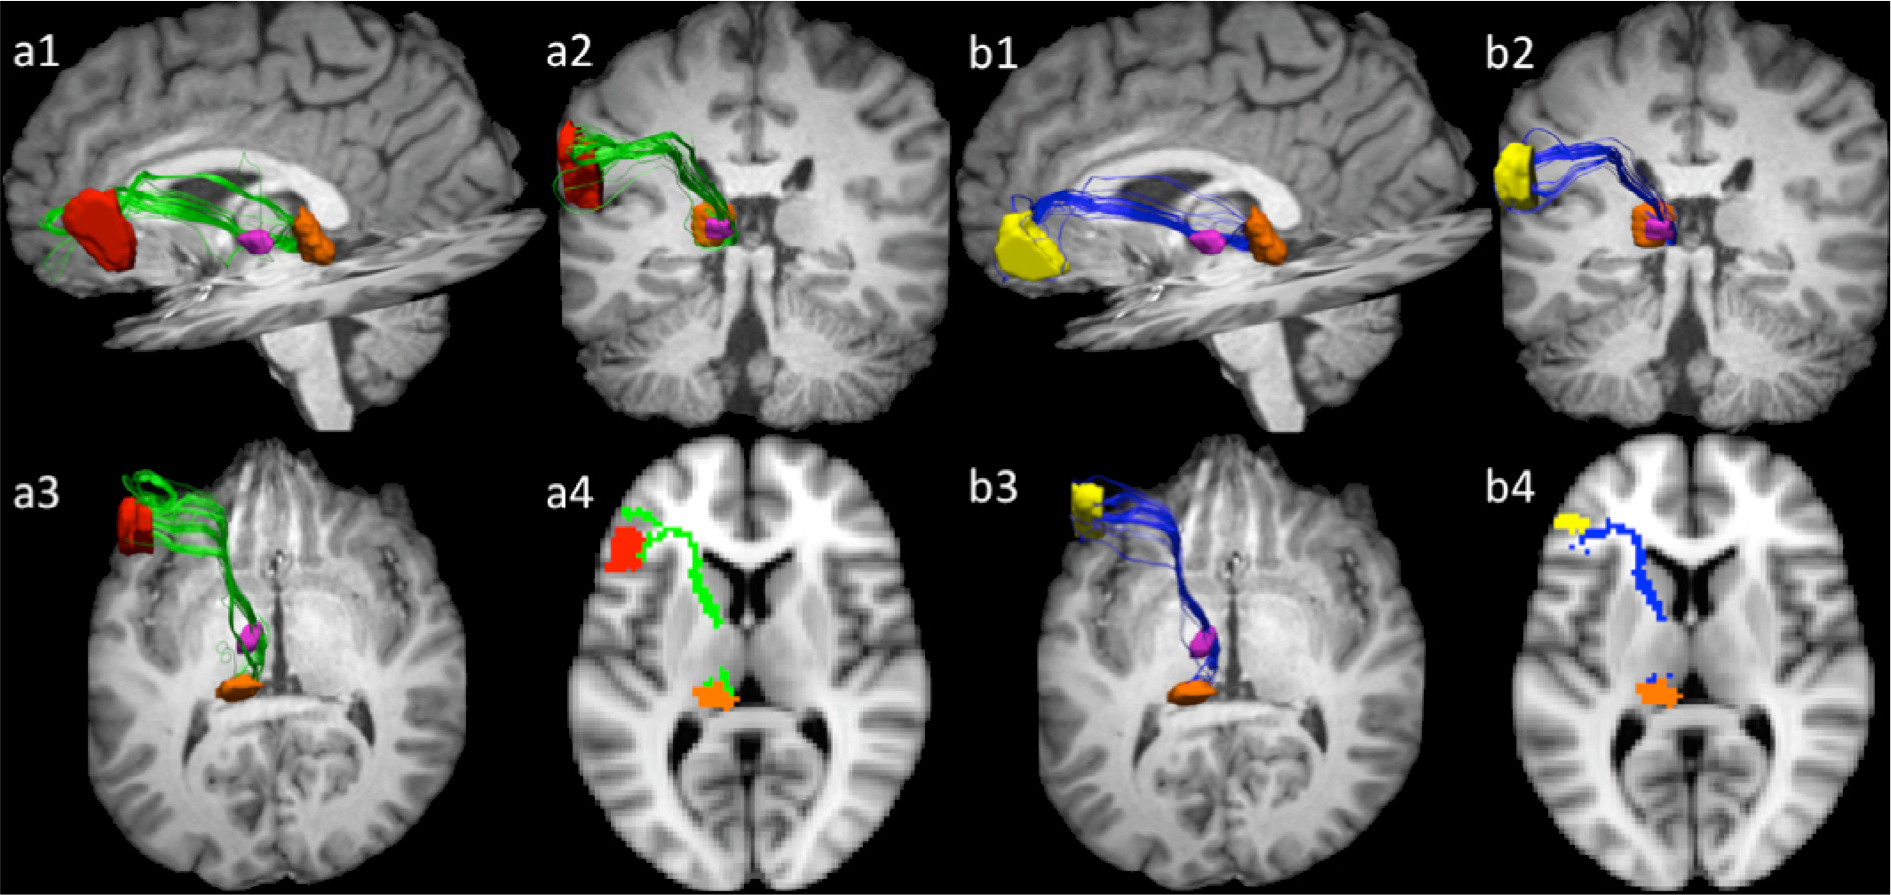
Projections among opercularis (a), pars triangularis (b), ventral anterior nucleus, and pulvinar in participant 1. Sub-figures 1–3 are 3-dimensional views from standard orientations (as in Fig. 3). Sub-figure 4 represents a 2-dimentional rendering of the pathways registered to the MNI152 standard template space z = 38. Pathways course medially and then posterior-inferiorly through the anterior limb of the capsule to first reach the ventral anterior nucleus. From there pathways track posteriorly through the thalamus, within the internal medullary lamina, toward the anterior superior portion of the pulvinar. Pars opercularis mask is depicted in red, pars triangularis in yellow, ventral anterior nucleus is pink, and pulvinar is orange. Pars opercularis—ventral anterior nucleus—pulvinar are depicted in green, while pars triangularis—ventral anterior nucleus—pulvinar pathways are rendered in blue.
4. Discussion
The present study aimed to determine whether direct connectivity between Broca’s area and the ventral anterior nucleus and pulvinar can be inferred using diffusion-weighted tractography. Our tracking method successfully traced pathways between Broca’s area and specific thalamic nuclei. In particular, the present study identifies identified six distinct pathways connecting Broca’s area with the thalamus: (1 and 2) pars opercularis/triangularis—ventral anterior nucleus pathway, (3 and 4) pars opercularis/triangularis—pulvinar pathway, and (5 and 6) pars opercularis/triangularis—ventral anterior nucleus—pulvinar pathway. Invasive animal tracer studies previously established the presence of some of these pathways in animal models. Specifically, Romanski and colleagues demonstrated projections between the macaque BA 45 and 46 and central/lateral medial pulvinar complex (Romanski et al., 1997). Akert and Hartmann-von Monakow demonstrated dense reciprocal connections between macaque areas 8 and 45, ventral anterior nucleus, and medial pulvinar (Akert & Hartmann-von Monakow, 1979), while Goldman-Rakic and Porrino described pathways between the several macaque prefrontal cortices, medial dorsal nucleus, ventral anterior nucleus, and the pulvinar (Goldman-Rakic & Porrino, 1985). In addition, our prior work demonstrated direct connectivity between the human ventral anterior nucleus and pars opercularis/triangularis using diffusion-weighted tractography (Ford et al., 2013). The present study identified additional pathways connecting Broca’s area and the pulvinar, as well as the en passage pathways connecting Broca’s area with both ventral anterior nucleus and the pulvinar. Thus, our results extend the findings from the macaque to Broca’s area – thalamic connectivity in the human. Moreover, these findings suggest a structural mechanism by which Broca’s area and the thalamus may interact, though the exact functions supported by each of the pathways presented in this paper and the roles of these cortical and subcortical regions remain unclear. In the discussion that follows, we bring previous literature on the thalamus and language to bear on this question.
Our selection of the left ventral anterior nucleus and the pulvinar for Broca’s area tractography was based on the literature indicating their involvement in language. Specifically, electrical stimulation (Schaltenbrand, 1965, 1975) and lesion studies (Graff-Radford et al., 1985; Nadeau & Crosson, 1997; Raymer et al., 1997) indicate that the ventral anterior thalamus plays a role in language. Similarly, electrical stimulation (Johnson & Ojemann, 2000; Ojemann, 1976), lesion (Alexander & Loverme, 1980; Cappa & Vignolo, 1979; Crosson et al., 1986, 1997; Raymer et al., 1997), and functional MRI (Kraut et al., 2002) studies all indicate a role for the pulvinar in language. The most common element of language impairment with either ventral anterior or pulvinar lesion is word-finding difficulty with semantic paraphasia. Indeed, semantic substitutions frequently are so prevalent that output deteriorates into semantic jargon. Though some difficulty with initiation may occur acutely, language output generally resolves into a fluent state (Crosson, 1992).
Only a few studies have shed any light on the underlying mechanism of causing thalamic aphasia. Raymer et al. (1997) showed that semantic processing and processing of phonological word forms are intact in residual word-finding difficulties from thalamic aphasia. These authors found that subjects had difficulty selecting the appropriate phonological word form from the neighborhood of semantically (and sometimes visually) related items. In other words, patients had difficulty selecting the correct lexical form based on intact semantic information. In a functional MRI study, Kraut et al. (2002) showed that the pulvinar was involved in binding words representing related features into their semantic construct. But, how is the structural anatomy demonstrated by our current findings involved in these processes?
Crosson (2013) recently suggested that thalamic nuclei are involved in no less than four functions related to language processes. One is transfer of information from one cortical area to another area of cortex. Recent evidence (Llano & Sherman, 2008; Sherman & Guillery, 2006; Theyel, Llano, & Sherman, 2010) indicates that cortico–thalamo–cortical relays are capable of such information transfer. Corticothalamic fibers originating from layer 5 terminate on relay neurons in thalamic nuclei that project to a related, but distinct cortical area. The corticothalamic synapses from these layer 5 neurons are similar to unique synapses created by optic fibers on lateral geniculate relay neurons that then transfer visual information to primary visual cortex (Sherman & Guillery, 2006). One conundrum about these cortico–thalamo–cortical relays is their exact role in information processing. Specifically, related cortical areas generally are also reciprocally connected by cortico-cortical pathways, and it is not clear what unique contribution that the thalamic relay makes apart from the cortico-cortical connection.
In the context of the current evidence, fibers to/from pars triangularis and pars opercularis to the ventral anterior nucleus and the pulvinar show very similar trajectories, suggesting the possibility of a thalamic relay between these two segments of Broca’s area. Findings of Devlin et al. (2003) have indicated a gradient of semantic processing favoring anterior Broca’s area (i.e., pars triangularis) and a phonological processing gradient favoring the posterior portion of Broca’s area (i.e., pars opercularis). As noted above, Raymer et al. (1997) data indicated that patients with thalamic lesions have difficulty wedding a semantic construct with its correct phonological (i.e., lexical) representation during word production. We hypothesize that cortico–thalamo–cortical relays between pars triangularis and pars opercularis play a role in wedding semantic constructs with their corresponding lexical representations. Probably, it is a safe assumption that pars triangularis and pars opercularis are connected via cortico-cortical pathways.1 Nonetheless, the symptoms of thalamic aphasia indicate that the thalamus plays a unique role in integrating semantic and phonological representations during word production. The exact role of cortico–thalamo–cortical relays in integrating these related kinds of information awaits further research.
One intriguing question for such research is what distinct roles the ventral anterior nucleus and pulvinar play in language. At least three possibilities can be presented. (1) Our data show the proximity of the Broca’s area-pulvinar pathway to the ventral anterior nucleus. Indeed, some of these fibers seem to pass through the ventral anterior nucleus. Hence, it seems likely that fibers to/from the pulvinar may be partially, or even substantially interrupted by lesions centered in the ventral anterior nucleus. In this scenario interrupting this pathway to the pulvinar and lesion to the pulvinar itself would have similar effects. (2) The ventral anterior nucleus and pulvinar may play closely related, but partially distinct roles in lexical–semantic processing. Raymer et al. (1997) data indicate the ventral anterior nucleus may be involved in binding a semantic construct to its lexical-phonological representation, while Kraut et al. (2002) data indicate that the pulvinar may be involved in binding semantic features into a semantic construct. (3) The functions of the pulvinar and the ventral anterior nucleus may be redundant, which would account for relatively good recovery in most left thalamic lesion cases.
The present study has limitations. In particular, we used anatomical landmarks to identify sub-regions within Broca’s area and thalamic nuclei and used these regions of interest to infer cortico–thalamo–cortical connectivity. Cortical gross anatomy based on the sulcal and gyral patterns often does not maintain a one-to-one relationship with the underlying cytoarchitecture and functional activations (Amunts et al., 1999). In addition, presently available diffusion tractography algorithms do not allow differentiation of directionality of the inferred white matter pathways. In the present study, our tracking results to do not indicate whether Broca’s area—thalamic connectivity consists of cortico-thalmic and/or thalamo-cortical projections.
Our tracking results show a considerable amount of individual variability in track volumes and edge weights. We believe that this variability may stem from a number of factors. First, the variability may be due to the individual differences in white matter organization. This hypothesis is supported by findings that individual patterns of gyral and sulcal distributions, as well as the underlying cytoarchitectonic divisions, vary considerably between individuals (Amunts et al., 1999). Our tractography approach was guided by cortical and subcortical gray matter regions of interest thus variability in size and location of these regions introduces variability in trajectories and size of the resulting white matter pathways.
Another potential explanation is that variability may be stemming from susceptibility of diffusion-weighted data to motion-related artifacts. Participants in our study were scanned without sedation and with minimal constriction of head and neck to maintain participants’ comfort. Data acquisition of excised tissue would eliminate motion related artifacts, and we are currently working on acquiring cadaver data to compare to our in-vivo tractography results.
5. Conclusion
In conclusion, our study presents Broca’s area—thalamic circuitry involving both the ventral anterior nucleus and the pulvinar. These pathways may be crucial to explaining the symptoms of thalamic aphasia and the role of the thalamus in language. Future studies employing functional neuroimaging would help to further examine functional importance of this structural network and its role in language processing. In particular, differential functions between the ventral anterior nucleus and pulvinar require further investigation. In addition, studies examining patients with thalamic lesions with chronic language deficits would shed additional light on the effects of damage to this circuitry and the related linguistic impairments (Nishio et al., 2014). The authors of the present study are currently working on developing thalamic lesion models based on previously reported thalamic lesion cases of patients with corresponding language deficits (Crosson et al., 1997; Raymer et al., 1997). These models will be used as virtual lesions that would interrupt the pathways connecting Broca’s area and the thalamus in healthy volunteers in order to examine the degree of damage that would be sustained by each of the three types of pathways presented in the current study.
Supplementary Material
Acknowledgments
This material is based upon work supported by the Department of Veterans Affairs Office of Research and Development: Rehabilitation Research & Development Service (Center of Excellence grant F2182C; Career Development Award-1D7174M to Keith McGregor; Career Development-2 B6698W to David B. FitzGerald; Senior Research Career Scientist Award B3470S to Bruce Crosson), and by the National Institute on Deafness and Other Communication Disorders (Grant R01 DC007387 to Bruce Crosson).
The contents of this paper do not represent the views of U.S. Department of Veterans Affairs or the United States Government.
The authors would like to kindly thank Dr. Daniel Llano (University of Illinois) for providing his thoughtful comments and suggestions for this article.
Footnotes
Appendix A. Supplementary material
Supplementary data associated with this article can be found, in the online version, at http://dx.doi.org/10.1016/j.bandl.2014.12.001.
Although macaque data (Petrides & Pandya, 1999) suggests direct anatomic connectivity between pars triangulars and pars opercularis, this coritico-cortical pathway in humans has yet to be established. Indeed, it is the subject of ongoing research in the first author’s laboratory.
References
- Akert K, & Hartmann-von Monakow K (1979). Relationships of precentral, premotor and prefrontal cortex to the mediodorsal and intralaminar nuclei of the monkey thalamus. Acta Neurobiologiae Experimentalis, 40(1), 7–25. [PubMed] [Google Scholar]
- Alexander MP, & Loverme SR (1980). Aphasia after left hemispheric intracerebral hemorrhage. Neurology, 30(11), 1193–1202. [DOI] [PubMed] [Google Scholar]
- Amunts K, Schleicher A, Burgel U, Mohlberg H, Uylings HBM, & Zilles K (1999). Broca’s region revisited: Cytoarchitecture and intersubject variability. Journal of Comparative Neurology, 412(2), 319–341. 10.1002/(Sici)1096-9861(19990920)412:2. [DOI] [PubMed] [Google Scholar]
- Amunts K, Weiss PH, Mohlberg H, Pieperhoff P, Eickhoff S, Gurd JM, et al. (2004). Analysis of neural mechanisms underlying verbal fluency in cytoarchitectonically defined stereotaxic space – The roles of Brodmann areas 44 and 45. Neuroimage, 22(1), 42–56. 10.1016/j.neuroimage.2003.12.031. [DOI] [PubMed] [Google Scholar]
- Assaf M, Calhoun VD, Kuzu CH, Kraut MA, Rivkin PR, Hart J Jr.,, et al. (2006). Neural correlates of the object-recall process in semantic memory. Psychiatry Research, 147(2–3), 115–126. 10.1016/j.pscychresns.2006.01.002. [DOI] [PubMed] [Google Scholar]
- Basser PJ, & Jones DK (2002). Diffusion-tensor MRI: Theory, experimental design and data analysis – A technical review. NMR in Biomedicine, 15(7–8), 456–467. 10.1002/Nbm.783. [DOI] [PubMed] [Google Scholar]
- Basser PJ, Mattiello J, & LeBihan D (1994). MR diffusion tensor spectroscopy and imaging. Biophysical Journal, 66(1), 259–267. 10.1016/S0006-3495(94)80775-1. [DOI] [PMC free article] [PubMed] [Google Scholar]
- Binder JR, Frost JA, Hammeke TA, Rao SM, & Cox RW (1996). Function of the left planum temporale in auditory and linguistic processing. Brain, 119, 1239–1247. 10.1093/brain/119.4.1239. [DOI] [PubMed] [Google Scholar]
- Cabeza R, & Nyberg L (2000). Neural bases of learning and memory: Functional neuroimaging evidence. [Review]. Current Opinion in Neurology, 13(4), 415–421. [DOI] [PubMed] [Google Scholar]
- Cappa SF, & Vignolo LA (1979). “Transcortical” features of aphasia following left thalamic hemorrhage. Cortex, 15, 121–130. [DOI] [PubMed] [Google Scholar]
- Crosson B (2013). Thalamic mechanisms in language: A reconsideration based on recent findings and concepts. Brain and Language, 126(1), 73–88. 10.1016/j.bandl.2012.06.011. [DOI] [PMC free article] [PubMed] [Google Scholar]
- Crosson B, McGregor K, Gopinath KS, Conway TW, Benjamin M, Chang YL, et al. (2007). Functional MRI of language in aphasia: A review of the literature and the methodological challenges. Neuropsychology Review, 17(2), 157–177. 10.1007/s11065-007-9024-z. [DOI] [PMC free article] [PubMed] [Google Scholar]
- Crosson B, Moberg PJ, Boone JR, Rothi LJG, & Raymer A (1997). Category-specific naming deficit for medical terms after dominant thalamic/capsular hemorrhage. Brain and Language, 60(3), 407–442. 10.1006/brln.1997.1899. [DOI] [PubMed] [Google Scholar]
- Crosson Bruce A. (1992). Subcortical functions in language and memory. Guilford Press. [Google Scholar]
- Crosson B, Parker JC, Kim AK, Warren RL, Kepes JJ, & Tully R (1986). A case of thalamic aphasia with postmortem verification. Brain and Language, 29(2), 301–314. 10.1016/0093-934x(86)90050-7. [DOI] [PubMed] [Google Scholar]
- Devlin JT, Raley J, Tunbridge E, Lanary K, Floyer-Lea A, Narain C, et al. (2003). Functional asymmetry for auditory processing in human primary auditory cortex. Journal of Neuroscience, 23(37), 11516–11522. [DOI] [PMC free article] [PubMed] [Google Scholar]
- Ford AA, Triplett W, Sudhyadhom A, Gullett J, McGregor K, FitzGerald DB, et al. (2013). Broca’s area and its striatal and thalamic connections: A diffusion-MRI tractography study. Frontiers in Neuroanatomy, 7. 10.3389/fnana.2013.00008. [DOI] [PMC free article] [PubMed] [Google Scholar]
- Goldman-Rakic PS, & Porrino LJ (1985). The primate mediodorsal (Md) nucleus and its projection to the frontal-lobe. Journal of Comparative Neurology, 242(4), 535–560. 10.1002/cne.902420406. [DOI] [PubMed] [Google Scholar]
- Graff-Radford NR, Damasio H, Yamada T, Eslinger PJ, & Damasio AR (1985). Nonhaemorrhagic thalamic infarction clinical, neuropsychological and electrophysiological findings in four anatomical groups defined by computerized tomography. Brain, 108(2), 485–516. [DOI] [PubMed] [Google Scholar]
- Hagoort P, Hald L, Bastiaansen M, & Petersson KM (2004). Integration of word meaning and world knowledge in language comprehension. Science, 304(5669), 438–441. 10.1126/science.1095455. [DOI] [PubMed] [Google Scholar]
- Heim S, Eickhoff SB, & Amunts K (2008). Specialisation in Broca’s region for semantic, phonological, and syntactic fluency? Neuroimage, 40(3), 1362–1368. 10.1016/j.neuroimage.2008.01.009. [DOI] [PubMed] [Google Scholar]
- Heim S, Friederici AD, Schiller NO, Ruschemeyer SA, & Amunts K (2009). The determiner congruency effect in language production investigated with functional MRI. Human Brain Mapping, 30(3), 928–940. 10.1002/Hbm.20556. [DOI] [PMC free article] [PubMed] [Google Scholar]
- Jenkinson M, & Smith S (2001). A global optimisation method for robust affine registration of brain images. Medical Image Analysis, 5(2), 143–156. [DOI] [PubMed] [Google Scholar]
- Jian B, & Vemuri B (2007a). Multi-fiber reconstruction from diffusion MRI using mixture of Wischarts and sparse deconvolution. Information Processing in Medical Imaging, 20, 384–395. [DOI] [PMC free article] [PubMed] [Google Scholar]
- Jian B, & Vemuri BC (2007b). A unified computational framework for deconvolution to reconstruct multiple fibers from diffusion weighted MRI. IEEE Transactions on Medical Imaging, 26, 1464–1471. [DOI] [PMC free article] [PubMed] [Google Scholar]
- Jian B, Vemuri BC, Ozarslan E, Carney PR, & Mareci TH (2007). A novel tensor distribution model for the diffusion-weighted MR signal. Neuroimage, 37(1), 164–176. 10.1016/j.neuroimage.2007.03.074. [DOI] [PMC free article] [PubMed] [Google Scholar]
- Johnson MD, & Ojemann GA (2000). The role of the human thalamus in language and memory: Evidence from electrophysiological studies. Brain and Cognition, 42(2), 218–230. 10.1006/brcg.1999.1101. [DOI] [PubMed] [Google Scholar]
- Kraut MA, Kremen S, Segal JB, Calhoun V, Moo LR, & Hart J (2002). Object activation from features in the semantic system. Journal of Cognitive Neuroscience, 14(1), 24–36. 10.1162/089892902317205294. [DOI] [PubMed] [Google Scholar]
- Llano DA, & Sherman SM (2008). Evidence for nonreciprocal organization of the mouse auditory thalamocortical-corticothalamic projection systems. Journal of Comparative Neurology, 507(2), 1209–1227. 10.1002/Cne.21602. [DOI] [PubMed] [Google Scholar]
- Mori S, Crain BJ, Chacko VP, & van Zijl PC (1999). Three-dimensional tracking of axonal projections in the brain by magnetic resonance imaging. Annals of Neurology, 45(2), 265–269. [DOI] [PubMed] [Google Scholar]
- Nadeau SE, & Crosson B (1997). Subcortical aphasia. [Review]. Brain and Language, 58(3), 355–402. 10.1006/brln.1997.1707. discussion 418–323. [DOI] [PubMed] [Google Scholar]
- Nishio Y, Hashimoto M, Ishii K, Ito D, Mugikura S, Takahashi S, et al. (2014). Multiple thalamo-cortical disconnections in anterior thalamic infarction: Implications for thalamic mechanisms of memory and language. Neuropsychologia, 53, 264–273. 10.1016/j.neuropsychologia.2013.11.025. [DOI] [PubMed] [Google Scholar]
- Ojemann GA (1976). Subcortical language mechanisms. In Whitaker H & Whitaker HA (Eds.). Studies in neurolinguistics (Vol. 1, pp. 103–138). New York: Academic Press. [Google Scholar]
- Petrides M, & Pandya DN (1999). Dorsolateral prefrontal cortex: Comparative cytoarchitectonic analysis in the human and the macaque brain and corticocortical connection patterns. European Journal of Neuroscience, 11, 1011–1036. 10.1046/j.1460-9568.1999.00518.x. [DOI] [PubMed] [Google Scholar]
- Raymer AM, Moberg P, Crosson B, Nadeau S, & Rothi LJG (1997). Lexical–semantic deficits in two patients with dominant thalamic infarction. Neuropsychologia, 35(2), 211–219. [DOI] [PubMed] [Google Scholar]
- Rizzolatti G, & Craighero L (2004). The mirror-neuron system. Annu. Rev. Neurosci, 27, 169–192. [DOI] [PubMed] [Google Scholar]
- Romanski LM, Giguere M, Bates JF, & Goldman-Rakic PS (1997). Topographic organization of medial pulvinar connections with the prefrontal cortex in the rhesus monkey. Journal of Comparative Neurology, 379(3), 313–332. [PubMed] [Google Scholar]
- Schaltenbrand G (1965). The effects of stereotactic electrical stimulation in the depth of the brain. Brain, 88(4), 835–840. [DOI] [PubMed] [Google Scholar]
- Schaltenbrand G (1975). The effects on speech and language of stereotactical stimulation in thalamus and corpus callosum. Brain and Language, 2(1), 70–77. [DOI] [PubMed] [Google Scholar]
- Schaltenbrand G, & Wahren W (1977). Atlas for stereotaxy of the human brain (2nd ed.). Stuttgart: Ed. Thieme. [Google Scholar]
- Sherman SM, & Guillery RW (2006). Exploring the thalamus and its role in cortical function. Cambridge, MA: MIT Press. [Google Scholar]
- Slotnick SD, Moo LR, Kraut MA, Lesser RP, & Hart J (2002). Interactions between thalamic and cortical rhythms during semantic memory recall in human. Proceedings of the National Academy of Sciences, 99(9), 6440–6443. 10.1073/pnas.092514899. [DOI] [PMC free article] [PubMed] [Google Scholar]
- Sudhyadhom A, Okun MS, Foote KD, Rahman M, & Bova FJ (2012). A three-dimensional deformable brain atlas for DBS targeting. I. Methodology for atlas creation and artifact reduction. The Open Neuroimaging Journal, 6, 92–98. 10.2174/1874440001206010092. [DOI] [PMC free article] [PubMed] [Google Scholar]
- Theyel BB, Llano DA, & Sherman M (2010). The corticothalamocortical circuit drives higher-order cortex in the mouse. Nature Neuroscience, 13(1). 10.1038/Nn.2449.84-U246. [DOI] [PMC free article] [PubMed] [Google Scholar]
- Ullman MT (2004). Contributions of memory circuits to language: The declarative/procedural model. [Review]. Cognition, 92(1–2), 231–270. 10.1016/j.cognition.2003.10.008. [DOI] [PubMed] [Google Scholar]
Associated Data
This section collects any data citations, data availability statements, or supplementary materials included in this article.