Abstract
The tumor microenvironment (TME) plays an essential role in malignancy and neurons have emerged as a key component of the TME that promotes tumorigenesis across a host of cancers1,2. Recent studies on glioblastoma (GBM) highlight bi-directional signaling between tumors and neurons that propagates a vicious cycle of proliferation, synaptic integration, and brain hyperactivity3-8; however, the identity of neuronal subtypes and tumor subpopulations driving this phenomenon are incompletely understood. Here we show that callosal projection neurons located in the hemisphere contralateral to primary GBM tumors promote progression and widespread infiltration. Using this platform to examine GBM infiltration, we identified an activity dependent infiltrating population present at the leading edge of mouse and human tumors that is enriched for axon guidance genes. High-throughput, in vivo screening of these genes identified Sema4F as a key regulator of tumorigenesis and activity-dependent progression. Furthermore, Sema4F promotes the activity-dependent infiltrating population and propagates bi-directional signaling with neurons by remodeling tumor adjacent synapses towards brain network hyperactivity. Collectively, our studies demonstrate that subsets of neurons in locations remote to primary GBM promote malignant progression, while revealing new mechanisms of glioma progression that are regulated by neuronal activity.
Glioblastoma (GBM) is the most aggressive and lethal form of brain tumor, featuring high rates of proliferation and infiltration into surrounding brain tissue9-11. Despite treatment, recurrence is inevitable and tends to occur outside surgical margins or in locations remote to the primary tumor12-14, highlighting the central role that tumor infiltration plays in this malicious disease. GBM infiltration in the brain generally occurs along organized anatomical structures such as blood vessels and white matter tracts, which contain neuronal axons and suggests the involvement of neuronal populations15-17. Previous studies established correlations between the presence of GBM and heightened neuronal activity in surrounding brain regions, with integration of tumors into circuits correlated with decreased survival and reduced cognitive function3,4,8,18-20. Moreover, it has been shown that increased neuronal activity can promote optic nerve glioma progression and the growth of both pediatric and adult forms of high-grade glioma through mechanisms involving activity-regulated paracrine factors and neuron-to-glioma synaptic signaling4-6,21. This raises the possibility that neuronal activity itself can promote tumor infiltration and progression, a concept supported by the recent discovery that synaptic signaling between neurons and glioma cells can promote invasion22,23. Whether neuronal activity promotes circuit-specific patterns of glioma infiltration through paracrine signaling is unknown, and the underlying molecular mechanisms driving GBM infiltration remain obscure. Furthermore, the brain contains a plethora of neuronal subtypes, and which subtypes of neurons serve as the substrate for driving GBM progression is also incompletely understood.
Results
Remote activity drives progression
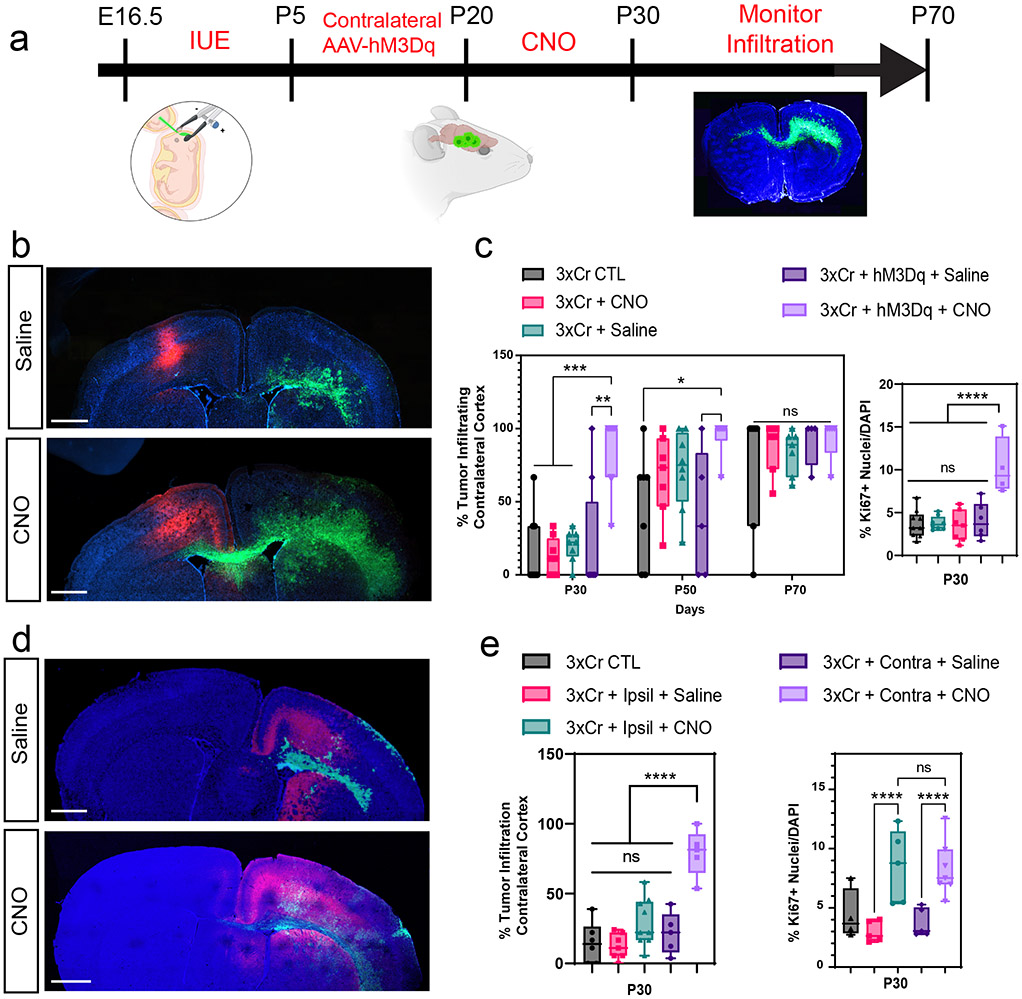
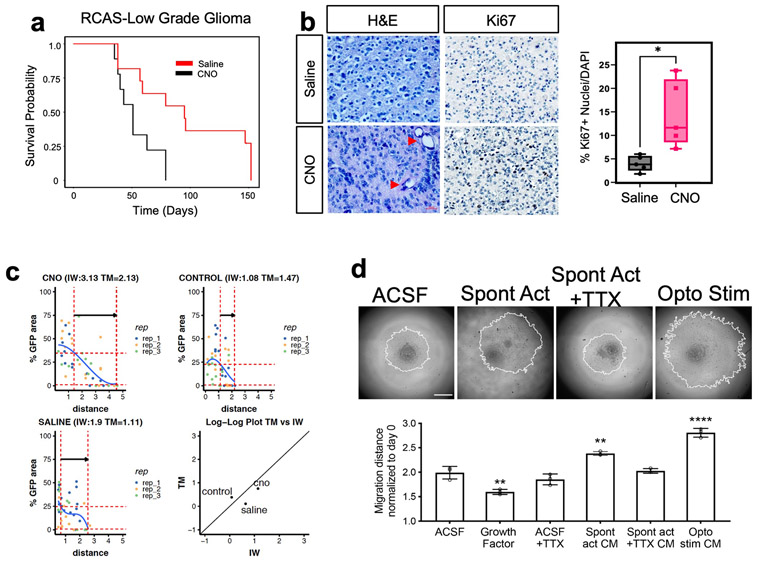
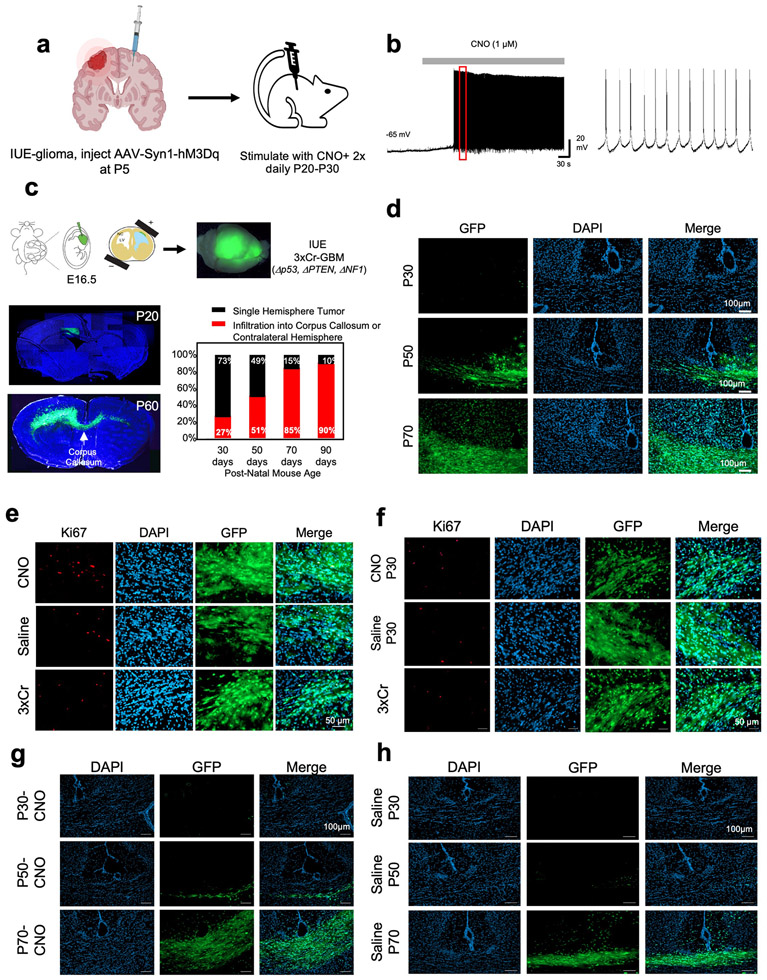
Neuronal activity promotes glioma proliferation, however whether activity promotes transformation of low-grade glioma (LGG) to high-grade glioma (HGG) remains an open question5,24. Furthermore, prior studies stimulated neurons in close proximity to xenografted tumors, raising the question of whether neuronal projections from brain regions remote to the primary tumor contribute to tumorigenesis. To determine whether remote stimulation of neurons promotes LGG to HGG transformation, we used an LGG model based on the RCAS/Ntva system25,26, combined with injection of the contralateral cortex with AAV2/9 Syn1-hM3Dq-mCherry at P5 (Fig. 1a and Extended Data Fig.1a). To stimulate contralateral neurons, we treated mice with saline or 5 mg/Kg of clozapine N-oxide (CNO) two times a day, for two months, starting at P20 and used slice recordings to confirm increased neuronal activity upon CNO treatment (Extended Data Fig. 2a-b). Strikingly, mice treated with CNO exhibited a drastic decrease in median overall survival compared to the saline group (51days CNO v. 95days saline) (Extended Data Fig.1a). These changes in survival are complemented by increased Ki67 expression in the CNO group and coupled with hallmark pathological features of HGG (Extended Data Fig.1b). These observations suggest that stimulation of neuronal activity in regions remote to primary LGG can promote progression to HGG.
Figure 1. Remote neuronal stimulation accelerates glioma progression.
a. Schematic of DREADD-based activation of neurons contralateral to IUE tumor. b. Representative images from IUE-HGG tumors at P30 after contralateral activation or control; green is tumor, red is AAV-DREADD virus. c. Quantification of infiltration and Ki67 expression via two-way ANOVA analysis. Analysis of infiltration derived from P30 CTL n = 8, P50 CTL n = 7, P70 CTL n = 7, P30+CNO n = 8, P50+CNO n = 7, P70+CNO n = 7, P30+Saline n = 8, P50+Saline n = 7, P70+Saline n = 7, P30+AAV+Saline n = 8, P50+AAV+Saline n = 5, P30+AAV+Saline n = 4, P30+AAV+CNO n = 8, P50+AAV+CNO n = 6, P30+AAV+CNO n = 5 samples. (***P=0.0001, *P=0.0107). Ki67 staining was performed at the P30 time point, from CTL n = 9, CNO-only n = 8, Saline n = 7, AAV+Saline n = 5, AAV+CNO n = 4 samples (****P<0.0001). d. Representative images from IUE-HGG tumors at P30 after ipsilateral neuronal activation; green is tumor, red is AAV-DREADD virus. e. Quantification of infiltration and Ki67 expression at P30 via two-way ANOVA. Analysis is derived from 3xCr CTL n = 6, 3xCr+IpsilAAV+Saline n=7, 3xCr+IpsilAAV+CNO n=9. CNO stimulated brains revealed no statistical difference with Saline treated (P=0.1247) or control tumors (P=0.2714). Comparison between ipsilateral-CNO and contralateral-CNO groups revealed a statistically significant difference (****P=0.0001). Ki67 staining was performed on 3xCr CTL n=5, 3xCr+IpsilAAV+Saline n=5, 3xCr+IpsilAAV+CNO n=5 (****P<0.0001, ***P=0.0003); Data are plotted as median (center line), IQR (box limits) and minimum and maximum values (whiskers) (c, e). Scale bars are 1000um.
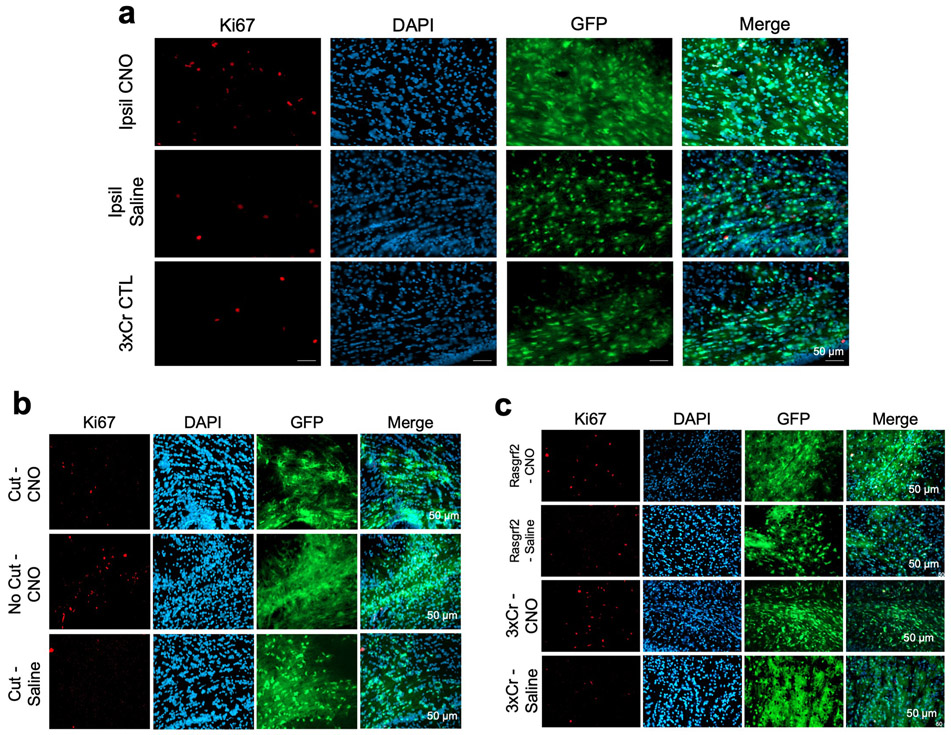
Infiltration throughout the brain is a key facet of progression to HGG, which we examined using our CRISPR/Cas9-based in utero electroporation (IUE) model. In this model, glioma tumorigenesis is initiated in a single cortical hemisphere and infiltrates across the corpus callosum to the contralateral hemisphere (Fig. 1a and Extended Data Fig.2c-d). To examine whether stimulation of neurons from brain regions remote to the primary tumor promotes infiltration, we injected the contralateral cortex with AAV2/9 Syn1-hM3Dq-mCherry at P5 (Fig.1a) and treated with CNO (or saline controls) starting at P20. Using migration across the corpus callosum, into the contralateral cortex, as an index for glioma infiltration, we found that CNO treated tumors exhibited an increase in infiltration as early as P30 (Fig.1b-c). This accelerated infiltration was complemented by an increase in Ki67 expression in the CNO group (Fig.1c and Extended Data Fig. 2e); critically CNO-only controls (without hM3Dq) did not impact tumor proliferation or infiltration (Fig.1c and Extended Data Fig. 2f-h). To determine whether these effects are specific to stimulation of contralateral neurons, we generated tumors and activated neurons in the ipsilateral cortex, finding an increase in proliferation, but no significant changes in infiltration at P30. (Fig.1d-e and Extended Data Fig. 3a). Together, these findings suggest that neuronal activity in the hemisphere contralateral to the primary tumor promotes precocious tumor infiltration across cortical hemispheres.
To further evaluate whether stimulation of contralateral neurons promotes glioma infiltration, we employed mathematical modeling27,41 , finding that tumor infiltration width (IW) is increased relative to tumor mass (TM) in the CNO treated group compared to control tumors at P30 (Extended Data Fig. 1c). To independently validate that neuronal activity-regulated paracrine factors promotes glioma infiltration, we used patient-derived glioma cell cultures in conjunction with a three-dimensional spheroid system to measure infiltration 28,29. These cultures were treated with conditioned media (CM) from cortical explants with spontaneously active neurons, optogentically stimulated neurons, or unconditioned control media (artificial cerebrospinal fluid, ACSF). These studies revealed that treatment of glioma spheroids with CM from cortical explants containing active neurons promoted glioma infiltration (Extended Data Fig.1d). Collectively, these data indicate that neuronal activity promotes tumor infiltration through secreted factors and suggest that neurons contralateral to the primary tumor promote this phenomenon during the early stages of progression.
CPNs promote glioma tumorigenesis
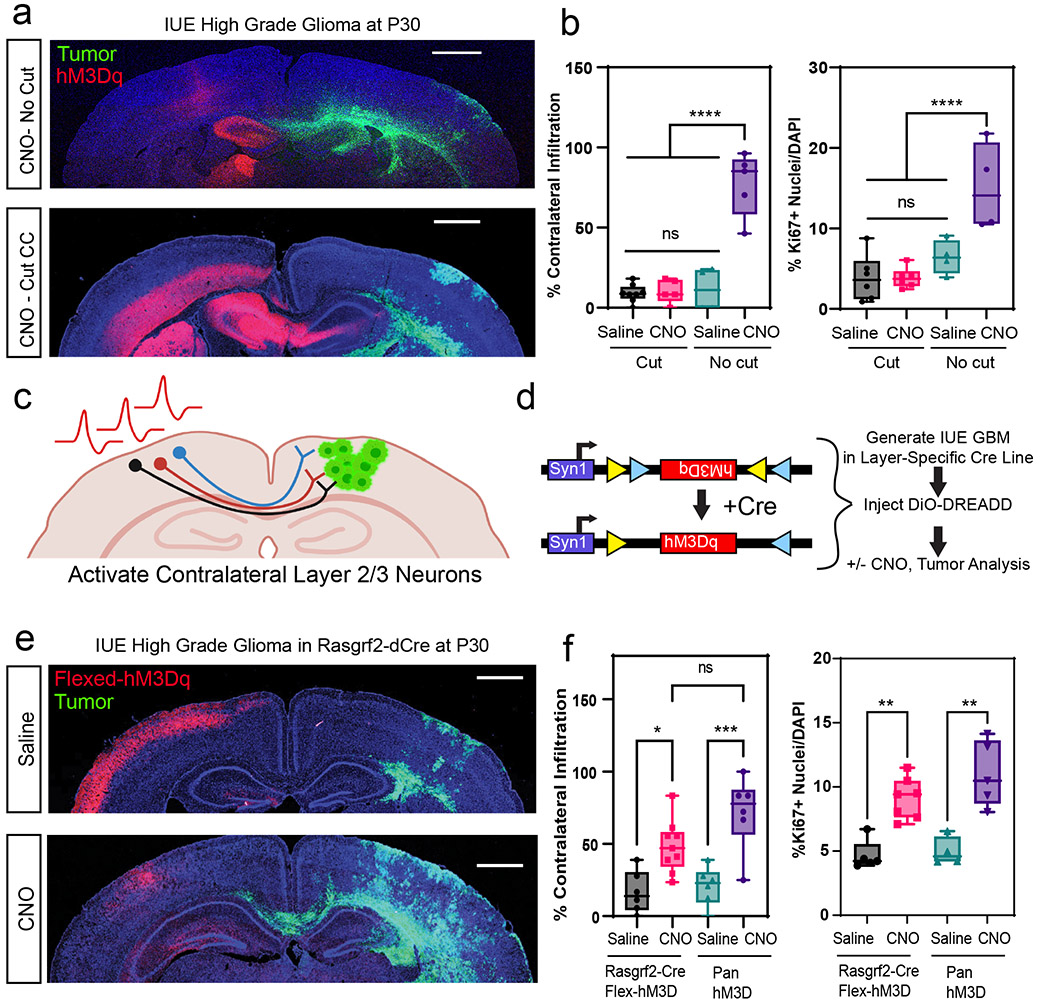
The preceding observations raise the question of which neuronal populations in the contralateral cortex promote glioma infiltration. Because axons of callosal projection neurons (CPN’s) cross cortical hemispheres along the corpus callosum, we reasoned that this population is contributing to activity dependent infiltration30. Therefore, to test whether CPNs are necessary for driving activity dependent tumor infiltration in our system, we severed the corpus callosum in the context of contralateral neuron stimulation. Analysis of these tumors revealed that severing the corpus callosum abolished activity-dependent acceleration of infiltration that was observed with the intact control (Fig.2a-b); we also observed that activity-dependent increases in Ki67 expression were lost (Fig.2b and Extended Data Fig. 3b). These results indicate that an intact corpus callosum is necessary for contralateral neurons to promote glioma progression, implicating CPNs in this phenomenon.
Figure 2. Callosal projection neurons promote glioma progression.
a. Representative images from IUE-HGG tumors at P30 demonstrating infiltration with a severed corpus callosum (cut-CC) or control (no cut); green is tumor; red is AAV-DREADD virus. b. Quantification of infiltration and Ki67 expression at P30 via two-way ANOVA. Analysis is derived from AAV+CNO (No Cut) n = 5, AAV+Saline (No Cut), n = 4, AAV+CNO (Cut) n = 6, CC-cut+AAV+Saline (Cut) n = 6 (****P<0.0001). c-d. Schematic of callosal projection neuron activation experiment and Rasgrf2-dCre mouse line with Cre-inducible DIO-hM3D-2a-mCherry DREADD to selectively activate layer2/3 neurons in contralateral hemisphere. e. Representative images from IUE-HGG tumors, injected with AAV-DIO-hM3D-2a-mCherry in Rasgrf2-Cre mice; green is tumor, red is AAV-DIO-DREADD virus. f. Quantification of infiltration and Ki67 expression at P30 via one-way ANOVA. Analysis is derived from Rasgrf2+AAV+CNO n=9, Rasgrf2+AAV+Saline n=6, 3xCr+AAV+CNO n=6, 3xCr+AAV+Saline n=6. (*P=0.0225, ***P=0.0015, **P=0.011). Data are plotted as median (center line), IQR (box limits) and minimum and maximum values (whiskers) (b,f). Scale bars are 1000um.
To examine whether CPNs are sufficient to accelerate tumor progression we utilized the Rasgrf2-dCre line, which marks layers 2/3 of the cortex, from where ~80% of CPN’s are derived (Fig.2c)30,31. To achieve selective activation of Rasgrf2-dCre expressing neurons, we utilized a Double-Floxed Inverse Orf (DIO) construct (pAAV-Syn1-DIO-hM3D-2A-mCherry), while inducing dCre with Trimethorpim, at 100ng/g body weight (Fig.2d). Induction of dCre and activity of Rasgrf2-Cre; ROSA-floxed-tdTomato in cortical layer 2/3 was confirmed (Extended Data Fig. 4a). Here, we injected the AAV-DIO virus in the contralateral cortex at P5, followed by dCre induction at P15, which enabled expression of hM3Dq in layer 2/3 neurons. Subsequently, we treated mice with saline or CNO at P20 and harvested tumor bearing brains at P30. Selective stimulation of Rasgrf2-Cre expressing neurons with CNO in the contralateral hemisphere promoted both tumor infiltration and Ki67 expression when compared to saline controls (Fig.2e-f and Extended Data Fig. 3c), at levels comparable to pan-neuronal activation. To control for the specificity of this manipulation we activated inhibitory neurons in the contralateral hemisphere using AAV2/9 Dlx5/6-hM3Dq-mCherry in our paradigm and found no changes in infiltration or proliferation at P30 (Extended Data Fig. 4b-c). Together, these data indicate that CPN’s contralateral to the primary tumor play a critical role in driving tumor progression.
Activity-dependent glioma populations
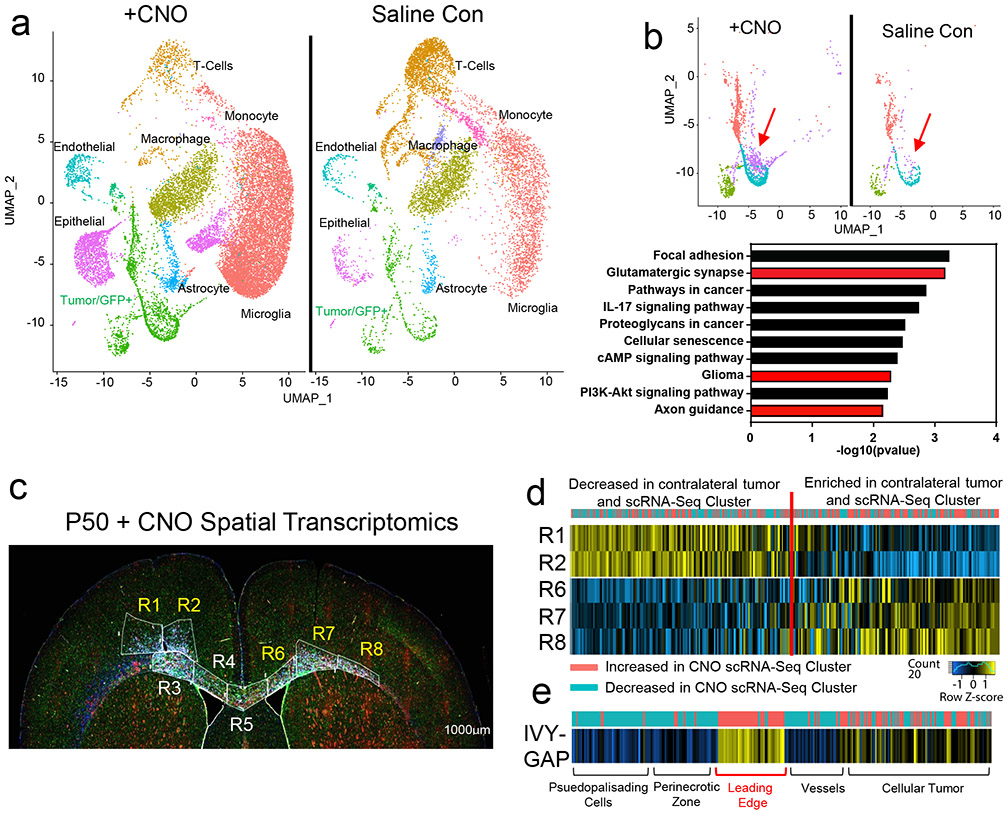
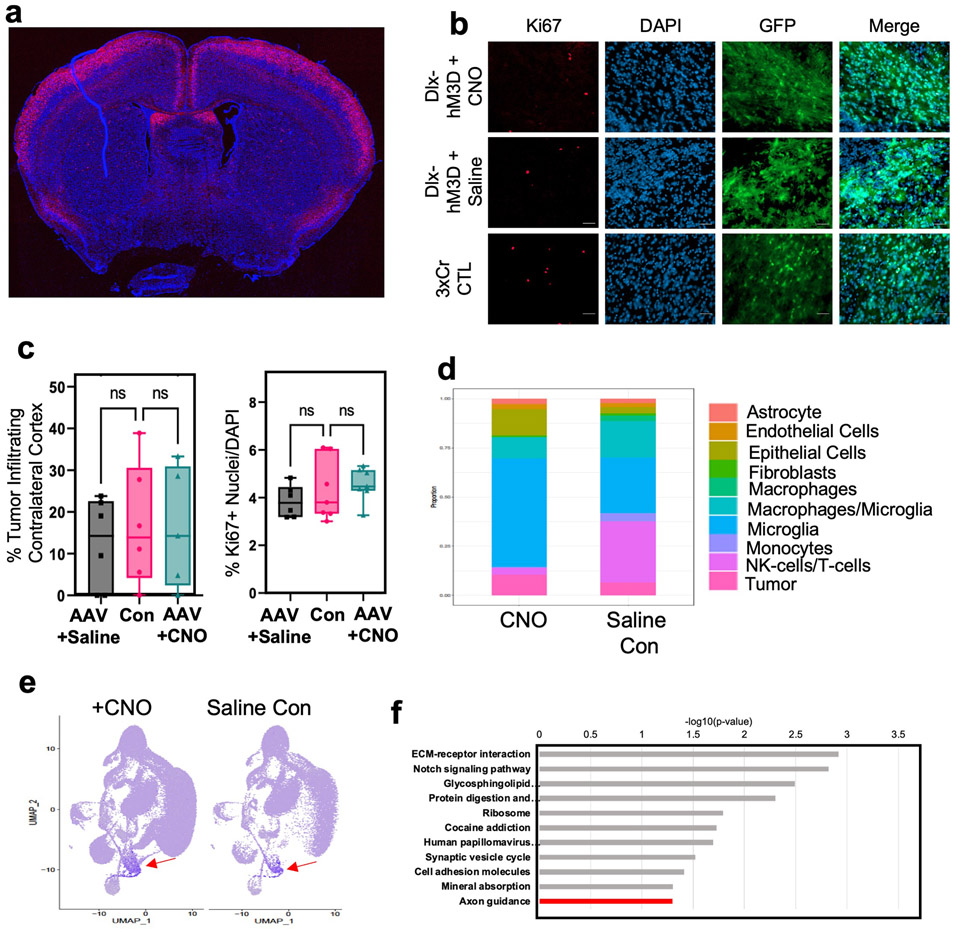
Infiltrating glioma cells contribute to progression and our activity-driven paradigm offers a venue in which to examine the cellular and molecular properties of these populations. To achieve this, we performed single-cell RNA-sequencing (scRNA-Seq) on P50 glioma tumors generated in the presence of contralateral stimulation and using GFP as a marker of tumor cells we were able to distinguish host microenvironmental populations from tumor populations (Fig.3a). This analysis revealed widespread changes in the immune microenvironment in the presence of increased neuronal activity (Fig. 3a and Extended Data Fig. 4d-e and Supplementary Tables 1-2), coupled with changes in the cellular constituency of the tumor. Focusing on the GFP+ tumor populations, we identified several prospective subpopulations that are enriched in the CNO, stimulated tumors (Fig.3b). Gene Ontology (GO) analysis on the most enriched subpopulation in this CNO-enriched clusters (Fig.3b-red arrow) identified a host of unique GO terms, including genes associated with glutamatergic synapses and axon guidance (Fig.3b and Supplementary Table 3). To localize this activity-dependent subpopulation within the tumor, we used spatial transcriptomics of P50 activity-driven glioma and found that the gene signatures associated with this population are localized to infiltrating tumor cells contralateral to the primary tumor (Fig.3c-d). Furthermore, the cells at the leading edge were enriched for genes associated with axon guidance (Extended Data Fig. 4f and Supplementary Table 4). Next, we cross-correlated the gene signature associated with the infiltrating mouse population with the IVY-GAP database, which has transcriptomic data for distinct anatomical structures of human GBM, including the leading edge32. This analysis revealed a similar and highly specific enrichment of this infiltrating signature at the leading edge of human GBM (Fig.3e). Our data indicate that neuronal stimulation drives the generation of infiltrating populations, and these populations correspond to the leading edge of glioma tumors.
Figure 3. Identification of activity-dependent infiltrating glioma population.
a. Single Cell RNA-Seq DimPlots of P50 IUE-HGG from CNO and saline controls. b. Sub-clustering analysis of GFP+ tumor cells shown in a; red arrow indicates the cluster of interest. GO-term analysis on upregulated (average log FC>0, P<0.05) genes was performed using EnrichR and the KEGG 2021 Human dataset. c. Spatial transcriptomics on P50 IUE-HGG from the CNO group; R1-R2 denote ipsilateral tumor, R3-R5 denote tumor within corpus callosum, R6-R8 denote infiltrating tumor in contralateral hemisphere. d. Heatmap depicting the expression of markers associated with the single cell cluster of interest from b and their relative expression across the tumor regions displayed in c. Fold change of markers from the scRNA-Seq data are mapped in pink and blue. e. Heatmap depicting the enrichment of markers associated with the single cell cluster of interest and their relative expression across various anatomical locations in human GBM, derived from the IVY-GAP database. These enrichment scores were generated with AUCell analysis (depicted in red and blue), or ssGSEA analysis (depicted in yellow and blue) and plotted as a heatmap
Sema4F guides glioma progression
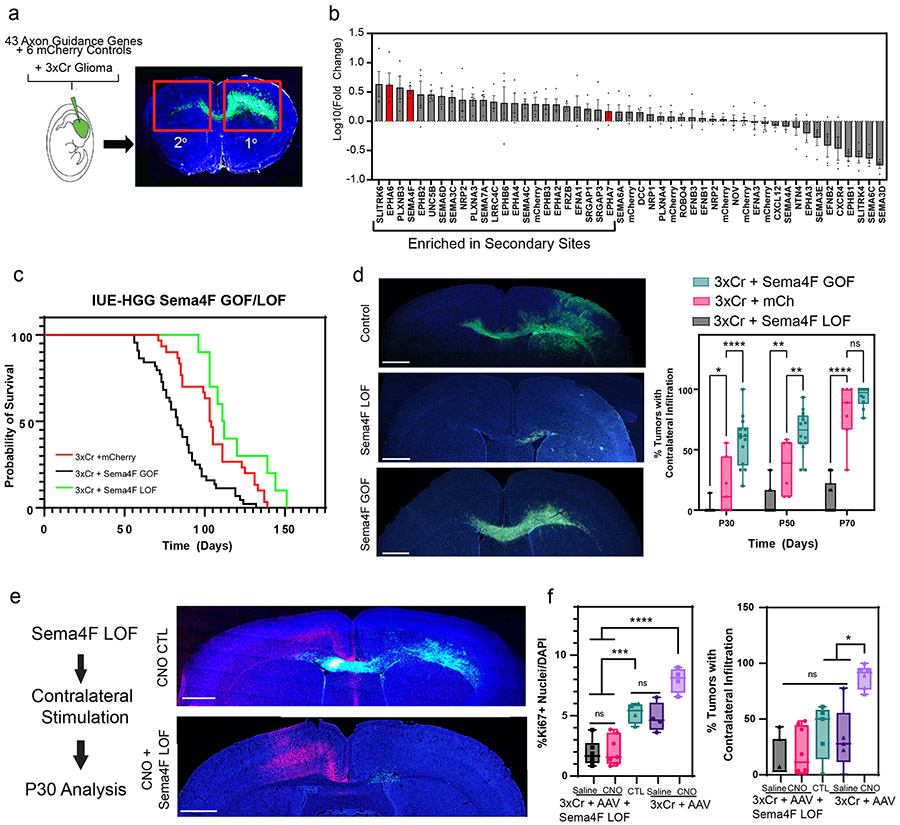
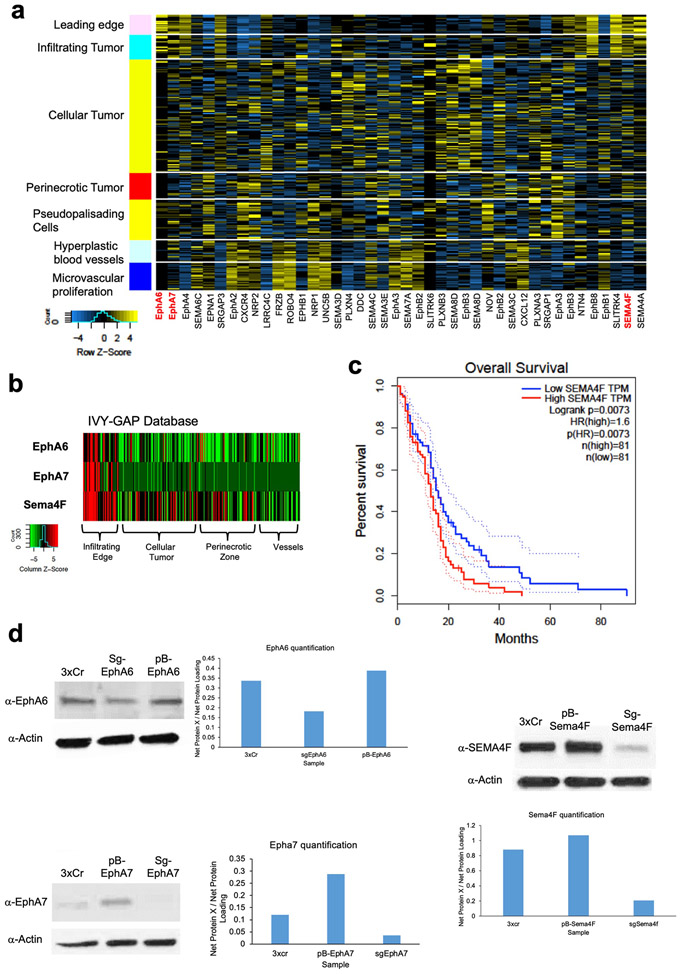
The enrichment of axon guidance genes in the activity-driven, infiltrating glioma population (Fig.3b), led us to investigate their contributions to glioma infiltration. To examine their roles in this context we performed a bar-coded, overexpression screen by generating a PiggyBac-based, barcoded library of 43 axon guidance genes (Fig.4a and Supplementary Table 5). Following introduction of the axon guidance library into our IUE-HGG model, we harvested tumor bearing mice at P90 and dissected tumors based on ipsilateral- (primary) and contralateral- (secondary) locations. We performed barcode sequencing on samples from both sites and compared barcode enrichment between primary and secondary sites, seeking to identify barcodes that are enriched in secondary sites (Fig.4a-b). Candidates nominated from this screen were further evaluated through the IVY-GAP database, revealing that Semaphorin-4F (Sema4F), EphrinA6 (EphA6), and EphrinA7 (EphA7) are enriched in the leading edge of human GBM (Extended Data Figs. 5a-c, 6b). Furthermore, the roles of EphA6, EphA7, and Sema4F in glioma infiltration are undefined, prompting us to examine their contribution to tumorigenesis.
Figure 4. In vivo screen identifies Sema4F as a driver of glioma progression.
a. Schematic of barcoded screen, tumors were harvested from ipsilateral primary and contralateral secondary tumor sites. b. Next-generation sequencing for barcode amplification. Samples were derived from n=4 biological replicates with paired primary tumor, secondary tumor, and input library samples to derive fold change relative to starting abundance. Results are plotted as mean +/− SEM. c. Kaplan-Meier survival curve of individual gain-of-function and loss-of-function for Sema4F. Sema4F-GOF (medianS4FGOF=83 days, Chisq = 14.8, df = 1 p-value = 0.0001, n = 44), Sema-LOF (medianS4FLOF=112 days, Chisq = 3.9, df = 1 p-value = 0.05, n = 10), controls (n=18) d. Representative images from IUE-HGG tumors at P50 from Sema4F-GOF, Sema4F-LOF, or control groups demonstrating infiltration; green is tumor. e. Quantification of infiltration from these tumors across the P30-P70 time course via two-way ANOVA. Analysis is derived from Sema4F-GOF p30 n=14, Sema4F-GOF p50 n=14, Sema4F-GOF p70 n=10, Sema4F CTL p30 n=7, Sema4F CTL p50 n=6 Sema4F CTL p70 n=7, Sema4F-LOF p30 n=17, Sema4F-LOF p50 n=16, Sema4F-LOF p70 n=19. (*P=0.0462, **P=0.001, ****P<0.0001). f. Representative images from IUE-HGG tumors at P30 after combined Sema4F-LOF and neuronal activation (CNO); green is tumor, red is AAV-DREADD virus.
g. Quantification of tumor infiltration and Ki67 expression at P30 analyzed via two-way ANOVA. Analysis is derived from Sema4F-KO+AAV+Saline n=7, Sema4F-KO+AAV+CNO n=8, 3xCr CTL n=5, 3xCr+AAV+Saline n=5, 3xCr+AAV+CNO n=6. (*P=0.0195, ***P=0.0003, ****P=<0.0001). Scale bars are 1000um.
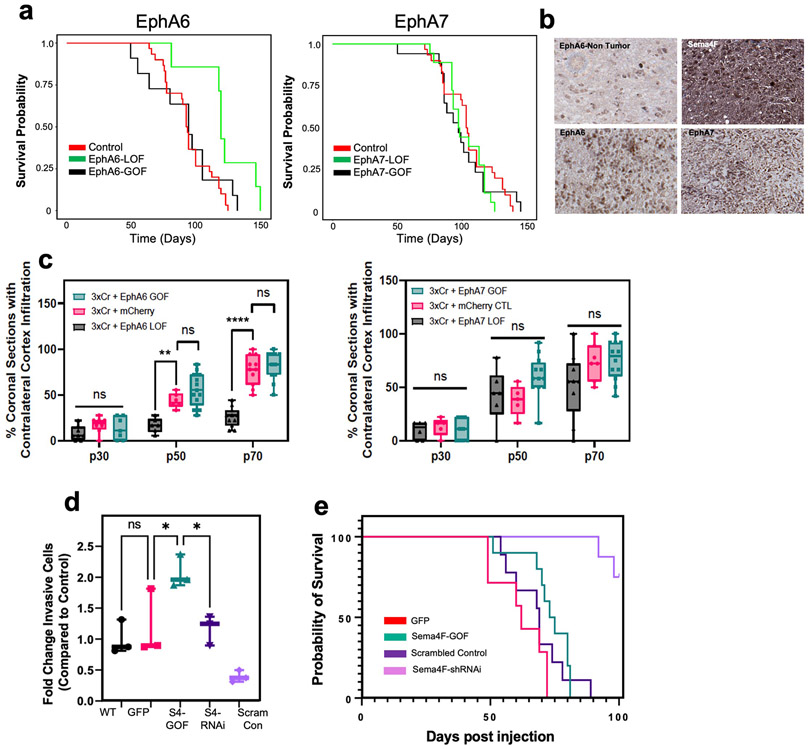
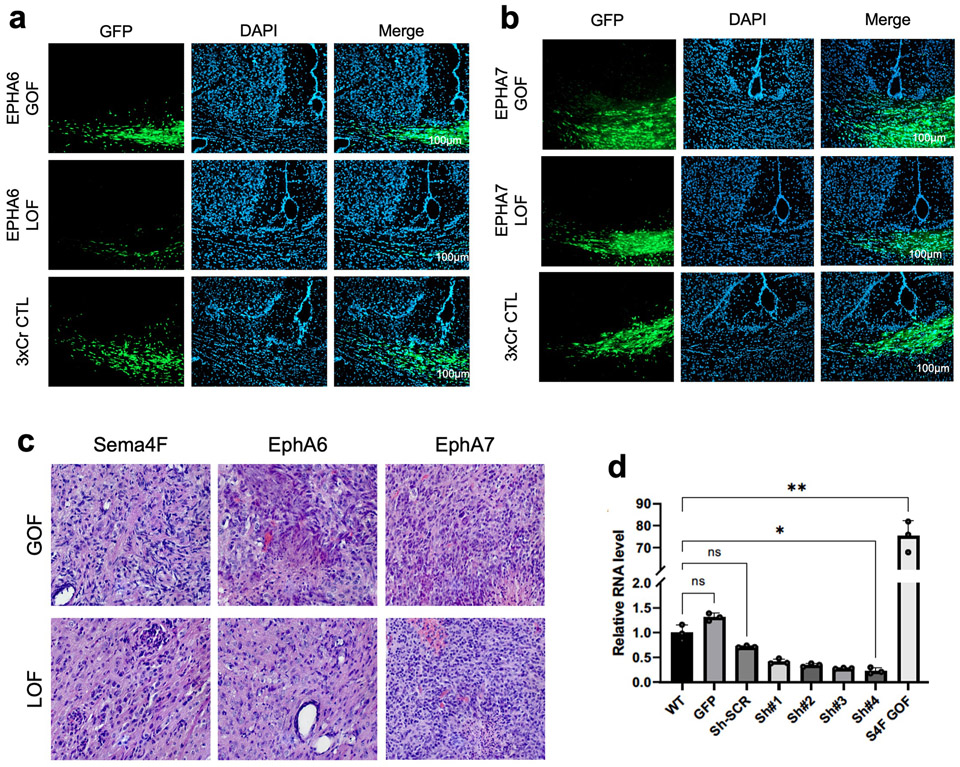
To determine the roles of Sema4F, EphA6, and EphA7 in glioma tumorigenesis and infiltration, we performed gain-of-function (GOF) overexpression and CRISPR-Cas9 based loss-of-function (LOF) studies in our IUE-HGG model (Extended Data Figure 5d). Using overall survival as a proxy for tumor burden, we found that LOF studies with EphA6 and Sema4F extended mouse survival, while GOF studies with Sema4F decreased overall survival (Fig.4c; Extended Data Fig. 6a). To determine how these manipulations impacted tumor infiltration we generated LOF and GOF tumors for each gene and measured contralateral infiltration, finding that GOF manipulations with Sema4F accelerated infiltration, while LOF manipulations impaired infiltration (Fig.4d). Analysis of EphA6-LOF revealed in impaired infiltration, while the remainder of the manipulations with EphA6 and EphA7 had negligible impacts on infiltration (Extended Data Figs. 6c,7a-c). Focusing on Sema4F, we generated human glioma cell lines that overexpress Sema4F (GOF) or have shRNA-knockdown (LOF) (Extended Data Fig. 7d) and implantation of these lines into the mouse brain revealed that knockdown of Sema4F resulted in an extension of overall survival (Extended Data Fig. 6e). To evaluate glioma cell infiltration, we performed transwell assays, finding that Sema4F-GOF resulted in enhanced infiltration, while Sema4F-LOF suppressed infiltration (Extended Data Fig. 6d). Collectively, these studies identify Sema4F as a regulator of glioma progression.
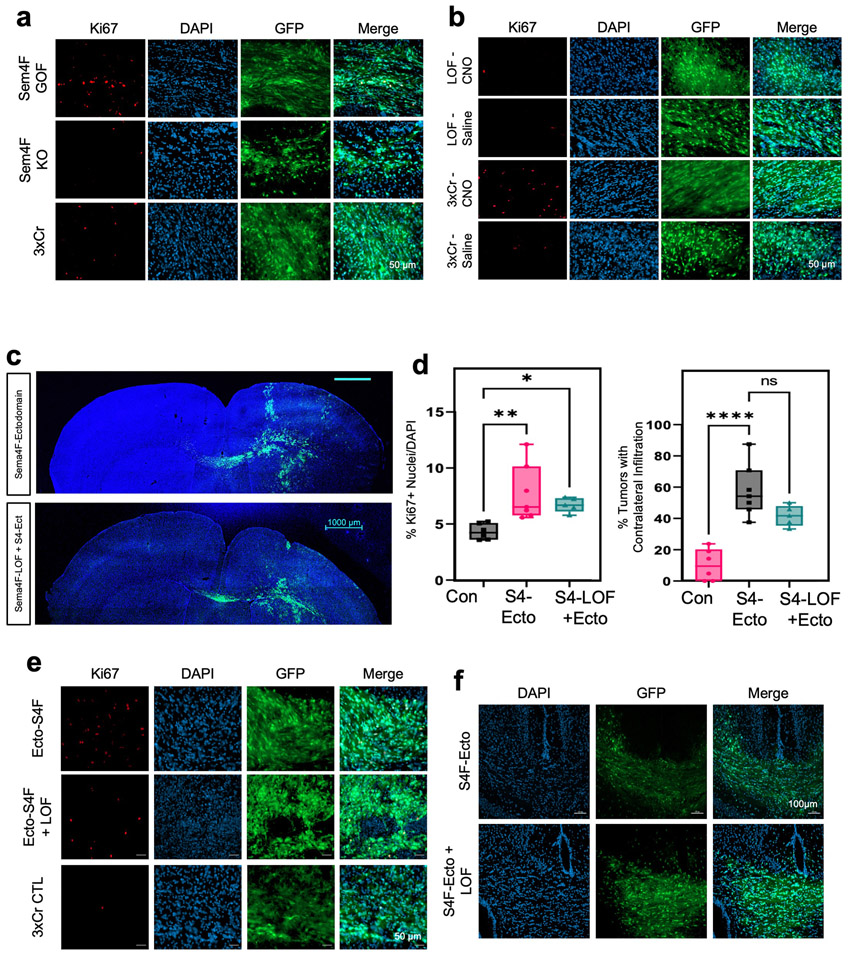
To determine whether activity-dependent infiltration requires Sema4F we used our established paradigm (Fig.1a), in conjunction with Sema4F-LOF. Analysis revealed that loss of Sema4F in the context of CNO-based stimulation abolished activity-dependent infiltration and proliferation when compared to controls with intact Sema4F (Fig.4e-f; Extended Data Fig. 8a-b). Next, we examined whether Sema4F contributes to glioma tumorigenesis via cell extrinsic mechanisms by overexpressing the Sema4F-ectodomain (S4E) in our IUE-HGG model, finding that it promotes infiltration and proliferation at P30 (Extended Data Fig. 8c-f). These findings prompted us to examine whether S4E can rescue the deficits manifest in Sema4F-LOF tumors, revealing that overexpression of S4E in the context of Sema4F-LOF rescues both infiltration and proliferation at P30 (Extended Data Fig. 8c-f). These results indicate that Sema4F mediates activity-dependent glioma progression and promotes tumor infiltration through its ectodomain, suggesting that it regulates this phenomenon through interactions with the brain microenvironment.
Sema4F promotes brain hyperactivity
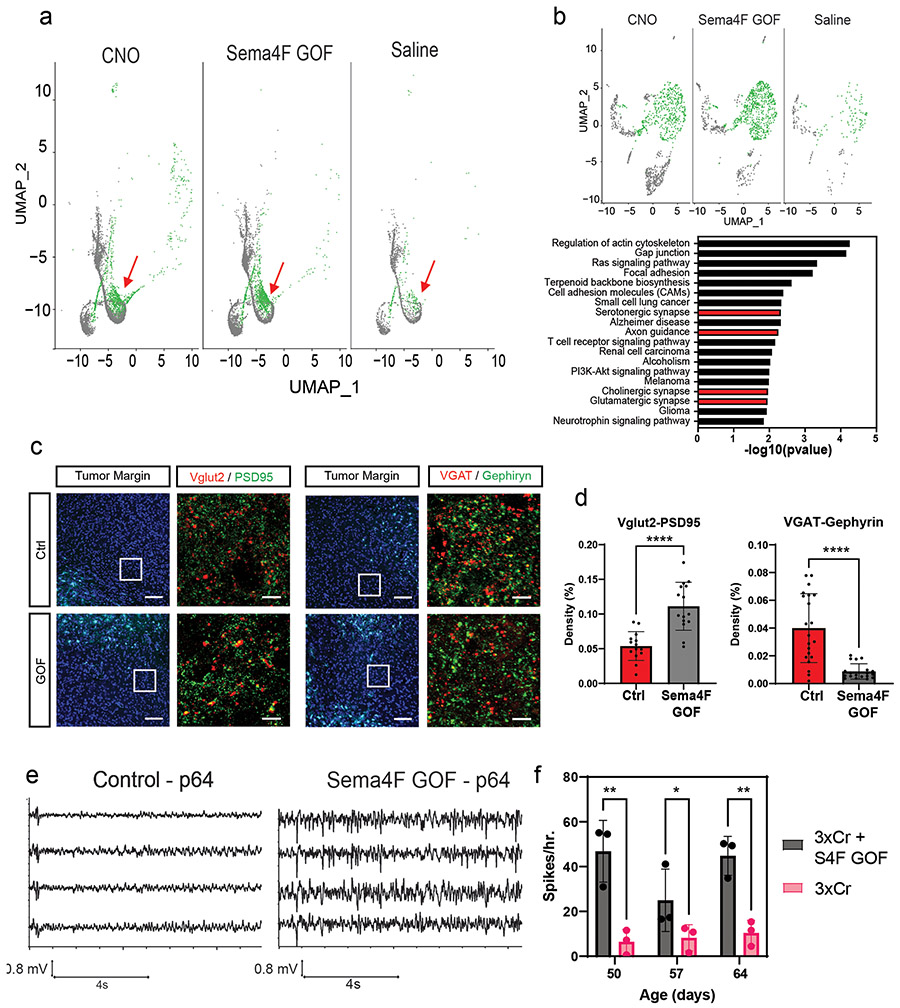
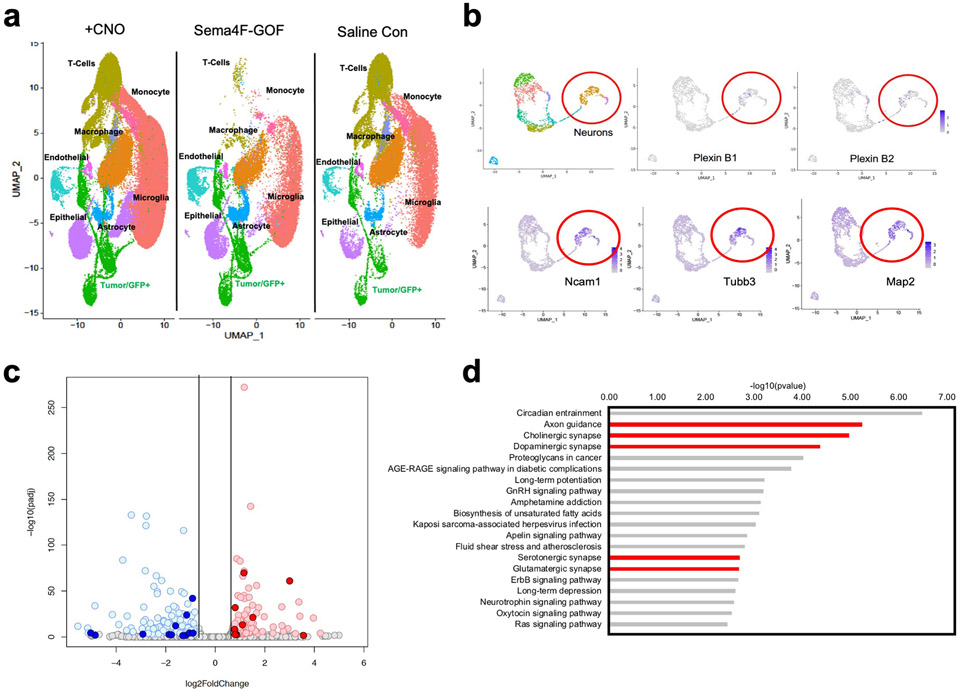
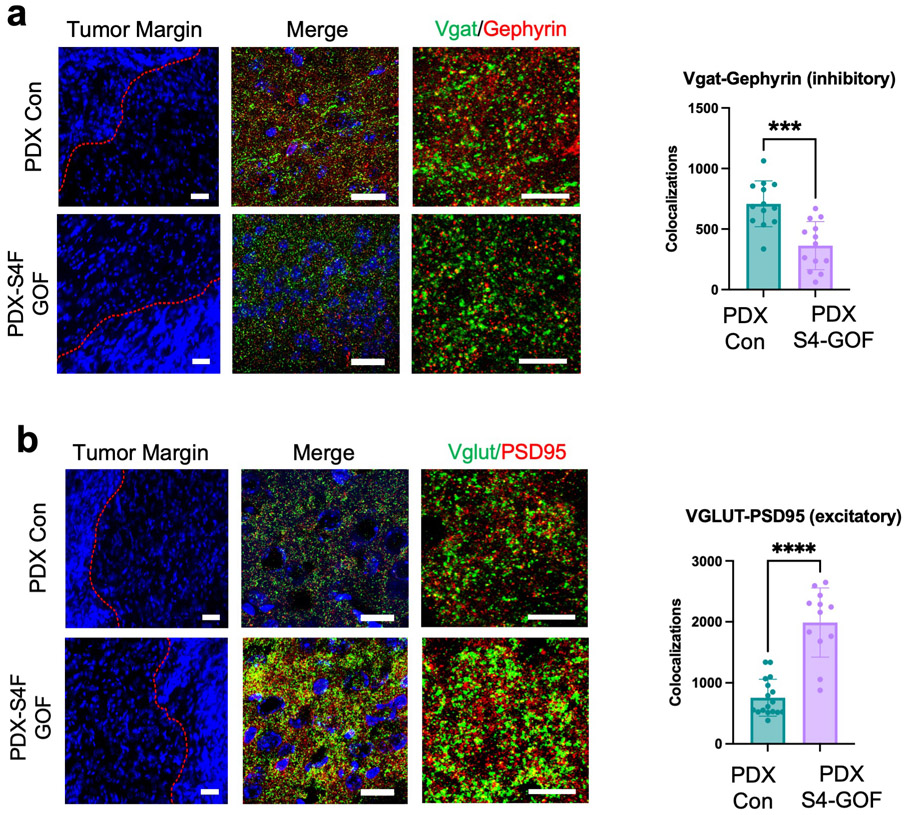
The foregoing data suggest that Sema4F promotes the generation of the activity-dependent, infiltrating population (Fig.3). To test this, we performed scRNA-Seq on Sema4F-GOF tumors at P50 and cross-compared these data with our activity-driven scRNA-Seq datasets (Fig.5a and Extended Data Fig. 9a). This analysis revealed that the activity-dependent cluster was also enriched in our Sema4F-GOF dataset and contains the axon guidance gene signature (Fig.5a-b; Supplementary Tables 2, 6), suggesting that Sema4F is capable of generating activity-dependent infiltrating glioma populations. Further analysis of our Sema4F-GOF scRNA-Seq dataset identified the upregulation of several synaptic signaling pathways in tumor cells (Fig.5b), including glutamatergic synapse genes. Bulk RNA-Seq of Sema4F-GOF human glioma cell lines revealed an analogous enrichment in synaptic signaling and axon guidance pathways, suggesting conserved features across these models (Extended Data Fig. 9c-d; Supplementary Tables 6-7). Prior studies have shown that Sema-family members and their PlexinB receptors can engender synapse formation 33 and when coupled with the role of the Sema4F-ectodomain in tumorigenesis (Extended Data Fig. 8c-f) prompted us to assess excitatory- and inhibitory- synapses in peritumoral neurons in Sema4F-GOF tumors. These studies revealed a decrease in inhibitory synapses (VGAT-Gephryin), coupled with an increase in excitatory synapses (Vglut2-PSD95) in mouse Sema4F-GOF tumors (Fig.5c-d), which we also observed in mice bearing Sema4F-GOF tumors derived from human glioma cell lines (Extended Data Fig. 10). These data suggest extensive synaptic remodeling towards hyperactive brain states, which we examined by performing serial electroencephalograms (EEG) on mice bearing Sema4F GOF tumors 3,7. As shown in Figure 5e-f, mice bearing Sema4F-GOF tumors exhibit an early onset of brain network hyperactivity, featuring increased spiking, compared to mice bearing control tumors. These EEG data indicate that synaptic remodeling by Sema4F promotes brain network hyperactivity and in conjunction with the scRNA-Seq data suggests that Sema4F itself drives the generation of this activity dependent, infiltrating glioma population.
Figure 5. Sema4F promotes synaptic remodeling and brain hyperactivity.
a. Single Cell RNA-Seq DimPlots of P50 IUE-HGG from Sema4F-GOF, CNO, and saline controls; shown is the GFP+ tumor cluster. Infiltrating tumor subpopulation is highlighted in green and denoted by red arrow. b. Sub-clustering analysis of tumor cells. Analysis of altered expression in this unique prospective cell population (in green) was performed using EnrichR and the KEGG 2021 Human dataset. c. Antibody staining of excitatory (Vglut2-PSD95) and inhibitory synapses (VGAT-Gephryin) P50 mouse brains at peritumoral margins from Sema4F-GOF and control tumors; box denotes zoomed in region in adjacent panel (10X and 200X magnification left to right; white scale bar is 12.5μm and yellow scale bar is 200μm). d. Quantification of synaptic staining. Images were sampled from n=3 biological replicates, with n=13 CTL, n=15 S4F GOF, n=16 S4F LOF fields sampled for Vglut/PSD95 colocalization, and n=23 CTL, n=19 S4F GOF, n=16 S4F LOF fields sampled for Vgat/Gephryn colocalization. Results presented as mean +/− SD and ****P<0.0001). e. Sample EEG traces from mice bearing control or Sema4F-GOF tumors. f. Quantification of spikes/hr over a 24-hr period at one-week intervals from P50 to P64. Spikes were recorded in 3 mice per condition and analyzed via two-way ANOVA (*P=0.024) and plotted as mean values +/− SD . Data are plotted as median (center line), IQR (box limits) and minimum and maximum values (whiskers) (c,f).
Discussion
Neuronal activity has emerged as a key component of the TME that engenders malignant growth in brain tumors and a host of other malignancies3-6,21-23,34-36, however the nature of tumor-neuron interactions remains incompletely understood. In this study, we use CPN activation to demonstrate that long-range projections from neuronal populations remote to primary glioma can drive progression. Our findings suggest that glioma-neuron interactions are more widespread than previously thought and that gliomas receive neuronal inputs from a host of brain regions, implying exposure to a diverse range of neuroactive compounds that can potentially influence tumor growth. Furthermore, glioma tumors remodel local neuronal synapses 3-6,21,22 and make direct synaptic connections, raising the possibility that synapses from these long-range projections are influenced by the tumor resulting in altered brain circuit activity in these remote regions. Interestingly, recent studies from mouse glioma models revealed spreading depolarization across cortical hemispheres37, while studies in humans demonstrate circuit dysregulation within infiltrative regions remote to the primary tumor8.
Despite its central role in glioma recurrence, the cellular and molecular mechanisms regulating tumor infiltration remain elusive. We identified an activity-dependent infiltrating glioma population, however the presence of this population in Sema4F-GOF tumors and at later stages of progression suggest that its emergence is a core feature of infiltration. Glioma tends to infiltrate along white matter tracts, which are myelinated axonal structures populated by nodes of Ranvier that are sources of dynamic ion flux during activity and could serve as a infiltrative cue15,17,38-40. Mechanistically, we found that the infiltrating population is enriched for axon guidance genes and identified Sema4F as a key driver of glioma progression and activity-dependent infiltration. An intriguing line of future investigation is to decipher how Ephrin- and Sema- family members cooperate to regulate activity-dependent progression. Further analysis revealed that Sema4F promotes synaptic remodeling in neurons adjacent to glioma, which is consistent with prior models suggesting that tumors in the CNS generate a positive feedback loop of receiving and promoting synaptic signaling to tumor populations3-5,24,37. When put together, a model emerges where neurons provoke expression of genes from glioma tumors that subsequently drive progression and their own synaptic activity.
Methods
In utero electroporation model of HGG, RCAS model of LGG
All mouse gliomas were generated in the CD-1 IGS mouse background as previously described 3. All mice were housed with food and water available ad libitum under a 12 h–12 h light–dark cycle in a 20–22 °C and 40–60% humidity environment. Both female and male mice were used for all of the experiments. In utero electroporation was performed on embryonic day 15. Previously generated CRISPR constructs were used to knockout NF1, PTEN, and TRP53 (each at 1.5μg per μl) 3. For our low-grade glioma studies we used the RCAS/Ntv-a system, a mouse model of platelet-derived growth factor subunit B (PDGFB)–driven gliomas 25-26. To generate RCAS/PDGFB virus we used immortalized DF-1 chicken fibroblasts grown in Dulbecco modified Eagle medium containing 10% fetal bovine serum in a humidified atmosphere (95% air and 5% carbon dioxide) at 37 C. Live virus was produced by transfecting the RCAS/PDGFB vector into DF-1 cells using FuGENE-6 (Roche, Indianapolis, IN) and allowing the cells to replicate in culture. DF-1, viral producing cells were then injected into the cortex of P1 RCAS/Ntva pups. In both models, when mice began demonstrating lethargy, intermittent seizures, lack of grooming and general moribund phenotypes, they were euthanized. These limits were not exceeded in any of our experiments. All procedures were approved by the Institutional Animal Care and Use Committee at Baylor College of Medicine and conform to the US Public Health Service Policy on Human Care and Use of Laboratory Animals.
Plasmid and adeno-associated virus (AAV) generation
For the initial contralateral neural stimulation experiments, pAAV-hSyn-hM3D-2amCherry (Addgene plasmid #50474) was used to generate AAV 2/9 at a concentration of 1.73E13 gc/mL genome copies per mL (gc/mL). Additional experiments in Rasgrf2-dCre mice utilized pAAV-DIO-EF1a-hM3D-mCherry (Addgene plasmid #50460) to generate AAV2/9 at a concentration of 1.02E13 gc/mL. pAAV-GqDREADD-P2A-dTomato-Fishell4 plasmid (Addgene #83897) was used to generate AAV 2/9 to target GABA-ergic interneurons. Virus was produced at 3.14e11 gc/mL. AAV-DREADDs were generated at the Neuroconnectivity Core at Baylor College of Medicine.
AAV-DREADD injection and CNO treatment
AAV was diluted with loading dye (10x Fast Green 2mg/mL) loaded into a micro dispenser (Drummond Scientific, Cat no.13-681-460) and injected at rate of 7nL/sec to a total volume of 1 μL into the left ventricle of 5-7 day old mice. After weaning, mice were weighed daily and injected intra-peritoneally with 1mg/mL Clozapine N-oxide (CNO) (Tocris Cat #4936) at 0.5 mg/kg per mouse or an equivalent volume of Saline for controls. Mice received injections of CNO or Saline respectively twice per day for the duration of their respective studies reaching 30, 50, or 70 days of age.
Histological Sample Preparation
Mice were anesthetized under isofluorane inhalation and perfused transcardially with icecold 1XPBS pH 7.4 followed by 10% Formalin for paraffin embedded samples, or 4% PFA for frozen sections. After fixing overnight on a shaker at 4C, samples were moved to 70% ethanol or 40% Sucrose respectively. Paraformaldehyde/Sucrose fixed samples were then embedded in OCT (Sakura Finetek, 4583) after an additional overnight incubation on a shaker at 4C. Formalin/Ethanol fixed samples were submitted to the Pathology Core and Lab at Baylor College of Medicine for paraffin embedding.
For haematoxylin and eosin (H&E) staining, 10-μm paraffin-embedded sections were process as follows: 3 × 3 min in xylene, 3 × 3 min in 100% ethanol, 3 × 3 min in 95% ethanol, 3 min in 80% ethanol, 5 min in 70% ethanol, 5 min in ddH2O, 2.5 min in Harris haematoxylin (Poly Scientific R&D, S212A), running tap water wash, 30 s in 95% ethanol, 2.5 min in eosin (Poly Scientific R&D, S176), 2 × 2 min in 95% ethanol, 2 × 2 min in 100% ethanol, and 2 × 2 min in xylene. Staining was preserved with Permount Mounting Media (Electron Microscope Sciences, 17986-01) under a coverslip. Histological diagnoses of mouse-IUE-generated tumors as well as RCAS-Ntva tumors were validated across n ≥ 4 tumors per variant. FFPE sections were subject to antigen retrieval (when needed), blocking and staining with the following antibodies: EphrinA6 (LS Bio LS-B4905, 1:250), EphrinA7(LSBio LS-B4098, 1:500), Sema4F (Atlas Antibodies HPA064095, 1:500), Ki67 (abcam #16667, 1:250) overnight at 4 °C. Slides were washed the following morning in 1xPBS 5 min X3 and stained with secondary antibody (ImmPRESS (Peroxidase) Polymer Anti-Rabbit IgG Reagent) at room temperature for 1 hour then stained with DAB (3,3'diaminobenzidine) peroxidase substrate (Vector Labs, SK4100). Nuclei were counterstained with Hematoxyline for 1 minute followed by development in running water for 5 minutes. Slides were dehydrated with 1x 50% ethanol 5min, 1x 75% ethanol 5min, 3x 95% ethanol 5 min, 3x xylene 5 min followed by mounting with Permount (Fisher chemical SP15). A 20-sided die was used to randomly sample RCAS tumor slides from each respective brain.
Frozen brains were sectioned at 20 μm thickness. Sections were subject to antigen retrieval (when needed), blocking and staining with Ki67 (abcam #16667, 1:250) overnight at 4 °C. We used rabbit-specific secondary antibodies tagged with Alexa Fluor 647 (1:1,000, ThermoFisher) for immunofluorescence. After Hoechst nuclear counter staining (ThermoFisher, H3570, 1:50,000), coverslips were mounted with VECTASHIELD antifade mounting medium (Vector Laboratories, H-1000).
Synapse staining was performed using the following antibodies: VGLUT1 Millipore ab5905,1:2000, PSD95 – Invitrogen 51-6900, 1:300, VGAT – SYSY 131011 1:500, Gephryn - SYSY 147011 1:500. Slides were incubated with their corresponding primary antibody overnight with secondary antibodies incubated the following day for 1 hour at room temperature (Goat-antirabbit AlexaFlour 647 A21245, lot: 1778005, 1:1000; Goat-antimouse AlexaFlour 488 A11001 lot: 1787787 1:1000).
Image Analysis of Ki67+ Nuclei
Ki67 staining images were taken using a Zeiss Axio Imager M2 microscope. Ki67 positive nuclei and total nuclei number were recorded for each field of view in ImageJ/Fiji and the percentage calculated. For RCAS slides utilizing DAB staining, images were taken at 20X magnification and analyzed with ImageJ/Fiji. For IUE-HGG slides utilizing Alexa-Fluor 647, 20x images were taken and analyzed with ImageJ/Fiji. The person who analyzed the images was blinded to the experimental groups.
Infiltration Analysis
Tumor brains were harvested and coronal sections containing GFP positive tumor were collected. From coronal sections containing GFP positive tumor, cortex contralateral to the tumor origin was observed and the presence of GFP tumor cells was logged. Sample brains were sampled randomly with N ≥ 3 slides randomly sampled from regions with GFP. Each slide contained at least N ≥ 3 coronal sections per slide. Infiltration in the contralateral cortex was converted to a percentage for each individual brain. Resulting percentages were analyzed and compared via one-way or two-way ANOVA in Prism (v9.3.0). The person who analyzed the images was blinded to the experimental groups.
Corpus Callosum Cutting Surgery
After receiving viral injections at 5 days of age as outlined above, pups were anesthetized at 7-10 days of age with ice. Using a pair of fine foreceps (FST 11412-11), the skull was penetrated and corpus callosum severed. Penetrating ~2mm in depth and severing the corpus callosum between the 1-2 mm rostral to the bregma. Mice were sutured and monitored during recovery.
Rasgrf2-dCre Induction
Rasgrf2-dCre mice were outbred from C57BL6 stocks with ICR-CD1 mice utilized for IUE for larger litter size. Mice were injected at weaning with trimethoprim (Sigma-Aldrich – T7883) suspended in DMSO at 100mg/mL. Mice were injected intraperitoneally before weaning to a final concentration of 100ng/gram body weight19. As a control, Rasgrf2-dCre and Rosa26-LSLTdTomato mice were crossed. 48 hours post-injection of trimethoprim, mice were sacrificed and analyzed for TdTomato expression in coronal slices (Extended Data Figure 4). Seeing adequate activation, IUE tumors were generated and AAV injected as outlined above. Mice were injected 2 days before weaning with Trimethorpim and received CNO or Saline treatment for 10 days at weaning.
Single Cell Sequencing
Tumor bearing mice were anesthetized under isofluorane inhalation. Brains were isolated and dissected based on the presence of GFP (Leica M80 stereomicroscope, Leica EL6000 Fluorescence Light source). One male and one female mouse was isolated for each group to control for sex-dependent variability. GFP positive tumor tissue was isolated and placed on ice. Tumors were dissociated by incubating with papain (Worthington, LK003178) with DNAseI (Worthington, LK003172) resuspended in EBSS (ThermoFisher, 24010043) on a Thermoshaker (Eppendorf, Z605271) for 15 minutes at 1400 rpm. Papain was neutralized using 10% FBS DMEM F12 w/PS and samples were spun down at 300g for 5 minutes. Samples were washed with PBS and RBC removal was performed as described (Miltenyi 130-094-183). Debris Removal was performed as described (Miltenyi 130-109-398). Following this we performed live cell cleanup using Dead Cell Removal Kit (Miltenyi 130-090-101) and sequenced samples using 10X Genomics through the Baylor Single Cell Sequencing Core. Samples were analyzed using Seurat, AUCell, ssGSEA, and EnrichR.
Single cell RNA-seq analysis
Sequencing files from each flow cell lane were downloaded and the resulting fastq files were merged. Reads were mapped to the mouse genome mm10 assembly using 10X CellRanger (3.0.2) and it is estimated 15,000-38,000 mean reads per cell. For single cell sequencing analysis, standard procedures for filtering, mitochondrial gene removal, doublets removal, variable gene selection, dimensionality reduction, and clustering were performed using Seurat (version 4.1.0) and DoubletFinder 42,43. Criteria for cell inclusion were minimum nUMI/cell threshold 200, minimum gene/cell threshold 250, minimum log10gene/UMI threshold 0.8, maximum mitochondria ratio 0.3, and minimum ribosome ration 0.01 44. Mitochondrial genes were removed before doublets removal. Principle component analysis and elbowplot were used to find neighbors and clusters (resolution 0.3). Cells were visualized using a 2-dimensional Uniform Manifold Approximation and Projection (UMAP) of the PCprojected data. Molecularly distinct cell populations were assigned to each cluster using singleR with adult mouse cortical cell taxonomy single cell RNA-seq data as references. FindAllMarkers were used to identify all differentially expressed markers between clusters. Annotated clusters were refined based on those unique markers. Differentially expressed genes (DEGs) in neurons between Gabbr1 control and cKO were identified by identified by FindMarkers using default settings. 2021 KEGG mouse pathway analysis of DEGs were performed using enrichR 45. Single cell RNA-Seq data can be found at the NIH GEO database (GSE231800).
Mathematical dissection of infiltration and proliferation
To understand the dynamics of the glioma tumor cells we estimated two quantities namely infiltration width (IW) and tumor mass (TM) within each condition (CNO, Saline and Control) at the p30 time point. Images were taken at tumor core, contralateral infiltration, and midline points. Piecewise-cubic splines are used for interpolating and smoothing the data points. Using these smoothed values, within each condition the 80% (0.8 pmax) and 2% (0.02 pmax) glioma cell density of the maximum smoothed cellular density (pmax ) was estimated. IW was defined by the difference between distance to the tumor origin at which glioma cell density is in 0.8 pmax and 0.02 pmax 27,41. TM was estimated using the areas under the smoothed curve.
Spatial Transcriptomics
GeoMx Digital Spatial Profiling (DSP) was performed through Nanostring. FFPE samples were sliced at 5μm thickness and stained for Vimentin (Santa Cruz - sc-373717), GFAP (Thermo - 53-9892-82), and Iba1 (Millipore - MABN92-AF647). Tumor cells were identified by co-expression of Vimentin and GFAP and no Iba1 expression. Adjacent sections were also stained for GFP (GeneTex - GTX113617) to confirm the presence of tumor. Next-generation sequencing was performed at Nanostring and data generated using established methods26. Data were subsequently analyzed using EnrichR v3.1), ssGSEA (v2.0), and AUCell (v3.14) and heatmaps generated in RStudio using pheatmap (v1.0.12).
Barcode Screen
Barcoded axon guidance genes of interest were generated as previously described27. The list of these genes can be found in Supplementary Table 3. Pooled injections were performed as previously described 3,7. Mice were euthanized at 90 days after demonstrating symptoms and tumor was isolated with fluorescence assisted microdissection of tumor as described above. Tumor from primary tumor sites and contralateral tumor sites was isolated and sequenced separately. Samples were prepared in biological and technical replicates (n = 4 biological replicates, n = 2 technical replicates) and compared to library input control (n = 2 technical replicates) to calculate fold change. Barcode libraries were prepared as previously reported 3,7. Barcode read representation was calculated by quantifying the reads of each barcode divided by total barcode reads per sample. Barcode enrichment was calculated as fold change value relative to the library input control. Standard error of this fold change was calculated and plotted on the barcode enrichment graphs. A control average and standard error was calculated between mCherry-barcode constructs included in the library. These were used as a cutoff for significance and are plotted as red lines on the barcode enrichment graphs.
In vivo functionalization – Individual ORFs
In vivo functionalization of EPHA6, EPHA7 and SEMA4F was performed by coelectroporating a pBCAG construct containing orfs for each respective gene (EPHA6 – NM_173655, EPHA7 - NM_004440, SEMA4F - NM_004263) at 1.0 μg per μL final concentration in the established IUE cocktail. Loss of function studies were performed by co-electroporating a CRISPR construct containing guides targeting each respective gene.
The gRNA sequences were as follows: EPHA6 – 5’ GACAGGGTATGAAGAATCGA 3’, EPHA7 – 5’GCACCTGGTATGTTCGTATCG3’, SEMA4F-5’ GACTACCTGTCATGGACAACG 3’. On and off target analysis was performed using Surveyor® Mutation Detection Kit (Integrated DNA Technologies; 706025) following manufacturer’s protocol. Western blots to confirm manipulations of tumors were performed using the following primary antibodies: EPHA6, 1:100 – Abcam: ab80207; EPHA7, Abcam: ab136095 1:500; SEMA4F 1:500 – LSBio: LS-C497142; Actin 1:500 – GeneTex: GTX629630. We used species specific secondary HRP conjugated antibodies from Jackson ImmunoResearch Labs to visualize western tagged blots (Peroxidase Affinipure Goat-antirabbit 1:10,000 AB_2313567, Peroxidase Affinipure Goat-antimouse 1:10000 AB_10015289)
Confocal Imaging
Tiling images were generated on a Zeiss LSM 880 laser scanning confocal microscope at 10X magnification. Coronal sections were scanned and tiled using Zeiss Zen Blue Edition software. Synaptic staining was imaged using a Zeiss LSM 880 laser scanning confocal microscope with 63X oil immersion. Colocalization of signal was analyzed using Synapse Counter (SynPuCo) in ImageJ/Fiji (https://github.com/SynPuCo/SynapseCounter)
EEG methods
Similar to previous studies 3,7 IUE mice at P40 were anesthetized with isoflurane vaporization pump and surgically implanted with bilateral silver wire electrodes (0.005-in. diameter) attached to a microminiature connector. Electrodes were placed bilaterally through burr holes subdurally in the frontal and parietal lobes with two grounds placed in the cerebellum. Mice were recorded for 48 hours continuously every 7 days starting at post-natal day 50. EEG signals were filtered and analyzed in LabChart Pro 8 (ADI Instruments). EEG signals were filtered with a 1-50Hz band-pass filter and interictal spikes were quantified using the Peak Analysis tool in LabChart Pro and standardized per hour of recording.
PDX methods
Patient-derived primary GBM cell lines were maintained in neurosphere media (DMEM/F12 (ThermoFisher, 11320082), supplemented with B27 (1X, ThermoFisher, 17504001), bFGF (20ng/mL, Peprotech, 100–18B), and EGF (20ng/mL, Peprotech, 100–47)). Cells were lentivirally infected with Sema4F overexpression, GFP control, shRNA constructs or shScramble control. After 48 hours infection, cells were selected for by puromycin (1μg/mL, ThermoFisher, A1113803). 50,000 live cells were stereotaxically transplanted into 6 week old female nude mouse (Taconic,CrTac:NCr-Foxn1nu) brains (from bregma, cells were injected 1.0mm caudal, 2.0mm lateral, 2.5mm ventral).
Human Cell line generation
Human glioma cell lines used for these studies are a gift from Dr. Fredrick Lang and are previously described 3, 46. The cell line used in this study (GSC 8-11) was validated using RNA-Seq, MGMT methylation status, and targeted sequencing of key tumor suppressors and oncogenes 46. This line is of the proneural subtype and contains mutations in PTEN, coupled with amplification of EGFR. Sema4F GOF/LOF cell lines were generated using infection with lentivirus generated as previously described 3,46. shRNAi constructs were acquired from OriGene (TL309556). Over expression constructs were generated via gateway cloning into pLenti-GTWY-ires-Puro constructs. Cells were lentivirally infected and were selected with puromycin (1ug/mL ThermoFisher, A1113803) after 48 hours. Expression was validated via qPCR (Extended Data Figure 5d). RNA was isolated via RNeasy Plus Mini Kit (Qiagen, 74134). For RT-qPCR, 500 ng of RNA was converted to complementary DNA (cDNA) using iScript Reverse Transcriptase Supermix. (BioRad, 1708841). RT-qPCR was performed using PerfeCTa SYBR Green Fast Mix (Quantabio, 95072-012) on a Roche Light Cycler 480 instrument. Reactions were set up using 2 ng cDNA, 250 nM primers, and 1× SYBR mix. qPCR was carried out at 95 °C for 30 s, 40 cycles of 95 °C for 5 s and 60 °C for 30 s, with subsequent melting curve analysis. The expression of transcripts of target genes was normalized to Gapdh. Primers for qPCR were: Sema4F-CDS-F (CAGACCTGGAGAGTGCATCA), Sema4F-CDS-R (GCCACGACTCTGAGATAGGC), Gapdh-CTL-F (ACAACTTTGGTATCGTGGAAGG), Gapdh-CTL-R (GCCATCACGCCACAGTTTC).
Human cell line RNA-Seq
Cell lines were generated as described above. Cell pellets were collected and RNA was isolated using the RNeasy Plus Mini Kit (Qiagen, 74134) according to the manufacturer’s protocol. Samples were prepared in biological replicates, N = 3 for each experimental group. RNA integrity (RIN ≥ 8.0) was confirmed using the High Sensitivity RNA Analysis Kit (AATI, DNF-472–0500) on a 12-Capillary Fragment Analyzer. Illumina sequencing libraries with 6-bp single indices were constructed from 1 μg total RNA using the TruSeq Stranded mRNA LT kit (Illumina, RS-122–2101). The resulting library was validated using the Standard Sensitivity NGS Fragment Analysis Kit (AATI, DNF-473–0500) on a 12Capillary Fragment Analyzer. Equal concentrations (2nM) of libraries were pooled and subjected to sequencing of approximately 10-20 million reads per sample using the Mid Output v2 kit (Illumina, FC-404–2001) on a Illumina NextSeq550 following the manufacturer’s instructions. Samples were mapped and analyzed using STAR (v.2.5.0a), GenomicAlignments (v1.26.0), and DeSeq2 (v1.30.1)
In vitro spheroid proliferation and infiltration
For the cell invasion assay, differences in the cell invasive potential were assessed using the CytoSelect Cell Invasion Assay (Cell Biolabs, USA) according to the manufacturer’s protocol with some modifications. 1.0x 10⁵ cells of each line were seeded in DMEM-F12 + 1% P/S into the basement membrane inserts. Inserts were placed in wells with DMEM + 10% FBS + 1% P/S. After 48 hours, invading cells were centrifuged, resuspended in 10uL PBS and counted by automated cell-counter (Bio-Rad).
Three-dimensional (3D) migration and invasion assays
3D migration assays were adapted from methods previously described 28-29, with additional modifications. Briefly, cells were seeded at 103/200ul/well in ULA 96-well round-bottomed plates and incubated for four days at 37°C, 5% CO2, 95% humidity to facilitate spheroid formation. Flat-bottomed 96-well plates (Corning biosciences) were coated with 125μg/ml matrigel in stem-cell media. Once coating was completed, 200μl/well of culture medium containing either growth factor media, ACSF or conditioned media collected from acute cortical slices was added to each well. After removal of 100μl medium from the ULA 96-well round-bottomed plates containing neurospheres of 250-300μm in diameter, the remaining medium including the neurosphere was transferred onto the pre-coated plates (4 replicates). Images were collected using standard exposure and gamma settings starting from time zero, and at 24-hours. The degree of cell spread on the matrix was measured and data plotted as the average area of migration using Image J.
Conditioned media
Mice expressing Thy1::Chr2 (channelrhodopsin-expressing) were used at 4-7 weeks of age. Brief exposure to isoflurane rendered the mice unconscious prior to decapitation. Brains were extracted and placed in an oxygenated sucrose cutting solution and sliced at 350um as described previously5. The slices were placed in ACSF (containing in mM 125 NaCl, 2.5 KCl, 25 glucose, 25 NaHCO3, 1.25 NaH2PO4, 1 MgCl2 and CaCl2) and allowed to recover for 30 minutes at 37°C and 30mins at room temperature. After recovery the slices were moved to fresh ACSF and stimulated using a blue-light LED using a microscope objective. The stimulation paradigm was 20-Hz pulses of blue light for 30 seconds on, 90 seconds off over a period of 30 minutes. The surrounding conditioned medium was collected and used immediately or frozen at -80°C for future use.
Quantification and Statistical Analysis
Sample sizes and statistical tests can be found in figure legends. Analysis was carried out using Fiji, QuPath-0.3.2, Graphpad Prism 9, Excel 2016, and R-studio. For survival data analysis we used log-rank test and measured significance with Chi-Squared test statistic. For infiltration analysis, we performed one-way analysis of variance (ANOVA) with Tukey’s test, or two-way analysis of variance (ANOVA) with Sidak’s test of treatment groups based on infiltration into the cortex. For multiple comparisons, we used the one way ANOVA with Tukey’s test and two-way ANOVA with Sidak’s test. In general, we assumed data were normally distributed but this was not formally tested. Data are presented as mean ± SEM (standard error of the mean). Levels of statistical significance are indicated as follows: * (p < 0.05), ** (p < 0.01), *** (p < 0.001), **** (p < 0.0001).
Extended Data
Extended Data Figure 1. Contralateral activity drives glioma progression and infiltration.
a. Kaplan-Meier survival analysis of RCAS-Ntva tumors treated with saline (medianSaline= 95 days, n = 11) or CNO (medianCNO = 51 days, n = 9) showing significantly faster morbidity in CNO treated RCAS tumors (Log-rank (Mantel-Cox) test, Chisq = 6.456, df = 1, p-value = 0.0111, CNO/Saline HRlog-rank= 2.768, 95% CI = 0.9770 to 7.945). b. H&E staining of RCAS-Ntva tumors samples revealed high grade characteristics in CNO treated tumor groups (red arrows). Ki67 staining proliferation in CNO treated mice versus saline treated mice. Quantification is derived from n=5 mice from CNO (mean = 14.51%, SD = 7.076%) and Saline (mean = 4.017%, SD = 2.179%) groups and determined by Welch’s unpaired t-test (P-value = 0.0276, t = 3.228, df = 4.441). c. Mathematical modeling of glioma infiltration as a function of tumor mass. Blue line is the smoothed data points using piecewise-cubic splines; red horizontal dashed lines are the 0.8 pmax and 0.02 pmax glioma cell density of the maximum smoothed cellular density (pmax ). Red vertical lines are the intersecting distance points of the red horizontal lines with smoothed blue line, which is used in calculating infiltrating width (IW). Black arrow shows the IW. Log-log plot shows the dependence of IW and tumor mass (TM). Analysis was performed at the p30 timepoint on CTL n = 3, Saline n = 3, CNO n = 3; samples from individual biological replicates are color coded. d. Glioma 3D spheroid migration assay, measuring glioma infiltration after treatment with growth factor media, conditioned media (CM) from spontaneously active cortical explants, spontaneously active cortical explants silenced with TTX (10μm) or optogenetically stimulated cortical explants (channelrhodopsin-2 (ChR2)-expressing deep layer cortical projection neurons), in comparison to ACSF control. Data are plotted as median (center line), IQR (box limits) and minimum and maximum values (whiskers) (b).
Extended Data Figure 2. Contralateral cortical stimulation accelerates tumor progression.
a. Schematic depicting injection of AAV into the contralateral cortex. b. Electrophysiology measuring neural activity in response to CNO treatment on mouse brain sections to confirm DREADD activity. c. Schematic of intra-uterine electroporation (IUE) model of high-grade glioma (HGG). Representative images of tumor brains from 20 day old mice versus 60 days old. Tumor brain slices were stained with Hoechst, and native GFP fluorescence was utilized to visualize tumor. Time course of contralateral cortical infiltration. Log-regression of 3xCr tumors demonstrated that infiltration correlates strongly with time (two-sided log-regression, Chi-square = 23.38, df = 1, p-value <0.0001, n30 =22, n50=19, n70=21, n90=10). 72 IUE-HGG bearing mice were generated from 10 separate litters of mice and sampled across P30, P50, P70, P90 to ensure accurate representation of infiltration. d. Representative images of infiltrating tumor across the midline at each respective timepoint. e. Representative Ki67 staining of CNO-treated versus Saline-treated versus untreated IUE-HGG sections taken from P30 tumor brains. f. Representative Ki67 staining of CNO-only control, without hM3Dq, Saline, and IUE-HGG sections taken from P30 tumor brains, g-h. Representative images of infiltrating tumor across the midline at each respective timepoint from the CNO-only control experiments (g) and saline only control (h). Tumor sections were imaged and quantified for each condition from at least five mice to ensure reproducibility (d-h).
Extended Data Figure 3. Ipsilateral stimulation does not promote early tumor progression.
a. Representative Ki67 staining of CNO versus Saline versus untreated IUE-HGG sections taken from P30 tumor brains after ipsilateral stimulation. b. Representative images of corpus callosum cut tumors stained for Ki67 (quantification in main figure). Tumor samples were prepared as described above, using native GFP to image tumor. c. Representative images of Rasgrf2-dCre tumors stained for Ki67 (quantification in main figure). Tumor samples were prepared as described above, using native GFP to image tumor). Tumor sections were imaged and quantified for each condition from at least five mice to ensure reproducibility (a-c).
Extended Data Figure 4. Activation of contralateral inhibitory neurons does not promote tumor progression.
a. Representative image of Rosa-LSL-TdTom + Rasgrf2-dCre mouse brain harvested 2 days post Trimethoprim treatment. Cells from layer 2/3 of the cortex show TdTom labelling. b. Representative images from IUE-HGG tumors at P30 demonstrating infiltration and Ki67 expression after activation of inhibitory neurons with AAV-Dlx5/6-hM3Dq in the cortex contralateral. c. Quantification of tumor infiltration and Ki67 expression at P30. Infiltration analyzed one-way ANOVA. Data derived from 3xCr CTL (n=7), 3xCr + DLX-hM3Dq-mCh + Saline (n=6), 3xCr + DLX-hM3Dq-mCh + CNO (n=7) tumors with 18 coronal slices analyzed per tumor. Coronal sections with infiltrating tumor showed no difference in proliferation compared to saline treated (p-value = 0.1823) or control tumors (p-value = 0.5328) or infiltration at P30 compared to Saline (p-value = 0.8880) or control tumors (p-value = 0.9981). d. Stacked bar chart of SingleR labeled populations percent representation in CNO and Saline single cell sequencing datasets. e. Feature plot of cluster of interest marker genes. Color represents a score assigned based on overall expression of marker genes. Seurat’s AddModuleScore function was used to calculate these scores. Red Arrow denotes population of interest featured in Fig. 3B. f. GO terms of genes enriched in the spatial transcriptomics analysis of the leading edge of P50 mouse tumors (R6-R8), (Cutoff for DEG via DESeq2, with p-value < 0.05). Data are plotted as median (center line), IQR (box limits) and minimum and maximum values (whiskers) (c).
Extended Data Figure 5. Expression characteristics of EphA6, EphA7, and Sema4F.
a. Heatmap of IVY-GAP expression data of all axon guidance genes included in the bar coded screen described in main figure 4a. b. Heatmap of IVY-GAP expression data for Sema4f, EphA6, EphA7. c. KM curve of GEPIA survival data. GBM patient cohort data were split based on high and low Sema4F expression. d. Western blots of wild type, GOF, and LOF tumors. (pBSema4F is GOF; sgSema4F is LOF). Antibodies and concentrations used are described in methods. Western blots were quantified in ImageJ. Western blots were performed on biological replicates (2 additional tumor sample) to ensure reproducibility.
Extended Data Figure 6. Analysis of EphA6, EphA7, and Sema4F GOF/LOF tumors.
a. Kaplan-Meier survival curve of individual gain-of-function and loss-of-function validation studies for EphA6 and EphA7. EphA6-GOF (medianA6GOF = 105 days, Chisq = 0.7, df=1, p-value =0.4, n=11), EphA6-LOF (medianA6LOF = 133days, Chis =7.2, df=1, p-value=0.007, n = 7), EphA7-GOF (medianA7GOF= 97 days, Chisq=0, df=1 p-value=0.9, n=15), EphA7-LOF (medianA7LOF= 97.5 days, Chisq=1.3, df=1, p-value=0.3). b. Representative immunostainings of EphA6, EphA7, and Sema4F human tumor micro-array. c. Quantification of infiltration from these tumors across the P30-P70 timecourse. Infiltration was quantified based on the presence of tumor cells in contralateral cortex and analyzed via two-way analysis of variance (ANOVA). Error bars represent standard deviation, data derived from EphA6-GOF p30 n=7, EphA6-GOF p50 n=13, EphA6-GOF p70 n=11, EphA6 CTL p30 n=8, EphA6 CTL p50 n=6, EphA6 CTL p70 n=11, EphA6-LOF p30 n=8, EphA6-LOF p50 n=6, EphA6-LOF p70 n=11, EphA7-GOF p30 n=9, EphA7-GOF p50 n=12, EphA7-GOF p70 n=12, EphA7 CTL p30 n=5, EphA7 CTL p50 n=5, EphA7 CTL p70 n=7, EphA7-LOF p30 n=6, EphA7-LOF p50 n=6, EphA7-LOF p70 n=9. d. Quantification of transwell migration of human glioma cell lines; infiltrating cells were counted after 48 hours incubation (n=3 wells per condition). e. Kaplan-Meier survival curve for human glioma cell lines transplanted into mouse brain. Samples were analyzed via log-rank (Mantel-Cox) test. WT median survival=66 days, n=11; GFP median=62 days n=7; Sema4f-GOF median=74 days, n=10, Chi = 0.4120, p-value = 0.5209; shSCR median=69 days, n=9; shSema4F median = undefined after 100 days, n=8, Chi = 14.08 p-value = 0.0002. *P < 0.05, **P < 0.01, ***P < 0.001, **** P < 0.0001, two-way analysis of variance (ANOVA) (c), one-way analysis of variance (ANOVA) (f), Log-rank (Mantel-Cox) test (a,d). Data are plotted as median (center line), IQR (box limits) and minimum and maximum values (whiskers) (c-d).
Extended Data Figure 7. Infiltrating glioma from EphA6 and EphA7 GOF/LOF tumors.
a. Representative images of IUE-HGG GOF/LOF/CTL of EphA6 in P50 mice. Frozen sections were stained with Hoechst and native GFP was assessed for infiltration status into the contralateral cortex. b. Representative images of IUE-HGG GOF/LOF/CTL of Epha7 in P50 mice. Samples assessed as outlined above (EphA6-GOF p50 n=13, EphA6 CTL p50 n=6, EphA6-LOF p50 n=6, EphA7-GOF p50 n=12, EphA7 CTL p50 n=5, EphA7-LOF p50 n=6) (a,b). c. Representative H&E staining of IUE-HGG tumors containing GOF and LOF of EphA6, EphA7, and Sema 4F. All tumors demonstrated high-grade characteristics such as microvascular proliferation or necrosis regardless of GOF or LOF. H&E staining repeated on n=4 tumor samples per condition d. qRT-PCR validation of Sema4F-GOF (S4F-GOF) overexpression and shRNAi knockdown in human glioma cell lines. Data are derived from n=3 biological replicates per condition. Results are plotted as mean +/− SD. Values were analyzed by Brown-Forsythe and Welch two-way ANOVA. S4F-GOF showed significant upregulation compared to uninfected control (**P=0.0082). shS4F #4 showed significant downregulation compared to shScramble cells (*P=0.0167).
Extended Data Figure 8. Representative Ki67 images from Sema4F manipulated tumors.
a. Representative images of Sema4F GOF/LOF and control tumors stained for Ki67 in P30 mice. Tumor samples were using native GFP to image tumor. b. Representative images of Sema4F-LOF and control tumors treated with CNO or Saline and stained for Ki67 in P30 mice. c. Representative images from IUE-HGG tumors at P30 demonstrating the extent of infiltration with Sema4F-ectodomain and Sema4F-ectodomain + Sema4F-LOF. d. Quantification of tumor infiltration and Ki67 expression at P30. Infiltration analyzed one-way ANOVA. Data derived from n=6 CTL, n=7 S4F-Ecto, and n=5 S4F Ecto+LOF tumors, *P=0.0483, **Pinfil=0.0025, **PKi67=0.0023 ****P=<0.0001. e. Representative images of Sema4F-ectodomain and Sema4F-ectodomain + Sema4F-LOF and control tumors stained for Ki67 in 30 day old mice. f. Representative images of infiltrating tumor across the midline from Sema4Fectodomain and Sema4F-ectodomain + Sema4F-LOF tumors in 30 day old mice. Data are plotted as median (center line), IQR (box limits) and minimum and maximum values (whiskers) (d).
Extended Data Figure 9. Single Cell RNA-Seq analysis.
a. Single Cell RNA-Seq DimPlots of P50 IUE-HGG from CNO, Sema4F, and saline controls UMAP plot of full single cell datasets from CNO and Saline treated and Sema4F GOF tumors. Tumors were isolated and sequenced as outlined above. All clusters were represented in all datasets, though their relative abundance varied. b. Single cell RNASeq analysis of from IUE-glioma model, sub-clustering on non-tumor, GFP-negative cells. Red circle denotes neuronal populations, marked by Map2, Tubb3, and Ncam. Note that Plexin B1 and B2 expression is enriched in neuronal populations, denoted by purple dots. c. Volcano plot depicting the differentially expressed genes (DEGs) between human glioma cell lines overexpressing Sema4F (Sema4F-GOF) and controls. For downregulated genes with blue color: padj<0.001 & log2FoldChange<(-0.75); for upregulated genes in red: padj<0.001 & log2FoldChange>0.75) d. GO analysis of DEGs upregulated in the Sema4F-GOF glioma cell lines. DEGs from padj<0.001 & log2FoldChange>0.75)
Extended Data Figure 10. Staining for synaptic markers in mice bearing PDXSema4F-GOF tumors.
a. Antibody staining of inhibitory synapses (VGAT-Gephryin) and b. excitatory (Vglut2PSD95) synapse from P50 mouse brains at peritumoral margins from PDX tumors ovexpressing Sema4F and control. Box denotes zoomed in region in adjacent panel (20X, 63X, and 200X magnification left to right; scale bar left to right: 50 um, 20 um and 10 um). Quantification of synaptic staining via unpaired two-tailed t-test is derived from PDX-Con n=3 and PDX-S4F-GOF n=3, utilizing a total of 13 fields of view from these sections for each experimental condition, (***P=0.0001, ****P<0.0001), data are presented as mean values +/− SE.
Supplementary Material
Acknowledgements
This work was supported by US National Institutes of Health grants NS124093, NS071153, and CA223388 to BD. This work was also supported by the National Cancer Institute-Cancer Target Discovery and Development, U01-CA217842 to BD. In addition, F31-CA243382 to E.H.H, 1F31CA265156 to RNC, T32- 5T32HL092332-19 to BL, and and NIH Director’s Pioneer Award DP1NS111132 to M.M. We are thankful for support from the David and Eula Wintermann Foundation. scRNA-Seq studies were performed at the Single Cell Genomics Core at BCM partially supported by NIH shared instrument grants (S10OD023469, S10OD025240) and P30EY002520. Human tumor tissue samples were obtained from the Dan L. Duncan Cancer Center Pathology and Histology Core (HTAP) core at Baylor College of Medicine (IRB#: H-35355), supported by P30 Cancer Center Support Grant (NCI-CA125123). We would like to acknowledge the Optogenetics and Viral Vectors Core at the Jan and Dan Duncan Neurological Research Institute. Research reported in this publication was supported by the Eunice Kennedy Shriver National Institute of Child Health & Human Development of the National Institutes of Health under Award Number P50HD103555 for use of the Microscopy Core facilities and the Animal Phenotyping & Preclinical Endpoints Core facilities. Images in schematics were created using Biorender.com.
Footnotes
Competing interests
The authors declare no competing interests.
Reporting summary
Further information on research design is available in the Nature Research Reporting Summary linked to this paper.
Data availability
Single cell RNA-Seq and bulk RNA-sequencing data from activity-driven tumors and Sema-4F GOF tumors has been deposited in the NCBI Gene Expression Omnibus (GEO) under accession number GSE231800. All other data in this article are available from the corresponding author upon reasonable request.
Code availability
No custom code was used in this study. The R package limma eBayes function was used to define DEGs. The Bioconductor SVA/Combat package was used for batch correction.
References
- 1.Monje M Synaptic Communication in Brain Cancer. Cancer Res. 80, 2979–2982 (2020). [DOI] [PMC free article] [PubMed] [Google Scholar]
- 2.Winkler F et al. Cancer neuroscience: State of the field, emerging directions. Cell 186, 1689–1707 (2023). [DOI] [PMC free article] [PubMed] [Google Scholar]
- 3.Yu K et al. PIK3CA variants selectively initiate brain hyperactivity during gliomagenesis. Nature 578, 166–171 (2020). [DOI] [PMC free article] [PubMed] [Google Scholar]
- 4.Venkatesh HS et al. Electrical and synaptic integration of glioma into neural circuits. Nature 573, 539–545 (2019). [DOI] [PMC free article] [PubMed] [Google Scholar]
- 5.Venkatesh HS et al. Neuronal Activity Promotes Glioma Growth through Neuroligin-3 Secretion. Cell 161, 803–816 (2015). [DOI] [PMC free article] [PubMed] [Google Scholar]
- 6.Pan Y et al. NF1 mutation drives neuronal activity-dependent initiation of optic glioma. Nature 594, 277–282 (2021). [DOI] [PMC free article] [PubMed] [Google Scholar]
- 7.Curry RN et al. Glioma epileptiform activity and progression are driven by IGSF3-mediated potassium dysregulation. Neuron 111, 682–695.e9 (2023). [DOI] [PMC free article] [PubMed] [Google Scholar]
- 8.Krishna S et al. Glioblastoma remodelling of human neural circuits decreases survival. Nature (2023) doi: 10.1038/s41586-023-06036-1. [DOI] [PMC free article] [PubMed] [Google Scholar]
- 9.Louis DN et al. The 2021 WHO Classification of Tumors of the Central Nervous System: a summary. Neuro. Oncol 23, 1231–1251 (2021). [DOI] [PMC free article] [PubMed] [Google Scholar]
- 10.Omuro A & LM D Glioblastoma and other malignant gliomas: A clinical review. JAMA 310, 1842–1850 (2013). [DOI] [PubMed] [Google Scholar]
- 11.Weller M et al. Glioma. Nat. Rev. Dis. Prim 1, 15017 (2015). [DOI] [PubMed] [Google Scholar]
- 12.Konishi Y, Muragaki Y, Iseki H, Mitsuhashi N & Okada Y Patterns of Intracranial Glioblastoma Recurrence After Aggressive Surgical Resection and Adjuvant Management: Retrospective Analysis of 43 Cases. Neurol. Med. Chir. (Tokyo) 52, 577–586 (2012). [DOI] [PubMed] [Google Scholar]
- 13.Milano MT et al. Patterns and Timing of Recurrence After Temozolomide-Based Chemoradiation for Glioblastoma. Int. J. Radiat. Oncol 78, 1147–1155 (2010). [DOI] [PubMed] [Google Scholar]
- 14.McDonald MW, Shu H-KG, Curran WJ & Crocker IR Pattern of Failure After Limited Margin Radiotherapy and Temozolomide for Glioblastoma. Int. J. Radiat. Oncol 79, 130–136 (2011). [DOI] [PubMed] [Google Scholar]
- 15.Vollmann-Zwerenz A, Leidgens V, Feliciello G, Klein CA & Hau P Tumor Cell Invasion in Glioblastoma. Int. J. Mol. Sci 21, 1932 (2020). [DOI] [PMC free article] [PubMed] [Google Scholar]
- 16.Vitorino P & Meyer T Modular control of endothelial sheet migration. Genes Dev. 22, 3268–3281 (2008). [DOI] [PMC free article] [PubMed] [Google Scholar]
- 17.Cuddapah VA, Robel S, Watkins S & Sontheimer H A neurocentric perspective on glioma invasion. Nat Rev Neurosci 15, 455–465 (2014). [DOI] [PMC free article] [PubMed] [Google Scholar]
- 18.Numan T et al. Non-invasively measured brain activity and radiological progression in diffuse glioma. Sci. Rep 11, 18990 (2021). [DOI] [PMC free article] [PubMed] [Google Scholar]
- 19.Robert SM et al. SLC7A11 expression is associated with seizures and predicts poor survival in patients with malignant glioma. Sci. Transl. Med 7, 289ra86 (2015). [DOI] [PMC free article] [PubMed] [Google Scholar]
- 20.Buckingham SC et al. Glutamate release by primary brain tumors induces epileptic activity. Nat. Med 17, 1269–1274 (2011). [DOI] [PMC free article] [PubMed] [Google Scholar]
- 21.Chen P et al. Olfactory sensory experience regulates gliomagenesis via neuronal IGF1. Nature 606, 550–556 (2022). [DOI] [PubMed] [Google Scholar]
- 22.Venkataramani V et al. Glutamatergic synaptic input to glioma cells drives brain tumour progression. Nature 573, 532–538 (2019). [DOI] [PubMed] [Google Scholar]
- 23.Venkataramani V et al. Glioblastoma hijacks neuronal mechanisms for brain invasion. Cell 185, 2899–2917.e31 (2022). [DOI] [PubMed] [Google Scholar]
- 24.Venkatesh HS et al. Targeting neuronal activity-regulated neuroligin-3 dependency in high-grade glioma. Nature 549, 533–537 (2017). [DOI] [PMC free article] [PubMed] [Google Scholar]
- 25.Doucette T et al. Bcl-2 promotes malignant progression in a PDGF-B-dependent murine model of oligodendroglioma. Int. J. cancer 129, 2093–2103 (2011). [DOI] [PMC free article] [PubMed] [Google Scholar]
- 26.Holland EC & Varmus HE Basic fibroblast growth factor induces cell migration and proliferation after glia-specific gene transfer in mice. Proc. Natl. Acad. Sci. U. S. A 95, 1218–1223 (1998). [DOI] [PMC free article] [PubMed] [Google Scholar]
- 27.Meaney C, Das S, Colak E & Kohandel M Deep learning characterization of brain tumours with diffusion weighted imaging. J. Theor. Biol 557, 111342 (2023). [DOI] [PubMed] [Google Scholar]
- 28.Nagaraja S et al. Transcriptional Dependencies in Diffuse Intrinsic Pontine Glioma. Cancer Cell 31, 635–652.e6 (2017). [DOI] [PMC free article] [PubMed] [Google Scholar]
- 29.Vinci M, Box C, Zimmermann M & Eccles SA Tumor spheroid-based migration assays for evaluation of therapeutic agents. Methods Mol. Biol 986, 253–266 (2013). [DOI] [PubMed] [Google Scholar]
- 30.Fame RM, MacDonald JL & Macklis JD Development, specification, and diversity of callosal projection neurons. Trends Neurosci. 34, 41–50 (2011). [DOI] [PMC free article] [PubMed] [Google Scholar]
- 31.Harris JA et al. Anatomical characterization of Cre driver mice for neural circuit mapping and manipulation. Front. Neural Circuits 8, 76 (2014). [DOI] [PMC free article] [PubMed] [Google Scholar]
- 32.Puchalski RB et al. An anatomic transcriptional atlas of human glioblastoma. Science (80-. ). 360, 660–663 (2018). [DOI] [PMC free article] [PubMed] [Google Scholar]
- 33.McDermott JE, Goldblatt D & Paradis S Class 4 Semaphorins and Plexin-B receptors regulate GABAergic and glutamatergic synapse development in the mammalian hippocampus. Mol. Cell. Neurosci 92, 50–66 (2018). [DOI] [PMC free article] [PubMed] [Google Scholar]
- 34.Ayala GE et al. Cancer-Related Axonogenesis and Neurogenesis in Prostate Cancer. Clin. Cancer Res 14, 7593–7603 (2008). [DOI] [PubMed] [Google Scholar]
- 35.Li J, Kang R & Tang D Cellular and molecular mechanisms of perineural invasion of pancreatic ductal adenocarcinoma. Cancer Commun. 41, 642–660 (2021). [DOI] [PMC free article] [PubMed] [Google Scholar]
- 36.Claire M et al. Autonomic Nerve Development Contributes to Prostate Cancer Progression. Science (80-. ). 341, 1236361 (2013). [DOI] [PubMed] [Google Scholar]
- 37.Hatcher A et al. Pathogenesis of peritumoral hyperexcitability in an immunocompetent CRISPR-based glioblastoma model. J. Clin. Invest 130, 2286–2300 (2020). [DOI] [PMC free article] [PubMed] [Google Scholar]
- 38.Rasband MN & Peles E Mechanisms of node of Ranvier assembly. Nat. Rev. Neurosci 22, 7–20 (2021). [DOI] [PubMed] [Google Scholar]
- 39.Brandalise F et al. Deeper and Deeper on the Role of BK and Kir4.1 Channels in Glioblastoma Invasiveness: A Novel Summative Mechanism? . Frontiers in Neuroscience vol. 14 at (2020). [DOI] [PMC free article] [PubMed] [Google Scholar]
- 40.Seker-Polat F, Pinarbasi Degirmenci N, Solaroglu I & Bagci-Onder T Tumor Cell Infiltration into the Brain in Glioblastoma: From Mechanisms to Clinical Perspectives. Cancers (Basel). 14, 443 (2022). [DOI] [PMC free article] [PubMed] [Google Scholar]
- 41.Mascheroni P et al. On the Impact of Chemo-Mechanically Induced Phenotypic Transitions in Gliomas. Cancers vol. 11 at 10.3390/cancers11050716 (2019). [DOI] [PMC free article] [PubMed] [Google Scholar]
- 42.Hao Y et al. Integrated analysis of multimodal single-cell data. Cell 184, 3573–3587 (2021). [DOI] [PMC free article] [PubMed] [Google Scholar]
- 43.McGinnis CS, Murrow LM & Gartner ZJ DoubletFinder: Doublet Detection in Single-Cell RNA Sequencing Data Using Artificial Nearest Neighbors. Cell Syst 8, 329–337.e4 (2019). [DOI] [PMC free article] [PubMed] [Google Scholar]
- 44.Ximerakis M et al. Single-cell transcriptomic profiling of the aging mouse brain. Nat Neurosci 22, 1696–1708 (2019). [DOI] [PubMed] [Google Scholar]
- 45.Kuleshov MV et al. Enrichr: a comprehensive gene set enrichment analysis web server 2016 update. Nucleic Acids Res 44, W90–W97 (2016). [DOI] [PMC free article] [PubMed] [Google Scholar]
- 46.Lang FM et al. Mesenchymal stem cells as natural biofactories for exosomes carrying miR-124a in the treatment of gliomas. Neuro-oncol. 20, 380–390 (2018 [DOI] [PMC free article] [PubMed] [Google Scholar]
Associated Data
This section collects any data citations, data availability statements, or supplementary materials included in this article.
Supplementary Materials
Data Availability Statement
Single cell RNA-Seq and bulk RNA-sequencing data from activity-driven tumors and Sema-4F GOF tumors has been deposited in the NCBI Gene Expression Omnibus (GEO) under accession number GSE231800. All other data in this article are available from the corresponding author upon reasonable request.
No custom code was used in this study. The R package limma eBayes function was used to define DEGs. The Bioconductor SVA/Combat package was used for batch correction.


