Abstract
Adeno-associated virus type 2 empty capsids are composed of three proteins, VP1, VP2 and VP3, which have relative molecular masses of 87, 72 and 62 kDa, respectively, and differ in their N-terminal amino acid sequences. They have a likely molar ratio of 1:1:8 and occupy symmetrical equivalent positions in an icosahedrally arranged protein shell. We have investigated empty capsids of adeno-associated virus type 2 by electron cryo-microscopy and icosahedral image reconstruction. The three-dimensional map at 1.05 nm resolution showed sets of three elongated spikes surrounding the three-fold symmetry axes and narrow empty channels at the five-fold axes. The inside of the capsid superimposed with the previously determined structure of the canine parvovirus (Q. Xie and M.S. Chapman, 1996, J. Mol. Biol., 264, 497–520), whereas the outer surface showed clear discrepancies. Globular structures at the inner surface of the capsid at the two-fold symmetry axes were identified as possible positions for the N-terminal extensions of VP1 and VP2.
INTRODUCTION
Adeno-associated virus type 2 (AAV2) is a human parvovirus that depends on co-infection with helper viruses such as adenovirus or herpes virus for efficient reproduction. Its single-stranded DNA genome of 4.7 kb contains two large open reading frames (ORFs), rep and cap (Srivastava et al., 1983). The cap ORF codes for the three structural proteins VP1, VP2 and VP3 that are made from the P40 promoter by the use of alternative splicing or alternative start codons. The three capsid proteins have relative molecular masses of 87, 72 and 62 kDa, respectively, with a common C-terminal region. VP1, VP2 and VP3 have a likely molar ratio of 1:1:8 (Johnson et al., 1971; Salo and Mayor, 1977) and form icosahedral shells with T = 1 structural organization in which they occupy symmetrically equivalent positions.
Vectors for human gene therapy derived from the adeno-associated virus have attracted much interest because of their ability to maintain long-term expression, their low toxicity, and their physical stability that allows large-scale production and in vivo application (Samulski et al., 1999). For targeting AAV vectors to cell type specific receptors by genetic modification of the capsid (Girod et al., 1999; Wu et al., 2000), information about the three-dimensional structure of AAV2 would be very useful. In the past, capsids of various parvoviruses have been investigated by X-ray crystallography (Agbandje et al., 1994; Xie and Chapman, 1996; Agbandje-McKenna et al., 1998; Simpson et al., 1998, 2000) or electron cryo-microscopy (Chipman et al., 1996; McKenna, 1999). So far, all capsids show a similar arrangement at their inner surfaces, but variability in the organization of the outer surface. Although in none of these structures is the N-terminal region completely resolved, there is evidence in some parvoviruses [B19, Agbandje et al., 1994; minute virus of mice (MVM), Agbandje-McKenna et al., 1998; and canine parvovirus (CPV), Xie and Chapman, 1996] that the N-terminal regions of some of the capsid proteins have traversed through narrow channels at the five-fold symmetry axes from the inside of the capsids to the outside.
We have investigated the empty capsids of AAV2 by electron cryo-microscopy and icosahedral image reconstruction. Since the icosahedral symmetry was used in the image reconstruction, it was impossible to identify directly the N-terminal extensions of VP1 and VP2. However, the high quality of electron microscopic data particularly in the low resolution range facilitates the detection of variable areas that often cannot be detected by X-ray crystallography. We present here a three-dimensional map of the empty capsids at 1.05 nm resolution, which shows ‘fuzzy’ regions at the inner surface of the capsid at the two-fold symmetry axes and empty channels at the five-fold symmetry axes. We attribute the fuzzy areas to the variable N-terminal regions of the capsid proteins.
RESULTS
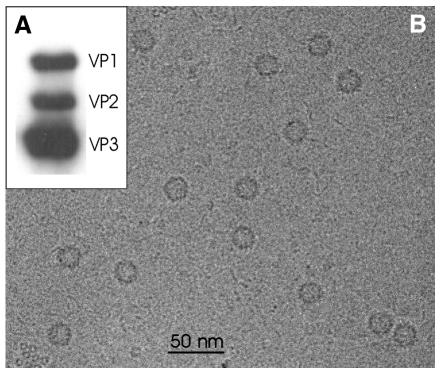
Empty AAV2 capsids have been produced in 293T cells using a recombinant adenovirus that expresses all three capsid proteins VP1, VP2 and VP3 in the expected ratio of approximately 1:1:8 as shown in Figure 1A. The appearance of empty AAV2 particles when imaged in a frozen hydrated but unstained state is shown in Figure 1B. The particles spread uniformly on the carbon support film and appeared as darker rings.
Fig. 1. (A) Western blot analysis of empty capsids. VP1, VP2 and VP3 were detected using a monoclonal antibody that recognizes all three capsid proteins. (B) Micrograph of unstained AAV2. The micrograph was recorded on a Philips CM 120 Biotwin at a nominal magnification of 52 000 with a defocus of 1900 nm. Particles appear as darker rings.
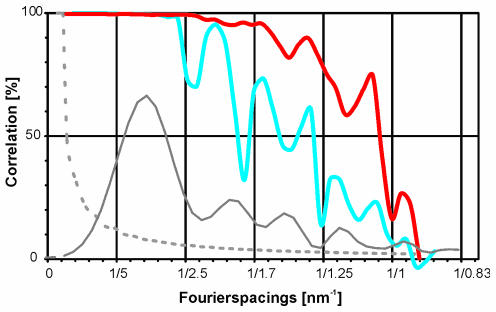
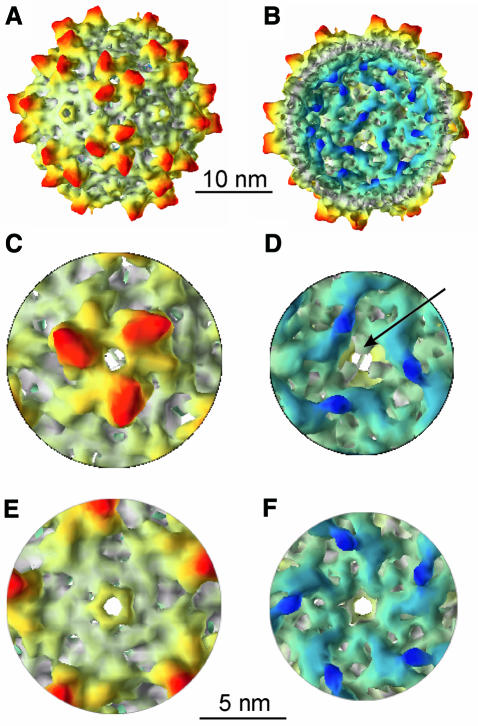
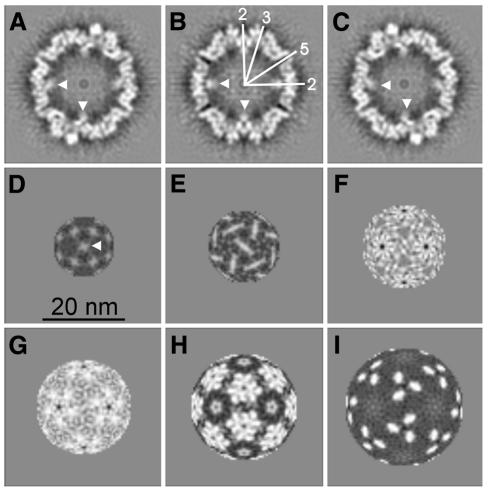
We have calculated a three-dimensional map from 1800 individual images of empty capsids from 10 different micrographs. Fourier shell correlation coefficients indicated that the map was reliable to spacing of at least 1.05 nm (see Methods; Figure 5). The map showed that the capsid had a T = 1 structural organization with a strongly modulated surface (Figure 2). The most prominent features were sets of three elongated spikes surrounding apparent holes at each of the three-fold symmetry axes. The spikes extended by ∼2 nm from the continuous protein shell and are seen in cross section in spherical slices of the capsid (Figure 3I) at an outer radius of 13.2 nm. At this radius the spikes were the only protein density present. Further inwards, at a radius of 11.9 nm (Figure 3H), the sets of three spikes were interlaced with three smaller protrusions. This assembly showed an almost hexagonal cross section in spherical slices (Figure 3H). Inside the continuous protein shell at a radius of 10.6 nm the apparent holes at the three-fold symmetry axes were almost completely closed (Figure 3G) by three protrusions at the inner surface of the capsid (Figure 2D, arrow). Although these protrusions appeared rather small in the surface representation (Figure 2D), it became apparent in the spherical slices (Figure 3G) that they touched each other at the three-fold symmetry axes.
Fig. 5. Assessment of the effective resolution of the map. The Fourier shell correlation coefficient is plotted against Fourier spacing for the map corrected for the contrast transfer function including the envelope function Ks (red trace) and ignoring the envelope function Ks (blue trace). The average values of the squares of the contrast transfer functions (including Ks) for all 10 micrographs are shown as grey, solid trace. The significance level 3σ for the Fourier shell correlation coefficient is plotted as a dotted grey line.
Fig. 2. Surface representations of half of the three-dimensional map of AAV2. (A), (C) and (E) show views of the outer surface of the capsid, (B), (D) and (F) the inner surface. The surface map is colour coded in such a way that features at higher radii are shown in red whereas features at lower radii appear blue. In (A) and (B) the map is viewed down a strict two-fold symmetry axis. (C) and (D) show views down the three-fold symmetry axis and (E) and (F) down the five-fold symmetry axis. The arrow in (D) marks one of the three protrusions that block the hole at the three-fold axes.
Fig. 3. Various slices through the three-dimensional map. (A–C) Orthogonal slices through the three-dimensional map, which are 0.44 nm apart. (B) Represents an equatorial slice. The symmetry axes are indicated in white in one quadrant of the map. (D–I) Spherical slices spaced by 1.32 nm, starting at an inner radius of 6.6 nm. Some of the fuzzy globules at the two-fold symmetry axes are indicated by arrowheads.
At the two-fold symmetry axes, small bridges connected the neighbouring spike-like assemblies at the outer surface of the capsid (Figures 2A and 3G) and elongated smooth lumps (Figure 2B, D and F) lined the interior of the capsid. These lumps joined neighbouring spike assemblies across the two-fold symmetry axes at a radius of 7.9 nm (Figure 3E). Exactly at the two-fold axes, globules (Figure 2B, dark blue globules) were attached to these lumps and extended furthest inwards (Figure 3D). Compared with the remaining protein density they were weaker and had fuzzy edges (Figure 3A–D) that gradually merged with the background.
The five-fold symmetry axes were surrounded by small rims that stuck out of the surrounding flat protein surface by ∼1.2 nm. These rims encircled empty channels, which connected the interior of the capsid to the outside (Figure 3B). The diameter of the channels was smallest at the outer surface (diameter of the hole ∼0.8 nm) and opened towards the interior (diameter of the hole 1.6 nm).
DISCUSSION
Image reconstruction as described here does not allow the determination of the absolute hand of a three-dimensional map. Therefore, we have compared our map to high-resolution models of other parvoviruses (CPV, Xie and Chapman, 1996; FPV, Simpson et al., 2000; MVM, Agbandje-McKenna et al., 1998) and chosen the hand in such a way that the interior of the capsid agreed best with the atomic models. Although the inner surfaces of the capsids of CPV, FPV and MVM were similar to AAV2, the outer surface differed significantly in the spike region around the three-fold symmetry axes. According to mutational analysis of AAV2 capsid proteins (Rabinowitz et al., 1999; Wu et al., 2000) and comparison to the sequence and structure of CPV-VP2 (Chapman and Rossmann, 1993), this region is involved in binding of heparan, the cellular receptor for AAV2 (Summerford and Samulski, 1998). In B19 the spike region is also identified to bind the cellular receptor (Chipman et al., 1996). Therefore, adaptation in this area might rule host specificity.
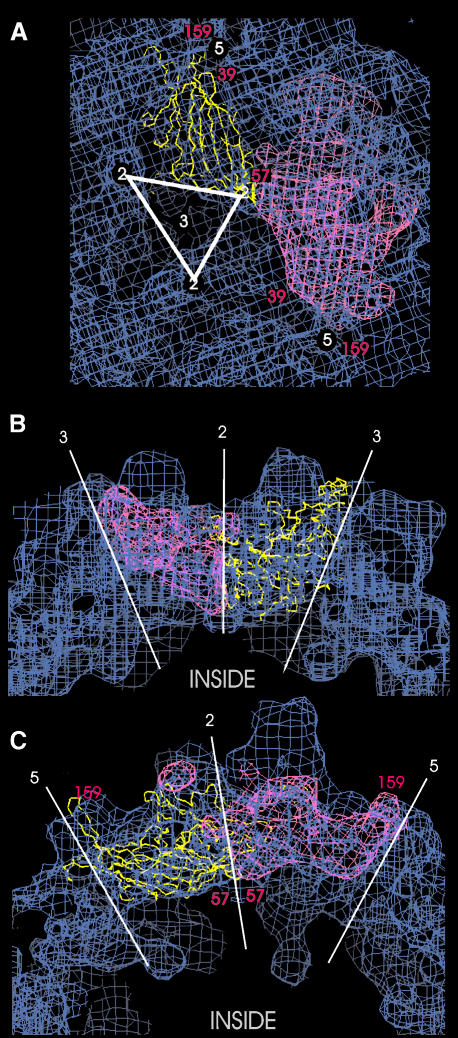
For direct comparison, we superimposed data derived from the atomic model of CPV-VP2 (PDB entry 1C8D, Simpson et al., 2000) to our three-dimensional map. Part of the inner surface of the capsid with the fitted structure of CPV-VP2 is shown in Figure 4A. Figure 4B and C show cross sections through the protein shell. The Cα-chain and the calculated envelope of CPV-VP2 followed the outline of the inner surface of the capsid quite accurately, but did not match the outer surface in the spike region. Assuming a similar fold of AAV2 and CPV in the spike region, six 14-amino acid inserts were tested by Girod et al. (1999) to target the integrin receptor, which is not specific for AAV2. Only two (AAV2-I447 and AAV2-I587) of these six inserts could efficiently bind to the receptor. At these two positions the three-dimensional map of AAV2 and the atomic model of CPV matched reasonably well, whereas at the other four positions there was no good agreement.
Fig. 4. Superposition of the Cα-chain (yellow) of the canine parvovirus VP2 capsid protein (PDB entry 1C8D) and the calculated surface of the VP2 capsid protein (pink) to the three-dimensional map of AAV2 (blue). The position of some residues of CPV-VP2 are labelled in red. Part of the inner surface of the capsid is shown in (A) with an almost straight on view to the eight-stranded β-barrel motif of CPV-VP2. The approximate positions of the symmetry axes are indicated in white. The views in (B) and (C) show different cross section through the protein shell.
The identity between the sequence of CPV and AAV2 is only 20% (Chapman and Rossmann, 1993). However, comparison of various parvovirus sequences (Chapman and Rossmann, 1993) indicated that the rim surrounding the five-fold symmetry axes, as well as the area lining the channels at the five-fold axes, should show a similar overall structure. The fit showed good agreement in this region, e.g. the loop formed by CPV residues 151–168, which belongs to the most conserved regions among parvoviruses (Chapman and Rossmann, 1993), fitted nicely into the rim (Figure 4, turn of the loop of CPV-VP2 at residue 159 labelled in red). In addition the central β-barrel structural motif matched the elongated lumps (Figure 4A). However, there was no density in our map that could have fully accounted for the N-terminal stretch between amino acids 39 and 57 of the CPV model, which runs parallel to the β-barrel from a position close to the two-fold axes (Figure 4A, residue 57) towards the channels at the five-fold axes. The amino acids of this missing stretch were probably located in the dense parts of the globules at the two-fold symmetry axes. These channels, which were clearly empty in our map, are partly filled in most of the resolved structures of parvoviruses (MVM, Agbandje-McKenna et al., 1998; B19, Agbandje et al., 1994; CPV, Xie and Chapman, 1996). For the MVM it is even possible to identify a glycine-rich stretch of the N-terminal region which traverses through the narrow channels from the interior of the capsids to the outside, which could lead to exposure of the N-terminal extensions at the outside of the capsids.
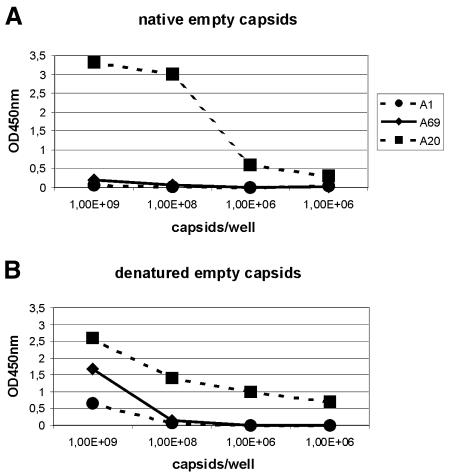
Since icosahedral symmetry was used for the image reconstruction, the location of the N-terminal parts of VP1 and VP2 could not be located directly. However, as the channels at the five-fold symmetry axes in our map appeared undoubtedly empty, it was unlikely that any of the N-terminal parts of the capsid proteins were located at the outside of the empty capsids of AAV2. Furthermore, the part of the amino acid sequence of AAV2 that supposedly traverses the channels does not have a stretch of poly-glycines found in other parvoviruses (Chapman and Rossmann, 1993), which for spatial reasons would be required for passing through the constricted channels. Therefore, the N-terminal extensions of VP1 and VP2 were most likely located at the inside of the capsids. This conclusion is supported by the reaction of capsids with two monoclonal antibodies having VP1- and VP1/VP2-specific epitopes (Wobus et al., 2000). They do not react with intact capsids in an ELISA, whereas they do react upon denaturation of the capsids by heat treatment (Figure 6). In contrast to this interpretation is the observation of Wu et al. (2000), that insertions of foreign epitopes at the N-termini of VP1 and VP2 (amino acid positions 1 and 138), as well as at position 34 of VP1, are accessible at the capsid surface.
Fig. 6. Accessibility of VP1 and VP2 specific sequences. (A) Intact empty capsids were bound to microtiter plates coated with the mAB A20 that selectively binds assembled capsids. Bound capsids were incubated with biotinylated secondary antibodies either detecting epitope 122 KRVLEPLGL 130 of VP1 (A1; circles), epitope 171 LNFGQTGDADSV 182 of VP1 and VP2 (A69; diamonds) or intact capsids (A20; squares), and visualized by horseradish peroxidase-coupled streptavidin. (B) Heat treated empty capsids were immobilized on microtiter plates and reacted with mAbs A1, A69 and A20 as described in (A).
A feature of our three-dimensional map that could possibly account for part of the N-terminal extensions are the globules at the two-fold symmetry axes at the interior of the capsid. These globules are missing in the electron density maps of the CPV and B19 (Agbandje et al., 1994). The lower density and less well defined boundary of the globules, compared with the remaining protein density, indicated that they represented either a flexible part of the structure or one which was not present at all equivalent positions. A variable occupancy of the 30 positions at the two-fold axes would have been exactly what one would expect if the N-terminal regions of the three structural proteins were located there. Therefore, we assume that in AAV2 empty capsids the N-terminal extensions of VP1 and VP2 are located at the inside of the capsid and possibly coincide with the globules at the two-fold symmetry axes.
METHODS
Immunological assays. Protein samples were electrophoresed on a 15% polyacrylamide gel in the presence of SDS (Thomas and Kornberg, 1975) and transferred to a nitrocellulose membrane using semi-dry blotting equipment. The VP proteins were detected with the monoclonal antibody B1, a peroxidase-coupled secondary antibody, and the enhanced chemoluminescence (ECL) detection kit (Amersham, Braunschweig, Germany) according to standard methods (Harlow and Lane, 1988).
The enzyme-linked immuno absorbant assay (ELISA) on A20-coated microtiter plates has been performed as described by Grimm et al. (1999). Purified monoclonal antibodies A1, A69 and A20 (Wistuba et al., 1997) with a concentration of 1 mg/ml were therefore labelled with biotin (Grimm et al., 1999). For detection of denatured capsids, purified empty virions were heat treated (70°C, 5 min), coated overnight to microtiter plates (Polysorp, Nunc), and free binding sites were blocked by incubation for 2 h with 0.2% caseine, 0.05% Tween-20 in phosphate-buffered saline (PBS). ELISA reactions were performed as described above.
Preparation and purification of empty AAV2 capsids. AAV2 empty capsids were produced as described by Grimm et al. (1999) and purified according to Steinbach et al. (1997) with the following modifications: four pellets of approximately 1 × 10⁷ 293T cells, infected with a recombinant adenovirus expressing VP1, VP2 and VP3 of AAV2, were thawed and each resuspended in 1 ml PBS with 0.035 mg/ml phenylmethylsulfonyl fluoride (PMSF), 0.009 mg/ml pepstatin and 0.006 mg/ml leupeptin. After the sucrose cushion the pellet was resuspended in 300 µl buffer (50 mM Tris pH 7.5, 5 mM MgCl2, 5 mM MnCl2), shaken for 30 min at room temperature and then digested again for 30 min with DNase (final concentration 50 µg/ml) and RNase (25 µg/ml). The reaction was stopped with EDTA (final concentration 10 mM). The extract was afterwards loaded again onto a double sucrose cushion of 200 µl 50% and 200 µl 30% sucrose in 10 mM Tris–HCl, 1 mM EDTA pH 8 and centrifuged for 2.5 h at 130 000 g, 4°C. The final pellet was resuspended in 0.1 M NaCl, 10 mM Tris pH 7.5, 1 mM MgCl2.
Electron microscopy. Samples were frozen as described by Böttcher and Crowther (1996) with the modification that the freezing device was used at room temperature. All grids were coated with a perforated carbon film that was covered with an additional, thinner, continuous carbon film. The additional carbon support increased the fraction of micrographs showing crisp particles and also raised the number of particles observed in the field of view.
Micrographs were taken under low dose conditions at a nominal magnification of 52 000 at a Philips CM 120 Biotwin operating at 100 kV and equipped with a LaB6-filament. For cryo-microscopy a Gatan cryo holder maintaining a temperature of 94 K was used. Micrographs were recorded on Kodak SO 163 film that was developed for 12 min in full strength D19 developer.
Image processing. Micrographs were scanned with a Zeiss Scai scanner with a step size of 21 µm/pixel. From 10 micrographs a total of 1800 particle images were selected. The defocus of each micrograph was determined as described by Böttcher et al. (1997) and ranged between 810 and 1930 nm. The particle images were boxed, masked with a narrow circular mask, normalized in their grey value distribution and Fourier transformed. The origin of each particle was determined by cross correlation with a ring (Böttcher and Crowther, 1996) that was generated by summing 240 of the particle images and rotationally averaging the sum.
For the determination of the initial three-dimensional map the IMAGIC V software package was used (Van Heel et al., 1996) following the standard procedures outlined in the manual and assuming icosahedral symmetry for the particles. After one round of refinement the resulting three-dimensional map was used as a reference map for the determination of individual particle orientations using cross common lines (Crowther et al., 1994), which are implemented in the MRC-image processing environment (Crowther et al., 1996). For refinement we followed the protocol of Böttcher et al. (1997) with the alteration that the initial complete asymmetric unit search was performed including information between 1/13.3 nm–1 and 1/2.5 nm–1. For the limited search during refinement information between 1/4 nm–1 and the Fourier spacing where the phase residual of the current best map reached 45° was used. Particle images were included in the calculation of the three-dimensional map if the cross common line phase residual was lower than 85° up to 1/2.8 nm–1, which was true for 95% of all particle images. For each micrograph a three-dimensional map with 52 symmetry (Crowther, 1971) was computed. The resulting maps were combined and corrected for the contrast transfer function (ctf, assuming a fractional amplitude contrast of a = 0.06 and a noise factor f = 0.1) as described by Böttcher and Crowther (1996) with the following modifications.
We have considered the envelope function Ks (Reimer, 1993) for the correction for the ctf. Ks is due to the limited spatial coherence of the electron microscope (illumination aperture αi = 0.25 mrad) and dampens information at higher spatial frequencies R, depending on the defocus Δ and the spherical aberration coefficient (cs = 6.4 mm) of the electron microscope.
Therefore the contrast transfer function c becomes:
where χ is the phase shift and a is the fractional amplitude contrast. For our imaging conditions Ks strongly influences data at spacing between 2.5 nm and 1 nm (Figure 5, grey solid line). Micrographs taken at a higher defocus contribute mainly noise at a spacing of 1 nm, whereas micrographs taken at a lower defocus still contribute significant information. The incorporation of Ks in the correction of ctf compensates for this effect, which leads to a clear improvement in resolution (Figure 5). For a field emission gun electron microscope the effect of Ks would be negligible in this resolution range since for similar imaging conditions the illumination aperture is at least 10× smaller (αi ≈ 0.03 mrad).
The icosahedral three-fold symmetry was imposed to the ctf-corrected, combined three-dimensional map. The quality of the map was assessed by Fourier Shell correlation (Böttcher et al., 1997). The correlation coefficient fell to 0.5 at a spacing of 1.05 nm (Figure 5). In the final map, information was set to zero at a spacing smaller than 1.05 nm, and an inverse temperature factor of B = 8 nm2 was applied for sharpening the map. The B-factor was chosen subjectively for better interpretability of the map and so as to avoid over amplification of the noise. However, a Wilson plot indicated that the fall-off in intensities at spacing between 1.6 and 1.05 nm was compatible with a B-factor of 6.5–9.5 nm2.
Fitting the atomic coordinates of CPV to the AAV2 map. A PDB file displaying all possible protein–protein interactions was retrieved from the EBI Macromolecular Structure Database (1C8D.unique) and imported to the IMAGIC V software package for calculation of a three-dimensional map. The map was band-pass limited to Fourier spacing 1/4 nm–1 to 1/0.9 nm–1 and fitted to the three-dimensional map of AAV2 using the crystallographic program O (Jones et al., 1991). In Figure 4 one of the subunits of CPV is shown as Cα-chain and a second as volume generated from the atomic coordinates of one of the fitted subunits using IMAGIC V.
REFERENCES
- Agbandje M., Kajigaya, S., McKenna, R., Young, N.S. and Rossmann, M.G. (1994) The structure of human parvovirus B19 at 8 Å resolution. Virology, 203, 106–115. [DOI] [PubMed] [Google Scholar]
- Agbandje-McKenna M., Llamas-Saiz, A.L., Wang, F., Tattersall, P. and Rossmann, M.G. (1998) Functional implications of the structure of the murine parvovirus, minute virus of mice. Structure, 6, 1369–1381. [DOI] [PubMed] [Google Scholar]
- Böttcher B. and Crowther, R.A. (1996) Difference imaging reveals ordered regions of RNA in turnip yellow mosaic virus. Structure, 4, 387–394. [DOI] [PubMed] [Google Scholar]
- Böttcher B., Wynne, S.A. and Crowther, R.A. (1997) Determination of the fold of the core protein of hepatitis B virus by electron cryomicroscopy. Nature, 386, 88–91. [DOI] [PubMed] [Google Scholar]
- Chapman M.S. and Rossmann, M.G. (1993) Structure, sequence, and function correlations among parvoviruses. Virology, 194, 491–508. [DOI] [PubMed] [Google Scholar]
- Chipman P.R., Agbandje-McKenna, M., Kajigaya, S., Brown, K.E., Young, N.S., Baker, T.S. and Rossmann, M.G. (1996) Cryo-electron microscopy studies of empty capsids of human parvovirus B19 complexed with its cellular receptor. Proc. Natl Acad. Sci. USA, 93, 7502–7506. [DOI] [PMC free article] [PubMed] [Google Scholar]
- Crowther R.A. (1971) Procedures for three-dimensional reconstruction of spherical viruses by Fourier synthesis from electron micrographs. Phil. Trans. R. Soc. Lond. B. Biol. Sci., 261, 221–230. [DOI] [PubMed] [Google Scholar]
- Crowther R.A., Henderson, R. and Smith, J.M. (1996) MRC image processing programs. J. Struct. Biol., 116, 9–16. [DOI] [PubMed] [Google Scholar]
- Crowther R.A., Kiselev, N.A., Böttcher, B., Berriman, J.A., Borisova, G.P., Ose, V. and Pumpens, P. (1994) Three-dimensional structure of hepatitis B virus core particles determined by electron cryomicroscopy. Cell, 77, 943–950. [DOI] [PubMed] [Google Scholar]
- Girod A., Ried, M., Wobus, C., Lahm, H., Leike, K., Kleinschmidt, J., Deléage, G. and Hallek, M. (1999) Genetic capsid modifications allow efficient re-targeting of adeno-associated virus type 2. Nature Med., 5, 1052–1056. [DOI] [PubMed] [Google Scholar]
- Grimm D., Kern, A., Pawlita, M., Ferrari, F., Samulski, R. and Kleinschmidt, J. (1999) Titration of AAV-2 particles via a novel capsid ELISA: packaging of genomes can limit production of recombinant AAV. Gene Ther., 6, 1322–1330. [DOI] [PubMed] [Google Scholar]
- Harlow E. and Lane, F. (1988) Antibodies: A Laboratory Manual. Cold Spring Harbor Laboratory Press, Cold Spring Harbor, NY.
- Johnson F.B., Ozer, H.L. and Hoggan, M.D. (1971) Structural proteins of adeno-associated virus type 3. J. Virol., 8, 860–863. [DOI] [PMC free article] [PubMed] [Google Scholar]
- Jones T.A., Zou, J.Y., Cowan, S.W. and Kjeldgaard. (1991) Improved methods for binding protein models in electron density maps and the location of errors in these models. Acta Crystallogr. A, 47, 110–119. [DOI] [PubMed] [Google Scholar]
- McKenna R. et al. (1999) Three-dimensional structure of Aleutian mink disease parvovirus: implications for disease pathogenicity. J. Virol., 73, 6882–6891. [DOI] [PMC free article] [PubMed] [Google Scholar]
- Rabinowitz J., Xiao, W. and Samulski, R. (1999) Insertional mutagenesis of AAV2 capsid and the protection of recombinant virus. Virology, 265, 274–285. [DOI] [PubMed] [Google Scholar]
- Reimer L. (1993) Transmission Electron Microscopy. Physics of Image Formation and Microanalysis. Springer, Berlin, Heidelberg.
- Salo R.J. and Mayor, H.D. (1977) Structural polypeptides of parvoviruses. Virology, 78, 340–345. [DOI] [PubMed] [Google Scholar]
- Samulski R.J., Sally, M. and Muzcyzka, N. (1999) Adeno-associated viral vectors. In Friedman, T. (ed.) The Development of Human Gene Therapy. Cold Spring Harbor Laboratory Press, Cold Spring Harbor, NY, pp. 131–172.
- Simpson A.A., Chandrasekar, V., Hebert, B., Sullivan, G.M., Rossmann, M.G. and Parrish, C.R. (2000) Host range and variability of calcium binding by surface loops in the capsids of canine and feline parvoviruses. J. Mol. Biol., 300, 597–610. [DOI] [PubMed] [Google Scholar]
- Simpson A.A., Chipman, P.R., Baker, T.S., Tijssen, P. and Rossmann, M.G. (1998) The structure of an insect parvovirus (Galleria mellonella densovirus) at 3.7 Å resolution. Structure, 6, 1355–1367. [DOI] [PMC free article] [PubMed] [Google Scholar]
- Srivastava A., Lusby, E.W. and Berns, K.I. (1983) Nucleotide sequence and organization of the adeno-associated virus 2 genome. J. Virol., 45, 555–564. [DOI] [PMC free article] [PubMed] [Google Scholar]
- Steinbach S., Wistuba, A., Bock, T. and Kleinschmidt, J. (1997) Assembly of adeno-associated virus type 2 capsids in vitro. J. Gen. Virol., 78, 1453–1462. [DOI] [PubMed] [Google Scholar]
- Summerford C. and Samulski, R.J. (1998) Membrane-associated heparan sulfate proteoglycan is a receptor for adeno-associated virus type 2 virions. J. Virol., 72, 1438–1445. [DOI] [PMC free article] [PubMed] [Google Scholar]
- Thomas J.O. and Kornberg, R.D. (1975) An octamer of histones in chromatin and free in solution. Proc. Natl Acad. Sci. USA, 72, 2626–2630. [DOI] [PMC free article] [PubMed] [Google Scholar]
- Van Heel M., Harauz, G., Orlova, E.V., Schmidt, R. and Schatz, M. (1996) A new generation of the IMAGIC image processing system. J. Struct. Biol., 116, 17–24. [DOI] [PubMed] [Google Scholar]
- Wistuba A., Kern, A., Weger, S., Grimm, D. and Kleinschmidt, J.A. (1997) Subcellular compartmentalization of adeno-associated virus type 2 assembly. J. Virol., 71, 1341–1352. [DOI] [PMC free article] [PubMed] [Google Scholar]
- Wobus C.E., Hugle-Dorr, B., Girod, A., Petersen, G., Hallek, M. and Kleinschmidt, J.A. (2000) Monoclonal antibodies against the adeno-associated virus type 2 (AAV-2) capsid: epitope mapping and identification of capsid domains involved in AAV-2-cell interaction and neutralization of AAV-2 infection. J. Virol., 74, 9281–9293. [DOI] [PMC free article] [PubMed] [Google Scholar]
- Wu P., Xiao, W., Conlon, T., Hughes, J., Agbandje-McKenna, M., Ferkol, T., Flotte, T. and Muzyczka, N. (2000) Mutational analysis of the adeno-associated virus type 2 (AAV2) capsid gene and construction of AAV2 vectors with altered tropism. J. Virol., 74, 8635–8647. [DOI] [PMC free article] [PubMed] [Google Scholar]
- Xie Q. and Chapman, M.S. (1996) Canine parvovirus capsid structure, analyzed at 2.9 Å resolution. J. Mol. Biol., 264, 497–520. [DOI] [PubMed] [Google Scholar]


