

Abstract
The mechanism by which macromolecules are translocated through the nuclear pore complex (NPC) is little understood. However, recent measurements of nuclear transport in permeabilized cells showed that molecules binding to phenylalanine-glycine-rich repeats (FG repeats) in NPC proteins were translocated much faster through the NPC than molecules not interacting with FG repeats. We have studied that substrate preference of the NPC in isolated oocyte nuclei and purified nuclear envelopes by optical single transporter recording. NTF2, the transport receptor of RanGDP, was exported ∼30 times faster than green fluorescent protein, an inert molecule of approximately the same size. The data confirm that restricted diffusion of inert molecules and facilitated transport of FG-repeat binding proteins are basic types of translocation through the NPC, demonstrating that the functional integrity of the NPC can be conserved in isolated nuclei and nuclear envelopes and thus opening new avenues to the analysis of nucleocytoplasmic transport.
INTRODUCTION
The nuclear pore complex (NPC), a large transporter spanning the nuclear envelope (for reviews, see Stewart, 2000; Wente, 2000; Macara, 2001; Vasu and Forbes, 2001), has dual permeability characteristics. Inert hydrophilic molecules that neither contain nuclear transport signals nor interact specifically with NPC proteins (nucleoporins) permeate the NPC by restricted diffusion. The transport rate depends inversely on molecular size and is compatible with diffusion through a patent aqueous channel of ∼10 nm in diameter and 45 nm in length (Keminer and Peters, 1999). In contrast, molecules containing nuclear localization sequences (NLSs) or nuclear export signals (NESs) are escorted through the NPC by soluble molecules, nuclear transport receptors, shuttling between cytoplasm and nucleus.
Recently, Ribbeck and Görlich (2001) observed that NTF2 (also referred to as p10; Moore and Blobel, 1994; Paschal and Gerace, 1995), the transport receptor of RanGDP (Ribbeck et al., 1998; Smith et al., 1998), was translocated through the NPC much faster than green fluorescent protein (GFP), an inert molecule of similar size. It thus appears that the passive, reversible and very fast facilitated translocation of transport receptors through the NPC is a central mechanism of selective nuclear transport. For substrates such as RanGDP, facilitated transport of the RanGDP–NTF2 complex apparently serves to rapidly dissipate gradients between cytoplasm and nucleus. In other cases, such as the translocation of NLS and NES proteins through the NPC by their cognate receptors, is modulated by the small Ras-like GTPase Ran. In the GTP form, Ran greatly enhances the association of export receptors (exportins) with NES substrates but promotes the dissociation of complexes between import receptors (importins) and NLS substrates. Supposedly occurring in high concentrations in the nucleus but small concentrations in the cytoplasm, RanGTP functions as molecular switch (Görlich et al., 1996) making translocation of NLS and NES substrates irreversible and permitting transport against concentration gradients. Facilitated translocation of transport receptors is related to their ability to interact with phenylalanine-glycine (FG) repeats in nucleoporins, but the molecular mechanism is debated (Rout et al., 2000; Ben-Efraim and Gerace, 2001; Macara, 2001; Ribbeck and Görlich, 2001).
Thus, the NPC exerts its transport functions in close cooperation with factors shuttling between cytoplasm and nucleus. Also, on a structural level, the NPC may be directly integrated into the molecular texture of the cell (Strambio-de-Castillia et al., 1999). Significantly, nucleocytoplasmic transport could be studied previously in intact and permeabilized cells only. It is therefore an open question whether the NPC can be removed from its native context in functional form to establish better defined and controllable in vitro assays for nucleocytoplasmic transport. We have developed a simplified and enhanced version of optical single transporter recording (OSTR; Tschödrich-Rotter and Peters, 1998) that can be applied to manually isolated intact oocyte nuclei and cleaned nuclear envelopes. We found recently (Siebrasse et al., 2002) that the export of an NES protein could be reconstituted in cleaned nuclear envelopes by the addition of the exportin CRM1 and RanGTP. In the present study, export rates of GFP and NTF2 were measured in isolated nuclei and nuclear envelopes. The results show that the major transport functions of the NPC can be conserved in isolated nuclei and nuclear envelopes, thus providing new possibilities for studies of nucleocytoplasmic transport.
RESULTS
Optical recording of nuclear transport in isolated oocyte nuclei and nuclear envelopes
The OSTR version used in the present study is illustrated in Figure 1. A manually isolated nucleus from a Xenopus oocyte (Radtke et al., 2001) was deposited in a preformed buffer-filled OSTR chamber and attached to the bottom of the chamber, an isoporous filter, by slight mechanical pressure (Figure 1A). In part of the experiments the nucleus was dissected (Figure 1B) using sharp steel needles to remove the nuclear contents, and the remaining nuclear envelope was cleaned by washing. Transport was started by exchanging the buffer in the chamber with a transport medium containing either GFP or Alexa488-labeled NTF2 and a Texas-Red-labeled 70 kDa dextran (TRD70). The chamber was placed on the stage of a confocal microscope, and a 40-fold objective was used to image filter pores right in the center of the nucleus-attached area of the filter. A time series of fluorescence scans was acquired, recording simultaneously the entrance of GFP or NTF2 (green fluorescence) into, and the exclusion of TRD70 (red fluorescence) from, the filter pores. When transport was completed, the nucleus-attached region was shifted out of the field of view, and a region of the OSTR filter not covered by the nucleus was scanned for reference. As indicated in Figure 1C, the present study employed a ‘macropatch’ version of OSTR. Filter pores of 0.72 µm in diameter were used so that nuclear envelope patches spanning filter pores contained not a single NPC but ∼15 NPCs not in contact with the rim of the filter pore.
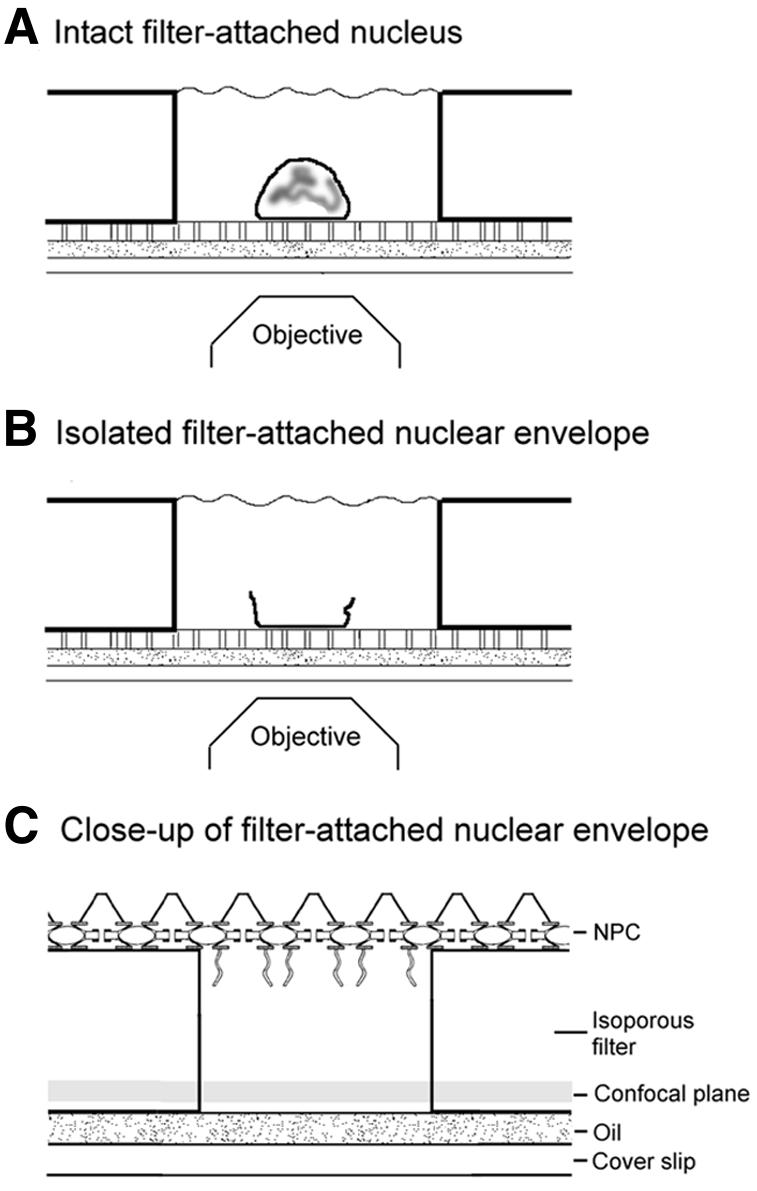
Fig. 1. Optical recording of nuclear transport in isolated oocyte nuclei and nuclear envelopes. (A) An isolated oocyte nucleus was deposited in a preformed buffer-filled OSTR chamber and attached to the bottom, an isoporous filter, by gentle pressure. (B) In part of the experiments the nucleus was dissected and the remaining nuclear envelope washed. (C) Export of substrates into the filter pores was recorded by confocal microscopy. The drawings are not to scale.
An example of an OSTR measurement is shown in Figure 2. An intact filter-attached nucleus was immersed in transport medium containing 4 µM Alexa488-labeled NTF2 dimers and TRD70. Thus, NTF2 had first to enter the nucleus at free, not filter-attached, regions of the nucleus before it could be exported into the filter pores. When imaging filter pores in an area covered by the nucleus (Figure 2A), a lag time of ∼4 min was observed before NTF2 appeared in the filter pores. During the lag time, background fluorescence had already increased (see the scan at 4 min) due to the strong binding of NTF2 to the nuclear envelope (data not shown). After the lag time, the filter pores were rapidly filled with NTF2. TRD70 was virtually excluded from the filter pores during the measuring time, indicating sufficiently tight sealing. Figure 2B shows an area of the filter not covered by the nucleus, providing a standard for the substrate concentration in the transport medium.

Fig. 2. Export of NTF2 from an intact nucleus. An intact filter-attached nucleus was incubated with fluorescently labeled NTF2 (green fluorescence) and TRD70 (red fluorescence). The time after addition of the transport medium to the nucleus is indicated. The filter pores were imaged. (A) A measuring field was selected in the center of the nucleus-covered area, and NTF2 (left column) and TRD70 (right column) were monitored simultaneously. After a lag time of ∼4 min, NTF2 appeared in the filter pores, rapidly approaching a steady state. TRD70 appeared in filter pores in very small amounts only, indicating sufficiently tight sealing. (B) In a reference field outside the nucleus-covered area, NTF2 and TRD70 had free access to the filter pores.
Effect of nuclear isolation and dissection on translocation of GFP and NTF2 through the NPC
Confocal scans such as those shown in Figure 2 were evaluated by a computer program, determining for each filter pore the time-dependent F(in/out) value, which is the ratio of the background-corrected mean fluorescence intensity F(in) of a filter pore inside and the mean fluorescence intensity F(out) of filter pores outside the nuclear-envelope-covered region. Since the concentration C(out) of the transport substrate in the medium was known, the concentration C(in) of transport substrate in nuclear-envelope-covered filter pores was derived by C(in) = F(in/out) × C(out), an approximation implying a linear relationship between filter-pore fluorescence and substrate concentration approximately fulfilled for both GFP and NTF2 (data not shown). A single experiment usually yielded 40 kinetic curves.
The results of export measurements using intact nuclei are shown in Figure 3A. The lag time amounted to ∼4 min in the case of both GFP and NTF2. In measurements with intact nuclei, the concentration inside the nucleus was not constant but increased gradually with time. It was therefore difficult to establish a relationship between transport rate and concentration difference. Nevertheless, the data clearly show that the transport of NTF2 was much faster than that of GFP.

Fig. 3. Effect of nuclear dissection on the translocation of GFP and NTF2 through the NPC. The export of NTF2 and GFP was measured in intact nuclei (A) and nuclear envelopes (B). In both cases, NTF2 was transported much faster than GFP.
Export measurements involving nuclear envelopes are shown in Figure 3B. When the nucleus was dissected and the nuclear side of the nuclear envelope cleaned by washing, the transport substrate had free access to the nuclear interior and thus the lag time was much reduced. Also, the concentration of transport substrate on the inside of the nuclear envelope was better defined and approximately constant. For GFP (Figure 3B, left), the initial concentration change in the filter pores amounted to 10 nM/s. With a filter-pore volume of 5 fl and 15 NPCs per patch, the initial concentration change corresponded to a rate of ∼2 molecules s–1 NPC–1. The export of NTF2 (Figure 3B, right) was very fast and could not be adequately resolved at a time resolution of 2 min. Therefore, only the lower limit of the transport rate could be determined as 10 molecules s–1 NPC–1.
Measurement of export kinetics at improved time resolution
To measure export kinetics in nuclear envelopes more precisely, we employed photobleaching (Keminer and Peters, 1999). After the addition of transport media containing either 15 µM GFP or 7.4 µM Alexa488 NTF2 dimers to a filter-attached nuclear envelope, the transport substrate was allowed to equilibrate between the OSTR chamber and filter pores. Then, employing the time-lapse/bleaching program of the confocal microscope system together with a high-power objective (100-fold, 1.3 numerical aperture), a prebleach scan was acquired, a filter pore selected for 1 s of photobleaching, and the recovery of the fluorescence of the photobleached filter pore followed by a series of scans. Representative examples of such measurements are shown in Figure 4. In filter pores covered by the nuclear envelope, GFP had a fluorescence recovery time of ∼55 s (Figure 4A and B), whereas NTF2 recovered in ∼2 s (Figure 4C). That filter pores had been essentially depleted of NTF2 fluorescence by the photobleaching pulse was shown (Figure 4D) in experiments with filter pieces bathed in NTF2 transport solution and then sealed by oil on both sides. Other controls showed that fluorescence recovered virtually immediately in areas of the filter not covered by the nuclear envelope.

Fig. 4. OSTR measurements of nuclear export initiated by photobleaching. Filter-attached nuclear envelopes were incubated with transport solutions containing either 15 µM GFP or 7.4 µM Alexa488-labeled NTF2. After equilibration, filter pores were imaged at high magnification and individual filter pores (arrows) photobleached for 1 s. Fluorescence recovery, due to the export of fresh substrate, was monitored by a time series of confocal scans. Times after photobleaching are indicated. (A and B) Recovery time of GFP, measured on two timescales, was ∼55 s. (C) Recovery time of NTF2 was ∼2 s. (D) Experiments with filter pores filled with the NTF2 transport solution but sealed on both ends by oil showed that NTF2 was very effectively photobleached.
Kinetics of passive transport processes measured by photobleaching are given by the following equation (Tschödrich-Rotter and Peters, 1998):
C(t) = C(0) + [C(∞) – C(0)] [1 – exp(–t/τ](1)
where C(0) and C(∞) are the substrate concentrations in the filter pore immediately and very long after photobleaching and τ is the characteristic transport time. τ is related to the single-transporter permeability coefficient P by τ = Vfp/n P, so that the transport rate R of the single NPC is
R = P ΔC = (Vfp/n τ) ΔC(2)
where Vfp is the volume of the filter pore, n is the average number of NPCs per patch and ΔC is the concentration difference across the NPCs. Taking Vfp = 5 × 10–15 l and n = 15 NPCs per patch yields R (molecules s–1 NPC–1) = [200 / τ (s)] ΔC (µM).
Experimental data together with fits according to equation (1) are given in Figure 5. On a timescale of 60 s (Figure 5A), the recovery of GFP could be adequately followed and a transport time of 52.6 ± 11.8 s (mean ± SD, n = 52) in nuclear-envelope-covered filter areas determined. This corresponds to transport rates of 57 molecules s–1 NPC–1 at a concentration difference ΔC of 15 µM or, assuming an approximately linear dependence of the rate on concentration, to 3.8 molecules s–1 NPC–1 at ΔC = 1 µM. On a timescale of 16 s (Figure 5B), τ of GFP in nuclear-envelope-covered areas (solid squares) was 60.5 ± 6.1 s (mean ± SD, n = 21), corresponding to 49.6 (ΔC = 15) or 3.3 (ΔC = 1 µM) molecules s–1 NPC–1. Figure 5B also shows that, in filter areas not covered by the nuclear envelope (open squares), GFP fluorescence recovered very fast. When NTF2 kinetics were measured in nuclear-envelope-covered areas (Figure 5C, filled squares), recovery was very fast. Fitting the NTF2 data by equation (1) yielded a transport time of 2.2 ± 0.2 s (mean ± SD, n = 25) when the concentration at zero time was not specified. If the fit was forced to pass through C = 1 µM at t = 0, as suggested by the measurements of oil-sealed filter pores (open triangles), τ reduced to 1.6 ± 0.2 s (mean ± SD, n = 25). Transport times of 2.2 and 1.6 s correspond to transport rates of 670–910 (ΔC = 7.4 µM) and 91–123 (ΔC = 1 µM) molecules s–1 NPC–1. Recovery of filter pores in areas not covered by the nuclear envelope (open circles) was very fast, whereas filter pores sealed on both sides by oil (open triangles) showed essentially no recovery.

Fig. 5. Export kinetics of GFP and NTF2. Quantification of scans as shown in Figure 4. Experimental data (symbols and error bars) were fitted by single exponentials (lines) as specified in the text. (A and B) Export of GFP. Export times were 53 and 60 s. (C) Export of NTF2. In nuclear-covered filter areas (filled squares), the export time of NTF2 was 1.6–2.2 s. Recovery in filter areas not covered by the nuclear envelope (open circles) was faster. In filter pores filled with NTF2 solution and sealed on both sides, recovery was essentially absent.
In another series of experiments, the export rate of NTF2 was determined at initial NTF2 concentration differences of 1.5, 7.4 and 14.8 µM. Transport rates were found to be 270 ± 148, 907 ± 408 and 1497 ± 674 molecules s–1 NPC–1, respectively. The dependence of transport rate on concentration was approximately linear but could be fitted much better, similar to the data for transportin and NTF2 (Ribbeck and Görlich, 2001), by a sum of a hyperbolic, Michaelis–Menten-type term and a linear term to yield νmax ∼600 molecules s–1 NPC–1, Km ∼4 µM and a slope of the linear term of ∼70 molecules s–1 NPC–1 µM–1. However, because of the large standard deviations, this analysis is speculative and has yet to be confirmed by measurements at improved time resolution.
DISCUSSION
The study shows that NTF2, the transport receptor of RanGDP, was translocated through the NPC of isolated oocyte nuclei and cleaned nuclear envelopes much faster than GFP, an inert protein of similar size. In nuclear envelopes the transport rates amounted to ∼1500 and ∼60 molecules s–1 NPC–1, respectively, at ∼15 µM concentration difference, which corresponds to 100 and 4 molecules s–1 NPC–1 upon linear extrapolation to 1 µM concentration difference. Ribbeck and Görlich (2001) measured import of NTF2 and GFP through the NPC of digitonin permeabilized HeLa cells and derived rates of 250 and 2 molecules s–1 NPC–1, respectively, at 1 µM concentration difference. The two studies differ in many details, most notably perhaps with regard to the application of detergent and the presence of the nuclear contents. Both parameters potentially affect apparent transport kinetics. It is remarkable, therefore, that the results of the two studies, although not identical, are quite similar. Concerning the translocation of inert molecules, we have previously provided evidence (Keminer and Peters, 1999) that each NPC contains a single patent diffusion channel of ∼10 nm in diameter and ∼45 nm in length. Our present GFP data are compatible with a channel of 9.5 nm in diameter and 45 nm in length, very similar to previous estimates.
Facilitated transport is apparently based on the ability of transport receptors to interact with FG repeats in nucleoporins. However, how this interaction generates facilitated transport and how facilitated transport can be reconciled with restricted diffusion of inert molecules is a matter of intensive research. Ribbeck and Görlich (2001) assumed that the NPC center contains a phase rich in FG repeats that selectively dissolves FG-repeat binding proteins, thereby facilitating their translocation. Other current models assume that the NPC contains a central transport channel. Whereas Rout et al. (2000) emphasized filament-mediated processes at the entrance of the transport channel attracting FG-repeat binding proteins and rejecting inert molecules by entropic exclusion, Ben-Efraim and Gerace (2001) described a gradient of increasing affinity for FG-repeat binding proteins along the axis of the channel. Macara (2001) suggested that the channel has a two-plied cross-section with a peripheral region of ∼7 nm in thickness occupied by flexible FG-repeat-containing filaments and a central water-filled space measuring ∼10 nm in diameter. FG-repeat binding proteins would slide along the wall, whereas inert molecules would diffuse through the central aqueous space. Our data (Keminer and Peters, 1999; this study) conform best with Macara’s suggestion. However, all the current models are essentially verbal and it will be necessary to develop more quantitative models that can be tested by kinetic data as provided by the present study.
Recently, we have analyzed the export of an NES protein through the NPC in filter-attached nuclear envelopes (Siebrasse et al., 2002). In cleaned nuclear envelopes, export of an NES protein was virtually abolished. However, when an export complex was formed in advance from the NES protein, the export receptor CRM1 and RanGTP export was fully restored and proceeded against a concentration difference. Together with the present data, this suggests that transport functions of the NPC can be fully conserved in isolated nuclear envelopes, thus providing new possibilities for the analysis of nucleocytoplasmic transport.
METHODS
Materials. Human NTF2 was expressed in Escherichia coli BL21(DE3) and purified according to Wong et al. (1997). Labeling with Alexa488 (C5-Maleimid; Molecular Probes) was performed in 20 mM Tris–HCl pH 7.4, 50 mM NaCl, 2 mM MgCl2 and incubation on ice overnight. Unbound dye was removed by gel filtration (Biogel P-6; Bio-Rad). MALDI mass analysis showed that the labeling ratio (moles Alexa488 per moles NTF2 monomer) was 1 and that labeled NTF2 formed stable dimers. N-terminal His-tagged GFP(S65T) was expressed in E. coli BL21(DE3) and purified using Ni-NTA–agarose (Qiagen). TRD70 was obtained from Molecular Probes (Leiden, The Netherlands). All manipulations of the nucleus and transport measurements were performed in mock 3 [90 mM KCl, 10 mM NaCl, 2 mM MgCl2, 0.1 mM CaCl2, 1.0 mM of the calcium chelator N-(2-hydroxyethyl)ethylene-diaminetriacetic acid (HEDTA), 10 mM HEPES pH 7.3]. Transport media contained either GFP or NTF2 at indicated concentrations, together with 4.0 µM TRD70 and 10% (w/v) BSA.
Transport measurements of intact filter-attached nuclei and filter-attached isolated nuclear envelopes by OSTR. The basic principles of OSTR have been described previously (Tschödrich-Rotter and Peters, 1998; Keminer and Peters, 1999). In the present study, a plastic dish with a hole of 3.5 mm in diameter covered by a piece of an isoporous 10 µm thick polycarbonate filter (Cat. No. 7062 4708; Whatman, Maidstone, UK), having perpendicular pores of 0.72 ± 0.8 µm in diameter, was filled with mock 3. Filter pores were sealed on the outer side of the dish by immersion oil and a cover slip. A nucleus, manually isolated and purified as described previously (Radtke et al., 2001), was transferred into the OSTR chamber and attached to the filter by gentle pressure, and the buffer in the OSTR chamber was exchanged with transport medium. In other experiments, the attached nucleus was fully opened and the nuclear contents, a very soft gel, removed. The nuclear side of the remaining filter-attached nuclear envelope was washed by perfusing it twice with 15 µl of mock 3 before applying the transport medium. In both cases, the OSTR chamber was placed on the stage of a confocal microscope. A 40-fold objective (NA 1.0, oil) was used to image filter pores in the nuclear-envelope-sealed area of the filter. Particular care was taken to avoid collapsed membrane protrusions, and regions were chosen in which flat areas of the nuclear envelope were attached to the filter. A time series of fluorescence scans was acquired recording simultaneously the entrance of GFP or NTF2 into, and the exclusion of TRD70 from, the filter pores. When transport was completed, a region of the chamber where the filter was not covered by the nuclear envelope was scanned for reference. Confocal scans were evaluated using ImageJ (Wayne Rasband, National Institute for Mental Health, Bethesda, MD). A special Java plug-in was created to align an image stack, place circular regions of interest (ROIs) on individual filter pores, determine the local background surrounding each ROI and compute the background-corrected fluorescence F(in)(t) for each filter pore at each time point. Then the mean fluorescence F(out) of filter pores in reference areas was determined, F(in)(t) normalized to F(out) and the resultant ratio F(in/out)(t) plotted versus time. For photobleaching studies, the time-lapse/bleaching program of the confocal microscope system (Leica, Heidelberg, Germany) was used.
Acknowledgments
ACKNOWLEDGEMENT
The study was supported by grant no. PE 138/17-1 from the Deutsche Forschungsgemeinschaft.
REFERENCES
- Ben-Efraim I. and Gerace, L. (2001) Gradient of increasing affinity of importin β for nucleoporins along the pathway of nuclear import. J. Cell Biol., 152, 411–417. [DOI] [PMC free article] [PubMed] [Google Scholar]
- Görlich D., Panté, N., Kutay, U., Aebi, U. and Bischoff, F.R. (1996) Identification of different roles for RanGDP and RanGTP in nuclear protein import. EMBO J., 15, 5584–5594. [PMC free article] [PubMed] [Google Scholar]
- Keminer O. and Peters, R. (1999) Permeability of single nuclear pores. Biophys. J., 77, 217–228. [DOI] [PMC free article] [PubMed] [Google Scholar]
- Macara I.G. (2001) Transport into and out of the nucleus. Microbiol. Mol. Biol. Rev., 65, 570–594. [DOI] [PMC free article] [PubMed] [Google Scholar]
- Moore M.S. and Blobel, G. (1994) Purification of a Ran-interacting protein that is required for protein import into the nucleus. Proc. Natl Acad. Sci. USA, 91, 10212–10216. [DOI] [PMC free article] [PubMed] [Google Scholar]
- Paschal B.M. and Gerace, L. (1995) Identification of NTF2, a cytosolic factor for nuclear import that interacts with nuclear pore protein p62. J. Cell Biol., 129, 925–937. [DOI] [PMC free article] [PubMed] [Google Scholar]
- Radtke T., Schmalz, D., Coutavas, E., Soliman, T.M. and Peters, R. (2001) Kinetics of protein import into isolated Xenopus oocyte nuclei. Proc. Natl Acad. Sci. USA, 98, 2407–2412. [DOI] [PMC free article] [PubMed] [Google Scholar]
- Ribbeck K. and Görlich, D. (2001) Kinetic analysis of translocation through nuclear pore complexes. EMBO J., 20, 1320–1330. [DOI] [PMC free article] [PubMed] [Google Scholar]
- Ribbeck K., Lipowsky, G., Kent, H.M., Stewart, M. and Görlich, D. (1998) NTF2 mediates nuclear import of Ran. EMBO J., 17, 6587–6598. [DOI] [PMC free article] [PubMed] [Google Scholar]
- Rout M.P., Aitchison, J.D., Suprapto, A., Hjertaas, K., Zhao, Y. and Chait, B. (2000) The yeast nuclear pore complex: composition, architecture and transport mechanism. J. Cell Biol., 148, 635–651. [DOI] [PMC free article] [PubMed] [Google Scholar]
- Siebrasse J.P., Coutavas, E. and Peters, R. (2002) Reconstitution of nuclear protein export in isolated nuclear envelopes. J. Cell Biol., in press. [DOI] [PMC free article] [PubMed] [Google Scholar]
- Smith A., Brownawell, A. and Macara, I. (1998) Nuclear import of Ran is mediated by the transport factor NTF2. Curr. Biol., 8, 1403–1406. [DOI] [PubMed] [Google Scholar]
- Stewart M. (2000) Insight into the molecular mechanism of trafficking using nuclear transport factor 2. Cell Struct. Funct., 25, 217–225. [DOI] [PubMed] [Google Scholar]
- Strambio-de-Castillia C., Blobel, G. and Rout, M.P. (1999) Proteins connecting the nuclear pore complex with the nuclear interior. J. Cell Biol., 144, 839–855. [DOI] [PMC free article] [PubMed] [Google Scholar]
- Tschödrich-Rotter M. and Peters, R. (1998) An optical method for recording the activity of single transporters in membrane patches. J. Microsc., 192, 114–125. [DOI] [PubMed] [Google Scholar]
- Vasu S.K. and Forbes, D.J. (2001) Nuclear pores and nuclear assembly. Curr. Opin. Cell Biol., 13, 363–375. [DOI] [PubMed] [Google Scholar]
- Wente S. (2000) Gatekeepers of the nucleus. Science, 288, 1374–1377. [DOI] [PubMed] [Google Scholar]
- Wong D.H., Corbett, A.H., Kent, H.M., Stewart, M. and Silver. P.A. (1997) Interaction between the small GTPase Ran/Gsp1p and NTF2p is required for nuclear transport. Mol. Cell. Biol., 17, 3755–3767. [DOI] [PMC free article] [PubMed] [Google Scholar]