

Abstract
Mutations causing loss of PTEN lipid phosphatase activity can promote cancer, benign tumors (PHTS), and neurodevelopmental disorders (NDDs). Exactly how they preferentially trigger distinct phenotypic outcomes has been puzzling. Here, we demonstrate that PTEN mutations differentially allosterically bias P loop dynamics and its connection to the catalytic site, affecting catalytic activity. NDD-related mutations are likely to sample conformations of the functional wild-type state, while sampled conformations for the strong, cancer-related driver mutation hotspots favor catalysis-primed conformations, suggesting that NDD mutations are likely to be weaker, and our large-scale simulations show why. Prenatal PTEN isoform expression data suggest exons 5 and 7, which harbor NDD mutations, as cancer-risk carriers. Since cancer requires more than a single mutation, our conformational and genomic analysis helps discover how same protein mutations can foster different clinical manifestations, articulates a role for co-occurring background latent driver mutations, and uncovers relationships of splicing isoform expression to life expectancy.
Keywords: neurodevelopmental disorders, autism spectrum disorder, cancer, allosteric mutations, tumor suppressor, glioblastoma, PTEN hamartoma tumor syndrome, BrainSpan
Graphical Abstract

Introduction
Tumor suppressor phosphatase and tensin homologue (PTEN) is a dual-specific protein and lipid phosphatase, suppressing cell growth and survival [1]. It negatively regulates PI3K/PDK1/AKT/mTOR signaling through dephosphorylation of signaling lipid phosphatidylinositol 3,4,5-trisphosphate (PIP3) to phosphatidylinositol 4,5-bisphosphate (PIP2) [2]. Dysfunction of PTEN due to somatic and germline genetic variations is associated with several disease phenotypes. While a PTEN somatic mutation after conception is often associated with human cancers including glioblastomas and endometrial carcinomas [3, 4], germline mutations (in egg or sperm cells) can lead to neurodevelopmental disorders (NDDs) such as macrocephaly/autism syndrome (OMIM # 605309) [5, 6] and PTEN hamartoma tumor syndrome (PHTS) [7]. PHTS is a rare inherited syndrome characterized by a benign noncancerous tumor-like cell growth, including Cowden syndrome (CS) and Bannayan-Riley-Ruvalcaba syndrome (BRRS) [8, 9]. Individuals with CS and BRRS often have macrocephaly, a non-tumoral phenotype. Those with PHTS genetic disorder have increased risk for certain types of cancer and autism spectrum disorder (ASD) [10–13]. Our work pioneers the integration of protein conformational dynamic data with mRNA isoform expression levels, as a function of tissue-specific timing windows, aiming to demystify the connection between these three pathologies: cancer, NDDs, and benign tumors. Data indicate that functional degradation in the human brain by carriers of the same mutation can abet all three pathologies, albeit with different probabilities. We seek to (i) explain the connections, (ii) identify the cancer and NDDs-related mutations not only from statistical frequencies–but from single molecules through their conformational dynamics, and (iii) relate specific PTEN exons to life expectancy of carriers of mutations in the human brain. The second aim is vital since we expect that not all mutations have been identified. We further suggest that similar approaches can be considered for other NDDs protein carriers, such as RASopathies.
Experimental studies have demonstrated degradation of PTEN lipid phosphatase activity due to mutations. However, exactly how single residue mutations work at the structural level at the membrane has been unknown. Further, NDDs emerge during embryonic brain cell development, suggesting that in addition to mutations, prenatal gene expression level plays a vital role. This is expected as mutations and expression levels determine signal strength down the pathway [14]. Thus, we considered cancer- and NDD-related mutations, as well as pre- and post-natal expression levels of isoforms harboring NDD (macrocephaly/ASD)-related mutations alone or in combination with cancer mutations. Earlier, we proposed that cancer-related mutations are frequently stronger whereas NDDs’ are weaker/milder [15, 16]. A strong mutation promotes cell proliferation, a weak/mild mutation may impact differentiation, processes which are influenced by cell cycle progression [17–19]. Mutation strength, the brain cell type and state, and timing of the expression, determine the outcome, NDD, PHTS, or cancer [15, 20]. Recent significant publications [14, 21–24] re-enforced earlier indications that even though driver mutations are key factors in cancer, signal strength decides the cell fate.
One way to assess mutation strength is through frequencies. Our comprehensive statistical analysis indicates that strong hotspots, defined by their frequencies, tend to be related to cell proliferation in cancer, whereas weak/moderate mutations with NDDs [18, 25]. This analysis includes 9736 profiles of attention-deficit/hyperactivity disorder (ADHD), ASD, intellectual disability, cerebral palsy, and more. They cover 14,133 mutations on 7907 genes, where only 0.28% are cancer driver mutations, and 5307 oncogenic mutations from the Cancer Genome Interpreter (Further details are in [25]). Another way to evaluate mutation strength is through analysis of catalysis-prone conformational tendencies of the protein variants. For PTEN, we expect that (i) our conformational analysis of cancer mutations, but not of NDDs, will trend toward molecules in the non-functional state, and (ii) that our genomic analysis will demonstrate higher expression levels for NDD mutation-harboring isoforms in the prenatal brain.
Thus, here we set out to identify and distinguish between strong and weak mutations by their conformational tendencies and to relate them to the corresponding phenotype. Exploiting molecular dynamics (MD) simulations, we sampled the conformations of mutants harboring a mutation associated with an NDD and observed that they resembled those of the wild-type protein. In contrast, conformations sampled from variants associated with cancer hotspots differ, favoring a potent PTEN catalytic phosphatase reaction. This supports the hypothesis that a key difference between NDDs and cancer mutations is strength [15, 16]. Mutation strength, as manifested in the biased conformational sampling that the mutant favors can then be harnessed as a feature in identifying mutations connected with the distinct clinical manifestation, assisting in early diagnosis. As to expression levels, our analysis observed that all mutant-harboring isoforms with available data were highly expressed in the prenatal time window, dropping following birth if no cancer mutations within the measured lifespan. Cancer development results from multiple (more than one hotspot) mutations, emerging sporadically during life. NDDs mutation carriers have higher chances of cancer emergence, suggesting that the signal of NDDs-related mutations can be strengthened by co-occurring ‘latent’ drivers [26]. If they reside at adjacent chromosomal regions, deletions/insertions can also infringe both [27], as they do in NDD comorbidity [28].
Our analysis undertakes the pivotal question of how same allele mutations can abet different clinical manifestations and uncovers relationships of splicing isoform expression with life expectancy. It observes that splicing isoforms that do not carry variants in exon 5 tend to be impacted by the NDD mutations F241S and D252G. On the other hand, variants carrying exons 5 and 7 can be strongly associated with an increased lifetime risk of certain cancers. Individuals afflicted with NDDs are known to have increased risk of cancer, in schizophrenia as much as 50% probability [29]. It is also high in e.g., autism [30], and in intellectual disability [31, 32]. Our work also offers guidelines for identification of NDD and cancer mutational variants. If the transcript harbors unknown mutation types, they can be differentiated by their strengths. Statistics and atomistic simulations can help, although applying MD is demanding, and accelerated sampling may not be sensitive to single residue sequence alterations. Our study underscores the merit of detailed structural and functional mechanisms of PTEN with mutations at the membrane, points how they may help resolve the enigma of how same-protein mutations can promote different pathologies, and a way to help forecast their outcome. It also emphasizes that multiple factors determine signaling strength. Ample data indicate that cancer involves more than a single mutation and that at least half of them originate prior to observed tumor initiation [33–36]. We expect that this holds for PHTS and ASD too. These co-occurring, preexisting or emerging latent driver mutations [26] strengthen the signaling, impacting the clinical outcome.
Results
A full-length PTEN contains 403 amino acids [37]. PTEN consists of the N-terminal PIP2-binding domain (PBD, residues 1-15), the phosphatase domain (residues 16-185), the C2 domain (residues 190-350), and the carboxy-terminal tail (CTT, residues 351-403) (Figure 1A). The C2 domain contains unstructured, intrinsically disordered region (IDR, residues 282-312). The CTT includes the PDZ binding motif (PDZ-BM, 401TKV403) at the C-terminal end. For catalysis, the phosphatase domain provides three critical catalytic residues in the active site; Asp92 in the WPD loop, and Cys124 and Arg130 in the P loop. Here, we performed comprehensive computational studies using MD simulations for PTEN mutants, and expression levels of PTEN splice isoforms in brain cells, with and without exon-harboring cancer and NDDs mutations. Our premise is that isoform-level gene products are the fundamental functional units in the mammalian cell. Combined, they give a more comprehensive outlook of signaling by cancer and NDDs variants. The simulations consist of PTEN at an anionic lipid bilayer, composed of the phospholipids, phosphatidylcholine, phosphatidylserine, and the phosphoinositides, PIP2 and PIP3 (Figure 1B). We only considered PTEN with missense point substitutions, since proteins with nonsense mutations and premature termination are not amenable to MD simulations. Eight missense mutations of PTEN were considered: six in the phosphatase (Y68H, H93R, A126T, R130Q, G132D, and R173C) and two in the C2 (F241S and D252G) domains (Figure 1C). Supplementary Table 1 lists the mutations, their types and likely outcomes, and the corresponding references. The types of mutations selected for the residues were chosen to have different chemical properties to ensure that the structural integrity of the protein can be observed due to the mutations within the simulation time. Among them, Y68H is in the core of the phosphatase domain and H93R is in the WPD loop (residues 88-98). The A126T, R130Q, and G132D mutations occur in and near the P loop (residues 123-130) with the catalytic signature motif, 123HCxxGxxR130 (where x is any amino acid). R173C is located at the interface between the phosphatase and C2 domains. For the C2 mutations, F241S is in the β-sandwich of the C2 domain and D252G is located at the interface between the two major domains. Our studies indicate that the PTEN mutants can effectively absorb the anionic lipid bilayer, similar to wild-type PTEN. However, the mutations significantly reduce protein stability and hinder substrate recruitment. The dynamics of the P loop were restrained due to the strong allosteric signals from the mutation sites, which would affect the PTEN’s catalytic activity. The initial configuration of PTEN mutants at the membrane is the “open-open” conformation [38–40], reflecting the relaxed PTEN conformation at the anionic lipid bilayer as observed in the wild-type case [41–43]. All PTEN mutants stably anchored in the anionic lipid bilayer. There are no dramatic changes in the deviations of the center of mass of the phosphatase and C2 domains from the bilayer surface, indicating stable contact of these two domains with the anionic lipid bilayer (Supplementary Figure 1). Multiscale coarse-grained MD simulations revealed the long-lasting interaction of an isolated C2 domain with the anionic lipid bilayer in the presence of the phosphoinositide lipid [44], indicating its intrinsic feature that targets the cell membrane. To compare with the full-length PTEN at the anionic membrane from the subsequent atomistic MD simulations [44], the binding modes of our PTEN mutants correspond to mode 1, which was defined as the ‘physical’ membrane binding mode. Both the phosphatase and C2 domains retained their initial secondary structures (Supplementary Figure 2), while the unstructured regions PBD, IDR, and CTT fluctuated greatly as their intrinsic nature. As observed in the wild-type PTEN system with the same lipid composition [41], the probability distribution functions of membrane contacts with the protein residues suggest five loops responsible for the membrane association (Supplementary Figure 3). The peaks in the distribution indicate loops PBD-pβ1(19DGFDL23) and pβ2-pα1 (41RLEGVYR47) in the phosphatase domain, and cβ1-cβ2 (205MFSGGTC211), CBR3 (260KQNKMLKKDK269), and Cα2 (327KANKDKANR335) in the C2 domain. In addition to the PBD, the two positively charged loops, pβ2-pα1 and CBR3, one from the phosphatase domain and the other from the C2 domain, are major membrane-binding interfaces of PTEN mutants. As observed in the wild-type systems, similar profiles of the distributions of the helix tilt angles for the helices in the phosphatase domain of PTEN mutants (Supplementary Figure 4) suggest that membrane absorption and orientation of the protein are highly affected by the lipid compositions in the bilayer [41].
Figure 1.

Sequence and mutations of PTEN. (A) The sequence of PTEN. In the sequence, the underlined residues highlight the mutation sites in the phosphatase and C2 domains, and the phosphorylated sites in the serine-threonine cluster of C-terminal tail. The residue letters are colored based on their amino acid types. (B) In silico model of the full-length PTEN interacting with the anionic lipid bilayer composed of DOPC:DOPS:PIP2:PIP3 (32:6:1:1, molar ratio). (C) Mapping of the residues for the mutations on the PTEN structure showing the phosphatase and C2 domains. P loop containing the catalytic signature motif 123HCxxGxxR130 is marked.
Y68H disrupts the core of the phosphatase domain and transmits strong allosteric signals to the active site, biasing the P loop dynamics
In wild-type PTEN, Tyr68 in pβ3 forms an aromatic cluster with Tyr88 in pβ4 and Phe104 in pα3. Y68H substitution disrupts this cluster (Figure 2A), resulting in the destruction of the salt bridge between Lys66 in pβ3 and Asp107 in pα3 (Figure 2B). The membrane absorption of the pβ2-pα1 loop in the phosphatase domain seems to be weaker than that of the other mutants and wild-type system (Supplementary Figure 3). The disruptions of key residue interactions cause a conformational change in the phosphatase domain, yielding a loosely packed core structure. This provides room for the mutant residue His68 to rotate its aromatic ring. The periodic fluctuations in the distance between HD1 at the ring and HB2 at the Cβ atom indicate the rotation of His68 aromatic sidechain (Figure 2C). In comparison with wild-type PTEN, no rotation of the aromatic ring of Tyr68 is monitored. To observe how the mutation allosterically affects the conformation of the active site, we identified the signal propagation pathways through the protein by calculating the dynamic correlated motion among residues using the weighted implementation of suboptimal paths (WISP) algorithm [45]. A number of optimal and suboptimal pathways were generated between the source residue, His68 (or Tyr68 for wild type), and the sink resides, Cys124 and Arg130, in the P loop (Figure 2D). The allosteric signal propagation through the protein illustrates that the mutant residue His68 is dynamically correlated with the P loop residues, Cys124, Lys125, Arg130, and Thr131. The strong allosteric signals due to the mutation transmitting through the active site constrain the P loop movement upwards from the bilayer surface (Figure 2E). In marked contrast to the mutant system, the allosteric signal nodes of Lys125 and Thr131 are absent in the propagation pathways from the wild-type residue Tyr68, implicating weak allosteric coupling to the P loop. For Y68H, the allosteric restraint on the P loop with the shifted conformation hampers the catalytic residue Arg130 recruitment of the substrate PIP3 (Figure 2F), which can lead to reduced catalytic activity.
Figure 2.

Destabilization of the core of phosphatase domain by Y68H. (A) The best representative conformation from the ensemble clusters highlighting the mutation site of Y68H. The wild-type PTEN is shown for comparison. In the cartoons, residues are colored based on their amino acid types. In wild-type PTEN, red dotted line denotes a salt bridge. (B) Violin plots representing the atomic pair distance between NZ of Lys66 in pβ3 and CG of Asp107 in pα3 for Y68H and wild-type PTEN. (C) The time series of atomic pair distances between HD1 and HB2 of His68 for Y68H (upper panel) and Tyr68 for wild-type PTEN (lower panel). (D) The allosteric pathways between the mutation site and P loop. The source residues are His68 for Y68H and Tyr68 for wild-type PTEN, and the sink residues are Cys124 and Arg130 for both proteins. Yellow beads represent the source and sink residues, and green beads denote the allosteric signal nodes. The blue lines represent the shortest allosteric paths. The P loop is colored yellow. (E) Superimpositions of the top five representative conformations of P loop for Y68H (left panel) and wild-type PTEN (middle panel). Superimposition of the first representative conformations of P loop from Y68H and wild-type PTEN (right panel). (F) The probability distribution of the center of mass distances between the guanidine group of Arg130 and the phosphate group in the inositol of PIP3 for Y68H and wild-type PTEN.
H93R in the WPD loop interrupts the catalytic site residues recruitment of the substrate
The P loop is highly positively charged, containing three cationic residues that facilitate the recruitment of the acidic substrate PIP3 to the catalytic pocket. For catalysis, three catalytically significant residues, Cys124 and Arg130 in the P loop and Asp92 in the WPD loop, align to coordinate PIP3 at the active site. The WPD loop in a closed conformation can bring Asp92 into the coordination, leading to high catalytic activity [46]. A point substitution H93R in the WPD loop amplifies the positively charged nature of the active site (Figure 3). The location of the WPD loop with respect to the P loop is comparable to the wild type (Supplementary Figure 5), suggesting that H93R preserves the closed loop conformation. However, the mutant residue Arg93 increases the interaction with the substrate PIP3, which seems to block the migration of the substrate to the catalytic site residues. This additional membrane interaction might be associated with the absence of the membrane contact of the Cα2 loop in the C2 domain (Supplementary Figure 3A).
Figure 3.
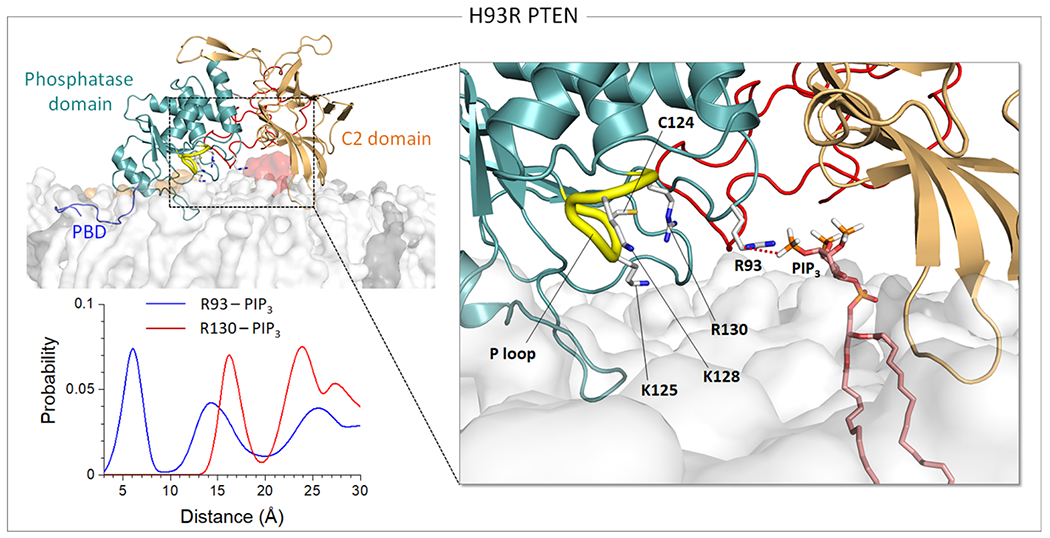
Hijacking of the substrate PIP3 by H93R in the WPD loop. Snapshot representing the best representative conformation from the ensemble clusters for H93R in the anionic lipid bilayer (top left). Highlight showing the interaction of the mutant residue Arg93 with PIP3 (right). The probability distribution of the center of mass distances between the guanidine groups of Arg93, or Arg130 for comparison, and the phosphate group in the inositol of PIP3 for H93R (bottom left).
The P loop mutations A126T and R130Q exhibit strong mutational effects, while G132D yields moderate mutational effects
The P loop contains the catalytic signature motif 123HCKAGKGR130, suggesting that any mutation of a P loop residue can alter the loop conformation. Our data illustrate that the direct P loop mutations, A126T and R130Q, and G132D nearby the P loop, induce a collapsed loop conformation (Figure 4A). In contrast, wild-type PTEN presents an extended (or relaxed) conformation of the P loop (Supplementary Figure 6), reaching for the substrate at the membrane. The extended P loop is populated for wild-type PTEN when the anionic bilayers contain both PIP2 and PIP3 [41]. Although our mutant systems contain the same phosphoinositide lipids as in the wild-type PTEN system [41], they yield the collapsed P loop conformation regardless of the lipid composition. Interestingly, both A126T and R130Q mutants show an open conformation of the WPD loop with increased distance from the P loop as compared to the wild type (Figure 4B). However, the G132D mutant maintains a closed conformation of the WPD loop with the distance from the P loop comparable to wild-type PTEN, suggesting that G132D exhibits weaker mutational effects compared to the other mutations.
Figure 4.

Collapsed loop conformation induced by A126T, R130Q, and G132D in the P loop. (A) The conformations of P loop and WPD loop for A126T, R130Q, and G132D. Key residues are marked, and the mutated residues are marked with yellow background. (B) Violin plots representing the atomic pair distance between Cα of His93 in the WPD loop and Cα of Arg130 (Gln130 for R130Q) in the P loop for A126T, G132D, and wild-type PTEN.
For catalysis, PTEN requires residual water molecules around the sidechains of Cys124 and Arg130 at the active site for hydrolysis to release the phosphate group from Cys124 after transferring it from PIP3 [46]. To delineate the catalytic activity in the mutant systems, we calculated the three-dimensional water density map in the region of the phosphatase domain (Figure 5). Compared to the wild-type system, low probability of water around the catalytic residues indicates that the active sites of A126T, R130Q, and G132D mutants are largely dehydrated. The severe dehydration in the active site of R130Q suggests that the mutational effect may be stronger than the other mutants. For R130Q, changes in the helix tilt angles for pα3 and pα5 are apparent when compared to wild-type PTEN (Supplementary Figure 4A).
Figure 5.

Water density maps reveal dehydration in the active site by the mutations. Three-dimensional water density map with probabilities P = 0.5 (yellow surface) and P = 0.4 (blue mesh) for A126T, R130Q, and G132D. Also showing wild-type PTEN for comparison. The protein structures depict the best representative conformation from the ensemble clusters. The mutated residues are marked with yellow background.
R173C at the interface disrupts the domain-domain interaction, allosterically biasing the P loop dynamics
In wild-type PTEN, Arg173 in pα6 of the phosphatase domain is important for maintaining the interdomain interaction at the interface between the phosphatase and C2 domains. It forms a strong salt bridge with Asp324 in the cβ7-cα2 loop, which induces the interdomain π-π stacking between Tyr177 in pα6 and Phe279 in cα1 (Figure 6A). In the R173C mutant, the absence of the salt bridge destabilizes the interface, resulting in the disruption of the π-π stacking. The removal of these key residue interactions increases the interdomain distance at the mutation site (Figure 6B). However, the opposite site of the interface is still maintained by the hydrophobic interaction between Pro95 in the WPD loop and Trp274 in cβ6, and an additional salt bridge formation between Gln97 in the WPD loop and Asp252 in cβ5. This unbalanced interaction in the interface induces the rotation of the C2 domain with respect to the phosphatase domain (Figure 6C), causing the loss of the membrane contact of the Cα2 loop in the C2 domain (Supplementary Figure 3A). The allosteric signaling pathways from the mutant residue Cys173 to the catalytic residue Arg130 seem to be stronger than those from the wild-type residue Arg173 (Figure 6D). This suggests that the R173C mutant allosterically constrains the P loop through the multiple shortest optimal pathways. The allosteric restraint on the P loop changes the loop conformation that moves upwards from the bilayer surface as observed in Y68H (Figure 6E). The shifted P loop location is highly elevated from the bilayer surface and adopts a collapsed loop conformation (Figure 6F), which induces the WPD loop open conformation. We observed that the substrate PIP3 is populated in the region of the C2 domain. The failure of the R173C mutant to recruit PIP3 by Arg130 (Figure 6G) indicates that it has a reduced catalytic activity.
Figure 6.

Disruption of the domain-domain interaction and allosteric constraint on the P loop by R173C at the interface. (A) The best representative conformation from the ensemble clusters highlighting the mutation site of R173C. Also showing wild-type PTEN for comparison. In the cartoons, residues are colored based on their amino acid types. Yellow dotted lines denote salt bridges. (B) Violin plots representing the atomic pair distance between Cα of Cys173 (Arg173 for wild-type PTEN) in pα6 and Cα of Asp324 in the cβ7-cα2 loop for R173C. (C) Superimposition of the first representative conformations of R173C and wild-type PTEN with respect to the phosphatase domain. (D) The allosteric pathways between the mutation site and P loop. The source residues are Cys173 for R173C and Arg173 for wild-type PTEN, and the sink residue is Arg130 for both proteins. Yellow beads represent the source and sink residues, and green beads denote the allosteric signal nodes. The blue lines represent the shortest allosteric paths. The P loop is colored yellow. (E) Superimposition of the first representative conformations of P loop from R173C and wild-type PTEN. (F) Snapshot representing the best representative conformation from the ensemble clusters for R173C. Highlight showing the interaction of PIP3 with the C2 domain. (G) The probability distribution of the center of mass distances between the guanidine group of Arg130 and the phosphate group in the inositol of PIP3 for R173C and wild-type PTEN.
F241S in the C2 domain exhibits behavior similar to wild-type PTEN, while D252G at the interface disrupts the domain-domain interaction
F241S in cβ4 resides in the pocket of the β-sandwich of the C2 domain, forming a hydrophobic cluster. D252G in cβ5 occurs at the interface between the phosphatase and C2 domains, similar to R173C. As expected, both C2 mutations increase the fluctuations in the C2 domain as compared to wild-type PTEN (Figure 7A). However, averaged deviations of the key basic residues from the bilayer surface are markedly different between these two C2 mutants (Figure 7B). The profile of averaged deviations of F241S resembles that of wild-type PTEN, but that of D252G is distinct. F241S shows a relatively weak membrane absorption of the pβ2-pα1 loop (Supplementary Figure 3B), and D252G alters the helix tilt angles for the helices in the phosphatase domain (Supplementary Figure 4B). F241S destabilizes the hydrophobic core of the β-sandwich (Figure 7C), affecting the dynamic correlations of motions of the residues in the C2 domain. The allosteric signal propagation from the mutant residue Ser241 to the active site avoids the signal nodes in the hydrophobic core, while the allosteric signals from the wild-type residue Phe241 transmit through the signal nodes in the hydrophobic core of the β-sandwich (Figure 7D). F241S obtains a single optimal pathway that passes more allosteric signal nodes than the wild type, indicating less effective allosteric connection to the active site. In contrast, D252G exhibits strong allosteric connection to the active site (Figure 7E). The allosteric signals from the wild-type residue Asp252 propagate through the signal nodes at the interface, Pro95 and Trp274, and in the WPD loop, Glu91, Asp92, His93, Asn94, and Pro96. However, the allosteric signal transmitting through the WPD loop is missing in the D252G mutant. The loss of the hydrophobic interaction due to the mutation destabilizes the interface (Figure 7F) and increases the interfacial distance (Figure 7G). D252G shows similar behavior as observed in R173C since both mutations occur in the same interface but at different sides.
Figure 7.

F241S destabilizes the C2 domain, and D252G disrupts the domain-domain interaction. (A) The root-mean-squared-fluctuations (RMSFs) of the C2 residues for F241S (left panel) and D252G (right panel). Thin orange lines represent the RMSF of wild type PTEN for comparison. (B) Averaged deviations of the amide nitrogen in the sidechains of Arg and Lys residues from the bilayer surface for the PIP3-favored residues in the phosphatase and C2 domains for F241S and D252G. Also showing wild-type PTEN for comparison. Error bars denote standard deviation. (C) Snapshot highlighting the hydrophobic core (surface representation in white) in the β-sandwich of C2 domain for F241S and wild-type PTEN. The protein structures depict the best representative conformation from the ensemble clusters. The allosteric pathways between the mutation site and P loop for (D) F241S and (E) D252G. In (D), the source residues are Ser241 and Phe241 for F241S and wild-type PTEN, respectively, and in (E) they are Gly252 and Asp252 for D252G and wild-type PTEN, respectively. The sink residue is Arg130 for all proteins. Yellow beads represent the source and sink residues, and green beads denote the allosteric signal nodes. The blue lines represent the shortest allosteric paths. The P loop is colored yellow. (F) The best representative conformation from the ensemble clusters highlighting the mutation site of D252G. In the cartoons, residues are colored based on their amino acid types. (G) Violin plots representing the atomic pair distance between Cα of Gly252 (Asp252 for wild-type PTEN) in cβ5 and Cα of Gln97 in the WPD for D252G.
The sampled mutant conformations relate to phenotypic presentations
In our studies, the phosphatase mutations associated with cancer, PHTS, and NDDs, while the C2 mutations preferentially relate to NDDs (Supplementary Table 1). Principal component analysis (PCA) of the sampled conformations found that the macrocephaly/ASD related mutations, H93R and F241S, favor sampling conformations present in wild-type PTEN (Supplementary Figure 7). In contrast, the sampled conformations for the cancer and PHTS-related mutations, Y68H, A126T, and G132D, differ from those of wild-type PTEN. The interface mutations R173C and D252G favor sampling similar conformations. Interestingly, although the sampled conformations for R130Q can overlap those of the wild-type PTEN, the function of the mutant protein largely differs. We suspect that a key structural effect of the PTEN missense mutation at the membrane is an impact on the dynamics and conformation of the P loop. The strong PTEN mutations, Y68H and R173C, which are distant from the active site, constrain the P loop through a strong allosteric signal, while R130Q, the mutation directly on the P loop, strongly controls the loop conformation. It was reported that cancer or PHTS-associated mutations targeting the P loop of PTEN resulted in complete loss of protein function [47].
PTEN variants expression for NDD vs. non-NDD
PTEN mutations are associated with various diseases including PHTS, cancer, and NDDs. Some PTEN mutations are preferentially expressed in a certain disease type, but mutations can share disease phenotypes (Supplementary Table 1). Here, the NDD-related mutations are H93R, F241S, and D252G that appear responsible for macrocephaly/autism syndrome [13]. The PTEN gene is located on chromosome 10 and contains nine exons. The longest human PTEN splicing isoform is encoded by the transcript ENST00000371953, with exon 3 (Y68H) and exon 6 (R173C) being impacted by the non-NDD mutations, exon 7 (F241S and D252G) by the NDD mutations, and exon 5 (H93R, A126T, R130Q, and G132D) by both the NDD and non-NDD mutations (Figure 8A).
Figure 8.

Expression of PTEN splicing isoforms as a function of time, and mapping autism and cancer mutations on their exons. (A) Schematic overview of chromosome 10, and the location of human PTEN gene on the long arm of the chromosome (marked by thin red bar). The PTEN gene contains nine exons. Mapping of variants implicated in neurodevelopmental disorder (NDD, pink) and those from other diseases (non-NDD, green) to PTEN splicing isoforms. Exons 3 and 6 are marked as carrying non-NDD mutations. Exon 5 is marked as carrying both NDD and non-NDD mutations. Exon 7 is marked as carrying NDD mutations. (B) Expression of PTEN isoforms in the developing human brain for which expression levels are available. The isoform expression data was quantified by the PsychEncode Consortium. Three PTEN isoforms (red, green and purple) are highly expressed prenatally, and their expression levels decrease after birth. PTEN isoforms and their associated exons and mutations are marked. Transcripts with NDD-related mutations alone or in combination with non-NDD mutations tend to have high prenatal expression, while transcripts lacking NDD mutations have lower prenatal expression within the measured lifespan.
Two other transcripts (ENST00000498703 and ENST00000472832) are shorter isoforms that carry the above combinations of mutations, except that exon 6 in the ENST00000472832 isoform (87952199-87952259, GRCh38.p13) is slightly (~80 bp) shorter than the same exon in the ENST00000371953 isoform (87952118-87952259, GRCh38.p13) due to alternative splicing, and it therefore carries only two NDD mutations in its exon 7 (F241S and D252G) and is missing a non-NDD mutation R173C from exon 6. There are additional isoforms comprising exons 1 and 2 that do not carry any known disease risk mutations. We quantified the expression levels of these five isoforms from the RNA-seq dataset of the developing human brain BrainSpan [48, 49], as we have described previously [50], and observed that three PTEN isoforms (ENST00000371953, ENST00000472832, and ENST00000498703) are highly expressed prenatally, and their expression levels decrease after birth (Figure 8B). The remaining two isoforms (ENST00000487939 and ENST00000462694) that are not impacted by mutations, are lowly expressed in the developing brain. Interestingly, the isoform ENST00000472832 with the shorter exon 6 that appears primarily impacted only by the NDD mutations, is the second highly expressed PTEN isoform, which may have further implications for NDD biology.
Not all PTEN transcript data result in a protein product. In disease, the PTEN gene can encode protein variants with mutations that are nonsense, frameshift, and deletion/insertion PTEN variants. As to variant expression, two PTEN transcripts, ENST00000371953 and ENST00000472832 are translated into proteins, whereas ENST00000498703 is not. Its deleted segment results in PTEN’s premature termination of translation, thus lower protein concentration in the cell. ENST00000498703 carries 5 mutations but lacks the ASD-associated mutations F241S and D252G. F241S and D252G are in exon 7, which is in the deleted part. The decreased levels of the PTEN protein due to the ENST00000498703 transcript in the cell are associated with mostly cancer and PHTS, and possibly ASD. This suggests that the lower level of the protein, a tumor suppressor, suppresses PTEN phosphate activity by diluting its concentration at the plasma membrane. Further, both ENST00000371953 and ENST00000472832 transcripts encode PTEN variants with missense mutations. Although these variants are able to bind to the membrane surface, their phosphatase activities may differ depending on the location in the structure and the chemistry of the mutations which are associated with the different disorders, as we observed and suggested from the atomistic modeling studies. Figure 9 clarifies how these mutational variants contribute to the level of PTEN in the non-functional state in the cell.
Figure 9.

PTEN translation and translocation to the plasma membrane. Schematic overview of PTEN translation from the ENST00000371953 (left), ENST00000472832 (middle), and ENST00000498703 (right) transcripts. ENST00000371953 translates a full-length PTEN (403 aa) protein that carries 8 mutations in exon 3, exon 5, exon 6, and exon 7 (light blue). These mutations are associated with cancers, PHTS, and ASD. ENST00000472832 translates a C-terminal truncated PTEN (344 aa) that carries 2 mutations on exon 7. Mutations on exon 7 are closely related to ASD. ENST00000498703 carries 5 mutations in exon 3 and exon 5. However, ENST00000498703 terminates protein translation prematurely, resulting in dilution of the protein concentration in the plasma membrane. No PTEN translocation to the membrane means no tumor suppressor activity and thus disease. The ENST00000498703 variants are associated with cancers, PHTS, and ASD. Abbreviations: e1, e2, … e9, exon 1, exon 2, … exon 9; PTP, phosphatase domain.
Discussion
The PTEN gene encodes the second most frequently mutated protein in human cancer following TP53 [51]. The most common PTEN mutations are nonsense, frameshift, and deletion/insertion [52]. They likely result in premature termination of translation, which would decrease the level of PTEN protein in the cell. In addition, a considerable number of PTEN mutations are missense point substitutions [53] that may result in loss of protein function including reduced catalytic activity and protein stability at the membrane. Missense mutations including indel mutations are commonly located at the phosphatase domain, while nonsense mutations including truncation and frameshift are largely found in the C2 domain [52, 53]. In addition to the mutations, posttranslational modifications (PTMs) on the C-terminal tail through the phosphorylation of Ser/Thr cluster (Ser380, Thr382, Thr383, and Ser385) (Figure 1A) hamper PTEN’s cellular membrane localization, silencing its catalytic activity [54–56]. In human malignancies, premature terminations, missense and nonsense mutations, frameshift mutations with frame deletion, PTMs including phosphorylation, ubiquitination, oxidation of active-site, and acetylation, elevate uncontrolled PI3K-stimulated cell growth and survival [57–64]. Large scale experimental deep mutational scanning [65, 66] and machine learning approaches [67] have been exploited to reveal genotype-phenotype relationships and distinguish between PTEN phenotypes.
Here, we considered six PTEN mutations in the phosphatase domain (Y68H, H93R, A126T, R130Q, G132D, and R173C) and two in the C2 domain (F241S and D252G). Our studies demonstrate that PTEN mutants retain the wild-type capability of membrane absorption to the anionic lipid bilayer [68]. However, the dynamics of the P loop, the WPD loop conformation, the hydration of the active site, and the substrate recruitment were greatly affected by the mutations. Y68H is associated with CS, BRRS, and glioblastoma, which is known to be affected by the loss of phosphatase activity and protein stability [68–73]. In our simulations, Y68H disrupted the core of the phosphatase domain and allosterically constrained the P loop, which hinders the recruitment of the substrate PIP3. The NDD-related mutation H93R is responsible for the macrocephaly/autism syndrome, displaying a modest loss of catalytic activity [47, 74, 75]. In our structural model, H93R in the WPD loop hijacked the substrate PIP3, interrupting the catalytic site residues recruitment of the substrate for catalysis. But the mutant protein preserved the closed WPD loop conformation. For the P loop mutations, A126T is found in endometrial and ovarian carcinomas [76], and R130Q is shared by CS and endometrial carcinoma [53, 68]. In our simulations, these mutations yielded a collapsed conformation of the P loop, resulting in the loss of contact with the WPD loop. G132D near the P loop, which is associated with endometrial carcinoma and ASD [70, 77], also exhibited the collapsed P loop conformation but preserved the closed WPD loop conformation. We observed that the PTEN mutations in the P loop, or nearby, cause dehydration in the active site, where water molecules are important for hydrolysis to release the phosphate group from the active site [46]. R130Q exhibited more severe dehydration than the other mutants. At the interface between the phosphatase and the C2 domains, R173C is associated with cancer, such as glioblastoma and endometrial carcinoma [68, 78]. We found that R173C disrupts the domain-domain interaction, allosterically biasing the P loop dynamics. Similar behavior was observed for the C2 mutation D252G at the interface. However, the other C2 mutation, F241S in the β-sandwich of C2 domain, exhibited less effective allosteric connection to the catalytic site than that observed in wild-type PTEN. Both NDD-related C2 mutations F241S and D252G are responsible for macrocephaly/autism syndrome [47, 70, 75, 79, 80].
Total loss of protein function can occur when PTEN has: (i) reduced protein expression due to truncation and (ii) PTM, i.e., C-terminal tail phosphorylation in solution. In these cases, PTEN is totally removed from the cell membrane, dismissing its catalytic activity [54–56]. On the other hand, PTEN with missense mutations can effectively absorb the cell membrane, exhibiting function with reduced activity [68]. We characterized the structural integrity of how PTEN degrades its function at the membrane due to missense mutations. Our membrane bound PTEN mutants exhibited key structural features: (i) allosteric constraint on the P loop, (ii) collapsed P loop, (iii) dehydration of the active site, (iv) open conformation of the WPD loop, and (v) failure of PIP3 recruitment. Although the simulations cannot directly assay PTEN lipid phosphatase activity, the failure in the coordination of the substrate PIP3 at the catalytic residues is a corollary of all the above structural features that lead to silencing PTEN catalytic activity. The phosphatase mutations, Y68H, A126T, R130Q, and R173C have all the above structural features induced by the mutations (Supplementary Table 2), suggesting that these proteins appear to exhibit a strong mutational effect. In contrast, the NDD-related H93R and F241S exhibit a weak mutational effect with few structural features by the mutations. Both cancer- and NDD-related G132D and only NDD-related D252G exhibit an intermediate mutational effect with the structural features by the mutations. Recent comprehensive dataset based on fitness scores using Mann-Whitney U test indicated that ASD PTEN variants (NDD mutations) are hypomorphic for lipid phosphatase activity, less severe than PHTS-associated PTEN variants (non-NDD) [65].
These distinct structural features in PTEN mutations appear to be related to mutation strength and the timing of expression of transcripts that determine the cancer and NDD outcomes. PTEN contains nine exons, and its mutations largely occur in exon 5, followed by exon 7, 3, and 6 [81]. Most missense mutations occur within the phosphatase domain, while the C2 domain mainly accommodates nonsense mutations. The largest exon 5 encodes the PTEN residues 84-164 including the catalytic signature motif, 123HCxxGxxR130. Up to 40% of all germline mutations are located in exon 5 [82]. Our analysis of the developing brain isoform expression data indicates that if the transcript has NDD-related mutations, alone or in combination with non-NDD mutations, it tends to have high prenatal expression. If it does not have NDD mutations within the measured lifespan, it has lower prenatal expression. Our data further indicates that exons 3 and 6 appear to carry non-NDD mutations. Exon 5 is impacted by both NDD and non-NDD mutations, while exon 7 is impacted only by NDD mutations. Thus, while additional data points are needed for validation, current observations suggest that exons 3 and 6 are associated with non-NDD mutations, exon 7 is associated only with NDD mutations without carrying non-NDD mutations, and exon 5 carries both. Since emergence of cancer requires multiple mutations, and NDD carriers harbor at least one NDD mutation, NDD mutation carriers harboring exon 5 and/or exon 7 are at higher risk to cancer. Thus, we expect that as compared to the absence of NDDs, the life expectancy of PTEN variants carrying exons 5 and 7 can be strongly associated with an increased lifetime risk of certain cancers [83].
Classification is essential to relate the mutations to the phenotype they are associated with. For NDDS, it is challenging on two counts: (i) The statistics of NDDs are small. One major reason is the difficulty in diagnosis. The phenotypes are often mild and overlooked. In addition, each disorder is characterized by several features making its distinct identification in epidemiological studies challenging. (ii) NDDs comorbidity, or overlap, is common [84]. Examples include intellectual disability, autism, and ADHD. Comorbidity can lead to different diagnosis in the literature. Additionally, (iii) NDD mutations can contribute to cancer. Taken together, a protein variant can be observed in more than a single disease, with the difficulties in identification hampering epidemiological statistics. This also holds for PTEN mutations which are associated with multiple diseases [85–87]. Detection and classification of PTEN clinical features are challenging and uncertain [88–92], since the phenotypes can be muted, and the methods for their identifications differ. Here, our classifications are based on currently available databases, which provide statistics, thus probabilities, of variants and diseases, based on observations documented in the literature.
Conclusions
PTEN, like other proteins in the signaling networks of the Ras superfamily and their associated regulatory proteins harbor mutations connected with cancer and with NDDs. As a phosphatase, PTEN is undruggable. Its associated interactome can be. Early diagnosis could help in NDD pharmacology. Identifying the mutations acting in cancer, NDD, or both has been challenging. The timing of the expression is a major determinant, during embryonic development or sporadic, throughout life in cancer. Here our data suggest that mutation strength is another crucial factor. To determine the mutation strength, we exploit the conformations sampled by the mutants. If the conformations are biased toward the wild type, we interpret the mutational effect as low/mild, preferentially acting in NDD. If they differ, adopting catalytically favored states, we label them as tending to strong hotspots. In kinases, strong mutations result in a larger population of active molecules, allowing stronger signals to enter the cell cycle to promote proliferation [14, 20]. For phosphatase repressors such as PTEN, strong mutations result in loss of function. We suggest sampling as a general approach toward defining the likelihood of mutations to act in distinct pathology in diagnosis. The atomistic MD simulations used here are limited by molecular size, and the number of proteins and mutations. Accelerated MD can be applied on a broader scale. It could also be employed as a first step in sequence sensitive, deep modeling [93]. We expect that other proteins bearing NDD connected mutations also display biased conformations.
MD simulations are a powerful tool to gain insight into the molecular behavior of proteins, wild type, and mutants. However, in the living cell, the conformational behavior is not stand-alone, and the mutant behavior is insufficient in determining cell transformation [14, 20]. In addition to the mutation strength, determinants of signal strength include mechanisms that can block or enhance the signal, the types, and locations of additional co-occurring, latent driver mutations, and critically, the expression levels of the respective isoforms, and of cross-talking proteins in the pathway that regulate the protein variants. Signal levels vary across cell types, states, and time windows, with chromatin structure and alternative splicing playing key roles. A strong mutation can be constrained by low expression level, and a weak/moderate mutation can be strengthened by high expression. Considering the spatio-temporal isoform expression in relevant tissues and cell types in conjunction with mutations can help unravel the molecular mechanisms driving human disease. It can also clarify why all mutations can contribute to all three disorders, cancer, PHTS, and NDDs. Mutation strength is critical. However, it can be bolstered by the latent mutational background. Single mutations do not determine disease nor cell fate. This would be too risky for evolution. Here we hypothesize that as in cancer, multiple mutations are involved in NDDs too.
Further, here we observe that expression levels of splicing isoforms harboring NDD, and mixed NDD/cancer mutations are elevated at the prenatal stage, dropping following birth. The mapping of these mutations on the respective exons in the isoforms, can be among the factors foretelling life expectancy. Taken together, here we made major strides, illuminating how same mutations can be involved in different disorders and clarified experimental data.
Materials and methods
Construction of full-length PTEN protein with mutations
To generate the initial configuration of full-length PTEN mutants, we adopted the conformations of wild-type PTEN interacting with the membrane from previous studies [41]. Explicit membrane simulations generated the fully relaxed wild-type proteins on an anionic lipid bilayer composed of DOPC:DOPS:PIP2:PIP3 (32:6:1:1 molar ratio). The wild-type sequence was modified to generate eight different PTEN mutants with each point mutation of Y68H, H93R, A126T, R130Q, G132D, R173C, F241S, and D252G. The anionic lipid bilayer with the same lipid compositions as in the wild-type system were reconstructed for the adopted mutant proteins. For all mutant systems, the initial configuration ensured that the PBD, phosphatase domain, and C2 domain were placed on the top of the bilayer surface without inserting the protein backbone into the bilayer, but the C-tail resided in bulky region without interacting with the lipid bilayer. Both PBD and C-tail were modeled as unstructured chains.
Atomistic molecular dynamics simulations
MD simulations were performed on PTEN mutant systems using the updated CHARMM program with the modified all-atom force field (version 36m) [94–96]. Our computational studies closely followed the same protocol as in our previous works [41, 97–110]. The membrane simulations were performed with the anionic lipid bilayer generated by the bilayer-building protocol involving the interactions of pseudospheres through the vdW (van der Waals) force field [111, 112]. A unit cell with lateral cell dimension of ~120 Å2 containing a total of 400 lipids constitutes the bilayer with TIP3P waters, added at both sides with lipid/water ratio of ~1/130. The cross-sectional areas per lipid 72.4 Å2 and 65.3 Å2 for DOPC and DOPS [113], respectively, were used to obtain the optimal value of lateral cell dimension. Sodium and chlorine ions were added to generate a final ionic strength of ~100 mM and neutralize the system. Prior to productions runs, a series of minimization and dynamics cycles were performed for the solvents including ions and lipids with a harmonically restrained protein backbone until the solvent reached 310 K. Next, preequilibrium simulations with dynamic cycles were performed while gradually releasing the harmonic restraints on the backbones of PTEN mutants. The particle mesh Ewald (PME) method was used to calculate the long-range electrostatic interaction, and the van der Waals (vdW) interactions using switching functions with the twin range cutoff at 12 Å and 14 Å were calculated for the short-range interaction between atoms.
In the production runs, the Nosé-Hoover Langevin piston control algorithm was used to sustain the pressure at 1 atm (1.01325 bar), and the Langevin thermostat method was employed to maintain the constant temperature at 310 K. The SHAKE algorithm was applied to constrain the motion of bonds involving hydrogen atoms. Simulations were performed for eight mutant systems each with 1 μs, and additional simulations for the same systems were also performed to check reproducibility. We found that the results were consistent between replicates, providing reproducibility of the critical results. Both independent simulations reproduced stable contact of the phosphate and C2 domains with the anionic lipid bilayer (Supplementary Figure 8). In terms of orientation, we observed that the α-helices in the phosphate domain were stably oriented with respect to the membrane for both independent simulations. The production runs were performed with the NAMD parallel-computing code [114] on a Biowulf cluster at the National Institutes of Health (Bethesda, MD). The result analysis was performed in the CHARMM program [94]. To determine the most populated conformation, the ensemble clustering in Chimera based on pairwise best-fit RMSD values [115] was implemented to obtain the clusters, their sizes, and the conformational representatives. In the clustering, 10,000 frames for each system were employed in Ensemble Cluster using a tool in the MD/Ensemble Analysis categories. The weighted implementation of suboptimal path (WISP) [45] algorithm was used to identify the allosteric signal propagation pathways through the protein. In the pathway calculation, the contact map distance between node pairs was set to 4.5 Å, and the value of the desired number of paths was set to 10. To observe conformational changes in proteins, the normal mode analysis (NMA) and principal component analysis (PCA) were conducted by the ProDy program [116].
PTEN variants mapping and visualization
For variants mapping, eight PTEN mutations were considered: six in the phosphatase (Y68H, H93R, A126T, R130Q, G132D, and R173C) and two in the C2 (F241S and D252G) domains. The PTEN isoform structures were retrieved from the Release 42 (GRCh38.p13) of human genome on the GENCODE website (https://www.gencodegenes.org/human/). In total, we extracted isoform structures for seven PTEN isoforms. Only 5 isoforms, for which expression data was available, are shown in Figure 8. When we mapped PTEN variants to the isoforms, we only considered the exonic regions. The variants are grouped by the disease status (NDD vs. Non-NDD) and the two groups of variants are mapped and visualized separately. To perform the variants mapping, we used R language (v4.0.5) and RStudio. The Tidyverse package in R was used for data processing and data analysis. To generate the schematic figure for visualization of variants mapping results in Figure 8A, we used the Gviz package in R (https://github.com/IakouchevaLab/PTEN).
PTEN expression line plots
The expression profiles of PTEN isoforms were retrieved from the BrainSpan dataset [83] which is an RNA-Seq datasets quantified at the gene and isoform levels and we downloaded it from PsychENCODE Knowledge Portal, PEC Capstone Collection, Synapse ID: syn8466658 (https://www.synapse.org/#!Synapse:syn12080241). The expression data was available for 5 out of 7 PTEN isoforms. For isoform expression level, transcripts per million (TPM) was used and log transformed. We used R language (v4.0.5) and RStudio to perform this analysis. The Tidyverse package in R was used for data processing, and the ggplot2 package in R (https://github.com/IakouchevaLab/Isoform_BrainSpan/tree/master/scripts/utility) was used for data visualization in Figure 8B.
Supplementary Material
Highlights.
PTEN trigger distinct phenotypic outcomes, cancer or neurodevelopmental disorders
Phosphatase domain mutations are mainly associated with cancer, PHTS, and autism
C2 domain mutations are largely related to autism
Exon 5 is impacted by both NDD and non-NDD mutations
Exon 7 is impacted only by NDD mutations
Acknowledgements
LMI was supported by R01MH109885 and R01MH108528. This project has been funded in whole or in part with federal funds from the National Cancer Institute, National Institutes of Health, under contract HHSN261201500003I. The content of this publication does not necessarily reflect the views or policies of the Department of Health and Human Services, nor does mention of trade names, commercial products, or organizations imply endorsement by the U.S. Government. This Research was supported [in part] by the Intramural Research Program of the NIH, National Cancer Institute, Center for Cancer Research. All simulations had been performed using the high-performance computational facilities of the Biowulf PC/Linux cluster at the National Institutes of Health, Bethesda, MD (https://hpc.nih.gov/).
Abbreviations
- PTEN
phosphatase and tensin homolog
- PI3K
phosphoinositide 3-kinase
- PIP3
phosphatidylinositol 3,4,5-trisphosphate
- PIP2
phosphatidylinositol 4,5-bisphosphate
- NDD
neurodevelopmental disorder
- PHTS
PTEN hamartoma tumor syndrome
- CS
Cowden syndrome
- BRRS
Bannayan-Riley-Ruvalcaba syndrome
- ASD
autism spectrum disorder
- ADHD
attention-deficit/hyperactivity disorder
- MD
molecular dynamics
- PBD
PIP2-binding domain
- CTT
carboxy-terminal tail
- IDR
intrinsically disordered region
- PTM
posttranslational modification
Footnotes
Publisher's Disclaimer: This is a PDF file of an unedited manuscript that has been accepted for publication. As a service to our customers we are providing this early version of the manuscript. The manuscript will undergo copyediting, typesetting, and review of the resulting proof before it is published in its final form. Please note that during the production process errors may be discovered which could affect the content, and all legal disclaimers that apply to the journal pertain.
CRediT author statement
Hyunbum Jang: Conceptualization, Methodology, Software, Formal analysis, Investigation, Writing - Original Draft, Resources, Writing - Review & Editing, Visualization, Project administration. Jiaye Chen: Software, Data Curation, Visualization. Lilia M Iakoucheva: Software, Data Curation, Supervision. Ruth Nussinov: Conceptualization, Resources, Writing - Review & Editing, Supervision, Project administration.
Declaration of interests
The authors declare that they have no known competing financial interests or personal relationships that could have appeared to influence the work reported in this paper.
References
- 1.Tu T, Chen J, Chen L, Stiles BL (2020). Dual-Specific Protein and Lipid Phosphatase PTEN and Its Biological Functions. Cold Spring Harb Perspect Med. 10, a036301. [DOI] [PMC free article] [PubMed] [Google Scholar]
- 2.Georgescu MM (2010). PTEN Tumor Suppressor Network in PI3K-Akt Pathway Control. Genes Cancer. 1, 1170–1177. [DOI] [PMC free article] [PubMed] [Google Scholar]
- 3.Koboldt DC, Miller KE, Miller AR, Bush JM, McGrath S, Leraas K, Crist E, Fair S, et al. (2021). PTEN somatic mutations contribute to spectrum of cerebral overgrowth. Brain. 144, 2971–2978. [DOI] [PMC free article] [PubMed] [Google Scholar]
- 4.Sansal I, Sellers WR (2004). The biology and clinical relevance of the PTEN tumor suppressor pathway. J Clin Oncol. 22, 2954–2963. [DOI] [PubMed] [Google Scholar]
- 5.Morris-Rosendahl DJ, Crocq MA (2020). Neurodevelopmental disorders-the history and future of a diagnostic concept. Dialogues Clin Neurosci. 22, 65–72. [DOI] [PMC free article] [PubMed] [Google Scholar]
- 6.Busch RM, Srivastava S, Hogue O, Frazier TW, Klaas P, Hardan A, Martinez-Agosto JA, Sahin M, et al. (2019). Neurobehavioral phenotype of autism spectrum disorder associated with germline heterozygous mutations in PTEN. Transl Psychiatry. 9, 253. [DOI] [PMC free article] [PubMed] [Google Scholar]
- 7.Abkevich VI, Gutin AM, Shakhnovich EI (1995). Impact of local and non-local interactions on thermodynamics and kinetics of protein folding. J Mol Biol. 252, 460–471. [DOI] [PubMed] [Google Scholar]
- 8.Cummings K, Watkins A, Jones C, Dias R, Welham A (2022). Behavioural and psychological features of PTEN mutations: a systematic review of the literature and meta-analysis of the prevalence of autism spectrum disorder characteristics. J Neurodev Disord. 14, 1. [DOI] [PMC free article] [PubMed] [Google Scholar]
- 9.Pilarski R, Burt R, Kohlman W, Pho L, Shannon KM, Swisher E (2013). Cowden syndrome and the PTEN hamartoma tumor syndrome: systematic review and revised diagnostic criteria. J Natl Cancer Inst. 105, 1607–1616. [DOI] [PubMed] [Google Scholar]
- 10.Yehia L, Ni Y, Sadler T, Frazier TW, Eng C (2022). Distinct metabolic profiles associated with autism spectrum disorder versus cancer in individuals with germline PTEN mutations. NPJ Genom Med. 7, 16. [DOI] [PMC free article] [PubMed] [Google Scholar]
- 11.Tan MH, Mester JL, Ngeow J, Rybicki LA, Orloff MS, Eng C (2012). Lifetime cancer risks in individuals with germline PTEN mutations. Clin Cancer Res. 18, 400–407. [DOI] [PMC free article] [PubMed] [Google Scholar]
- 12.Buxbaum JD, Cai G, Chaste P, Nygren G, Goldsmith J, Reichert J, Anckarsater H, Rastam M, et al. (2007). Mutation screening of the PTEN gene in patients with autism spectrum disorders and macrocephaly. Am J Med Genet B Neuropsychiatr Genet. 144B, 484–491. [DOI] [PMC free article] [PubMed] [Google Scholar]
- 13.Butler MG, Dasouki MJ, Zhou XP, Talebizadeh Z, Brown M, Takahashi TN, Miles JH, Wang CH, et al. (2005). Subset of individuals with autism spectrum disorders and extreme macrocephaly associated with germline PTEN tumour suppressor gene mutations. J Med Genet. 42, 318–321. [DOI] [PMC free article] [PubMed] [Google Scholar]
- 14.Nussinov R, Tsai CJ, Jang H (2022). A New View of Activating Mutations in Cancer. Cancer Res. 82, 4114–4123. [DOI] [PMC free article] [PubMed] [Google Scholar]
- 15.Nussinov R, Tsai CJ, Jang H (2022). How can same-gene mutations promote both cancer and developmental disorders? Sci Adv. 8, eabm2059. [DOI] [PMC free article] [PubMed] [Google Scholar]
- 16.Nussinov R, Tsai CJ, Jang H (2022). Neurodevelopmental disorders, immunity, and cancer are connected. iScience. 25, 104492. [DOI] [PMC free article] [PubMed] [Google Scholar]
- 17.Fruman DA, Chiu H, Hopkins BD, Bagrodia S, Cantley LC, Abraham RT (2017). The PI3K Pathway in Human Disease. Cell. 170, 605–635. [DOI] [PMC free article] [PubMed] [Google Scholar]
- 18.Nussinov R, Yavuz BR, Arici MK, Demirel HC, Zhang M, Liu Y, Tsai CJ, Jang H, Tuncbag N (2023). Neurodevelopmental disorders, like cancer, are connected to impaired chromatin remodelers, PI3K/mTOR, and PAK1-regulated MAPK. Biophys Rev 15, 163–181. [DOI] [PMC free article] [PubMed] [Google Scholar]
- 19.Vitucci M, Karpinich NO, Bash RE, Werneke AM, Schmid RS, White KK, McNeill RS, Huff B, et al. (2013). Cooperativity between MAPK and PI3K signaling activation is required for glioblastoma pathogenesis. Neuro Oncol. 15, 1317–1329. [DOI] [PMC free article] [PubMed] [Google Scholar]
- 20.Nussinov R, Tsai CJ, Jang H (2022). Allostery, and how to define and measure signal transduction. Biophys Chem. 283, 106766. [DOI] [PMC free article] [PubMed] [Google Scholar]
- 21.Ingram K, Samson SC, Zewdu R, Zitnay RG, Snyder EL, Mendoza MC (2022). NKX2-1 controls lung cancer progression by inducing DUSP6 to dampen ERK activity. Oncogene. 41, 293–300. [DOI] [PMC free article] [PubMed] [Google Scholar]
- 22.Mukherjee R, Vanaja KG, Boyer JA, Gadal S, Solomon H, Chandarlapaty S, Levchenko A, Rosen N (2021). Regulation of PTEN translation by PI3K signaling maintains pathway homeostasis. Mol Cell. 81, 708–723 e705. [DOI] [PMC free article] [PubMed] [Google Scholar]
- 23.Guo L, Zhu K, Pargett M, Contreras A, Tsai P, Qing Q, Losert W, Albeck J, Zhao M (2021). Electrically synchronizing and modulating the dynamics of ERK activation to regulate cell fate. iScience. 24, 103240. [DOI] [PMC free article] [PubMed] [Google Scholar]
- 24.Chen WS, Liang Y, Zong M, Liu JJ, Kaneko K, Hanley KL, Zhang K, Feng GS (2021). Single-cell transcriptomics reveals opposing roles of Shp2 in Myc-driven liver tumor cells and microenvironment. Cell Rep. 37, 109974. [DOI] [PMC free article] [PubMed] [Google Scholar]
- 25.Yavuz BR, Arici MK, Demirel HC, Tsai CJ, Jang H, Nussinov R, Tuncbag N (2023). Neurodevelopmental disorders and cancer networks share pathways, but differ in mechanisms, signaling strength, and outcome. NPJ Genom Med. doi: 10.1038/s41525-41023-00377-41526. [DOI] [PMC free article] [PubMed] [Google Scholar]
- 26.Yavuz BR, Tsai CJ, Nussinov R, Tuncbag N (2023). Pan-cancer clinical impact of latent drivers from double mutations. Commun Biol. 6, 202. [DOI] [PMC free article] [PubMed] [Google Scholar]
- 27.Lu D, Song J, Lu Y, Fall K, Chen X, Fang F, Landen M, Hultman CM, et al. (2020). A shared genetic contribution to breast cancer and schizophrenia. Nat Commun. 11, 4637. [DOI] [PMC free article] [PubMed] [Google Scholar]
- 28.Lu C, Jin D, Palmer N, Fox K, Kohane IS, Smoller JW, Yu KH (2022). Large-scale real-world data analysis identifies comorbidity patterns in schizophrenia. Transl Psychiatry. 12, 154. [DOI] [PMC free article] [PubMed] [Google Scholar]
- 29.Nordentoft M, Plana-Ripoll O, Laursen TM (2021). Cancer and schizophrenia. Curr Opin Psychiatry. 34, 260–265. [DOI] [PubMed] [Google Scholar]
- 30.Liu Q, Yin W, Meijsen JJ, Reichenberg A, Gadin JR, Schork AJ, Adami HO, Kolevzon A, et al. (2022). Cancer risk in individuals with autism spectrum disorder. Ann Oncol. 33, 713–719. [DOI] [PubMed] [Google Scholar]
- 31.Achterberg J, Collerrain I, Craig P (1978). A possible relationship between cancer, mental retardation and mental disorders. Soc Sci Med (1967). 12, 135–139. [PubMed] [Google Scholar]
- 32.Liu Q, Adami HO, Reichenberg A, Kolevzon A, Fang F, Sandin S (2021). Cancer risk in individuals with intellectual disability in Sweden: A population-based cohort study. PLoS Med. 18, e1003840. [DOI] [PMC free article] [PubMed] [Google Scholar]
- 33.Loeb LA, Loeb KR, Anderson JP (2003). Multiple mutations and cancer. Proc Natl Acad Sci U S A. 100, 776–781. [DOI] [PMC free article] [PubMed] [Google Scholar]
- 34.Saito Y, Koya J, Kataoka K (2021). Multiple mutations within individual oncogenes. Cancer Sci. 112, 483–489. [DOI] [PMC free article] [PubMed] [Google Scholar]
- 35.Tomasetti C, Vogelstein B, Parmigiani G (2013). Half or more of the somatic mutations in cancers of self-renewing tissues originate prior to tumor initiation. Proc Natl Acad Sci U S A. 110, 1999–2004. [DOI] [PMC free article] [PubMed] [Google Scholar]
- 36.Boland CR, Ricciardiello L (1999). How many mutations does it take to make a tumor? Proc Natl Acad Sci U S A. 96, 14675–14677. [DOI] [PMC free article] [PubMed] [Google Scholar]
- 37.Lee JO, Yang H, Georgescu MM, Di Cristofano A, Maehama T, Shi Y, Dixon JE, Pandolfi P, Pavletich NP (1999). Crystal structure of the PTEN tumor suppressor: implications for its phosphoinositide phosphatase activity and membrane association. Cell. 99, 323–334. [DOI] [PubMed] [Google Scholar]
- 38.Malaney P, Pathak RR, Xue B, Uversky VN, Dave V (2013). Intrinsic disorder in PTEN and its interactome confers structural plasticity and functional versatility. Sci Rep. 3, 2035. [DOI] [PMC free article] [PubMed] [Google Scholar]
- 39.Ross AH, Gericke A (2009). Phosphorylation keeps PTEN phosphatase closed for business. Proc Natl Acad Sci U S A. 106, 1297–1298. [DOI] [PMC free article] [PubMed] [Google Scholar]
- 40.Rahdar M, Inoue T, Meyer T, Zhang J, Vazquez F, Devreotes PN (2009). A phosphorylation-dependent intramolecular interaction regulates the membrane association and activity of the tumor suppressor PTEN. Proc Natl Acad Sci U S A. 106, 480–485. [DOI] [PMC free article] [PubMed] [Google Scholar]
- 41.Jang H, Smith IN, Eng C, Nussinov R (2021). The mechanism of full activation of tumor suppressor PTEN at the phosphoinositide-enriched membrane. iScience. 24, 102438. [DOI] [PMC free article] [PubMed] [Google Scholar]
- 42.Nanda H, Heinrich F, Losche M (2015). Membrane association of the PTEN tumor suppressor: neutron scattering and MD simulations reveal the structure of protein-membrane complexes. Methods. 77-78, 136–146. [DOI] [PMC free article] [PubMed] [Google Scholar]
- 43.Shenoy SS, Nanda H, Losche M (2012). Membrane association of the PTEN tumor suppressor: electrostatic interaction with phosphatidylserine-containing bilayers and regulatory role of the C-terminal tail. J Struct Biol. 180, 394–408. [DOI] [PMC free article] [PubMed] [Google Scholar]
- 44.Larsen AH, Sansom MSP (2021). Binding of Ca(2+)-independent C2 domains to lipid membranes: A multi-scale molecular dynamics study. Structure. 29, 1200–1213 e1202. [DOI] [PMC free article] [PubMed] [Google Scholar]
- 45.Van Wart AT, Durrant J, Votapka L, Amaro RE (2014). Weighted Implementation of Suboptimal Paths (WISP): An Optimized Algorithm and Tool for Dynamical Network Analysis. J Chem Theory Comput. 10, 511–517. [DOI] [PMC free article] [PubMed] [Google Scholar]
- 46.Brandao TA, Johnson SJ, Hengge AC (2012). The molecular details of WPD-loop movement differ in the protein-tyrosine phosphatases YopH and PTP1B. Arch Biochem Biophys. 525, 53–59. [DOI] [PMC free article] [PubMed] [Google Scholar]
- 47.Rodriguez-Escudero I, Oliver MD, Andres-Pons A, Molina M, Cid VJ, Pulido R (2011). A comprehensive functional analysis of PTEN mutations: implications in tumor- and autism-related syndromes. Hum Mol Genet. 20, 4132–4142. [DOI] [PubMed] [Google Scholar]
- 48.Kang HJ, Kawasawa YI, Cheng F, Zhu Y, Xu X, Li M, Sousa AM, Pletikos M, et al. (2011). Spatio-temporal transcriptome of the human brain. Nature. 478, 483–489. [DOI] [PMC free article] [PubMed] [Google Scholar]
- 49.Li M, Santpere G, Imamura Kawasawa Y, Evgrafov OV, Gulden FO, Pochareddy S, Sunkin SM, Li Z, et al. (2018). Integrative functional genomic analysis of human brain development and neuropsychiatric risks. Science. 362, eaat7615. [DOI] [PMC free article] [PubMed] [Google Scholar]
- 50.Chau KK, Zhang P, Urresti J, Amar M, Pramod AB, Chen J, Thomas A, Corominas R, et al. (2021). Full-length isoform transcriptome of the developing human brain provides further insights into autism. Cell Rep. 36, 109631. [DOI] [PMC free article] [PubMed] [Google Scholar]
- 51.Yin Y, Shen WH (2008). PTEN: a new guardian of the genome. Oncogene. 27, 5443–5453. [DOI] [PubMed] [Google Scholar]
- 52.Bonneau D, Longy M (2000). Mutations of the human PTEN gene. Hum Mutat. 16, 109–122. [DOI] [PubMed] [Google Scholar]
- 53.Serebriiskii IG, Pavlov V, Tricarico R, Andrianov G, Nicolas E, Parker MI, Newberg J, Frampton G, et al. (2022). Comprehensive characterization of PTEN mutational profile in a series of 34,129 colorectal cancers. Nat Commun. 13, 1618. [DOI] [PMC free article] [PubMed] [Google Scholar]
- 54.Dempsey DR, Viennet T, Iwase R, Park E, Henriquez S, Chen Z, Jeliazkov JR, Palanski BA, et al. (2021). The structural basis of PTEN regulation by multi-site phosphorylation. Nat Struct Mol Biol. 28, 858–868. [DOI] [PMC free article] [PubMed] [Google Scholar]
- 55.Henager SH, Chu N, Chen Z, Bolduc D, Dempsey DR, Hwang Y, Wells J, Cole PA (2016). Enzyme-catalyzed expressed protein ligation. Nat Methods. 13, 925–927. [DOI] [PMC free article] [PubMed] [Google Scholar]
- 56.Bolduc D, Rahdar M, Tu-Sekine B, Sivakumaren SC, Raben D, Amzel LM, Devreotes P, Gabelli SB, Cole P (2013). Phosphorylation-mediated PTEN conformational closure and deactivation revealed with protein semisynthesis. Elife. 2, e00691. [DOI] [PMC free article] [PubMed] [Google Scholar]
- 57.Kotelevets L, Trifault B, Chastre E, Scott MGH (2020). Posttranslational Regulation and Conformational Plasticity of PTEN. Cold Spring Harb Perspect Med. 10, a036095. [DOI] [PMC free article] [PubMed] [Google Scholar]
- 58.Zhang Y, Park J, Han SJ, Yang SY, Yoon HJ, Park I, Woo HA, Lee SR (2020). Redox regulation of tumor suppressor PTEN in cell signaling. Redox Biol. 34, 101553. [DOI] [PMC free article] [PubMed] [Google Scholar]
- 59.Xia Q, Ali S, Liu L, Li Y, Liu X, Zhang L, Dong L (2020). Role of Ubiquitination in PTEN Cellular Homeostasis and Its Implications in GB Drug Resistance. Front Oncol. 10, 1569. [DOI] [PMC free article] [PubMed] [Google Scholar]
- 60.Alvarez-Garcia V, Tawil Y, Wise HM, Leslie NR (2019). Mechanisms of PTEN loss in cancer: It’s all about diversity. Semin Cancer Biol. 59, 66–79. [DOI] [PubMed] [Google Scholar]
- 61.Meng Z, Jia LF, Gan YH (2016). PTEN activation through K163 acetylation by inhibiting HDAC6 contributes to tumour inhibition. Oncogene. 35, 2333–2344. [DOI] [PubMed] [Google Scholar]
- 62.Xu W, Yang Z, Zhou SF, Lu N (2014). Posttranslational regulation of phosphatase and tensin homolog (PTEN) and its functional impact on cancer behaviors. Drug Des Devel Ther. 8, 1745–1751. [DOI] [PMC free article] [PubMed] [Google Scholar]
- 63.Song MS, Salmena L, Pandolfi PP (2012). The functions and regulation of the PTEN tumour suppressor. Nat Rev Mol Cell Biol. 13, 283–296. [DOI] [PubMed] [Google Scholar]
- 64.Singh G, Chan AM (2011). Post-translational modifications of PTEN and their potential therapeutic implications. Curr Cancer Drug Targets. 11, 536–547. [DOI] [PubMed] [Google Scholar]
- 65.Mighell TL, Evans-Dutson S, O’Roak BJ (2018). A Saturation Mutagenesis Approach to Understanding PTEN Lipid Phosphatase Activity and Genotype-Phenotype Relationships. Am J Hum Genet. 102, 943–955. [DOI] [PMC free article] [PubMed] [Google Scholar]
- 66.Mighell TL, Thacker S, Fombonne E, Eng C, O’Roak BJ (2020). An Integrated Deep-Mutational-Scanning Approach Provides Clinical Insights on PTEN Genotype-Phenotype Relationships. Am J Hum Genet. 106, 818–829. [DOI] [PMC free article] [PubMed] [Google Scholar]
- 67.Portelli S, Barr L, de Sa AGC, Pires DEV, Ascher DB (2021). Distinguishing between PTEN clinical phenotypes through mutation analysis. Comput Struct Biotechnol J. 19, 3097–3109. [DOI] [PMC free article] [PubMed] [Google Scholar]
- 68.Han SY, Kato H, Kato S, Suzuki T, Shibata H, Ishii S, Shiiba K, Matsuno S, et al. (2000). Functional evaluation of PTEN missense mutations using in vitro phosphoinositide phosphatase assay. Cancer Res. 60, 3147–3151. [PubMed] [Google Scholar]
- 69.He X, Ni Y, Wang Y, Romigh T, Eng C (2011). Naturally occurring germline and tumor-associated mutations within the ATP-binding motifs of PTEN lead to oxidative damage of DNA associated with decreased nuclear p53. Hum Mol Genet. 20, 80–89. [DOI] [PMC free article] [PubMed] [Google Scholar]
- 70.Post KL, Belmadani M, Ganguly P, Meili F, Dingwall R, McDiarmid TA, Meyers WM, Herrington C, et al. (2020). Multi-model functionalization of disease-associated PTEN missense mutations identifies multiple molecular mechanisms underlying protein dysfunction. Nat Commun. 11, 2073. [DOI] [PMC free article] [PubMed] [Google Scholar]
- 71.Marsh DJ, Theodosopoulos G, Howell V, Richardson AL, Benn DE, Proos AL, Eng C, Robinson BG (2001). Rapid mutation scanning of genes associated with familial cancer syndromes using denaturing high-performance liquid chromatography. Neoplasia. 3, 236–244. [DOI] [PMC free article] [PubMed] [Google Scholar]
- 72.Tsou HC, Ping XL, Xie XX, Gruener AC, Zhang H, Nini R, Swisshelm K, Sybert V, et al. (1998). The genetic basis of Cowden’s syndrome: three novel mutations in PTEN/MMAC1/TEP1. Hum Genet. 102, 467–473. [DOI] [PubMed] [Google Scholar]
- 73.Smith IN, Thacker S, Jaini R, Eng C (2019). Dynamics and structural stability effects of germline PTEN mutations associated with cancer versus autism phenotypes. J Biomol Struct Dyn. 37, 1766–1782. [DOI] [PMC free article] [PubMed] [Google Scholar]
- 74.Redfern RE, Daou MC, Li L, Munson M, Gericke A, Ross AH (2010). A mutant form of PTEN linked to autism. Protein Sci. 19, 1948–1956. [DOI] [PMC free article] [PubMed] [Google Scholar]
- 75.Fricano-Kugler CJ, Getz SA, Williams MR, Zurawel AA, DeSpenza T Jr., Frazel PW, Li M, O’Malley AJ, et al. (2018). Nuclear Excluded Autism-Associated Phosphatase and Tensin Homolog Mutations Dysregulate Neuronal Growth. Biol Psychiatry. 84, 265–277. [DOI] [PMC free article] [PubMed] [Google Scholar]
- 76.Valtcheva N, Lang FM, Noske A, Samartzis EP, Schmidt AM, Bellini E, Fink D, Moch H, et al. (2017). Tracking the origin of simultaneous endometrial and ovarian cancer by next-generation sequencing - a case report. BMC Cancer. 17, 66. [DOI] [PMC free article] [PubMed] [Google Scholar]
- 77.Chao JT, Hollman R, Meyers WM, Meili F, Matreyek KA, Dean P, Fowler DM, Haas K, et al. (2020). A Premalignant Cell-Based Model for Functionalization and Classification of PTEN Variants. Cancer Res. 80, 2775–2789. [DOI] [PubMed] [Google Scholar]
- 78.Shan L, Yu J, He Z, Chen S, Liu M, Ding H, Xu L, Zhao J, et al. (2020). Defining relative mutational difficulty to understand cancer formation. Cell Discov. 6, 48. [DOI] [PMC free article] [PubMed] [Google Scholar]
- 79.Spinelli L, Black FM, Berg JN, Eickholt BJ, Leslie NR (2015). Functionally distinct groups of inherited PTEN mutations in autism and tumour syndromes. J Med Genet. 52, 128–134. [DOI] [PMC free article] [PubMed] [Google Scholar]
- 80.Mingo J, Rodriguez-Escudero I, Luna S, Fernandez-Acero T, Amo L, Jonasson AR, Zori RT, Lopez JI, et al. (2018). A pathogenic role for germline PTEN variants which accumulate into the nucleus. Eur J Hum Genet. 26, 1180–1187. [DOI] [PMC free article] [PubMed] [Google Scholar]
- 81.Tan MH, Mester J, Peterson C, Yang Y, Chen JL, Rybicki LA, Milas K, Pederson H, et al. (2011). A clinical scoring system for selection of patients for PTEN mutation testing is proposed on the basis of a prospective study of 3042 probands. Am J Hum Genet. 88, 42–56. [DOI] [PMC free article] [PubMed] [Google Scholar]
- 82.Waite KA, Eng C (2002). Protean PTEN: form and function. Am J Hum Genet. 70, 829–844. [DOI] [PMC free article] [PubMed] [Google Scholar]
- 83.Miller JA, Ding SL, Sunkin SM, Smith KA, Ng L, Szafer A, Ebbert A, Riley ZL, et al. (2014). Transcriptional landscape of the prenatal human brain. Nature. 508, 199–206. [DOI] [PMC free article] [PubMed] [Google Scholar]
- 84.Dewey D (2018). What Is Comorbidity and Why Does It Matter in Neurodevelopmental Disorders? Curr Dev Disord Rep. 5, 235–242. [Google Scholar]
- 85.Chien YL, Wu CS, Tsai HJ (2021). The Comorbidity of Schizophrenia Spectrum and Mood Disorders in Autism Spectrum Disorder. Autism Res. 14, 571–581. [DOI] [PubMed] [Google Scholar]
- 86.Zheng Z, Zheng P, Zou X (2018). Association between schizophrenia and autism spectrum disorder: A systematic review and meta-analysis. Autism Res. 11, 1110–1119. [DOI] [PubMed] [Google Scholar]
- 87.Hong D, Iakoucheva LM (2023). Therapeutic strategies for autism: targeting three levels of the central dogma of molecular biology. Transl Psychiatry. 13, 58. [DOI] [PMC free article] [PubMed] [Google Scholar]
- 88.Mpaka DM, Okitundu DL, Ndjukendi AO, N’Situ A M, Kinsala SY, Mukau JE, Ngoma VM, Kashala-Abotnes E, et al. (2016). Prevalence and comorbidities of autism among children referred to the outpatient clinics for neurodevelopmental disorders. Pan Afr Med J. 25, 82. [DOI] [PMC free article] [PubMed] [Google Scholar]
- 89.Kaymakcalan H, Kaya I, Cevher Binici N, Nikerel E, Ozbaran B, Gorkem Aksoy M, Erbilgin S, Ozyurt G, et al. (2021). Prevalence and clinical/molecular characteristics of PTEN mutations in Turkish children with autism spectrum disorders and macrocephaly. Mol Genet Genomic Med. 9, e1739. [DOI] [PMC free article] [PubMed] [Google Scholar]
- 90.Albores-Gallo L, Fritsche-Garcia L, Miranda-Aguirre AP, Avila-Acosta M (2017). Brief Report: Macrocephaly Phenotype and Psychiatric Comorbidity in a Clinical Sample of Mexican Children and Adolescents with Autism Spectrum Disorders. J Autism Dev Disord. 47, 2911–2917. [DOI] [PubMed] [Google Scholar]
- 91.Inga Jacome MC, Morales Chacon LM, Vera Cuesta H, Maragoto Rizo C, Whilby Santiesteban M, Ramos Hernandez L, Noris Garcia E, Gonzalez Fraguela ME, et al. (2016). Peripheral Inflammatory Markers Contributing to Comorbidities in Autism. Behav Sci (Basel). 6, 29. [DOI] [PMC free article] [PubMed] [Google Scholar]
- 92.Al-Beltagi M (2021). Autism medical comorbidities. World J Clin Pediatr. 10, 15–28. [DOI] [PMC free article] [PubMed] [Google Scholar]
- 93.Strokach A, Kim PM (2022). Deep generative modeling for protein design. Curr Opin Struct Biol. 72, 226–236. [DOI] [PubMed] [Google Scholar]
- 94.Brooks BR, Brooks CL 3rd, Mackerell AD Jr., Nilsson L, Petrella RJ, Roux B, Won Y, Archontis G, et al. (2009). CHARMM: the biomolecular simulation program. J Comput Chem. 30, 1545–1614. [DOI] [PMC free article] [PubMed] [Google Scholar]
- 95.Klauda JB, Venable RM, Freites JA, O’Connor JW, Tobias DJ, Mondragon-Ramirez C, Vorobyov I, MacKerell AD Jr., Pastor RW (2010). Update of the CHARMM all-atom additive force field for lipids: validation on six lipid types. J Phys Chem B. 114, 7830–7843. [DOI] [PMC free article] [PubMed] [Google Scholar]
- 96.Huang J, Rauscher S, Nawrocki G, Ran T, Feig M, de Groot BL, Grubmuller H, MacKerell AD Jr. (2017). CHARMM36m: an improved force field for folded and intrinsically disordered proteins. Nat Methods. 14, 71–73. [DOI] [PMC free article] [PubMed] [Google Scholar]
- 97.Grudzien P, Jang H, Leschinsky N, Nussinov R, Gaponenko V (2022). Conformational Dynamics Allows Sampling of an “Active-like” State by Oncogenic K-Ras-GDP. J Mol Biol. 434, 167695. [DOI] [PubMed] [Google Scholar]
- 98.Liu Y, Zhang M, Tsai CJ, Jang H, Nussinov R (2022). Allosteric regulation of autoinhibition and activation of c-Abl. Comput Struct Biotechnol J. 20, 4257–4270. [DOI] [PMC free article] [PubMed] [Google Scholar]
- 99.Liu Y, Jang H, Zhang M, Tsai CJ, Maloney R, Nussinov R (2022). The structural basis of BCR-ABL recruitment of GRB2 in chronic myelogenous leukemia. Biophys J. 121, 2251–2265. [DOI] [PMC free article] [PubMed] [Google Scholar]
- 100.Maloney RC, Zhang M, Liu Y, Jang H, Nussinov R (2022). The mechanism of activation of MEK1 by B-Raf and KSR1. Cell Mol Life Sci. 79, 281. [DOI] [PMC free article] [PubMed] [Google Scholar]
- 101.Zhang M, Maloney R, Jang H, Nussinov R (2021). The mechanism of Raf activation through dimerization. Chem Sci. 12, 15609–15619. [DOI] [PMC free article] [PubMed] [Google Scholar]
- 102.Zhang M, Jang H, Li Z, Sacks DB, Nussinov R (2021). B-Raf autoinhibition in the presence and absence of 14-3-3. Structure. 29, 768–777 e762. [DOI] [PMC free article] [PubMed] [Google Scholar]
- 103.Maloney RC, Zhang M, Jang H, Nussinov R (2021). The mechanism of activation of monomeric B-Raf V600E. Comput Struct Biotechnol J. 19, 3349–3363. [DOI] [PMC free article] [PubMed] [Google Scholar]
- 104.Weako J, Jang H, Keskin O, Nussinov R, Gursoy A (2021). The structural basis of Akt PH domain interaction with calmodulin. Biophys J. 120, 1994–2008. [DOI] [PMC free article] [PubMed] [Google Scholar]
- 105.Haspel N, Jang H, Nussinov R (2021). Active and Inactive Cdc42 Differ in Their Insert Region Conformational Dynamics. Biophys J. 120, 306–318. [DOI] [PMC free article] [PubMed] [Google Scholar]
- 106.Liao TJ, Jang H, Fushman D, Nussinov R (2020). SOS1 interacts with Grb2 through regions that induce closed nSH3 conformations. J Chem Phys. 153, 045106. [DOI] [PMC free article] [PubMed] [Google Scholar]
- 107.Jang H, Zhang M, Nussinov R (2020). The quaternary assembly of KRas4B with Raf-1 at the membrane. Comput Struct Biotechnol J. 18, 737–748. [DOI] [PMC free article] [PubMed] [Google Scholar]
- 108.Jang H, Banerjee A, Marcus K, Makowski L, Mattos C, Gaponenko V, Nussinov R (2019). The Structural Basis of the Farnesylated and Methylated KRas4B Interaction with Calmodulin. Structure. 27, 1647–1659 e1644. [DOI] [PMC free article] [PubMed] [Google Scholar]
- 109.Jang H, Muratcioglu S, Gursoy A, Keskin O, Nussinov R (2016). Membrane-associated Ras dimers are isoform-specific: K-Ras dimers differ from H-Ras dimers. Biochem J. 473, 1719–1732. [DOI] [PMC free article] [PubMed] [Google Scholar]
- 110.Jang H, Banerjee A, Chavan TS, Lu S, Zhang J, Gaponenko V, Nussinov R (2016). The higher level of complexity of K-Ras4B activation at the membrane. FASEB J. 30, 1643–1655. [DOI] [PMC free article] [PubMed] [Google Scholar]
- 111.Woolf TB, Roux B (1994). Molecular dynamics simulation of the gramicidin channel in a phospholipid bilayer. Proc Natl Acad Sci U S A. 91, 11631–11635. [DOI] [PMC free article] [PubMed] [Google Scholar]
- 112.Woolf TB, Roux B (1996). Structure, energetics, and dynamics of lipid-protein interactions: A molecular dynamics study of the gramicidin A channel in a DMPC bilayer. Proteins. 24, 92–114. [DOI] [PubMed] [Google Scholar]
- 113.Kucerka N, Tristram-Nagle S, Nagle JF (2005). Structure of fully hydrated fluid phase lipid bilayers with monounsaturated chains. J Membr Biol. 208, 193–202. [DOI] [PubMed] [Google Scholar]
- 114.Phillips JC, Braun R, Wang W, Gumbart J, Tajkhorshid E, Villa E, Chipot C, Skeel RD, et al. (2005). Scalable molecular dynamics with NAMD. J Comput Chem. 26, 1781–1802. [DOI] [PMC free article] [PubMed] [Google Scholar]
- 115.Pettersen EF, Goddard TD, Huang CC, Couch GS, Greenblatt DM, Meng EC, Ferrin TE (2004). UCSF Chimera--a visualization system for exploratory research and analysis. J Comput Chem. 25, 1605–1612. [DOI] [PubMed] [Google Scholar]
- 116.Bakan A, Meireles LM, Bahar I (2011). ProDy: protein dynamics inferred from theory and experiments. Bioinformatics. 27, 1575–1577. [DOI] [PMC free article] [PubMed] [Google Scholar]
Associated Data
This section collects any data citations, data availability statements, or supplementary materials included in this article.