Abstract
A Cu-doped Fe2O3/g-C3N4 composite, synthesized via a straightforward hydrothermal process with controlled morphologies, represents a significant advancement in supercapacitor electrode materials. This study systematically analyzes the impact of Cu doping in Fe2O3 and its synergistic combination with g-C3N4 to understand their influence on the electrochemical performance of the resulting composite, focusing on Cu doping in Fe2O3 rather than varying Fe2O3/g-C3N4 content. The comprehensive characterization of these composites involved a suite of physicochemical techniques. X-ray diffraction (XRD) confirmed the successful synthesis of the composite, while field emission scanning electron microscopy (FESEM) and transmission electron microscopy (TEM) were employed to investigate the morphological attributes of the synthesized materials. X-ray photoelectron spectroscopy (XPS) spectra confirmed the elemental composition of the composite with 6% Cu doped Fe2O3/g-C3N4. The composite electrode, which incorporated 6% Cu doped Fe2O3 with g-C3N4, exhibited exceptional cycling stability, retaining 94.22% of its capacity even after 2000 charge–discharge cycles at a current density of 5 mA cm−2. Furthermore, this Cu doped Fe2O3/g-C3N4 composite electrode demonstrated impressive electrochemical performance, boasting a specific capacitance of 244.0 F g−1 and an impressive maximum energy density of 5.31 W h kg−1 at a scan rate of 5 mV s−1. These findings highlight the substantial potential of the Cu doped Fe2O3/g-C3N4 electrode for supercapacitor applications.
A Cu-doped Fe2O3/g-C3N4 composite, synthesized via a straightforward hydrothermal process with controlled morphologies, represents a significant advancement in supercapacitor electrode materials.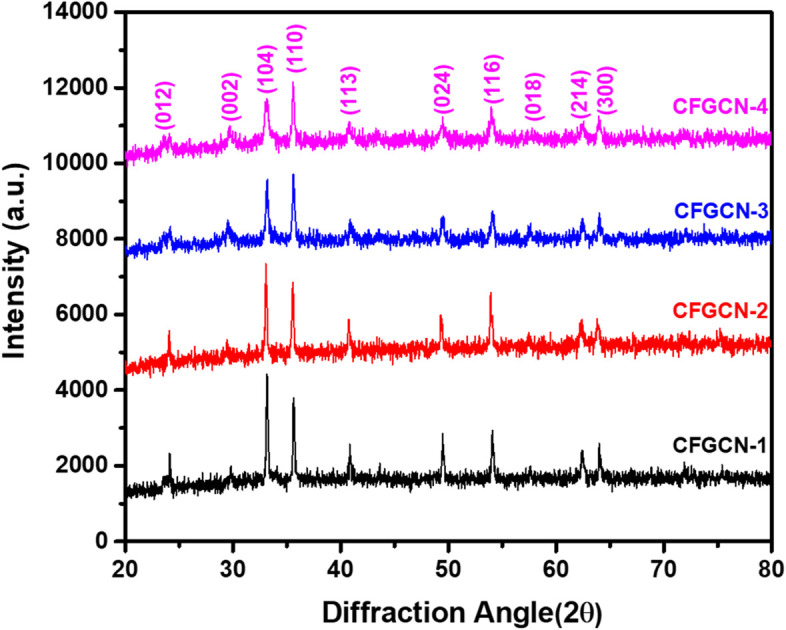
1. Introduction
Supercapacitors have emerged as a promising solution for addressing the increasing energy demands and environmental concerns associated with non-renewable energy sources.1,2 These electrochemical capacitors offer numerous advantages over traditional batteries, including superior lifespan, high power density, cost-effectiveness, rapid charging/discharging rates, and enhanced safety.3,4 Supercapacitors are classified as either an Electrical Double Layer Capacitor (EDLC) or a pseudocapacitor based on their charge storage method.5,6 The electrochemical performance of the electrode materials substantially influences the efficiency of supercapacitors.7,8 In recent years, there has been a growing interest in flexible energy storage devices, particularly in the field of wearable electronics. Among these devices, fiber-shaped supercapacitors have gained significant attention due to their lightweight nature, small size, and high flexibility.9 However, conventional supercapacitors do not meet the requirements of flexible energy storage devices due to their weight, bulkiness, and low capacitance.10,11 Consequently, researchers are focusing on the development of electrode materials with high specific capacitance and stability to enhance the performance of supercapacitors. These materials mainly comprise carbon materials, conductive polymers, and transition metal oxides, and their continuous advancement holds vital importance in the research and development of supercapacitors.12–14
In recent years, transition metal oxides have garnered significant attention from researchers due to their remarkable properties, including unique crystal structure, low band gap, and exceptional electrochemical reactivity.15 Notably, nanostructured transition metal oxides such as CuO, Fe2O3, Co3O4, NiO, and V2O5 have been investigated extensively, as they possess a higher specific surface area that facilitates enhanced electrochemical reactions.11,16,17 Consequently, these materials exhibit higher specific capacitances compared to their bulk counterparts. Among these oxides, iron oxide (Fe2O3) stands out as a promising electrode material for supercapacitor (SC) applications due to its desirable attributes such as low-cost, high capacity, non-toxic nature, eco-friendliness, and ease of synthesis.18 However, the application of Fe2O3 in supercapacitors is constrained by its inadequate electrical conductivity and limited cycle stability,19 which hinder its electrochemical reaction over prolonged periods. The electrical conductivity of the electrode material plays a crucial role in enhancing the specific capacitance, energy density, and cycle life of the supercapacitor. Doping with external impurities is a widely adopted strategy to improve the electrical conductivity of electrode materials. In the literature, various doping methods, such as fluorine,20 titanium,21 lithium,22 manganese,23 chromium,24 nickel,25etc., have been successfully employed to enhance the electrical conductivity of the supercapacitor electrode material. Furthermore, to enhance the energy density and cycle life of Fe2O3-based supercapacitors, many studies have reported the use of combinations of Fe2O3 with carbon-based substances such as reduced graphene oxide (rGO), graphitic carbon nitride (g-C3N4), carbon nanotubes (CNTs), and porous carbon.26–28 As an illustration, Zhang et al. synthesized a rGO/Fe2O3 composite via a simple hydrothermal method as the active material for screen-printing functional inks. The composite exhibited a high specific capacitance of 703.91 F g−1 at 1 A g−1.19 Wei et al. developed hollow acanthospheres (Fe2O3@C-HASs) on carbon cloth via a solvothermal process and self-sacrifice template, showcasing their potential as high-quality anode materials for asymmetric supercapacitors.29 Amirabad et al. investigated the enhancement of supercapacitor efficiency by modifying binder-free electrodes using Zn-doped Fe2O3 on MoS2@rGO nanosheets.30 Zhong et al. introduced a novel supercapacitor material composed of CeO2–Fe2O3 nanoparticles supported on a highly porous carbon framework (CeO2–Fe2O3/C) with a remarkable specific capacitance of 803 F g−1 at 1 mV s−1.31 These reports have shed light on the potential for investigating these composites for their supercapacitor capabilities. However, there is a lack of extensive research on the utilization of Fe2O3/carbon-based composites as electrode materials for supercapacitors. Consequently, our focus has been on synthesizing Cu-Fe2O3/g-C3N4 composites and exploring their application in supercapacitors.
In this investigation, we utilized a cost-effective and efficient hydrothermal technique to synthesize a distinctive Cu-Fe2O3/g-C3N4 composite material. The Fe2O3/g-C3N4 composition remained constant, with a specific focus on evaluating the influence of Cu doping in the Fe2O3 component. g-C3N4, synthesized through combustion, was introduced during the hydrothermal process, providing a nuanced approach for a comprehensive analysis of interactions and structural characteristics in the resulting material. The characterization of these composites was conducted using various analytical techniques such as XRD, FESEM, EDX, XPS, UV, and TEM. The Cu-Fe2O3/g-C3N4 composite material, prepared through the aforementioned method, was employed as an electrode in supercapacitors. Remarkably, it displayed a specific capacitance of approximately 244 F g−1 at a scan rate of 5 mV s−1. Furthermore, the composite exhibited only a 5.78% loss in specific capacitance after 2000 cycles, indicating its remarkable electrochemical stability. The Cu-Fe2O3/g-C3N4 electrode material prepared in this work offers substantial potential as an extraordinary option for uses in the field of supercapacitors due to its good specific capacitance.
2. Experimental
2.1. Synthesis of g-C3N4
Graphitic carbon nitride (g-C3N4) was prepared using equivalent amounts of urea and thiourea through a combustion method.32 In the process of synthesizing g-C3N4, equal amounts of urea and thiourea (5 grams each) were combined in a mortar and pestle before being transferred to a silica crucible. The mixture was then heated to 550 °C for 5 hours using a muffle furnace set at a heating rate of 5 °C. The resulting yellow product was collected and utilized in the fabrication of the Cu-Fe2O3/g-C3N4 samples.
2.2. Synthesis of Cu doped Fe2O3@g-C3N4 nanocomposite
The synthesis of a Cu doped Fe2O3@g-C3N4 nanocomposite was performed using the hydrothermal method. Notably, the g-C3N4 component employed in the composite was prepared beforehand using a combustion synthesis approach. The first step in the synthesis involved preparing a 1 M solution of iron(iii) nitrate nonahydrate in water and a 1 M solution of copper chloride in water. In a typical preparation procedure, 50 mg of g-C3N4 was initially dispersed in 40 mL of water under magnetic stirring this g-C3N4 was synthesized in combustion method and used in the synthesis of composite. Then, an appropriate amount of the copper salt solution and iron salt solution was added to this solution, and the mixture was stirred at room temperature for 10 minutes. Afterward, 0.2 M NaOH was added dropwise to the mixture while stirring it at 60 °C on a hot plate for 2 hours. Once all the NaOH was added, the reaction mixture was cooled to room temperature while continuing to stir. Subsequently, the mixture was transferred to a hydrothermal container and placed in an oven at 160 °C for 12 hours. The autoclave was then allowed to cool naturally to ambient temperature. The resulting precipitate was collected, centrifuged, washed, and dried in a 55 °C oven. The dry product was then calcined for 4 hours at 550 °C. This process was repeated for different compositions of the Cu doped Fe2O3@g-C3N4 nanocomposite, specifically 0%, 2%, 4%, 6%, and 8% Cu doping, which were labelled as CFGCN-0, CFGCN-1, CFGCN-2, CFGCN-3, and CFGCN-4, respectively. The nanocomposites were subsequently characterized using various techniques. Table ESI 1† provides a summary of the different preparation conditions for the Cu doped Fe2O3@g-C3N4 nanocomposite.
2.3. Characterization
X-ray diffraction was utilized to identify the phase of a composite material comprising Cu doped Fe2O3@g-C3N4. A Philips diffractometer was employed with X-ray radiation at a wavelength of 1.540 Å at room temperature. X-ray photoelectron spectra were captured using a Prevac XPS system designed for ambient pressure. It featured a VG Scienta SAX 100 emission controller monochromator and an Al Ka anode with an energy of 1486.6 eV in transmission lens mode. The morphology analysis of the composite could be conducted using the JEOL JSM-7600F, FEG-SEM. Transmission electron microscopy (TEM) images of the synthesized product were obtained with a JEOL JEM-2200 FS Transmission Electron Microscope equipped with a field emission gun. Optical investigation was carried out using a Shimadzu model 1800 UV-visible spectrophotometer.
2.4. Electrochemical measurements
The electrodes were created using stainless steel (SS) plates, specifically of grade 304.0, as the foundational material. These SS plates were meticulously cleaned according to well-established laboratory standards. To remove pre-existing contamination on the stainless steel (SS) substrate, the substrate was first cleaned in detergent. It was then immersed in a 4 N HNO3 solution for 45 min. The SS was simultaneously washed using acetone and distilled water and then dried in an oven at 55 °C. To craft the electrodes, we followed a widely-documented procedure outlined in existing literature.33 To prepare the electrodes, a mixture consisting of acetylene black (AcB) and polyvinylidene fluoride (PVDF), each making up 5% of the total weight, was combined with 90% of the as-prepared samples labelled as CFGCN-0, CFGCN-1, CFGCN-2, CFGCN-3, and CFGCN-4. This amalgamation took place in a solution of dimethylformamide (DMF). Subsequently, this blend was evenly spread using a doctor blade and left to dry at a temperature of 60 °C for a duration of 12 hours. The resulting electrodes were then employed for the purpose of conducting electrochemical analysis. The electrochemical supercapacitor properties of the electrodes, specifically those identified as CFGCN-0, CFGCN-1, CFGCN-2, CFGCN-3, and CFGCN-4, were evaluated through various methods, including cyclic voltammetry (CV), galvanostatic charge/discharge (GCD), and electrochemical impedance spectroscopy (EIS).
3. Results and discussion
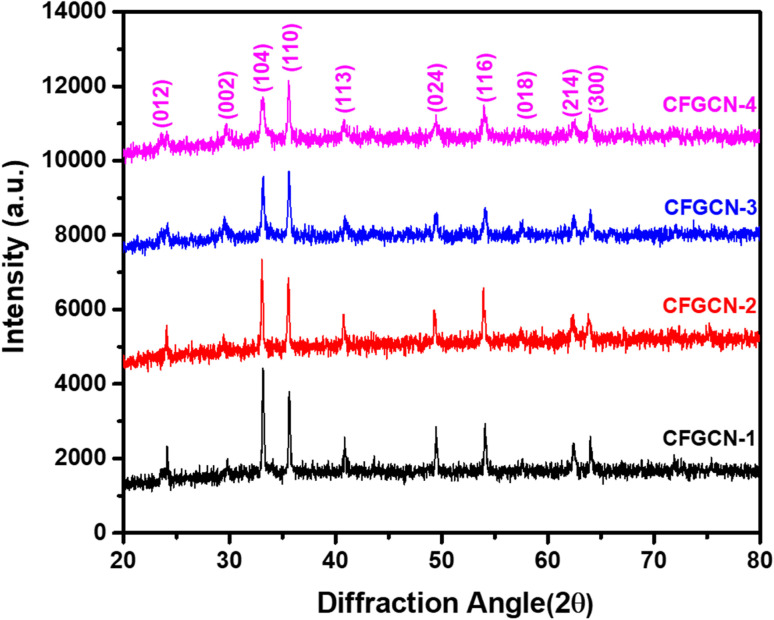
The study conducted a powder X-ray diffraction (XRD) analysis to assess the phase purity and crystalline structure of three materials: as-prepared g-C3N4, pristine Fe2O3, and Cu doped Fe2O3@g-C3N4 nanocomposite. The XRD pattern for g-C3N4 and Fe2O3 was consistent with previous literature findings, serving as a foundation for this extended research (Fig. ESI-1†).32 The X-ray diffraction patterns for the newly synthesized Cu doped Fe2O3@g-C3N4 nanocomposites are presented in Fig. 1. In the XRD pattern of pristine g-C3N4, a peak was observed at 29.64°, corresponding to the (002) stacking layered structure, in agreement with JCPDS card no. 87-1526.32 Additionally, diffraction peaks at 23.63°, 33.03°, 35.38°, 40.56°, 49.36°, 53.85°, 57.69°, 62.53°, and 63.92° were identified and indexed to lattice planes (012), (104), (110), (113), (024), (116), (018), (214), and (300), respectively. The XRD patterns for all Cu doped Fe2O3@g-C3N4 nanocomposites exhibited diffraction peaks corresponding to both Fe2O3 and g-C3N4, indicating the successful formation of Cu doped Fe2O3@g-C3N4 nanocomposites.34 It is noteworthy that all samples exhibited crystalline phases, suggesting that the introduction of copper through doping had a minimal impact on the crystal structure of Fe2O3. However, heavily doped copper led to a slightly reduced particle size, as evidenced by a broadened peak with reduced intensity in the case of CFGCN-4. Importantly, no diffraction peaks associated with impurities were observed in any of the composites, underscoring the formation of highly pure Cu doped Fe2O3@g-C3N4 nanocomposites.
Fig. 1. XRD pattern of as-synthesized Cu doped Fe2O3@g-C3N4 nanocomposites.
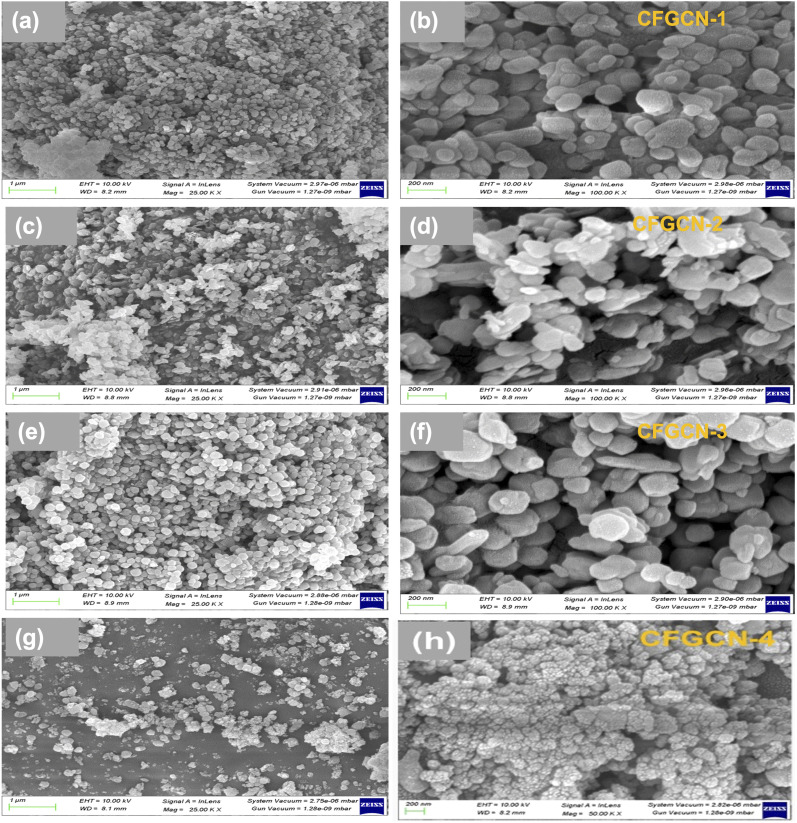
The morphology of Cu doped Fe2O3@g-C3N4 nanocomposites was examined through field emission scanning electron microscopy (FESEM), and Fig. 2 displays both low and high magnification FESEM images of these nanocomposites, denoted as CFGCN-1 to CFGCN-4. Pristine g-C3N4 exhibited its characteristic layered structure with wrinkles, as depicted in Fig. ESI 2.† In contrast, the Fe2O3@g-C3N4 nanocomposites displayed irregularly shaped nanostructures. The same morphological characteristics were observed in the Cu doped Fe2O3@g-C3N4 nanocomposites. Specifically, the surface morphology of CFGCN-1 revealed irregular shapes and some nearly spherical, prematurely aggregated nanostructures with a reduced diameter compared to the Fe2O3@g-C3N4 nanocomposite (Fig. 2a and b). Fig. 2c and d illustrate FESEM images of CFGCN-2, showing a mixed morphology comprising irregularly shaped nanostructures of varying sizes and the deposition of nanoparticles atop them. CFGCN-3, as shown in Fig. 2e and f, displayed fully developed irregularly shaped nanostructures, clearly indicating that copper played a crucial role in the formation of these well-developed structures. Furthermore, when the copper content exceeded 6%, as depicted in Fig. 2g and h, the fully developed irregular nanostructures tended to aggregate. This distortion in morphology is likely attributed to an increase in in situ pressure during the hydrothermal synthesis process. In a nutshell, optimal copper doping led to the formation of highly crystalline, well-developed irregularly shaped nanostructures.
Fig. 2. FESEM images of (a) and (b) 2% Cu doped Fe2O3@g-C3N4 (CFGCN-1), (c) and (d) 4% Cu doped Fe2O3@g-C3N4 (CFGCN-2), (e) and (f) 6% Cu doped Fe2O3@g-C3N4 (CFGCN-3), and (g) and (h) 8% Cu doped Fe2O3@g-C3N4 (CFGCN-4).
In order to ascertain the elemental composition of both the as-synthesized pristine g-C3N4 and the Cu doped Fe2O3@g-C3N4 nanocomposites, Energy Dispersive Spectra (EDS) analysis was conducted. In Fig. ESI 3a,† the spectrum for pristine g-C3N4 displays distinct peaks corresponding to the elements carbon (C) and nitrogen (N). Conversely, Fig. ESI 3b–3e† reveal EDS spectra for the ferrites CFGCN-1, CFGCN-2, CFGCN-3, and CFGCN-4, showcasing prominent peaks corresponding to the elements copper (Cu), carbon (C), nitrogen (N), iron (Fe), and oxygen (O). Notably, the absence of any impurity peaks in the spectra provides confirmation of the high purity of these samples.
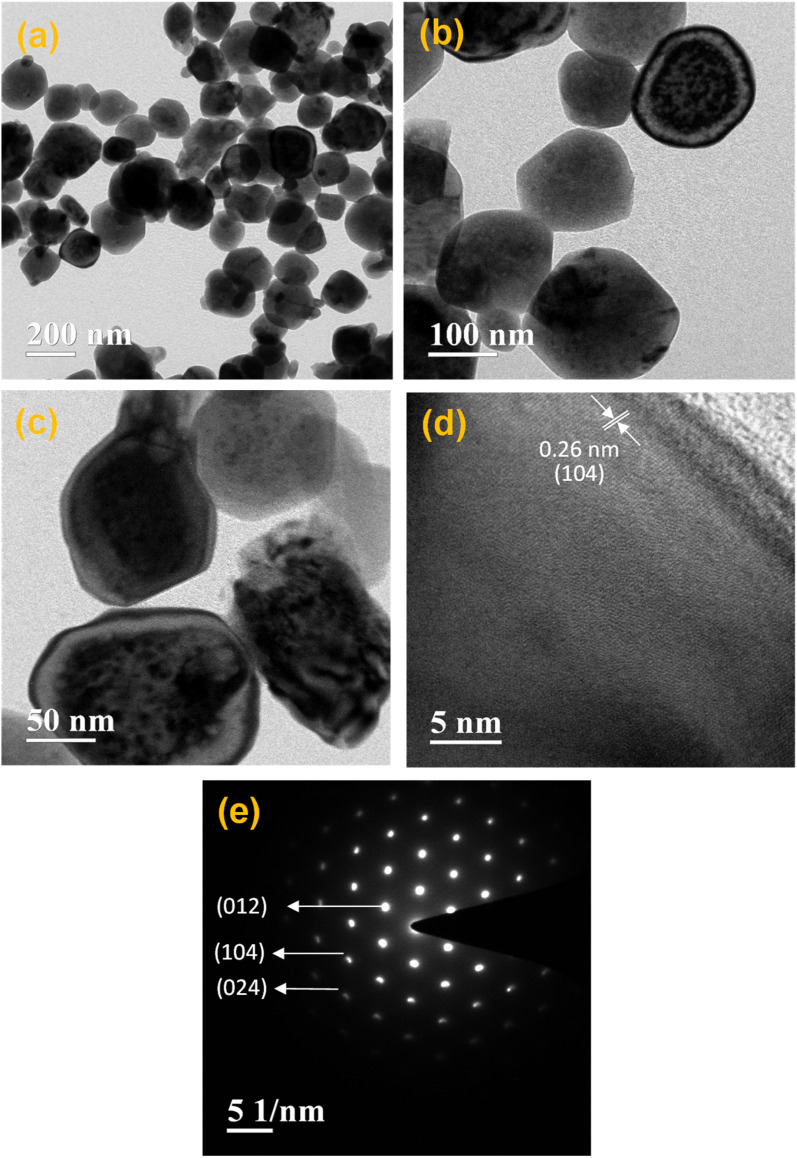
The investigation of the microstructure of a nanocomposite consisting of 6% Cu doped Fe2O3@g-C3N4 was conducted using transmission electron microscopy (TEM), as depicted in Fig. 3. The examination revealed the presence of fully developed irregularly shaped nanostructures, with an average diameter of approximately 120 nm. This observation aligns well with the findings from field-emission scanning electron microscopy (FESEM) shown in Fig. 2e and f. Furthermore, Fig. 3d displays lattice fringes with a spacing of 0.26 nm, corresponding to the (104) lattice plane of Fe2O3. The selected area electron diffraction (SAED) pattern of the 6% Cu doped Fe2O3@g-C3N4 nanocomposite, as shown in Fig. 3e, clearly indicates its crystalline nature. The SAED pattern reveals the presence of crystalline planes such as (012), (104), and (024), consistent with the X-ray diffraction (XRD) results. This correspondence between the TEM and XRD results confirms the structural characteristics of the CFGCN-3 nanocomposite.
Fig. 3. (a)–(c) TEM images, (d) HRTEM image, and (e) the SAED pattern of 6% Cu doped Fe2O3@g-C3N4 (CFGCN-3).
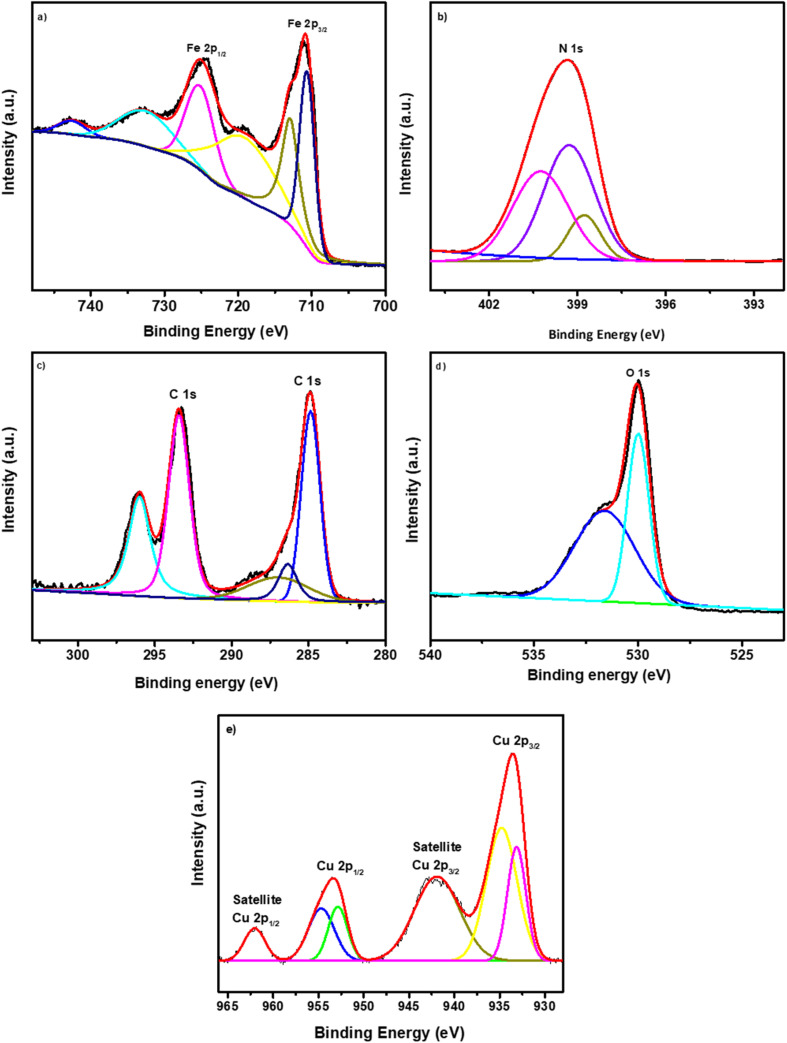
The chemical composition of the as-synthesized nanocomposite, consisting of 6% Cu doped Fe2O3@g-C3N4, was confirmed using X-ray photoelectron spectroscopy. The survey spectra of this nanocomposite revealed the presence of Cu, Fe, O, N, and C elements, thereby substantiating the chemical makeup of the synthesized sample (as shown in Fig. ESI 4†). In Fig. 4a–f, high-resolution spectra for Fe 2p, N 1s, C 1s, O 1s, and Cu 2p elements are presented. The Fe 2p doublet in Fig. 4a exhibited clear splitting into two components: one at a binding energy of 710.80 eV, corresponding to Fe 2p3/2, and the other at 724.33 eV, corresponding to Fe 2p1/2.35 In addition to these, two satellite peaks related to Fe 2p were observed in CFGCN-3, positioned at 719.06 eV and 733.22 eV.36Fig. 4b displays the high-resolution spectra of N 1s with a binding energy of 399.44 eV. This peak was further deconvoluted into three distinct peaks, which were assigned to the C–N–H, N–C3, and C–N–C groups found in the triazine rings of g-C3N4.37 The high-resolution spectra of C 1s, as depicted in Fig. 4c, revealed the presence of commonly observed peaks attributed to C–(N)3 and C–C bonding within the g-C3N4 lattice, respectively.38 As shown in Fig. 4d, the O 1s spectra demonstrated a predominant peak at 529.98 eV, which was attributed to oxygen lattice structures firmly established in the Fe2O3 crystal. Further deconvolution revealed two minor peaks at 531.98 eV and 530.19 eV, which could be ascribed to adsorbed oxygen species, most likely arising from C O–Fe and C–O–Fe interactions.39 The high-resolution Cu 2p spectrum (Fig. 4e) of CFGCN-3 displayed peaks at 933.54 and 953.47 eV, corresponding to Cu 2p3/2 and Cu 2p1/2, respectively. Additionally, two satellite peaks associated with Cu 2p in CFGCN-3 were observed at 942.15 eV and 962.44 eV.40 These findings further substantiate the formation of the Cu doped Fe2O3@g-C3N4 nanocomposite.
Fig. 4. XPS spectra of 6% Cu doped Fe2O3@g-C3N4 (CFGCN-3) (a) Fe 2p (b) N 1s (c) C 1s (d) O 1s and (e) Cu 2p.
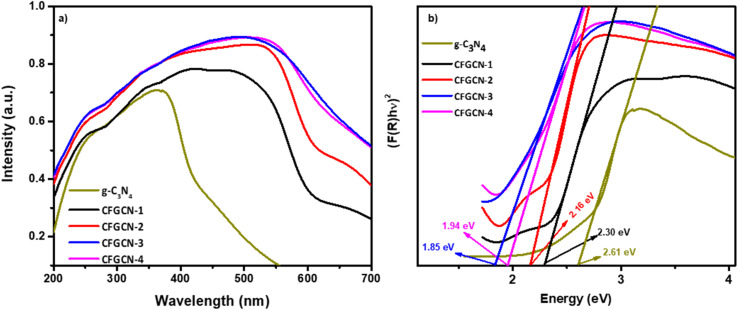
Fig. 5a displays the UV-visible absorption spectra of pristine g-C3N4 and Cu doped Fe2O3@g-C3N4 nanocomposites (CFGCN-1 to CFGCN-4). In the spectra, the absorption edge at 475 nm is characteristic of pristine g-C3N4, a feature well-documented in the literature.41 Notably, the absorption curves of the Cu doped Fe2O3@g-C3N4 nanocomposites closely resemble those of pristine g-C3N4, but with greater intensity and a shift toward longer wavelengths. This broadened absorbance and the bathochromic shift distinctly indicate the successful incorporation of copper into the Fe2O3@g-C3N4 nanocomposites.42 Furthermore, the band energy of as-synthesized pristine g-C3N4 and Cu doped Fe2O3@g-C3N4 nanocomposites was evaluated using Kubelka–Munk function as shown in Fig. 5b. The estimated band gap of g-C3N4, CFGCN-1, CFGCN-2, CFGCN-3, and CFGCN-4 were observed to be 2.61 eV, 2.30 eV, 2.16 eV, 1.84 eV and 1.94 eV respectively. Moreover, as the copper content varies from 2% to 6%, the extent of the bathochromic shift in the Cu doped Fe2O3@g-C3N4 nanocomposites progressively increases, affirming higher levels of copper doping. However, at 8% copper doping in the Fe2O3@g-C3N4 nanocomposites (CFGCN-4) a further increase in the band gap was observed.
Fig. 5. (a) UV-vis absorption spectra and (b) Kubelka–Munk function verses energy of g-C3N4 and Cu-Fe2O3@g-C3N4 nanocomposites.
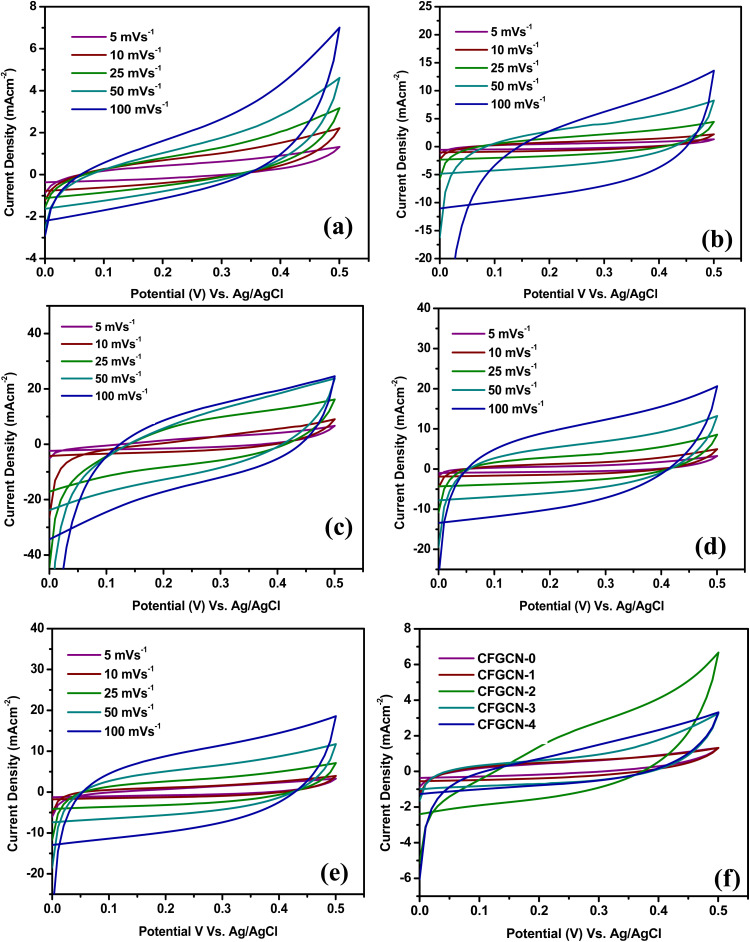
Fig. 6(a–e) display the cyclic voltammetry (CV) curves for electrodes CFGCN-0, CFGCN-1, CFGCN-2, CFGCN-3, and CFGCN-4, each evaluated at various scan rates ranging from 5 to 100 mV cm−2 within a potential window of 0–0.5 V (versus Ag/AgCl). What's immediately apparent is the classic pseudocapacitive behavior in all these electrodes, suggesting the occurrence of Faradaic reactions. Intriguingly, Fig. 6(f) reveals a notable difference in the area under the CV curve, with CFGCN-3 demonstrating a significantly larger area compared to the other electrodes at a current density of 5 mV s−1. To quantify this, specific capacitance values were calculated for all the electrodes at different scan rates, and the results are summarized in Table 1. Among all the samples, CFGCN-2 stood out with the highest specific capacitance of 244.0 F g−1 and an energy density of 5.21 W h kg−1 at a scan rate of 5 mV s−1.
Fig. 6. Cyclical Voltammetry (CV) curves for (a) CFGCN-0, (b) CFGCN-1, (c) CFGCN-2, (d) CFGCN-3, and (e) CFGCN-4 samples in 1 M Na2SO4 solution at various scan rates, and (f) comparative CV curves of all samples at a current density of 5 mV s−1.
Determination of specific capacitance from cyclic voltammetry (CV) at various scan rates for electrodes of samples CFGCN-0, CFGCN-1, CFGCN-2, CFGCN-3, and CFGCN-4.
| Scan rate (mV s−1) | Specific capacitance (F g−1) | ||||
|---|---|---|---|---|---|
| CFGCN-0 | CFGCN-1 | CFGCN-2 | CFGCN-3 | CFGCN-4 | |
| 5 | 48.8 | 67.6 | 124.8 | 244.0 | 129.0 |
| 10 | 45.0 | 59.8 | 116.3 | 171.7 | 104 |
| 25 | 23.5 | 51.9 | 103.8 | 142.0 | 95.7 |
| 50 | 16.3 | 51.3 | 84.28 | 130.4 | 88.1 |
| 100 | 12.28 | 38.2 | 78.01 | 90.2 | 75.5 |
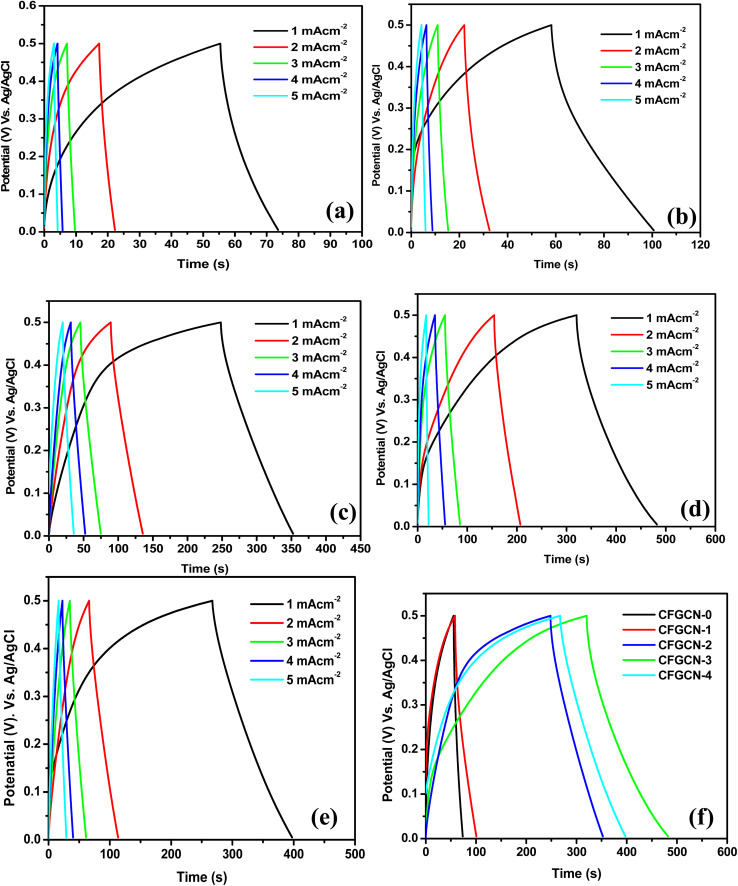
To understand the charge–discharge characteristics, galvanostatic charge–discharge (GCD) studies were performed within the potential range of 0–0.5 V versus Ag/AgCl in a 1 M Na2SO4 electrolyte. Fig. 7(a–e) illustrate the GCD curves for CFGCN-0, CFGCN-1, CFGCN-2, CFGCN-3, and CFGCN-4 electrodes at different current densities ranging from 1 to 5 mA cm−2. Once again, CFGCN-3 displayed a remarkable performance with an extended discharge time (as shown in Fig. 7(f)). Quantitative values of specific capacitance calculated from GCD curves of studied samples at different current densities (1–5 mA cm−2) are summarized in Table 2. Notably, CFGCN-2 exhibited the highest specific capacitance of 191.1 F g−1 and the highest energy density of 6.7 W h kg−1, surpassing the performance of the other electrodes. The effective application of the Cu-doping approach is highlighted in this study to enhance the electrochemical performance by augmenting the electrical conductivity of the ferrite material. Among all examined electrodes, the superior electrochemical performance of CFGCN-3 is attributed to the optimal doping of Cu within the Fe2O3 crystal lattice and its proper integration with g-C3N4.22,34
Fig. 7. GCD curves of the (a) CFGCN-0, (b) CFGCN-1, (c) CFGCN-2 (d) CFGCN-3, (e) CFGCN-4 samples in 1 M Na2SO4 solution at scan rates ranging 1 to 5 mA cm−2, and (f) GCD curves of all samples (CFGCN-0, CFGCN-1, CFGCN-2, CFGCN-3, and CFGCN-4) at constant current density of 1 mA cm−2.
Specific capacitance obtained from GCD curves for CFGCN-0, CFGCN-1, CFGCN-2, CFGCN-3, and CFGCN-4 sample electrodes at a constant current density of 1 mA cm−2.
| Current density (mA cm−2) | Specific capacitance (F g−1) | ||||
|---|---|---|---|---|---|
| CFGCN-0 | CFGCN-1 | CFGCN-2 | CFGCN-3 | CFGCN-4 | |
| 1 | 20.07 | 47.36 | 117.06 | 191.11 | 147.22 |
| 2 | 12.53 | 23.33 | 101.51 | 116.40 | 103.40 |
| 3 | 8.17 | 15.80 | 92.93 | 112.83 | 75.17 |
| 4 | 6.22 | 13.20 | 79.07 | 98.93 | 75.02 |
| 5 | 3.33 | 8.89 | 84.41 | 72.61 | 64.22 |
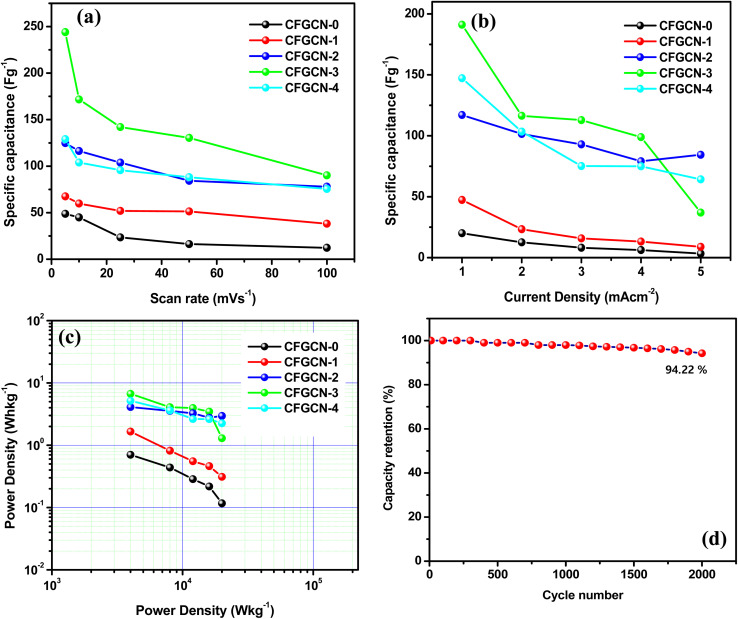
Furthermore, the variation in specific capacitance with scan rate is evident in Fig. 8(a). Fig. 8(b) illustrates the changes in specific capacitance with current density. When compared to the specific capacitance and energy density values obtained at lower current densities, it is noticeable that at higher current densities, the specific capacitance and energy density values tend to decrease. This decrease can be attributed to the diminished accessibility of electrolyte ions at higher scan rates and current densities. CFGCN-3 demonstrates superior performance compared to other electrodes at low current levels; however, its efficacy diminishes at higher current levels, rendering it the least effective under such conditions. This phenomenon is attributed to the fact that, at lower current density values, the electrolyte ions have sufficient time to permeate the pores within the electrode material. As a result, a substantial number of electrolyte ions can fill the pores present on the electrode surface. Conversely, at higher current density values and high scan rates, the electrolyte ions struggle to access all the pores on the electrode surface. Consequently, the electrode exhibits lower electrochemical performance, particularly when compared to its performance at lower current densities. The outstanding electrochemical performance of CFGCN-3 can be attributed to multiple factors, including its larger surface area, uniform porosity, appropriate doping, excellent electrical conductivity, and efficient ion insertion/extraction processes during the charging and discharging cycles. A Ragone plot in Fig. 8(c) highlights the energy and power density performance of the different sample electrodes, emphasizing the impressive performance of CFGCN-2 and CFGCN-3. Moreover, Fig. 8(d) illustrates the remarkable 94.22% capacity retention of the CFGCN-3 electrode over 2000 charge–discharge cycles at a consistent current density of 5 mA cm−2, underlining its suitability for high-energy-density supercapacitors (Table 3).
Fig. 8. (a) Variation specific capacitance vs. scan rate, (b) variation specific capacitance with current densities, (c) Ragone plot and (d) coulombic efficiency of CFGCN-3 samples at constant current density of 5 mA cm−2.
Comparison of our work with related studies in the literature.
| Electrode material | Method of synthesis | Electrolyte | Sp. capacitance (F g−1), scan rate (mV s−1)/current density (A g−1) | Columbic efficiency (%) & cycles | Ref. |
|---|---|---|---|---|---|
| Fe2O3 | Chemical bath deposition | 1 M NaOH | 178 F g−1, 5 mV | 89% & 3000 | 43 |
| α-Fe2O3 | Self-assembly process | 0.5 M Na2SO3 | 127 F g−1, 1 A g−1 | 80% & 1000 | 44 |
| α-Fe2O3 | Hydrothermal approach | 1 M KOH | 249 F g−1 | 93.6% & 2000 | 45 |
| α-Fe2O3/rGO | Hydrothermal method | 1 M KOH | 255 F g−1, 0.5 A g−1 | 90% & 4000 | 46 |
| Cu-Fe2O3/g-C3N4 | Hydrothermal method | 1 M Na2SO4 | 244.0 F g−1, 5 mV s−1 | 94.22% & 2000 | In the present work |
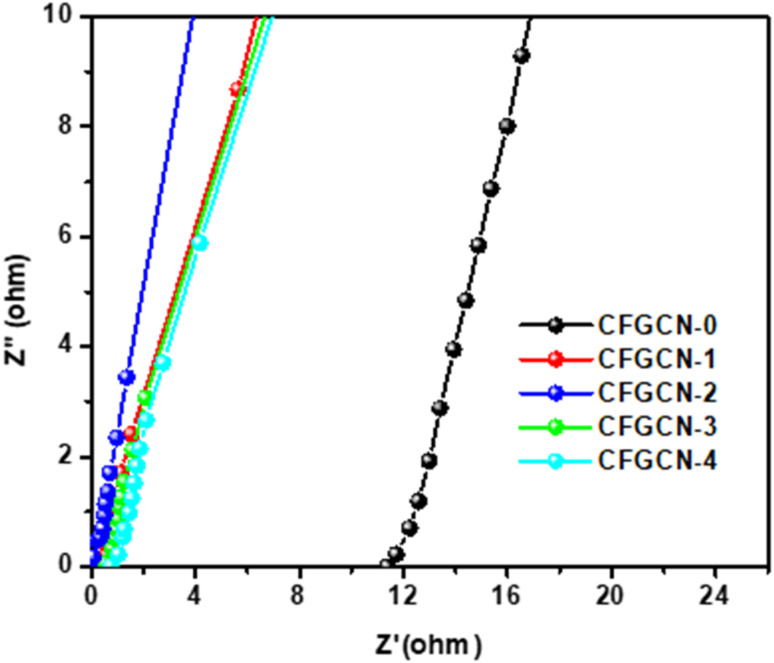
Electrochemical impedance spectroscopy (EIS) analysis was conducted to investigate the charge transfer resistance (Rct) and solution resistance (Rs) at the electrode–electrolyte interface for various electrode samples, including CFGCN-0, CFGCN-1, CFGCN-2, CFGCN-3, and CFGCN-4. This analysis was performed within a frequency range of 10.0–0.001 kHz using a 1 M Na2SO4 electrolyte, with a constant perturbation potential of 5 mV. The resulting Nyquist plot (Fig. 9) provided valuable insights into the electrochemical properties of these samples. From the Nyquist plot, the Rct and Rs values for each sample were determined based on the high and low-frequency regions, respectively, and are summarized in Table 4. Notably, CFGCN-0 exhibited the highest Rct and Rs values when compared to the other samples. It's important to highlight that elevated Rct and Rs values can adversely impact the overall electrochemical performance of the electrode within the electrolyte. Conversely, CFGCN-3 displayed the lowest Rct and Rs values among all the samples. This characteristic sets CFGCN-3 apart, indicating a superior electrochemical performance. As a consequence, CFGCN-3 demonstrated a higher energy density, specific capacitance, and an extended cycle life. These outcomes can be attributed to the excellent electrical conductivity of CFGCN-3, appropriate Cu doping into Fe2O3, and the optimal combination of Cu-Fe2O3 within g-C3N4. The findings derived from the EIS spectra align with those obtained from cyclic voltammetry (CV) and galvanostatic charge–discharge (GCD) curves, underscoring the consistency of our results. In summary, the EIS analysis offered crucial insights into the electrochemical behavior of these samples, emphasizing the significance of low Rct and Rs values in achieving enhanced electrochemical performance, and highlighting CFGCN-3 as a standout candidate in this regard, owing to its unique composition and properties.
Fig. 9. EIS spectra for CFGCN-0, CFGCN-1, CFGCN-2, CFGCN-3, and CFGCN-4 samples.
The values of Rct and Rs obtained for sample (CFGCN-0, CFGCN-1, CFGCN-2, CFGCN-3, and CFGCN-4) electrode.
| Sample code | R ct (ohm) | R s (ohm) |
|---|---|---|
| CFGCN-0 | 12.04 | 18.56 |
| CFGCN-1 | 1.56 | 2.6 |
| CFGCN-2 | 0.956 | 1.54 |
| CFGCN-3 | 0.78 | 1.66 |
| CFGCN-4 | 0.88 | 1.25 |
4. Conclusion
In this present study, we successfully synthesized a Cu doped Fe2O3@g-C3N4 nanocomposite through a hydrothermal process. Our investigation focused on examining the impact of varying levels of copper doping on the material's morphology and electrochemical properties. The Cu doped Fe2O3@g-C3N4 composite electrode, comprising 6% Cu doped Fe2O3 in conjunction with g-C3N4, exhibited remarkable characteristics. Notably, it displayed exceptional cycling stability, retaining 94.22% of its capacity even after undergoing 2000 charge–discharge cycles at a current density of 5 mA cm−2. Furthermore, this electrode demonstrated impressive electrochemical performance, boasting a specific capacitance of 244.0 F g−1 and a remarkable maximum energy density of 5.31 W h kg−1 at a scan rate of 5 mV s−1. These enhanced electrochemical properties can be attributed to several factors, including its morphology, appropriate doping levels, excellent electrical conductivity, and efficient ion insertion/de-insertion processes during charging and discharging. Therefore, these compelling results firmly establish the Cu doped Fe2O3@g-C3N4 electrode as a highly promising material for supercapacitor applications, highlighting its potential in energy storage and related technologies.
Conflicts of interest
The authors declare that they have no known competing financial interests or personal relationships that could have appeared to influence the work reported in this paper.
Supplementary Material
Acknowledgments
The authors express their gratitude to Dr P. B. Buchade, the principal of MES Abasaheb Garware College in Pune, and Dr Shobha A. Waghmode, the head of the chemistry department, for their invaluable support and motivation. HRP extends thanks to the Maharashtra Education Society in Pune for granting access to research facilities.
Electronic supplementary information (ESI) available: XRD diffraction spectra of (a) g-C3N4 and (b) Fe2O3, and Fe2O3/g-C3N4. FESEM images of pristine g-C3N4. EDS of pure g-C3N4 and Cu doped Fe2O3/g-C3N4 nanocomposites. XPS survey spectra of Cu doped Fe2O3/g-C3N4 nanocomposites. Summary of the various preparation conditions of Cu doped Fe2O3/g-C3N4 nanocomposites. See DOI: https://doi.org/10.1039/d3ra08428k
References
- Zhang L. Tian Y. Song C. Qiu H. Xue H. J. Alloys Compd. 2021;859:157816. doi: 10.1016/j.jallcom.2020.157816. [DOI] [Google Scholar]
- Rabani I. Zafar R. Subalakshmi K. Kim H.-S. Bathula C. Seo Y.-S. J. Hazard. Mater. 2021;407:124360. doi: 10.1016/j.jhazmat.2020.124360. [DOI] [PubMed] [Google Scholar]
- Zhong L. Wu C. Lei S. Liang G. Sayyar S. Gao B. Lin L. ACS Appl. Energy Mater. 2022;5:8004–8014. doi: 10.1021/acsaem.2c00444. [DOI] [Google Scholar]
- Balgude S. D., Barkade S. S. and Mardikar S. P., Multifunctional Nanostructured Metal Oxides for Energy Harvesting and Storage Devices, 2020, pp. 169–194 [Google Scholar]
- Tan J. Li Z. Ye M. Shen J. ACS Appl. Mater. Interfaces. 2022;14:37259–37269. doi: 10.1021/acsami.2c07775. [DOI] [PubMed] [Google Scholar]
- Sahoo S. Kumar R. Joanni E. Singh R. K. Shim J.-J. J. Mater. Chem. A. 2022;10:13190–13240. doi: 10.1039/D2TA02357A. [DOI] [Google Scholar]
- Mir R. A. Upadhyay S. Rather R. A. Thorpe S. J. Pandey O. P. Energy Adv. 2022;1:438–448. doi: 10.1039/D2YA00050D. [DOI] [Google Scholar]
- Tiwari P. Janas D. Mater. Chem. Front. 2022;6:2386–2412. doi: 10.1039/D2QM00146B. [DOI] [Google Scholar]
- Zhao Y. Dong D. Wang Y. Gong S. An T. Yap L. W. Cheng W. ACS Appl. Mater. Interfaces. 2018;10:42612–42620. doi: 10.1021/acsami.8b14769. [DOI] [PubMed] [Google Scholar]
- Shi Y. Sun L. Zhang Y. Si H. Sun C. Gu J. Gong Y. Li X. Zhang Y. J. Alloys Compd. 2021;853:156903. doi: 10.1016/j.jallcom.2020.156903. [DOI] [Google Scholar]
- Delbari S. A. Ghadimi L. S. Hadi R. Farhoudian S. Nedaei M. Babapoor A. Sabahi Namini A. Le Q. V. Shokouhimehr M. Shahedi Asl M. Mohammadi M. J. Alloys Compd. 2021;857:158281. doi: 10.1016/j.jallcom.2020.158281. [DOI] [Google Scholar]
- Hu J. Gao B. Qi Q. Zuo Z. Yan K. Hou S. Zou D. ACS Omega. 2022;7:31628–31637. doi: 10.1021/acsomega.1c05717. [DOI] [PMC free article] [PubMed] [Google Scholar]
- Gu J. Sun L. Zhang Y. Zhang Q. Li X. Si H. Shi Y. Sun C. Gong Y. Zhang Y. Chem. Eng. J. 2020;385:123454. doi: 10.1016/j.cej.2019.123454. [DOI] [Google Scholar]
- Zaka A. Hayat K. Mittal V. ACS Appl. Electron. Mater. 2021;3:574–596. doi: 10.1021/acsaelm.0c00953. [DOI] [Google Scholar]
- Lichchhavi A. K. Shirage P. M. J. Energy Storage. 2022;55:105692. doi: 10.1016/j.est.2022.105692. [DOI] [Google Scholar]
- Kandasamy M. Sahoo S. Nayak S. K. Chakraborty B. Rout C. S. J. Mater. Chem. A. 2021;9:17643–17700. doi: 10.1039/D1TA03857E. [DOI] [Google Scholar]
- Liang C. Wang S. Sha S. Lv S. Wang G. Wang B. Li Q. Yu J. Xu X. Zhang L. J. Mater. Chem. C. 2023;11:4288–4317. doi: 10.1039/D2TC04816G. [DOI] [Google Scholar]
- Zhu Y. Cheng S. Zhou W. Jia J. Yang L. Yao M. Wang M. Zhou J. Wu P. Liu M. ACS Sustain. Chem. Eng. 2017;5:5067–5074. doi: 10.1021/acssuschemeng.7b00445. [DOI] [Google Scholar]
- Zhang X. Pei Y. Tian B. Wu Y. Tang G. Liu Q. Liang J. Wu W. J. Energy Storage. 2022;56:106136. doi: 10.1016/j.est.2022.106136. [DOI] [Google Scholar]
- Karthikeyan K. Amaresh S. Lee S. N. Aravindan V. Lee Y. S. Chem.– Asian J. 2014;9:852–857. doi: 10.1002/asia.201301289. [DOI] [PubMed] [Google Scholar]
- Zeng Y. Han Y. Zhao Y. Zeng Y. Yu M. Liu Y. Tang H. Tong Y. Lu X. Adv. Energy Mater. 2015;5:1402176. doi: 10.1002/aenm.201402176. [DOI] [Google Scholar]
- Tamboli A. M. Tamboli M. S. Shinde S. K. Byeon J. Truong N. T. N. Kim C. Park C. J. Alloys Compd. 2022;928:167242. doi: 10.1016/j.jallcom.2022.167242. [DOI] [Google Scholar]
- Zhang J. Wang Y. Liao H.-J. Yang T.-Y. Chen Z. Yan X. Zhou Z. lv H. Liu W.-W. Chueh Y.-L. Mater. Today Energy. 2020;17:100388. doi: 10.1016/j.mtener.2020.100388. [DOI] [Google Scholar]
- Aalim M. Irshad I. Tantray A. M. Sohail A. Want B. Shah M. J. Mater. Sci.: Mater. Electron. 2023;34:1409. doi: 10.1007/s10854-023-10825-9. [DOI] [Google Scholar]
- Agale P. Salve V. Patil K. Mardikar S. Uke S. Patange S. More P. Ceram. Int. 2023;49:27003–27014. doi: 10.1016/j.ceramint.2023.05.240. [DOI] [Google Scholar]
- Tian Y. Hu X. Wang Y. Li C. Wu X. ACS Sustain. Chem. Eng. 2019;7:9211–9219. doi: 10.1021/acssuschemeng.8b06857. [DOI] [Google Scholar]
- Liu L. Wang J. Wang C. Wang G. Appl. Surf. Sci. 2016;390:303–310. doi: 10.1016/j.apsusc.2016.08.093. [DOI] [Google Scholar]
- Yue L. Zhang S. Zhao H. Wang M. Mi J. Feng Y. Wang D. J. Alloys Compd. 2018;765:1263–1266. doi: 10.1016/j.jallcom.2018.06.283. [DOI] [Google Scholar]
- Wei Y. Zhou C.-M. Cao X.-M. Sun Z.-J. Wu Q. Liu D.-L. Xing Z. Zhang Q.-G. J. Alloys Compd. 2022;929:167245. doi: 10.1016/j.jallcom.2022.167245. [DOI] [Google Scholar]
- Amirabad T. N. Ensafi A. A. Rezaei B. Fuel. 2022;330:125645. doi: 10.1016/j.fuel.2022.125645. [DOI] [Google Scholar]
- Zhang H. Xia L. Tang J. Li Y. Wang L. Ouyang C. Zhong S. Mater. Adv. 2022;3:6818–6825. doi: 10.1039/D2MA00377E. [DOI] [Google Scholar]
- Balgude S. Godase S. Shinde A. Harak C. Curr. Res. Green Sustainable Chem. 2021;4:100210. doi: 10.1016/j.crgsc.2021.100210. [DOI] [Google Scholar]
- Uke S. J. Akhare V. P. Meshram S. P. Chaudhari G. N. Adv. Sci., Eng. Med. 2018;10(12):1174–1182. doi: 10.1166/asem.2018.2290. [DOI] [Google Scholar]
- Pham V. V. Truong T. K. Hai L. V. La H. P. P. Nguyen H. T. Lam V. Q. Tong H. D. Nguyen T. Q. Sabbah A. Chen K.-H. You S.-J. Cao T. M. ACS Appl. Nano Mater. 2022;5:4506–4514. doi: 10.1021/acsanm.2c00741. [DOI] [Google Scholar]
- Balgude S. Patil K. Moharil S. Puranik M. Kadam S. Lokhande P. Patange S. More P. ChemistrySelect. 2022;7:e202200221. doi: 10.1002/slct.202200221. [DOI] [Google Scholar]
- Rajan A. Sharma M. Sahu N. K. Sci. Rep. 2020;10:15045. doi: 10.1038/s41598-020-71703-6. [DOI] [PMC free article] [PubMed] [Google Scholar]
- Harak C. Satpute D. Kadam V. Kolhe N. Wade A. Balgude S. Mardikar S. Balgude S. Pawar H. Emergent Mater. 2023;6:1797–1807. doi: 10.1007/s42247-023-00566-0. [DOI] [Google Scholar]
- Al-Musawi T. J. Asgariyan R. Yilmaz M. Mengelizadeh N. Asghari A. Balarak D. Darvishmotevall M. Magnetochemistry. 2022;8:137. doi: 10.3390/magnetochemistry8110137. [DOI] [Google Scholar]
- Shi X. Li X. Liu G. Du M. Zhang J. Liu G. Lu Q. J. Mater. Sci. 2020;55:10035–10046. doi: 10.1007/s10853-020-04775-4. [DOI] [Google Scholar]
- Jin Z. Liu C. Qi K. Cui X. Sci. Rep. 2017;7:39695. doi: 10.1038/srep39695. [DOI] [PMC free article] [PubMed] [Google Scholar]
- Guo X. Duan J. Li C. Zhang Z. Wang W. J. Mater. Sci. 2020;55:2018–2031. doi: 10.1007/s10853-019-04097-0. [DOI] [Google Scholar]
- Jangam K. Balgude S. Pawar H. Patange S. More P. Surf. Interfaces. 2022;33:102189. doi: 10.1016/j.surfin.2022.102189. [DOI] [Google Scholar]
- Kulal P. M. Dubal D. P. Lokhande C. D. Fulari V. J. J. Alloys Compd. 2011;509:2567–2571. doi: 10.1016/j.jallcom.2010.11.091. [DOI] [Google Scholar]
- Shivakumara S. Penki T. R. Munichandraiah N. ECS Electrochem. Lett. 2013;2:A60. doi: 10.1149/2.002307eel. [DOI] [Google Scholar]
- Zheng X. Yan X. Sun Y. Yu Y. Zhang G. Shen Y. Liang Q. Liao Q. Zhang Y. J. Colloid Interface Sci. 2016;466:291–296. doi: 10.1016/j.jcis.2015.12.024. [DOI] [PubMed] [Google Scholar]
- Zhu Y. Cheng S. Zhou W. Jia J. Yang L. Yao M. Wang M. Zhou J. Wu P. Liu M. ACS Sustain. Chem. Eng. 2017;5:5067–5074. doi: 10.1021/acssuschemeng.7b00445. [DOI] [Google Scholar]
Associated Data
This section collects any data citations, data availability statements, or supplementary materials included in this article.


