Abstract
A common motif in biology is the arrangement of cells into tubes, which further transform into complex shapes. Traditionally, analysis of dynamic tissues has relied on inspecting static snapshots, live imaging of cross-sections, or tracking isolated cells in 3D. However, capturing the interplay between in-plane and out-of-plane behaviors requires following the full surface as it deforms and integrating cell-scale motions into collective, tissue-scale deformations. Here, we present an analysis framework that builds in toto maps of tissue deformations by following tissue parcels in a static material frame of reference. Our approach then relates in-plane and out-of-plane behaviors and decomposes complex deformation maps into elementary contributions. The Tube-like sUrface Lagrangian Analysis Resource (TubULAR) provides an open-source implementation accessible either as a standalone toolkit or as an extension of the ImSAnE package used in the developmental biology community. We demonstrate our approach by analyzing shape change in the embryonic Drosophila midgut and beating zebrafish heart. The method naturally generalizes to in vitro and synthetic systems and provides ready access to the mechanical mechanisms relating genetic patterning to organ shape change.
INTRODUCTION
In the morphogenesis of thin tissues, the interplay between mechanical forces, cellular fates, and physiological function determines dynamic patterns of shape change. In epithelia [1], circulatory organs [2, 3], digestive organs [4, 5], respiratory organs [6–8], elastic shells [9, 10], and whole organisms alike [11, 12], tube-like surfaces deform in 3D space, contracting and dilating in-plane while bending out-of-plane in a coupled fashion. Understanding the dynamic mechanisms of shape change requires not only capturing instantaneous motion in 3D, but also following the material as it deforms [13, 14]. Furthermore, decomposing that motion into physically meaningful components enables insights linking cell behavior to organ shape [4, 15, 16].
Emerging computational approaches have enabled quantitative characterizations of morphogenesis that clarify the relationship between gene expression patterns, physical forces, and tissue geometry [14, 17–24]. In a particularly fruitful methodological advance, the community has applied ‘tissue cartography’ methods that map curved tissues to planar representations [25–28]. This has provided insight into a variety of systems including egg chambers [29], fly wings [30], eyes [31], ascidian vasculature [32], zebrafish endoderm [25], and mouse intestines [33]. While these methods are sufficient to track tissue motion within static geometries or in local patches, in toto measurements of tissue deformation in complex, dynamic geometries have remained a challenge.
We propose an automated method for registering dynamic surfaces with the topology of a cylinder – but with arbitrarily complex geometry – and classifying the signatures of tissue deformation underlying organ-scale shape change (Fig. 1). This provides a framework for automatically tracing the dynamics of complex shapes and facilitates cell tracking on contorting 3D surfaces (Fig. S1 and Supplementary Information Section I). This framework then decomposes tissue dilation, rotation, and shear, handling the computational subtleties that arise from surface curvature and bending. Further, performing 2D cell segmentation and projecting onto the deforming 3D surface resolves tissue shape changes into contributions from cell shape, cell rearrangement, and cell division.
FIG. 1. TubULAR is a toolkit for tracking dynamic surfaces such as visceral organs.
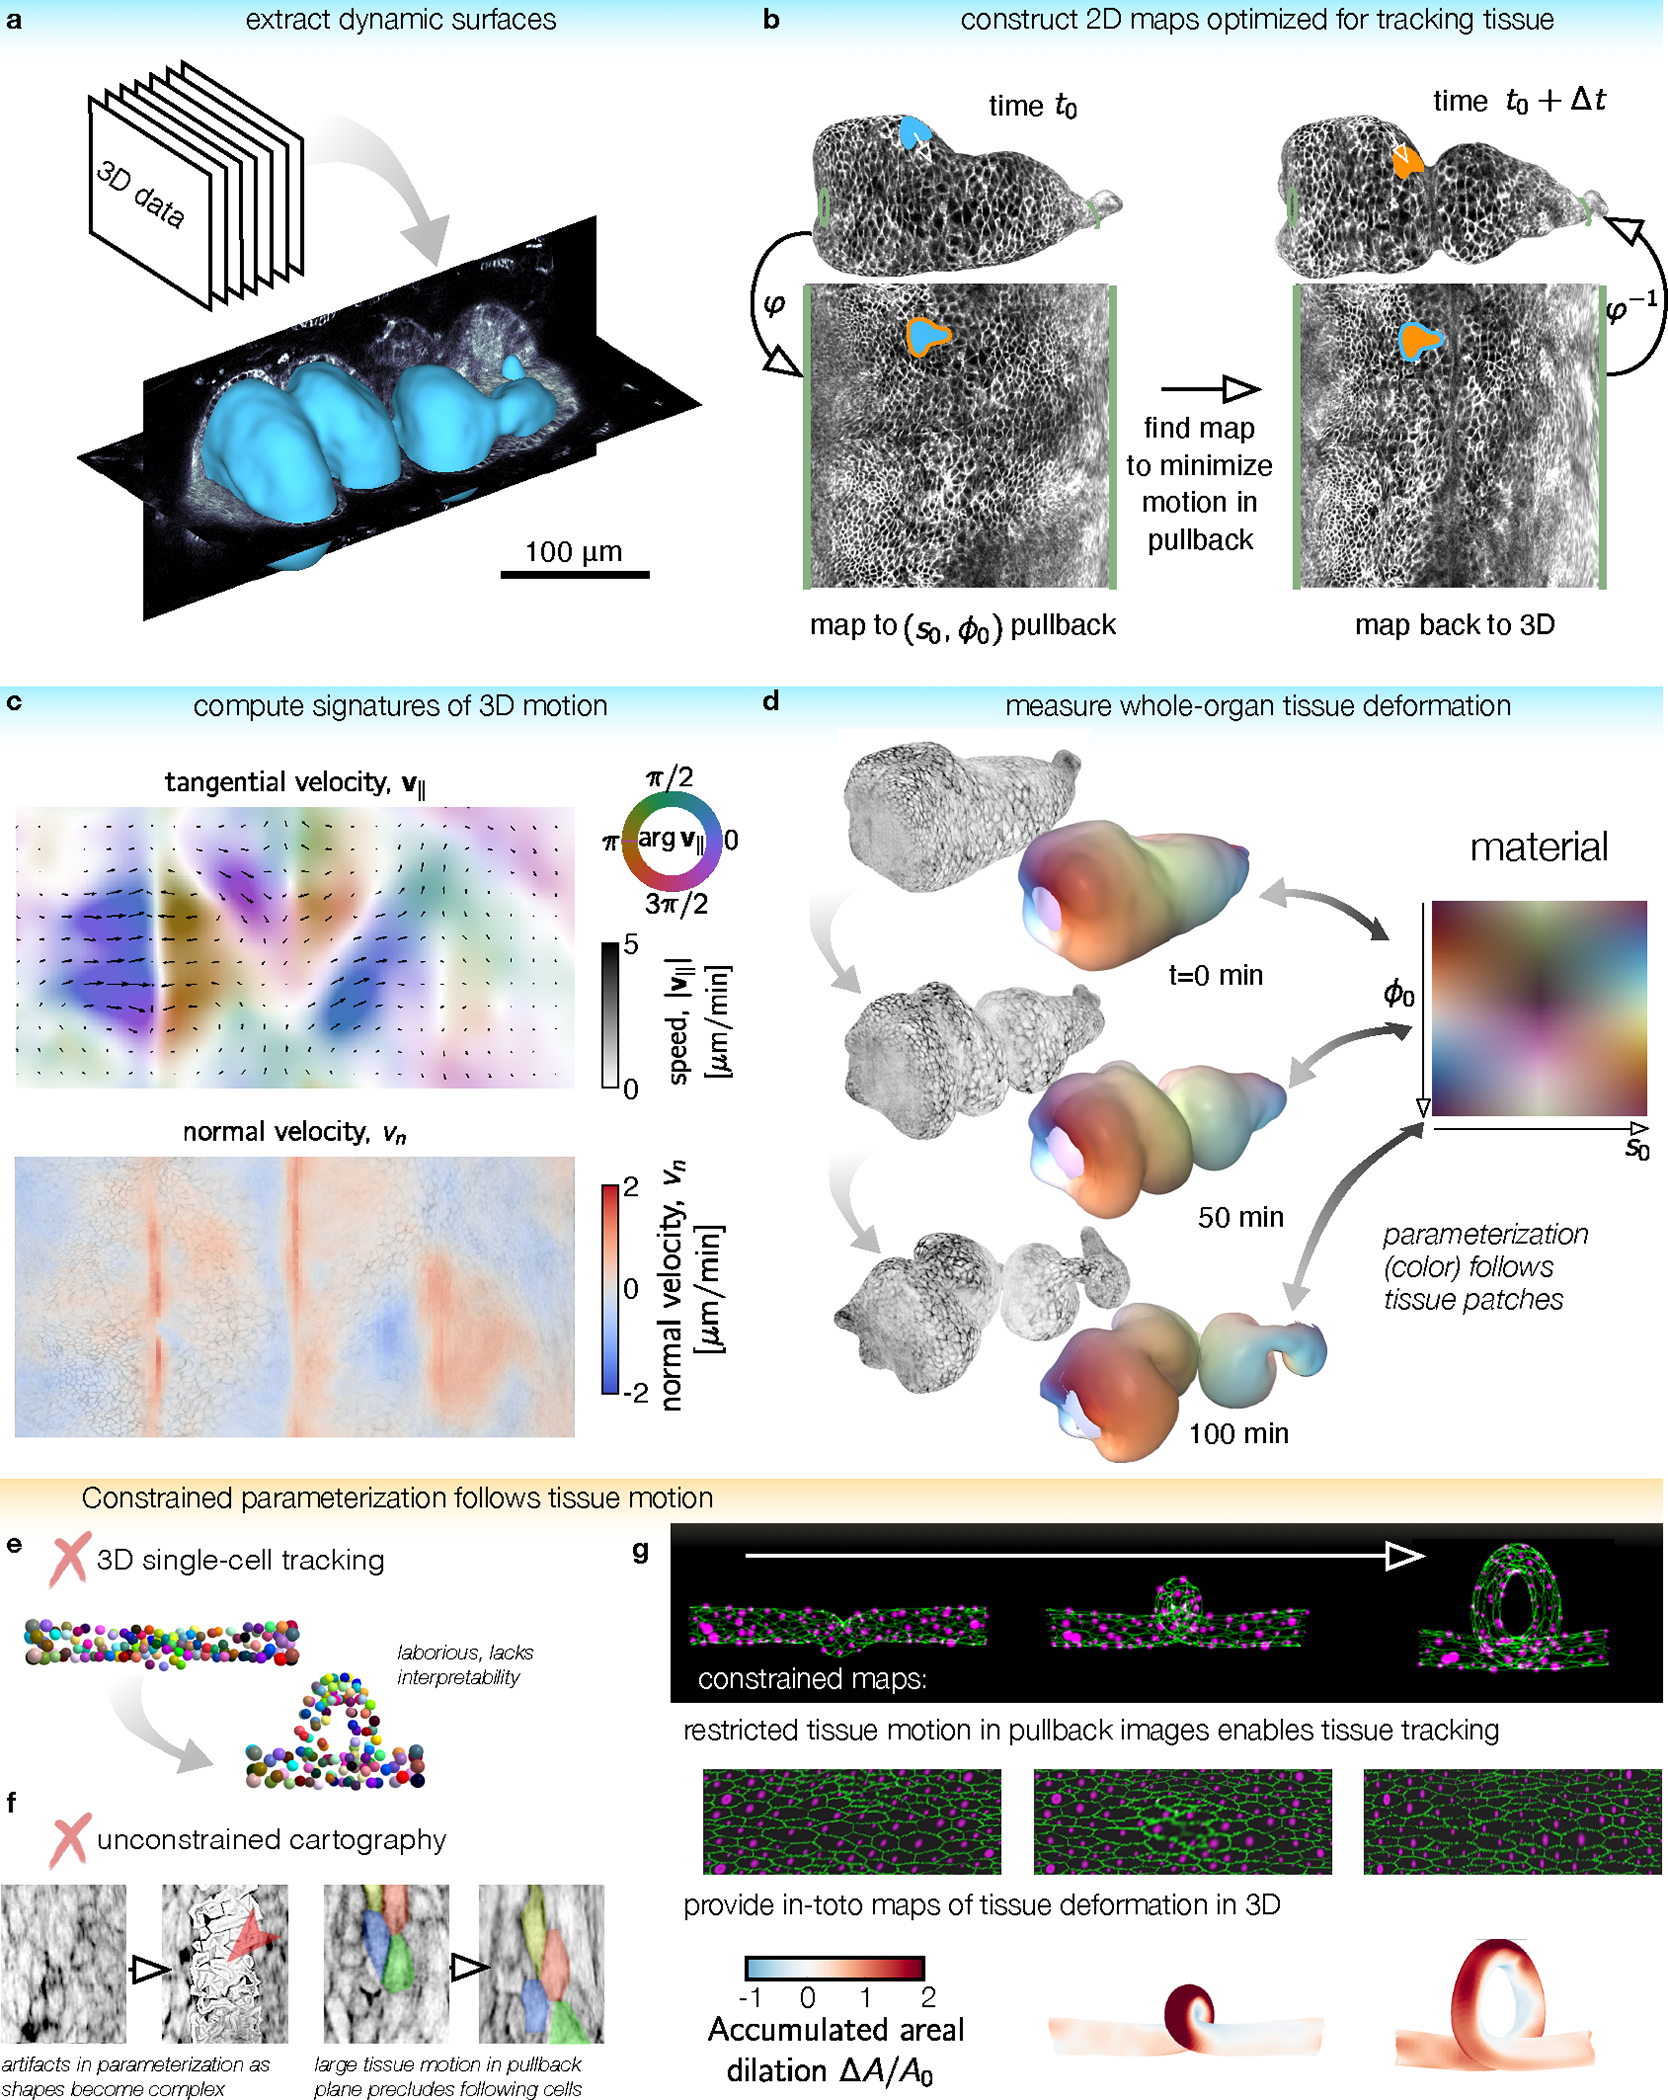
a, TubULAR first extracts dynamic surfaces of interest from volumetric datasets, here shown for the Drosophila midgut. b, Constrained parameterization of the whole surface facilitates tracking tissue motion. Mapping the surface at a reference timepoint to the plane defines a material coordinate system, . Pullback images of subsequent timepoints are optimized to be nearly stationary in the parameterization space. 3D tissue velocities (white arrow) are obtained by linking the 3D positions of each material coordinate across timepoints. c, Velocities decompose into in-plane and out-of-plane tissue motions, here shown by a 2D pullback representation of the tangential tissue velocity (colored quiverplot) and the normal velocity, (red for inward velocity, blue for outward). d, We integrate tissue deformations over time in the tissue’s material frame of reference. Here, the gut is colored by the location of each tissue parcel in its intrinsic material coordinate system . Patches retain their original color as they move, stretch, and bend. e, Tracking individual cells typically involves laborious manual input and does not readily return tissue-scale deformation patterns. Cell identities are colored from an in silico dataset of cells on a coiling tube. f, Cartographic projections using previously-published methods fail for complex and dynamic shapes such as the folding midgut. (Left) Parameterization errors appear when using ImSAnE’s cylinderMeshWrapper on complex surfaces. (Right) Motion of cells in the pullback plane is large for adjacent timepoints. g, For the same in silico dataset as in (e), TubULAR maps the tissue to a series of images which change little over time. By tracking the motion in 2D, we read out tissue deformation across the full tube in 3D, here shown using the accumulated dilatational strain.
By applying this approach to the embryonic gut of the fly Drosophila melanogaster [4, 34–36] and the beating heart of the embryonic zebrafish Danio rerio [37–40], we extract the full deformation fields and relate signatures of in-plane and out-of-plane tissue deformation. Despite the complexity of tissue motion in these systems, we obtain simple geometric descriptions underlying shape change.
RESULTS
Contemporary microscopy methods such as confocal microscopy [41] or light-sheet microscopy [42–44] generate volumetric data, wherein each voxel carries a (potentially multi-channel) intensity measured at a specific location in the sample. At the same time, many biological processes harness quasi-2D, thin tissues or interfaces to sculpt complex 3D forms. To probe the interplay between in-plane interactions and out-of-plane dynamics in such systems, we must extract the tissue surface, track motion within the surface as it deforms, and decompose the resulting motion into signatures of deformation (Fig. S2).
We package this functionality in the Tube-like sUrface Lagrangian Analysis Resource (TubULAR), publicly available on GitHub. The package includes (and uses) independent toolkits for surface visualization (TexturePatch), conformal mapping (RicciFlow), and discrete exterior calculus (DECLab). A typical workflow (1) extracts the tissue surface from 3D data – whether from confocal, light-sheet, or another 3D imaging technique, (2) generates a pullback representation for surface parameterization and visualization, (3) analyzes tissue motion using discrete exterior calculus, and, if appropriate, (4) decomposes the dynamics into a mode-based description (see Fig. S3, Fig. S4, and Supplementary Information Section II). In addition to the standalone toolkit, we have incorporated the core functionality of TubULAR within the ImSAnE environment [26], extending ImSAnE’s capabilities to tackle complex, tube-like geometries and interpret their dynamics.
TubULAR’s parameterization approach offers several advantages over previous methods. In contrast to 3D tracking of individual cells, TubULAR supplies a material frame of reference through which to interpret motion and deformations for curved surfaces of interest (Fig. 1a–e). TubULAR further extends previous cartographic approaches like ImSAnE to construct constrained in toto parameterizations of surfaces, following tissue patches as they move and deform over time (Fig. 1f–g and Supplementary Information Section III). While ImSAnE can generate high-quality cartographic projections at any given timepoint by dividing a surface into multiple coordinate patches, tissue motion within and between patches is unconstrained between time points, posing challenges for tracking and interpreting cell and tissue motion in dynamic geometries (Fig. S5). Moreover, while previous methods can construct an in toto parameterization for simple surface geometries, native ImSAnE methods failed to capture complex geometries and do not constrain tissue motion in the 2D pullback space (Fig. S6).
After validating our constrained method with a synthetic dataset (Fig. 1e and g, Fig. S7–S11 and Supplementary Information Section IV), we then applied our method below using a dataset of the embryonic Drosophila midgut (Fig. 1a–d, Fig. 2, and Fig. 3) from ref. [4], as we discuss step-by-step below. During development, the midgut closes into a tube composed of a monolayer of endoderm surrounded by a thin net of muscle cells [36, 45–47]. Constrictions then form, subdividing the organ into chambers [4, 34]. This dataset featured midgut-specific expression of an mCherry-tagged plasma membrane marker (see Methods).
FIG. 2. Coordinate parameterization follows 3D deformations of the evolving surface, enabling quantification of cell and tissue-scale dynamics, shown here for the fly midgut as it folds into compartments.
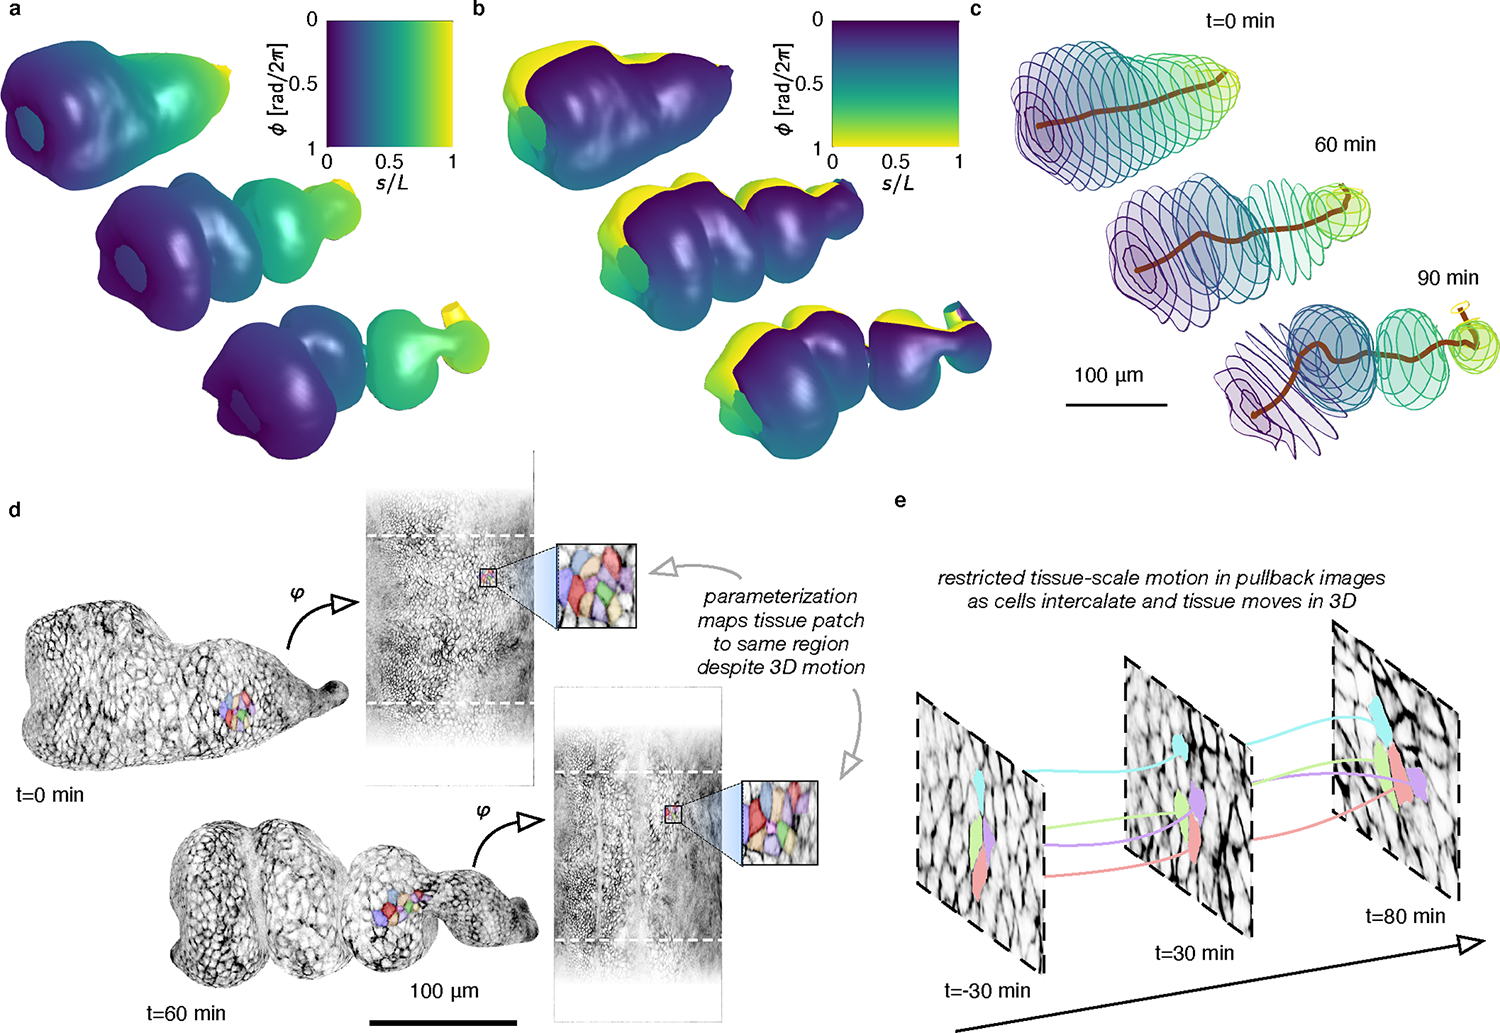
a-b, Dynamic maps to a fixed material frame captures the midgut’s longitudinal (a) and circumferential (b) coordinates as the surface deforms into a convoluted shape. c, Computational sectioning of the parameterized surface shows circumferential disks of the organ sampled evenly along its length. This construction provides a natural, system-spanning centerline and a measure of sample width along the surface. d, Despite large tissue movement in 3D, tissue motion is restricted in the pullback images, as highlighted by the same patch of cells 1 hour apart. e, While tissue-scale motion is minimized in the pullback images, individual cells may move and exchange neighbors, enabling cell tracking. Measuring the difference between tissue strain-rate and intercalation rate gives insights into the morphogenetic process (see Extended Data Fig. 3).
FIG. 3. Dynamic maps to the material frame yield covariant measures of tissue velocity and deformation in 3D.
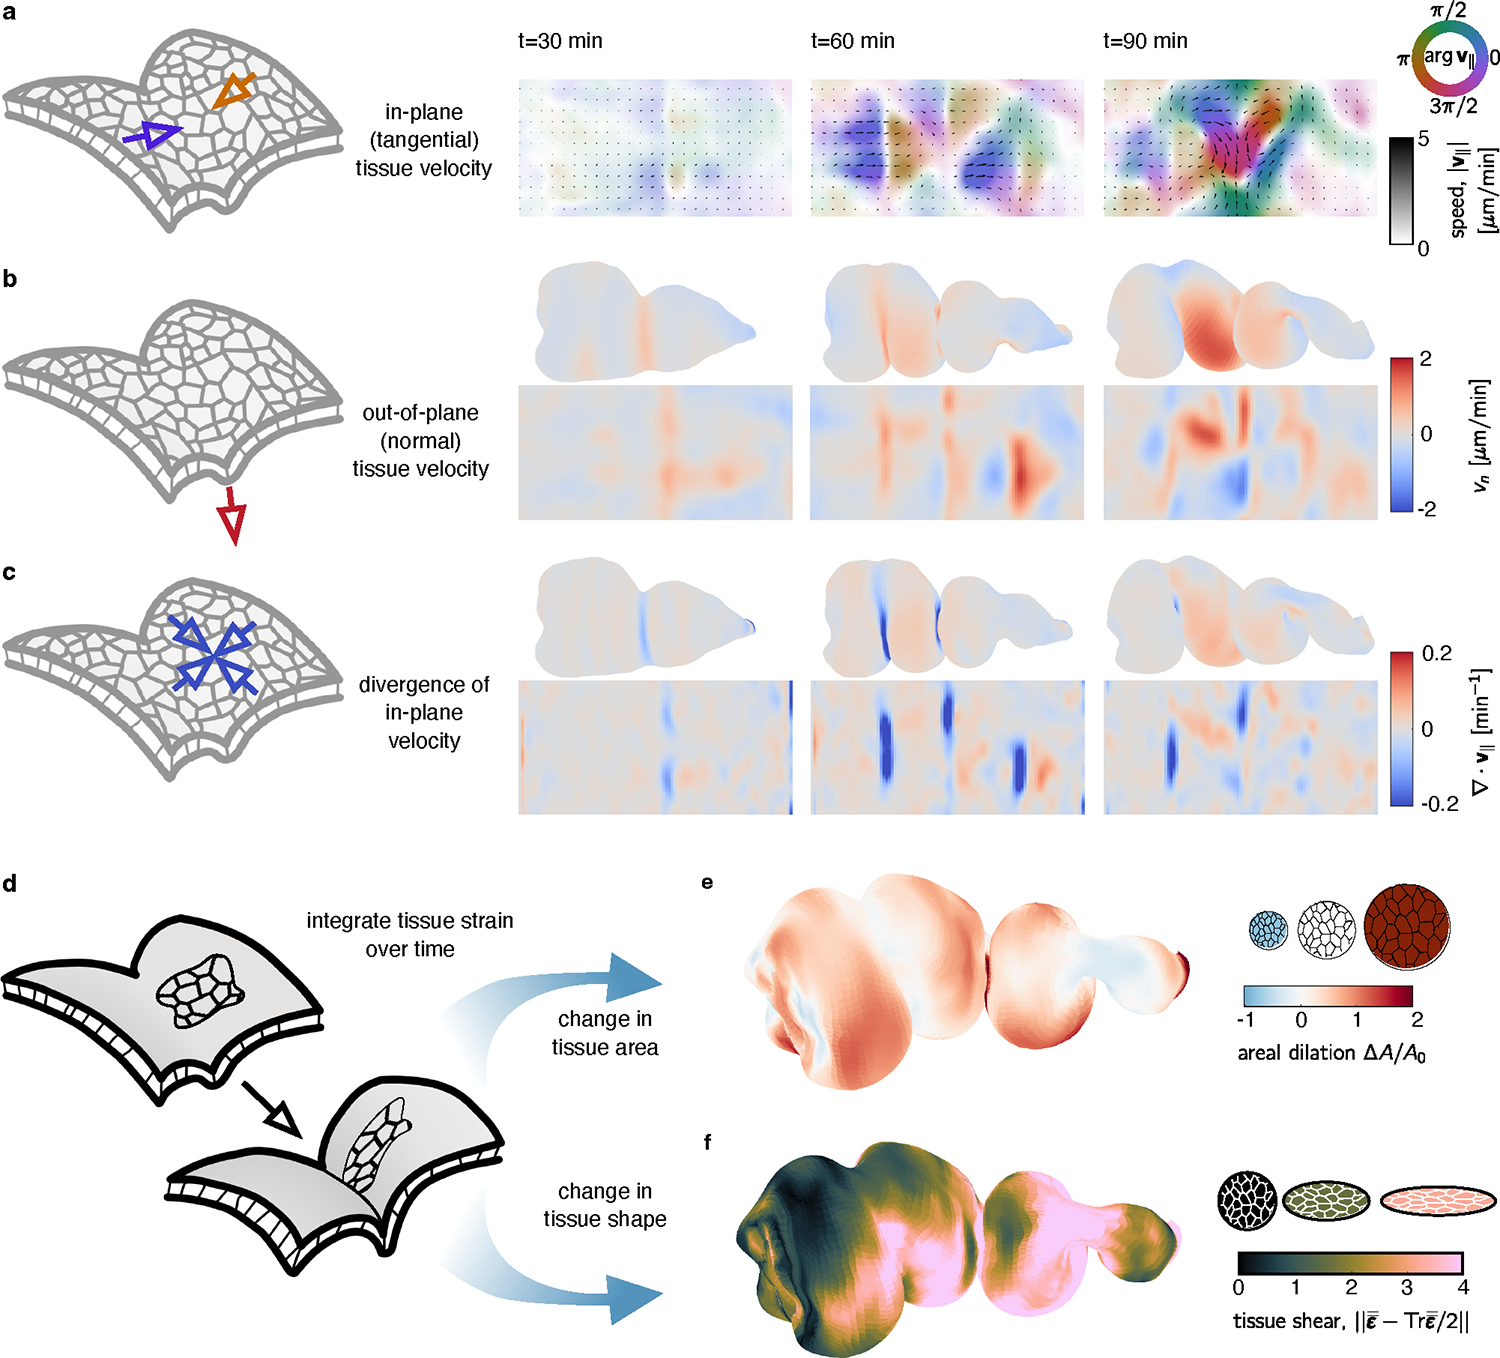
Tissue velocities are decomposed into in-plane (tangential) and out-of-plane (normal) components. a, 2D pullback representation of in-plane tissue motion shows a line defect near the middle constriction, then defects at the anterior and posterior constrictions, followed by increasingly complex in-plane flows. Color denotes the orientation of flow relative to the longitudinal axis , and the opacity and arrow lengths reflect speed of the tissue motion. b, The underlying out-of-plane velocity is positive (inwards) near constrictions. c, DEC computation of the divergence of the in-plane velocity shows patterns of sinks in the constrictions and sources in the chambers’ lobes, in synchrony with the out-of-plane deformation. d-f Following material pathlines in 3D through time returns measures of integrated strain. These decompose into dilatational (area-changing) and deviatoric (shape-changing) components. e, The dilatational strain shows areal growth in the chambers but less area change near constrictions for a midgut 90 minutes after the onset of the first constriction. f, The deviatoric strain shows strong tissue shear near each constriction at the same timepoint.
From volumetric data to dynamic textured surfaces
We first set out to extract curved surfaces of interest from 3D data. As shown in Fig. 1a, we use a level sets method [48] to obtain a simply-connected surface with a desired smoothness and generate a smooth mesh triangulation (see Fig. S12 and Supplementary Information Section V). The result is a dynamic set of surfaces tracing the tube-like surface over time. Users may alternately generate triangulated surfaces via other methods (such as Imaris, iLastik [49], or intensity-based segmentation), then use TubULAR for subsequent analysis.
Constrained parameterization for tracking surface dynamics
Understanding the ways in which shape dynamics couple to biological processes such as cell shape change, cell intercalations, cytoskeletal patterning, and gene expression requires the ability to identify and follow patches of tissue as they move and deform. On its own, the previous surface extraction step provides an instantaneous description of the surface geometry, but does not identify how the tissue moves and deforms from timepoint to timepoint. In the language of continuum mechanics, we must construct a Lagrangian description, wherein we follow material parcels along the surface as morphogenesis proceeds [50].
As illustrated in Fig. 1b–d and Fig. 2, we build a parameterization scheme such that cells (or other objects) in the pullback representation move as little as possible. This enables us to follow a nearly static 2D representation, which we can then project into 3D to obtain the true motion. TubULAR first cartographically maps the surface at a reference timepoint to the plane – defining a material frame of reference (Fig. 1d). To do so, we cut small ‘endcaps’ at two poles (Fig. S13 and create a virtual seam along the long axis for ‘unrolling’ the mesh into the plane using a conformal map (see Fig. S14, Fig. S15, Fig. S16, and Supplementary Information Sections VI–VIII).
We then advance from this initial map at a single timepoint to follow the tissue motion over time, adjusting the mapping so that tissue is immobilized in the pullback image. The result is a dynamic map from the 3D surface to a 2D material frame of reference that parameterizes the whole organ surface over time (Fig. 2). We found that a four-step approach to constructing this map provides a balance between stringent motion minimization and stability across many timepoints: , where is a conformal map from the 3D surface to the plane, adjusts the longitudinal axis, minimizes motion along the circumferential axis, accounts for residual motion through optical correlation of consecutive pullback images, and denotes function composition (Extended Data Fig. 1 and Fig. S15). We are then able to follow extreme deformations of the tissue in 3D space simply by reading off the dynamic inverse map .
Fig. 2a–c shows this parameterization scheme applied to the Drosophila midgut, with tracked surfaces colored by the longitudinal (Fig. 2a) and circumferential (Fig. 2b) coordinates of the tissue as it deforms in space. The resulting parameterization can be conceptualized as tracking polygons arranged sequentially along a system-spanning centerline (Fig. 2c).
Fig. 2d–e shows that tracked cells in the corresponding pullback images move little despite large deformations, taming the analysis of whole-organ morphogenesis. Extended Data Fig. 2 shows an overlay of the tissue in the material frame for timepoints spanning over 1 hour, highlighting the precision of pullback stabilization. Since the method rectifies tissue-scale velocity (at a user-defined spatial scale), but not necessarily individual cells’ motion, we observe cell intercalation events such as those shown in Fig. 2e. Separating out the effects of cell shape changes and cell intercalations has given insights into multiple mechanisms of morphogenesis in planar tissues [19, 51]. Here, this follows naturally from our approach. Extended Data Fig. 3 and Supplementary Information Section IX detail an example of this decomposition.
Interpreting motion on curved surfaces
The previous step provides ‘pathlines’ of material points in the tissue: since tissue patches remain stationary in the material coordinates, we can read off the 3D paths of these patches. Motion along these paths provides velocity vectors of the tissue defined over the surface and over time. In order to interpret these tissue flows, we now decompose the velocity fields into their underlying components. With 3D velocities in hand for each timepoint, we first separate the component that is normal to the tissue surface from tangential motion along the surface (Fig. 3a–b), then measure the divergence, curl, Laplacian, and harmonic component [52] of tangential tissue velocities.
Dealing with velocity fields on curved surfaces requires certain computational care: parallel lines cross and diverge, and the orientation of a cell may change by simply traveling along ‘straight’ lines (geodesics). In TubULAR, our calculations therefore rest on an implementation of the discrete exterior calculus (DEC) formalism [52, 53]. Signals are represented as discrete differential forms on the surface. In this framework, basic differential operators can be combined together to form the divergence, curl, and Laplacian operators that are a part of TubULAR’s default workflow, as well as more complicated differential operators. These operators can be directly applied to geometric data (e.g. surface curvature), kinematic data (e.g. surface velocities), and beyond (e.g. surface data intensity, surface data anisotropy fields etc.) to understand the ways in which spatiotemporal variation in observable fields (such as gene expression or myosin anisotropy) generate 3D shape change.
To make these methods accessible to a broad audience, we provide the DECLab toolkit, a simple and flexible framework for discrete geometry processing. It is included with TubULAR and also functions as a standalone tool. No deep knowledge of differential geometry or exterior calculus is necessary to use our implementation (see Supplementary Information Section X, Fig. S17, and Fig. S18 for validation and details).
Fig. 3 displays examples of DEC calculations applied to the developing Drosophila midgut. Whole-organ measurements of the tangential velocity are represented in the 2D pullback coordinates for snapshots of a representative embryo in Fig. 3a, with normal velocities shown in Fig. 3b. Further processing via DEC of the in-plane velocity fields shows localized sinks in the flow near constrictions, as shown in Fig. 3c. Extended Data Fig. 4 shows that this analysis reveals nearly incompressible dynamics of the midgut tissue [4].
Lagrangian measures of time-integrated tissue strain
Endowing the evolving surface with a set of Lagrangian coordinates induces the construction of a material metric. The metric tensor, , is a geometric object enabling the measurement of distances and angles between points on the surface. Unlike in flat geometries, here lengths and angles deform under the surface motion due to both gradients in the tangential velocity and also due to out-of-plane motion in curved regions of the tissue (see Methods and Supplementary Information Section XD). These changes are captured by the rate-of-deformation tensor, , which we construct directly from the tissue velocity fields and surface curvatures. Integrating the rate-of-deformation tensor along pathlines provides a Lagrangian measurement of cumulative tissue strain: .
As illustrated in Fig. 3d–f, the result is decomposed into both an isotropic area change and an anisotropic shear deformation. In the midgut, the small but persistent areal strain-rate pattern results in areal growth in the lobes of each chamber and modest decrease in tissue area near each constriction (Fig. 3e). The anisotropic shape-changing deformation indicative of convergent extension, in contrast, is strongest near constrictions (Fig. 3f).
Field decomposition simplifies complex deformations
Frequently, seemingly complicated patterns of motion can be decomposed into a sum of contributions from simpler components. This strategy has been successfully adopted to interpret zebrafish gastrulation [54] and vertebrate limb generation [24], for instance. In addition to the surface velocity decomposition discussed earlier, TubULAR also constructs mode decompositions on the surface. These are applicable to scalar fields, vector fields, or more complex objects such as cell anisotropy tensors. This functionality comes in two forms. First, our DEC implementation compares the relative importance of long-wavelength modes (with smooth spatial variation) and short-wavelength modes (with rapid spatial variation) by decomposing signals onto a basis of the eigenfunctions of the discrete Laplace-Beltrami operator [55]. Second, we include functions to decompose signals using principal component analysis (PCA) [56], as demonstrated in the next section. This extracts more general patterns of motion that contribute most strongly to the variance observed across time or across datasets.
Decomposing deformations of an embryonic heartbeat
Pumping circulatory organs such as the heart are ubiquitous across metazoans. To demonstrate the generality of our method to cyclic organ deformations, we analyzed a zebrafish heartbeat at a developmental timepoint roughly 28 hours post fertilization. In toto imaging of the heart relied on light-sheet illumination of an embryo expressing GFP in cardiomyocytes [40, 57]. Reconstruction of the 3D shape of the beating heart is shown for a set of illustrative timepoints in Fig. 4a [40]. Passing the volumetric data through TubULAR then returns covariant measures of in-plane and out-of-plane deformation (Supplementary Information Section XI).
FIG. 4. Tracing the in-plane and out-of-plane dynamics of a beating heart reveals the phased coupling between dilatational and transverse deformations.
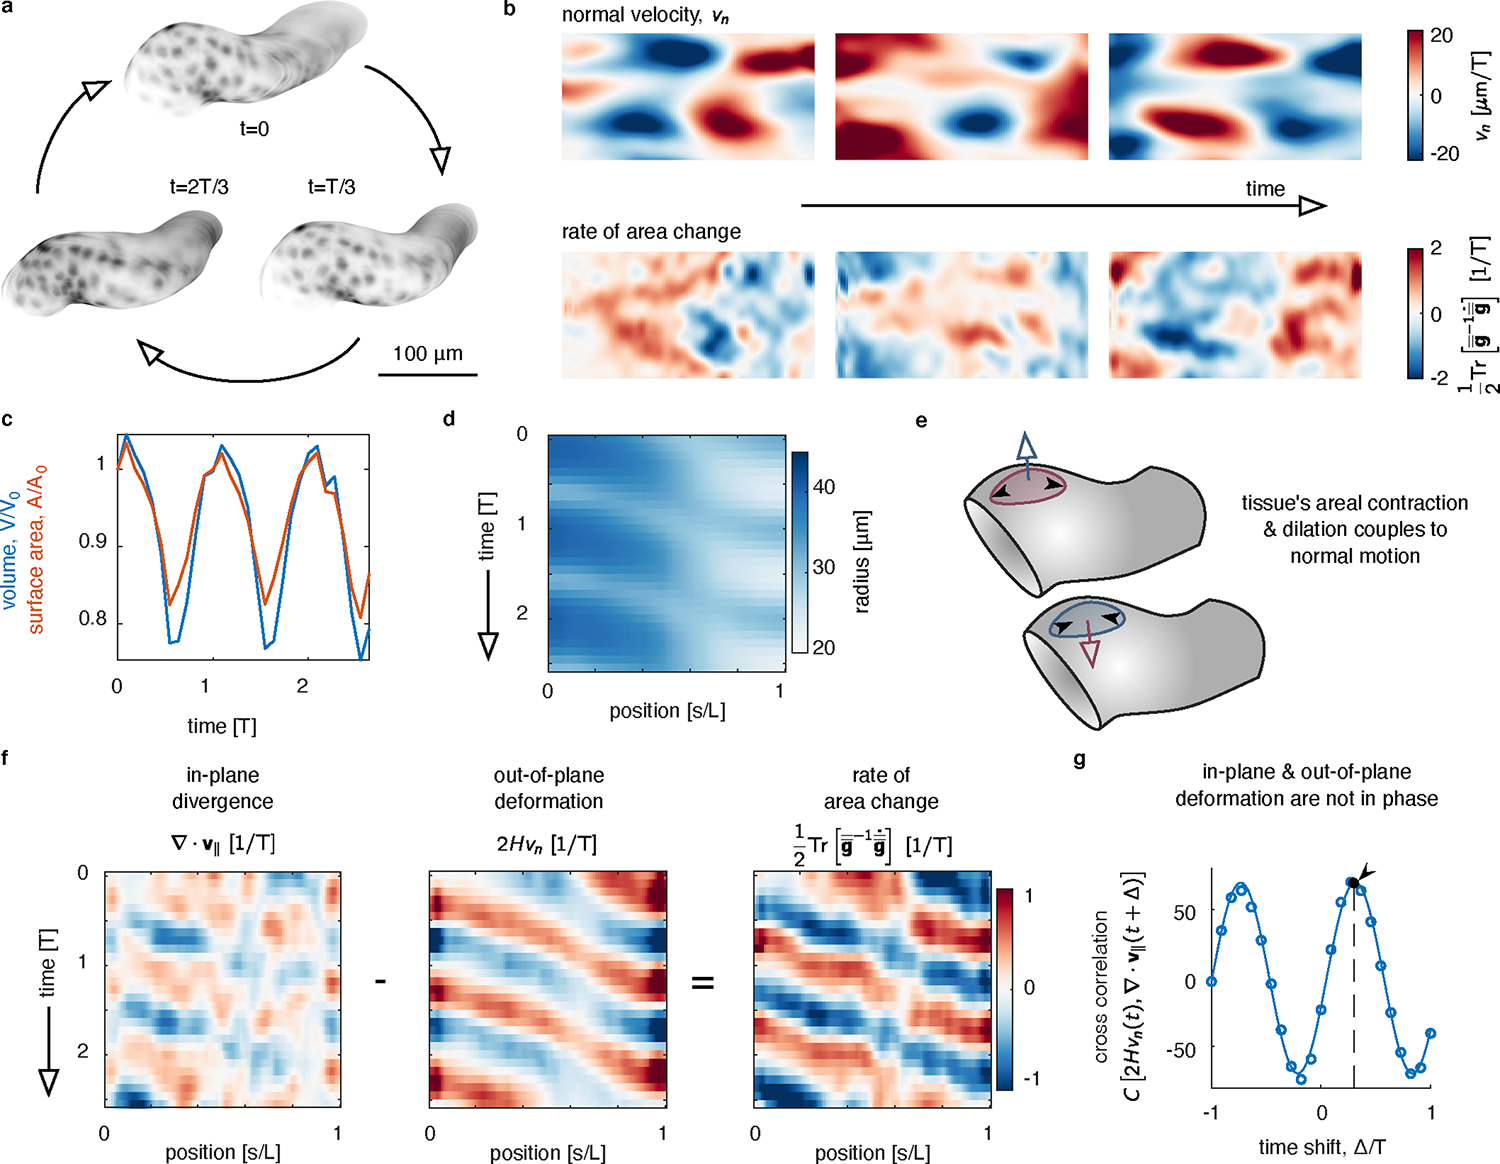
a, Segmentation of a beating zebrafish heart shows cyclic deformations in 3D, shown at three timepoints within a beat period, . b, Decomposing in-plane and out-of-plane tissue motion demonstrates how pulsed deformation travels along the long axis of the tube. The normal velocity is represented by a color specifying both its magnitude and the direction, where inward motion corresponds to . c, Both the total enclosed volume and the surface area oscillate over time. d, A kymograph of the radius of the tube measured along the long axis shows cyclic beating. We average the radius around the circumferential axis for each axial position . e, During each cycle, tissue undergoes both out-of-plane motion and in-plane deformation. These two are coupled, such that the rate of area change depends on both the normal motion and the divergence of the in-plane velocity. f, Kymographs of in-plane and out-of-plane motion averaged along the circumferential axis highlights waves of contraction. During each cycle, the in-plane and out-of-plane deformations are nearly out of phase, so that the rate of local tissue area change is large. g, Cross correlation between in-plane tissue dilatation and out-of-plane deformation (constriction of the heart tube) indicates an offset phase relationship. The curve shown is a fit to the data by an offset sinusoidal wave, with a peak fit to .
Cyclic deformations of the heart result in both in-plane velocities (Extended Data Fig. 5) and out-of-plane motion that constricts or dilates the tube (Fig. 4b). Both the surface area and the enclosed volume of the heart oscillate as it beats, shown in Fig. 4c. Fig. 4d highlights the waveform of the beat by plotting a kymograph of the radius as a function of time and position along the long axis of the tube. Given that the developing heart is reasonably symmetric along its circumference at this early stage, we average along the circumferential axis of the tube in this measurement (see Supplementary Information Section VIII).
Unlike in midgut morphogenesis, the beating heart’s in-plane velocities are not proportional to the out-of-plane deformation so as to produce incompressible motion (Fig. 4e–g). While both the in-plane divergence and out-of-plane motion display directional waves in their kymographs, the two fields are not in phase. As shown in Fig. 4g, we measure a phase offset between the two fields of , where is the period of the heartbeat. In other words, as the tube constricts, the tangential velocities are compressive and the in-plane dilation lags behind the wave of constriction. These features contrast sharply with the constrictions of the fly midgut during embryonic stages 15–16, in which a 97% correlation between the two fields results in only small (but persistent) areal growth in the lobes and areal contraction near the constrictions (Fig. 3e, Extended Data Fig. 4, and [4]). This analysis offers a route for quantitatively testing mechanical models of the beating heart.
Finally, we decomposed the complex cyclic beating of the heart into simpler constituent motions. To do so, we performed principal component analysis (PCA) on the set of 3D tissue velocities across the surface over time. This determines the motions in the material coordinates that explain the majority of the variance in the data over time. The most prominent modes are displayed in Fig. 5a–b.
FIG. 5. Decomposition of tissue motion in the beating heart reveals two principal components with nonreciprocal dynamics.
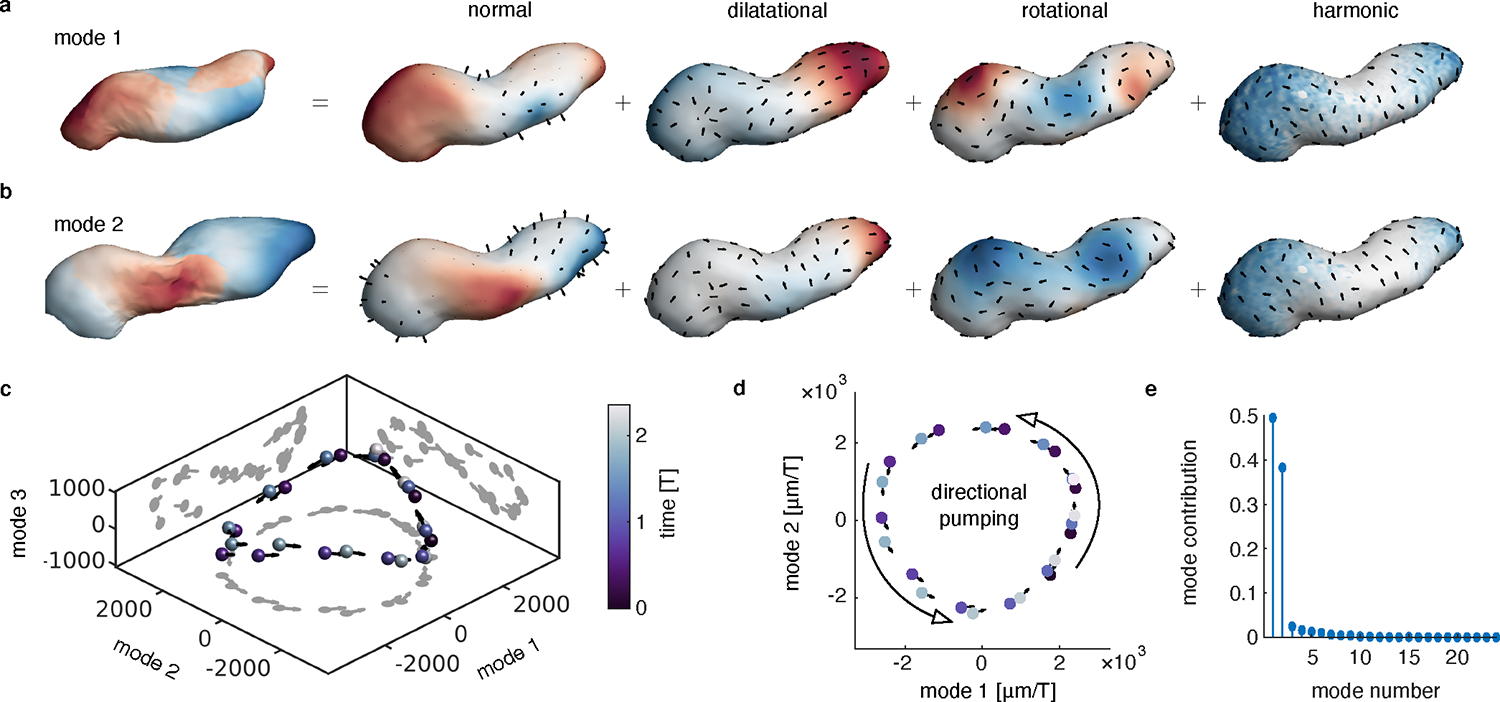
a-b, Visualization of the principal components of Lagrangian tissue velocities. The leftmost image in each panel shows the deformation induced by moving along the associated component axis, colored by the alignment of the component axis with the surface normal direction. Subsequent images illustrate each mode’s normal motion and a Helmholtz-Hodge decomposition of the tangential motion. Color in the normal part represents the norm of the normal component. Color in the dilatational, rotational, and harmonic parts are given by the scalar potential, vector potential, and norm of the harmonic motion, respectively. c, PCA on the time course of deformations returns two dominant modes of deformation. d, The two dominant modes have a phase relationship of nearly , such that the system winds in state space along a nearly planar, circular pattern. e, A comparison of the relative contribution of the first 24 modes shows the time-averaged ratio of the squared length of the projection of the velocity along each mode, normalized by the total squared length of each velocity vector in state space.
TubULAR further decomposes these modes to probe the signatures of motion. After separating the out-of-plane motion from in-plane motion along the surface, the tangential component of the velocity field decomposes into three physically distinct classes of motion: dilational, rotational, and harmonic. The dilational (or “curl-free”) velocity encodes the extent to which material patches are induced to expand or contract due to in-plane motion. The rotational (or “divergence-free”) velocity reflects swirling, vortex-like motion in which the velocity tends to circulate around a point. Finally, the harmonic component reflects surface motion that is neither contributing to in-plane expansion or contraction nor to vortex-like patterns. For tubular geometries, examples of harmonic velocities include uniform flows along or around the tube. Fig. 5a–b shows the application of this decomposition to the heart.
We find that two modes dominate the dynamics, offering insight into the kinematics driving unidirectional pumping. As shown in Fig. 5c–d, the system oscillates between the first two modes, sweeping out a roughly circular trajectory subtending a nonzero area. This phased oscillation indicates a simple description underlies unidirectional pumping of the heart. Computing the contribution of each mode to the total motion validates this 2D state representation: the first two modes capture nearly 90% of the deformation (Fig. 5e and Fig. S19).
DISCUSSION
We developed a computational framework for unravelling the complex, dynamic shapes of tube-like surfaces into their principal signatures of deformation. This framework computes Lagrangian measures of strain and strain-rate, decomposing dilatational and rotational signatures and mapping them onto the a reference material configuration. This enables ready interpretation of how cell behaviors collectively generate shape change. We provide an open-source MATLAB implementation, and we also packaged the core elements of this toolkit into the existing ImSAnE environment [26].
Our approach has important limitations. First, our implementation follows tubes with a single opening on each end. This means that the TubULAR functionality does not naturally handle tissue surfaces that dynamically branch, split, merge, or intersect. Extending to higher-order networks of tubes [58, 59] and shapes which fuse or separate [60] poses future challenges. Our method is furthermore designed for 3D datasets with sufficient resolution in space and time to track features in the pullback plane during the stabilization of the material parameterization across timepoints. While TubULAR was built to handle surfaces with exaggerated and dynamic geometries, extreme geometries may still pose inherent difficulties during analysis. Surfaces with wild variation in their radius along the centerline, for instance, may exhibit more distortion in the 2D pullback space. This distortion can make tangential velocity extraction more challenging, especially in scenarios where the data has only coarse temporal resolution. Finally, large changes of the coiling or twisting of the tissue from timepoint to timepoint require tuning parameters for capturing a topologically consistent virtual seam. Supplementary Information Section XII provides further details on TubULAR’s limitations.
Using our approach, we characterized the tissue dynamics and strains during midgut morphogenesis. We then analyzed the cyclic deformations of the beating zebrafish heart – highlighting a phased relationship between in-plane motion and out-of-plane deformation – and captured the heart’s directional pumping motion with a two-dimensional mode decomposition. An efficient method for tracing surface dynamics in the Lagrangian frame of reference offers new opportunities for understanding not only the morphogenesis of organs, but also organoids, in vitro systems, and sub-cellular structures [60–62]. As multi-scale datasets emerge, we foresee constrained parameterization methods as useful building blocks for tracking the dynamics of hierarchical processes.
METHODS
Microscopy data
The midgut dataset from [4] was generated by crossing female w;48YGAL4;klar flies (obtained from crossing Bloomington #4935 [63] with a klar line from Eric Wieschaus) with male w;UAS-mCherry.CAAX.S flies (Bloomington #59021 [64]). The klarsicht mutation in the mother reduced light scattering in the embryo, enhancing image clarity deep within the embryo at the gut surface [65].
We analyzed a zebrafish heart dataset from [40] taken on a light-sheet microscope described in [21]. The transgenic Tg(cmlc2:eGFP) zebrafish embryo expressed GFP in cardiomyocytes [57]. Reconstruction of the volumetric snapshots at multiple intervals throughout the heartbeat cycle relied on an approach which combines 2D frames acquired across multiple heartbeat cycles [40].
The synthetic dataset shown in Fig. 1e and g was created by specifying a centerline that coils with an amplitude varying as a function of both time and position along the curve. After defining a radius at each point along the centerline, we then decorated the resulting surface with artificial nuclei and membranes (Supplementary Information Section IV).
No statistical method was used to predetermine sample size. No data were excluded from the analyses. The experiments were not randomized, and the investigators were not blinded to allocation during experiments and outcome assessment.
Generating stabilized surfaces
The TubULAR workflow begins by first extracting tissue surfaces for each timepoint. We used a level sets approach for surface segmentation [66, 67], combined with marching cubes to generate a mesh of the surface [68] and Laplacian smoothing (see Supplementary Information Section V).
For the Drosophila midgut, we first captured the surface of the endoderm as a topological sphere. After an iLastik pass to identify yolk in the interior of the midgut tissue, a level sets minimization captured the apical surface of the endoderm by minimizing a Chan-Vese functional defined on the output of the iLastik training. The result from each timepoint served as an initial condition for the level sets optimization of the subsequent timepoint. With surfaces of the apical side of the endoderm in hand, we pushed each surface 2.5μm outward to vizualize and segment cells.
For the zebrafish heart dataset, we used level set methods to segment only the heart tissue, rather than the space enclosed. This resulted in a binary level set solution of toroidal topology. We then skeletonized each annular cross section along the length of the tube to produce a point cloud approximating the mid-surface of the tissue. We fed a smoothed, up-sampled version of this point cloud into the Poisson surface reconstruction algorithm included in TubULAR to produce a closed, spherelike mesh of the heart.
The next step in the TubULAR workflow is to remove two endcaps of the closed surfaces. This yields surfaces with cylindrical topology. By default, this step is performed by the user in an interactive point-and-click method using a graphical user interface supplied as a TubULAR routine. For the midgut, we instead classified regions in 3D space as endcaps using the semi-automatic iLastik option from TubULAR (Supplementary Information Section VI). TubULAR extracts the centroid of these regions and point-matches each to the mesh to identify endcap vertices. Mesh vertices within a designated distance from these points are removed from the mesh to yield a processed surface with cylindrical topology.
We note that the endcaps for the zebrafish heart were defined in a non-standard way relative to the default TubULAR workflow. First, the cylindrical point cloud extracted by thinning the segmented heart tissue was snapped onto the closed, spherical mesh. We then calculated the geodesic distance along the surface between each vertex on the mesh and the snapped locations of the “true” surface points. This distance was low for vertices along the length of the tube (since they were always close to at least one snapped point), but high for future endcap vertices. The endcap points were defined to be the two vertices on either end of the tube with the maximal geodesic distances from the snapped points. After defining endcaps, we define a virtual seam connecting one endcap to another in order to prepare for unwrapping the surface into the plane.
Our method for mapping the 3D tissue surface into the 2D plane begins with an initial map at a reference timepoint that defines the material coordinates. We then ensure that these material coordinates are consistently assigned to the time-evolving surface in accordance with the tissue flow by a applying a sequence of maps that constrain tissue motion in the pullback plane. The composite dynamic map from the evolving surface to a fixed 2D material coordinate system – which we denote is built via a sequence of four steps: (Extended Data Fig. 1 and Supplementary Information Section VII). is a conformal map of the surface to the unit square via Ricci flow (slow, but more precise) or Dirichlet energy minimization (see Supplementary Information Section VIIa). Note that the mapping to the plane is independent of the choice of virtual seam (Supplementary Information Section VIIa3). Intuitively, the surface is periodic along the circumferential direction, and so our parameterization is tiled along the axis. maps each longitudinal coordinate to proper length along the longitudinal axis ( axis) of the tube-like surface:
| (1) |
where the average is taken over the circumferential hoop defined by . This step adjusts circumferential hoops sampled at equally spaced distances (as measured by their average proper distance along the longitudinal axis) to be equally spaced in pullback space. then stabilizes motion of the tissue along the circumferential axis:
| (2) |
For the reference timepoint and defines the material coordinate frame. For other timepoints, is chosen to minimize the difference in positions of material points at the current timepoint relative to the previous (next) timepoint for . For the datasets presented here, we used the option for computing that numerically minimizes the sum of squared Euclidean distances of uniformly-sampled points along this circumferential hoop from the mapped 3D locations at a previously-solved timepoint closer to . Finally, removes any residual motion of the material in the pullback plane relative to the material coordinate frame by subtracting optical flow (obtained via particle image velocimetry [69]).
Computing tissue motions and strain
We extract tissue velocities on the surface by mapping the endpoints of 2D PIV vectors obtained in the computation of onto their respective mesh positions in 3D. Displacement vectors extend from on the surface at time to on the deformed surface at time . When and are adjacent timepoints, this defines the 3D tissue velocity at as (Fig. 1b).
Taking the dot product of the velocity vectors with the surface normal returned the signed normal velocity and the tangential velocity . We computed the divergence of the tangential velocity using our discrete exterior calculus toolkit DECLab included with TubULAR. In the language of discrete exterior calculus, the divergence of the tangential vector field is
| (3) |
where the exterior derivative and Hodge star operator are defined for each mesh surface upon instantiation of a DiscreteExteriorCalculus class instance [52]. The musical isomorphism transforms the vector field into a 1-form [52]. Validation of the discrete exterior calculus toolkit is shown in Supplementary Information Section X.
We computed integrated tissue deformations relative to a reference configuration at the onset of constrictions. To do so, we define a metric tensor , which is an object measuring distances and angles between nearby points on the surface:
| (4) |
where are the coordinates of a tissue parcel on the surface in 3D space, are the coordinates of that same parcel in the 2D material space, and and are indices [70].
The rate-of-deformation tensor is the time derivative of this metric and describes how lengths and angles change locally as the surface deforms in time:
| (5) |
where , and denote the tangential (in-plane) and normal (out-of-plane) components, respectively, of the tissue velocity, denotes the covariant derivative with respect to the tangential coordinate, and denote the components of the second fundamental form [71]. In the absence of cell proliferation, the relationship between local tissue area rate of change, in-plane divergence, and out-of-plane motion in Fig. 4 and Extended Data Fig. 4 is
| (6) |
where is the in-plane covariant divergence of the in-plane tissue velocities , is the mean curvature of the surface, and is the rate of local area change.
We integrated the rate-of-deformation tensor along pathlines to construct a Lagrangian measurement of cumulative tissue strain in Fig. 3:
| (7) |
In the language of geometric elasticity, this is equivalent to the Green-St. Venant strain tensor [72], defined relative to a reference configuration at time . We decomposed the strain tensor into a dilatational (isotropic) component
| (8) |
and the deviatoric component
| (9) |
Decomposition of motions
We decomposed the motion of the heart by separating the normal (out-of-plane) component of the velocity and performing a Helmholtz-Hodge decomposition on the tangential component. The Helmholtz-Hodge decomposition breaks up that vector field into dilational, rotational, and harmonic components using DECLab’s helmholtzHodgeDecomposition (Supplementary Information Section Xc).
We also performed principal component analysis (PCA) on the full 3D velocity field on the surface using TubULAR’s computePCAoverTime. Explicitly, we consider the full surface velocity field on the mesh triangulation at a time to be a single vector in a -dimensional space where is the number of triangle faces in the mesh and the factor of 3 accounts for the ()-components of the 3D velocity vector on each face. PCA analysis provides information about the variation of this full surface velocity field over time.
To compare the contribution of different modes, we computed the time-averaged ratio of the squared length of the projection of the velocity along each mode normalized by the total squared length of each velocity vector in state space:
| (10) |
where is full 3D surface velocity at time (treated as a vector of dimension is the unit vector PCA mode direction, and is the total number of timepoints.
Tutorials and documentation for using TubULAR are provided at https://npmitchell.github.io/tubular/ and validation of the method is provided in Supplementary Information Sections IV and X.
Extended Data
FIG. Extended Data Fig. 1. Global parameterization of tube-like surfaces with material coordinates proceeds by a sequence of mapping steps.
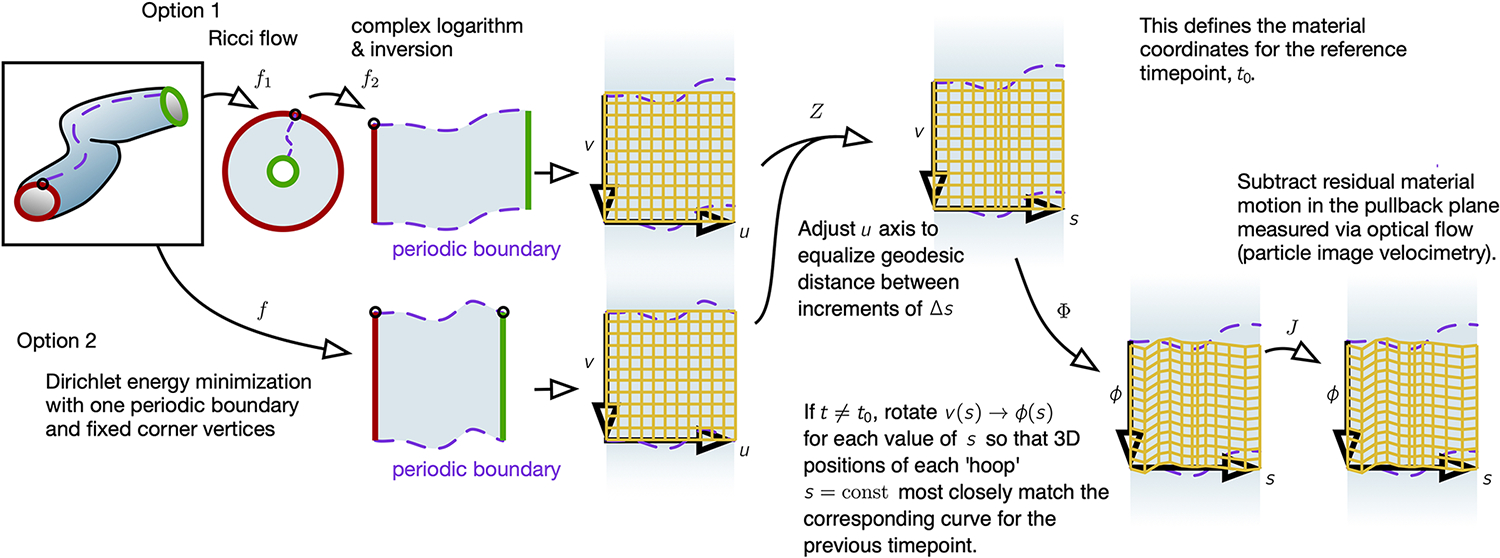
The 3D surface is first mapped via to the plane, either through Ricci flow (which is slower but results in a more exactly conformal map) or through minimization of a Dirichlet energy (faster but less precisely conformal, see Supplementary Information Section VIIa). In either case, the material is periodic in the dimension and finite in extent along the longitudinal direction . The resulting coordinate system is then adjusted. First we apply , where is a distance along the longitude of the tissue defined by Eq. (1), which we find aids in parameterization for tubes with varying radii (Supplementary Information Section VIIb). If the timepoint under question is the reference timepoint , this defines the material coordinates. Otherwise, if , we then apply , where is given by Eq. (2), and then apply to stabilize the resulting coordinates based on material motion measured through particle image velocimetry (phase correlation analysis) relative to the previous timepoint.
FIG. Extended Data Fig. 2. Overlaid pullback images spanning morphogenesis demonstrate the stability of the pullback parameterization against 3D motion of the tissue.
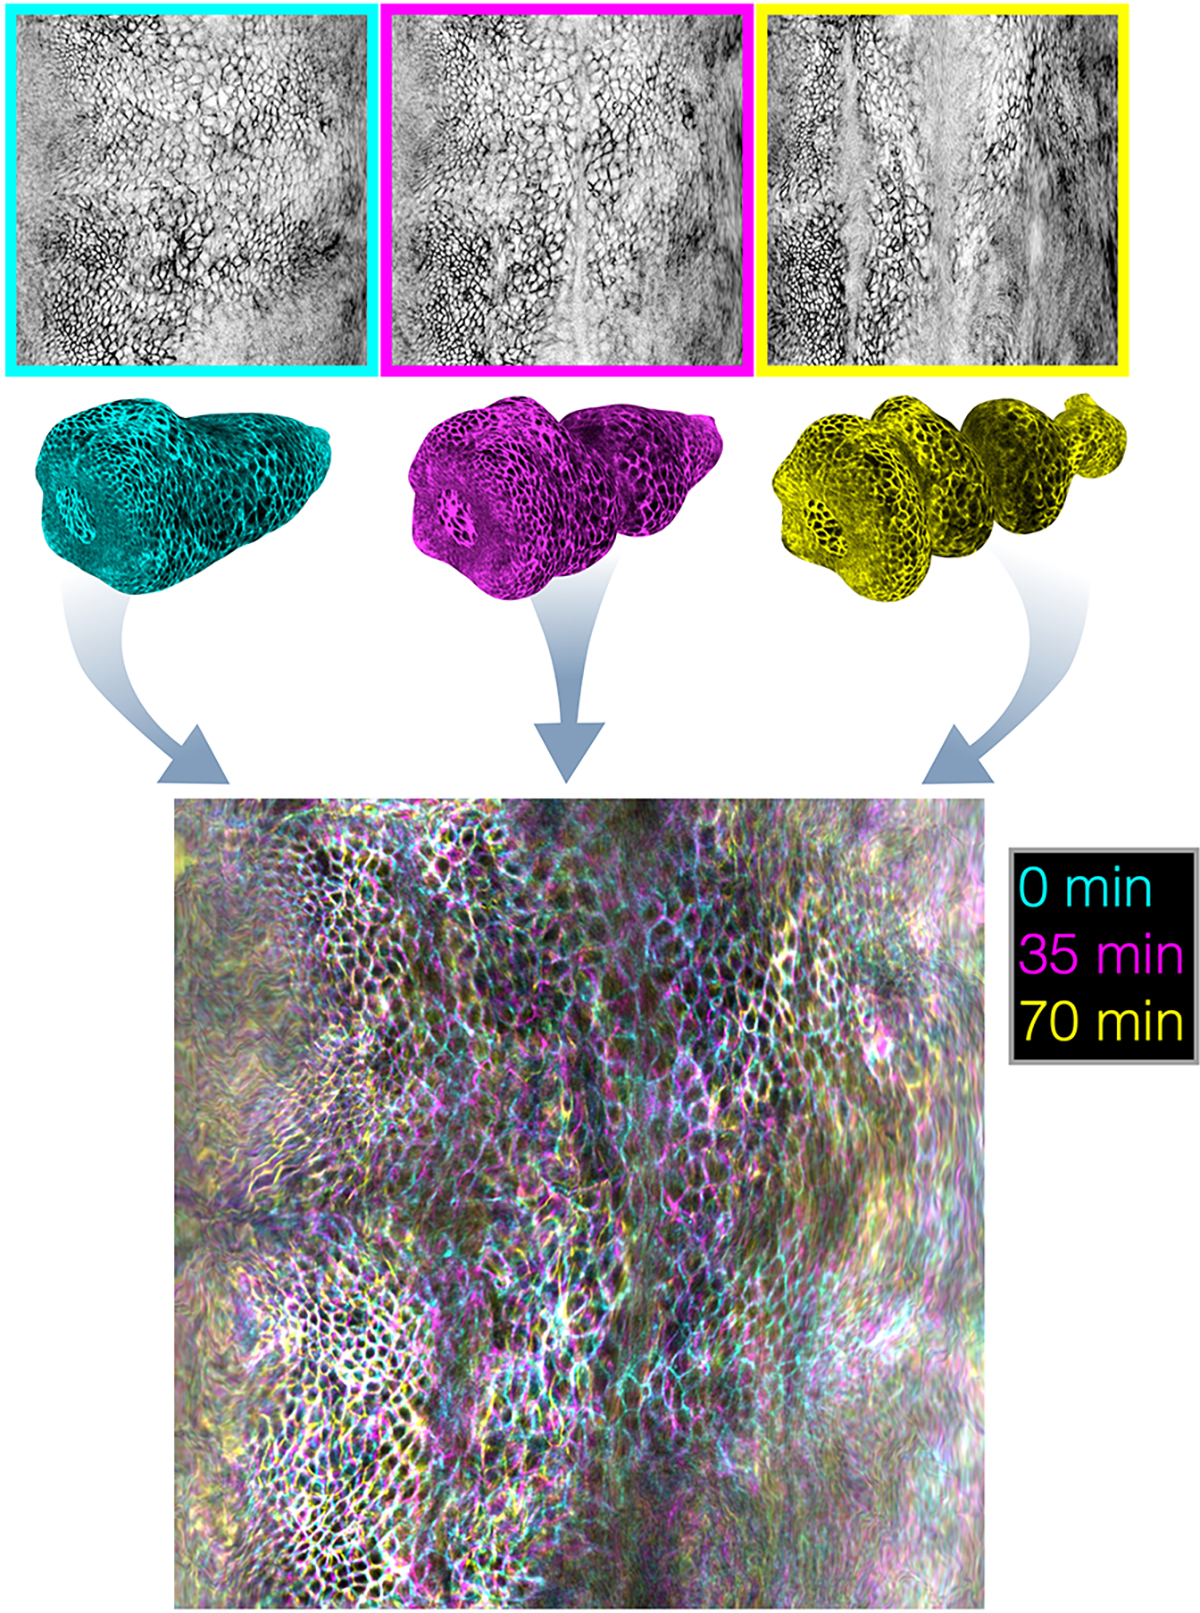
Using planar maps of the folding Drosophila midgut, we perform refined Lagrangian parameterization of the surface. The resulting timepoints at 0 minutes, 35 minutes, and 70 minutes after constriction onset are overlaid in cyan, magenta, and yellow, respectively. Much of the tissue appears as black and white, indicating that tissue placement in the pullback frame is stationary.
FIG. Extended Data Fig. 3. TubULAR aids in measuring the contribution of cell intercalations to tissue-scale convergent extension.
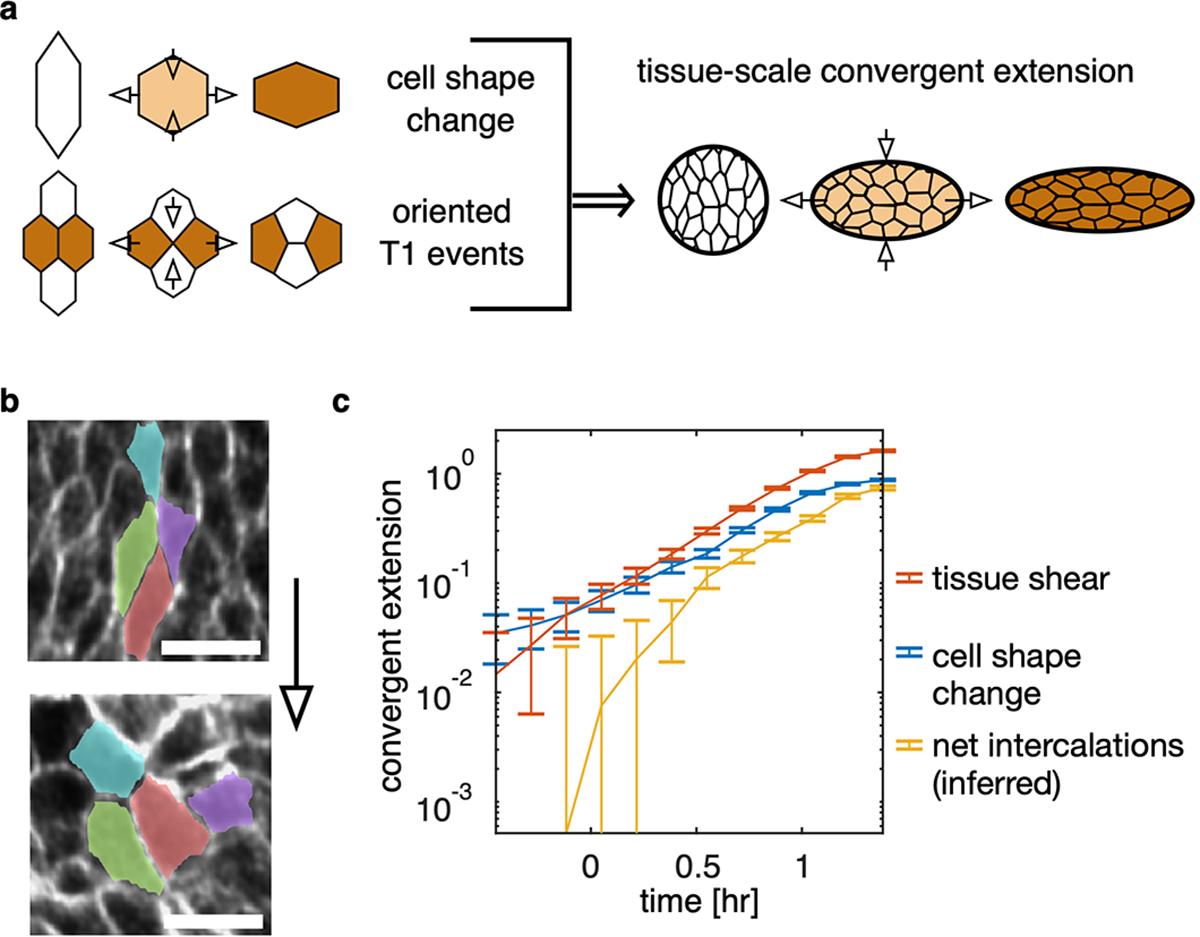
a, In the absence of cell divisions, in-plane tissue-scale convergent extension occurs due to the changing shape of cells as well as the occurrence of oriented cell intercalations (‘T1 events’). b, During constrictions in the fly midgut, no cell divisions take place, but cells change shape and also intercalate in the endodermal layer. Scale bars are 10 μm. c, We can then compare the cumulative effect of each contribution (blue and yellow) to the total tissue-scale convergent extension (orange, constricting along and extending along ). In the midgut endoderm, we directly measure tissue shear from the deviatoric component of the integrated strain computed from Lagrangian pathlines in 3D. This shear strain is almost entirely oriented along the longitudinal axis . In order to compare directly this quantity to the cell shape change, we imprint the segmentation of 1260 cells at on the tissue surface, follow the outlines of these cells along 3D tissue pathlines obtained from full stabilization with small Gaussian smoothing applied to the optical flow stabilization to avoid self-intersections in pathlines, and compute the cell shape anisotropy in the tangent plane of the tissue for each cell. Here, and are the semimajor and semiminor axes of the ellipse capturing each cell’s moment of inertia tensor, and is the cell’s angle with respect to the material frame’s longitudinal axis. We excluded advected polygons that acquire partial self-intersections from advection, so that we excluded 3, 5, and 8 out of a total 1260 advected cell shapes at the latest timepoints 63, 73, and 83 minutes after constriction onset, respectively. We compared these advected segmentation shapes with the true segmentation. After passing pullback images through a skeletonization procedure detailed in ref. [4], we manually selected , and 964 cells for accuracy with broad organ coverage at each timepoint. Blue and yellow curves represent the net contribution of cell shape change and the net contribution of intercalations averaged across the organ, and the red curve represents the mean tissue shape change. Error bars denote standard error on the mean. Further technical details are found in TubULAR’s generateCellSegmentationPathlines3D method.
FIG. Extended Data Fig. 4. TubULAR measures the kinematic coupling between in-plane and out-of-plane motion, computing the rate of local area change across the organ, shown here for the developing midgut.
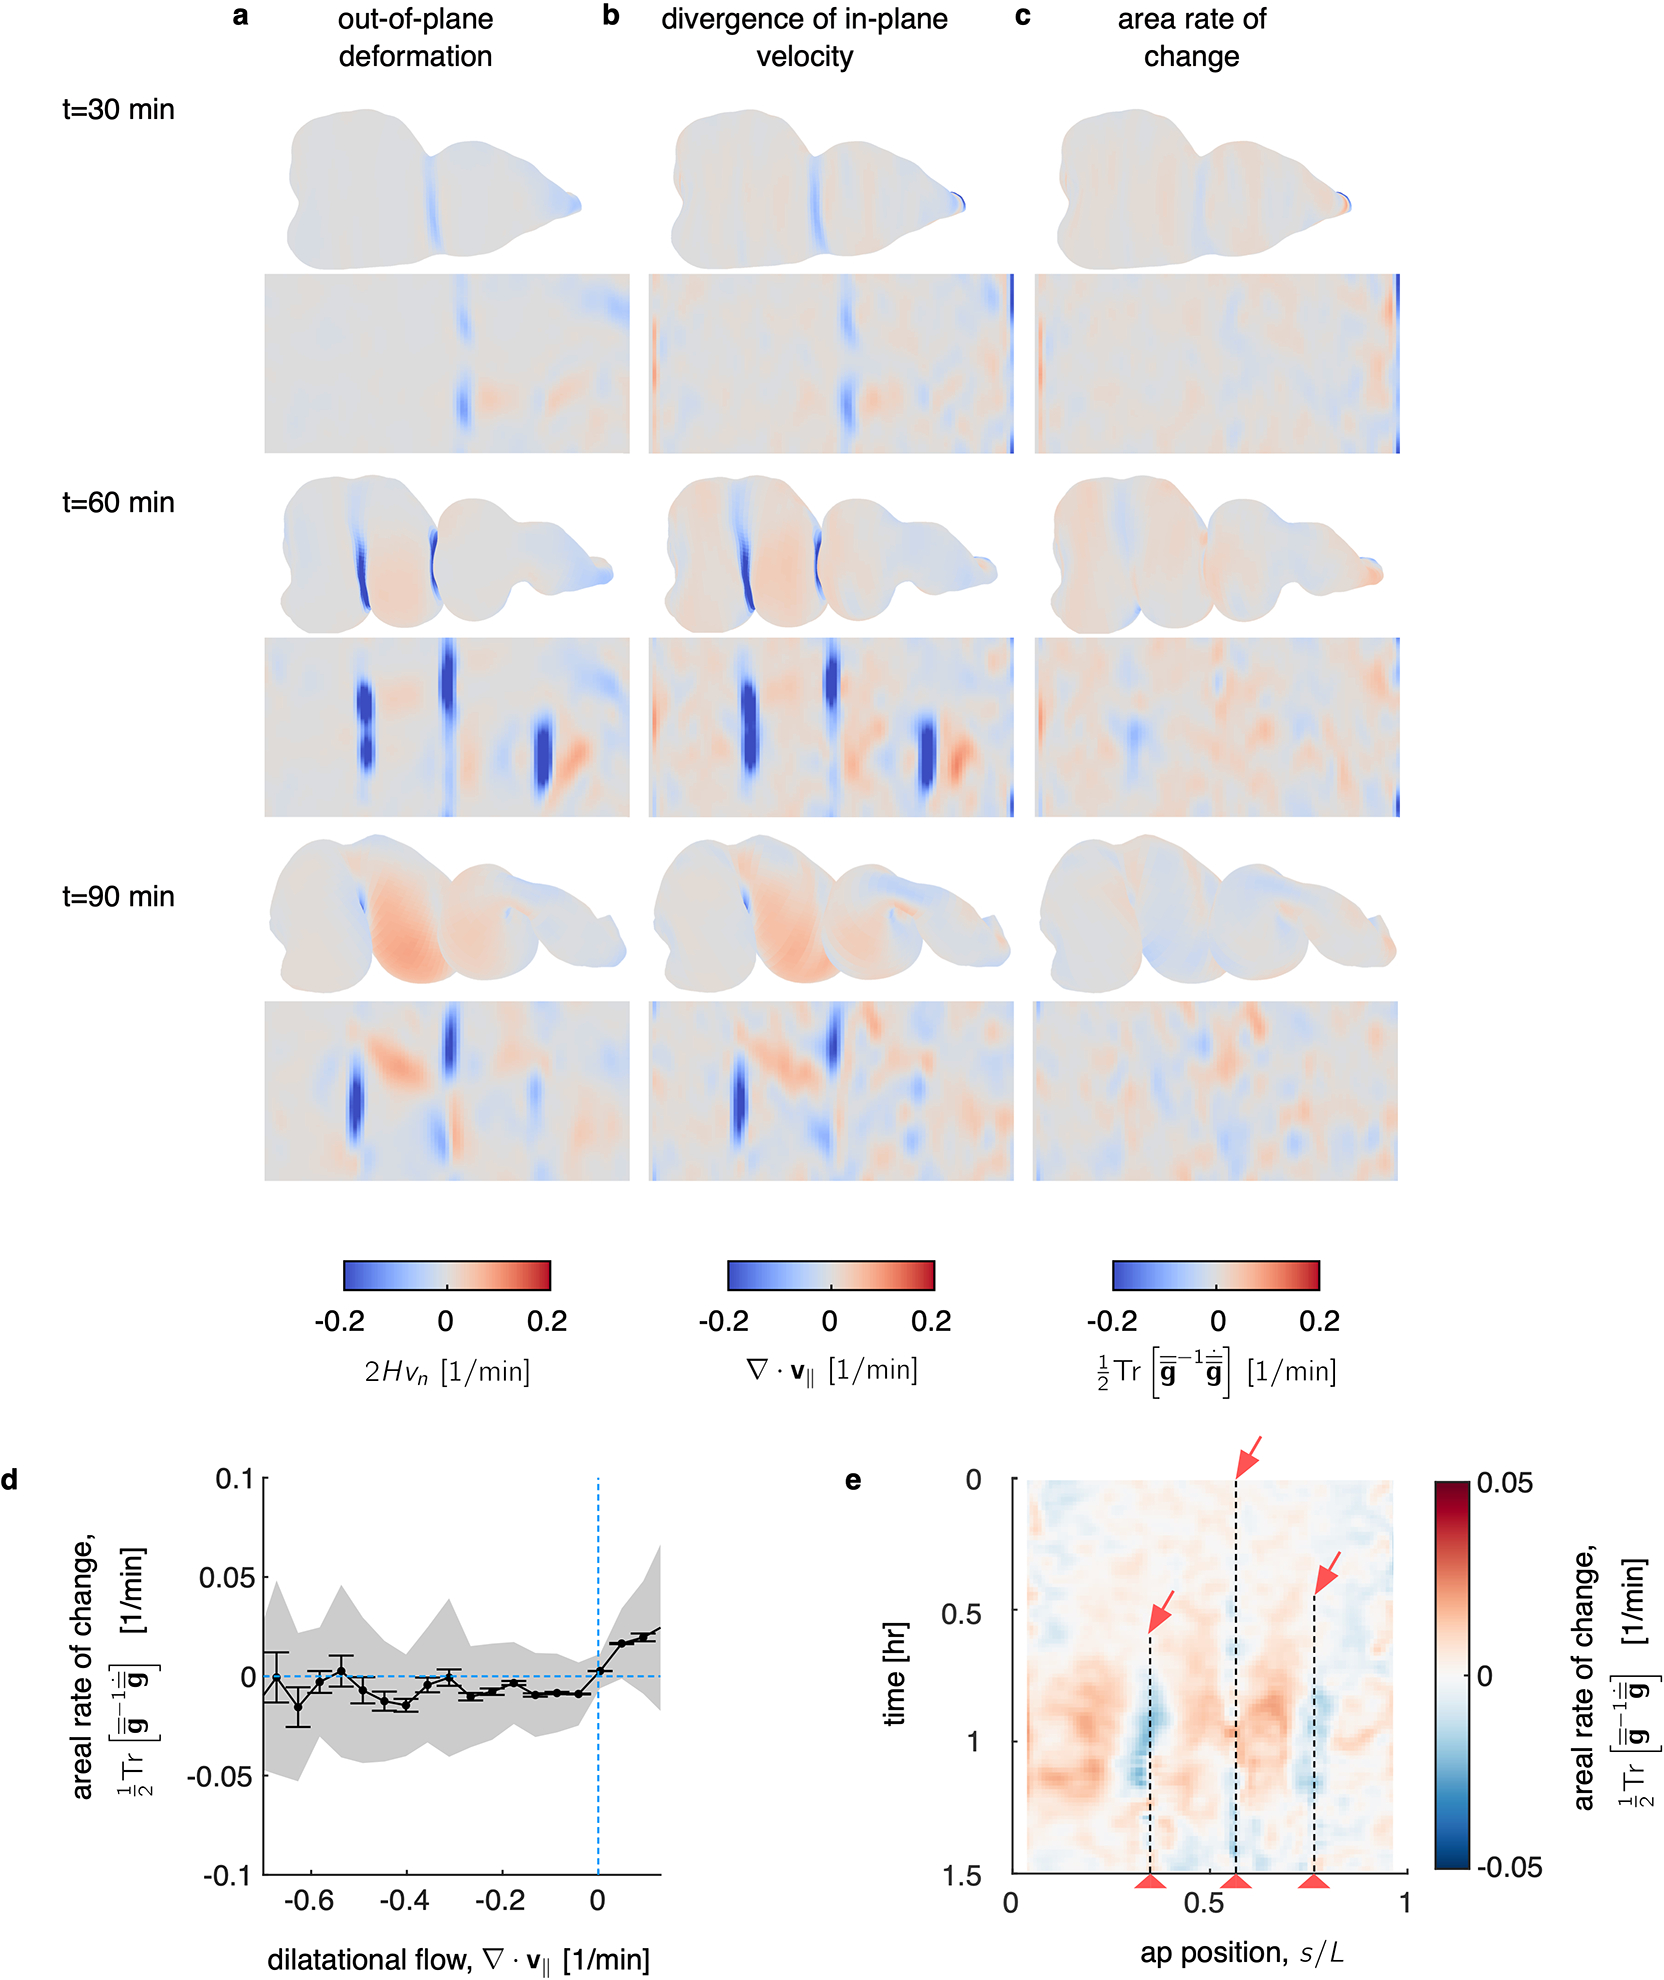
a, The underlying out-of-plane deformation, defined as the normal motion times twice the mean curvature , shows negative values at each constriction, where the mean curvature becomes negative. b, DEC computation of the divergence of the in-plane velocity shows patterns of sinks in the constrictions and sources in the chambers’ lobes, in synchrony with the out-of-plane deformation. c, As a result of the match between in-plane and out-of-plane dynamics, the areal growth rate – defined as – remains relatively quiescent. Here is the metric (first fundamental form) of the tissue surface. d, Regions of tissue which experience positive divergence (the lobes of each gut chamber) tend to experience modest areal growth, while regions with negative tissue divergence experience slight areal compression. This is the relatively quiescent signature of the tissue’s compressibility. Here, data is averaged across three biological repeats, with shaded band denoting standard deviation and tick marks denoting standard error on the mean. e, An example kymograph from a single embryo’s developing midgut showing the small but persistent areal strain rate. The tissue expands in the lobes of each chamber (red in the kymograph) and contracts near each constriction (dashed lines and red arrows). The kymograph is aligned such that each vertical line follows a ring of tissue as it deforms in 3D. In other words, measurements are made in the Lagrangian frame of reference. The anterior-posterior position (horizontal axis) is parameterized in the material frame at the onset of the first constriction.
FIG. Extended Data Fig. 5. TubULAR reveals the tangential deformations of a beating embryonic zebrafish heart.
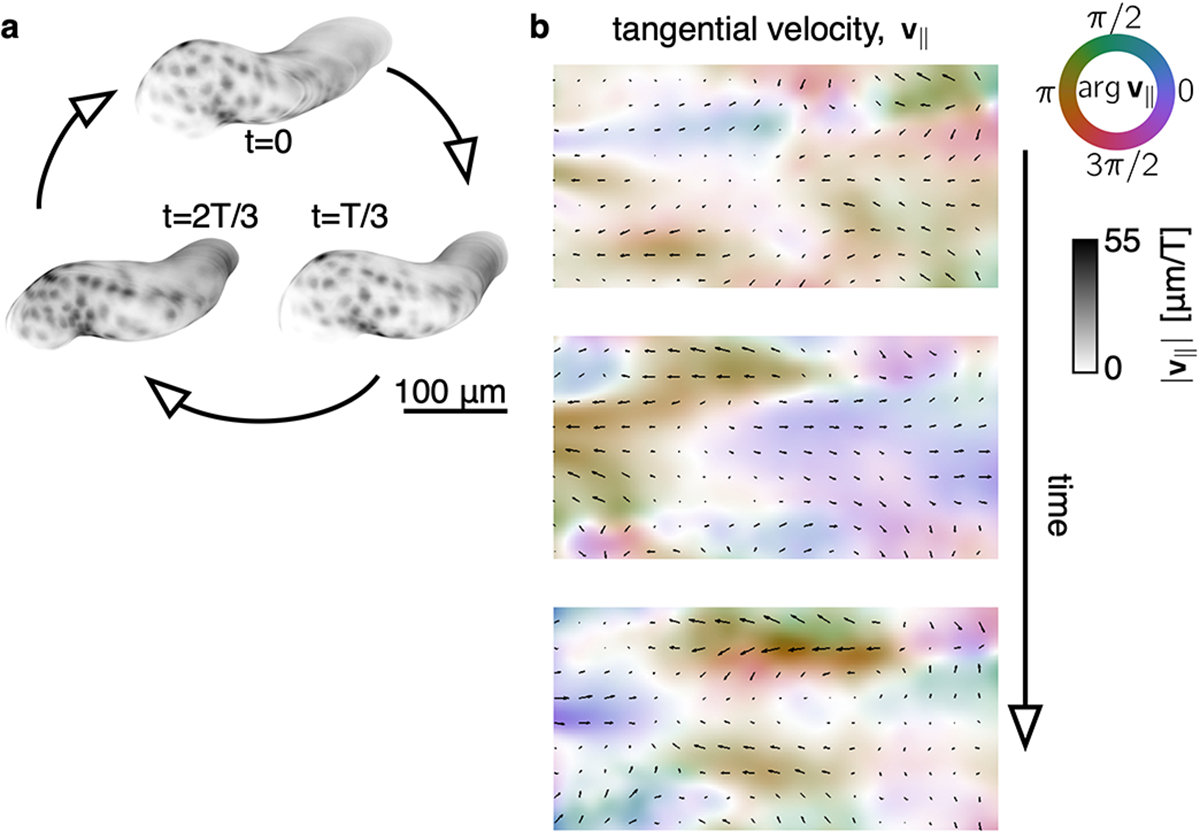
a, A rendering of cardiomyocyte fluorescence via TexturePatch shows cyclic deformations with a beat period, . See also Fig. 4a. b, TubULAR maps the tangential component of the 3D velocity field onto the pullback plane. Color denotes the tangential velocity direction along the long axis (purple or orange) or along the circumferential axis (green or red). The opacity of the rendered image reflects the magnitude of the tangential velocity, as do the length of overlaid black arrows.
Supplementary Material
ACKNOWLEDGEMENTS
Sebastian Streichan provided insights, mentorship, expertise, and the laboratory and computational resources to develop and execute this work, with primary support for this work from NSF Grant No. PHY-2047140. Boris Shraiman provided additional insights and mentorship. We thank Sebastian Streichan and Michael Liebling for the light sheet dataset of the beating zebrafish heart and A. Tayar for the dataset of the deforming DNA droplet in a microtubule gel (Supplementary Information Section I). We also thank Suraj Shankar and Fritdjof Brauns for useful discussions. Research reported in this publication was supported by NIH NICHD Award Number K99HD110675. NPM acknowledges support from the Helen Hay Whitney Foundation. DJC acknowledges support from the NSF Grant No. PHY-1707973. The work was also supported in part by the National Science Foundation Grant No. NSF PHY-1748958 and PHY-2309135 to the Kavli Institute for Theoretical Physics.
Footnotes
COMPETING INTERESTS
The authors declare no competing financial interests.
Reporting summary
Further information on research design in available in the Nature Portfolio Reporting Summary linked to this article.
Code availability
Software used in this study is available at https://github.com/npmitchell/tubular, with full documentation and tutorials at https://npmitchell.github.io/tubular/. Integration with ImSAnE is provided at https://github.com/npmitchell/imsane.
Data availability
Data generated in this work are available at https://doi.org/10.6084/m9.figshare.c.6178351.
REFERENCES
- [1].Diaz-De-La-Loza M-D-C, Ray RP, Ganguly PS, Alt S, Davis JR, Hoppe A, Tapon N, Salbreux G, and Thompson BJ, Developmental Cell 46, 23–39.e5 (2018). [DOI] [PMC free article] [PubMed] [Google Scholar]
- [2].Bakkers J, Verhoeven MC, and Abdelilah-Seyfried S, Developmental Biology 330, 213 (2009). [DOI] [PubMed] [Google Scholar]
- [3].Iruela-Arispe ML and Beitel GJ, Development 140, 2851–2855 (2013). [DOI] [PMC free article] [PubMed] [Google Scholar]
- [4].Mitchell NP, Cislo DJ, Shankar S, Lin Y, Shraiman BI, and Streichan SJ, eLife 11, e77355 (2022). [DOI] [PMC free article] [PubMed] [Google Scholar]
- [5].Shyer AE, Tallinen T, Nerurkar NL, Wei Z, Gil ES, Kaplan DL, Tabin CJ, and Mahadevan L, Science 342, 212 (2013). [DOI] [PMC free article] [PubMed] [Google Scholar]
- [6].Beitel GJ and Krasnow MA, Development 127, 3271 (2000). [DOI] [PubMed] [Google Scholar]
- [7].Goodwin K, Mao S, Guyomar T, Miller E, Radisky DC, Košmrlj A, and Nelson CM, Development 146, dev181172 (2019). [DOI] [PMC free article] [PubMed] [Google Scholar]
- [8].Gómez HF, Dumond MS, Hodel L, Vetter R, and Iber D, eLife 10, e68135 (2021). [DOI] [PMC free article] [PubMed] [Google Scholar]
- [9].Klein Y, Efrati E, and Sharon E, Science 315, 1116 (2007). [DOI] [PubMed] [Google Scholar]
- [10].van Rees WM, Vouga E, and Mahadevan L, Proceedings of the National Academy of Sciences 114, 11597 (2017). [DOI] [PMC free article] [PubMed] [Google Scholar]
- [11].Maroudas-Sacks Y, Garion L, Shani-Zerbib L, Livshits A, Braun E, and Keren K, Nature Physics 17, 251 (2021). [Google Scholar]
- [12].Stokkermans A, Chakrabarti A, Subramanian K, Wang L, Yin S, Moghe P, Steenbergen P, Mönke G, Hiiragi T, Prevedel R, Mahadevan L, and Ikmi A, Current Biology 32, 4707 (2022). [DOI] [PubMed] [Google Scholar]
- [13].Saadaoui M, Rocancourt D, Roussel J, Corson F, and Gros J, Science 367, 453 (2020). [DOI] [PubMed] [Google Scholar]
- [14].Lefebvre MF, Claussen NH, Mitchell NP, Gustafson HJ, and Streichan SJ, eLife 12, e78787 (2023). [DOI] [PMC free article] [PubMed] [Google Scholar]
- [15].Mietke A, Jülicher F, and Sbalzarini IF, Proceedings of the National Academy of Sciences 116, 29 (2019). [DOI] [PMC free article] [PubMed] [Google Scholar]
- [16].Forouhar AS, Liebling M, Hickerson A, Nasiraei-Moghaddam A, Tsai H-J, Hove JR, Fraser SE, Dickinson ME, and Gharib M, Science 312, 751 (2006). [DOI] [PubMed] [Google Scholar]
- [17].Savin T, Kurpios NA, Shyer AE, Florescu P, Liang H, Mahadevan L, and Tabin CJ, Nature 476, 57 (2011). [DOI] [PMC free article] [PubMed] [Google Scholar]
- [18].Barbier de Reuille P, Routier-Kierzkowska A-L, Kierzkowski D, Bassel GW, Schüpbach T, Tauriello G, Bajpai N, Strauss S, Weber A, Kiss A, Burian A, Hofhuis H, Sapala A, Lipowczan M, Heimlicher MB, Robinson S, Bayer EM, Basler K, Koumoutsakos P, Roeder AH, Aegerter-Wilmsen T, Nakayama N, Tsiantis M, Hay A, Kwiatkowska D, Xenarios I, Kuhlemeier C, and Smith RS, eLife 4, e05864 (2015). [DOI] [PMC free article] [PubMed] [Google Scholar]
- [19].Etournay R, Popović M, Merkel M, Nandi A, Blasse C, Aigouy B, Brandl H, Myers G, Salbreux G, Jölicher F, and Eaton S, eLife 4, e07090 (2015). [DOI] [PMC free article] [PubMed] [Google Scholar]
- [20].Le Garrec JF, Domínguez JN, Desgrange A, Ivanovitch KD, Raphaël E, Bangham JA, Torres M, Coen E, Mohun TJ, and Meilhac SM, Elife 6, e28951 (2017). [DOI] [PMC free article] [PubMed] [Google Scholar]
- [21].Streichan SJ, Lefebvre MF, Noll N, Wieschaus EF, and Shraiman BI, eLife 7, e27454 (2018). [DOI] [PMC free article] [PubMed] [Google Scholar]
- [22].Wolff C, Tinevez J-Y, Pietzsch T, Stamataki E, Harich B, Guignard L, Preibisch S, Shorte S, Keller PJ, Tomancak P, and Pavlopoulos A, eLife 7, e34410 (2018). [DOI] [PMC free article] [PubMed] [Google Scholar]
- [23].Kierzkowski D, Runions A, Vuolo F, Strauss S, Lymbouridou R, Routier-Kierzkowska A-L, Wilson-Sánchez D, Jenke H, Galinha C, Mosca G, and et al. , Cell 177, 1405–1418.e17 (2019). [DOI] [PMC free article] [PubMed] [Google Scholar]
- [24].Dalmasso G, Musy M, Niksic M, Robert-Moreno A, Badía-Careaga C, Sanz-Ezquerro JJ, and Sharpe J, Developmental Cell 57, 2140 (2022). [DOI] [PMC free article] [PubMed] [Google Scholar]
- [25].Schmid B, Shah G, Scherf N, Weber M, Thierbach K, Campos CP, Roeder I, Aanstad P, and Huisken J, Nature Communications 4, 2207 (2013). [DOI] [PMC free article] [PubMed] [Google Scholar]
- [26].Heemskerk I and Streichan SJ, Nature Methods 12, 1139 (2015). [DOI] [PMC free article] [PubMed] [Google Scholar]
- [27].Herbert S, Valon L, Mancini L, Dray N, Caldarelli P, Gros J, Esposito E, Shorte SL, Bally-Cuif L, Aulner N, Levayer R, and Tinevez J-Y, BMC Biology 19, 136 (2021). [DOI] [PMC free article] [PubMed] [Google Scholar]
- [28].Mitchell NP, Lefebvre MF, Jain-Sharma V, Claussen N, Raich MK, Gustafson HJ, Bausch AR, and Streichan SJ, bioRxiv (2022), 10.1101/2022.05.26.493584. [DOI] [Google Scholar]
- [29].Chen D-Y, Lipari K, Dehghan Y, Streichan S, and Bilder D, Cell Reports 15, 1125 (2016). [DOI] [PMC free article] [PubMed] [Google Scholar]
- [30].Zhou Z, Alégot H, and Irvine KD, Current Biology 29, 856 (2019). [DOI] [PMC free article] [PubMed] [Google Scholar]
- [31].Gallagher KD, Mani M, and Carthew RW, eLife 11, e72806 (2022). [DOI] [PMC free article] [PubMed] [Google Scholar]
- [32].Madhu R, Rodriguez D, Guzik C, Singh S, De Tomaso AW, Valentine MT, and Loerke D, Molecular Biology of the Cell 31, 1714 (2020). [DOI] [PMC free article] [PubMed] [Google Scholar]
- [33].Candeo A, Sana I, Ferrari E, Maiuri L, D’Andrea C, Valentini G, and Bassi A, Journal of Biomedical Optics 21, 56001 (2016). [DOI] [PubMed] [Google Scholar]
- [34].Immerglück K, Lawrence PA, and Bienz M, Cell 62, 261 (1990). [DOI] [PubMed] [Google Scholar]
- [35].Bienz M and Tremml G, Nature 333, 576 (1988). [DOI] [PubMed] [Google Scholar]
- [36].Reuter R and Scott MP, Development 109, 289 (1990). [DOI] [PubMed] [Google Scholar]
- [37].Bakkers J, Cardiovasc Res 91, 279 (2011). [DOI] [PMC free article] [PubMed] [Google Scholar]
- [38].Bhat S, Ohn J, and Liebling M, IEEE Transactions on Image Processing 21, 3638 (2012). [DOI] [PubMed] [Google Scholar]
- [39].Stainier D, Lee R, and Fishman M, Development 119, 31 (1993). [DOI] [PubMed] [Google Scholar]
- [40].Chan KG, Streichan SJ, Trinh LA, and Liebling M, IEEE Transactions on Computational Imaging 2, 348 (2016). [Google Scholar]
- [41].Pawley J, Handbook of biological confocal microscopy, Vol. 236 (Springer Science & Business Media, 2006). [Google Scholar]
- [42].Keller PJ, Schmidt AD, Wittbrodt J, and Stelzer EH, Science 322, 1065 (2008). [DOI] [PubMed] [Google Scholar]
- [43].Krzic U, Gunther S, Saunders TE, Streichan SJ, and Hufnagel L, Nature Methods 9, 730 (2012). [DOI] [PubMed] [Google Scholar]
- [44].Chen B-C, Legant WR, Wang K, Shao L, Milkie DE, Davidson MW, Janetopoulos C, Wu XS, Hammer JA, Liu Z, English BP, Mimori-Kiyosue Y, Romero DP, Ritter AT, Lippincott-Schwartz J, Fritz-Laylin L, Mullins RD, Mitchell DM, Bembenek JN, Reymann A-C, Böhme R, Grill SW, Wang JT, Seydoux G, Tulu US, Kiehart DP, and Betzig E, Science 346, 1257998 (2014). [DOI] [PMC free article] [PubMed] [Google Scholar]
- [45].Campos-Ortega J and Hartenstein V, The Embryonic Development of Drosophila melanogaster (Springer; Berlin Heidelberg, 1997). [Google Scholar]
- [46].Klapper R, Stute C, Schomaker O, Strasser T, Janning W, Renkawitz-Pohl R, and Holz A, Mechanisms of Development 110, 85 (2002). [DOI] [PubMed] [Google Scholar]
- [47].Wolfstetter G, Shirinian M, Stute C, Grabbe C, Hummel T, Baumgartner S, Palmer RH, and Holz A, Mechanisms of Development 126, 721 (2009). [DOI] [PubMed] [Google Scholar]
- [48].Chan TF and Vese LA, IEEE Transactions on Image Processing 10, 266 (2001). [DOI] [PubMed] [Google Scholar]
- [49].Berg S, Kutra D, Kroeger T, Straehle CN, Kausler BX, Haubold C, Schiegg M, Ales J, Beier T, Rudy M, Eren K, Cervantes JI, Xu B, Beutten-mueller F, Wolny A, Zhang C, Koethe U, Hamprecht FA, and Kreshuk A, Nature Methods 16, 1226 (2019). [DOI] [PubMed] [Google Scholar]
- [50].Landau LD and Lifshitz EM, Fluid Mechanics, Second Edition: Volume 6 (Course of Theoretical Physics), 2nd ed., Course of theoretical physics / by Landau LD and Lifshitz EM, Vol. 6 (Butterworth-Heinemann, 1987). [Google Scholar]
- [51].Blanchard GB, Kabla AJ, Schultz NL, Butler LC, Sanson B, Gorfinkiel N, Mahadevan L, and Adams RJ, Nature Methods 6, 458–464 (2009). [DOI] [PMC free article] [PubMed] [Google Scholar]
- [52].Crane K, de Goes F, Desbrun M, and Schröder P, in ACM SIGGRAPH 2013 courses, SIGGRAPH ‘13 (ACM, New York, NY, USA, 2013). [Google Scholar]
- [53].Desbrun M, Hirani AN, Leok M, and Marsden JE, arXiv (2005), arXiv:0508341. [Google Scholar]
- [54].Romeo N, Hastewell A, Mietke A, and Dunkel J, eLife 10, e68679 (2021). [DOI] [PMC free article] [PubMed] [Google Scholar]
- [55].Lévy B and Zhang HR, in ACM SIGGRAPH 2010 Courses, SIGGRAPH ‘10 (Association for Computing Machinery, New York, NY, USA, 2010). [Google Scholar]
- [56].Jolliffe I, Principal component analysis (Springer Verlag, New York, 2002). [Google Scholar]
- [57].Huang C-J, Tu C-T, Hsiao C-D, Hsieh F-J, and Tsai H-J, Developmental Dynamics 228, 30–40 (2003). [DOI] [PubMed] [Google Scholar]
- [58].Metzger RJ, Klein OD, Martin GR, and Krasnow MA, Nature 453, 745 (2008). [DOI] [PMC free article] [PubMed] [Google Scholar]
- [59].Goodwin K and Nelson CM, Development 147, dev184499 (2020). [DOI] [PubMed] [Google Scholar]
- [60].Karzbrun E, Khankhel AH, Megale HC, Glasauer SMK, Wyle Y, Britton G, Warmflash A, Kosik KS, Siggia ED, Shraiman BI, and Streichan SJ, Nature 599, 268 (2021). [DOI] [PMC free article] [PubMed] [Google Scholar]
- [61].Tayar AM, Caballero F, Anderberg T, Saleh OA, Cristina Marchetti M, and Dogic Z, Nature Materials (2023). [DOI] [PubMed] [Google Scholar]
- [62].Lemma B, Mitchell NP, Subramanian R, Needleman DJ, and Dogic Z, Phys. Rev. X 12, 031006 (2022). [DOI] [PMC free article] [PubMed] [Google Scholar]
- [63].Martin-Bermudo MD, The EMBO Journal 16, 4184–4193 (1997). [DOI] [PMC free article] [PubMed] [Google Scholar]
- [64].Sens KL, Zhang S, Jin P, Duan R, Zhang G, Luo F, Parachini L, and Chen EH, Journal of Cell Biology 191, 1013–1027 (2010). [DOI] [PMC free article] [PubMed] [Google Scholar]
- [65].Welte MA, Gross SP, Postner M, Block SM, and Wieschaus EF, Cell 92, 547–557 (1998). [DOI] [PubMed] [Google Scholar]
- [66].Osher SJ and Fedkiw R, Level set methods and dynamic implicit surfaces., Applied mathematical sciences, Vol. 153 (Springer, 2003). [Google Scholar]
- [67].Marquez-Neila P, Baumela L, and Alvarez L, IEEE Transactions on Pattern Analysis and Machine Intelligence 36, 2 (2014). [DOI] [PubMed] [Google Scholar]
- [68].Lorensen WE and Cline HE, in Proceedings of the 14th annual conference on Computer graphics and interactive techniques - SIGGRAPH ‘87, Vol. 21 (ACM Press, New York, New York, USA, 1987) pp. 163–169. [Google Scholar]
- [69].Thielicke W and Sonntag R, Journal of Open Research Software (2021), 10.5334/jors.334. [DOI] [Google Scholar]
- [70].Struik DJ, Lectures on classical differential geometry (Courier Corporation, 1961). [Google Scholar]
- [71].Arroyo M and Desimone A, Physical Review E 79, 031915 (2009). [DOI] [PubMed] [Google Scholar]
- [72].Efrati E, Sharon E, and Kupferman R, Journal of the Mechanics and Physics of Solids 57, 762 (2009). [Google Scholar]
Associated Data
This section collects any data citations, data availability statements, or supplementary materials included in this article.
Supplementary Materials
Data Availability Statement
Data generated in this work are available at https://doi.org/10.6084/m9.figshare.c.6178351.


