Abstract
This study attempted to better understand the properties associated with the metabolic brain network in mild cognitive impairment (MCI) and Alzheimer’s disease (AD). Graph theory was employed to investigate the topological organization of metabolic brain network among 86 patients with MCI, 89 patients with AD, and 97 normal controls (NCs) using 18F fluoro-deoxy-glucose positron emission tomography (FDG-PET) data. The whole brain was divided into 82 areas by Brodmann atlas to construct networks. We found that MCI and AD showed a loss of small-world properties and topological aberrations, and MCI showed an intermediate measurement between NC and AD. The networks of MCI and AD were vulnerable to attacks resulting from the altered topological pattern. Furthermore, individual contributions were correlated with Mini-Mental State Examination and Clinical Dementia Rating. The present study indicated that the topological patterns of the metabolic networks were aberrant in patients with MCI and AD, which may be particularly helpful in uncovering the pathophysiology underlying the cognitive dysfunction in MCI and AD.
Keywords: AD, MCI, Metabolic brain network, Network robustness, Leave-one-out, FDG-PET
Introduction
Alzheimer’s disease (AD) is generally characterized with symptoms such as cognitive dysfunction, neurodegenerative disease, or even abnormal neuronal systems. 1 Mild cognitive impairment (MCI) characterized by memory impairment is a kind of clinical syndrome, considered as the transition stage from normal aging to dementia. 2,3
Within the past decades, magnetic resonance imaging (MRI) and diffusion tensor imaging (DTI) have been widely utilized, as these modern brain mapping techniques were useful in the early diagnosis and monitoring of progress made in MCI and AD. Functional MRI (fMRI) could be employed to describe hemodynamic response related to neural activity. 4,5 Liu et al 6 suggested that the nodal centrality was altered in medial temporal lobe (MTL) and occipital lobe during resting state fMRI scan, implying a rewiring in the brain network of MCI. A structural MRI study of MCI and AD explored the brain networks by measuring the gray matter volume, reporting altered correlations in the MTL and the abnormal hub regions in the frontal lobe. 7 Furthermore, the default mode network (DMN) deficits in amnestic MCI, such as a functional disruption in the alpha band and structural disconnection, were reported in a bimodal study that combined magnetoencephalography (MEG) with DTI. 8 In a DTI/FDG-PET study, patients with MCI and AD showed a reduced fractional anisotropy and white matter integrity within the limbic system, potentially causing MTL atrophy and posterior cingulate cortex hypometabolism. 9
Fluoro-deoxy-glucose positron emission tomography (FDG-PET) could measure the metabolic patterns of the brain by examining the values of cerebral glucose metabolism. 10,11 A longitudinal research suggested that 18F-FDG-PET was a valuable diagnostic tool for the prediction of clinical outcome in individual patients with MCI. 12 Using PET imaging, Caminiti et al investigated the alterations in connectivity indexes, brain modularity, and hubs configuration in 42 patients having dementia with Lewy bodies. 13 Toussaint et al combined the voxel-based analysis and independent component analysis to extract the characteristic metabolism patterns for discriminating stable MCI and converting MCI from AD with support vector machine classifier. 14 Recently, Zippo et al pointed out a new topological feature (compression flow) with random centrality-driven walks method to estimate the functional integration ability in the brain network among normal controls (NCs), patients with MCI, and patients with AD. 15 Furthermore, the disturbance in glucose metabolism might predict future cognitive decline. 16 The graph–theoretical analysis was introduced to analyze the brain networks, and it could provide a mathematical and conceptual framework to construct a whole network for exploring the topological patterns of brain networks. 17 Watts and Strogatz 18 had proposed that neural networks could be known as “small-world” networks with densely local connectivity between neighboring regions and sparsely long-range connectivity among distant regions. A previous study on the functional networks in MCI and AD indicated that functional integration in whole-brain network gradually declined with increasing severity of the illness. 19 Although most of the previous studies suggested disease-related alterations in topological patterns of AD/MCI, the findings were substantially inconsistent with different modalities (fMRI, 20 MEG, 21 and EEG 22 ). The large sample sizes and parametric investigation derived from PET imaging were essential to examine the MCI- and AD-related abnormalities in metabolic brain network at different scales. However, the characteristics of the metabolic brain networks of MCI and AD have not been explored extensively. 19,23
In this study, we hypothesized that the metabolic networks of MCI and AD were characterized by abnormality in topological properties based on FDG-PET data. Metabolic networks were established by the average metabolism level of brain regions for MCI, AD, and NCs. We attempted to investigate the topological pattern, network robustness, and individual contribution using the network-based algorithm in MCI and AD. These findings in the metabolic network may provide critical insight into the brain pathophysiological mechanism in patients with MCI and AD.
Materials and Methods
Ethics Statement
Before the imaging collection, patients in Alzheimer’s Disease Neuroimaging Initiative (ADNI) provided written informed consent, which was approved by the institutional review boards at 59 performance sites. All the PET acquisition sites and principal investigator (PI) names can be found at http://adni.loni.usc.edu/about/centers-cores/study-sites/. The ADNI Data and Publications Committee approved the study for sharing and analyzing the PET data anonymously.
Patients
In this study, 272 right-handed patients undergoing FDG-PET scans were selected from the ADNI database (Supplementary Text 1), including 97 NC individuals, 86 patients with MCI, and 89 patients with AD. Clinical Dementia Rating (CDR) and Mini-Mental State Examination (MMSE) scores were used to evaluate dementia severity and cognitive function of all the patients. 24,25 The 97 NCs aged 62 to 87 (mean = 75.77; SD = 6.28; male/female, 42/55), 86 patients with MCIs aged 57 to 90 (mean = 76.67; SD = 7.45; male/female, 36/50), and 89 patients with ADs aged 56 to 90 (mean = 75.52; SD = 7.36; male/female, 33/56). All the neuropsychological scores were significantly different among the 3 groups (Table 1). A statistically significant difference between the groups was not found in age and gender. Additional information about the inclusion/exclusion criteria is described on http://www.adni-info.org/Scientists/doc/grant.pdf.
Table 1.
Group Differences in Demographics and Neuropsychological Tests.a
| NC, n = 97 | MCI, n = 86 | AD, n = 89 | P Value | |
|---|---|---|---|---|
| Age, mean (SD) | 75.77 (6.28) | 76.67 (7.45) | 75.52 (7.36) | .606 |
| Gender (male/female) | 42/55 | 36/50 | 33/56 | .173 |
| MMSE,b means (SD) | 28.97 (1.24) | 27.08 (1.70) | 20.69 (3.70) | <.001 |
| CDRb score (%) | <.001 | |||
| 0 | 100 | 0 | 0 | |
| 0.5 | 0 | 100 | 25.8 | |
| 1 | 0 | 0 | 50.6 | |
| 2 | 0 | 0 | 23.6 | |
Abbreviation: AD, Alzheimer’s disease; CDR, Clinical Dementia Rating Scale; MCI, mild cognitive impairment; MMSE, Mini-Mental State Examination; NC, normal control; SD, standard deviation.
aAge, Gender, MMSE, and CDR differences among the 3 groups were analyzed by analysis of variance (ANOVA) with Bonferroni-corrected post hoc t tests.
bStatistically significant difference in each pair of groups at P < .001.
Construction of the Metabolic Network
After FDG-PET data acquisition and processing (Supplementary Text 2), the correlation matrices were computed. In this study, Brodmann atlas (Supplementary Text 3) was applied to subdivide the cortex into 82 regions (ROI-based), which had been widely used as a reference for functional parcellation in brain imaging studies. 26 The metabolic correlations were statistical correlation coefficients between the average metabolic levels of discrete brain regions. Three steps were adopted to estimate the correlation matrices. First, we used the linear regression model to remove the effects of age, gender, and the average value of whole-brain metabolic level for each patient. Second, a correlation matrix R with dimensions 82 × 82 was generated, where every individual entry Rij was computed by the Pearson correlation coefficient between region i and j. 7 Finally, the correlation matrices were obtained with diagonal elements equivalent to 1 and the number of total probable correlations were 82 × (82 − 1)/2 for each group. The binary matrices P were applied to simplify the metabolic networks and reduce the computing scale for graph theory analysis.
Graph Theoretical Approaches
Graph theory is a reliable and an attractive model for analyzing the parameters of networks. 27 In the gained networks, the nodes and edges corresponded to the Brodmann areas and the undirected connections of each pair in Brodmann areas, respectively. The topology of each group network would differ significantly from each other under the thresholding of the same correlations value. In order to resolve this issue, sparsity (S) was used to threshold the correlations matrices of the networks into binarized matrices P, where an entry Pij equals 1 if |Rij | exceeded sparsity and 0 otherwise. 7 Sparsity was defined as the number of existing edges, K, divided by the maximum possible number of edges in a graph. 5 Definitive way for choosing a single optimal threshold value is yet absent. 28 Thus, a range of S values was utilized to threshold each correlations matrix repeatedly (18% ≤ S ≤ 40%). 28 This range of S values could provide a fully connected undirected graph, which provided a reasonable estimation of the properties of networks. In the current situations, a fixed sparsity (S = 18%) could guarantee that all regions were included in the networks, while minimizing the quantity of false-positive connections, thereby using it to threshold the metabolic networks of each group. 29
Small-World Properties Analysis
Small worldness is a ubiquitous property of complex brain networks. 30 The clustering coefficient (Cp ) and the characteristic path length (Lp ) of a network are used as the indices to describe the small world properties (Supplementary Text 4).
Criteria for the small-world characteristics aree as follows:
| 1 |
| 2 |
indicates the Cp and the Lp of the matched random networks, 7 respectively, and the number of nodes, edges, and degrees distribution of these random networks were in line with the real network. 18
Nodal Centrality
The “betweenness centrality” was defined as a local characteristic for exploring the outstanding nodes in the metabolic networks (Supplementary Text 4). A node, which had a high betweenness might bridge different parts of the network. 31 A node with 2-fold higher than the average betweenness of the network would be defined as a hub region in our study. The betweenness value of each node was computed at a fixed sparsity 18% to ensure that the metabolic brain network was fully connected without fragmentation in each group. The hub nodes played a crucial role in facilitating information communication and processing among the human brain networks. 32 The arithmetic description of these characteristics is provided in the supporting information.
Network Robustness Analysis
Network robustness referring to the network stability and plasticity in the case of losing nodes or edges was a crucial parameter of a complex network. 33 In the metabolic brain networks, the network robustness could be evaluated by removing the nodes or edges in random and targeted patterns at the sparsity of 18%.
In the “random pattern analysis,” the basic design principle was removing nodes in the random order. The same operation was performed on the edges in the network. In the “targeted pattern analysis,” we first computed the betweenness value of each node and edge in the metabolic brain network for the 3 groups, respectively. Next, the nodes were deleted in decreasing sequence of their betweenness value. The same operation was performed on the edges. The size of the remainder component was a critical measurement of the ability to resist crashes. 34
Estimation of Individual Contribution by Leave-One-Out Approach
Previous graph–theoretical studies have uncovered abnormalities in structural and functional brain network on the group level or individual level. Using the leave-one-out (LOO) approach, we adequately considered the effects of both individual contribution and group-level properties. The individual contribution was estimated by removing 1 individual and reshaping the group-level brain network. Then, we combined the information regarding the individual cognitive impairment with the group-level brain parameters. The individual contribution was considered as a proxy of individual contributions from homologous group, 35 thereby providing preliminary evidence for the diversity of clinical symptoms (excessive jealousy, delusions of infidelity, and emotional distress) of patients with MCI and AD. 36 The correlation between clinical scores and individual contributions was introduced to identify the accuracy of the individual contribution in tracking the progression of the cognitive impairment or dementia in MCI and AD. We assumed that patients with higher differences have worse network organization patterns, which were specifically related to impairments in fundamental circuits for information integration. 35 Here, the participant Rx was removed to measure his or her individual contribution to the overall organization of the network. The Mantel’s test statistic (Supplementary Text 5) was used to evaluate the similarity between the original and specific elements-removed metabolic brain networks. 37 To estimate the individual contribution Rx to global metabolism correlation matrix P, we used the Saggar estimation formula: 35
| 3 |
In order to investigated the relationships between LooRx and clinical assessments, we calculated the Pearson correlation coefficients between LooRx and MMSE scores (as a measure of mental status) as well as between LooRx and CDR scores (as a measure of dementia severity), respectively.
Statistical Analysis
In our test, we would rearrange the PET data from 3 groups and then we get a reference distribution about the possible values of the test statistic. 7 To estimate the between-group significant differences in age, gender, MMSE, and CDR, analysis of variance with post hoc test was used in this study. First, we would compute the Cps and Lps in each real metabolic network over a wide range of network sparsity thresholds. For testing the significant between-group difference, we randomly intermix 1 group data with the 2 other groups separately. Second, we would divide the data into 2 groups in line with the numbers of the original groups. We took the same sparsity threshold to obtain the correlation coefficient matrices so as to compute the Cps and Lps. Then, we did the repetitive experiment for 1000 times. At last, we sorted the 1000 results and found the between-group differences in real networks. If between-group differences were included in 95% (2-tailed) of the supposed between-group differences, we would accept the null hypothesis of the same probability between the 2 groups at the 5% level. If not, we rejected the null hypothesis. 38
Results
Correlation Matrices of the Metabolic Networks
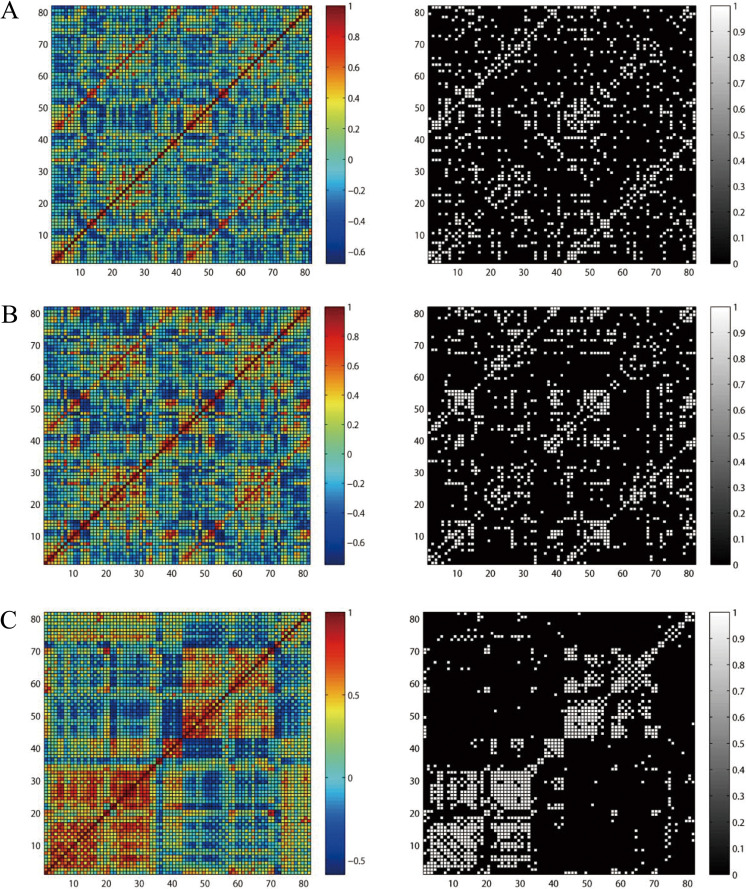
The correlation coefficients of the metabolic networks were computed to obtain the correlation matrices (82 × 82) for NC, MCI, and AD groups. Although the correlation matrices of each group exhibited unique pattern, they had strong voxel-mirrored homotopic correlations and intrahemisphere correlations in common (Figure 1).
Figure 1.
Metabolism-based connectivity matrices for normal control (NC), mild cognitive impairment (MCI), and Alzheimer’s disease (AD). The color bar showed the strength of the correlations. Pearson correlation matrices in NC (A), MCI (B), and AD (C). Left: weighted correlation matrices, Right: binary matrices. The binary matrices were obtained by sparsity threshold (18%).
Small-World Properties of Metabolic Networks
Over a wide range of sparsity values, the Cp and Lp were calculated, which were the precondition to evaluate the balance of integration and interconnectivity. The expected results are shown in Figure 2, 3 networks were with γ > 1, λ ≈ 1, and δ > 1 (δ = γ/λ) through a wide range of sparsity (18% ≤ S ≤ 40%), which implied the presence of small-world properties. These findings were consistent with previous studies that revealed human brain with an efficient organizational structure. 29
Figure 2.
Small-world properties of the metabolic brain networks. The images indicate the changes in and σ = γ/λ in normal control (NC), mild cognitive impairment (MCI), and Alzheimer’s disease (AD) groups (sparsity ranging 18%-40%).
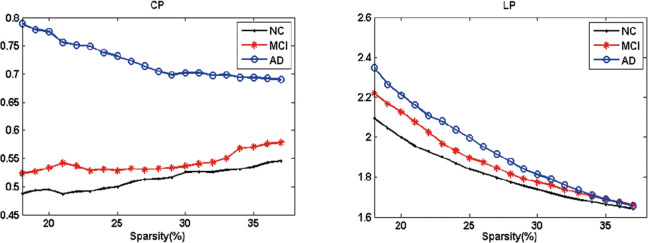
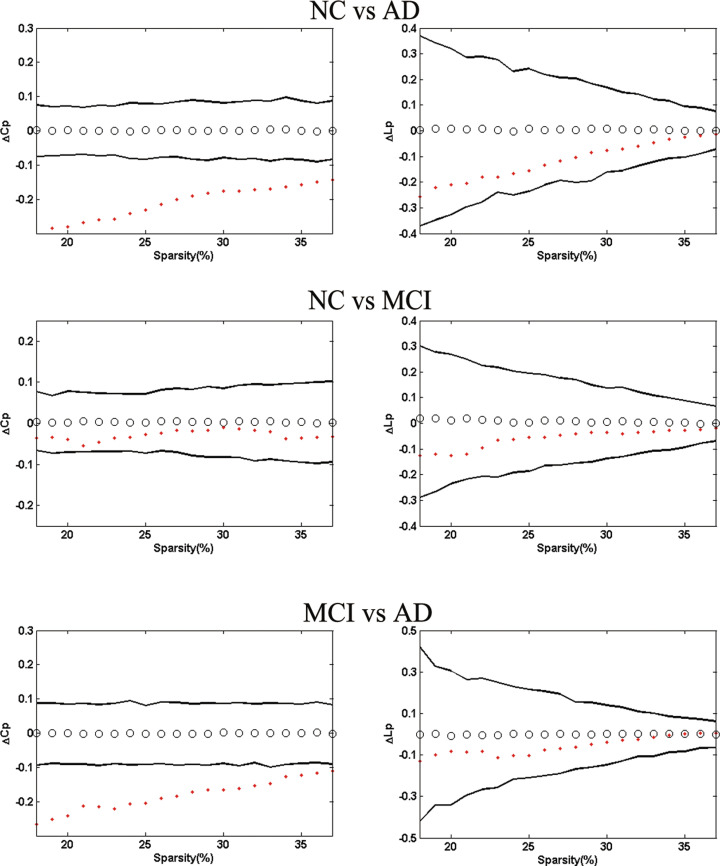
Moreover, AD presented the highest Cp and the longest Lp (Figure 3). The permutation test was introduced to explore the between-group differences in these attributes. With respect to Lp , the 3 groups showed no significant differences between each other, but AD had significantly higher C p than MCI and NC for the entire sparsity (Figure 4).
Figure 3.
Mean clustering coefficients (Cp ) and mean absolute path lengths (Lp ) in normal control (NC), mild cognitive impairment (MCI), and Alzheimer’s disease (AD). The blue circles represented the NC, red stars for MCI, and black dots for AD.
Figure 4.
The left panel shows the between-group differences in clustering coefficients (▵Cp ) and the right panel absolute path lengths (▵Lp ). Top images display delta variables as ▵Cp = C pNC-C pAD and ▵Lp = L pNC-LpAD. Middle images display delta variables as ▵Cp = C pNC-C pMCI and ▵Lp = L pNC-LpMCI. Bottom images display delta variables as ▵Cp = C pMCI-C pAD and ▵Lp = L pMCI-LpAD. The black hollow circles show the average values, and the black lines represent 95% confidence intervals of the between-group differences through 1000 permutation tests per sparsity.
Differences in Nodal Centrality and Hub Regions of the Metabolic Networks
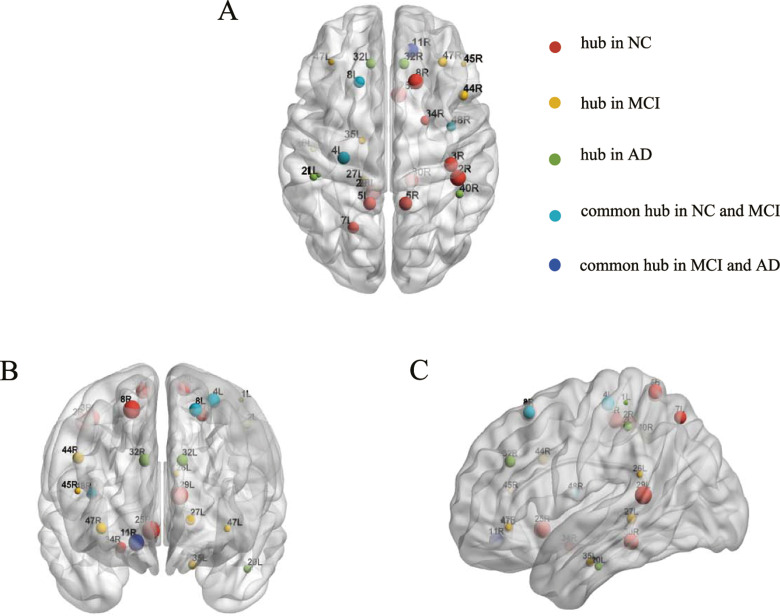
The 1000 nonparametric permutation tests were used to explore the between-group differences in the nodal centrality of the metabolic brain networks. Figure 5 displayed the significant differences in nodal centrality among the 3 groups. Between-group comparisons revealed that AD group had significantly lower nodal centrality in the left BA7 (lateral precuneus cortex), BA8 (superior frontal gyrus), right BA25 (anterior cingulate), and BA48 (medial surface of the temporal lobe), whereas AD had higher nodal centrality in the left BA20 (inferior temporal gyrus), right BA11 (orbitofrontal area), and BA40 (Wernicke’s area) compared to NC. In comparison to the NCs, the nodal centrality of the patients with MCI decreased mainly in the brain areas of left BA7, right BA8, and BA25 and increased primarily in the brain areas of the left BA26 (ectosplenial area) and the right BA45 (Broca’s area) and BA47 (inferior prefrontal gyrus). A reduced nodal centrality in right BA48 was observed in AD with respect to the MCI group. Contrastingly, some regions in AD showed increased values, such as the left BA20 and right BA40 (Figure 6). The hub regions in the NC group were primarily located in somatosensory association cortex and cingulate cortex and in the MCI group were majorly distributed around the Broca’s area and parahippocampal gyrus. As for AD group, the hub regions were found approximately in Wernicke’s area and cingulate cortex (Table 2; Figure 6).
Figure 5.
Hub region’s distribution in normal control (NC), mild cognitive impairment (MCI), and Alzheimer’s disease (AD). (A) Axial, (B) coronal, and (C) sagittal. Hub regions in NC (red), MCI (yellow), and AD (green). Cyan indicated common hub in NC and MCI. Blue indicated common hub in MCI and AD. Sphere size was decided by the region’s betweenness values. L indicates left; R, right.
Figure 6.
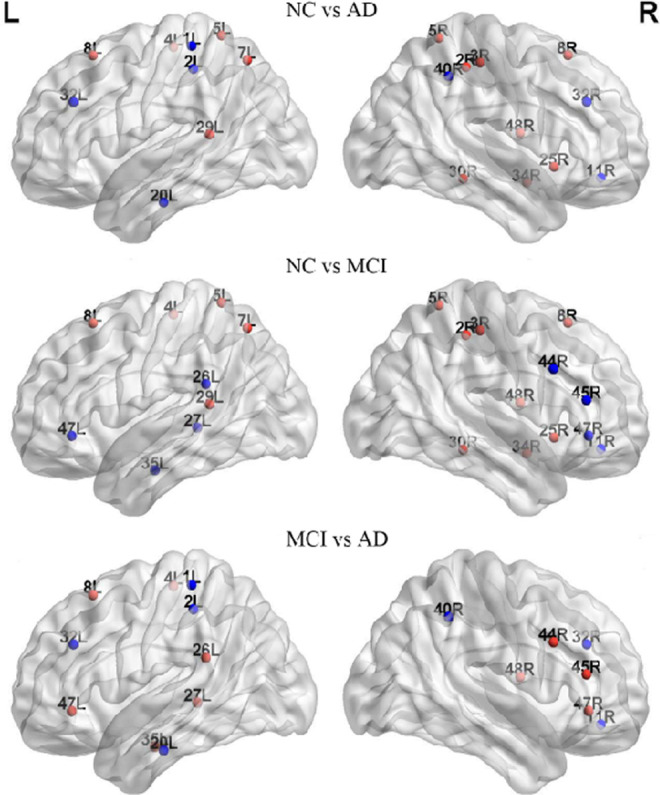
Brain regions showed abnormal nodal centrality in whole brain networks. All the regions belong to the hub regions, which are at least in 1 network of the 3 groups, and these hub regions indicated the significant between-group differences (P < .05). Regions showing decreased (blue) and increased (red) nodal centrality in former compared to the latter group. L indicates left; R, right.
Table 2.
Hub Regions in Metabolic Networks for NC, MCI, and AD Groups.a
| Hemisphere | Brodmann Areas | Brain Regions | Normalized Betweenness | ||
|---|---|---|---|---|---|
| NC | MCI | AD | |||
| Left | Area 8 | Frontal eye fields | 3.352 | 2.297 | 0.706 |
| Area 7 | Somatosensory association cortex | 2.596 | 0.246 | 0.554 | |
| Area 5 | Somatosensory association cortex | 2.526 | 0.600 | 0.249 | |
| Area 4 | Primary motor cortex | 2.436 | 2.237 | 0.395 | |
| Area 29 | Retrosplenial cingulate cortex | 2.370 | 1.143 | 0.608 | |
| Area 32 | Dorsal anterior cingulate cortex | 1.001 | 0.591 | 5.362 | |
| Area 47 | Inferior prefrontal gyrus | 0.446 | 3.693 | 0.044 | |
| Area 26 | Ectosplenial area | 0.410 | 2.550 | 0.535 | |
| Area 35 | Perirhinal cortex | 0.358 | 2.193 | 0.100 | |
| Area 27 | Piriform cortex | 0.326 | 2.976 | 0.362 | |
| Area 20 | Inferior temporal gyrus | 0.249 | 0.325 | 5.702 | |
| Areas 3, 1, and 2 | Primary somatosensory cortex | 0.172 | 0.276 | 4.565 | |
| Right | Area 48 | Retrosubicular area | 3.615 | 2.583 | 0.134 |
| Area 25 | Subgenual cortex | 3.233 | 1.227 | 0.623 | |
| Area 30 | Part of cingulate cortex | 3.082 | 1.358 | 0.407 | |
| Areas 3, 1, and 2 | Primary somatosensory cortex | 2.696 | 0.221 | 0.920 | |
| Area 5 | Somatosensory association cortex | 2.684 | 0.775 | 0.104 | |
| Area 34 | Anterior entorhinal cortex | 2.469 | 0.488 | 0.181 | |
| Area 8 | Includes frontal eye fields | 2.448 | 0.489 | 0.574 | |
| Areas 3, 1, and 2 | Primary somatosensory cortex | 2.139 | 1.180 | 0.173 | |
| Area 11 | Orbitofrontal area | 1.817 | 3.083 | 4.302 | |
| Area 40 | Wernicke’s area | 1.057 | 0.100 | 5.792 | |
| Area 32 | Dorsal anterior cingulate cortex | 0.963 | 0.745 | 2.547 | |
| Area 47 | Inferior prefrontal gyrus | 0.923 | 2.206 | 0.159 | |
| Area 44 | Broca’s area | 0.780 | 2.327 | 0.360 | |
| Area 45 | Pars triangularis Broca’s area | 0.493 | 3.800 | 0.004 | |
Abbreviation: AD, Alzheimer’s disease; MCI, mild cognitive impairment; NC, normal control.
aThe hub regions in the metabolic network of the NC group were listed in a descending order of their normalized betweenness in left brain and then in the right brain.
Network Robustness Analysis
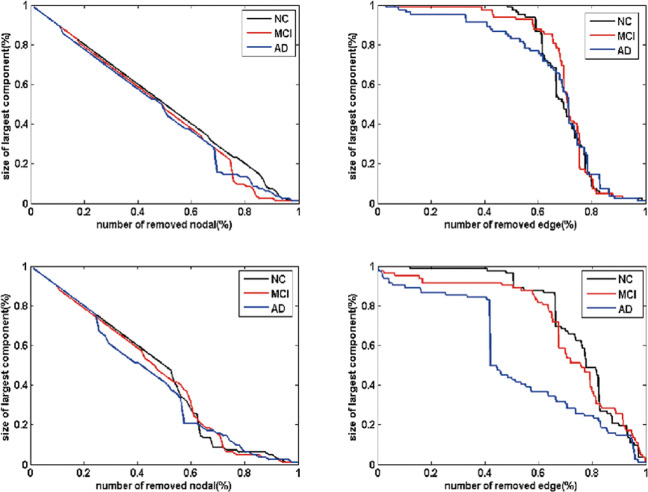
As seen in Figure 7, in all the 3 groups, the sizes of the largest component decreased as the deletion ratio grew. The sizes of the largest component in patients with MCI and AD were smaller than that of the NC over a wide percentage of removal. We also noted that the performance of the 3 groups was interwoven near the end of the removal processes in both patterns (Figure 7). Responding to the failures and crashes, the metabolic brain network in patients with MCI and AD were more vulnerable than the NCs.
Figure 7.
Network robustness under random and target analysis. The sizes of largest components under removing node at random (top panel) and targeted pattern (bottom panel). The black line corresponded to the performance of normal control (NC), red line for mild cognitive impairment (MCI), and blue line for Alzheimer’s disease (AD).
Correlations Between Individual Contribution and Clinical Assessments
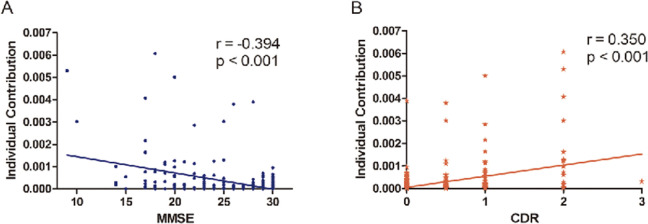
Before exploring the relationship between individual contribution and clinical assessments, we assessed the individual contribution of each person in the 3 groups (Figure 8). Figure 9A illustrated the significant negative correlation between individual contribution and MMSE using Pearson linear correlation coefficient (r = −.394, P < .001). As expected, the individual contribution positively correlated with the CDR score (r = .350, P < .001; Figure 9B). Moreover, the analyses revealed that participants with higher individual contribution to the overall metabolic brain network showed a worse clinical performance, with respect to cognitive disturbance and memory impairment and vice versa.
Figure 8.
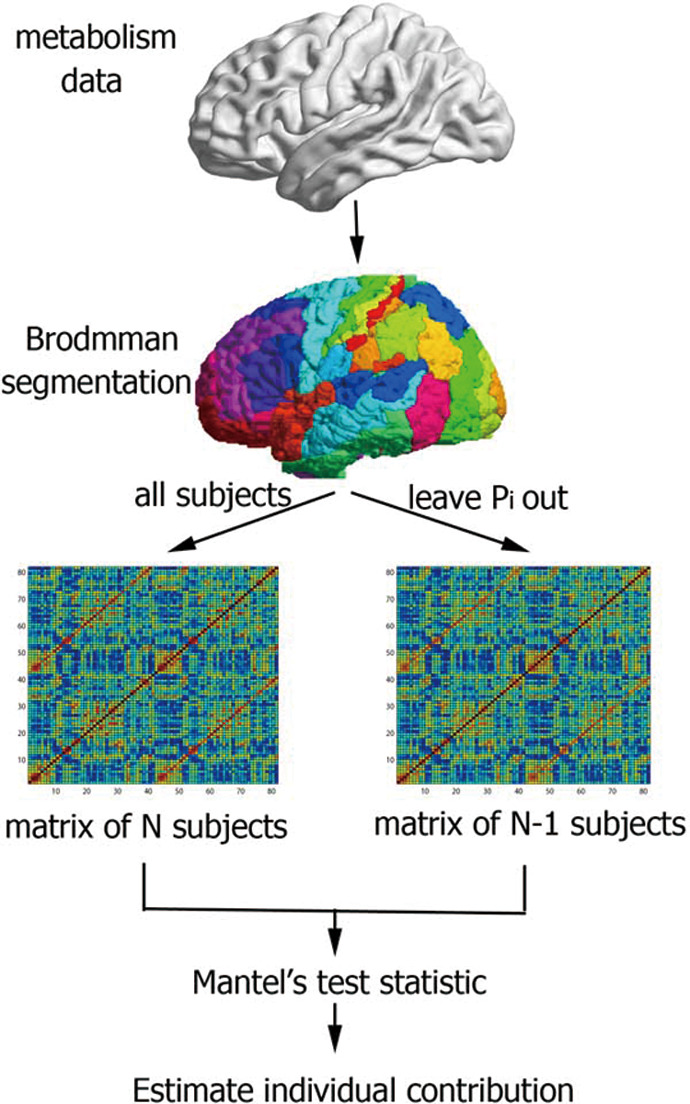
Flow diagram of the leave-one-out (Loo) approach. Metabolism data were segmented using Brodmann atlas. With the matrix of all and N − 1 participants, the individual contribution can be estimated by Mantel’s test statistic. Pi = 1…N represents the successive removal of Pi from the original group.
Figure 9.
Correlations between individual contribution and clinical assessment. Relations (r) represented the Pearson linear correlation coefficient. MMSE indicates Mini-Mental State Examination; CDR, Clinical Dementia Rating Scale.
Discussion
In the present study, we examined the topological pattern of the metabolic brain network using Brodmann atlas by the resting-state FDG-PET data in NC, MCI, and AD. To the best of our knowledge, this is the first report using LOO approach to explore the individual contribution to group-level metabolic network in the 3 groups. The main findings of our study could be summarized as follows: (1) The metabolic brain networks of both MCI and AD groups showed loss of the small-world properties compared to NC. (2) Relative to NC, the MCI and AD groups showed the disrupted topological organization in the metabolic brain network. (3) MCI and AD showed vulnerable network robustness compared to NC. (4) The individual contribution was significantly correlated with clinical assessments.
Small-World Properties of the Metabolic Networks
Previous studies focused on brain network functionality or structures, whereas the integrated regulation and information transfer reflected through metabolic changes in a cell or organisms. 39 The metabolic activity has been shown to correlate with clinical features in patients with chronic schizophrenia. 40 Regions with synchronous metabolic level are functionally interconnected. 41 On this assumptions, our approach investigated the regional metabolic relationships by estimating the region-to-region correlations in order to understand the abnormality of functional pathways in pathological diseases. 42,43 The correlation analysis of regional metabolism data was speculated to behave as a proxy for analyzing the patterns of synchronization of brain activity and disease-related influences among connected regions. 44 The 3 groups showed strong correlations between most homologous regions (same areas in the opposite hemispheres; Figure 1), which might be associated with the directly functional coupling between the left and the right hemispheres. 41 Recent studies indicated that there were small-world properties in functional and structural brain networks. 30,45 Watts et al 18 suggested that small-world networks displayed enhanced signal-propagation speed, self-organizing power, and synchronization ability when compared to regular networks. In this study, the highest Cp and the longest Lp were observed in AD, while MCI showed the intermediate values between normal aging and AD. Our findings provided additional evidence that MCI could be considered as the prodromal stage of AD. The longer Lp led to the lower level of the global efficiency in MCI and AD. 46 A lower speed of information processing and dissemination caused by low global efficiency might indicate poor manifestation in cognitive responses of MCI and AD. 47 Using the permutation tests (Figure 4), we found significant differences in Cp between NC and AD, and also between MCI and AD, which could be one plausible conjecture that the metabolic brain network of MCI was closer to NC. Moreover, the high Cp in patients indicated that the networks might self-rewire to improve the local efficiency as the compensation system for maintaining the brain organization. 48 In addition, the 3 groups presented no significant differences in Lp (P < .05), which indicated the differences in global integrated information processing failed to pass the statistical level. 7
Abnormal Changes in Nodal Centrality (Hub) in MCI and AD
The hub regions in the metabolic networks included 13 regions in NC, 11 in MCI, and 7 in AD (Table 2; Figure 5). The hub regions in MCI and AD altered in number and spatial distribution, which might increase the risk of losing the plastic ability of the brain. 49 The left BA4 (primary motor cortex), BA8, and right BA48 showed a high nodal centrality as common hubs in NC and MCI, implying stabilized state in the motor function and limited memory impairment during the MCI process. 50,51 Combining FDG-PET with fMRI, Perrotin et al suggested that hypometabolism in BA11 correlated with anosognosia in patients with AD. 52 In our study, the common hub region in MCI and AD groups might indicate a compensatory nature for mediating memory processes. 53
Figure 6 showed the higher nodal centrality in brain regions including BA26, BA45, and BA47 in MCI and BA20 and BA40 in AD when compared to NC. Mild cognitive impairment had been associated not only with structural but also with functional aberrations, such as metabolism enhanced in BA26, 54 and significant activation in BA45 during the phonological processing. 55 Moreover, evidence from a face-matching task showed an increased functional connectivity related to BA20 in MCI. 56 Previous research indicated that the temporal pole underwent serious structural changes involving cortical atrophy and synaptic loss in AD. 57 Furthermore, BA40 possessed a higher proportion of fibers in patients with AD. 58 Thus, the increased nodal centrality in Figure 6 might be the compensation responses in MCI and AD. 27 On the other hand, the nodal centrality regions in MCI and AD were also found to be significantly decreased (Figure 6), predominately located in BA7, BA8, and BA25. The prior structural network study using MRI reported that the gray matter volume of BA25 was highly atrophied in the MCI and AD. 59 A review of neuroimaging in AD suggested that hypometabolism or hypoperfusion occurred in the cingulate cortex and precuneus. 60 In the present study, the lower nodal centrality likely reflected the breakdown of metabolism system which might impede cognitive functioning in MCI and AD.
Network Robustness Analysis
In this study, we established the largest cluster as a measure of quantifying network robustness. By deleting the nodes or edges in the metabolic brain network and computing the largest cluster, our approach enabled the quantitative inquiry of network robustness. We observed that metabolic brain network in MCI and AD were more vulnerable to perturbations or attacks compared to NC, and the performance of MCI was located between NC and AD, which provided the additional evidence that MCI was an intermediate stage from NC to AD (Figure 7). Because of the power-law distribution, brain networks of the 3 groups were almost constant when deletion ratio was low. 61 After deletion ratio reached 50%, the performance of the 3 groups were amalgamated, thereby suggesting that the topological structure of the brain networks was extremely destroyed and thus unable to support integrality. From the network system perspective, the impact of losing nodes or edges could indicate a decline in cognition and memory in MCI and AD. Supporting evidence from He et al demonstrated that structural brain network of patients with AD showed vulnerability against perturbations compared to NC. 28 The reduced attack survivability might reflect the topological reorganization of the metabolic brain network, providing implications for cognition and memory impairment in MCI and AD. 28,33
Correlations Between Individual Contribution and Clinical Assessment
The leave-one-out approach has been widely employed in classification accuracy validation and brain network research with regard to the mental illnesses with cognitive and behavioral deficits. Given that the individual contribution reflected an optimal balance between an individual and a group, it could be treated as an innovative measurement of brain network in neurological disease. 35
We detected that the individual contributions toward the group-level network were negatively associated with MMSE scores (Figure 9A) and positively correlated with CDR scores (Figure 9B). This suggested that participants with higher contributions have poor network topology because of their poor mental status and dementia severity. In congruence with previous studies, our findings provided additional evidence that higher individual contributions in the global metabolic network were related to severe cognitive impairment. 35 Patients with AD were characterized by various deteriorations in language, memory, praxis, and general intellectual status. 62 These clinical differences in AD might be caused by functional and structural alterations in the entire brain networks, leading to the highest contribution toward global metabolic network. 28 In addition, the general linear model between individual contribution and MMSE or CDR might be valuable to predict cognition status, which suggested the individual contribution might be considered as a biomarker in the diagnosis of MCI and AD.
Conclusions
In this study, we combined the robustness analysis and LOO approach to investigate the organization of metabolic networks in patients with MCI and AD based on the FDG-PET data. Both MCI and AD showed a loss of small-world properties and abnormal organization of the metabolic networks, which were explored by local and global characteristics, that is, increased Cp and Lp , and altered nodal centrality. Additionally, the brain networks in MCI and AD were vulnerable to random or sequential targeted attacks compared to NC. Finally, individual contribution significantly correlated with neuropsychological scores. Findings in the metabolic brain networks might elucidate the pathological mechanism of MCI and AD for further perspective studies.
Acknowledgments
The authors appreciate the ADNI database (http://www.adni-info.org) for the availability of the neuroimaging required for this study. The principle investigator of ADNI is Michael W. Weiner, MD, UC San Francisco (Email- of ADNI: adni@loni.usc.edu).
Footnotes
The authors declared no potential conflicts of interest with respect to the research, authorship, and/or publication of this article.
Funding: The authors received no financial support for the research, authorship, and/or publication of this article.
Supplementary Material: Supplementary material for this article is available online.
References
- 1. Delbeuck X, Van der Linden M, Collette F Alzheimer’s disease as a disconnection syndrome?. Neuropsychol Rev. 2003:13(2);79–92. [DOI] [PubMed] [Google Scholar]
- 2. Morris JC, Cummings J. Mild cognitive impairment (MCI) represents early-stage alzheimer’s disease. J Alzheimers Dis. 2005:7(3);235–239;discussion 255-262. [DOI] [PubMed] [Google Scholar]
- 3. Rombouts SA, Barkhof F, Goekoop R, Stam CJ, Scheltens P. Altered resting state networks in mild cognitive impairment and mild alzheimer’s disease: an fMRI study. Hum Brain Mapp. 2005:26(4);231–239. [DOI] [PMC free article] [PubMed] [Google Scholar]
- 4. Machulda MM, Senjem ML, Weigand SD, et al. Functional magnetic resonance imaging changes in amnestic and nonamnestic mild cognitive impairment during encoding and recognition tasks. J Int Neuropsychol Soc. 2009:15(3);372–382. [DOI] [PMC free article] [PubMed] [Google Scholar]
- 5. Pihlajamäki M, Sperling RA. fmri: use in early alzheimer’s disease and in clinical trials. Future Neurol. 2008;3(4):409–421. [Google Scholar]
- 6. Liu ZY, Zhang YM, Yan H, et al. Altered topological patterns of brain networks in mild cognitive impairment and alzheimer’s disease: a resting-state fMRI study. Psychiatry Res. 2012:202(2);118–125. [DOI] [PubMed] [Google Scholar]
- 7. Yao ZJ, Zhang YC, Lin L, Zhou YA, Xu CL, Jiang TZ, Initi AsDN abnormal cortical networks in mild cognitive impairment and alzheimer’s disease. Plos Comput Biol. 2010:6(11);e1001009. [DOI] [PMC free article] [PubMed] [Google Scholar]
- 8. Garces P, Pineda-Pardo JA, Canuet L, et al. The Default Mode Network is functionally and structurally disrupted in amnestic mild cognitive impairment - A bimodal MEG-DTI study. Neuroimage-Clin. 2014:6;214–221. [DOI] [PMC free article] [PubMed] [Google Scholar]
- 9. Bozoki AC, Korolev IO, Davis NC, Hoisington LA, Berger KL. Disruption of limbic white matter pathways in mild cognitive impairment and alzheimer’s disease: A DTI/FDG-PET study. Hum Brain Mapp. 2012:33(8);1792–1802. [DOI] [PMC free article] [PubMed] [Google Scholar]
- 10. Grady CL, McIntosh AR, Beig S, Keightley ML, Burian H, Black SE. Evidence from functional neuroimaging of a compensatory prefrontal network in Alzheimer’s disease. J Neurosci. 2003:23(3);986–993. [DOI] [PMC free article] [PubMed] [Google Scholar]
- 11. Silveira M, Marques J. Boosting Alzheimer Disease Diagnosis Using PET Images. In: Pattern Recognition (ICPR), 2010 20th International Conference on. IEEE; 2010:2556–2559. [Google Scholar]
- 12. Drzezga A, Grimmer T, Riemenschneider M, et al. Prediction of individual clinical outcome in MCI by means of genetic assessment and (18)F-FDG PET. J Nucl Med. 2005;46(10):1625–1632. [PubMed] [Google Scholar]
- 13. Caminiti S, Tettamanti M, Sala A, et al. Metabolic connectomics targeting brain pathology in dementia with Lewy bodies. J Cereb Blood Flow Metab. 2017;37(4):1311–1326. [DOI] [PMC free article] [PubMed] [Google Scholar]
- 14. Zippo AG, Castiglioni I, Borsa VM, Biella GEM. The compression flow as a measure to estimate the brain connectivity changes in resting state fMRI and 18FDG-PET alzheimer’s disease. Front Comput Neurosci. 2015;9:148. [DOI] [PMC free article] [PubMed] [Google Scholar]
- 15. Toussaint PJ, Perlbarg V, Bellec P, et al. Resting state FDG-PET functional connectivity as an early biomarker of Alzheimer’s disease using conjoint univariate and independent component analyses. Neuroimage. 2012;63(2):936–946. [DOI] [PubMed] [Google Scholar]
- 16. Landau SM, Harvey D, Madison CM, et al. Alzheimer’s disease neuroimaging i. associations between cognitive, functional, and FDG-PET measures of decline in AD and MCI. Neurobiol Aging. 2011;32(7):1207–1218. [DOI] [PMC free article] [PubMed] [Google Scholar]
- 17. Sporns O, Chialvo DR, Kaiser M, Hilgetag CC. Organization, development and function of complex brain networks. Trends Cogn Sci. 2004;8(9):418–425. [DOI] [PubMed] [Google Scholar]
- 18. Watts DJ, Strogatz SH. Collective dynamics of ‘small-world’ networks. Nature. 1998;393(6684):440–442. [DOI] [PubMed] [Google Scholar]
- 19. Seo EH, Lee DY, Lee JM, et al. Whole-brain functional networks in cognitively normal, mild cognitive impairment, and Alzheimer’s disease. PLoS One. 2013;8(1):e53922. [DOI] [PMC free article] [PubMed] [Google Scholar]
- 20. Supekar K, Menon V, Rubin D, Musen M, Greicius MD. Network analysis of intrinsic functional brain connectivity in Alzheimer’s disease. PLoS Comput Biol. 2008;4(6):e1000100. [DOI] [PMC free article] [PubMed] [Google Scholar]
- 21. Stam C, De Haan W, Daffertshofer A, et al. Graph theoretical analysis of magnetoencephalographic functional connectivity in Alzheimer’s disease. Brain. 2009;132:213–224. [DOI] [PubMed] [Google Scholar]
- 22. de Haan W, Pijnenburg YAL, Strijers RLM, et al. Functional neural network analysis in frontotemporal dementia and Alzheimer’s disease using EEG and graph theory. BMC Neurosci. 2009;10:101. [DOI] [PMC free article] [PubMed] [Google Scholar]
- 23. Liu ZY, Bai LJ, Dai RW, et al. Dysfunctional whole brain networks in mild cognitive impairment patients: an fMRI study. Psychiatry Res. 2012;202(2):118–125. [DOI] [PubMed] [Google Scholar]
- 24. Folstein MF, Folstein SE, McHugh PR. “Mini-mental state”. A practical method for grading the cognitive state of patients for the clinician. J Psychiatr Res. 1975;12(3):189–198. [DOI] [PubMed] [Google Scholar]
- 25. Hughes CP, Berg L, Danziger WL, Coben LA, Martin RL. A new clinical scale for the staging of dementia. Br J Psychiatry. 1982;140:566–572. [DOI] [PubMed] [Google Scholar]
- 26. Thottakara P, Lazar M, Johnson SC, Alexander AL. Application of Brodmann’s area templates for ROI selection in white matter tractography studies. Neuroimage. 2006;29(3):868–878. [DOI] [PubMed] [Google Scholar]
- 27. Sanabria-Diaz G, Martínez-Montes E, Melie-Garcia L; for the Alzheimer’s Disease Neuroimaging I, the Alzheimer’s Disease Neuroimaging I. Glucose metabolism during resting state reveals abnormal brain networks organization in the Alzheimer’s Disease and mild cognitive impairment. PLoS One. 2013;8:e68860. [DOI] [PMC free article] [PubMed] [Google Scholar]
- 28. He Y, Chen Z, Evans A. Structural insights into aberrant topological patterns of large-scale cortical networks in Alzheimer’s Disease. J Neurosci. 2008;28(18):4756–4766. [DOI] [PMC free article] [PubMed] [Google Scholar]
- 29. Stam CJ, Jones BF, Nolte G, Breakspear M, Scheltens P. Small-world networks and functional connectivity in Alzheimer’s disease. Cereb Cortex. 2007;17(1):92–99. [DOI] [PubMed] [Google Scholar]
- 30. Bassett DS, Meyer-Lindenberg A, Achard S, Duke T, Bullmore E. Adaptive reconfiguration of fractal small-world human brain functional networks. Proc Natl Acad Sci U S A. 2006;103(51):19518–19523. [DOI] [PMC free article] [PubMed] [Google Scholar]
- 31. Rubinov M, Sporns O. Complex network measures of brain connectivity: uses and interpretations. Neuroimage. 2010;52(3):1059–1069. [DOI] [PubMed] [Google Scholar]
- 32. Hwang K, Hallquist MN, Luna B. The development of hub architecture in the human functional brain network. Cereb Cortex. 2013;23(10):2380–2393. [DOI] [PMC free article] [PubMed] [Google Scholar]
- 33. Albert R, Jeong H, Barabasi AL. Error and attack tolerance of complex networks. Nature. 2000;406(6794):378–382. [DOI] [PubMed] [Google Scholar]
- 34. Cohen R, Erez K, ben-Avraham D, Havlin S. Resilience of the Internet to random breakdowns. Phys Rev Lett. 2000;85(21):4626–4628. [DOI] [PubMed] [Google Scholar]
- 35. Saggar M, Hosseini SMH, Bruno JL, et al. Estimating individual contribution from group-based structural correlation networks. Neuroimage. 2015; 120:274–284. [DOI] [PMC free article] [PubMed] [Google Scholar]
- 36. Geda YE, Schneider LS, Gitlin LN, et al. ; Neuropsychiatric Syndromes Professional Interest Area of ISTAART. Neuropsychiatric symptoms in Alzheimer’s disease: past progress and anticipation of the future. Alzheimers Dement. 2013;9(9):602–608. [DOI] [PMC free article] [PubMed] [Google Scholar]
- 37. Mantel N. The detection of disease clustering and a generalized regression approach. Cancer Res. 1967;27(2):209–220. [PubMed] [Google Scholar]
- 38. Yao ZJ, Hu B, Zheng JX, et al. ; Alzheimer’s Disease Neuroimaging Initiative. A FDG-PET study of metabolic networks in apolipoprotein e epsilon 4 allele carriers. PloS One. 2015;10(7):E0132300. [DOI] [PMC free article] [PubMed] [Google Scholar]
- 39. Patil KR, Nielsen J. Uncovering transcriptional regulation of metabolism by using metabolic network topology. Proc Natl Acad Sci U S A. 2005;102(6):2685–2689. [DOI] [PMC free article] [PubMed] [Google Scholar]
- 40. Volkow ND, Wolf AP, Vangelder P, et al. Phenomenological correlates of metabolic-activity in 18 patients with chronic-schizophrenia. Am J Psychiatry. 1987;144(2):151–158. [DOI] [PubMed] [Google Scholar]
- 41. Horwitz B, Duara R, Rapoport SI. Intercorrelations of glucose metabolic rates between brain-regions - application to healthy-males in a state of reduced sensory input. J Cereb Blood Flow Metab. 1984;4(4):484–499. [DOI] [PubMed] [Google Scholar]
- 42. Metter EJ, Riege WH, Kuhl DE, Phelps ME. Cerebral Metabolic Relationships for Selected brain-regions in healthy-adults. J Cereb Blood Flow Metab. 1984;4(1):1–7. [DOI] [PubMed] [Google Scholar]
- 43. Horwitz B, Rumsey JM, Grady CL, Rapoport SI. The cerebral metabolic landscape in autism - intercorrelations of regional glucose-utilization. Arch Neurol. 1988;45(7):749–755. [DOI] [PubMed] [Google Scholar]
- 44. Morbelli S, Drzezga A, Perneczky R, et al. Resting metabolic connectivity in prodromal Alzheimer’s disease. A European Alzheimer Disease Consortium (EADC) project. Neurobiol Aging. 2012;33(11):2533–2550. [DOI] [PubMed] [Google Scholar]
- 45. He Y, Chen ZJ, Evans AC. Small-world anatomical networks in the human brain revealed by cortical thickness from MRI. Cereb Cortex. 2007;17(10):2407–2419. [DOI] [PubMed] [Google Scholar]
- 46. van den Heuvel MP, Stam CJ, Kahn RS, Hulshoff Pol HE. Efficiency of functional brain networks and intellectual performance. J Neurosci. 2009;29(23):7619–7624. [DOI] [PMC free article] [PubMed] [Google Scholar]
- 47. Yener GG, Emek-Savas DD, Guntekin B, Basar E. The visual cognitive network, but not the visual sensory network, is affected in amnestic mild cognitive impairment: a study of brain oscillatory responses. Brain Res. 2014;1585:141–149. [DOI] [PubMed] [Google Scholar]
- 48. Agosta F, Rocca MA, Pagani E, et al. Sensorimotor network rewiring in mild cognitive impairment and Alzheimer’s Disease. Hum Brain Mapp. 2010;31(4):515–525. [DOI] [PMC free article] [PubMed] [Google Scholar]
- 49. Bruno J, Hosseini SMH, Kesler S. Altered resting state functional brain network topology in chemotherapy-treated breast cancer survivors. Neurobiol Dis. 2012;48(3):329–338. [DOI] [PMC free article] [PubMed] [Google Scholar]
- 50. Goldman WP, Baty JD, Buckles VD, Sahrmann S, Morris JC. Motor dysfunction in mildly demented AD individuals without extrapyramidal signs. Neurology. 1999;53(5):956–962. [DOI] [PubMed] [Google Scholar]
- 51. Cerami C, Della Rosa P, Dodich A, et al. 18FFDG PET evidence of atypical medial temporal lobe dysfunction in prodromal alzheimer’s disease (P6. 325). Neurology. 2014;82(10 suppl P6):P325–P326. [Google Scholar]
- 52. Perrotin A, Desgranges B, Landeau B, et al. Anosognosia in Alzheimer disease: disconnection between memory and self-related brain networks. Ann Neurol. 2015;78(3):477–486. [DOI] [PubMed] [Google Scholar]
- 53. Kumfor F, Irish M, Hodges JR, Piguet O. The orbitofrontal cortex is involved in emotional enhancement of memory: evidence from the dementias. Brain. 2013;136 (pt 10):2992–3003. [DOI] [PubMed] [Google Scholar]
- 54. Walhovd KB, Fjell AM, Brewer J, et al. Combining MR imaging, positron-emission tomography, and CSF biomarkers in the diagnosis and prognosis of Alzheimer disease. AJNR Am J Neuroradiol. 2010;31(2):347–354. [DOI] [PMC free article] [PubMed] [Google Scholar]
- 55. Clement F, Belleville S. Test-retest reliability of fMRI verbal episodic memory paradigms in healthy older adults and in persons with mild cognitive impairment. Hum Brain Mapp. 2009;30(12):4033–4047. [DOI] [PMC free article] [PubMed] [Google Scholar]
- 56. Bokde ALW, Lopez-Bayo P, Meindl T, et al. Functional connectivity of the fusiform gyrus during a face-matching task in subjects with mild cognitive impairment. Brain. 2006;129(pt 5):1113–1124. [DOI] [PubMed] [Google Scholar]
- 57. Scheff SW, Price DA, Schmitt FA, Scheff MA, Mufson EJ. Synaptic loss in the inferior temporal gyrus in mild cognitive impairment and Alzheimer’s disease. J Alzheimers Dis. 2011;24(3):547–557. [DOI] [PMC free article] [PubMed] [Google Scholar]
- 58. Daianu M, Jahanshad N, Nir TM, et al. ; Alzheimer’s Disease Neuroimaging Initiative. Breakdown of brain connectivity between normal aging and alzheimer’s disease: a structural k-core network analysis. Brain Connect. 2013;3(4):407–422. [DOI] [PMC free article] [PubMed] [Google Scholar]
- 59. Prestia A, Drago V, Rasser PE, Bonetti M, Thompson PM, Frisoni GB. Cortical changes in incipient Alzheimer’s disease. J Alzheimers Dis. 2010;22(4):1339–1349. [DOI] [PubMed] [Google Scholar]
- 60. Matsuda H. Role of neuroimaging in Alzheimer’s disease, with emphasis on brain perfusion SPECT. J Nucl Med. 2007;48(8):1289–1300. [DOI] [PubMed] [Google Scholar]
- 61. Friedman EJ, Landsberg AS. Hierarchical networks, power laws, and neuronal avalanches. Chaos. 2013;23(1):013135. [DOI] [PMC free article] [PubMed] [Google Scholar]
- 62. Morris J, Heyman A, Mohs R, et al. The consortium to establish a registry for Alzheimer’s disease (CERAD): part I. Clinical and neuropsychological assessment of Alzheimer’s disease. Neurology. 1989;39(9):1159–1165. [DOI] [PubMed] [Google Scholar]


