Abstract
After myocardial infarction (MI), emergency hematopoiesis produces inflammatory myeloid cells that accelerate atherosclerosis and promote heart failure. Since the balance between glycolysis and mitochondrial metabolism regulates hematopoietic stem cell homeostasis, metabolic cues may influence emergency myelopoiesis. Here, we show in humans and female mice that hematopoietic progenitor cells increase fatty acid metabolism after MI. Blockade of fatty acid oxidation by deleting carnitine palmitoyltransferase (Cpt1A) in hematopoietic cells of Vav1Cre/+Cpt1Afl/fl mice limited hematopoietic progenitor proliferation and myeloid cell expansion after MI. We also observed reduced bone marrow adiposity in humans, pigs and mice following MI. Inhibiting lipolysis in adipocytes using AdipoqCreERT2Atglfl/fl mice or local depletion of bone marrow adipocytes in AdipoqCreERT2iDTR mice also curbed emergency hematopoiesis. Furthermore, systemic and regional sympathectomy prevented bone marrow adipocyte shrinkage after MI. These data establish a critical role for fatty acid metabolism in post-MI emergency hematopoiesis.
Keywords: Myocardial infarction, emergency hematopoiesis, bone marrow, adipocytes, lipolysis, fatty acid oxidation
Introduction
Innate myeloid immune cells serve as critical responders in injury and infection but can also propel inflammatory pathologies, including cardiovascular disease1,2. Given their short life span3, inflammatory monocytes are constantly produced from hematopoietic stem and progenitor cells (HSPC). Myocardial infarction (MI) induces emergency hematopoiesis4, and the ensuing leukocyte overproduction promotes reinfarction and heart failure by sustaining chronic inflammation in the arterial wall and the heart muscle5–8. Clinically, harmful effects of augmented myeloid cell production manifest in a strong correlation of blood leukocytes with cardiovascular mortality9–13.
Emerging data suggest that systemic and cell-intrinsic metabolic changes impact hematopoietic stem and progenitor cell (HSPC) homeostasis and engraftment14–16. Given metabolism’s relevance for these conditions, we reasoned that emergency hematopoiesis, during which increased cell proliferation raises energy demand, may alter metabolic requirements of HSPC. Understanding putative metabolic choke points for expanded myeloid cell production may provide therapeutic opportunities to counter the abundance of inflammatory leukocytes.
The bone marrow niche is a heterogeneous tissue microenvironment with diverse cellular components that maintain and regulate HSPC homeostasis via various signals, including cytokines and growth factors17,18. In addition to these secreted and surface-mounted niche factors, the metabolic microenvironment may also influence hematopoiesis, a notion supported by the importance of heterogeneous niche oxygen tension for HSPC activity19. Adipocytes, among the body’s primary cellular energy stores, are enigmatic but numerous residents of the bone marrow niche that have been assigned neutral or even inhibitory roles20. More recent work indicates that bone marrow adipocytes may serve as local sources of energy in mice with caloric restriction or recovery from bone marrow transplantation21, and that bone marrow adipocytes serve as a cytokine source22,23. Given that bone marrow adipocytes can be considered local sources of energy in the form of fatty acids, we here explored how they influence HSPC behavior after myocardial infarction, which frequently occurs in patients with atherosclerosis and dysregulated lipid metabolism.
Results
Myocardial infarction increases HSPC fatty acid oxidation
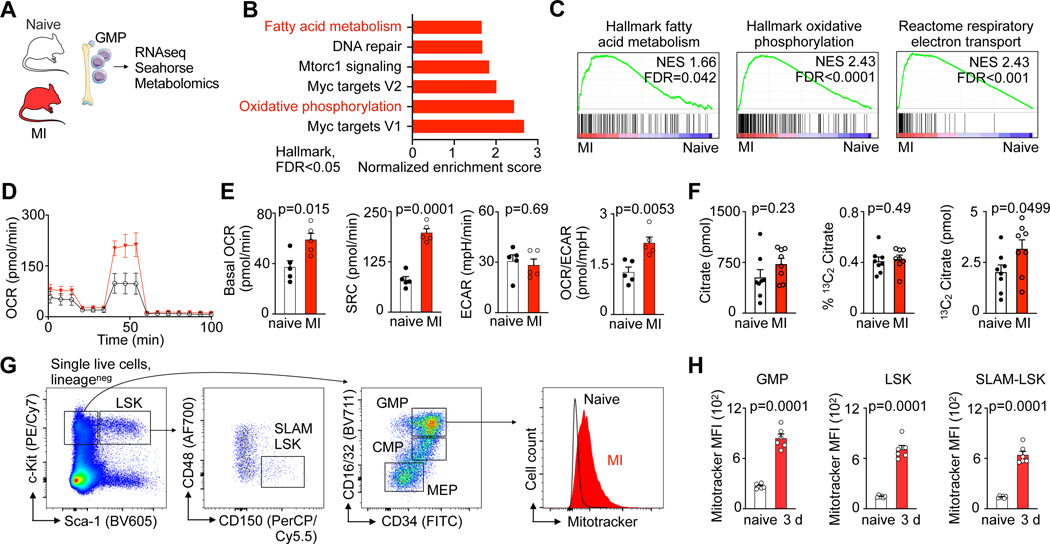
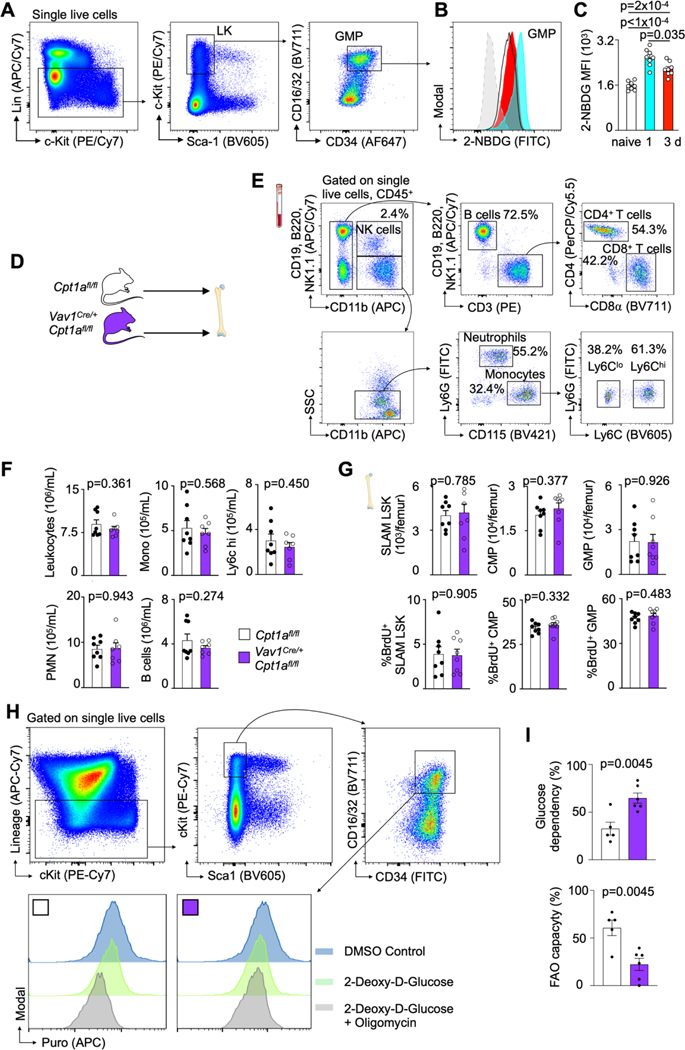
Myocardial infarction (MI) is among the most frequent and deadliest clinical challenges to hematopoiesis24, increasing HSPC proliferation with a peak 2 days after ischemia4. Both, preclinical and clinical data strongly indicate that the bone marrow’s heightened leukocyte output accelerates cardiovascular diseases5–13. To shed light on the bone marrow’s metabolic adaptions that occur during this health emergency, we pursued transcriptomic profiling in bone marrow granulocyte-monocyte progenitors (GMP) isolated from mice on day 2 after MI (Fig. 1A, Supplementary Table 1). GMP vastly amplify production of monocytes and neutrophils, leukocytes that become abundant after MI and determine worse clinical outcomes12. While there were no negatively regulated gene sets, six Hallmark gene sets were significantly (FDR<0.05) enriched in GMP isolated from the bone marrow of mice with MI, among them gene sets related to oxidative phosphorylation and fatty acid metabolism (Fig. 1B,C). Given the link between cellular metabolism and HSPC function25, we next tested how MI affects GMP bioenergetics. In cells isolated on day 3 post-MI, we observed that MI increased both, GMP’s basal oxygen consumption rate (OCR) and spare respiratory capacity (SRC); yet, the extracellular acidification rate (ECAR) indicated unchanged glycolysis (Fig. 1D,E). The resulting OCR/ECAR ratio rise in GMP isolated from mice with MI (Fig. 1E) indicates these cells turn towards mitochondrial metabolism during emergency hematopoiesis after MI. To assess glucose uptake into GMPs, we intravenously injected the fluorescent analog 2-NBD glucose into mice with and without MI. Using flow cytometry, we found that glucose uptake into GMP peaks on day 1 post-MI and declines on day 3 (Extended Data Fig. 1A–C), suggesting that GMP also use an alternative energy source while sustaining elevated proliferation.
Fig. 1 |. Myocardial infarction enhances fatty acid metabolism in hematopoietic stem and progenitor cells.
A, Experimental design. B, Hallmark gene sets significantly (FDR<0.05) enriched in granulocyte monocyte progenitors (GMP) from mice with myocardial infarction (MI). GMP were isolated from the bone marrow of control mice and day 2 after MI (n=3 control, n=3 MI). C, Gene set enrichment analysis showing upregulation of “Hallmark oxidative phosphorylation”, “Hallmark fatty acid metabolism” and “C2 Reactome respiratory electron transport” in GMP isolated from mice with MI. D, Real-time changes in the oxygen consumption rate (OCR) of GMP sorted from control mice compared to day 3 after MI (n=5 control, n=5 MI, two independent experiments), assessed by Seahorse assay. E, Quantification of basal OCR, spare respiration capacity (SRC), extracellular acidification rate (ECAR) and OCR/ECAR ratio of GMP sorted from control mice versus day 3 after MI (n=5 control, n=5 MI, two-tailed Welch’s t test, two independent experiments). F, Abundance of citrate, percentage of 13C2 labelled citrate, and amount of total 13C2 citrate as measured by mass spectrometry in 300,000 GMP isolated from control and day 3 post-MI mice that were injected with 13C16 palmitate (n=8 mice per group, two-tailed Mann-Whitney test, two independent experiments). G, Flow cytometry gating for hematopoietic stem and progenitor cells (HSPC) in mice and histogram of MitoTracker™ Green FM intensity in GMP from controls and mice on day 3 after MI. H, Mean fluorescence intensity (MFI) of MitoTracker™ Green staining in control mice versus day 3 after MI (n=5 control, n=6 MI, two-tailed Welch’s t test). Data are displayed as mean±SEM.
We therefore next considered fatty acid oxidation, which is thought to influence HSC cell cycle activity and fate decisions, preserving an upstream undifferentiated HSC pool25,26. To track the uptake and then metabolism of fatty acids, we intravenously injected a 13C labelled fatty acid (13C16 palmitate) shortly before GMP isolation, followed by mass spectrometry analysis of these cells. In this experiment, we found a trend towards a higher total citrate abundance on day 3 post-MI (Fig. 1F). 13C labelling efficiencies of GMPs were similar after MI and in control mice, indicated in a comparable fraction of 13C citrate (Fig. 1F). Importantly, the concentration of 13C2 citrate in GMP isolated from mice with MI was higher compared to controls, pointing towards an increased use of 13C16 palmitate in the tricarboxylic acid (TCA) cycle and elevated energy generation from fatty acids.
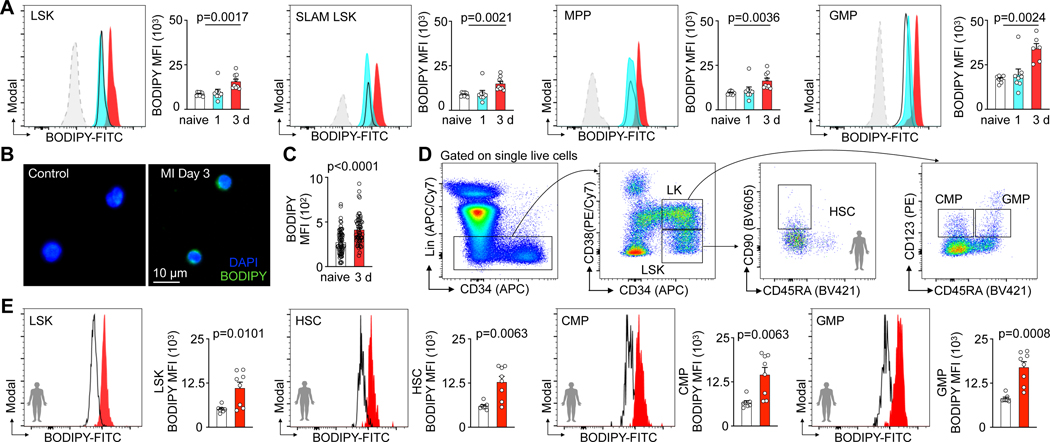
In line with this increased metabolic activity, flow cytometry assays using MitoTracker™ Green staining of lineage− Sca1+ ckit+ LSK, lineage− Sca1+ ckit+ CD150+ CD48− SLAM-LSK, and lineage− Sca1− ckit+ CD16/32+ CD34+ GMP (Fig. 1G) showed a higher mitochondrial content in HSPC after MI (Fig. 1G, H). After MI, HSPC that underwent ex-vivo staining with BODIPY, a fluorescent dye that stains lipids, showed increased BODIPY fluorescence (Fig. 2A). Fluorescence microscopy confirmed heightened post-MI lipid BODIPY staining in the cell plasma surrounding the nucleus of GMP (Fig. 2B,C). Taken together, these data indicate that mouse HSPC contain more mitochondria and lipids after MI.
Fig. 2 |. Hematopoietic stem and progenitor cells display increased fatty acid content in response to myocardial infarction.
A, Histograms and quantification of BODIPY lipid dye fluorescence intensity in LSK, SLAM-LSK, MPP and GMP from controls and mice day 1–3 after MI (n=9 control, n=8 MI day 1, n=9 MI day 3 for LSK, SLAM LSK and MPP, n=7 control, n=8 MI day1, n=6 MI day3 for GMP, one-way ANOVA followed by Dunnett’s post-test, four independent experiments). B, Fluorescence microscopy image of lipid BODIPY staining in GMP sorted from control mice versus day 3 after MI. C, Quantification of BODIPY mean fluorescence intensity (MFI) in sorted GMP from control mice versus day 3 after MI (n=12 control, n=10 MI, 6 measurements from each mouse, two-tailed Welch’s t test, three independent experiments). D, Flow cytometry gating for human bone marrow HSPC. E, Quantification of BODIPY lipid dye fluorescence intensity in LSK, HSC, CMP and GMP in controls versus patients on days 3–6 after MI (n=7 controls, n=8 MI patients, two-tailed Welch’s t test, three independent experiments). Data are displayed as mean±SEM.
To test whether acute MI associates with elevated HSPC lipid content in patients as well, we incorporated BODIPY lipid staining in flow cytometric gating for human HSPC27–29(Fig. 2D). The HSPC lipid content increased in patient bone marrow biopsies aspirated from the iliac crest on day 3 to 6 after acute MI when compared to marrow from sex- and age-matched healthy controls (Fig. 2E). Collectively, these findings suggest heightened fatty acid metabolism in HSPC during emergency hematopoiesis in humans and mice with acute MI.
Fatty acid oxidation promotes expanded myelopoiesis after MI
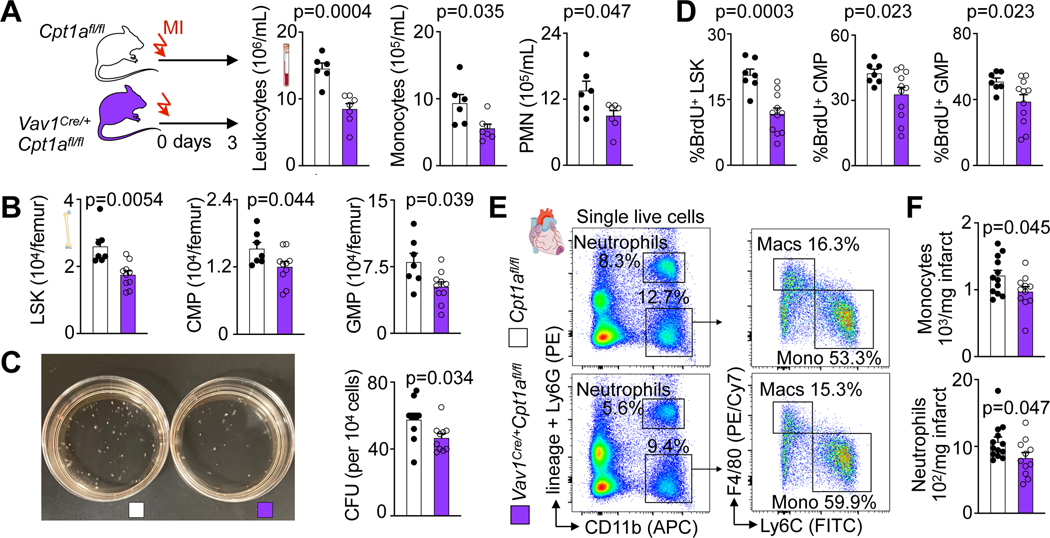
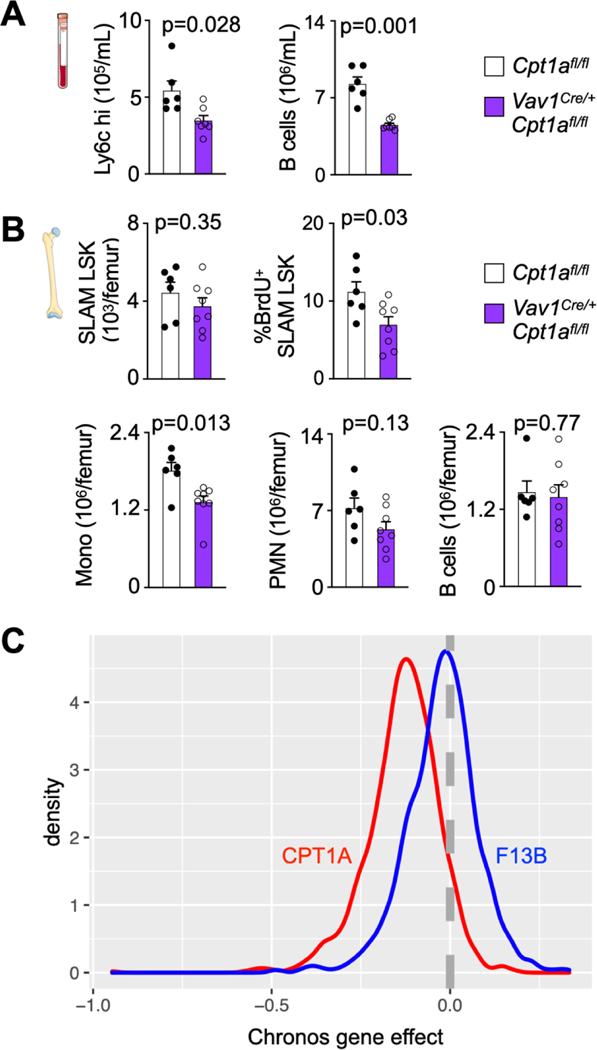
Mitochondrial electron transport chain activity supports HSC differentiation30. When viewed with the data described above, we therefore hypothesized that fatty acid oxidation is required for post-MI emergency hematopoiesis. To test this hypothesis, we inhibited fatty acid oxidation specifically in hematopoietic cells using conditional carnitine palmitoyltransferase gene (Cpt1A) deletion in Vav1Cre/+Cpt1Afl/fl mice. Adult Vav1Cre/+Cpt1Afl/fl mice had normal cellularity in the blood and bone marrow as well as normal SLAM-LSK, CMP and GMP numbers (Extended Data Fig. 1D–G). In Vav1Cre/+Cpt1Afl/fl mice, GMP had reduced fatty acid oxidation capacity, as expected (Extended Data Fig. 1H, I). When Vav1Cre/+Cpt1Afl/fl mice were subjected to MI, blood leukocyte and bone marrow HSPC numbers were lower than in Cpt1Afl/fl control mice with MI (Fig. 3A,B, Extended Data Fig. 2A,B). Deleting Cpt1A reduced the number of colony forming units (Fig. 3C) and LSK, CMP and GMP proliferation in the marrow of mice with MI (Fig. 3D). Consequently, monocyte and neutrophil recruitment to the injured myocardium fell in Vav1Cre/+Cpt1Afl/fl compared to Cpt1Afl/fl control mice with MI (Fig. 3E,F).
Fig. 3 |. Fatty acid oxidation is required for emergency hematopoiesis after myocardial infarction.
A, Quantification of blood leukocytes, monocytes and neutrophils (PMN) by flow cytometry in Cpt1afl/fl controls and Vav1Cre/+Cpt1Afl/fl mice, both 3 days after MI (n=6 Cpt1afl/fl, n= 7 Vav1Cre/+Cpt1Afl/fl, two-tailed Welch’s t test, three independent experiments). B, Quantification of bone marrow LSK, CMP and GMP by flow cytometry in Cpt1afl/fl controls and Vav1Cre/+Cpt1Afl/fl mice 3 days after MI (n=7 Cpt1afl/fl, n=10 Vav1Cre/+Cpt1Afl/fl, two-tailed Welch’s t test, three independent experiments). C, Colony forming unit (CFU) assay of bone marrow cells from Cpt1afl/fl controls and Vav1Cre/+Cpt1Afl/fl mice 3 days after MI (n=10 Cpt1afl/fl, n=10 Vav1Cre/+Cpt1Afl/fl, two-tailed Welch’s t test). D, Proliferation quantification of LSK, CMP and GMP in the femurs of Cpt1afl/fl controls and Vav1Cre/+Cpt1Afl/fl mice 3 days after MI (n=7 Cpt1afl/fl, n=11 Vav1Cre/+Cpt1Afl/fl, two-tailed Welch’s t test, three independent experiments). E, Flow plots and F, quantification of monocytes and neutrophils in the ischemic myocardium of Cpt1afl/fl controls and Vav1Cre/+Cpt1afl/fl mice on day 3 after MI (n=12 Cpt1afl/fl, n=11 Vav1Cre/+Cpt1Afl/fl, two-tailed Welch’s t test, four independent experiments). Data are displayed as mean±SEM.
We validated the Cpt1a deletion effects using the publicly available Depmap database that provides results of genome wide genetic perturbations with CRISPR screens. Gene essentiality scores were assessed for CPT1A and the control gene F13B. The Chronos gene effect measures the proliferative disadvantage that a cell line experiences after CRISPR-mediated knockout of the gene in question after adjusting for copy number effects31. The data (Extended Data Fig. 2C) support that Cpt1a is essential for proliferation in many cell types, including cells of the hematopoietic lineage. Altogether, our data indicate that fatty acid metabolism in the hematopoietic lineage is required for MI-induced emergency hematopoiesis.
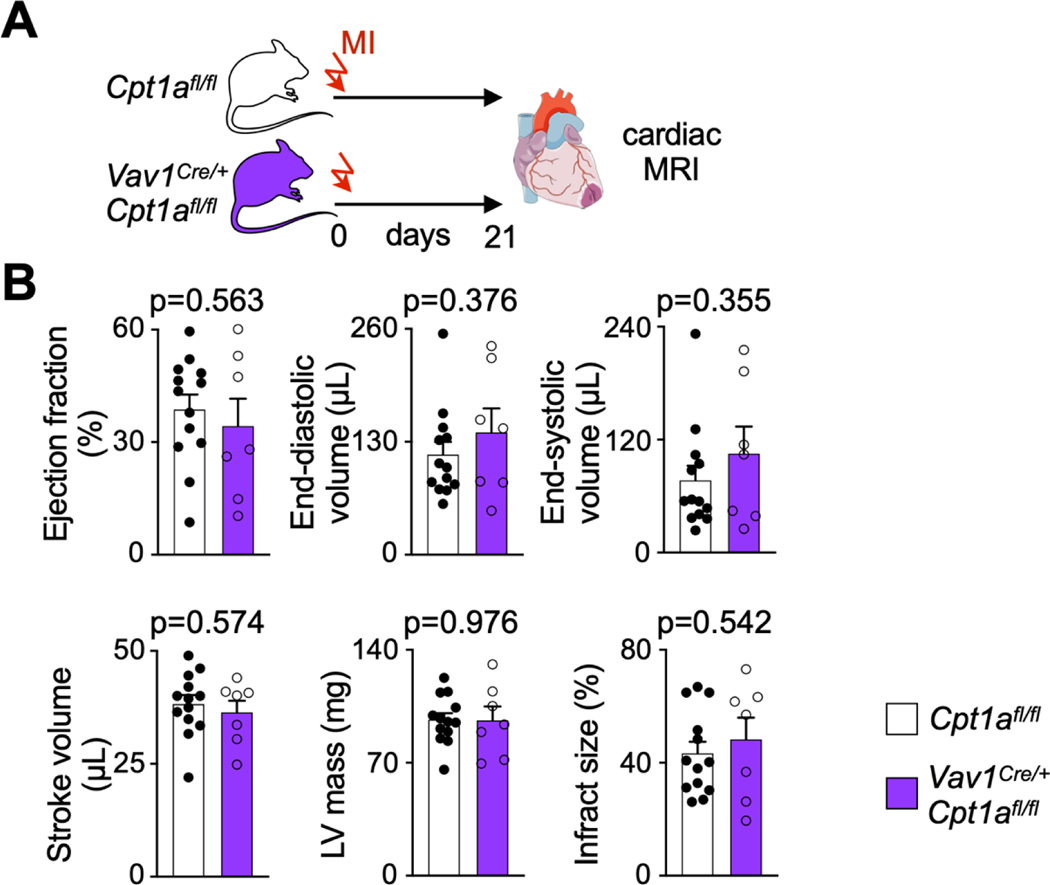
Post-MI heart failure was comparable in Vav1Cre/+Cpt1Afl/fl and Cpt1Afl/fl control mice with MI, measured by cardiac MRI 3 weeks after coronary ligation (Extended Data Fig. 3A,B).
Myocardial infarction reduces bone marrow adiposity
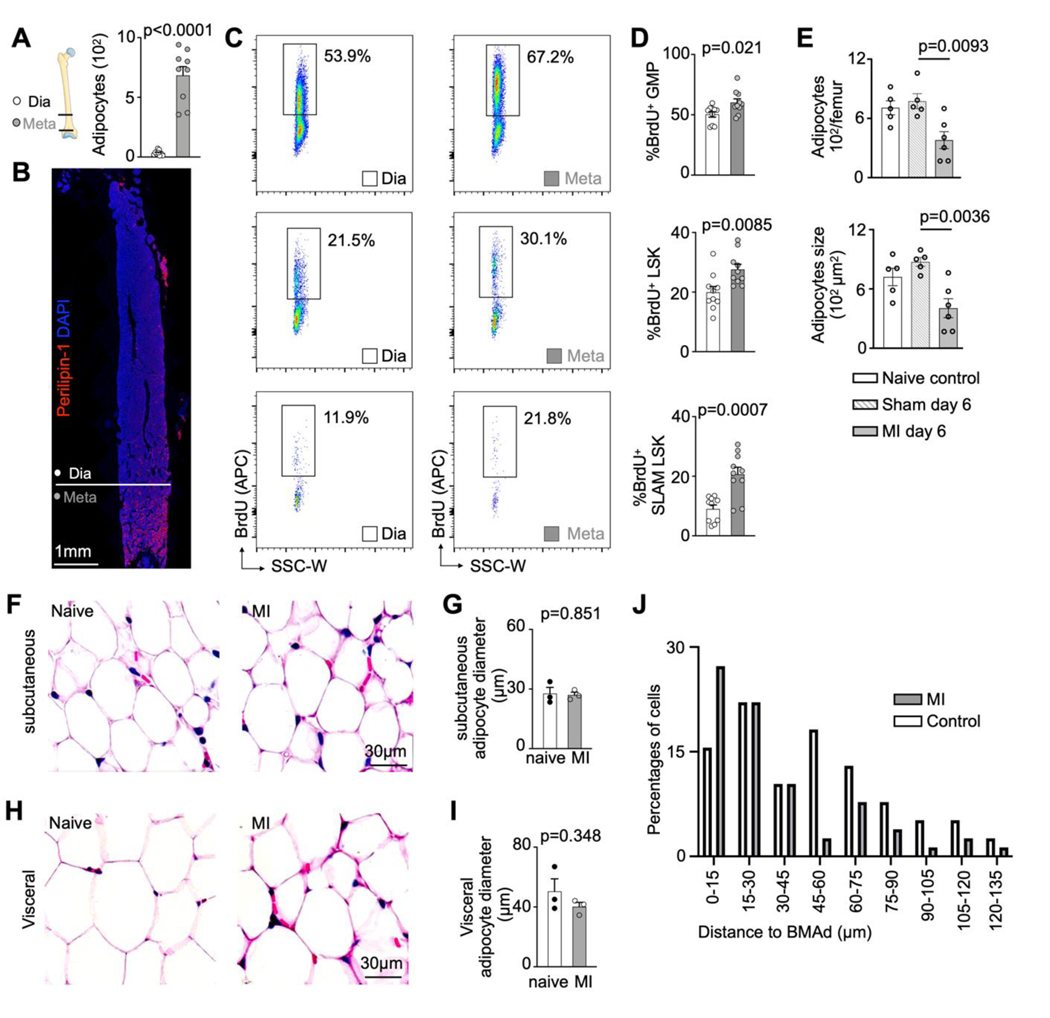
Bone marrow adipose tissue comprises 10% of total fat mass in healthy humans32,33 but its distribution is heterogeneous34. In mice, there were more adipocytes in the metaphysis (Extended Data Fig. 4A,B), a region with higher HSPC proliferation rates on day 3 after MI (Extended Data Fig. 4C,D). This association between HSPC activity and adipocyte-rich regions led us to hypothesize that bone marrow adipocytes act as local energy stores, providing fatty acids to HSPC that proliferate in their vicinity. To test this hypothesis, which is also supported by data obtained in mice with caloric restriction21, we assayed bone marrow adiposity in mice, humans, and swine in steady state and after MI. In mice, metaphyseal bone marrow adipocytes became less numerous and progressively shrank starting on day 1 after MI, reaching a nadir on day 6 (Fig. 4A–C, Extended Data Fig. 4E). Osmium micro-CT confirmed these histological data, with reduced adiposity in the proximal region of the tibia on day 3 after MI (Fig. 4D,E). Of note, adipocyte size did not change in subcutaneous fat but was also slightly reduced in visceral fat in mice with MI (Extended Data Fig. 4F–I). Using confocal microscopy of the femur after transplantation of dye-labeled HSPC, we observed that in mice 3 days after MI, HSPC locate closer to bone marrow adipocytes than they do in control mice (Fig. 4F,G and Extended Data Fig. 4J).
Fig. 4 |. Myocardial infarction reduces bone marrow adiposity.
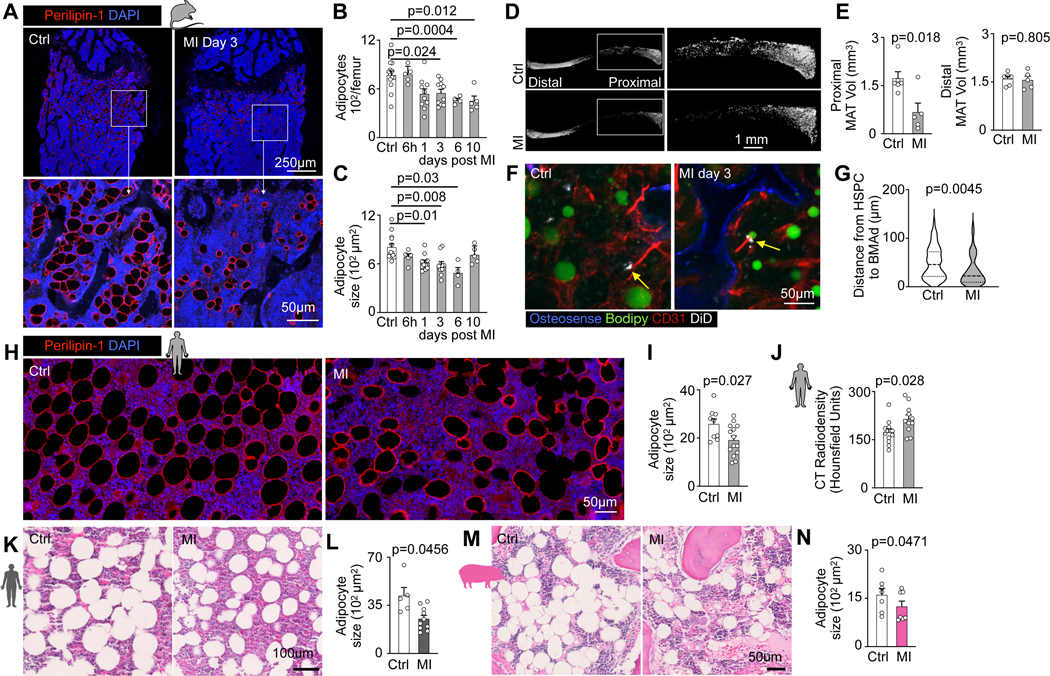
A, Bone marrow adipocyte immunofluorescence staining for Perilipin-1 in controls versus mice on day 3 after MI. B, Quantification of adipocyte numbers and C, adipocyte size in femurs on indicated days after MI (n=13 control, n=4–10 per time, Brown-Forsythe and Welsh Anova with Dunnett’s T3 multiple comparison, six independent experiments). D, Representative Osmium μCT images and E, quantification of marrow adipose tissue (n=6 control mice, n=5 MI day 3, two-tailed Welch’s t test, 2 independent experiments). F, Confocal imaging of DiD-labeled LSK, adipocytes and endothelial cells in controls versus 3 days after MI. G, Quantification of LSK distance to the next adipocyte in control mice versus day 3 after MI (n=6 control, n=7 MI, two-tailed Welch’s t test, three independent experiments). H, Vertebral bone marrow adipocyte immunofluorescence staining for Perilipin-1 in humans with or without MI. I, Quantification of adipocyte size (n=9 controls, n=14 MI patients, two-tailed Welch’s t test). J, Vertebral density measurement by CT in control subjects without MI and patients admitted with acute MI (n=11 controls, n=11 MI, two-tailed Welch’s t test). K, Histology staining of sternal bone marrow samples from patients with myocardial infarction vs control patients. L, Quantification of adipocyte size (n=5 control subjects, n=10 MI patients, two-tailed Welch’s t test). M, Histology staining of bone marrow biopsies from the iliac crest of pigs before versus post-MI. N, Quantification of adipocyte size (n=7, two-tailed paired t test). Data are displayed as mean±SEM.
To explore if MI affects bone marrow adiposity in humans, we measured adipocyte size in histological sections of vertebral bone marrow collected at autopsy. In patients that died within two weeks after acute MI, adipocytes were smaller than in sex- and age- matched controls without MI (Fig. 4H,I), replicating our findings obtained in mice. Further, we retrospectively analyzed vertebral bone marrow density in cardiac CT scans obtained from patients admitted with acute MI, comparing them to sex- and age-matched cases in which MI was ruled out. Cardiac scans contained the 8th thoracic vertebra in the field of view, allowing us to analyze its marrow’s radiodensity which is low for air and fat. In patients with MI, vertebral radiodensity was higher (Fig. 4J), which is consistent with reduced adiposity of the bone marrow35. These results were confirmed in a separate cohort, in which we collected bone marrow from the sternum of control and MI patients (Fig. 4K, L). Samples collected from the iliac crest of swine also displayed a significant reduction of bone marrow adipocyte size after MI (Fig. 4M,N). Taken together, these data, obtained in three species, suggest that bone marrow adipocytes may act as lipid sources for HSPC during emergency hematopoiesis after myocardial infarction.
Bone marrow adipocyte lipids increase post-MI myelopoiesis
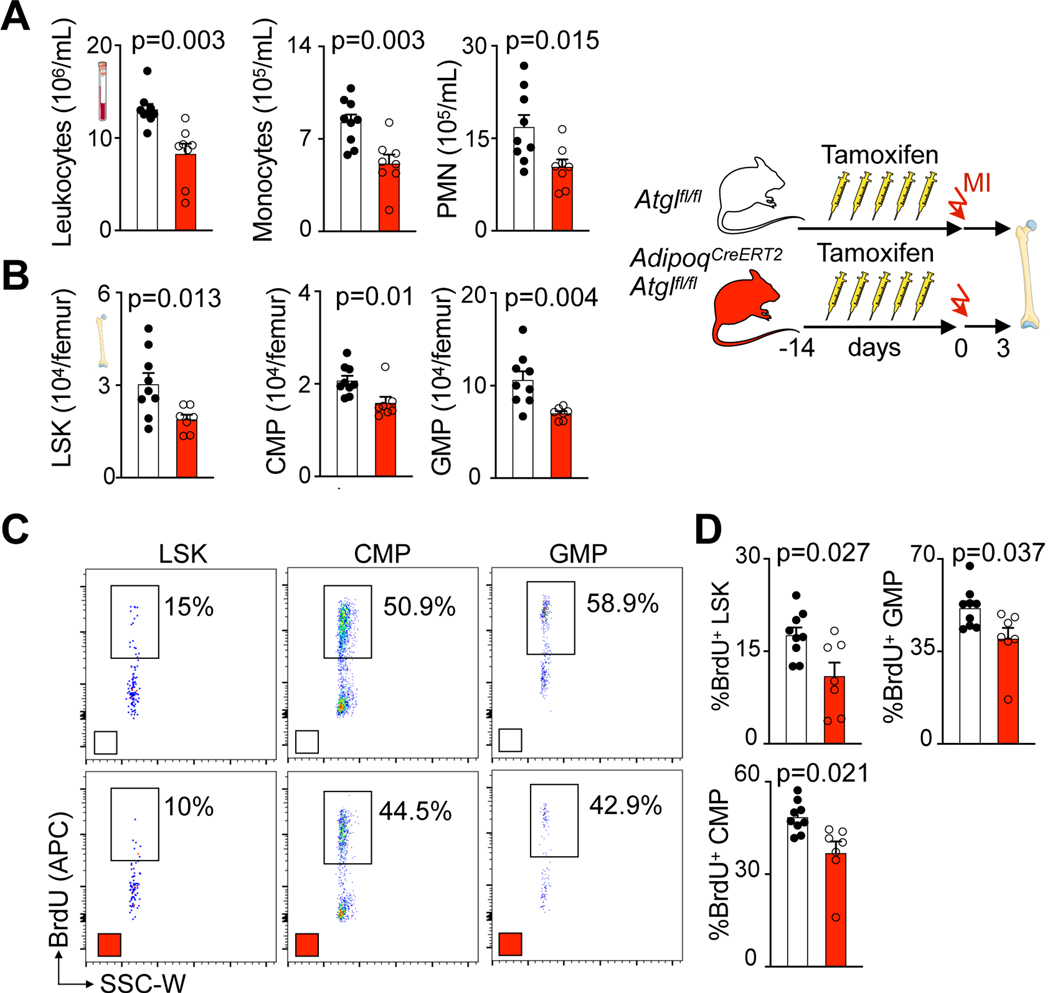
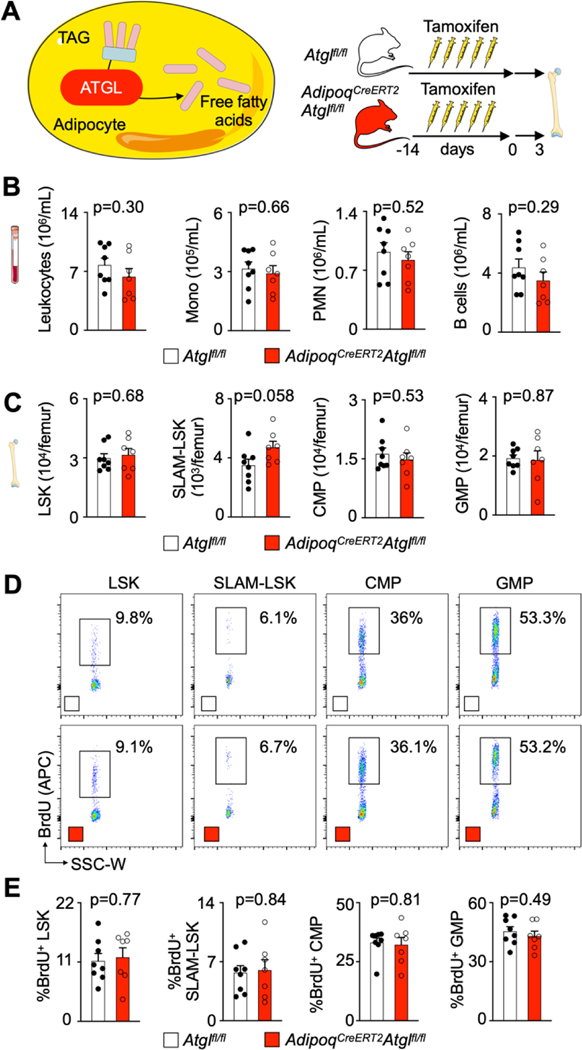
To causally test whether lipids from adipocytes are required for myelopoiesis acceleration after MI, we conditionally deleted Pnpla2 gene encoding adipose triglyceryl lipase (ATGL) from adipocytes in AdipoqCreERT2Atglfl/fl mice. Without this enzyme, adipocytes cannot undergo lipolysis or provide fatty acids to other cells36. In agreement with a prior report21, adult AdipoqCreERT2Atglfl/fl mice had blood leukocyte and bone marrow HSPC numbers comparable to Atglfl/fl controls (Extended Data Fig. 5A–C). A BrdU incorporation assay revealed unchanged HSPC proliferation rates in AdipoqCreERT2Atglfl/fl mice in the steady state (Extended Data Fig. 5D,E). After MI, bone marrow adipocytes were larger in AdipoqCreERT2Atglfl/fl mice compared to Atglfl/fl control mice with MI (Extended Data Fig. 6A,B). Blood leukocyte and bone marrow HSPC numbers were lower in AdipoqCreERT2Atglfl/fl mice with MI compared to Atglfl/fl control mice with MI (Fig. 5A,B; Extended Data Fig. 6C,D). Post-MI, HSPC also proliferated at lower rates in mice with deficient adipocyte lipolysis (Fig. 5C,D). Consequently, monocyte and neutrophil recruitment into the infarcted myocardium declined in AdipoqCreERT2Atglfl/fl mice (Extended Data Fig. 6E,F). These data, which align with the function of Atgl during caloric restriction21, indicate that lipolysis in adipocytes supports emergency hematopoiesis in mice after MI.
Fig. 5 |. Fatty acids from bone marrow adipocytes are required for increased myelopoiesis after myocardial infarction.
A, Quantification of blood leukocytes, monocytes and neutrophils (PMN) by flow cytometry in Atglfl/fl controls and AdipoqCreERT2Atglfl/fl mice 3 days after MI (n=9 Atglfl/fl, n=8 AdipoqCreERT2Atglfl/fl, two-tailed Welch’s t test, three independent experiments). B, Quantification of bone marrow LSK, CMP and GMP by flow cytometry in Atglfl/fl controls and AdipoqCreERT2Atglfl/fl mice 3 days after MI (n=9 Atglfl/fl, n=7 AdipoqCreERT2Atglfl/fl, two-tailed Welch’s t test, three independent experiments). C, Flow plots and D, proliferation quantification of LSK, CMP and GMP in femurs of Atglfl/fl controls and AdipoqCreERT2Atglfl/fl mice 3 days after MI (n=9 Atglfl/fl, n=7 AdipoqCreERT2Atglfl/fl, two-tailed Welch’s t test, four independent experiments). Data are displayed as mean±SEM.
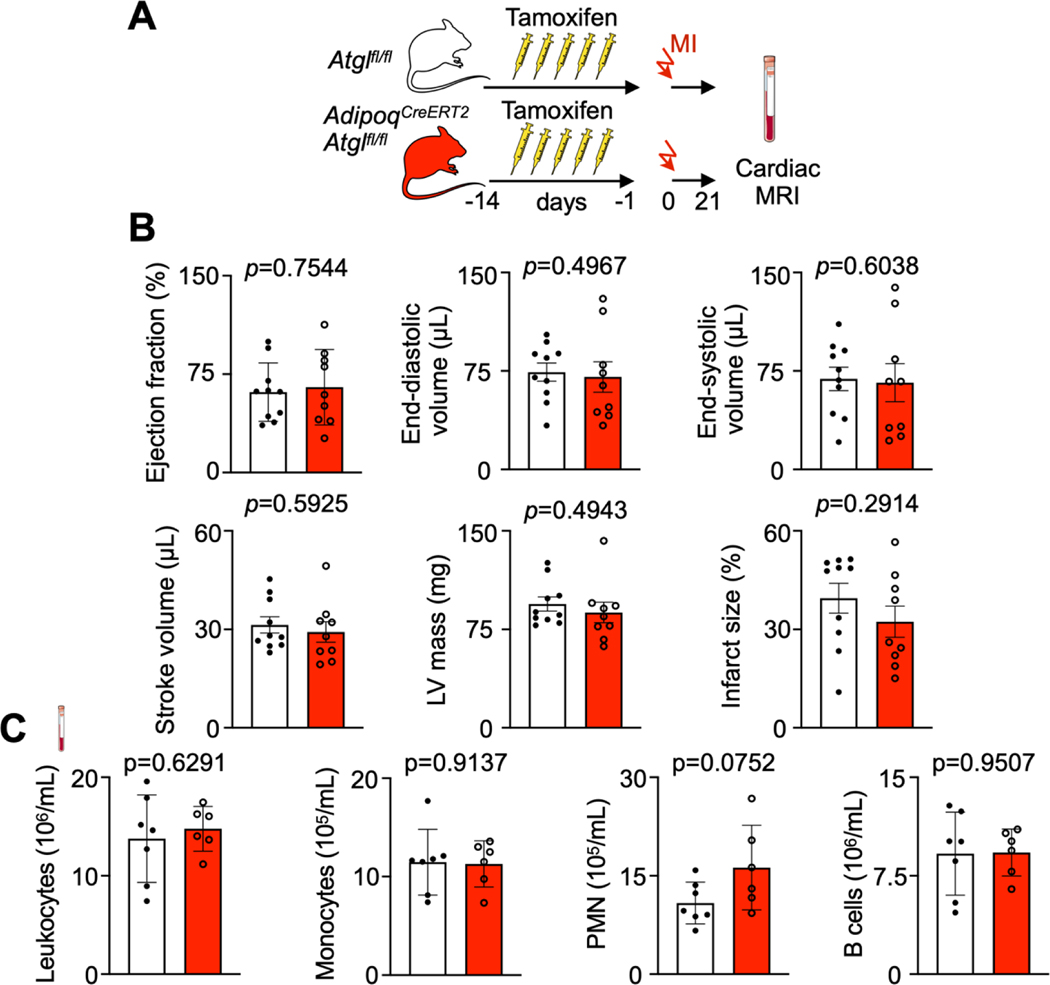
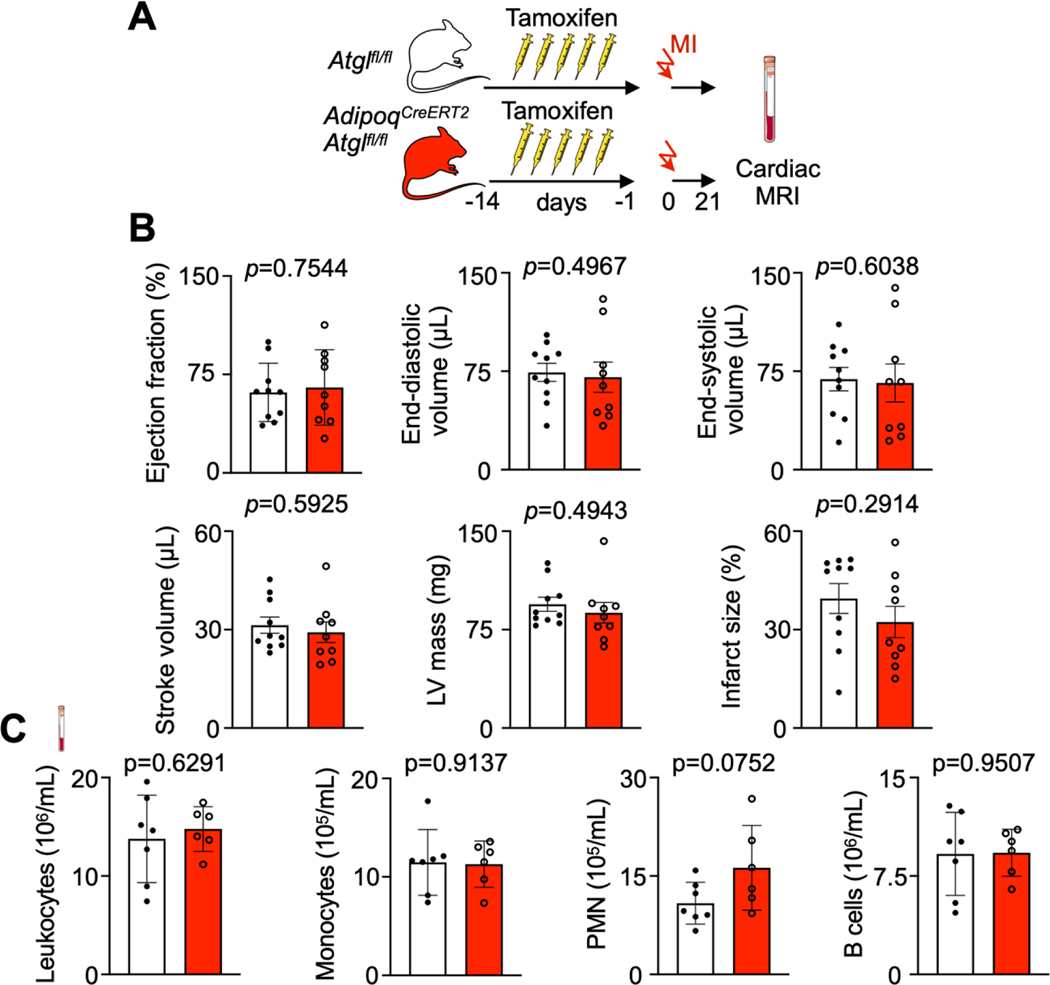
To evaluate the impact of Atgl deletion in adipocytes on development of post-MI heart failure, we performed a cardiac MRI three weeks after coronary ligation (Extended Data Fig. 7A). We observed no difference in the ejection fraction and left ventricular dilation, with similar infarct sizes (Extended Data Fig. 7B). Flow cytometry of circulating leukocytes AdipoqCre-ERT2 Atglfl/fl three weeks after MI (the time point we had chosen for MRI) indicated no differences compared to Atglfl/fl mice with MI (Extended Data Fig. 7C).
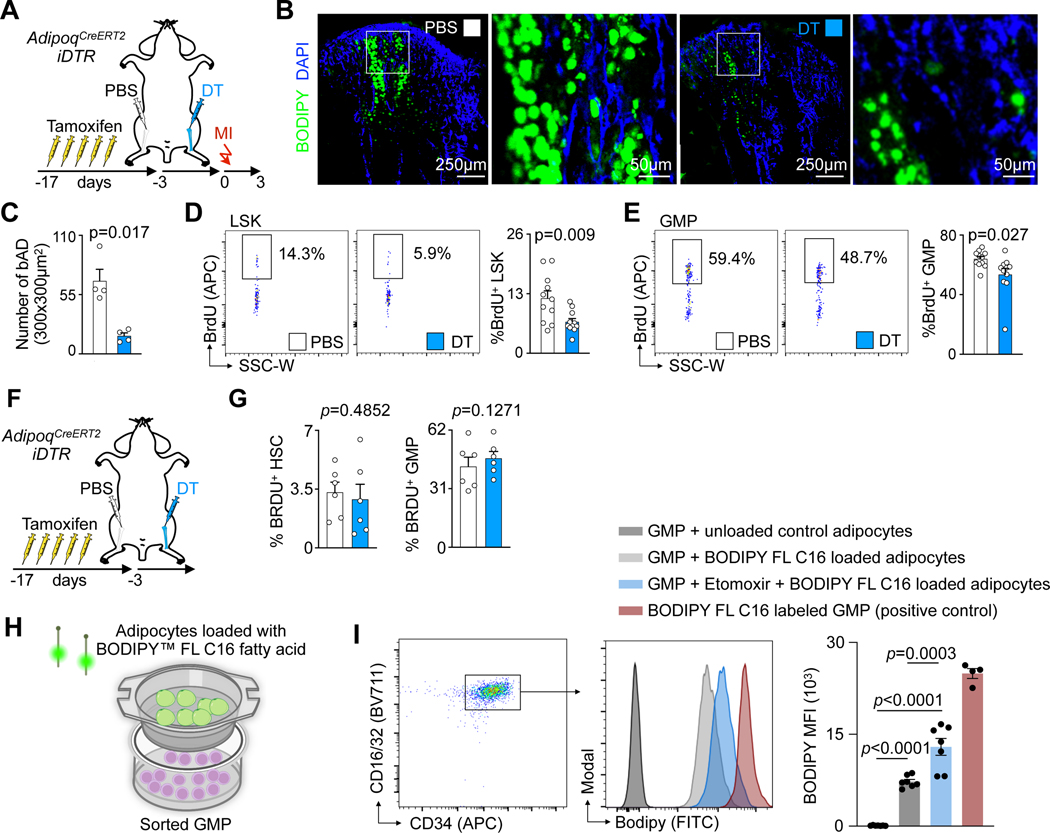
To distinguish the contributions of bone marrow adipocytes from adipocytes in other regions, we developed a strategy to regionally deplete adipocytes in the bone marrow only. We injected diphtheria toxin into the left tibia of AdipoqCreERT2iDTR mice, while the right tibia was injected with PBS and served as control (Fig. 6A). Confocal immunofluorescent imaging indicated that local depletion of bone marrow adipocytes occurred (Fig. 6B,C). 3 days after left tibial adipocyte depletion, we induced myocardial infarction. In the adipocyte-depleted tibia, post-MI LSK and GMP proliferation rates were lower than in the contralateral control tibia (Fig. 6D,E) while they were similar in mice without MI (Fig. 6F,G). This experiment’s limitations include that adipocyte death may trigger a local immune response that inhibits myelopoiesis via mechanisms unrelated to fatty acid oxidation. We then co-cultured bone marrow-derived adipocytes, which were first exposed to a fluorescently tagged fatty acid, with GMP. The fluorescently tagged fatty acid could be detected in GMP by flow cytometry, indicating that there was fatty acid transfer between both cell types. When GMP were also exposed to etomoxir, their fluorescence intensity rose, possibly because GMP were unable to oxidize fatty acids (Fig. 6H,I). Viewed together with our other findings, the data support that lipolysis in bone marrow adipocytes sustains local emergency hematopoiesis.
Fig. 6 |. Local depletion of bone marrow adipocytes leads to reduced emergency hematopoiesis.
A, Experimental design for single leg adipocyte depletion before MI. B, Immunofluorescence imaging of adipocytes in PBS- versus diphtheria toxin- (DT) injected tibias. C, Number of adipocytes in PBS- versus DT-injected tibias (n=4 mice, two-tailed paired t test, three independent experiments). D,E, Flow plots and proliferation quantification of LSK (D) and GMP (E) in PBS- versus DT-injected tibias 3 days after MI (n=11, two-tailed paired t test, three independent experiments). F, Experimental design for single leg adipocyte depletion. G, Proliferation quantification of HSC and GMP in non-MI mice (n=6, paired t test). H, Experimental design for in vitro FFA transfer experiment. I, Gating strategy, histogram, and quantification of BODIPY FL C16 in GMPs co-cultured with adipocytes (GMPs and adipocytes from n=4 mice for the positive control, n=7 for every other group, One-way ANOVA with Tukey’s multiple comparison tests, two independent experiments). Data are displayed as mean±SEM.
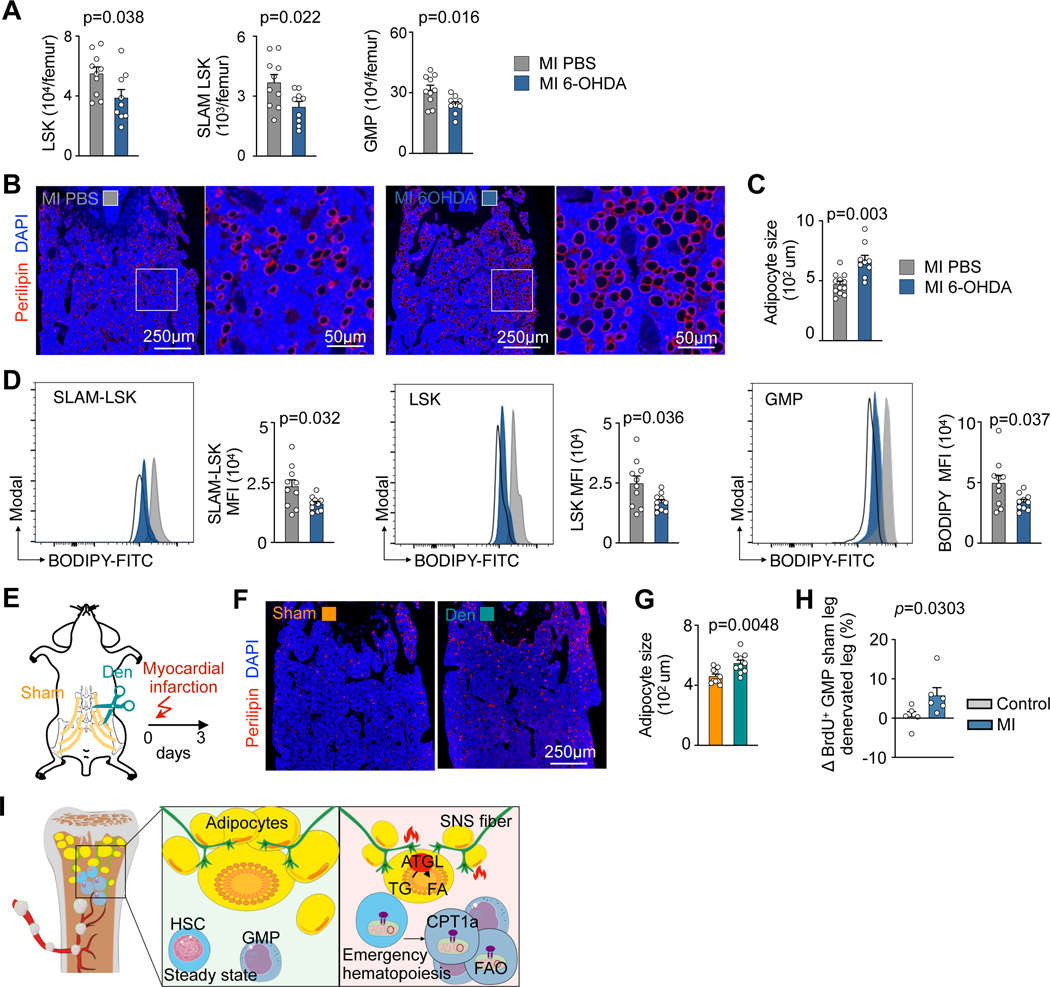
Finally, we investigated which signals induce lipolysis in bone marrow adipocytes. MI activates sympathetic nervous signaling (SNS) in the marrow5, and SNS induces lipolysis outside the marrow37. To investigate whether SNS leads to MI-induced shrinkage of bone marrow adipocytes, we first blocked peripheral SNS with 6-hydroxydopamine (6-OHDA). This treatment reduced HSPC numbers in the bone marrow after MI (Fig. 7A), increased bone marrow adipocyte size in mice with MI (Fig. 7B,C) and decreased HSPC lipid content after MI (Fig. 7D). To more specifically target the bone marrow SNS, we implemented a surgical single-leg denervation procedure by cutting the femoral nerve in close proximity to the iliac crest of the pelvis (Fig. 7E). This local intervention denervated the left femur’s bone marrow, while the right femur, which underwent nerve exposure only, was still innervated and could thus serve as control tissue. After MI, adipocytes were larger in the denervated femur (Fig. 7F,G). We also compared GMP proliferation in control mice and MI mice between the two legs (denervated versus sham leg). In control mice without MI, no differences in GMP proliferation were observed between the two legs. However, we observed higher GMP proliferation in the sham leg than in the denervated leg in the MI setting (Fig. 7H). In summary, these data suggest that the SNS governs MI-induced lipolysis in bone marrow adipocytes; however, perhaps systemic catecholamines, cytokine-related or metabolic mechanisms also contribute to adipocyte shrinkage.
Fig. 7 |. Sympathetic nerve fibers regulate the release of fatty acids from bone marrow adipocytes in response to myocardial infarction.
A, Quantification of LSK, SLAM-LSK and GMP in PBS versus 6-OHDA-treated mice 3 days after MI (n=10 mice PBS, n=9 6-OHDA, two-tailed Welch’s t test, four independent experiments). B, Immunofluorescence Perilipin staining and C, adipocyte quantification in controls versus 6-OHDA injected mice, all on day 3 after MI (n=12 PBS, n=9 6-OHDA, two-tailed Welch’s t test, four independent experiments). D, Flow cytometry histograms and quantification of lipid content in SLAM-LSK, LSK, and GMP in controls versus 6-OHDA treated mice, all 3 days after MI (n=10 PBS, n=10 6-OHDA, two-tailed Welch’s t test, four independent experiments). E, Experimental design of single leg denervation. F, Immunofluorescent staining of adipocytes in sham versus denervated femurs. G, Quantification of adipocyte size in sham denervated versus denervated femurs in mice on day 3 after MI (n=10, two-tailed paired t test). H, Difference in GMP proliferation between the two legs (sham leg vs. denervated leg) in MI and control mice (n=5 control mice and n=6 MI mice, two-tailed Mann-Whitney test, four independent experiments) I, Graphical abstract. Data are displayed as mean±SEM.
Discussion
Our data suggest that fatty acid metabolism in HSPC supports emergency hematopoiesis, as blocking either adipocyte lipolysis or HSPC’s mitochondrial fatty acid importation reduced post-MI myelopoiesis. We also conclude that bone marrow adipocytes may act as a local energy resource during emergency hematopoiesis. The precise relative contribution of bone marrow adipocytes vis-a-vis other lipid sources remains to be determined since we did not yet use a new mouse cre line that targets bone marrow adipocytes only21. Further, sympathetic nervous signaling augments lipid release from bone marrow adipocytes, raising the question whether beta blockers, which are used in patients with MI, interfere with bone marrow lipolysis. Together, our results reveal a critical interaction of the autonomic nervous system with the bone marrow that metabolically supports hematopoiesis expansion.
After transplantation, HSC maintenance and self-renewal depends on the transcription factor HIF-1α38, a master regulator which promotes a metabolic shift towards glycolysis in quiescent HSC39. However, the importance of mitochondrial metabolism in HSPC, particularly for HSC differentiation into GMP, remains less certain. Loss of mitochondrial complex III subunit results in anemia, prenatal death and impaired quiescence of adult HSC30. Moreover, deleting PPARδ, a positive regulator of fatty acid oxidation, decreases asymmetric HSC division14, suggesting that fatty acid oxidation is required for hematopoiesis and for preserving an undifferentiated HSC pool. Previous studies also indicated that fatty acid metabolism supports the immune response40 and leukemogenesis40,41. We here extend this knowledge to emergency hematopoiesis after MI. In addition to providing ATP, fatty acid oxidation may generate metabolites that exert control over HSPC function, perhaps via epigenetic mechanisms such as histone acetylation42,43. Future studies are needed to explore if CD36 regulates HSPC uptake of fatty acids after MI, as reported after infection44.
Emerging data support that hematopoietic activity distributes heterogeneously across the skeleton and even varies between meta- and diaphysis of individual long bones32. In conjunction with lower HSC abundance in adipocyte-rich mouse tail vertebra, increased HSPC expansion in fatless FVB A-ZIP/F mice tail vertebrae post-irradiation45 had suggested that bone marrow adipocytes inhibit hematopoiesis or simply occupy areas vacated by hematopoietic cells. However, in long bones, A-ZIP/F1 fatless mice experience delayed hematopoietic regeneration, and adipocyte-specific Scf deletion inhibits hematopoietic regeneration after irradiation23. This indicates that adipocytes’ roles in hematopoiesis are region and context specific. Proximal “regulated” marrow adipose tissue may promote hematopoiesis whereas distal “constitutive” adipocytes have less impact32. This notion is consistent with our data showing decreased proximal adipocyte size and numbers in response to MI, while distal adipocytes were less affected.
We followed post-MI heart failure development by cardiac MRI in Vav1Cre/+Cpt1afl/fl and in AdipoqCreERT2Atglfl/fl mice. These two trials showed a similar degree of heart failure in knockouts and in controls. In Vav1Cre/+Cpt1afl/fl mice, mitochondrial fatty acid uptake is not only disrupted in HSPC but also in downstream leukocytes that derive from these progenitors, including macrophages that are recruited to the heart. Thus, the effector cells responding to ischemia have a compromised metabolism. Fatty acid oxidation is linked to phagocytosis46. We speculate that Cpt1a gene deletion modulated leukocyte functions, which may have neutralized the effects of reduced emergency hematopoiesis. Another possible explanation for our observation of neutrality is that emergency hematopoiesis subsides a few days after MI5, but the post-MI remodeling process takes weeks. Hematopoiesis during later disease stages is likely influential for the final outcome. That we found comparable blood leukocyte numbers three weeks after MI argues in favor of this hypothesis.
We here report that bone marrow adipocytes support fatty acid metabolism in HSPC (Fig. 7I). These data were obtained in the setting of a clinically relevant challenge—myocardial infarction—in mice without pre-existing metabolic disorders. Our observations raise the question whether hyperlipidemia, obesity, diabetes or advanced age, which all alter adipocyte numbers, phenotypes47,48, metabolism, hematopoiesis and cardiovascular risk, influence interactions between HSPC and bone marrow adipocytes. Aligning with this argument, inflammatory cytokines arising from peripheral fat enhance myelopoiesis in obese and diabetic mice49,50. Red marrow expansion in humans with heart failure has been reported more than 70 years ago51. Understanding HSPC metabolism may provide therapeutic opportunities to limit the myeloid cell expansion that propels disease in many experimental systems1,2,8 and associates with cardiovascular mortality in patients12.
Methods
All the research performed complies with relevant ethical regulations. The mouse studies were approved by the Institutional Animal Care and Use Committee at Massachusetts General Hospital, protocol number 2005N000306. The swine study was approved by the Animal Experimentation Unit Ethical Committee of the Germans Trias i Pujol Health Research Institute (IGTP) and Government Authorities (Generalitat de Catalunya; Code: 10558). It adhered to all the stipulated guidelines for the ethical use of animals in research and education, as outlined in the Guide for the Care and Use of Laboratory Animals [NIH (2011) Guide for the Care and Use of Laboratory Animals, 8th ed. National 860 Academies Press, Washington, D.C.. Human studies were performed following written informed consent in accordance with the Declaration of Helsinki and after approval by the institutional review boards of the Massachusetts General Hospital, the VUmc Hospital, the University Hospital Germans Trias I Pujol, and the HEBE trial. The patients did not receive compensation.
Mice
Wild-type C57BL/6J (000664), B6.Cg-Commd10Tg(Vav1-icre)A2Kio/J (Vav1Cre/+, stock 008610), B6N.129S-Pnpla2tm1Eek/J (Atglfl/fl, stock 024278), C57BL/6-Tg(Adipoq-icre/ERT2)1Soff/J ( AdipoqCreERT2,stock 025124) and C57BL/6-Gt(ROSA)26Sortm1(HBEGF)Awai/J (iDTR, stock 007900) mice were purchased from The Jackson Laboratory. Cpt1afl/fl mice were gifted by Dr. Peter Carmeliet and generated as described previously52. Twelve- to sixteen-week-old female mice were used for experiments. Mice were housed on a 12:12-hour day:night cycle with access to normal chow (Labdiet 5P76) and water. The room temperature was 221±°C, with 31% humidity. All transgenic mice were routinely genotyped before use. Where appropriate, animals were randomly assigned to interventions. Investigators were not blinded to group allocation during experiments and outcome assessment for some experiments. Mice received isoflurane (3–4% induction; 1–2% maintenance) unless stated otherwise. To activate the Cre/loxP system, Adipoq-cre/ERT2 mice were treated with tamoxifen (75 mg/kg body weight, dissolved in corn oil) via i.p. injections. A total of 6 injections over two weeks prior experiment were performed. Many studies were done in female mice given their higher bone marrow adipocyte content. All animals were handled according to the regulations for experimental animals by Massachusetts General Hospital.
Surgery procedures and treatments
Myocardial infarction.
Coronary ligation to induce myocardial infarction was performed as described previously53. In brief, mice were anesthetized with 2% isoflurane, intubated and ventilated. A left thoracotomy was then performed at the third or fourth intercostal space to visualize the heart. The left anterior descending coronary artery was permanently ligated with a monofilament nylon 8.0 suture. The thoracic cage was closed with a 5.0 monofilament suture.
Intratibial injection.
Mice were injected with buprenorphine (0.08 mg/kg SC) 30 minutes before the procedure, then anesthetized with isoflurane (3% induction, 1,5% maintenance). Hair around the knee joint was shaved. After iodine and 70% alcohol disinfection, a 25G needle was used to drill a hole into the tibia, through which 10 ng diphtheria toxin dissolved in 10 μl 0.9% sterile saline was slowly injected using an insulin syringe.
Local denervation.
Single-leg (left) femoral bone marrow denervation was performed by transecting femoral nerves in mice anesthetized with a mixture of ketamine (90 mg/kg) and xylazine (10 mg/kg). Mice were positioned in prone position on a heated operating table and hair was removed prior to an incision into the psoas muscle to reveal the femoral nerve. Using sharp scissors, the muscle was carefully separated from the femur, exposing the sciatic nerve in close proximity to the iliac crest of the pelvis. Following the sciatic nerve’s course, the femoral nerve was identified. A 5-mm section of the femoral nerve was excised for the denervation procedure. Then the incision in the muscle was sutured with 8/0 resorbable thread and the skin sutured with 6/0 resorbable thread. A sham control operation involved gaining surgical access to the femoral and sciatic nerves of the right leg, but the nerve was left intact.
Injections.
Mice were treated with 6-OHDA (250 mg/kg body weight) in a final volume of 100 μl one day before experiments commenced. For glucose uptake measurements, mice were injected IV with 150 μl of 2-NBD glucose, dissolved in DPBS at a concentration of 5 mM, 45 min before euthanasia. For targeted metabolomics, mice were injected IV with 21 nmol/g bodyweight of 13C16 palmitate (Sigma-Aldrich) 30 min before organ harvest. For the injection, a palmitate stock solution of 200 mM in pure ethanol was diluted to 4.2 mM with 10% bovine serum albumin (BSA) in 0.9% sodiumchloride (BSA Fraction V, fatty acid-poor and endotoxin-free, Sigma-Aldrich).
Osmium Tetroxide μCT.
Marrow adipose tissue was stained with osmium tetroxide and quantified with μCT as previously described54. Briefly, the tibiae were demineralized in 4.1% EDTA, pH 7.4, for 21 days. The demineralized tibiae were washed with cold tap water and then incubated in a 1% osmium teroxide/2.5% potassium dichromate solution at room temperature for 48 hours on an orbital shaker. Next, the tibiae were washed in cool tap water for 2 h to remove unbound osmium tetroxide and then transferred to fresh tubes containing phosphate-buffered saline. The osmium tetroxide-stained tibiae were then imaged using the Scanco μCT40 scanner (Scanco Medical AG, Brüttisellen, Switzerland). Whole-tibia scans were acquired using a 10 μm3 isotropic voxel size, 55 kVp peak x-ray tube potential, 145 μA x-ray intensity, 300 ms integration time and were subjected to Gaussian filtration and segmentation. To measure the MAT volume relative to the marrow volume in two regions of the tibia, the outside of the entire tibia was countered in the scans of both the mineralized and the demineralized/osmium tetroxide-stained bone. The contoured region in the mineralized scan was then analyzed with a segmentation threshold of 400 mgHA/cm3 to quantify the bone volume, total volume and marrow volume (MV = total volume – bone volume) within each region. MAT volume was then analyzed in the corresponding regions in the scan of the osmium tetroxide-stained bone. Segmentation thresholds equivalent to 900 mgHA/cm3 and 1600 mgHA/cm3 were used to segment MAT (positive osmium tetroxide staining) in the proximal region (superior to the distal tibiofibular junction) and distal region (distal to the distal tibiofibular junction) of the tibia, respectively.
MRI.
Cardiac magnetic resonance imaging (MRI) was performed 21 d after coronary ligation to assess ejection fraction and left ventricular volumes. MRI short-axis views of the entire left ventricle were acquired on a Bruker 4.7 Tesla PhamaScan magnet (Billerica) with a cine fast low-angle shot sequence using intraGate technology. The left ventricular wall and cavity were segmented manually at systole and diastole using Horos software (https://horosproject.org).
Bone marrow transfer and in vivo imaging.
Lin- cKit+ Sca1+ cells were FACS sorted and labeled with Vibrant™ DiD cell-labeling solution for 15 min at 37 °C according to the manufacturer’s instructions. 3 × 10⁴ LSK and 2 × 10⁵ supportive bone marrow cells were transplanted into each mouse. 48 hours after LKS cells injection, myocardial infarction was induced. Three days after myocardial infarction, mice were euthanized and femurs were harvested. Before sacrifice, mice received intravenous injections of Osteosense® 750EX (4nmol/mouse, Perkin Elmer) and anti-mouse CD31-AF647 (5 μg/mouse, 1:10 in PBS) antibodies in 100 μl of sterile PBS. The femurs were shaved open to expose the marrow and stained with BODIPY for 15 mins before imaging with an Olympus IV100 microscope.
Swine
Ten Landrace × Large White pigs (42±4.2 kg) underwent MI induction through coronary coil deployment in the first marginal branch of the circumflex coronary artery as described previously55. All animals were 4 months old at the time of the experiment, and 70% were female.
Anaesthesia and analgesia.
Pigs were sedated with an intramuscular (IM) injection of atropine (0.04 mg/kg; BBraun, Barcelona, Spain) and pre-anesthetized with dexmedetomidine (0.03 mg/kg, IM; Dexdor, Orion Pharma, Espoo, Finland), midazolam (0.3 mg/kg, IM; Laboratorios Normon, Barcelona, Spain), and butorphanol (0.3 mg/kg, IM; Butomidor, Richter Pharma AG, Wels, Austria). Anesthetic induction was achieved with an intravenous (IV) bolus of propofol (2 mg/kg; Propovet, Zoetis, Barcelona, Spain). Animals underwent endotracheal intubation, and anesthesia was maintained with 2% isoflurane (IsoVet, BBraun), inhalation. Fentanyl (0.075 mg/kg/45 minutes, IV; Fentadon, Dechra, Bladel, The Netherlands) was given during intervention. At the beginning of the surgical procedure, a 1 mg/kg lidocaine bolus (IV, Lidocaína® 2%, B. Braun) was administered, followed by a continuous infusion (1 mg/kg/h) that was maintained for 1 h after MI induction. Finally, an IM dose of 2.5 mg/kg tulathromycin (Draxxin®, Pfizer Animal Health) was administered as a post-operative antibiotic and a transdermal fentanyl patch was applied for analgesic post-operative care (Fentanilo Matrix STADA®, STADA, Sant Just Desvern, Barcelona, Spain). All surgery procedures were done under monitoring conditions with electrocardiogram (ECG) registration and measures of capnography, non-invasive and invasive arterial blood pressure, pulse oximetry, and temperature.
Coil deployment.
After engaging the left main artery using a 6-F JR4 guide catheter, a left lateral MI was experimentally induced by percutaneous embolization coil deployment (VortX-18 Diamond 3 mm/3.3 mm coil, Boston Scientific/Target) in the first marginal branch of the circumflex artery under continuous fluoroscopy. In all cases, complete thrombotic occlusion (TIMI flow score = 0) was confirmed by coronary angiography 10–15 min after coil implantation.
Sample collection.
We obtained 2 cm length long core samples at baseline and 10-days post-MI BM biopsies from the iliac crest of 10 animals. When the core specimen was obtained, a blunt stylet was inserted through the distal end of the biopsy needle to expel the core from the proximal end of the biopsy needle onto a glass slide. Touch imprints were also obtained from the biopsy prior to placing in fixative. Imprints were made by gently touching the fresh unfixed core on the slide. Both the core specimen and the imprints were fixated in 10% buffered formalin overnight as previously reported56,57. After fixation, the biopsy specimens were embedded in paraffin blocks and 5 μm sections cut on a microtome as per the same protocol of the human samples.
Human samples
Vertebral density measurements in patients with MI.
The study was IRB approved and HIPAA compliant. A retrospective search was performed to identify patients who had undergone coronary CT angiography to evaluate a complaint of acute chest pain or possible acute coronary syndrome in the emergency department at our institution between 2013 and 2016. All patients were scanned on 128- or 192-slice dual-source CT scanners (Somatom Definition Flash or Somatom Force, respectively, Siemens Healthineers, Forcheim, Germany) using the same protocol: 120 kV and 3 mm thickness reconstructions with a reference peak tube current of 280 mA. Non-contrast scans that included thoracic vertebral bodies were used for the analysis. Patients with conditions or medication use that may affect bone metabolism were excluded from the study. Patients with acute myocardial infarction (MI) and patients in which MI was ruled out (controls), which were matched for sex (6 females and 5 males in each group) and age (55.5 (±10.8) years old in MI group vs. 54.6 (±10.6) in control). Vertebral density measurements were performed on CT images using manually placed circular regions of interest within the T8 vertebral body, comprising marrow and trabecular bone. The mean density of each vertebral body was determined in Hounsfield Units (HU).
Human thoracic vertebral body tissue collection.
Thoracic vertebral body tissue (bone marrow) specimens were collected from patients who were referred to the Department of Pathology, VU University Medical Center (VUmc), Amsterdam, The Netherlands between 1997–2011. Autopsy was performed within 24 hours after death. Acute myocardial infarction in 14 patients was verified with lactate dehydrogenase and leukocyte staining of myocardial tissue (ranging from day 1–14 after MI)58. Mean age was 64.4 (±8.6). From each patient, a tissue sample from a thoracic vertebral body was collected. Control thoracic vertebral body tissue specimens were obtained from 9 patients who died from a cause not related to myocardial infarction and thus with normal myocardial lactate dehydrogenase staining. Mean age was 61.1 (±16.3). Patients with evidence for pulmonary embolism, myocarditis or sepsis were excluded. Tissue specimens were formalin fixed and paraffin embedded for immunohistochemical analyses. Use of patient material after completion for the diagnostic process is part of the patient contract in the VUmc hospital, Amsterdam, The Netherlands.
Human sternal bone tissue collection.
Bone marrow samples were obtained during surgical procedures from sternum in patients following written informed consent after approval by the Institutional Review Board (IRB) of University Hospital Germans Trias i Pujol (CEIm; IRB00002131). Sixteen patients were recruited for this study. Mean age was 62.5 (±9.34), mean days after MI for the patients is 6.0 +/− SEM 0.972, and 12 were males (75%). Post-myocardial infarction (MI) patients (n=11) presented mainly with non-ST elevation segment MI (NSTEMI; 9) and were admitted for coronary artery bypass graft (CABG) surgery. Control patients were defined to not have cardiac ischemic injuries nor endocarditis and being elective for cardiac surgery. Five control patients were enrolled, matched by age and gender, diagnosed with aortic stenosis and admitted for aortic valve replacement procedures. All patients were PCR-tested for SARS-COV-2 previous to surgery. Sample collection in post-MI patients was performed between day 2 and day 10 after diagnosis of NSTEMI or ST elevation MI (STEMI). At the surgeon criteria, BM samples were obtained by gently collecting tissue discards originated during the cutting of the sternal bone to access the heart for the specific surgery and before using medical sterile bone wax to control for bleeding. All tissue samples were immediately submerged in formalin after extraction using the BiopSafe® Biopsy Sample System (Merit Medical Systems, UT). BM samples were fixated for 4–6 h at room temperature (RT), after which the formalin solution was renewed, and stored overnight at 4 °C. Samples were washed 3 times in 1x PBS for 1 hour at RT and processed for paraffin embedding in a RNase-, DNase-, and protease-free environment. Paraffin blocks were sectioned at a thickness of 5microns and mounted on positively charged slides.
Human iliac crest bone marrow collection.
Bone marrow was aspirated from the iliac crest between 3–6 days after myocardial infarction from 8 patients who participated in the HEBE trial (Netherlands Trial Register, #NL132/www.trialregister.nl, and the International Standard Randomized Controlled Trial, #ISRCTN95796863/http://isrctn.org)59. The BMMC suspension was prepared using density gradient centrifugation. Mean age was 59.1 (±7.6) and 87.5% were male. The study protocol was approved by Institutional Review Boards of the participating center of the HEBE trial. All patients gave informed consent.
Cell sorting and flow cytometry
Cell collection.
Bone marrow cells were collected by flushing bones with PBS, after which a single-cell suspension was created by passing cells through a 26-gauge needle. Red blood cells were lysed with RBC lysis buffer. Peripheral blood was collected by retro-orbital bleeding and red blood cells were lysed in RBC lysis buffer (Biolegend). For adipocyte isolation, bone marrow cells were centrifuged 7 min at 100 G to separate adipocytes (floating cells) from the remaining bone marrow.
Flow cytometry.
Single-cell suspensions were stained in PBS supplemented with 2% FBS and 0.5% BSA. Blood leukocytes and bone marrow leukocytes were stained with Ly6G-FITC, CD11b-PE, CD3-PerCP/Cy5.5, CD115-BV421, Ly6C-BV605, CD8a-BV711, CD4-AF700, CD45.2-APC, CD45.1-PE/Cy7, CD19-APC/Cy7, B220-APC/Cy7, NK1.1-APC/Cy7 (1:600) and LIVE/DEAD™ Fixable Aqua Dead Cell Stain Kit (L-34957, Life Technologies, 1:300). Hematopoietic progenitor stem cells were first stained with biotin-conjugated anti-mouse antibodies cocktails including CD3, CD4, CD8a, CD90.2, CD19, B220, NK1.1, TER119, CD11b, CD11c, Gr-1 (1:300) and LIVE/DEAD™ Fixable Aqua Dead Cell Stain Kit (1:300). Secondary staining used a cocktail of CD34-FITC, CD150-PerCP/Cy5.5, c-kit-PE/Cy7, CD48-AF700, Sca-1-BV605, CD16/32-BV711 and streptavidin-APC/Cy7(1:150). Brdu samples were stained with APC BrdU Flow Kit (552598, BD Biosciences) following the manufacturer’s protocol..
The SCENITH protocol was performed as previously described60. Briefly, after collection, cells were split in 5 tubes respectively and incubated for 45 min with control, 2-deoxy-d-glucose (DG, 100mM), oligomycin (O,1μM), or a sequential combination of the drugs (DGO). Harringtonine (2 μg/ml) treatment was used as a negative control. Puromycin (10 μg/ml) was added during the last 30 minutes of the metabolic inhibitor treatment. Cells were washed and stained with a combination of Fc receptor blockade and fluorescent cell viability marker, followed by the hematopoietic progenitor stem cell staining described above. After washing, cells were fixed and permeabilized using FOXP3 fixation and permeabilization buffer (Thermofisher eBioscience™). Intracellular staining of puromycin (Puromycin-AF647, 1:50) was performed by incubating cells for 1 hour at 4°C diluted in permeabilization buffer. The percentages of glucose dependence and fatty acid oxidation capacity were calculated using the mean fluorescence intensity (MFI) values of AF647 with the following formula:
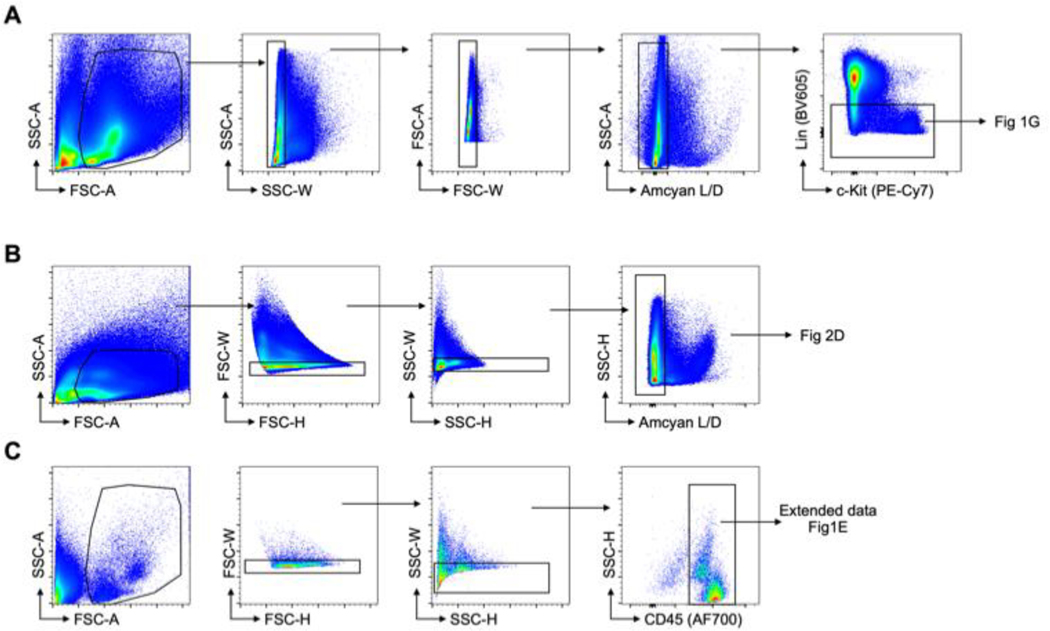
A LSRII flow cytometer was used for data acquisition and FlowJo 10 was used for data analysis. Gating strategies for different organs are detailed in Extended Data Fig. 8.
Cell sorting.
Bone marrow cell suspensions were stained to identify the indicated cell populations and cells were sorted on a FACS Aria II cell sorter (BD Biosciences) directly into collection medium. All cell-sorting experiments were performed using an Aria Cell Sorter (BD Biosciences).
Fatty acid transfer.
After isolation, adipocytes were incubated with BODIPY FL C16 at 5μM in DMEM supplemented with 0.5% BSA for 6 h. Adipocytes were then washed twice before co-culture with sorted GMP using a 0.4 μm tissue culture insert. After 12 hours of co-culture, BODIPY FL C16 in GMP was assessed by flow cytometry.
RNA sequencing
Total RNA isolated from sorted GMP on day 2 after MI (n=3 mice with coronary ligation, n=3 naive control mice) was subjected to polyA selection, followed by NGS library construction using the NEBNext Ultra Directional RNA Library Prep Kit for Illumina (New England Biolabs, Ipswich, MA, USA). Sequencing was performed on an Illumina HiSeq 2500 instrument, resulting in 25–35 million paired‐end 50 bp reads per sample. Library preparation and sequencing was performed by the MGH NextGen Sequencing Core. Salmon61 was used to perform transcript quantification from the RNA sequencing reads. Gene-level count data were then generated with tximport62. Differential gene expression analysis was carried out with DESeq263. Gene set enrichment analyses64 were performed using the log2 (fold change) from the differential expression as the ranking metric, with the “weighted” option for the enrichment score. The published software packages Salmon v0.13.061, tximport v1.10.162, DESeq2 v1.22.263, and GSEA v3.064 were used for RNA-seq data analysis.
Metabolomics
Sample preparation.
Mice were intravenously injected with 21 nmol/g bodyweight 13C16 palmitate (Sigma-Aldrich) and sacrificed 30 min later. 300,000 bone marrow GMP were flow sorted per mouse and immediately fixed in 80% methanol. Samples were stored at −80C and transferred to the mass spectrometry facility on dry ice.
Cell extractions.
Methanol and chloroform was added to cells fixed in methanol in adequate volumes to reach a 6 ml resuspension in methanol:chloroform (1:3). Samples were incubated for 10 min in an ultrasound bath. Phase separation was initiated by adding 2ml of water. Samples were then vortexed and incubated another 10 min in an ultrasound bath. After centrifugation at 4500g for 20 min, the aqueous supernatant was transferred to new vials and dried under nitrogen flow. The dried upper phase was resuspended in 100ul of 70% acetonitrile in water and transferred to a glass microinsert. Ten microliters of each sample were combined into a pool sample for MS/MS runs. All samples were then dried down and resuspended in 1/5 of their original resuspension volume to concentrate them further.
Quantification and internal standards.
For quantification of targeted metabolites, 1ml of the methanol added in the extraction (see above) was replaced with 1ml of methanol + a mix of fully labelled amino acid mix at 250 nM (fully 13C and 15N labelled, MSK-A2 from Cambridge Isotopes Laboratories). A standard curve for the target was also prepared using the same methanol + internal standard solution and used to quantify the targets.
Liquid chromatography-mass spectrometry (LC-MS).
Samples were analyzed by LC-MS on a Vanquish LC coupled to an ID-X MS (Thermofisher). Five μL of sample was injected on a ZIC-pHILIC peek-coated column (150 mm x 2.1 mm, 5 micron particles, maintained at 40 °C, SigmaAldrich). Buffer A was 20 mM Ammonium Carbonate, 0.1% Ammonium hydroxide in water, and Buffer B was Acetonitrile 97% in water. The LC program was as follows: starting at 99% B, to 40% B in 17 min, then to 0% B in 10 min, maintained at 0% B for 5 min, then back to 99% B in 4 min and re-equilibrated at 99% B for 11 min. The flow rate was maintained at 0.15 mL min−1. Data were acquired on the ID-X in switching polarities at 250000 resolution, with an AGC target of 1e5 and a m/z range of 65 to 1000. The pool sample was analyzed with the AquireX Deepscan workflow in positive and negative modes separately, using a solvent sample as the original blank for an exclusion list and the pool sample for the original inclusion list. The automated targeted MS/MS run was repeated three times.
Data analysis.
For metabolomics, data were analyzed using Compound Discoverer© (3.3 , Thermofisher). Compound identification to a level 2 was achieved using the MzCloud online database and to a level 1 with a local MzVault databases (including retention times). Each compound with an automatic library match was manually inspected for integration quality, MS/MS spectrum quality and match with the library. For isotopomers distribution and target quantification: Tracefinder (4.1, Thermofisher) was used to integrate the sum of all isotopomers m/z and to quantify the targets using the internal standards and standard curves. Isotopomers distribution was manually extracted from a non-saturated spectrum at or close to the top of the peak of each target. Raw data are presented in Supplementary Table 2.
Mitochondrial activity studies
Extracellular flux was measured using a Seahorse XFe96 Analyzer (Agilent) using Mito Stress Test kits according to the manufacturer’s instructions. Briefly, 120,000 GMP were plated in cellTak-treated XF96 plates in XF media (non-buffered DMEM 1640 containing 10 mM glucose, 2 mM L-glutamine and 1mM sodium pyruvate). The number of flow-sorted cells was similar for both experimental conditions, verified by hemocytometer counting. Respiration was measured in the basal state as well as in response to 2.5 μM oligomycin, 10μM FCCP and 2 μM rotenone with 2 μM antimycin A. The OCR was measured in a XF96 extracellular flux analyzer (Seahorse Bioscience). Basal mitochondrial respiration was assessed by subtracting the non-mitochondrial OCR from baseline OCR.
Histology and immunostaining
Mouse femurs and tibias were dissected, fixed in 4% paraformaldehyde and then decalcified in EDTA 20% with shaking at 4°C for 2 weeks. Femurs were embedded in paraffin, then sectioned longitudinally at 5 μm thickness. Tissue sections were stained with anti-Perilipin A antibody (P1998, Sigma, 1:500) followed by goat anti-rabbit IgG and streptavidin DyLight 594 (BA-1000 1:100 and SA-5594 1:600, Vector Laboratories). For immunofluorescent double staining, sections were first incubated with goat anti-Perilipin-1 antibody (ab61682, Abcam, 1:100), followed by secondary antibodies donkey anti-goat IgG AF594 (A-11058, ThermoFisher Scientific, 1:100) and donkey anti-rabbit IgG AF488 (A-21206, ThermoFisher Scientific, 1:100). Perilipin antibody (sc-390169, Santa Cruz Biotechnology, 1:50) and goat anti-mouse IgG AF488 (A-11029, Thermo Fisher Scientific, 1:100) were used for human tissue. Nuclei were stained with DAPI (D21490, ThermoFisher Scientific, 1:3000) and tissue images were either captured by using a digital scanner NanoZoomer 2.0RS (Hamamatsu, Japan) or acquired with a Nikon 80i (Nikon) and analyzed using ImageJ and MATLAB software.
Statistics
Statistical analyses were performed using GraphPad Prism 8 software (GraphPad Software, Inc.). Results are reported as mean ± standard error of the mean (s.e.m.). For a two-group comparison, normally distributed datasets underwent a parametric Welch’s t-test. For more than two group comparison, one way ANOVA was used.
Extended Data
Extended data Fig. 1 |. Glucose uptake capacity of bone marrow GMP post MI and baseline phenotype in Vav1iCre+Cpt1Afl/fl mice.
A, Representative flow cytometry plots, showing the gating strategy on GMP. B, Flow histograms and C, statistical analysis of 2-NBD glucose fluorescence in GMP isolated from naive controls and mice on day 1 and 3 post MI. Data are displayed as mean±SEM. (n=8 per time, Brown-Forsythe and Welsh Anova with Dunnett’s T3 multiple comparison, two independent experiments) D, Hematopoietic Cpt1a deficiency does not alter baseline leukocyte profile, Experimental design. E, PCR analysis of FACS-purified Vav+/+ and VavCre/+ for the presence of wildtype (Cpt1a+) and conditional undeleted (Cpt1afl) alleles. F, Gating strategy for blood leukocytes. G, Quantification of blood leukocytes in naive Cpt1afl/fl controls and Vav1iCre+Cpt1Afl/fl mice (n=8 Cpt1Afl/fl, n=8 Vav1iCre+Cpt1Afl/fl, two-tailed Welch’s t test, two independent experiments). H, Quantification of HSPC numbers and proliferation in naive Cpt1afl/fl controls and Vav1iCre+Cpt1Afl/fl mice (n=8 Cpt1Afl/fl, n=8 Vav1iCre+Cpt1Afl/fl, two-tailed Welch’s t test, two independent experiments). I, Representative flow cytometry plot, gating strategy on GMP and histogram for puromycin quantification. J, GMP glucose dependency and FAO capacity (n=5 Cpt1Afl/fl n=6 Vav1iCre+Cpt1Afl/fl, two-tailed unpaired t-test, two independent experiments). Data are displayed as mean±SEM.
Extended data Fig. 2 |. Hematopoietic Cpt1a deficiency reduces hematopoiesis.
A, Quantification of blood leukocytes in Cpt1afl/fl controls and Vav1iCre+Cpt1Afl/fl mice on day 3 after MI (n=6 Cpt1Afl/fl, n=7 Vav1iCre+Cpt1Afl/fl, two-tailed Welch’s t test, three independent experiments). B, Bone marrow SLAM-LSK numbers and proliferation and leukocyte numbers in Cpt1afl/fl controls and Vav1iCre+Cpt1Afl/fl mice on day 3 after MI (n=6 Cpt1Afl/fl, n=8 Vav1iCre+Cpt1Afl/fl, two-tailed Welch’s t test, three independent experiments). Data are displayed as mean±SEM. C, Gene essentiality (Chronos) scores for CPT1A (red curve) and F13B (blue, a control gene expressed in hematopoietic cells).
Extended data Fig. 3 |. Deletion of Cpt1a from HSPC and their progeny does not change post-MI outcomes 3 weeks later.
A, Experimental Outline. B, Left ventricular morphology and function measured by cardiac magnetic resonance imaging (MRI) 3 weeks after coronary ligation in Cpt1afl/fl controls and Vav1iCre+Cpt1Afl/fl mice (n=7 and 13, two-tailed unpaired t-tests, three independent experiments). Data are displayed as mean±SEM.
Extended data Fig. 4 |. Expanded proliferation of hematopoietic stem and progenitor cells in the adipocyte-rich metaphysis after myocardial infarction.
A, Quantification of adipocytes in femur diaphysis versus metaphysis (n=9 mice, two-tailed paired t test, three independent experiments). Data are displayed as mean±SEM.B, Immunofluorescent staining of adipocytes in femur. C, Flow plots of BrdU incorporation into GMP, LSK and SLAM-LSK in the femur diaphysis versus metaphysis in mice on day 3 after MI. D, Quantification of GMP, LSK and SLAM-LSK proliferation in femur diaphysis versus metaphysis (n=10 mice for diaphysis, n=10 mice for metaphysis, two-tailed Welch’s t test, three independent experiments). Data are displayed as mean±SEM E, Quantification of adipocytes number and size on indicated days after surgery (n=5–6 per time, One-way ANOVA with Tukey’s multiple comparison tests, two independent experiments) Data are displayed as mean±SEM F, Hematoxylin and eosin (H&E) stain for subcutaneous adipocytes in control mice and on day 3 after MI. G, Quantification of subcutaneous adipocyte size in control mice and on day 3 after MI (n=20 fields of view for 3control mice, n=20 fields of view for3 mice with MI, two-tailed Welch’s t test). Data are displayed as mean±SEM H, H&E stain for visceral adipocytes in control mice and on day 3 after MI. H, Quantification of visceral adipocyte size in control mice and on day 3 after MI (n=20 fields of view for 3 control mice, n=20 fields of view for 3 mice with MI, two-tailed Welch’s t test). Data are displayed as mean±SEM. J, Percentage of counted labeled cells in the respective distance range of a bone marrow adipocyte in control and MI mice (78 cells counted in control and 61 in MI mice, three independent experiments).
Extended data Fig. 5 |. Baseline hematopoiesis and leukocyte profile in AdipoqCreERT2Atglfl/fl mice.
A, Schematic depiction of ATGL-mediated lipolysis and experimental design. B, Quantification of blood leukocytes in Atglfl/fl controls and AdipoqCreERT2Atglfl/fl mice (n=8 Atglfl/fl, n=7 AdipoqCreERT2Atglfl/fl, two-tailed Welch’s t test, two independent experiments). C, Quantification of bone marrow SLAM-LSK, LSK, CMP and GMP numbers in Atglfl/fl controls and AdipoqCreERT2Atglfl/fl mice (n=8 Atglfl/fl, n=7 AdipoqCreERT2Atglfl/fl, two-tailed Welch’s t test, two independent experiments). D, Flow plots of Brdu incorporation into LSK, SLAM-LSK, CMP and GMP in Atglfl/fl controls and AdipoqCreERT2Atglfl/fl mice. E, Quantification of LSK, SLAM-LSK, CMP and GMP proliferation in Atglfl/fl controls and AdipoqCreERT2Atglfl/fl mice (n=8 Atglfl/fl, n=7 AdipoqCreERT2Atglfl/fl, two-tailed Welch’s t test, two independent experiments). Data are displayed as mean±SEM.
Extended data Fig. 6 |. Reduced hematopoiesis and myocardial myeloid cell content in AdipoqCreERT2Atglfl/fl mice.
A, Bone marrow adipocyte immunofluorescence images stained with perilipin-1 in Atglfl/fl versus AdipoqCreERT2Atglfl/fl mice 3 days after MI. B, Quantification of adipocyte size (n=4 Atglfl/fl, n=6 AdipoqCreERT2Atglfl/fl, two-tailed Welch’s t test, three independent experiments). C, Quantification of blood leukocytes in Atglfl/fl controls and AdipoqCreERT2Atglfl/fl mice 3 days after MI (n=9 Atglfl/fl, n=9 AdipoqCreERT2Atglfl/fl, two-tailed Welch’s t test, three independent experiments). D, Quantification of bone marrow leukocytes in Atglfl/fl controls and AdipoqCreERT2Atglfl/fl mice 3 days after MI (n=9 Atglfl/fl, n=9 AdipoqCreERT2Atglfl/fl, two-tailed Welch’s t test, three independent experiments). E, Flow plots of infiltrated leukocytes in the hearts of Atglfl/fl controls and AdipoqCreERT2Atglfl/fl. F, Quantification of macrophages, monocytes and neutrophils in the myocardium of Atglfl/fl controls and AdipoqCreERT2Atglfl/fl mice 3 days after MI (n=9 Atglfl/fl, n=9 AdipoqCreERT2Atglfl/fl, two-tailed Welch’s t test, three independent experiments). Data are displayed as mean±SEM.
Extended data Fig. 7. Deletion of Atgl from adipocytes does not change 3 week post-MI outcomes.
A, Experimental Outline. B, Left ventricular morphology and function measured by cardiac magnetic resonance imaging (MRI) 3 weeks after coronary ligation in Atglfl/fl controls and AdipoqCreERT2Atglfl/fl mice (n=9 and 10, Unpaired t-tests, two independent experiments). C, Quantification of blood leukocytes, monocytes, neutrophils (PMN) and B cells by flow cytometry 3 weeks after coronary ligation in Atglfl/fl controls and AdipoqCreERT2Atglfl/fl mice. (n=6 and 7, Unpaired t-tests). Data are displayed as mean±SEM.
Extended data Fig. 8. Flow cytometry gating.
A, Gating strategy for lineage negative cells, used to gate on LK and LSK in Figure 1G. B, Gating strategy for single live cell used for human HSPC gating. C, Gating strategy for blood leukocytes. The gating on specific cell types is detailed in extended data figure 1E.
Supplementary Material
Suppl. Table 1 | Differentially regulated genes ordered by ascending p-value in flow sorted bone marrow granulocyte-monocyte progenitors isolated from controls and mice on day 2 after myocardial infarction, as assessed by RNA-seq. A Wald test was performed and adjusted p value is adjusted for multiple multiple comparisons based on the Benjamini-Hochberg algorithm to control the false discover rate (FDR).
Suppl. Table 2 | Mass Spectrometry data for Figure 1F
Acknowledgements
This work was funded in part by U.S. federal funds from the National Institutes of Health (HL142494, HL139598, HL125428, NS108419 and T32HL076136), the MGH Research Scholar Program, the Deutsche Forschungsgemeinschaft (RO5071/1-1 for D.R. and SCHL 2221/1-1 for M.J.S.), the Italian Ministry of Health “Ricerca Corrente” and Siemens Healthineers. The authors thank the MGH Mouse Imaging Program for assistance with imaging, the Center for Skeletal Research Core (NIH P30 AR066261) for histological processing and micro-CT imaging, the HSCI-CRM Flow Cytometry Core for assistance with flow sorting, the Harvard Center for Mass Spectrometry for metabolomics, and Kaley Joyes (Center for system biology) for editing the manuscript. We acknowledge BioRender (BE261P1NT4) for the cartoon component.
M.N. has been a paid consultant or received research support from Takeda, Novartis, GSK, Medtronic, Verseaux, Sigilon, Alnylam, IFM therapeutics and Molecular Imaging Inc..
Footnotes
Competing interests statement
All other authors declare no conflicts of interest, financial or otherwise.
Data availability
The data were deposited in NCBI’s Gene Expression Omnibus and are accessible through GEO Series accession number GSE169267. The DepMAp public database was use for Extended data 2C.
References
- 1.Galkina E. & Ley K. Immune and inflammatory mechanisms of atherosclerosis (*). Annu Rev Immunol 27, 165–197 (2009). [DOI] [PMC free article] [PubMed] [Google Scholar]
- 2.Moore KJ & Tabas I. Macrophages in the pathogenesis of atherosclerosis. Cell 145, 341–355 (2011). [DOI] [PMC free article] [PubMed] [Google Scholar]
- 3.Patel AA et al. The fate and lifespan of human monocyte subsets in steady state and systemic inflammation. J Exp Med 214, 1913–1923 (2017). [DOI] [PMC free article] [PubMed] [Google Scholar]
- 4.Dutta P. et al. Myocardial Infarction Activates CCR2(+) Hematopoietic Stem and Progenitor Cells. Cell Stem Cell 16, 477–487 (2015). [DOI] [PMC free article] [PubMed] [Google Scholar]
- 5.Dutta P. et al. Myocardial infarction accelerates atherosclerosis. Nature 487, 325–329 (2012). [DOI] [PMC free article] [PubMed] [Google Scholar]
- 6.Nahrendorf M. et al. The healing myocardium sequentially mobilizes two monocyte subsets with divergent and complementary functions. J Exp Med 204, 3037–3047 (2007). [DOI] [PMC free article] [PubMed] [Google Scholar]
- 7.Sager HB et al. Proliferation and Recruitment Contribute to Myocardial Macrophage Expansion in Chronic Heart Failure. Circ Res 119, 853–864 (2016). [DOI] [PMC free article] [PubMed] [Google Scholar]
- 8.Swirski FK & Nahrendorf M. Cardioimmunology: the immune system in cardiac homeostasis and disease. Nat Rev Immunol 18, 733–744 (2018). [DOI] [PubMed] [Google Scholar]
- 9.Emami H. et al. Splenic metabolic activity predicts risk of future cardiovascular events: demonstration of a cardiosplenic axis in humans. JACC Cardiovasc Imaging 8, 121–130 (2015). [DOI] [PMC free article] [PubMed] [Google Scholar]
- 10.Engstrom G, Melander O. & Hedblad B. Leukocyte count and incidence of hospitalizations due to heart failure. Circ Heart Fail 2, 217–222 (2009). [DOI] [PubMed] [Google Scholar]
- 11.Ernst E, Hammerschmidt DE, Bagge U, Matrai A. & Dormandy JA Leukocytes and the risk of ischemic diseases. JAMA 257, 2318–2324 (1987). [PubMed] [Google Scholar]
- 12.Madjid M, Awan I, Willerson JT & Casscells SW Leukocyte count and coronary heart disease: implications for risk assessment. J Am Coll Cardiol 44, 1945–1956 (2004). [DOI] [PubMed] [Google Scholar]
- 13.Maekawa Y. et al. Prognostic significance of peripheral monocytosis after reperfused acute myocardial infarction:a possible role for left ventricular remodeling. J Am Coll Cardiol 39, 241–246 (2002). [DOI] [PubMed] [Google Scholar]
- 14.Ito K. et al. A PML–PPAR-δ pathway for fatty acid oxidation regulates hematopoietic stem cell maintenance. Nat Med 18, 1350–1358 (2012). [DOI] [PMC free article] [PubMed] [Google Scholar]
- 15.Takubo K. et al. Regulation of glycolysis by Pdk functions as a metabolic checkpoint for cell cycle quiescence in hematopoietic stem cells. Cell Stem Cell 12, 49–61 (2013). [DOI] [PMC free article] [PubMed] [Google Scholar]
- 16.Yu WM et al. Metabolic regulation by the mitochondrial phosphatase PTPMT1 is required for hematopoietic stem cell differentiation. Cell Stem Cell 12, 62–74 (2013). [DOI] [PMC free article] [PubMed] [Google Scholar]
- 17.Crane GM, Jeffery E. & Morrison SJ Adult haematopoietic stem cell niches. Nat Rev Immunol 17, 573–590 (2017). [DOI] [PubMed] [Google Scholar]
- 18.Pinho S. & Frenette PS Haematopoietic stem cell activity and interactions with the niche. Nat Rev Mol Cell Biol 20, 303–320 (2019). [DOI] [PMC free article] [PubMed] [Google Scholar]
- 19.Itkin T. et al. Distinct bone marrow blood vessels differentially regulate haematopoiesis. Nature 532, 323–328 (2016). [DOI] [PMC free article] [PubMed] [Google Scholar]
- 20.Naveiras O. et al. Bone-marrow adipocytes as negative regulators of the haematopoietic microenvironment. Nature 460, 259–263 (2009). [DOI] [PMC free article] [PubMed] [Google Scholar]
- 21.Li Z. et al. Lipolysis of bone marrow adipocytes is required to fuel bone and the marrow niche during energy deficits. Elife 11, (2022). [DOI] [PMC free article] [PubMed] [Google Scholar]
- 22.Zhang Z. et al. Bone marrow adipose tissue-derived stem cell factor mediates metabolic regulation of hematopoiesis. Haematologica 104, 1731–1743 (2019). [DOI] [PMC free article] [PubMed] [Google Scholar]
- 23.Zhou BO et al. Bone marrow adipocytes promote the regeneration of stem cells and haematopoiesis by secreting SCF. Nat Cell Biol 19, 891–903 (2017). [DOI] [PMC free article] [PubMed] [Google Scholar]
- 24.Virani SS et al. Heart Disease and Stroke Statistics-2020 Update: A Report From the American Heart Association. Circulation 141, e139–e596 (2020). [DOI] [PubMed] [Google Scholar]
- 25.Ito K. & Suda T. Metabolic requirements for the maintenance of self-renewing stem cells. Nat Rev Mol Cell Biol 15, 243–256 (2014). [DOI] [PMC free article] [PubMed] [Google Scholar]
- 26.Kohli L. & Passegué E. Surviving change: the metabolic journey of hematopoietic stem cells. Trends Cell Biol 24, 479–487 (2014). [DOI] [PMC free article] [PubMed] [Google Scholar]
- 27.Heyde A. et al. Increased stem cell proliferation in atherosclerosis accelerates clonal hematopoiesis. Cell 184, 1348–1361.e22 (2021). [DOI] [PMC free article] [PubMed] [Google Scholar]
- 28.Pang WW et al. Hematopoietic stem cell and progenitor cell mechanisms in myelodysplastic syndromes. Proc Natl Acad Sci U S A 110, 3011–3016 (2013). [DOI] [PMC free article] [PubMed] [Google Scholar]
- 29.Rohde D. et al. Bone marrow endothelial dysfunction promotes myeloid cell expansion in cardiovascular disease. Nat Cardiovasc Res 1, 28–44 (2022). [DOI] [PMC free article] [PubMed] [Google Scholar]
- 30.Ansó E. et al. The mitochondrial respiratory chain is essential for haematopoietic stem cell function. Nat Cell Biol 19, 614–625 (2017). [DOI] [PMC free article] [PubMed] [Google Scholar]
- 31.Dempster JM et al. Chronos: a cell population dynamics model of CRISPR experiments that improves inference of gene fitness effects. Genome Biol 22, 343 (2021). [DOI] [PMC free article] [PubMed] [Google Scholar]
- 32.Scheller EL et al. Region-specific variation in the properties of skeletal adipocytes reveals regulated and constitutive marrow adipose tissues. Nat Commun 6, 7808 (2015). [DOI] [PMC free article] [PubMed] [Google Scholar]
- 33.Shen W. et al. MRI-measured bone marrow adipose tissue is inversely related to DXA-measured bone mineral in Caucasian women. Osteoporos Int 18, 641–647 (2007). [DOI] [PMC free article] [PubMed] [Google Scholar]
- 34.Li Y, Meng Y. & Yu X. The Unique Metabolic Characteristics of Bone Marrow Adipose Tissue. Front Endocrinol (Lausanne) 10, 69 (2019). [DOI] [PMC free article] [PubMed] [Google Scholar]
- 35.Bani Hassan E. et al. Bone Marrow Adipose Tissue Quantification by Imaging. Curr Osteoporos Rep 17, 416–428 (2019). [DOI] [PubMed] [Google Scholar]
- 36.Schoiswohl G. et al. Impact of Reduced ATGL-Mediated Adipocyte Lipolysis on Obesity-Associated Insulin Resistance and Inflammation in Male Mice. Endocrinology 156, 3610–3624 (2015). [DOI] [PMC free article] [PubMed] [Google Scholar]
- 37.Zeng W. et al. Sympathetic neuro-adipose connections mediate leptin-driven lipolysis. Cell 163, 84–94 (2015). [DOI] [PMC free article] [PubMed] [Google Scholar]
- 38.Takubo K. et al. Regulation of the HIF-1alpha level is essential for hematopoietic stem cells. Cell Stem Cell 7, 391–402 (2010). [DOI] [PubMed] [Google Scholar]
- 39.Simsek T. et al. The distinct metabolic profile of hematopoietic stem cells reflects their location in a hypoxic niche. Cell Stem Cell 7, 380–390 (2010). [DOI] [PMC free article] [PubMed] [Google Scholar]
- 40.Fritsche K. Fatty acids as modulators of the immune response. Annu Rev Nutr 26, 45–73 (2006). [DOI] [PubMed] [Google Scholar]
- 41.Tcheng M. et al. Very long chain fatty acid metabolism is required in acute myeloid leukemia. Blood 137, 3518–3532 (2021). [DOI] [PMC free article] [PubMed] [Google Scholar]
- 42.Cai L, Sutter BM, Li B. & Tu BP Acetyl-CoA induces cell growth and proliferation by promoting the acetylation of histones at growth genes. Mol Cell 42, 426–437 (2011). [DOI] [PMC free article] [PubMed] [Google Scholar]
- 43.Mews P. et al. Acetyl-CoA synthetase regulates histone acetylation and hippocampal memory. Nature 546, 381–386 (2017). [DOI] [PMC free article] [PubMed] [Google Scholar]
- 44.Mistry JJ et al. Free fatty-acid transport via CD36 drives beta-oxidation-mediated hematopoietic stem cell response to infection. Nat Commun 12, 7130 (2021). [DOI] [PMC free article] [PubMed] [Google Scholar]
- 45.Naveiras O. et al. Bone-marrow adipocytes as negative regulators of the haematopoietic microenvironment. Nature 460, 259–263 (2009). [DOI] [PMC free article] [PubMed] [Google Scholar]
- 46.Zhang S. et al. Immunometabolism of Phagocytes and Relationships to Cardiac Repair. Front Cardiovasc Med 6, 42 (2019). [DOI] [PMC free article] [PubMed] [Google Scholar]
- 47.Ambrosi TH et al. Adipocyte Accumulation in the Bone Marrow during Obesity and Aging Impairs Stem Cell-Based Hematopoietic and Bone Regeneration. Cell Stem Cell 20, 771–784.e6 (2017). [DOI] [PMC free article] [PubMed] [Google Scholar]
- 48.Yin W, Li Z. & Zhang W. Modulation of Bone and Marrow Niche by Cholesterol. Nutrients 11, (2019). [DOI] [PMC free article] [PubMed] [Google Scholar]
- 49.Nagareddy PR et al. Hyperglycemia promotes myelopoiesis and impairs the resolution of atherosclerosis. Cell Metab 17, 695–708 (2013). [DOI] [PMC free article] [PubMed] [Google Scholar]
- 50.Nagareddy PR et al. Adipose tissue macrophages promote myelopoiesis and monocytosis in obesity. Cell Metab 19, 821–835 (2014). [DOI] [PMC free article] [PubMed] [Google Scholar]
- 51.SHILLINGFORD JP The red bone marrow in heart failure. J Clin Pathol 3, 24–39 (1950). [DOI] [PMC free article] [PubMed] [Google Scholar]
- 52.Schoors S. et al. Fatty acid carbon is essential for dNTP synthesis in endothelial cells. Nature 520, 192–197 (2015). [DOI] [PMC free article] [PubMed] [Google Scholar]
- 53.Heidt T. et al. Chronic variable stress activates hematopoietic stem cells. Nat Med 20, 754–758 (2014). [DOI] [PMC free article] [PubMed] [Google Scholar]
- 54.Scheller EL et al. Use of osmium tetroxide staining with microcomputerized tomography to visualize and quantify bone marrow adipose tissue in vivo. Methods Enzymol 537, 123–139 (2014). [DOI] [PMC free article] [PubMed] [Google Scholar]
- 55.Galvez-Monton C. et al. Comparison of two preclinical myocardial infarct models: coronary coil deployment versus surgical ligation. J Transl Med 12, 137 (2014). [DOI] [PMC free article] [PubMed] [Google Scholar]
- 56.Lee SH, Erber WN, Porwit A, Tomonaga M. & Peterson LC ICSH guidelines for the standardization of bone marrow specimens and reports. Int J Lab Hematol 30, 349–364 (2008). [DOI] [PubMed] [Google Scholar]
- 57.Torlakovic EE et al. ICSH guidelines for the standardization of bone marrow immunohistochemistry. Int J Lab Hematol 37, 431–449 (2015). [DOI] [PubMed] [Google Scholar]
- 58.van der Laan AM et al. Monocyte subset accumulation in the human heart following acute myocardial infarction and the role of the spleen as monocyte reservoir. Eur Heart J 35, 376–385 (2014). [DOI] [PMC free article] [PubMed] [Google Scholar]
- 59.Hirsch A. et al. Intracoronary infusion of autologous mononuclear bone marrow cells or peripheral mononuclear blood cells after primary percutaneous coronary intervention: rationale and design of the HEBE trial--a prospective, multicenter, randomized trial. Am Heart J 152, 434–441 (2006). [DOI] [PubMed] [Google Scholar]
- 60.Argüello RJ et al. SCENITH: A Flow Cytometry-Based Method to Functionally Profile Energy Metabolism with Single-Cell Resolution. Cell Metab 32, 1063–1075.e7 (2020). [DOI] [PMC free article] [PubMed] [Google Scholar]
- 61.Patro R, Duggal G, Love MI, Irizarry RA & Kingsford C. Salmon provides fast and bias-aware quantification of transcript expression. Nat Methods 14, 417–419 (2017). [DOI] [PMC free article] [PubMed] [Google Scholar]
- 62.Soneson C, Love MI & Robinson MD Differential analyses for RNA-seq: transcript-level estimates improve gene-level inferences. F1000Research 4, 1521 (2015). [DOI] [PMC free article] [PubMed] [Google Scholar]
- 63.Love MI, Huber W. & Anders S. Moderated estimation of fold change and dispersion for RNA-seq data with DESeq2. Genome Biol 15, 550 (2014). [DOI] [PMC free article] [PubMed] [Google Scholar]
- 64.Mootha VK et al. PGC-1alpha-responsive genes involved in oxidative phosphorylation are coordinately downregulated in human diabetes. Nat Genet 34, 267–273 (2003). [DOI] [PubMed] [Google Scholar]
Associated Data
This section collects any data citations, data availability statements, or supplementary materials included in this article.
Supplementary Materials
Suppl. Table 1 | Differentially regulated genes ordered by ascending p-value in flow sorted bone marrow granulocyte-monocyte progenitors isolated from controls and mice on day 2 after myocardial infarction, as assessed by RNA-seq. A Wald test was performed and adjusted p value is adjusted for multiple multiple comparisons based on the Benjamini-Hochberg algorithm to control the false discover rate (FDR).
Suppl. Table 2 | Mass Spectrometry data for Figure 1F
Data Availability Statement
The data were deposited in NCBI’s Gene Expression Omnibus and are accessible through GEO Series accession number GSE169267. The DepMAp public database was use for Extended data 2C.


