

Summary
Transcription factors (TFs) can define distinct cellular identities despite nearly identical DNA-binding specificities. One mechanism for achieving regulatory specificity is DNA-guided TF cooperativity. Although in vitro studies suggest it may be common, examples of such cooperativity remain scarce in cellular contexts. Here, we demonstrate how ‘Coordinator’, a long DNA motif comprised of common motifs bound by many basic helix-loop-helix (bHLH) and homeodomain (HD) TFs, uniquely defines regulatory regions of embryonic face and limb mesenchyme. Coordinator guides cooperative and selective binding between the bHLH family mesenchymal regulator TWIST1 and a collective of HD factors associated with regional identities in the face and limb. TWIST1 is required for HD binding and open chromatin at Coordinator sites, while HD factors stabilize TWIST1 occupancy at Coordinator and titrate it away from HD-independent sites. This cooperativity results in shared regulation of genes involved in cell-type and positional identities, and ultimately shapes facial morphology and evolution.
Keywords: transcription factor, bHLH, homeodomain, TWIST1, ALX factors, mesenchyme, cooperativity, face, limb, neural crest, Coordinator
Graphical Abstract

In Brief
Epigenomic, biochemical, structural, and human phenotypic analysis of transcription factors that regulate a composite DNA motif in the embryonic face and limb mesenchyme reveals how DNA-guided cooperative binding gives rise to specificity among members of large TF families. This cooperativity promotes integration of cellular and positional identity programs and contributes to evolution and individual variation of human facial shape.
Introduction
Sequence-specific transcription factors (TFs) play key roles in controlling gene expression. TFs bind DNA sequence motifs, and recruit cofactors to modulate transcription1,2. However, many TFs fall into large families with highly conserved DNA-binding domains that often bind very similar DNA motifs2,3. Among the largest TF families in humans are homeodomain (HD, >200 TFs) and basic helix-loop-helix (bHLH, >100 TFs) proteins, well-known for roles in driving diverse positional (e.g. HOX genes4) and cell type identities5 (e.g. MyoD1 and NeuroD1), respectively. Yet, most bHLH factors recognize a subset of CANNTG sequences collectively called the ‘E-box’6, while the motif TAATT[A/G] is bound by roughly a third of all HD TFs in humans7,8.
Cooperative TF binding is a mechanism of DNA-binding specificity among TFs of large families and for integrating multiple biological inputs at cis-regulatory elements. Diverse mechanisms underlying TF cooperativity have been described9, but less well-understood is so-called ‘DNA-mediated’ or ‘DNA-guided’ cooperativity. Certain TFs can cooperatively bind juxtaposed DNA sites arranged in specific orientation and distance without forming stable, direct protein-protein interactions in solution. However, direct contacts between cooperating TFs are favored upon binding at composite DNA sites, stabilizing the occupancy of both TFs. In vitro analysis of TF pairs using consecutive affinity-purification systematic evolution of ligands by exponential enrichment (CAP-SELEX) revealed that DNA-guided cooperativity may be common10. However, most cellular studies of this mechanism and its biological function have been limited to few well-understood examples11–13, such as the pluripotency factors OCT4 and SOX2, which bind a composite motif combining their individual motifs10 to facilitate chromatin opening14,15. In other cases, composite motifs have been observed in DNA sequence analyses of enhancers16–18, but their mechanisms of cooperativity and selectivity remain unexplored.
We previously serendipitously discovered a 17-bp DNA sequence motif with evidence of endogenous cellular function, which we termed ‘Coordinator’19. By comparing enhancer landscapes in human and chimpanzee facial progenitor cells called cranial neural crest cells (CNCCs) and analyzing the underlying DNA sequence changes, we uncovered motifs whose gains and losses correlated with changes in enhancer activity (Figure 1A). The Coordinator motif, discovered through de novo sequence analysis, was more predictive of species bias in enhancer activity than any known motif19. We therefore hypothesized that the trans-regulatory factor(s) that recognize the motif play an outsized role in coordinating enhancer activity in CNCCs, and hence named the motif Coordinator. Although the motif was not annotated to a regulatory factor, it did not escape our attention that Coordinator contains the TAATT[A/G] motif bound by many HD factors and a version of the CANNTG ‘E-box’ motif bound by most bHLH factors, separated by a fixed spacing (Figure 1A). Given the large number of bHLH and HD factors in humans2, the Coordinator motif represents an opportunity to gain insight into mechanisms of specificity and functional implications of TF co-binding in a biologically relevant context. Thus, we sought to systematically identify TFs that bind the Coordinator motif, determine their molecular functions in an endogenous cellular context, and dissect the mechanisms underlying their cooperativity and selectivity.
Figure 1. The ‘Coordinator’ motif is active specifically in embryonic face and limb mesenchyme.
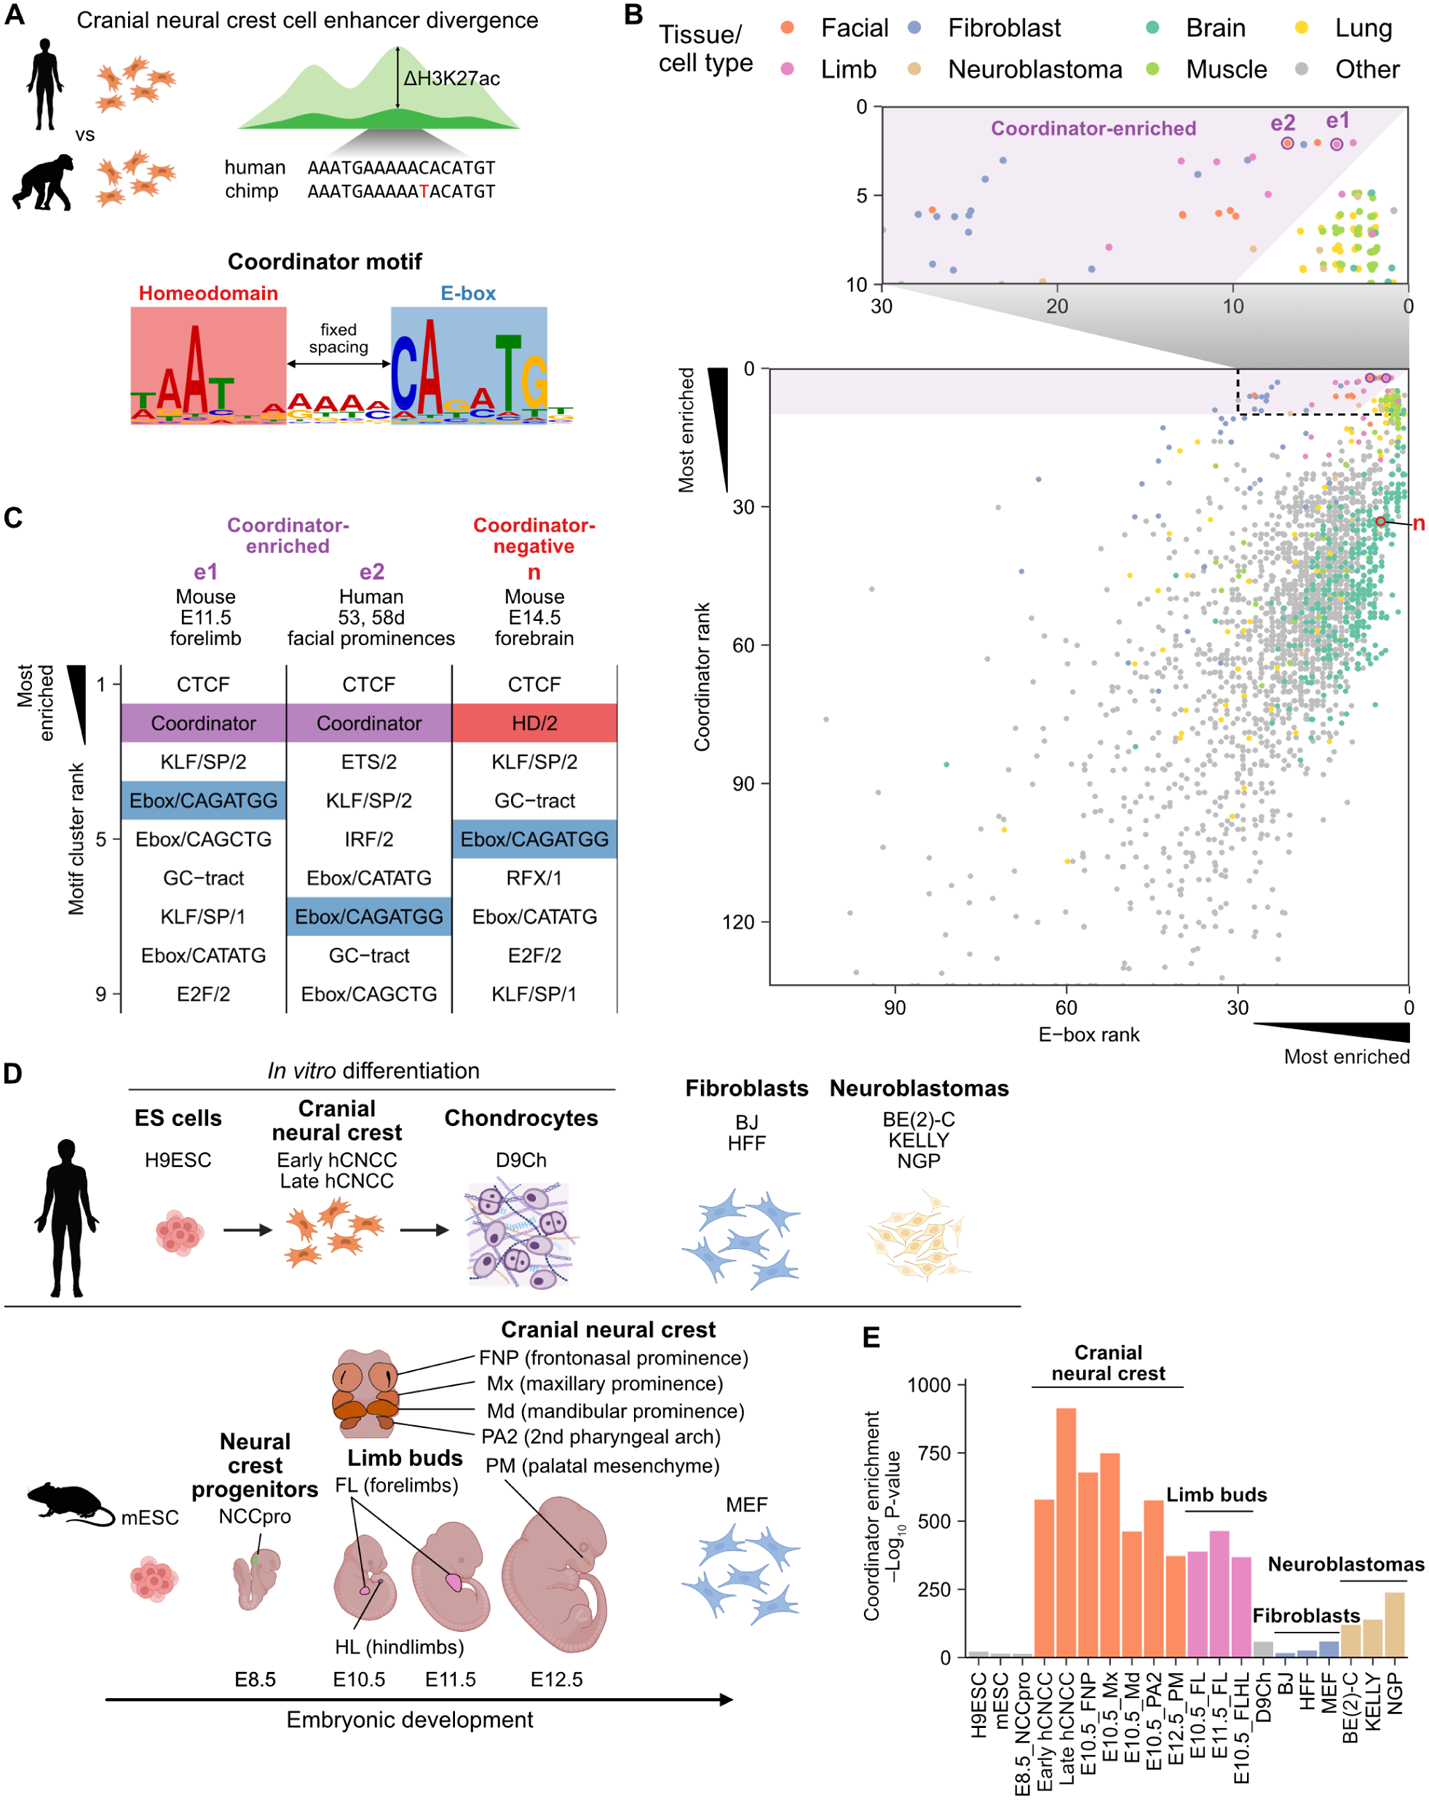
A. Schematic of the ‘Coordinator’ motif and its discovery. B. Rankings of Coordinator and its constituent Ebox/CAGATGG motif in enrichment in the top 10,000 distal accessible regions in ENCODE. e1, e2, and n indicate examples detailed in (C). Points jittered to avoid overplotting. C. Top motif clusters for examples of Coordinator-enriched and Coordinator-negative samples, with relevant motifs highlighted. D. Schematic of cell types and tissues in (E). E. Coordinator motif enrichment across additional ATAC-seq datasets.
Results
The ‘Coordinator’ motif is active specifically in embryonic face and limb mesenchyme
We wondered whether any cell types other than CNCCs also exhibit enrichment for the Coordinator motif in their active cis-regulatory regions. We defined a signature of Coordinator activity, based on the observation that in hCNCCs the Coordinator motif is most enriched in the top ~10,000 promoter-distal open chromatin peaks as defined by the assay for transposase-accessible chromatin with sequencing (ATAC-seq) (Figure S1A). We searched for enrichment of known motifs in each of the 549 ATAC-seq and 1,781 DNase-seq datasets from human and mouse in ENCODE20, collapsing similar motifs into motif clusters (STAR Methods). Finally, we identified samples with: 1) Coordinator among the top 10 motif clusters, and 2) Coordinator ranked higher than either constituent motif cluster, Ebox/CAGATGG and HD/2 (Figure 1B,C). An analogous approach recapitulates the specificity of the OCT:SOX motif active in pluripotent stem cells (Figure S1B).
As expected, embryonic facial prominences, largely comprised of CNCCs, exhibit Coordinator motif activity (Figure 1B,C). However, many developing limb samples and a smaller subset of fibroblast and neuroblastoma samples also meet our definition of Coordinator activity. Notably, neuroblastoma is a cancer originating from neural crest-derived lineages21, whereas fibroblasts are mesenchymal cells of either mesodermal or neural crest origin22. Importantly, other samples showing strong E-box and HD motif enrichment, such as those from the developing brain, lack Coordinator enrichment (Figure S1C). To corroborate this finding, we gathered additional published human and mouse ATAC-seq datasets from cell types related to those in which we initially detected Coordinator enrichment and relevant negative controls (Figure 1D)23–34. In vitro-derived mesenchymal hCNCCs and mouse embryonic facial prominences of CNCC origin have the strongest Coordinator motif enrichment, followed closely by limb bud samples, with much lower enrichment in neuroblastomas and fibroblasts (Figure 1E). Thus, the Coordinator motif is selectively enriched in the accessible cis-regulatory regions of the developing face and limb mesenchyme.
TWIST1 binds Coordinator across tissues with diverse homeodomain TF expression
To systematically nominate candidate Coordinator-binding TFs, we searched for TFs with: 1) binding motifs consistent with the constituent E-box or HD halves of Coordinator, and 2) high expression levels specifically in cell types with Coordinator enrichment in open chromatin. First, we aligned known TF motifs [derived from either chromatin immunoprecipitation DNA sequencing (ChIP-seq) data or in vitro specificity measurements using SELEX or protein binding microarrays (PBM)] against each half of the Coordinator motif. Of 54 TFs with motifs aligned to the E-box (Figure 2A; Figure S2A), TWIST1 is the only TF with a motif spanning both the E-box and the HD motif. However, this motif is derived from ChIP-seq in neuroblastoma cells34, and as a bHLH factor, it only directly binds the E-box. In fact, previously published ChIP-seq for TWIST1 overexpressed in human mammary epithelial cells revealed binding to single or double E-box motifs35. Next, we examined the RNA levels of each candidate TF and their correlation with Coordinator motif enrichment across cell types. TWIST1 had the highest correlation (r = 0.934; Figure S2B,C). Indeed, we previously detected Coordinator motif enrichment at TWIST1 ChIP-seq peaks from hCNCCs23. To confirm that TWIST1 binds Coordinator in vivo, we performed Twist1 ChIP-seq in dissected E10.5 mouse embryos (Figure 2B), separately testing the frontonasal prominences (FNP), maxillary prominences (Mx), mandibular prominences (Md), forelimbs (FL), and hindlimbs (HL). We compared these to hCNCCs and previously published data from the neuroblastoma cell lines BE(2)-C and SHEP2134. Across these cellular contexts, the strongest TWIST1 peaks mostly contained the Coordinator motif, but weaker peaks were progressively less likely to do so. However, compared to hCNCCs, facial prominences, and limb buds, which sustained high Coordinator motif frequencies (>50%) for the top 20,000 peaks, neuroblastomas only had such motif frequencies in the top few thousand peaks (despite a greater total number of peaks). This rapid falloff is consistent with the weaker Coordinator enrichment in neuroblastoma open chromatin (Figure 1E).
Figure 2. TWIST1 binds Coordinator across tissues with diverse homeodomain TF expression.
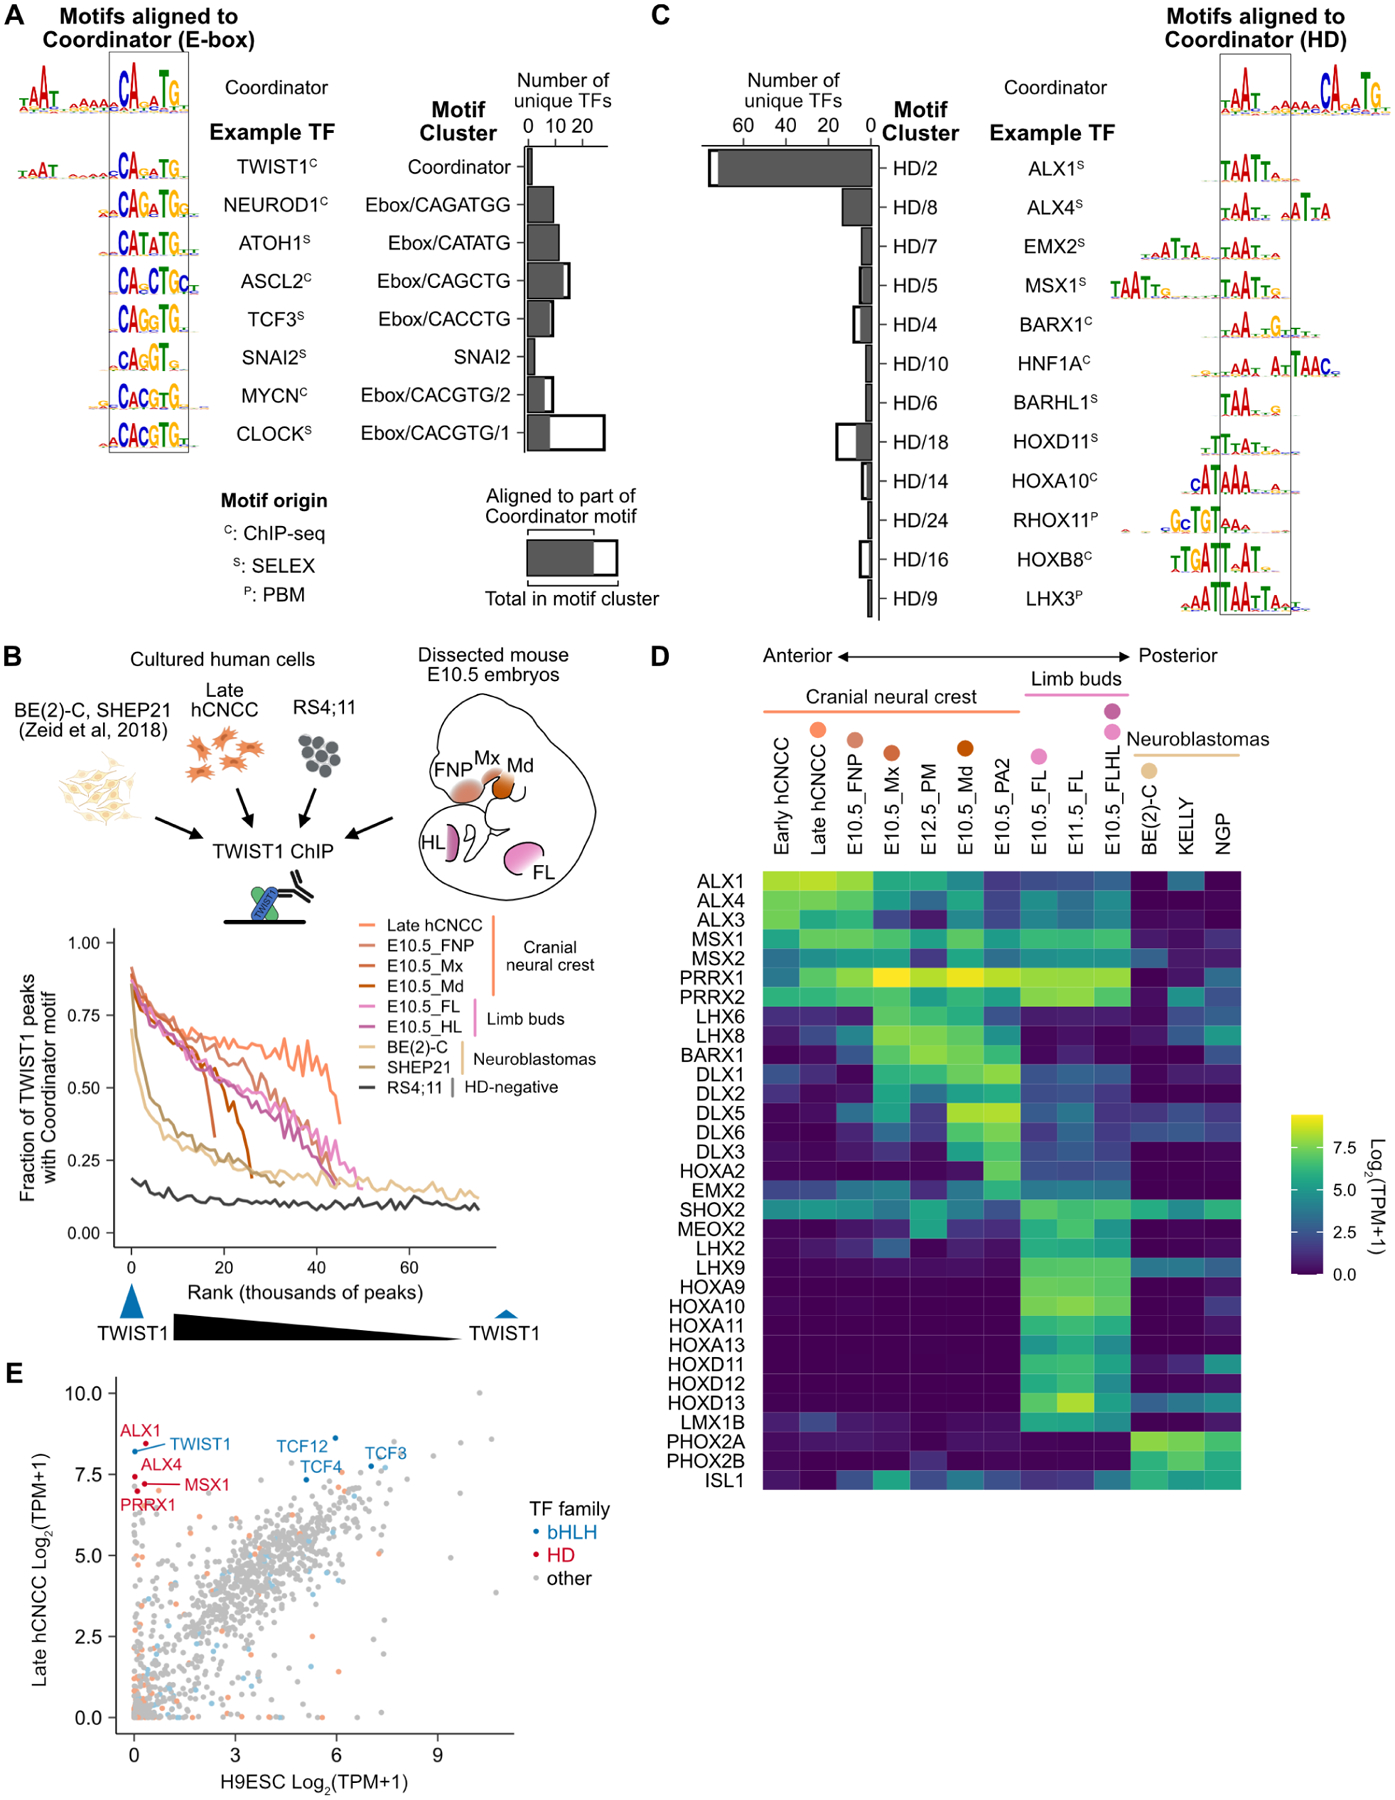
A. Motif clusters and example motifs aligned to the E-box within Coordinator; bar plots show number of aligned and total motifs per cluster (STAR Methods). Motif origin: C, ChIP; P, PBM; S, SELEX. B. TWIST1 ChIP-seq in human cell types and dissected mouse embryo tissues. TWIST1 peaks ranked from strongest to weakest in bins of 1000. C. As in (A), but for the homeodomain (HD) portion. D. HD TF expression across cell/tissue types with Coordinator enrichment. Colored circles correspond to the schematic and data in (C). E. TF RNA expression in human cranial neural crest cells (hCNCC) and H9 embryonic stem cells (H9ESC).
Next, we focused on candidate factors binding the HD portion of Coordinator. Of 129 TFs with motifs aligned to the HD half of Coordinator, 32 are expressed moderately or highly in at least one cell type with Coordinator enrichment (Figure 2C,D; Figure S2D). However, no candidate was expressed in all Coordinator-positive cell types and could explain the quantitative variation in Coordinator activity. Instead, every cell type expresses multiple HD TFs robustly, with groups of HDs showing overlapping expression in distinct regions of the developing face and limbs, consistent with their previously described association with specific positional identities36–38.
To test whether these HDs collectively enable TWIST1 binding to Coordinator, we searched the Cancer Cell Line Encyclopedia39 (CCLE) for cell lines with high RNA levels of TWIST1 but minimal levels of candidate Coordinator-binding HDs (Figure S2E). One of the best matches was RS4;11, an acute lymphoblastic leukemia cell line with a t(4;11) translocation. We performed TWIST1 ChIP-seq in RS4;11 cells and found that TWIST1 predominantly binds the single and double E-box motifs (Figure S2F), as in human mammary epithelial cells35, rather than Coordinator (Figure 2B). These results suggest that TWIST1 binds Coordinator only in cell types with HD proteins co-expressed.
Multiple homeodomains co-bind Coordinator motif with TWIST1
To study the mechanisms and functional role of TWIST1 cooperation with HD TFs at Coordinator, we turned to our in vitro model of human embryonic stem cell (hESC) differentiation to hCNCCs19,23,40,41. TWIST1 is the only bHLH TF selectively expressed in hCNCCs compared to hESCs, whereas the E-proteins TCF3, TCF4 and TCF12, known to heterodimerize with TWIST135,42, are expressed in both cell types, consistent with their broad expression (Figure 2E). Among HD TFs, ALX1, ALX4, MSX1, and PRRX1 are most highly and selectively expressed in our hCNCCs, in concordance with their closest resemblance to the anterior facial region CNCCs24.
Accordingly, we created hESC lines with each TF endogenously and homozygously tagged with the dTAG-inducible FKBP12F36V degron43,44, a V5 epitope tag, and in one case also the fluorophore mNeonGreen45, which we could then differentiate to hCNCCs in vitro46 (Figure 3A). This approach allows acute or long-term depletion of each TF (Figure 3B) and—through the common V5 tag—comparative studies of TF levels and DNA binding. We tagged TWIST1, ALX1, MSX1, and PRRX1 and confirmed near-complete depletion upon adding dTAGV-1 to the media (Figure 3B; Figure S3A). Tagging did not significantly decrease baseline TF levels (Figure S3B). Based on previous studies indicating ALX1 and ALX4 have overlapping functions37,47, we generated multiple independent clonal lines with nonsense mutations in ALX4 on top of the ALX1FV tag, as we were unable to degron-tag ALX4 (Figure 3C; Figure S3C).
Figure 3. Multiple homeodomains co-bind Coordinator motif with TWIST1.
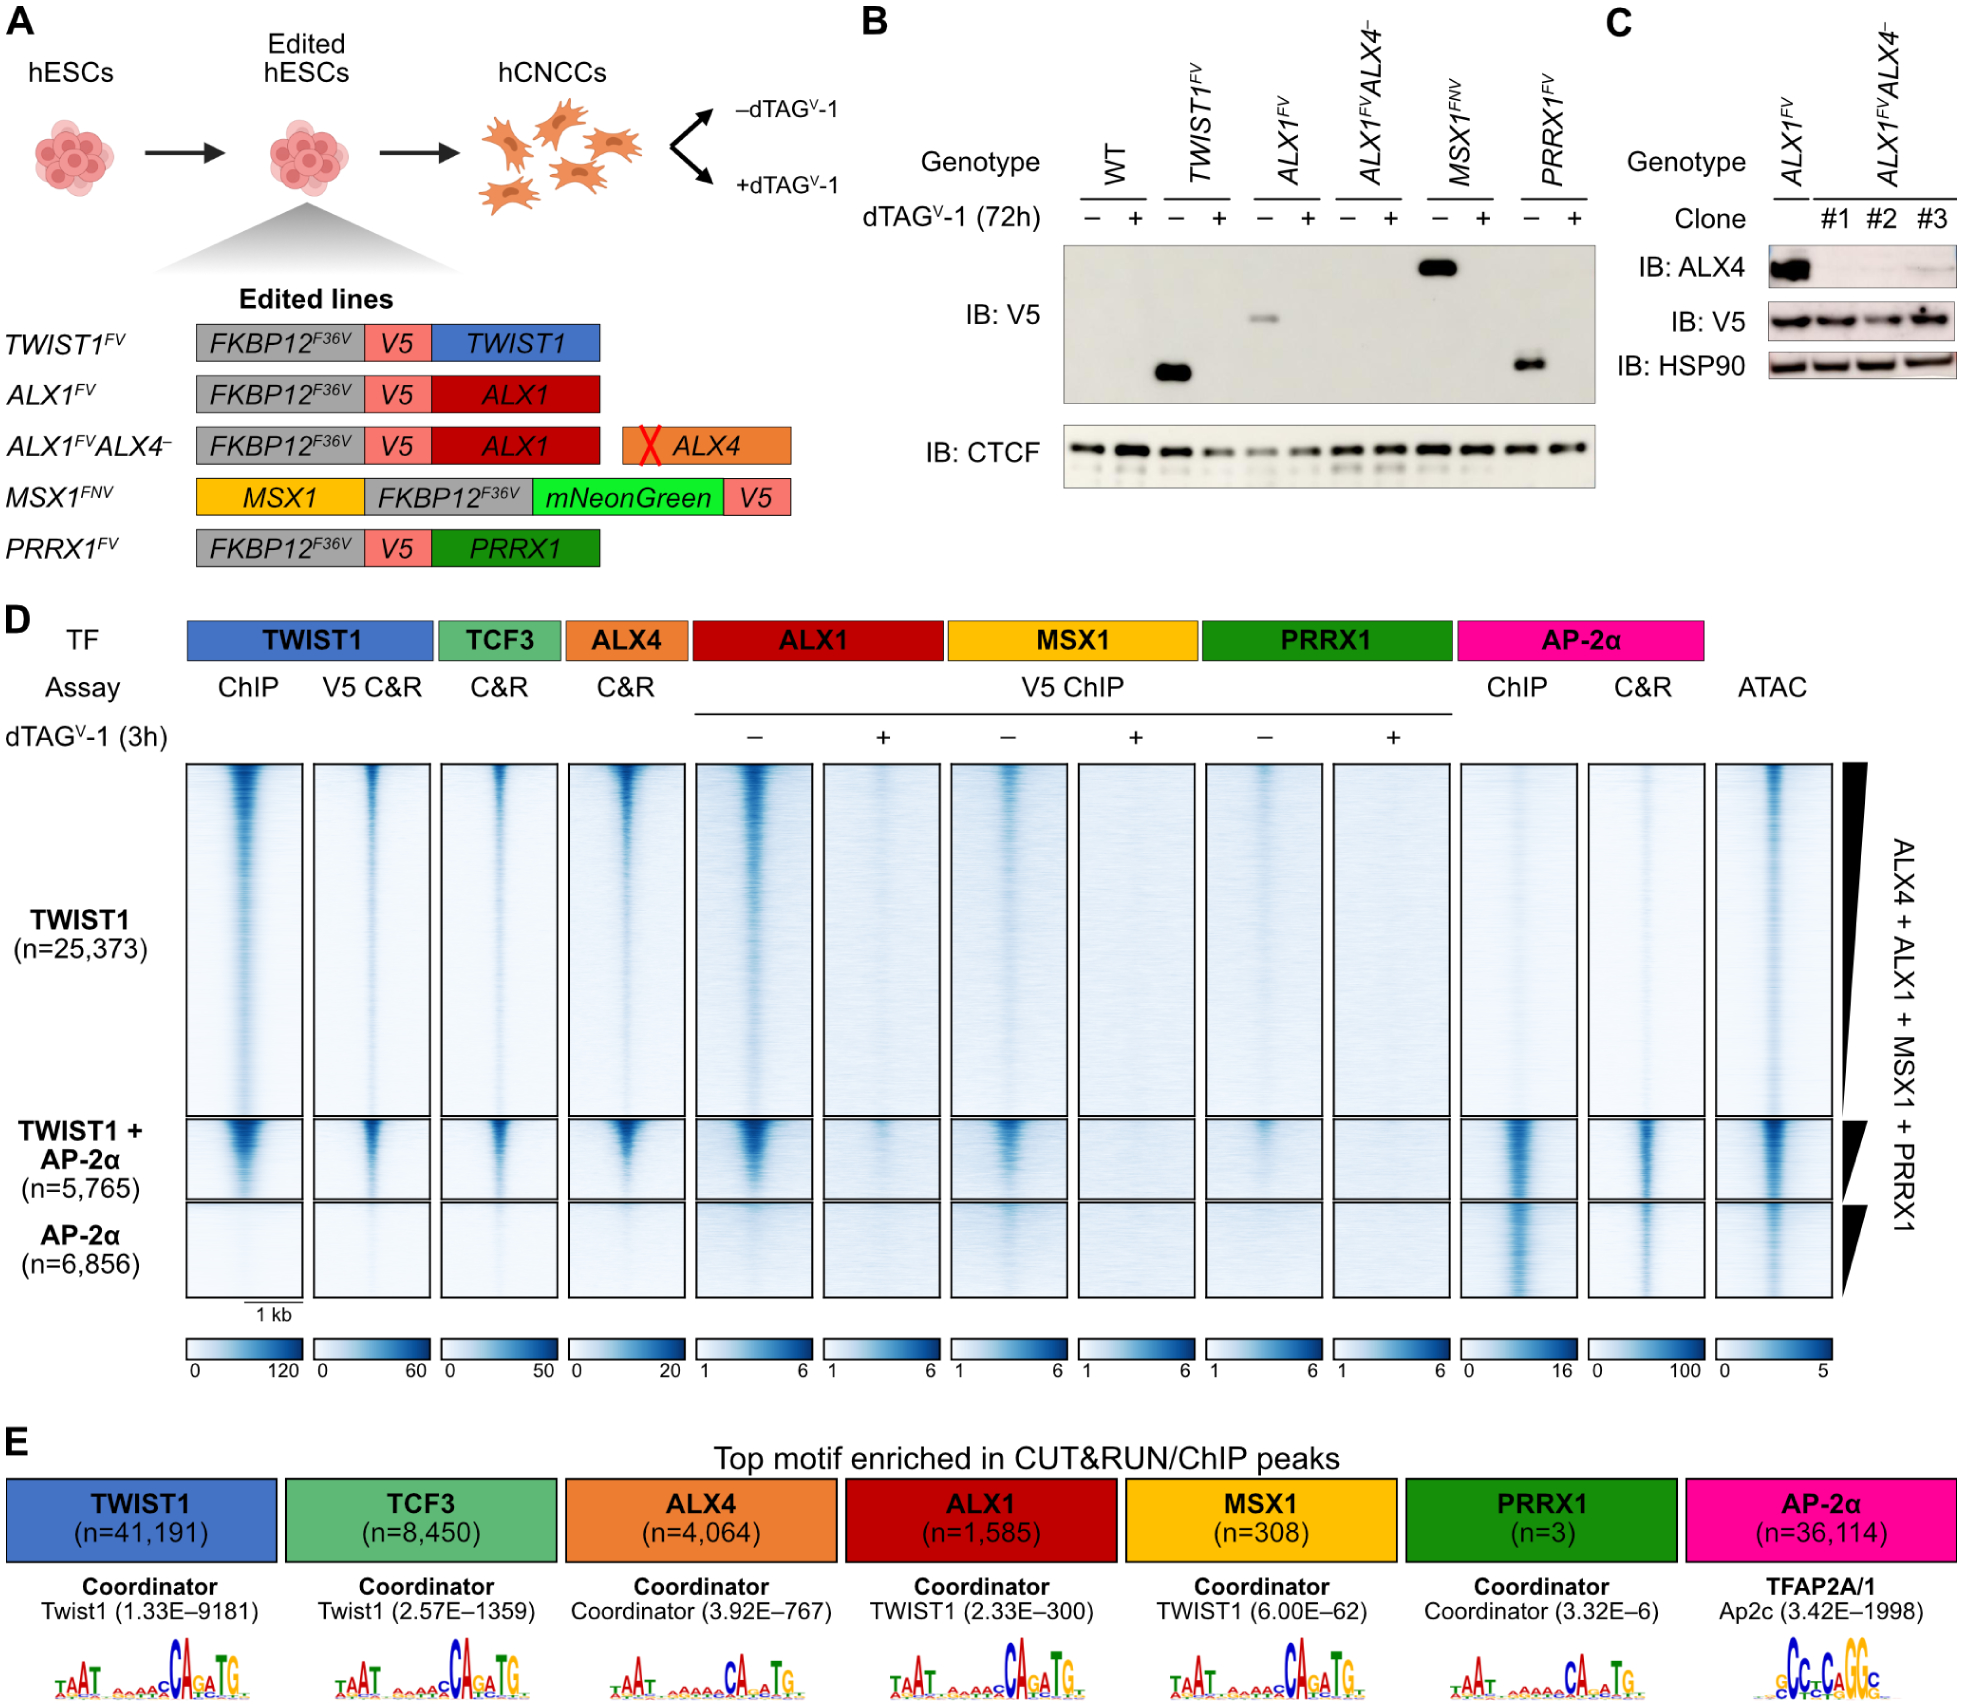
A. Schematic of endogenous TF tagging and knockout. B. Confirmation of TF tagging and depletion upon dTAGV-1 addition by Western blot. IB, immunoblot. C. Confirmation of ALX4 knockout in three independent clones by Western blot. D. Heatmap of TF binding (ChIP and CUT&RUN) and chromatin accessibility (ATAC) at promoter-distal binding sites for TWIST1 and/or AP-2α. Units: reads per genome coverage, except for ATAC, which is in signal per million reads. E. The top enriched known motif for each TF, with p-values.
We performed ChIP-seq and CUT&RUN to assess DNA binding profiles of these tagged TFs, plus ALX4, TCF3 (a heterodimerization partner of TWIST1), and the positive control AP-2α (a key neural crest TF encoded by TFAP2A40) using endogenous antibodies. We first used binding sites for TWIST1 and AP-2α as reference points, grouping distal regulatory regions into those bound by TWIST1 or AP-2α only or those co-bound by both (Figure 3D). As expected, binding of the TWIST1 heterodimerization partner TCF3 is correlated with that of TWIST1. For all four tested HD TFs, DNA binding at TWIST1 sites clearly exceeds that at AP-2α-only sites despite comparable accessibility. However, the strength of ChIP signal is reproducibly distinct between the tagged HD TFs, with strongest signal for ALX1. This ranking is discordant with that of TF protein levels, as ALX1 has the lowest relative abundance but strongest binding (Figure 3B). ALX4 shows similar binding patterns as well, though we could not directly compare its chromatin occupancy with that of other HDs.
As an orthogonal approach, we called peaks for each TF and searched for enriched motifs (Figure 3E). The top motif cluster for TWIST1, TCF3, and all tested HD TFs is Coordinator, confirming that these HD TFs predominantly bind DNA with TWIST1. Together these data indicate that TWIST1 can bind Coordinator sites with multiple HD TFs including ALX4, ALX1, MSX1, and PRRX1, albeit at varying occupancies.
TWIST1 facilitates homeodomain TF binding, chromatin opening, and enhancer activity
To investigate the mechanism and function of TF cooperation at Coordinator, we studied how depletion of each Coordinator-binding TF impacts chromatin states and the binding of other TFs. We first focused on TWIST1, given its central role as the key bHLH factor binding Coordinator. We began with acute depletions ranging from 1 to 24 hours in hCNCCs, and performed ChIP-seq to measure TWIST1 binding, CUT&RUN for ALX4 binding, ATAC-seq to measure chromatin accessibility, and ChIP-seq for H3K27ac as a mark correlated with enhancer/promoter activity (Figure 4A).
Figure 4. TWIST1 opens chromatin for homeodomain TFs and enhancer acetylation.
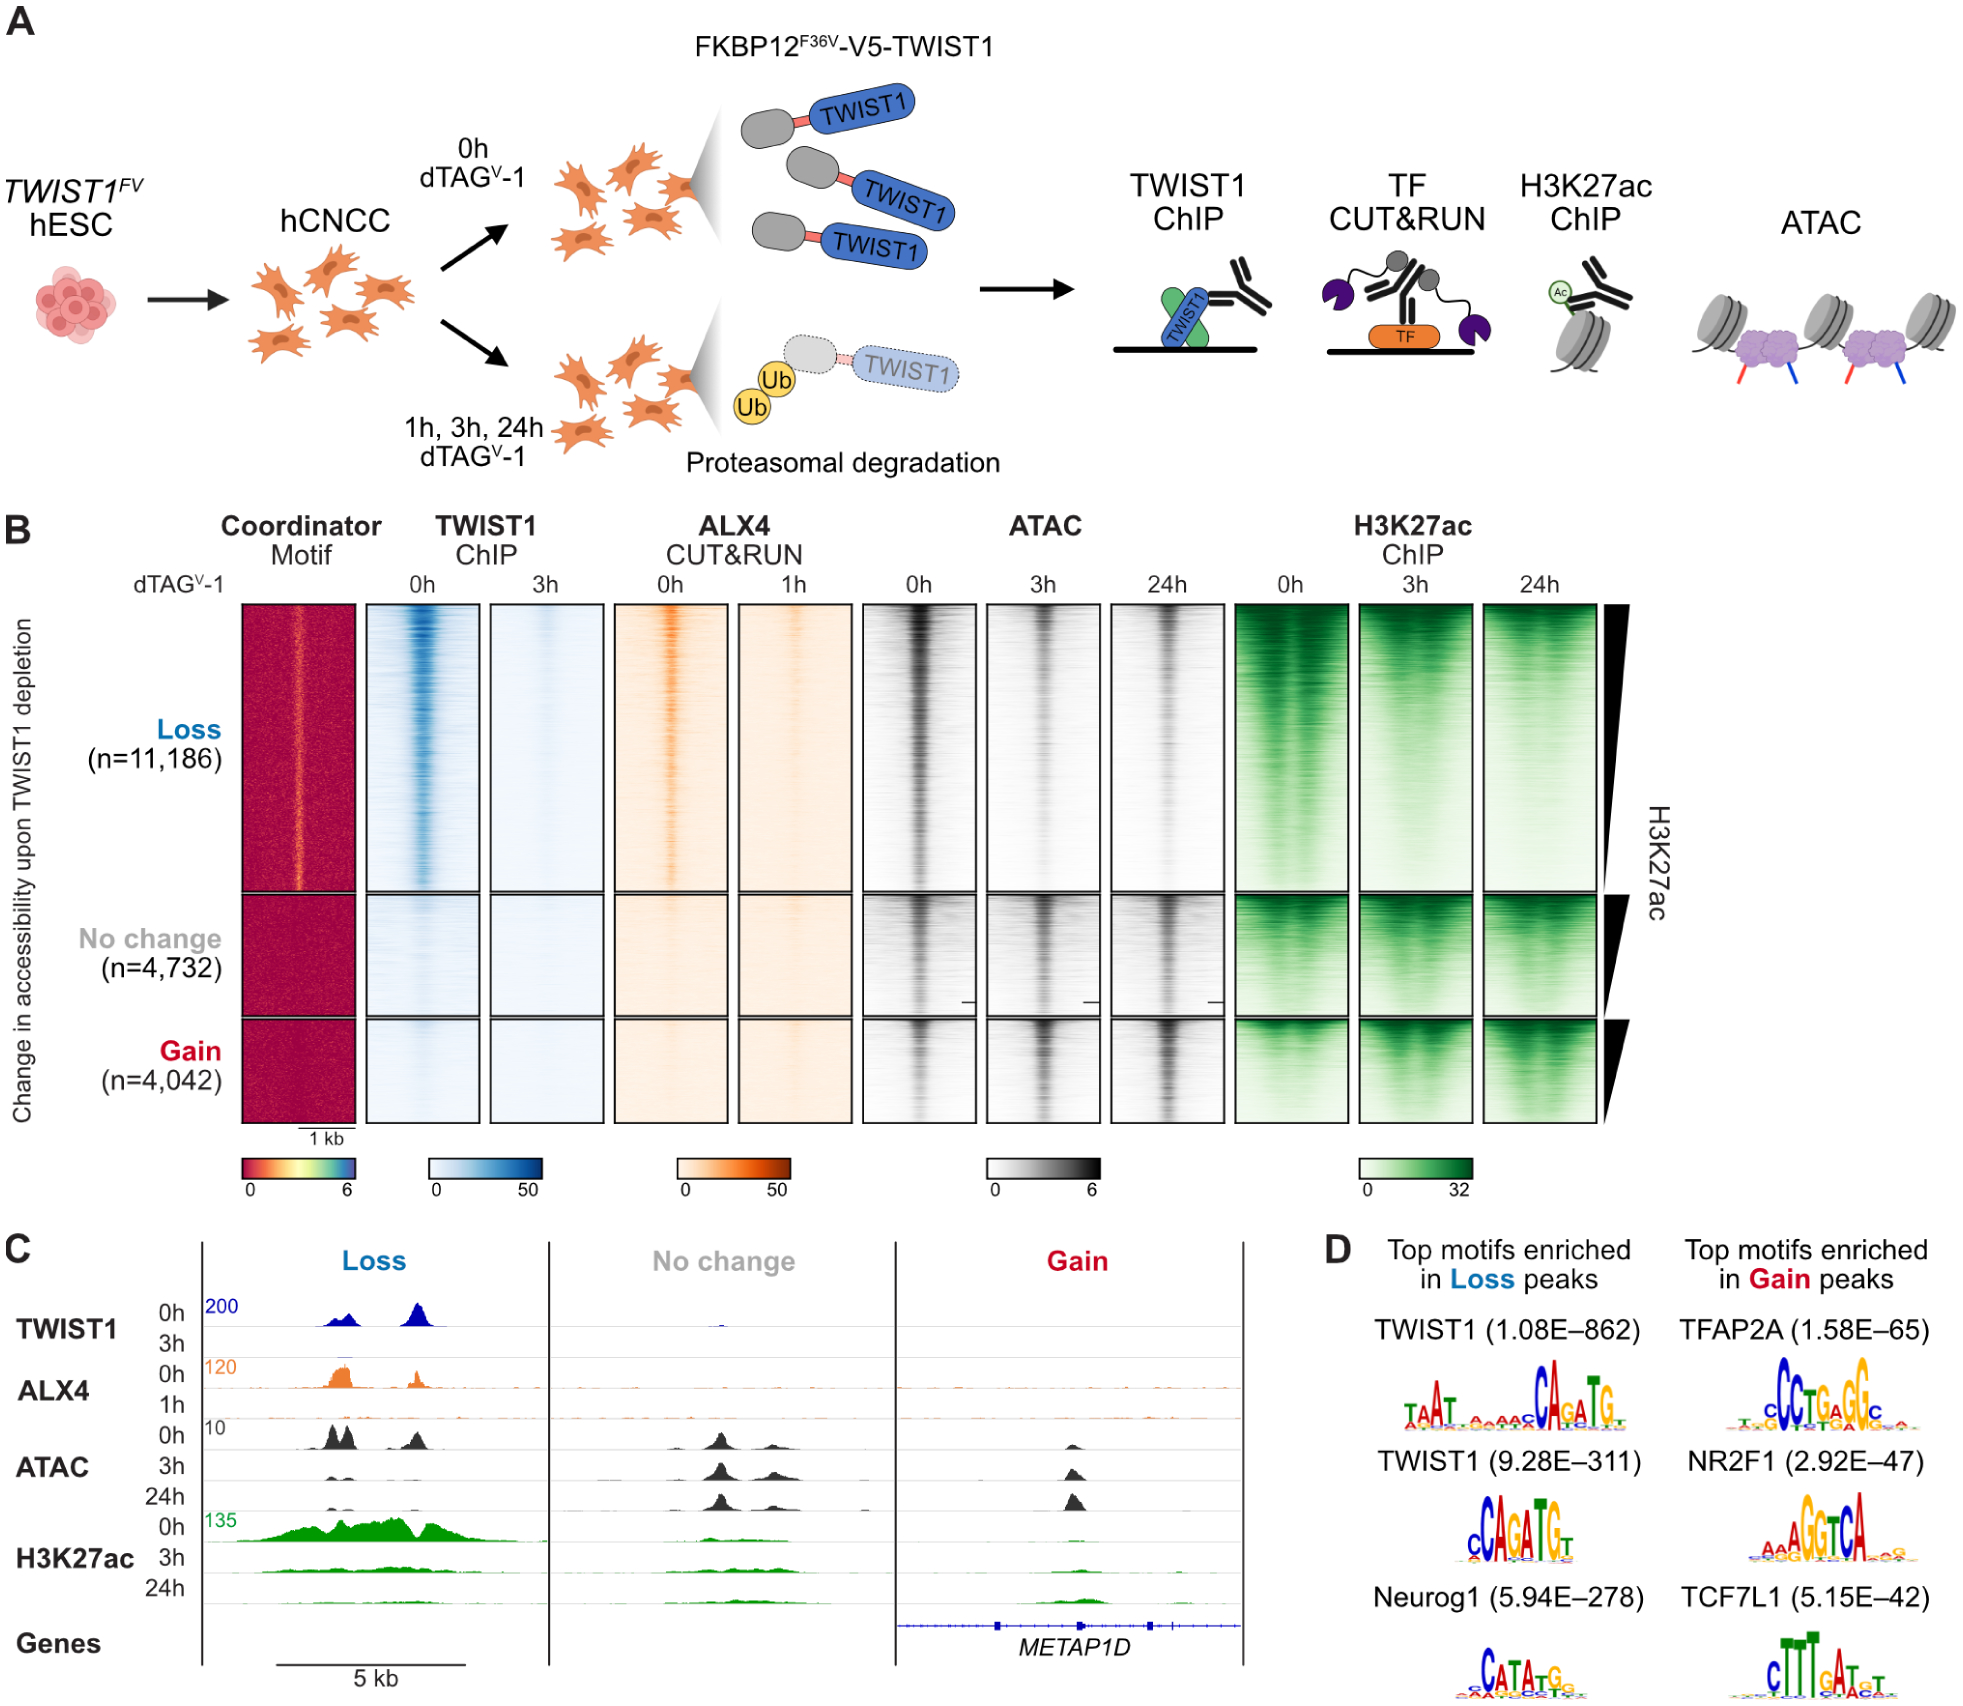
A. Schematic of acute depletion experiments. B. Heatmap of Coordinator motif enrichment, TF binding, chromatin accessibility (ATAC), and H3K27ac at distal enhancers grouped by their change in accessibility upon TWIST1 depletion. Units: reads per genome coverage, except for the Coordinator motif (−log10 p-value) and ATAC (signal per million reads). One representative replicate of two independent differentiations. C. Example enhancers with loss, no change, or gain of accessibility upon TWIST1 depletion. Coordinates (hg38): Loss, chr17:70,668,899–70,678,127; No change, chr11:44,958,683–44,968,011; Gain, chr2:172,058,768–172,068,096. D. Top enriched motif clusters in enhancers with loss or gain of accessibility upon TWIST1 depletion compared to those with no change, with p-values.
TWIST1 depletion rapidly reshapes chromatin accessibility, with 36,290 regions losing accessibility and 17,054 gaining accessibility within 3 h (Figure S4A). The change in accessibility is mostly complete within 3 h (Figure S4B), so we combined the 3 h and 24 h differentially accessible peaks to define a set of sites with loss vs gain of accessibility. Among candidate distal enhancers, 11,186 sites lose accessibility, 4,042 gain accessibility, and 4,732 do not significantly change (Figure 4B,C). Regions losing accessibility are highly enriched for the Coordinator motif and TWIST1 binding, whereas those gaining accessibility lack TWIST1 binding and are most enriched for AP-2α and NR2F1 motifs, suggesting these effects are indirect (Figure 4B–D). Changes in accessibility are correlated with changes in H3K27ac (Figure 4B, Figure S4C, r = 0.834 for 3 h, 0.896 for 24 h). Loss of TWIST1 leads to a depletion of H3K27ac within hours, consistent with an activating role of TWIST1 (Figure S4D). Furthermore, TWIST1 depletion eliminates enhancer reporter activity of a well-characterized SOX9 enhancer dependent on the Coordinator motif23 (Figure S4E). Importantly, TWIST1 depletion largely abrogates DNA binding of ALX4 at Coordinator sites within 1 h (Figure 4B,C; Figure S4D). Therefore, both HD factor binding and open/active chromatin states of cis-regulatory elements depend on TWIST1, consistent with our original hypothesis that the trans-regulatory proteins recognizing Coordinator play a large role in enhancer activity in CNCCs19.
Homeodomain TFs cooperate with TWIST1 to open chromatin at Coordinator sites
We next asked how depletion of HD TFs affects chromatin accessibility and TWIST1 binding at Coordinator. Since we only generated a constitutive knockout of ALX4, to obtain comparable data across all TF perturbations, we differentiated ALX4− hESCs along with ALX1, MSX1, PRRX1, and TWIST1 degron-tagged hESCs while treating cells with dTAGV-1 from the beginning of differentiations to mimic a knockout. We harvested these cells at an early hCNCC stage, to minimize indirect effects. Even in these long-term depletions, many of the observed effects are likely directly caused by HD dysfunction in mesenchymal CNCCs, as most of the aforementioned HD TFs are only expressed in CNCCs following their specification and delamination37,48 (except MSX1, which is expressed in the neural plate border precursor to CNCCs49). Furthermore, accessibility effects of long-term TWIST1 depletion are well-correlated with acute 24 h depletion (r = 0.664; Figure S5A).
Consistent with the range in strength of DNA binding among HDs (Figure 3D), ALX1 depletion results in significant changes in accessibility at 6,195 peaks (FDR < 0.05), compared to 4,284 for ALX4, 1,410 for MSX1, and 0 for PRRX1, the weakest binder (Figure S5B). In general, HD TF depletions have much weaker effects than TWIST1 depletion, likely due to functional redundancy among them. Indeed, changes upon ALX1 and ALX4 losses are well-correlated (r = 0.651) (Figure 5A). These are also correlated, albeit less well, with effects of MSX1 loss (r = 0.462) (Figure S5C). Next, by comparing undepleted ALX1FV samples (in which both ALX1 and ALX4 are present) to depleted ALX1FV ALX4− samples (in which both are lost), we inferred the effect of combined ALX1 and ALX4 loss on the ATAC-seq changes at the corresponding set of genomic targets. This comparison allowed detection of differential accessibility at a greater number of peaks (8,577) (Figure 5B).
Figure 5. Homeodomain TFs stabilize TWIST1 binding at Coordinator sites.
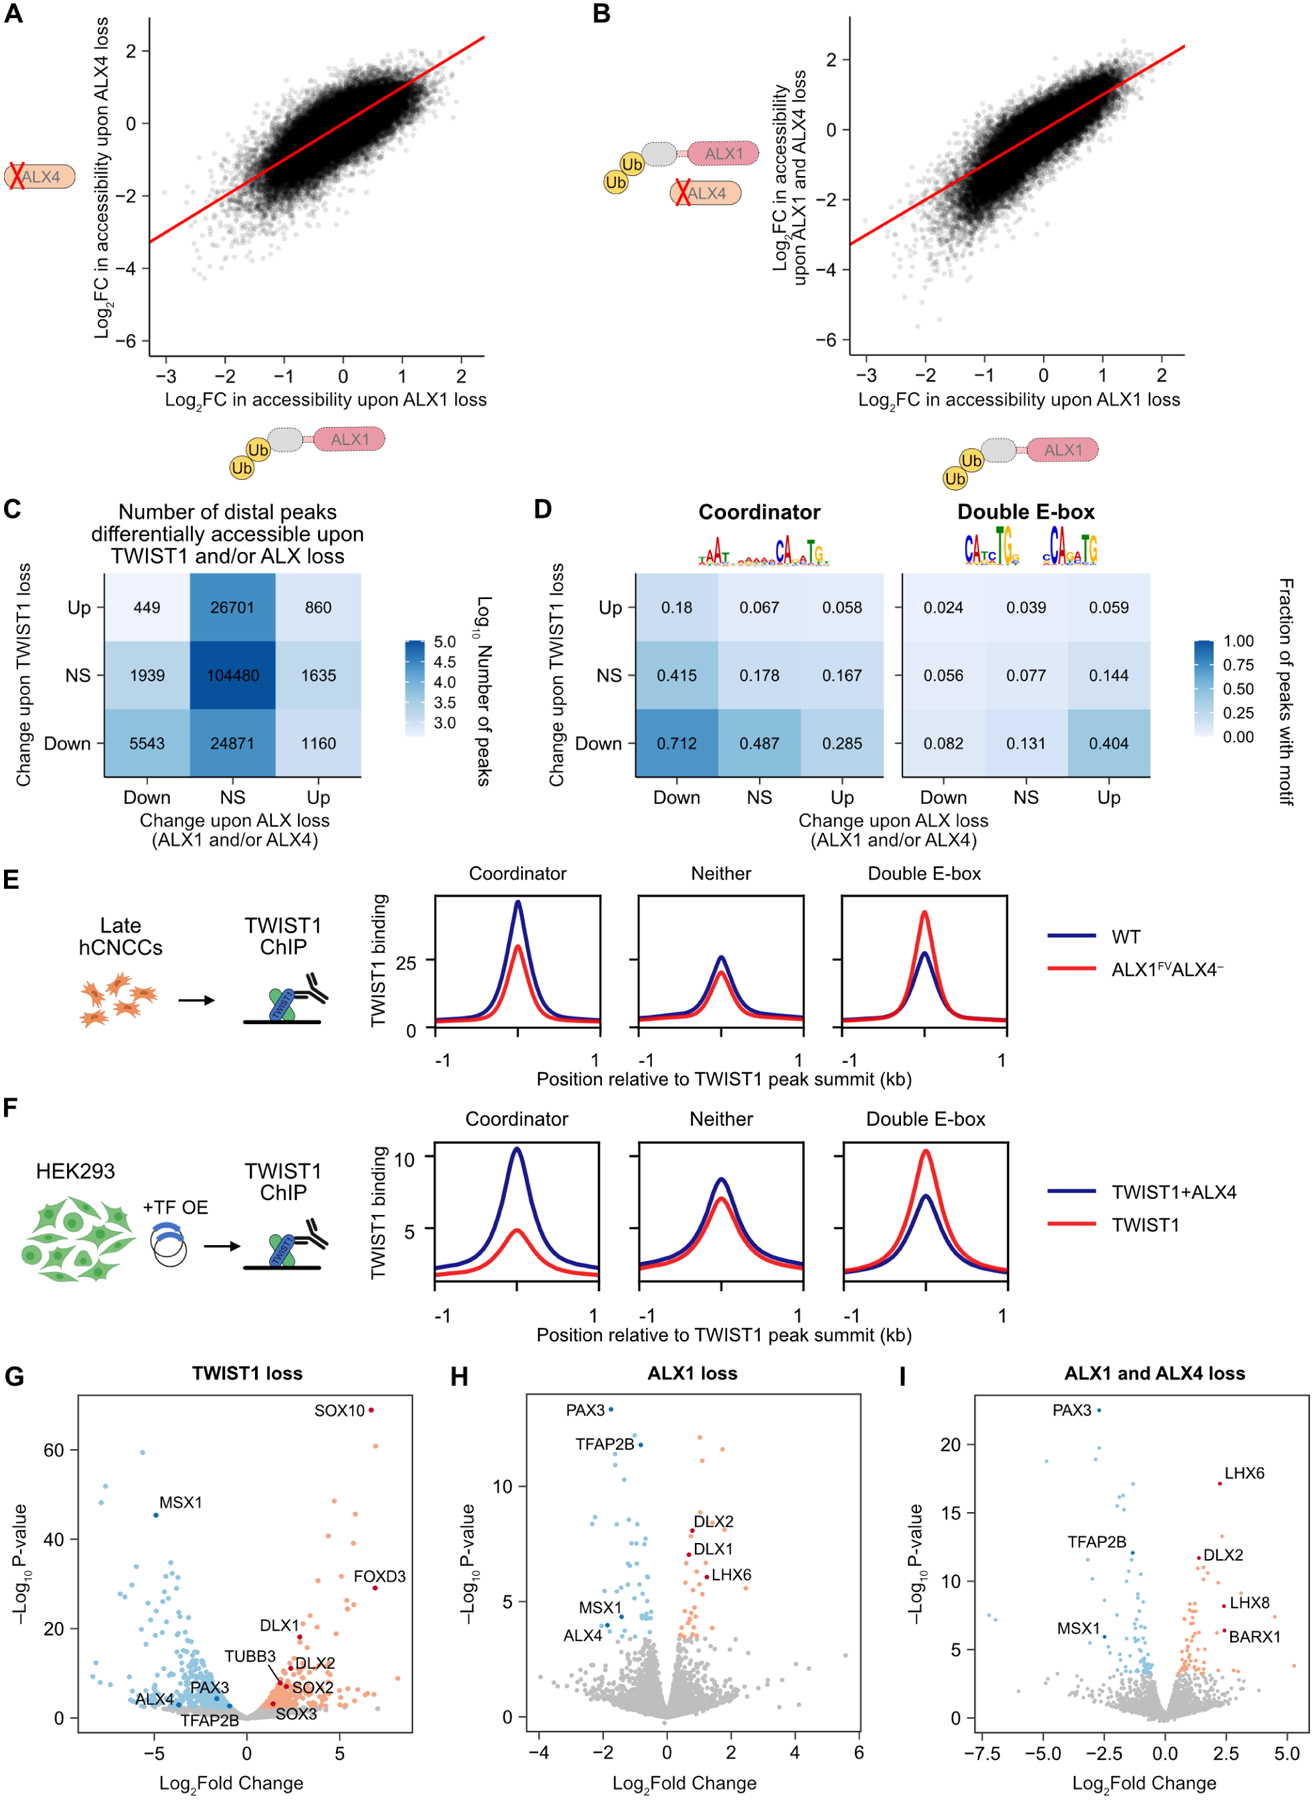
A. Correlation in Log2 fold change (FC) in accessibility upon loss of ALX1 (long-term dTAGV-1 treatment) versus ALX4 (knockout). Red line, y = x. B. Change in accessibility upon loss of both ALX1 and ALX4 vs log sum of individual effects. C. Most chromatin accessibility effects of ALX loss (ALX1 and/or ALX4) are concordant with (but are a subset of) those of TWIST1 loss. NS, not significant. D. Top motif enrichments among peaks responsive to TWIST1 and ALX loss. E and F. TWIST1 binding by ChIP-seq quantitatively shifts from Coordinator to double E-box motif sites upon loss of ALX4 (without ALX1 depletion) in hCNCCs (E) or overexpression of TWIST1 alone rather than with ALX4 in HEK293 cells (F). G through I. Volcano plots of differential gene expression upon loss of TWIST1 (G), ALX1 (H), or ALX1 and ALX4 (I). ALX4 is excluded in (I). Selected genes highlighted in darker colors.
We next asked how similar the effects of ALX loss on chromatin accessibility are to those of TWIST1 loss. Given the correlated effects of ALX1 and ALX4 loss (Figure 5A,B), we considered their combined effects, taking any ATAC-seq peak significantly affected by loss of ALX1, ALX4, or combined loss. As there are many more TWIST1-dependent peaks, most of these are not dependent on ALXs. However, of distal peaks downregulated upon ALX loss, the vast majority (5,543/7,931; 70%) are concordant, or also downregulated upon TWIST1 loss, while few (449/7,931; 5.7%) are discordant, or upregulated upon TWIST1 loss (Figure 5C). Peaks upregulated upon ALX loss lack this enrichment for concordance with TWIST1 effects, but these represent a minority (32%) of changes. The effects of MSX1 loss are also concordant with TWIST1 loss (Figure S5E). To find the DNA sequence features driving these concordant and discordant changes, we performed motif analyses on these classes of peaks. Coordinator is highly enriched in the TWIST1- and ALX-dependent peaks, underscoring that the main function of ALX1 and ALX4 in chromatin opening is indeed at Coordinator sites (Figure 5D). We also repeated the chromatin accessibility analysis upon acute loss of each degron-tagged TF, and observed minimal changes except for TWIST1 (Figure S5D).
Loss of homeodomain TFs titrates TWIST1 away from Coordinator towards the canonical double E-box sites
In addition to Coordinator, other motifs provide insight into the mechanisms underlying TWIST1-HD cooperation (Figure 5D; Figure S5F). The dominant feature of peaks that gain accessibility upon ALX loss but lose accessibility upon TWIST1 loss is the double E-box motif, which contains two E-box motifs at a 5 bp spacing. The double E-box motif has previously been proposed to bind two copies of TWIST1:TCF3 heterodimers35 and we found it highly enriched in the top TWIST1 binding sites in the HD-negative RS4;11 cells (Figure 5D; Figure S2E). Thus, ALX loss appears to quantitatively redirect TWIST1 or its chromatin opening capacity away from Coordinator sites and towards double E-box sites.
To substantiate this observation and determine whether the distribution of TWIST1 binding at Coordinator vs double E-box sites is affected by ALX loss, we performed TWIST1 ChIP-seq in ALX1FV ALX4− hCNCCs (without ALX1 depletion) and compared the binding to that of WT cells (Figure 5E). TWIST1 binding signal is reduced at sites with the Coordinator motif but increases at sites with the double E-box motif. These changes are quantitative, potentially due to partially redundant functions of HD TFs. To confirm this finding in a cellular context without redundancy, we overexpressed TWIST1 with or without ALX4 in HEK293 cells (which lack appreciable expression of TWIST1 or most HD TFs) and then performed TWIST1 ChIP-seq. As in hCNCCs but to a greater extent in this overexpression context, TWIST1 binding to Coordinator decreased in the absence of ALX4, whereas binding to the double E-box motif increased (Figure 5F).
Shared transcriptional functions of TWIST1 and ALX factors
To assess the transcriptional functions of TWIST1 and HD factors in our in vitro hCNCC differentiation model, we used RNA-seq to identify genes significantly affected by the perturbation of TWIST1, ALX1, or both ALX1/4 (Figure 5G–I). Consistent with previous mouse studies50,51, the most significant effect of TWIST1 loss is an increase in expression of SOX10, a marker of early neural crest and neuronal/glial derivatives (Figure 5G). This is accompanied by gain of other early neural crest52,53 (FOXD3), neural progenitor (SOX2/3) and neuronal (TUBB3) markers, suggesting a defect in mesenchymal specification. Meanwhile, the loss of ALXs (expressed primarily in the anterior CNCC) leads to upregulation of TF genes normally expressed only in more posterior parts of the face (DLX1, DLX2, LHX6, LHX8, and BARX1) and downregulation of TF genes normally most abundant in the anterior regions of the face, such as PAX3, TFAP2B, and ALX4 (the latter upon ALX1 depletion) (Figure 5H,I). This suggests that ALXs promote expression of genes associated with this anterior identity, as seen in a recent Alx1-null mouse37.
Notably, there is substantial overlap between TWIST1- and ALX-responsive genes, with a subset of position-specific genes (DLX1/2, PAX3, TFAP2B) regulated by TWIST1 as well as ALXs (Figure 5G–I). Furthermore, MSX1, a gene encoding HD TF broadly expressed throughout the face and limb buds and associated with mesenchymal cell identity54, is downregulated upon loss of ALXs as well as TWIST1. This overlap is representative of overall concordance between TWIST1 and ALX transcriptional changes: genes downregulated upon ALX loss are enriched for downregulation upon TWIST1 loss as well (Figure S5G). Note that MSX1 loss affects mesenchymal specification, with upregulation of neural progenitor markers SOX2 and SOX3 as seen with TWIST1 loss (Figure S5H), but generally has fewer effects than loss of ALXs, so shared activation of MSX1 cannot explain most of the overlap in ALX and TWIST1 functions. These results suggest that TWIST1 and HD TFs co-binding at Coordinator sites drives shared transcriptional functions and may serve to integrate regulatory programs for lineage and regional identities during facial development.
The Coordinator motif guides contact and cooperativity between TWIST1 and HD TFs
We next investigated biochemical and structural mechanisms underlying cooperative co-binding of TWIST1 and HD factors at Coordinator sites. We first used immunoprecipitation-mass spectrometry (IP-MS) to identify proteins that interact with TWIST1 in hCNCCs, using a chromatin extraction protocol that minimizes the extraction of DNA (Figure 6A and Table S1). Consistent with published results, we find that TWIST1 forms stable heterodimers with its E-protein partners TCF3, TCF4, and TCF1235,42,55. However, TWIST1 lacks interactions with ALXs or other HD TFs, as confirmed by reciprocal IP-MS experiments pulling down the HD TFs (Table S1).
Figure 6. The Coordinator motif guides TWIST1-homeodomain contact and cooperativity.
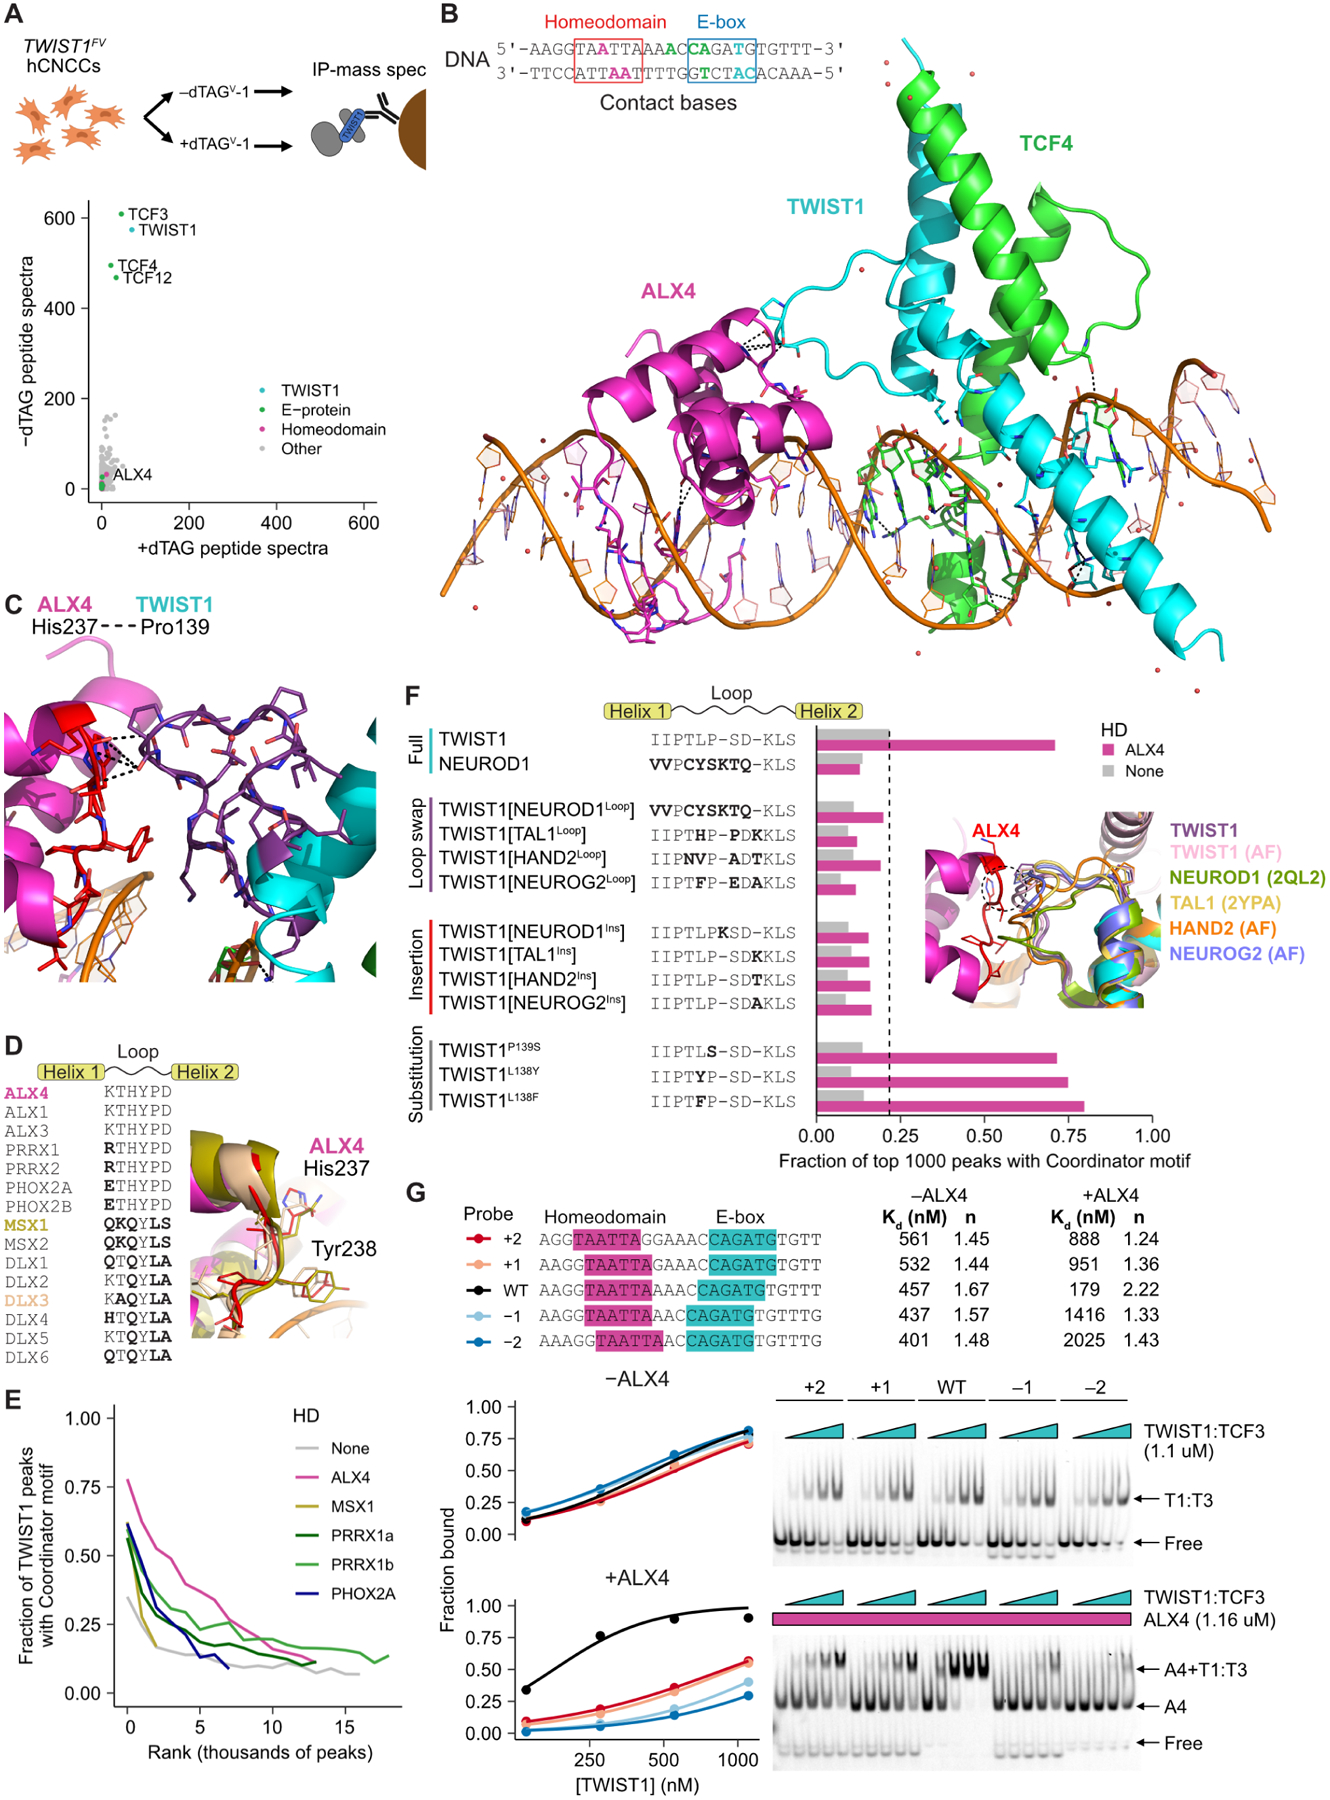
A. Immunoprecipitation-mass spectrometry (IP-MS) for TWIST1 using the V5 tag, in undepleted (-dTAG, y-axis) versus depleted (+dTAG, x-axis) hCNCC protein extracts. Plotted data are the sum of two biological replicates. B. 3D structure of TWIST1 (aa101–170), TCF4 (aa565–624), and ALX4 (aa210–277) DNA binding domains bound to the Coordinator DNA sequence. DNA bases recognized by the TFs highlighted: cyan for TWIST1, green for TCF4, and magenta for ALX4. C. Zoom-in of contact between ALX4 and TWIST1. D. Sequence alignment of selected homeodomain TF loop sequences with sequence differences from ALX4 in bold, and structural alignment of ALX4 with MSX1 (PDB: 1IG7) and DLX3 (PDB: 4XRS). E. TWIST1 preference for Coordinator motif upon homeodomain overexpression (see Figure S6A for protein levels). TWIST1 peaks ranked from strongest to weakest in bins of 1000 peaks. F. Extent of Coordinator motif binding preference of V5-tagged TWIST1 and various loop mutants expressed in HEK293 cells (see Figure S6A for protein levels) with or without ALX4. Inset: structural alignment of TWIST1 in our structure with the AlphaFold-predicted (AF) or experimentally solved (PDB: 2QL2, 2YPA) of tested bHLH loops. G. EMSA probe sequences, gels, with Hill curve fits and estimated Kd and Hill coefficients (n).
This suggested that cooperativity between TWIST1 and ALX proteins may be guided by the Coordinator motif DNA sequence. To explore this possibility, we solved an X-ray crystal structure of TWIST1, TCF4, and ALX4 DNA-binding domains co-bound to the consensus Coordinator motif, at 2.9Å resolution (Figure 6B). As expected, a TWIST1-TCF4 heterodimer binds the E-box and ALX4 binds the HD monomer motif within Coordinator. Within the bHLH dimer, TWIST1 binds the side of the E-box motif further from the HD motif, allowing its loop to contact ALX4 (Figure 6C). The contact primarily involves a hydrogen bond between the TWIST1 backbone at proline 139 and the ALX4 histidine 237 side chain, but other weaker hydrogen bonds (TWIST1 Ser140-ALX4 His237) and hydrophobic interactions (e.g. TWIST1 Lys142-ALX4 Tyr238) further stabilize the complex (Table S2). Our structure suggests that although interactions between TWIST1 and ALX4 are insufficient to form a stable complex in solution, these weak contacts are stabilized on DNA.
To validate the role of TWIST1-HD interactions in cooperativity, we explored the effects of amino acid sequence variation in both the bHLH and HD, using evolution as a guide. The amino acid residues, and more broadly the loops, involved in the TWIST1-HD contact are not invariant across paralogous TFs with highly similar DNA binding motifs (Figure 6D,F). To assess whether these loops form distinct structures, we aligned our TWIST1-TCF4-ALX4-Coordinator structure to previously solved or AlphaFold-predicted (individual) HD and bHLH structures. Despite sequence differences at the contact residue position (i.e. His to Gln substitution), MSX1 (PDB: 1IG7) and DLX3 (PDB: 4XRS) both form structures highly similar to ALX4 (Figure 6D). While the amino acid identity could impact contact affinity, this is consistent with our ChIP data suggesting that MSX1 and PRRX1 can also bind DNA at many of the same sites as ALX1/4 in hCNCCs (Figure 3D). To further test if these additional HD TFs can indeed direct TWIST1 binding towards Coordinator, we transfected plasmids encoding TWIST1 with one of ALX4, MSX1, PRRX1 (two splice isoforms), or PHOX2A into HEK293 cells and performed TWIST1 ChIP-seq. All tested HD TFs are capable of increasing TWIST1 binding to the Coordinator motif, but none as potently as ALX4 (Figure 6E), despite being expressed at comparable or higher protein levels (Figure S6A).
We next examined variation among bHLH TFs in loop sequence. In contrast to HDs, bHLH factors closely related to TWIST1 such as TAL1, HAND2, NEUROG2, and NEUROD1 adopt more distinct loop structures (Figure 6F) despite binding highly similar E-box motifs (Figure S2A). If the loop contact plays a key role in Coordinator-guided cooperativity between bHLH and HD, then replacing the bHLH loop of TWIST1 with that of the related bHLH TFs may prevent binding to Coordinator. To test this, we transfected HEK293 cells with plasmids encoding V5-tagged TWIST1 or a loop-swap mutant, each with or without ALX4, then performed ChIP-seq for the V5 tag. In addition, we tested full-length NEUROD1, the most divergent from TWIST1 of the examined bHLH TFs. All bHLH protein levels were comparable to or higher than that of WT TWIST1 (Figure S6A). Although wild-type TWIST1 binds the Coordinator motif robustly in the presence of ALX4, neither full-length NEUROD1 nor any of the loop-swap TWIST1 mutants do so (Figure 6F), instead binding to their known E-box motifs (Figure S6B). To pinpoint which amino acid changes drive this selective ALX4 cooperativity, we tested subsets (Figure S6C) and ultimately single amino acid substitutions and insertions (Figure 6F). Notably, all four single amino acid insertions strongly reduce cooperativity, regardless of the inserted residue or position. TWIST1’s loop is among the shortest of all bHLH factors in humans; the longer loops of other bHLH TFs likely contribute to kinked structures incompatible with the ALX4 contact. In contrast to the critical role of loop length, none of the tested substitutions have a detectable effect on cooperativity, including changing the ALX4-contacting proline residue (Figure 6F). This can be explained by the observation that the TWIST1 peptide backbone contacts ALX4, rather than a side chain. Collectively, these results illustrate how the cooperative binding of TWIST1 and HD TFs depends on the sequence and structure of the TWIST1 loop.
Importance of Coordinator DNA sequence features in TF cooperativity
If TWIST1-ALX4 cooperativity is mediated by weak protein interactions, it should also depend on the DNA sequence positioning the TFs at the right distance and angle. We tested this by repeating our original human-chimpanzee enhancer divergence analyses19 with variant Coordinator motifs in which we extended or shortened the spacer between the homeodomain and E-box motifs by up to 3 bases (Figure S6D, STAR Methods). Briefly, for each Coordinator motif variant, we calculated the correlation between the net change in motif p-value and the change in H3K27ac signal in human vs chimp across all human-chimp divergent enhancers. This correlation (Pearson r = 0.558) was highly sensitive to spacer length, falling to r < 0.16 with even 1 bp changes.
To further test this idea in vitro, we performed electrophoretic mobility shift assays (EMSAs) with purified recombinant TWIST1, TCF3, and ALX4 DNA-binding domains and labeled DNA templates containing the consensus “wild-type” (WT) Coordinator motif or various DNA mutations (Figure S6E). We first confirmed that TWIST1:TCF3 dimer and ALX4 can independently bind the WT DNA at sufficiently high concentrations, but not templates in which their canonical motifs were abolished (Figure S6F,G). Upon titrating TWIST1:TCF3 in the presence of excess ALX4, TWIST1:TCF3-DNA binding occurs at ~2.5 fold lower concentrations and fits Hill equations with higher cooperativity coefficients (>2 vs ~1.5) (Figure 6G, Figure S6H). To test the role of DNA sequence in this cooperativity, we then assayed the effects of mutating the homeodomain motif or changing to the spacer length (from +2 to −2 bp). Strikingly, these mutations all eliminated TWIST1 cooperativity with ALX4, despite no effect on TWIST1:TCF3-DNA binding in the absence of ALX4 (Figure 6G).
Most native genomic instances of TWIST1-bound Coordinator motifs are imperfect. We therefore tested TWIST1 cooperativity with ALX4 at a partial E-box motif (CAGACG) (Figure S6I). Though independent TWIST1:TCF3 binding was reduced (~5–6 fold) as expected, cooperative binding with ALX4 was only mildly affected (<2-fold), indicating even greater cooperativity in this sequence context, with a net >10-fold decrease in Kd upon ALX4 addition. Finally, we tested whether the spacer sequence between the homeodomain and E-box motifs affects TWIST1-ALX4 cooperativity by testing a DNA template with the As in the spacer replaced with Cs (Figure S6J). TWIST1:TCF3 binding is reduced (~2-fold) even in the absence of ALX4, consistent with protein-DNA contacts extending beyond the E-box in our structure and previous studies of bHLH recognition of DNA shape flanking the E-box motif56. This change in spacer sequence also affects cooperativity with ALX4; the estimated cooperativity coefficient is comparable to TWIST1:TCF3 in the absence of ALX4. Thus, the A-rich spacer preference may arise from both TWIST1:E-protein direct DNA recognition and the role of the spacer DNA shape in mediating TWIST1-ALX4 contact. Together, these results demonstrate how DNA sequence guides TWIST1-HD cooperativity by positioning the TFs next to each other.
The roles of Coordinator-binding TFs and their genomic targets in facial shape variation
We initially identified the Coordinator motif through analysis of enhancer divergence between human and chimpanzee cranial neural crest (Figure 1A)19. Having uncovered the trans-regulatory complex that binds Coordinator, we aimed to assess the potential impacts of the identified TFs and their genomic targets on human phenotypic variation. Our previous genome-wide association study (GWAS) identified over 200 loci associated with normal-range variation in facial shape among individuals of European ancestry and revealed enrichment of face shape-associated genetic variants in CNCC enhancers57. To assess the contribution of Coordinator-binding TFs to human facial variation, we used two orthogonal approaches. In the first approach, we investigated the phenotypic impact of genetic variants at the loci encoding Coordinator-binding TFs. In the second approach, we focused on enrichment of facial shape heritability at genomic targets regulated by Coordinator-binding TFs.
Examination of facial shape GWAS signals revealed that loci encoding each of the Coordinator-binding TFs analyzed in this study (i.e. TWIST1, ALX1, ALX4, MSX1, and PRRX1) have facial shape-associated SNPs in nearby non-coding regions, suggesting that quantitative changes in expression of Coordinator-binding TFs may modulate individual divergence of facial shape in humans (Figure 7A–E). Given the complex and multifactorial nature of the human face, we previously used a multivariate approach to model the aspects of shape variation associated with a single SNP (STAR Methods, Figure S7A). Each of the five TF genes had two independent SNPs that reached genome-wide significance (p < 5×10⁻⁸), tens to hundreds of kilobases apart and each with distinct effects on facial shape. For example, the SNP rs212672 near TWIST1 has most significant effects on the entire face, including shape changes in the forehead and chin, whereas rs1178102 ~60 kb upstream instead has most significant effect on the shape of the nostrils (Figure 7A). These variants (with others in tight linkage) likely impact different context-specific cis-regulatory elements and thereby modulate TF expression in distinct spatiotemporal manners.
Figure 7. The roles of Coordinator-binding TFs in facial shape variation.

A-E. Facial shape effects associated with genetic variants at loci encoding Coordinator-binding TFs (A, TWIST1; B, ALX1; C, MSX1; D, ALX4; E, PRRX1). LocusZoom plots (left) show SNPs plotted by p-value of facial shape association and colored by linkage disequilibrium (r2) to the lead SNP in each locus. Note that p-values are with respect to the trait of each lead SNP. Coordinates in hg19. Facial shape effects of each lead SNP near Coordinator-binding TF genes, as normal displacement (displacement in the direction normal to the facial surface) for the facial region (Figure S7A) with highest significance for each lead SNP. F. Facial shape heritability enrichment at TWIST1-dependent regulatory regions. Vertical line indicates enrichment in all hCNCC distal ATAC peaks; flanking dashed lines indicate error bars (s.e.m.).
As further validation of the role of Coordinator-binding TFs in human facial shape, we examined another completely independent GWAS dataset relevant to the face. We previously conducted a GWAS for brain shape inferred from MRI scans58 that had uncovered an unexpectedly high shared genetics underlying variation in brain and face shape. While some of the shared brain-face loci are associated with genes known to play pleiotropic roles in both brain and facial development, others are near genes that are not expressed in the developing brain, but instead are primarily expressed in CNCCs and the developing face. Among the top shared brain-face shape associated genes lacking expression in the brain (excluding mesenchyme in and around the brain) are TWIST1, ALX1, and ALX4. TWIST1 has three independent genome-wide significant peaks in this brain shape GWAS, while ALX1 and ALX4 each have one (Figure S7B–D). Since these genes are not robustly expressed in the brain, the association with brain shape are therefore likely driven by the developing face, for example, through control of regulatory programs modulating the ability of the facial mesenchyme to respond to and accommodate brain growth. Consistent with this possibility, the genetic effects of the TWIST1, ALX1, and ALX4 on brain shape are enriched in the forebrain (Figure S7B–D), which develops in proximity to the face. Together, these observations indicate that all loci encoding TF components of the Coordinator trans-regulatory complex are implicated in human phenotypic variation.
Finally, we examined whether genomic targets regulated by Coordinator-binding TFs are disproportionately enriched for facial shape heritability. To assess contributions of specific sets of genomic regions responsive to TF losses, we used stratified linkage disequilibrium score regression (S-LDSC) to determine the heritability enrichment of each set of regions compared to: (i) an accessibility-matched control set of hCNCC distal ATAC peaks (control) or (ii) the entire set of hCNCC distal ATAC peaks (all peaks, including all putative CNCC enhancers that we have previously shown are enriched for facial shape heritability57,59) (Figure 7F). We first tested the set of distal regions differentially accessible within 3 h of acute TWIST1 depletion, separately assessing the up- and downregulated peaks. Notably, the downregulated but not the upregulated TWIST1-dependent peaks are highly enriched for the Coordinator motif. The downregulated peaks are also highly enriched for facial shape heritability [25.6-fold enrichment over the genome, in contrast to 2.44-fold enrichment in the control peaks (p = 2.47×10⁻⁶, downregulated vs matched control peaks, t-test) and 9.35-fold enrichment across all peaks (p = 6.63×10⁻⁵, downregulated vs all peaks, t-test). In contrast, the upregulated peaks have a lower enrichment than either the matched or full control sets. We observed similar results for the peaks differentially accessible upon long-term TWIST1 loss.
When we repeated this analysis using the brain shape GWAS statistics, we again found a significant enrichment of the brain shape heritability at TWIST1-dependent, Coordinator-containing regulatory regions compared to various controls, though this enrichment was smaller than for face shape heritability (as expected, given that most of the brain shape GWAS signals are relevant to brain development and not to facial development) (Figure S7E). Specifically, the distal ATAC-seq peaks that decrease in accessibility upon acute TWIST1 depletion were 13.7-fold enriched for brain shape heritability, compared to the 5.3-fold enrichment of accessibility-matched non-responsive ATAC-seq peaks (p = 0.014, t-test), and 6.4-fold enrichment of all CNCC distal ATAC-seq peaks (p = 0.0077, t-test). By contrast, ATAC-seq peaks that increase in accessibility upon TWIST1 depletion were instead depleted of brain shape GWAS heritability compared to the full set of CNCC distal ATAC-seq peaks. As a negative control, we analyzed the same genomic regions for enrichment of an unrelated trait, height. Height does not show the same pattern of enrichment in downregulated peaks even though height GWAS signal is enriched in hCNCC distal ATAC peaks overall, likely due to shared programs for skeletal development being involved in both traits (Figure S7F). These results indicate that genetic variation in the Coordinator-containing, TWIST1-dependent regulatory regions ultimately modulates human facial shape. Together, these observations link Coordinator-binding TFs and their genomic targets to human phenotypic variation.
Discussion
Although we first discovered the Coordinator motif through comparisons of human and chimpanzee CNCCs19, Coordinator is not restricted to primates nor the developing face. Instead, Coordinator is selectively enriched at cis-regulatory regions of undifferentiated mesenchymal cells from both face and limb buds, which have distinct embryonic origins (neural crest vs mesoderm, respectively) but share expression of many key TFs. Across species, we detected Coordinator enrichment in mouse and chick limb bud mesenchyme (Figure S1D)60. However, although Drosophila have homologs of TWIST1 and its HD partners, with well-conserved DNA-binding domains, they have not been reported to bind Coordinator or similar composite motifs; this is in line with the emergence of neural crest and facial ectomesenchyme in vertebrates. Thus, evolutionarily ancient TFs can be repurposed for novel functions during emergence of new cell types.
The TFs binding Coordinator have well-documented roles in face and limb development, as shown both in mouse models and by human genetics. For example, mouse knockouts of Twist150,61, Alx137, and Alx4 (in combination with mutations of Alx1 or Alx3)37,62 all have strong craniofacial phenotypes that most profoundly manifest in the anterior facial regions. Similarly, Twist163, Alx64, Msx54,65, and Prrx66,67 factors are involved in limb development in the mouse. In humans, mutations in TWIST1 are associated with the Saethre-Chotzen and Sweeney-Cox syndromes, characterized by facial dysmorphisms, craniosynostosis, and limb malformations68,69, mutations in genes encoding ALX TFs cause frontonasal dysplasias70–73, and mutations in PRRX1 are associated with agnathia-otocephaly complex (absence of mandible)74. Our observations further suggest that cis-regulatory mutations that affect Coordinator motif or expression of its associated TFs play an important role in mediating inter- and intra-species phenotypic divergence in face shape. This role in phenotypic variation is likely not restricted to humans or primates: genetic variants in the ALX1 locus are associated with beak shape in Darwin’s finches75, while a bat PRRX1 enhancer contributed to its elongated forelimbs76.
Embryonic development requires placement of the right cell types in the right places. Coordinator-guided cooperativity between TWIST1, a well-known regulator of mesenchymal lineage, and HDs, many of which have been implicated in establishing or maintaining positional identity (e.g. along anterior-posterior or proximal-distal axes), may serve to coordinate cell type and positional information in the embryonic mesenchyme. TWIST1 is broadly expressed across the undifferentiated mesenchyme of the face and limb buds, where it has been shown to promote mesenchymal identity50,51,61. Beyond the face and limbs, TWIST1 functions in other processes associated with mesenchymal identity, such as during epithelial-to-mesenchymal transition in cancer cells77 and mesoderm development in Drosophila78,79, but in these contexts TWIST1 binds canonical solo and double E-box motifs35,80. Thus, TWIST1 performs distinct cellular and organismal functions, with Coordinator-guided cooperativity with HD TFs potentially enabling functions specific to face and limb development.
In contrast to the broad expression of TWIST1 across the developing mesenchyme, expression of HD TFs is more regionally restricted (Figure 2D). ALXs and DLXs are expressed in, and involved in development of, the anterior and posterior facial structures, respectively38,81, while MSX and PRRX TFs are more broadly transcribed throughout the developing face81. The observation that Coordinator enrichment and TWIST1 binding at Coordinator sites are detectable in regulatory regions of mandibular prominences (Figure 1D, 2D), combined with the structural similarity of the DLX3 and ALX4 homeodomains (Figure 6D), suggest that in the developing jaw mesenchyme, TWIST1 likely also cooperates with the DLXs. However, the strength of Coordinator binding may contribute to the incipient divergence of facial regions, as the anterior-most FNP exhibits the highest Coordinator motif enrichment among TWIST1 binding sites (Figure 2B). Together with our observation that ALXs have the strongest cooperation with TWIST1 (Figure 6E), this may explain the prior observation that a conditional knockout of TWIST1 in the neural crest leads to the most dramatic phenotype (a near-complete loss) in the upper face derived from the FNP and maxillary prominences, while the mandible is less affected50.
Cooperation at Coordinator is remarkably selective among cell types and TFs, akin to the OCT4-SOX2 motif defining pluripotent stem cells. Even TFs with highly similar individual TF motifs that are co-expressed with some of the same candidate partner TFs are unable to cooperate: NEUROD1 cannot cooperate with ALX4 (Figure 6F), and in the developing forebrain, the abundant DLX factors do not bind Coordinator despite nearby enrichment of neurogenic bHLH TF motifs (Table S3)82. Nevertheless, in vitro, other bHLH-HD TF pairs can co-bind composite motifs by CAP-SELEX10, so while Coordinator itself has not been seen in other cellular contexts, other TF pairs may be capable of co-binding distinct composite motifs. Furthermore, whether a given pair of TFs will preferentially bind at composite sites in vivo may depend not only on the strength of co-binding between the two partners, but also on the milieu of other TFs capable of interactions with the cooperating TFs such as E-proteins and TALE-type HD TFs83, for bHLH and HD factors, respectively.
Limitations of the study
Most of the study was done in the in vitro derived hCNCCs that model anterior CNCCs. More work is needed to decipher which HD TFs cooperate with TWIST1 in other biological contexts where Coordinator is active, such as the more posterior CNCCs of the upper and lower jaw, and limb bud mesenchyme. The crystal structure and EMSAs were performed with DNA binding domains recombinantly expressed in E. coli and lack post-translational modifications and the disordered regions present in cells that may further regulate TF cooperativity. Facial and brain shape GWAS data were only analyzed for individuals of European ancestry in the US and UK; further work will be needed in other populations.
STAR Methods
RESOURCE AVAILABILITY
Lead contact
Further information and requests for resources and reagents should be directed to and will be fulfilled by the Lead Contact, Joanna Wysocka (wysocka@stanford.edu).
Materials availability
Plasmids generated in this study will be deposited in Addgene upon publication. All other reagents are available upon request.
Data and code availability
All sequencing datasets have been deposited in NCBI GEO and are publicly available at accession GSE230319. Accession numbers of reanalyzed publicly available datasets are listed in Table S4. ENCODE datasets were downloaded from https://www.encodeproject.org/. CCLE data were downloaded from https://depmap.org/portal/download/all/, Release 22Q1 “CCLE_expression.csv” and “sample_info.csv”. Mass spectrometry peptide spectrum match counts are provided in Table S1. The TWIST1-TCF4-ALX4 crystal structure atomic coordinates and diffraction data have been deposited to Protein Data Bank under accession 8OSB.
All original code have been deposited to Zenodo and is publicly available as of the date of publication. DOI is listed in the key resources table.
Any additional information required to reanalyze the data reported in this paper is available from the lead contact upon request.
Key resources table
| REAGENT or RESOURCE | SOURCE | IDENTIFIER |
|---|---|---|
| Antibodies | ||
| Mouse monoclonal TWIST1 (WT, ChIP, CUT&RUN) | Abcam | Cat# ab50887; RRID:AB_883294 |
| Mouse monoclonal ALX4 (WB, CUT&RUN) | Novus Bio | Cat# NBP2-45490; RRID:AB_3073561 |
| Rabbit polyclonal ALX1 (WB) – discontinued | Novus Bio | Cat# NBP1-88189 |
| Rabbit polyclonal MSX1 (WB) – discontinued | Origene | Cat# TA590129 |
| Mouse monoclonal PRRX1 (WB) | Santa Cruz Biotechnology | Cat# sc-293386; RRID:AB_3073562 |
| Rabbit polyclonal CTCF (WB, CUT&RUN) | Cell Signaling | Cat# 2899; RRID:AB_2086794 |
| Rabbit monoclonal HSP90 (WB) | Cell Signaling | Cat# 4877; RRID: RRID:AB_2233307 |
| Rabbit monoclonal V5 tag (WB, IP) | Abcam | Cat# ab206566; RRID:AB_2819156 |
| Mouse monoclonal Flag tag (WB) | Sigma | Cat# F1804; RRID:AB_262044 |
| Donkey polyclonal anti-rabbit IgG (H+L) HRP (WB) | Jackson Immunoresearch | Cat# 711-035-152; RRID:AB_10015282 |
| Goat polyclonal anti-mouse IgG (H+L) HRP (WB) | Jackson Immunoresearch | Cat# 115-005-003; RRID:AB_2338447 |
| Rabbit polyclonal V5 tag (ChIP) | Abcam | Cat# ab15828; RRID:AB_443253 |
| Rabbit polyclonal H3K27ac (ChIP) | Active Motif | Cat# 39133; RRID:AB_2561016 |
| Rabbit monoclonal AP-2α (ChIP, CUT&RUN) | Cell Signaling | Cat# 3215; RRID:AB_2227429 |
| Mouse monoclonal AP-2α (ChIP) | Novus Bio | Cat# NB100-74359; RRID:AB_1048155 |
| Mouse monoclonal TCF3 (E2A) (CUT&RUN) | Santa Cruz Biotechnology | Cat# sc-133074; RRID:AB_2199147 |
| Rabbit polyclonal anti-mouse IgG (H+L) (CUT&RUN) | Abcam | Cat# ab46540; RRID:AB_2614925 |
| Chemicals, peptides, and recombinant proteins | ||
| mTeSR 1 | Stem Cell Technologies | Cat# 85850 |
| Matrigel Growth Factor Reduced (GFR) Basement Membrane Matrix | Corning | Cat# 356231 |
| ReLeSR | Stem Cell Technologies | Cat# 05872 |
| mTeSR Plus | Stem Cell Technologies | Cat# 100-0276 |
| RPMI-1640 | Gibco | Cat# 11875093 |
| Antibiotic-antimycotic | Sigma-Aldrich | Cat# A5955 |
| DMEM High glucose with L-glutamine, sodium pyruvate | Cytiva | Cat# SH30243.01 |
| GlutaMAX | Gibco | Cat# 35050061 |
| Non-essential amino acids | Gibco | Cat# 1114-0050 |
| Complete ES Cell Medium with 15% FBS | Millipore | Cat# ES-101-B |
| mLIF | Millipore | Cat# ESG1107 |
| SpeI-HF | NEB | Cat# R3133S |
| XbaI | NEB | Cat# R0145S |
| Gibson assembly master mix | NEB | Cat# E2611S |
| SalI-HF | NEB | Cat# R3138S |
| BclI | NEB | Cat# R0160S |
| Polyethylenimine | Sigma | Cat# 408719 |
| Opti-MEM | Gibco | Cat# 31985070 |
| Benzonase | Millipore | Cat# 71205-3 |
| OptiPrep Density Gradient medium | Sigma-Aldrich | Cat# D1556-250ML |
| Pluronic F-68 | Gibco | Cat# 240 4-0032 |
| Turbo DNase | Invitrogen | Cat# AM2238 |
| Collagenase IV | Gibco | Cat# 17104019 |
| KnockOut DMEM | Gibco | Cat# 10829018 |
| DMEM/F12 1:1 medium, with L-glutamine; without HEPES | Cytiva | Cat# SH30271.FS |
| Neurobasal Medium | Gibco | Cat# 21103049 |
| N2 NeuroPlex | Gemini Bio | Cat# 400-163 |
| Gem21 NeuroPlex | Gemini Bio | Cat# 400-160 |
| EGF | Peprotech | Cat# AF-100-15 |
| bFGF | Peprotech | Cat# 100-18B |
| Bovine insulin | Gemini Bio | Cat# 700-112P |
| Accutase | Sigma-Aldrich | Cat# A6964-100ML |
| Human fibronectin | Millipore | Cat# FC010-10MG |
| BSA | Gemini Bio | Cat# 700-104P |
| BMP2 | Peprotech | Cat# 120-02 |
| CHIR-99021 | Selleckchem | Cat# S2924 |
| dTAGV-1 | Tocris | Cat# 6914/5 |
| Y-27632 RHO/ROCK pathway inhibitor | Stem Cell Technologies | Cat# 72304 |
| Alt-R S.p. HiFi Cas9 nuclease V3 | Integrated DNA Technologies | Cat# 1081059 |
| QuickExtract DNA Extraction Solution | Lucigen | Cat# QE9050 |
| Lipofectamine 2000 | Invitrogen | Cat# 11668019 |
| FuGENE 6 | Promega | Cat# E2691 |
| cOmplete EDTA-free protease inhibitor cocktail | Roche | Cat# 11873580001 |
| NuPAGE LDS Sample Buffer | Invitrogen | Cat# NP0007 |
| 4–12% Novex Tris-glycine gels | Invitrogen | Cat# XV04125PK20 |
| 4–20% Novex Tris-glycine gels | Invitrogen | Cat# XV04205PK20 |
| Nitrocellulose membrane | GE Healthcare | Cat# 10600003 |
| Amersham enhanced chemiluminescence (ECL) Prime reagent | Cytiva | Cat# RPN2232 |
| DNase I | Worthington | Cat# LS006331 |
| Ampure XP beads | Beckman Coulter | Cat# A63881 |
| Methanol-free 16% formaldehyde solution | Pierce | Cat# 28908 |
| RNase A | Thermo | Cat# EN0531 |
| Proteinase K | Thermo | Cat# EO0491 |
| Dynabeads Protein A | Invitrogen | Cat# 10002D |
| Dynabeads Protein G | Invitrogen | Cat# 10004D |
| Concanavalin A beads | Epicypher | Cat# 21-1401 |
| pAG-MNase | Epicypher | Cat# 15-1016 |
| E. coli spike-in DNA | Epicypher | Cat# 18-1401 |
| TRIzol | Invitrogen | Cat# 15596018 |
| 4-thiouridine | Carbosynth | Cat# NT06186 |
| Iodoacetamide | G Biosciences | Cat# 786-078 |
| 0.05% Trypsin-EDTA | Gibco | Cat# 25300054 |
| phosSTOP | Roche | Cat# 4906845001 |
| Trypsin/LysC | Promega | Cat# V5071 |
| 0.02% ProteaseMax | Promega | Cat# V2071 |
| NEBuffer 2 | NEB | Cat# B7002S |
| LightShift Poly (dI-dC) | Thermo | Cat# 20148E |
| Critical commercial assays | ||
| OptiSeal tubes | Beckman Coulter | Cat# 362183 |
| Amicon Ultra-15 100K filter | Millipore | Cat# UFC910008 |
| LightCycler 480 Probes Master | Roche | Cat# 04707494001 |
| P3 Primary Cell 4D-Nucleofector X Kit L | Lonza | Cat# V4XP-3034 |
| Quick-DNA mini prep kit | Zymo | Cat# D3024 |
| Dual-Luciferase Reporter assay kit | Promega | Cat# E1960 |
| BCA Protein Assay | Thermo | Cat# 23225 |
| TD enzyme | Illumina | Cat# 20034197 |
| DNA Clean & Concentrator-5 | Zymo | Cat# D4013 |
| NEBNext Ultra II Q5 master mix | NEB | Cat# M0544 |
| Qubit dsDNA high sensitivity | Invitrogen | Cat# Q33231 |
| TPX 1.5 ml tubes | Diagenode | Cat# c30010010-50 |
| ChIP DNA Clean & Concentrator-5 | Zymo | Cat# D5205 |
| NEBNext Ultra II DNA | NEB | Cat# E7645S |
| RNA Clean & Concentrator-5 | Zymo | Cat# R1013 |
| Qubit RNA broad range assay | Invitrogen | Cat# Q10210 |
| QuantSeq 3’ mRNA-Seq Library Prep FWD | Lexogen | Cat# 113.96 |
| Direct-zol RNA miniprep | Zymo | Cat# R2052 |
| Dynabeads Antibody Coupling kit | Invitrogen | Cat# 14311D |
| JCSG crystallization kit | Molecular Dimensions | |
| Deposited data | ||
| ChIP-seq, ATAC-seq, CUT&RUN, RNA-seq | This paper | GEO: GSE230319 |
| Crystal structure of TWIST1, TCF4, ALX4, BRG1 bound to DNA | This paper | PDB: 8OSB |
| Experimental models: Cell lines | ||
| Human: Female H9 human embryonic stem cells (hESCs) | WiCell | WA09; RRID:CVCL_9773 |
| Human: Female RS4;11 cells | ATCC | CRL-1873; RRID:CVCL_0093 |
| Human: Female HEK293 cells | ATCC | CRL-1573; RRID:CVCL_0045 |
| Human: Female 293FT cells | Invitrogen | R70007; RRID:CVCL_6911 |
| Mouse: O9-1 cells | Millipore | SCC049; RRID:CVCL_GS42 |
| Experimental models: Organisms/strains | ||
| Mouse: CD-1 | Charles River Laboratories | RRID:MGI:5649524 |
| Oligonucleotides | ||
| Primers for cloning and genotyping, see Table S5 | ||
| HDR oligos and gRNAs for CRISPR/Cas9 editing, see Table S5 | ||
| Recombinant DNA | ||
| pAAV-GFP | Gray et al84 | Addgene 32395 |
| pCAG-NLS-HA-Bxb1 | Hermann et al87 | Addgene 51271 |
| PB-iNEUROD1_P2A_GFP_Puro | Dailamy et al86 | Addgene 168803 |
| pAAV-hSOX9-dTAG-mNeonGreen-V5 | Naqvi et al46 | Addgene 194971 |
| pDGM6 | Gregorevic et al85 | Addgene 110660 |
| pRL | Promega | N/A |
| pGL3-SV40_control | Promega | N/A |
| pUC19 | NEB | Cat# N3041S |
| pGL3-noSV40 | Long et al23 | N/A |
| pGL3-noSV40humanEC1.45_min1-2 | Long et al23 | Addgene 173952 |
| pcDNA3.1_MSX1-Flag | Genscript | OHu18516D |
| pcDNA3.1_PRRX1a-Flag | Genscript | OHu23742D |
| pcDNA3.1_PRRX1b-Flag | Genscript | OHu15551D |
| pcDNA3.1_PHOX2A-Flag | Genscript | OHu18020D |
| pAAV_FKBP-V5-TWIST1 | This paper | N/A |
| pAAV_FKBP-V5-ALX1 | This paper | N/A |
| pAAV_FKBP-V5-PRRX1 | This paper | N/A |
| pAAV_MSX1-FKBP-mNeonGreen-V5 | This paper | N/A |
| pGL3-noSV40-humanEC1.45_min1-2_4XEboxMutant | This paper | N/A |
| pCAG_TWIST1 | This paper | N/A |
| pCAG_ALX4-Flag-HA | This paper | N/A |
| pcDNA3.1_ALX4-Flag | This paper | N/A |
| pcDNA3.1_V5-TWIST1 | This paper | N/A |
| pcDNA3.1_V5-NEUROD1 | This paper | N/A |
| pcDNA3.1_V5-TWIST1_NEUROD1loop | This paper | N/A |
| pcDNA3.1_V5-TWIST1_NEUROG2loop | This paper | N/A |
| pcDNA3.1_V5-TWIST1_HAND2loop | This paper | N/A |
| pcDNA3.1_V5-TWIST1_TAL1loop | This paper | N/A |
| pcDNA3.1_V5-TWIST1_NEUROD1ins | This paper | N/A |
| pcDNA3.1_V5-TWIST1_NEUROG2ins | This paper | N/A |
| pcDNA3.1_V5-TWIST1_HAND2ins | This paper | N/A |
| pcDNA3.1_V5-TWIST1_TAL1ins | This paper | N/A |
| pcDNA3.1_V5-TWIST1_P139S | This paper | N/A |
| pcDNA3.1_V5-TWIST1_L138Y | This paper | N/A |
| pcDNA3.1_V5-TWIST1_L138F | This paper | N/A |
| pcDNA3.1_V5-TWIST1_NEUROD1L | This paper | N/A |
| pcDNA3.1_V5-TWIST1_NEUROD1R | This paper | N/A |
| pcDNA3.1_V5-TWIST1_NEUROD1M | This paper | N/A |
| Software and algorithms | ||
| Dozor-MeshBest | Melnikov et al88 | N/A |
| BEST | Bourenkov and Popov89 | https://www.embl-hamburg.de/BEST/ |
| XDS | Kabsch90 | https://xds.mr.mpg.de/ |
| skewer v0.2.2 | Jiang et al91 | https://github.com/relipmoc/skewer |
| bowtie2 v2.4.1 | Langmead and Salzberg92 | https://bowtie-bio.sourceforge.net/bowtie2/index.shtml |
| samtools v1.10 | Danecek et al93 | https://samtools.sourceforge.net/ |
| MACS2 v2.2.7.1 | Zhang et al94 | https://github.com/macs3-project/MACS |
| bedtools | Quinlan and Hall95 | https://github.com/arq5x/bedtools2 |
| DESeq2 | Love et al96 | https://bioconductor.org/packages/release/bioc/html/DESeq2.html |
| IGV v2.7.2 | Robinson et al97 | https://igv.org/ |
| deeptools | Ramirez et al98 | https://deeptools.readthedocs.io/en/develop/index.html |
| tximport | Soneson et al99 | https://bioconductor.org/packages/release/bioc/html/tximport.html |
| slamdunk v0.4.3 | Neumann et al100 | https://t-neumann.github.io/slamdunk/ |
| MEME Suite v5.1.1 TOMTOM | Gupta et al101 | https://meme-suite.org/meme/doc/download.html |
| MEME Suite v5.1.1 AME | McLeay and Bailey102 | https://meme-suite.org/meme/doc/download.html |
| MEME Suite v5.1.1 FIMO | Grant et al103 | https://meme-suite.org/meme/doc/download.html |
| PWMScan | Ambrosini et al104 | https://epd.expasy.org/pwmtools/pwmtools/ |
| MEME Suite v5.1.1 STREME | Bailey et al105 | https://meme-suite.org/meme/doc/download.html |
| MEME Suite v4.12.0 ceqlogo | Timothy Bailey lab | https://meme-suite.org/meme/doc/download.html |
| Preview | Protein Metrics | https://proteinmetrics.com/resources/preview-a-program-for-surveying-shotgun-proteomics-tandem-mass-spectrometry-data/ |
| Byonic | Protein Metrics | https://proteinmetrics.com/byonic/ |
| Phaser | McCoy et al106 | https://www.phaser.cimr.cam.ac.uk/index.php/Phaser_Crystallographic_Software |
| Phenix | Adams et al107 | https://phenix-online.org/ |
| CCP4 | Winn et al108 | https://www.ccp4.ac.uk/ |
| REFMAC5 | Murshudov et al109 | https://www.ccp4.ac.uk/ |
| Coot | Emsley et al110 | https://www2.mrc-lmb.cam.ac.uk/personal/pemsley/coot/ |
| PyMOL | 111 | https://www.pymol.org/2 |
| Fiji | Schindelin et al112 | https://fiji.sc/ |
| LD score regression v1.0.1 | Finucane et al113 | https://github.com/bulik/ldsc |
| Matching package for R v4.10-8 | Sekhon114 | https://cran.r-project.org/web/packages/Matching/index.html |
| UCSC Kent tools | Kent et al115 | https://genome.ucsc.edu/ |
| Original code | This paper | https://zenodo.org/doi/10.5281/zenodo.7847852 |
| Other | ||
| Beckman VTi 50 rotor | Beckman Coulter | N/A |
| Bioruptor Plus | Diagenode | N/A |
| Amersham ImageQuant 800 | Cytiva | N/A |
| Countess II | Invitrogen | N/A |
| NovaSeq X Plus | Illumina | N/A |
| NovaSeq 6000 | Illumina | N/A |
| HiSeq X Ten | Illumina | N/A |
| Acquity M-Class UPLC | Waters | N/A |
| Orbitrap Q Exactive HF-X | Thermo | RRID:SCR_018703 |
| Orbitrap Exploris 480 | Thermo | RRID:SCR_022215 |
| LightCycler 480 | Roche | N/A |
| Lonza 4D-Nucleofector | Lonza | N/A |
EXPERIMENTAL MODEL AND STUDY PARTICIPANT DETAILS
Cell culture
Female H9 cells (WiCell, WA09, RRID:CVCL_9773) were cultured in feeder-free conditions, in mTeSR1 medium (Stem Cell Technologies, 85850) on Matrigel Growth Factor Reduced (GFR) Basement Membrane Matrix (Corning, 356231) and passaged using ReLeSR (Stem Cell Technologies, 05872) every 4–6 days. Cells were switched to mTeSR Plus medium (Stem Cell Technologies, 100–0276) prior to and during genome editing and clonal expansion, but switched back to mTeSR1 before differentiation to CNCC.
Female RS4;11 cells (ATCC, CRL-1873, RRID:CVCL_0093) were cultured in RPMI-1640 medium (Gibco, 11875093) supplemented with 10% v/v FBS and 1x antibiotic/antimycotic.
Female HEK293 cells (ATCC, CRL-1573, RRID:CVCL_0045) and female 293FT cells (Invitrogen, R70007, RRID:CVCL_6911) were cultured in DMEM high glucose medium with sodium pyruvate and L-glutamine, supplemented with 10% v/v FBS and 1x GlutaMAX, non-essential amino acids, and antibiotic/antimycotic.
Mixed male and female O9–1 cells (Millipore, SCC049, RRID:CVCL_GS42) used for spike-in controls for ChIPs of TWIST1 depletions were cultured in Complete ES Cell Medium with 15% FBS (Millipore, ES-101-B), 25 ng/ml bFGF, and mLIF (Millipore, ESG1107).
Animal procedures
CD-1 mice (RRID:MGI:5649524) were obtained from Charles River Laboratories and housed in RAFII facility at Stanford University. Animal care and all procedures were conducted in accordance with the Stanford University Administrative Panel on Laboratory Animal Care (under pre-approved protocol APLAC-30364). For timed pregnancies, an 8-week old female CD-1 mouse was introduced to a cage with a single >10-week old CD-1 male and monitored for plugs. The noon of the day that a vaginal plug was detected was considered E0.5. Pregnant mice were sacrificed at E10.5 for dissections of facial prominences and limb buds from mixed male and female embryos.
METHOD DETAILS
Oligonucleotides
Primers used in this study are listed in Table S5.
Plasmids and cloning
AAV donor templates were cloned into the pAAV-GFP (Addgene plasmid # 32395) backbone by digesting pAAV-GFP with SpeI-HF (NEB, R3133S) and XbaI (NEB, R0145S) and performing Gibson assembly (NEB, E2611S) with PCR products of the ~1 kb homology arms and tags. Flexible linkers (glycine-serine or glycine-alanine) of 5–11 aa were added in between the degron and epitope tags and the TF of interest.
Plasmids in the pCAG backbone used to overexpress TWIST1 and ALX4 in HEK293 cells were cloned by digesting the pCAG-NLS-HA-Bxb1 plasmid (Addgene plasmid # 51271) prepared from dam-/dcm- E. coli (NEB, C2925H) with SalI-HF (NEB, R3138S) and BclI (NEB, R0160S) followed by Gibson assembly with PCR products of desired inserts.
Plasmids in the pcDNA3.1 backbone used to overexpress V5-tagged TWIST1/NEUROD1 and ALX4 in HEK293 cells were cloned by PCR of the pcDNA3.1 backbone and desired inserts followed by Gibson assembly.
Coding sequences of MSX1 (NM_002448.3, OHu18516D), PRRX1a (NM_006902.5, OHu23742D), PRRX1b (NM_022716.4, OHu15551D), PHOX2A (NM_005169.4, OHu18020D) were ordered from Genscript. TWIST1 was amplified from H9 gDNA, with tags added following the second ATG at the beginning of the coding sequence. NEUROD1 was amplified from PB-iNEUROD1_P2A_GFP_Puro (Addgene plasmid # 168803). FKBP12F36V-V5 (for N-terminal tagging) was synthesized by Integrated DNA Technologies. FKBP12F36V-mNeonGreen-V5 (for C-terminal tagging) was amplified from pAAV-hSOX9-dTAG-mNeonGreen-V5 (Addgene plasmid #194971).
The pGL3-noSV40-humanEC1.45_min1-2_4xEboxMutant plasmid was generated by mutating all four E-box motifs within Coordinator motifs in silico at the positions with greatest information content in the PWM. The sequence containing mutant EC1.45 E-box motifs was ordered from Twist Bioscience and cloned into the pGL3 luciferase reporter vector.
AAV preparation
AAV production was performed by transfecting 293FT cells with 22 ug of pDGM6 helper plasmid (Addgene plasmid # 110660), 6 ug of donor template plasmid, and 120 ug polyethylenimine (Sigma-Aldrich, 408719) diluted in Opti-MEM (Gibco, 31985070) in 1 ml total volume per 15-cm plate (4 plates were used per construct). Twenty-four hours after transfection, media was changed to media with 2% FBS. Three days after transfection, cells were harvested by scraping, triturated by pipetting up and down, centrifuged at 1000g for 20 min at 4°C, resuspended in 1.5 ml AAV lysis buffer (2 mM MgCl2, 10 mM NaCl) per 2×15 cm plates, and then flash frozen for storage. Samples were passaged through a 23-gauge needle and then freeze-thawed three additional cycles to lyse cells. Lysates were then treated with Benzonase (Millipore, 71205–3) for 1 h at 37°C with intermittent mixing, centrifuged at 2000g for 20 min at 4°C, and then the supernatant was flash frozen for storage at −80°C. OptiSeal tubes (Beckman Coulter, 362183) were filled from the bottom (with a blunt 18-gauge needle attached to a syringe), in order, with layers of 9.7 ml of 25% OptiPrep Density Gradient medium (Sigma-Aldrich, D1556–250ML) in 100 mM Tris pH 7.6, 1.5 M NaCl, 100 mM MgCl2; 6.4 ml of 41.7% OptiPrep in 100 mM Tris pH 7.6, 0.5 M NaCl, 100 mM MgCl2, and 12 ug/ml Phenol Red; 5.4 ml of 66.7% in 100 mM Tris pH 7.6, 0.5 M NaCl, 100 mM MgCl2,, and 5.4 ml of 96.7% OptiPrep Density Gradient medium (Sigma-Aldrich, D1556–250ML) in 33.3 mM Tris pH 7.6, 167 mM NaCl, 33 mM MgCl2 with 0.012 mg/ml Phenol Red. Lysate was gently added on top, the tubes were filled with AAV lysis buffer, and centrifuged at 48,000 rpm at 18°C in a Beckman Vti 50 rotor for 70 min with max acceleration and braking at a setting of 9. The viral fraction above the 66.7%−96.7% OptiPrep interface was collected using an 18-gauge needle and syringe and then washed with cold PBS using an Amicon Ultra-15 100K filter (Millipore, UFC910008). Pluronic F-68 (Gibco, 240 4–0032) was added to 0.001% v/v final and then purified AAV was then flash frozen in aliquots for storage at −80°C. To calculate AAV titers, an aliquot was digested with Turbo DNase (Invitrogen, AM2238) per manufacturer’s instructions, inactivated with 1 mM EDTA final concentration and incubation at 75°C for 10 min, and then digested with proteinase K in 1 M NaCl and 1% w/v N-lauroylsarcosine at 50°C for 2h. Samples were then boiled for 10 min, and diluted in H2O to 1:20,000 and 1:200,000. DNA standards comprising 1010 – 103 molecules were prepared using AAV6 backbone plasmids containing inverted terminal repeats. Quantitative PCR was carried out on standards and test samples using the LightCycler 480 Probes Master kit (Roche, 04707494001) with inverted terminal repeat probe and primer sequences indicated in Table S5.
Differentiation of hESC to hCNCCs
hESCs were differentiated to hCNCCs as previously described19,23. Briefly, hESC colonies were partially detached from the plate with collagenase IV (Gibco, 17104019) in Knockout DMEM medium (Gibco, 10829018) for 30–60 min and scraped to break up large colonies, and then cultured in Neural Crest Differentiation Medium (50%−50% v/v mixture of DMEM/F12 1:1 medium with L-glutamine, without HEPES (Cytiva, SH30271.FS) and Neurobasal medium (Gibco, 21103049) with 0.5x N2 NeuroPlex (Gemini Bio, 400–163) and Gem21 NeuroPlex (Gemini Bio, 400–160) supplements and GlutaMAX (Gibco, 35050061), and 1x antibiotic/antimycotic, and 20 ng/ml EGF (Peprotech, AF-100–15), 20 ng/ml bFGF (Peprotech, 100–18B), and 5 ug/ml bovine insulin (Gemini Bio, 700–112P)) for 11 days in bacterial-grade petri dishes, changing the plate to prevent attachment for 4 days and then leaving the cells unfed for two days to allow attachment, and then fed as needed at least every other day. At day 11, cells (now called ‘early hCNCC’) were harvested by treatment with Accutase (Sigma-Aldrich, A6964–100ML), strained to remove residual neuroectodermal spheres, and plated onto plates coated with 7.5 ug/ml human fibronectin (Millipore, FC010–10MG) and cultured in Neural Crest Maintenance Medium (Neural Crest Differentiation Medium with bovine insulin replaced by 1 mg/ml BSA (Gemini Bio, 700–104P)). These hCNCC were then passaged every 2–3 days upon reaching confluency, with cells in the third or subsequent passages defined as ‘late hCNCC’ and cultured with added 50 pg/ml BMP2 (Peprotech, 120–02) and 3 uM CHIR-99021 (Selleckchem, S2924).
dTAG treatment
dTAGV-1 (Tocris, 6914/5) was dissolved in DMSO at 5 mM and then diluted to 250 uM in 60% DMSO/40% water (v/v) before dilution to 500 nM for acute depletions (up to 1 day) or diluted directly from the 5 mM stock for long-term depletions. For acute depletion time courses, an equivalent amount of DMSO (0.12% v/v final) was added to all samples starting 24 h before harvest, and cells for all time points were harvested simultaneously.
Genome editing
H9 cells were treated with 10 uM Y-27632 (Stem Cell Technologies, 72304) for at least 2 h prior to nucleofection, and then harvested as single cells with Accutase. For each editing experiment, 800,000 cells were nucleofected with 1.7 ul (17 ug) Alt-R S.p. HiFi Cas9 nuclease V3 (Integrated DNA Technologies) and 3.3 ul of 100 uM annealed crRNA XT and tracrRNA (pre-incubated for 15 min at room temperature to form RNPs) and for generating ALX4 knockout, 2 ul of 100 uM ssDNA homology-directed repair (HDR) template, using the P3 Primary Cell 4D-Nucleofector X Kit L (Lonza, V4XP-3034) and the CA-137 program. When AAV was used to deliver HDR template, the AAV was diluted to 25,000 viral genomes per cell in medium and added to the plate before adding the nucleofected cells. Media was changed 4 h after nucleofection, and then cells were cultured until nearing confluency, at which point cells were diluted to single cells and plated at low densities (~500 cells per well of a 6-well plate). Resulting colonies were picked and a portion of the cells lysed by QuickExtract (Lucigen, QE9050) and used to genotype by PCR with primers on either side of the insertion site (in most cases with one primer outside the homology arms; see Table S5 for primer sequences) and gel electrophoresis or Sanger sequencing. Putatively edited colonies were confirmed by genomic DNA extraction using the Quick-DNA mini prep kit (Zymo, D3024) and Sanger sequencing. All gRNA and primer sequences are listed in Table S5.
Transfection
HEK293 cells were transfected with Lipofectamine 2000 (Invitrogen, 11668019) at a ratio of 2.8 ul lipofectamine per ug of DNA, diluted in Opti-MEM. Cells were transfected with 2.5 ug DNA per well of a 6-well plate or 15 ug DNA per 10-cm plate 1–2 days after seeding, when they reached 70–90% confluency. Media was replaced 4–6h after transfection, and then cells were harvested for Western blot or chromatin immunoprecipitation at 24 h after transfection. For the initial TWIST1/ALX4 transfections, equal amounts of pCAG_TWIST1, pCAG_ALX4-Flag-HA, and pUC19 were transfected. For transfections with V5-tagged TWIST1/NEUROD1, to normalize plasmid amounts, the following amounts of plasmids were transfected per well of a 6-well plate (and six-fold more for a 10-cm plate, and the remaining amount filled with pUC19 as carrier): 200 ng pcDNA3.1_ALX4-Flag, 2000 ng pcDNA3.1_MSX1-Flag, 200 ng pcDNA3.1_PRRX1a-Flag, 200 ng pcDNA3.1_PRRX1b-Flag, 200 ng pcDNA3.1_PHOX2A-Flag, 200 ng pcDNA3.1_V5-TWIST1, 1200 ng pcDNA3.1_V5-NEUROD1, 300 ng pcDNA3.1_V5-TWIST1_P139S, and 200 ng for all other TWIST1 mutants.
hCNCCs were transfected with FuGENE 6 (Promega, E2691) immediately after passaging, using 1 ul of FuGENE 6 per 3 ug of DNA and 100 ng DNA diluted in 50 ul Opti-MEM per well of a 24-well plate.
Luciferase assay
hCNCCs were transfected with 0.5 ng pRL renilla control plasmid, 10 ng modified pGL3 reporter plasmid, and 89.5 ng carrier plasmid (pUC19) per well of a 24-well plate, in triplicate. Cells were lysed 24 h after transfection and assayed with the Dual-Luciferase Reporter assay kit (Promega, E1960).
Western blot
Cells were washed with cold PBS, lysed by incubation for 10 min on ice in RIPA buffer (50 mM Tris pH 7.6, 150 mM NaCl, 1% Igepal CA-630, 0.5% sodium deoxycholate, 0.1% SDS) with 1x cOmplete EDTA-free protease inhibitor cocktail (Roche, 11873580001), and sonicated for 6 cycles of 30s ON/30s OFF on high power using the Bioruptor Plus (Diagenode). Insoluble material was removed by centrifugation at >16,000g for 10 min at 4°C. The supernatant was quantified by BCA protein assay (Thermo, 23225) and then denatured by addition of 1x NuPAGE LDS Sample Buffer (Invitrogen, NP0007) and 100 mM DTT and heating to 95°C for 7 min. Samples were normalized by BCA quantifications and then loaded in 4–12% or 4–20% Novex Tris-glycine gels (Invitrogen) and run at 165V for ~1 h in Tris-glycine buffer (25 mM Tris and 192 mM glycine) with 0.1% SDS. Gels were transferred onto nitrocellulose membranes (GE Healthcare) for 1 h at 400 mA in Tris-glycine buffer with 20% methanol, stained with 0.1% Ponceau S in 3% trichloroacetic acid, then blocked with 5% milk and 1% BSA in PBS with 0.1% Tween-20 (PBST) for 15 min at room temperature, and then incubated with primary antibody overnight at 4°C followed by horseradish peroxidase (HRP)-conjugated secondary antibody incubation for 1 h at room temperature, with 4 washes of PBST after each antibody incubation. Antibodies used include TWIST1 (Abcam, ab50887, RRID:AB_883294, 1:500), ALX4 (Novus Bio, NBP2–45490, 1:1000), ALX1 (Novus Bio, NBP1–88189, 1:1000), MSX1 (Origene, TA590129, 1:5000), PRRX1 (Santa Cruz Biotechnology, sc-293386, 1:500), CTCF (Cell Signaling, 2899, 1:2000), HSP90 (Cell Signaling, 4877, 1:2000), V5 (Abcam, ab206566, RRID:AB_2819156, 1:2000), Flag (Sigma, F1804, 1:2000), HA (Abcam, ab9110, 1:2000), Donkey anti-Rabbit IgG (H+L) HRP (Jackson Immunoresearch, 711-035-152, RRID:AB_10015282, 1:3000), Goat anti-Mouse IgG (H+L) HRP (Jackson Immunoresearch, 115-005-003, RRID:AB_2338447, 1:3000). Chemiluminescence was performed with Amersham enhanced chemiluminescence (ECL) Prime reagent (Cytiva, RPN2232) and imaged with an Amersham ImageQuant 800 (Amersham).
ATAC-seq
Omni-ATAC was performed essentially as published116, with 30 min treatment with 200 U/ml Dnase I (Worthington, LS006331) at 37°C prior to harvesting cells, using Ampure XP (Beckman Coulter, A63881) beads to clean up the DNA. Briefly, treated cells were harvested by Accutase, counted using the Countess II (Invitrogen), and 50,000 cells were collected by centrifugation at 500g for 5 min at 4°C. Cells were resuspended in lysis buffer (resuspension buffer (RSB), or 10 mM Tris-HCl pH 7.4, 10 mM NaCl, and 3 mM MgCl2, with 0.1% Igepal CA-630, 0.1% Tween-20, and 0.01% digitonin) for 3 min, then quenched by dilution with RSB with 0.1% Tween-20. Lysate was centrifuged for 10 min at 500g at 4°C and then resuspended in transposition buffer (25 ul TD buffer and 2.5 ul TD enzyme (Illumina, 20034197), 16.5 ul PBS, 0.01% digitonin, 0.1% Tween-20, and water up to 50 ul). Transposition reactions were performed for 30 min at 37°C, and then cleaned up with the DNA Clean & Concentrator-5 kit (Zymo, D4013) and eluted in 21 ul 10 mM Tris-HCl pH 8. DNA was then pre-amplified 5 cycles with NEBNext Ultra II Q5 master mix (NEB, M0544) with a cycling protocol of 72°C for 5 min, 98°C for 30s, and 5 cycles of 98°C for 10s, 63°C for 30s, 72°C for 1 min. Then 5 ul of the 50 ul reaction was used to run a qPCR reaction (with the same cycling protocol except the initial 72°C incubation) to determine the optimal number of PCR cycles for each sample. The remaining portion of the reaction was then amplified the appropriate number of cycles, and then subjected to two rounds of double-sided Ampure XP bead cleanup, with 0.5x/1.3x and 0.5x/1.0x bead ratios (numbers indicate bead ratios added in first and second steps). Libraries were quantified by Qubit dsDNA high sensitivity assay (Invitrogen, Q33231), run on a 5% polyacrylamide TBE gel to check the size distribution, and then pooled for sequencing.
Chromatin immunoprecipitation
Cells (about 1 confluent 10-cm plate or ~10–20 million cells) were crosslinked with 1% methanol-free formaldehyde (Pierce, 28908) in PBS for 10 min at room temperature and then quenched by adding 2.5 M glycine to 125 mM final concentration and incubating for 10 min. Cells were washed in PBS with 0.001% v/v Triton X-100, harvested by scraping, and collected by centrifugation for 5 min at 4°C. Cells were washed with PBS and flash frozen for storage at −80°C. Cell pellets were later thawed on ice for 30 min, and then sequentially resuspended in lysis buffer 1 (50 mM HEPES-KOH pH 7.5, 140 mM NaCl, 1 mM EDTA, 10% glycerol, 0.5% Igepal CA-630, 0.25% Triton X-100, 1x cOmplete EDTA-free protease inhibitor cocktail (PIC), 1 mM PMSF), lysis buffer 2 (10 mM Tris-HCl pH 8, 200 mM NaCl, 1 mM EDTA, 0.5 mM EGTA, 1x cOmplete EDTA-free protease inhibitor cocktail, 1 mM PMSF), and lysis buffer 3 (10 mM Tris-HCl pH 8, 100 mM NaCl, 1 mM EDTA, 0.5 mM EGTA, 0.1% sodium deoxycholate, 0.5% N-lauroylsarcosine, 1x PIC, 1 mM PMSF), with 10 min incubations in each buffer, with rotation. Lysates were sonicated for 10–15 cycles of 30s ON/30s OFF on high power using the Bioruptor Plus (Diagenode), then diluted in additional lysis buffer 3 and clarified by centrifugation for 10 min at max speed at 4°C. Triton X-100 was added to 1%, and a small aliquot was used to extract DNA to check chromatin yield and size distribution, by dilution in elution buffer (1% w/v SDS and 100 mM NaHCO3) and incubation with 200 mM NaCl and Rnase A (Thermo, EN0531) at 65°C for 1 h, then proteinase K (Thermo, EO0491) at 65°C for 1 h, and clean up with the ChIP DNA Clean & Concentrator-5 kit (Zymo, D5205). DNA was quantified by Qubit dsDNA high sensitivity kit, and the remaining chromatin was then normalized for immunoprecipitations. For TWIST1 acute depletions, chromatin from O9–1 mouse CNCCs were added prior to ChIP at ~10% of the total chromatin as a spike-in control. Antibodies used include TWIST1 (Abcam, ab50887), V5 (Abcam, ab15828), H3K27ac (Active Motif, 39133), Flag (Sigma-Aldrich, F1804), AP-2α (Cell Signaling, 3215), AP-2α (Novus Bio, NB100–74359). For H3K27ac, 5 ug of antibody was used per ChIP; for TFs, 9 ug of antibody was used per ChIP, except for dissected mouse embryos where 4.5 ug was used in half of the total ChIP volume. ChIPs were incubated overnight, then incubated for 4–6h with 100 ul Dynabeads Protein A (Invitrogen, 10002D) or Protein G (Invitrogen, 10004D) prewashed with 0.1% w/v BSA in PBS, then washed 5x with RIPA wash buffer (50 mM HEPES-KOH pH 7.5, 500 mM LiCl, 1 mM EDTA, 1% Igepal CA-630, 0.7% w/v sodium deoxycholate), once with 50 mM Tris-HCl pH 8, 10 mM EDTA, 50 mM NaCl, and eluted in elution buffer at 65°C for 30 min. Eluate was then reverse crosslinked and treated with RNase A and proteinase K, and then DNA was extracted with the ChIP DNA Clean & Concentrator-5 kit. ChIP-seq libraries were prepared using the NEBNext Ultra II DNA kit (NEB, E7645S) using up to 50 ng of input or ChIP DNA, with ~4–8 cycles of amplification, with no pre-PCR size selection but a post-PCR double-sided 0.5x/0.9x Ampure XP bead clean-up.
CUT&RUN
The CUTANA CUT&RUN (Epicypher) protocol and reagents (concanavalin A beads, 21–1401 and pAG-MNase, 15–1016) were used with minor modifications based on the protocol from ref117: digestion was performed for 30 min on ice, and digestion supernatant was treated with 0.1% w/v SDS and 0.25 mg/ml proteinase K at 50°C for 1 h and then phenol-chloroform extraction was performed to extract DNA. Primary antibody incubations were performed overnight, and secondary antibody was used for mouse antibodies (TWIST1, ALX4, TCF3). Antibodies used include TWIST1 (Abcam, ab50887, 1:25), ALX4 (Novus Bio, NBP2–45490), TCF3 (Santa Cruz Biotechnology, sc-133074, 1:50), AP-2α (Cell Signaling, 3215, 1:25), CTCF (Cell Signaling, 2899, 1:25), V5 (Abcam, ab206566, 1:100), Rabbit anti-mouse IgG (H+L) (Abcam, ab46540, 1:100). E. coli spike-in DNA (Epicypher, 18–1401) was added at 0.01 ng per reaction. Library prep was performed with modifications to the NEBNext Ultra II DNA kit as in dx.doi.org/10.17504/protocols.io.bagaibse118.
SLAM-seq and RNA-seq
Cells were harvested by TRIzol (Invitrogen, 15596018) and stored at −80°C until processing. Chloroform was added to TRIzol lysate and separated into aqueous and organic phases by centrifugation per manufacturer instructions, and then the aqueous fraction was extracted using the RNA Clean & Concentrator-5 (Zymo, R1013) with on-column Dnase I digestion. RNA was checked for purity by Nanodrop and was quantified by Qubit RNA broad range assay (Invitrogen, Q10210). RNA-seq libraries were prepared using the QuantSeq 3’ mRNA-Seq Library Prep FWD kit (Lexogen, 113.96) using 500 ng of input RNA and ~15 cycles of amplification, with unique dual indices.
For acute depletions, SLAM-seq119 was performed as described with minor modifications, with 4-thiouridine (100 uM) labeling of nascent transcription for the last 2 h prior to harvest. Briefly, RNA was extracted using the Direct-zol RNA miniprep kit (Zymo, R2052), modified to include 0.1 mM DTT in wash buffers and 1 mM DTT to the water for elution, with protection from light. Four ug of RNA was then alkylated with 10 mM iodoacetamide (G Biosciences, 786–078) dissolved in ethanol at 100 mM, in 50% v/v DMSO, 50 mM NaPO4 pH 8 for 15 min at 50°C. Alkylation was quenched by addition of 1 ul of 1 M DTT, and alkylated RNA was extracted by RNA Clean & Concentrator-5 kit.
Sequencing
Illumina sequencing libraries were sequenced using 150 bp paired-end reads on the NovaSeq X Plus, NovaSeq 6000, HiSeq X Ten platforms.
Embryo dissection
Frontonasal prominences (FNP), maxillary prominences (Mx), mandibular prominences (Md), forelimb buds (FL), and hindlimb buds (HL) of E10.5 mouse embryos were microdissected in cold PBS, and then washed twice with cold PBS, and treated with 0.05% trypsin-EDTA (Gibco, 25300054) at 37°C for 30 min, shaking at 750 rpm. Trypsin was quenched by addition of FBS, then cells were dissociated to single cells by pipetting with a P1000 pipette, chilled on ice, washed twice in PBS, and filtered through a 35-um strainer. An aliquot was taken to count cells using a Countess II, and the remainder was crosslinked and processed for ChIP as described above. One litter of embryos was used per experiment, yielding ~1.8–3.6 million cells per region.
Immunoprecipitation-mass spectrometry
hCNCCs were grown in 6×10-cm plates per condition and replicate, optionally treated with 500 nM dTAGV-1 for 30 min. Media was replaced with ice-cold PBS with 0.5 mM PMSF, cells were collected by scraping, and centrifuged at 300g for 5 min at 4°C. After aspirating supernatant, cell pellet was flash frozen and stored at −80°C. The day prior to performing IPs, 30 ug of V5 antibody (Abcam, ab206566, RRID:AB_2819156) and 6 mg magnetic beads (per sample) were conjugated overnight using the Dynabeads Antibody Coupling Kit (Invitrogen, 14311D). The next day, Dignam nuclear extraction was performed (all steps at 4°C or on ice). Briefly, cells were thawed in 5x volume buffer A (10 mM HEPES, 1.5 mM MgCl2, 10 mM KCl, 1x PIC and phosSTOP (Roche, 4906845001) freshly added), rotated for 5 min, centrifuged at 600g for 5 min, and resuspended in 2x buffer A. Cells were lysed by 15 strokes in a Dounce homogenizer with a tight pestle, and then centrifuged at 1000g for 5 min. The pellet was washed in 5x volume buffer A, then resuspended in 2x volume buffer C (20 mM HEPES, 25% v/v glycerol, 420 mM KCl, 1.5 mM MgCl2, 1x PIC and phosSTOP freshly added) and rotated for 30 min. After centrifuging at max speed for 15 min, the supernatant was slowly diluted in an equal volume of buffer D (20 mM HEPES, 25% v/v glycerol, 0.2% v/v Igepal CA-630, 1x PIC and phosSTOP freshly added) and then again diluted two-fold with buffer E (20 mM HEPES, 25% v/v glycerol, 150 mM KCl, 0.1% v/v Igepal CA-630, 1x PIC and phosSTOP freshly added). Precipitate was cleared by centrifugation at max speed for 10 min, and the supernatant (nuclear extract) was quantified by BCA assay and used for IPs. Nuclear extract was added to antibody-coupled beads pre-washed in PBS with 0.1% w/v BSA, rotated for 2h, washed four times with buffer F (20 mM HEPES, 25% v/v glycerol, 150 mM KCl, 1x PIC and phosSTOP freshly added) and two times with PBS.
In a typical mass spectrometry experiment, beads were resuspended in TEAB prior to reduction in 10 mM DTT. Reduced proteins on beads then alkylated using 30 mM acrylamide to cap cysteine residues. Digestion was performed using Trypsin/LysC (Promega) in the presence of 0.02% ProteaseMax (Promega) overnight. Following digestion and quench, eluted peptides were desalted, dried, and reconstituted in 2% aqueous acetonitrile prior to analysis.
Mass spectrometry (MS) experiments were performed using liquid chromatography (LC) using an Acquity M-Class UPLC (Waters), connect to either an Orbitrap Q Exactive HF-X (RRID:SCR_018703 Thermo Scientific) or an Orbitrap Exploris 480 (RRID:SCR_022215 Thermo Scientific). For LC separations, a flow rate of 300 nL/min was used, where mobile phase A was 0.2% (v/v) formic acid in water and mobile phase B was 0.2% (v/v) formic acid in acetonitrile. Analytical columns were prepared in-house by pulling and packing fused silica with an internal diameter of 100 microns. Columns were packed with NanoLCMS Solutions 1.9 um C18 stationary phase to a length of approximately 25 cm. Peptides were directly injected into the analytical column using a gradient (2% to 45% B, followed by a high-B wash) of 90 min. Both MS instruments were operated in a data-dependent fashion using Higher Energy Collison Dissociation (HCD).
Protein purification, crystallization, and data collection
Expression and purification of the DNA-binding domain fragments of human TWIST1 (residues Gln101-Ser170), TCF4 (residues Arg565-Arg624), ALX4 (residues Asn210-Gln277), and BRG1 (residues 1428–1568) were performed as described in refs 120–122. The DNA fragments used in crystallization were obtained as single strand oligos (Eurofins), and annealed in 20 mM HEPES (pH 7.5) containing 300 mM NaCl and 0.5 mM Tris (2-carboxyethyl) phosphine (TCEP) and 10% glycerol. The purified and concentrated proteins were mixed with a solution of annealed DNA duplex at a molar ratio 1:1:1:1.2 at room temperature, and after one hour subjected to the crystallization trials. The crystallization conditions were optimized using several conditions from JCSG crystallization kit (Molecular Dimensions). Complex was crystallized in sitting drops by vapor diffusion technique from solution containing 50 mM sodium cacodylate buffer (pH 7.5), 100 mM magnesium acetate, 18% glycerol, 20% 2-Methyl-2,4-pentanediol and 6–7% PEG (MW 8000). The X-ray data set was collected at European Synchrotron Radiation Facility (ESRF) (Grenoble, France) from a single crystal on beam-line ID23–1 at 100 K using the reservoir solution as cryo-protectant. Prior to data collection, crystals mounted on the goniometer were located and characterized using X-ray mesh scans analyzed by Dozor-MeshBest88,123. The experimental parameters for optimal data collection were designed using the program BEST89. Data were integrated with the program XDS90 and scaled with program AIMLESS as implemented in CCP4108. Statistics of data collection are presented in Table S6.
Electrophoretic mobility shift assays (EMSAs)
DNA-binding domain fragments of human TWIST1 and ALX4 were expressed and purified as for crystallization, and TCF3 (residues Arg547-Arg606, E47 isoform) was used instead of TCF4. The forward strand of DNA was ordered with a 5’ conjugated Cy3 fluorophore (Integrated DNA Technologies) and annealed with an unlabeled reverse strand in NEBuffer 2 (NEB, B7002S) at 5 uM final concentration, and diluted to 1 uM final concentration in 10 mM Tris-HCl pH 8, 100 mM NaCl, 1 mM EDTA. TWIST1 and TCF3 were pre-mixed at an equimolar ratio and incubated for 30 min at room temperature to form heterodimers. Proteins were diluted in 20 mM HEPES, 300 mM NaCl, 10% glycerol, and 2 mM TCEP. Binding reactions were set up by diluting 0.5 ul LightShift Poly (dI-dC) (Thermo 20148E, 1 ug/ul) in 17 ul total binding buffer (20 mM HEPES, 100 mM NaCl, 10% glycerol, 1 mM DTT, 0.05 mg/ml BSA), adding 1 ul of annealed DNA probe, and finally 1 ul of diluted TWIST1:TCF3 and 1 ul of diluted ALX4 (or equal volume protein dilution buffer). After 30 minutes of incubation at room temperature, 13 ul of each reaction was loaded on a pre-equilibrated 5% native polyacrylamide gel (45 mM Tris-Borate, 1 mM EDTA, 1% glycerol, using 29:1 acrylamide:bis solution) and run for 1 h at 130 V. Gels were imaged using an Amersham ImageQuant 800 with the Cy3 fluorescence setting and a 10 s exposure.
QUANTIFICATION AND STATISTICAL ANALYSIS
ATAC-seq analysis
Reads were trimmed of Nextera adapter sequences and low-quality bases (-Q 10) using skewer v0.2.291 and then mapped to the hg38 analysis set (human), mm39 (mouse), or galGal6 (chick) reference genome using Bowtie2 v2.4.192 with the options --very-sensitive -X 2000. Reads were deduplicated with samtools v1.1093 markdup and uniquely mapped reads (-q 20) mapped to the main chromosomes (excluding mitochondria and unplaced contigs) were retained using samtools view. Read ends were shifted inward 5 bp (+5 bp on + strand, −5bp on – strand) for each fragment, and then MACS294 was used to call peaks from shifted read ends using --shift −100 --extsize 200 -f BED --nomodel --keep-dup all --call-summits --SPMR with -g hs for human, -g mm for mouse, and -g 1055580959 for chick data. Peaks from all hCNCC experiments were merged into a unified peak set by concatenating all significant summits, clustering peaks within 150 bp with bedtools95 cluster, keeping only the most significant summit (in any sample) per cluster with a p-value < 1E-20, extending by an additional 100 bp in both directions, and then merging any overlapping peaks with bedtools merge, resulting in 213,151 total peaks. The most significant summit within each merged peak was used as the overall summit, which was used to generate heatmaps and perform motif analyses.
Counts of reads in each sample overlapping the merged peak set were generated using bedtools, and differentially accessible peaks were called using DESeq296 using only samples pertinent to each comparison, and using CNCC differentiation replicate as a covariate, excluding peaks with fewer than an average of 10 reads per dataset in the comparison. Genome browser tracks were generated by MACS2 v2.2.7.194 and plotted using IGV v2.7.297. Peaks with a summit within 500 bp of a TSS (from refGene GFF files from UCSC for hg38 and mm39, and ncbiRefSeq for galGal6) were considered promoter-proximal, and the remaining peaks were considered distal.
For published data with multiple replicates, all summit files were concatenated and then summits within 100 bp were clustered with bedtools cluster, and the most significant summit in each cluster was retained.
For ENCODE data, bed narrowPeak files and metadata were downloaded on 1-18-2023 for all GRCh38 and mm10 non-control ATAC-seq (n=549) and DNase-seq (n=1781) experiments. All replicates were processed separately. Samples were annotated into tissue/cell types as follows: facial, limb, or lung if the annotation included that corresponding term; fibroblast if it included “fibroblast” or “HFF-Myc”, “BJ”, “AG09319”, ”AG09309”, “AG10803”, “GM03348”, “GM04504”, or“NIH3T3”; muscle if it included “muscle” or “gastroc”; neuroblastoma if it included “SK-N” or “BE2C”; and brain if it included “brain”, “cereb”, “front”, “nucleus”, “hippo”, “occipital”, “gyrus”, or “ceph”. Samples were annotated as pluripotent stem cells if the annotation included “iPS”, “WTC11”, “ES-“, “R1”, “H1”, “H7”, “H9”, “ZHBTc4”, “WW6”, “L1-S8R”, “NT2/D1”, or “GM23338” but not “NCI-H929” or “CH12.LX”.
ChIP-seq and CUT&RUN analysis
Reads were trimmed, mapped, and deduplicated as described above for ATAC-seq analysis (but trimming Truseq adapter sequences), and then peaks were called with MACS2 (but with -f BAMPE --nomodel --keep-dup all --call-summits –SPMR) and browser tracks were generated with deeptools v3.5.098 bamCoverage -bs 10 --normalizeUsing RPGC --samFlagInclude 64 --samFlagExclude 8 --extendReads and plotted using IGV. For TWIST1 acute depletion samples, which included O9–1 mouse cranial neural crest cell spike-in chromatin, reads were mapped to a combined hg38 analysis set + mm39 reference genome. The fraction of reads mapping to the mouse genome was similar across all samples, so unnormalized tracks are shown for consistency.
For published single-end read data, reads were not deduplicated, and peaks were called with MACS2 with -f BAM and without --nomodel).
For defining TWIST1/AP-2α-bound distal regions used as reference points for heatmap generation, merged ATAC peaks were defined as bound by TWIST1 or AP-2α if the ATAC summit was within 200 bp of the ChIP summit, where the ChIP summits from multiple replicates were merged using bedtools cluster if they were within 150 bp. ATAC peaks were considered distal if they were at least 1000 bp from a TSS.
For comparisons of quantitative TWIST1 binding strength in hCNCC and HEK293 with and without ALX4, TWIST1 ChIP peaks (p < 10−10 for hCNCC, p < 10−5 for HEK293) from both conditions (+/− ALX4) from the same cell type were merged by removing peaks with a stronger peak within 100 bp, with bedtools cluster.
Putative enhancers (promoter-distal ATAC peaks with robust H3K27ac signal) were defined as ATAC peaks with a maximum of at least 10 RPGC in at least one TWIST1FV or WT H3K27ac ChIP. For assessing log2 fold changes in H3K27ac signal, reads were counted over merged ATAC peaks using deeptools multiBamSummary -e --outRawCounts and used as counts for DESeq2.
CUT&RUN reads were mapped to a combined human (hg38 analysis set) and E. coli (K-12 substr. MG1655) reference genome using Bowtie2. CUT&RUN tracks of depleted (i.e. dTAGV-1 treated) samples were normalized to the control samples using the E. coli spike-in control, by multiplying by a scaling factor of (Econtrol/Hcontrol)/(Edepleted/Hdepleted), where Ex = fraction of reads mapped to E. coli in sample x, and Hx = fraction of reads mapped to human.
SLAM-seq and RNA-seq analysis
Newly generated sequencing data (read 1 only) were trimmed of adapters and low-quality bases then poly A strings using skewer91 and processed using slamdunk v0.4.3119 with map options -n 100 −5 0 -q -ss, using the hg38 analysis set reference genome. Differentially expressed genes were called using DESeq296 using only samples pertinent to each comparison, and using CNCC differentiation replicate as a covariate, excluding genes with fewer than 30 reads across datasets in the comparison.
Publicly available RNA-seq data were trimmed of adapters and low-quality bases using skewer91 and mapped using salmon124 quant --seqBias -l A to hg38_cdna and mm10_cdna pre-built indices (http://refgenomes.databio.org/). Salmon abundance files were summarized to the gene level and imported into R with the tximport99 package v1.20.0 with countsFromAbundance = ‘lengthScaledTPM’. When multiple replicates were available, the mean TPM of all replicates was used.
Human-mouse orthologs were downloaded from https://www.informatics.jax.org/downloads/reports/index.html#homology and only one-to-one orthologs were kept for analyses of RNA levels across cell types. The list of human TFs and their family definitions were downloaded from http://humantfs.ccbr.utoronto.ca/download.php (Full Database).
CCLE processed TPM values were downloaded, and these values for TWIST1 were plotted against the average for all homeodomain TFs with known motifs aligned to the HD portion of Coordinator.
Motif analysis
Motifs from JASPAR 2018125, HOCOMOCO v11 human and mouse core binding models126, and HT-SELEX8, plus the Coordinator motif19 were used for scans of known motifs with meme suite v5.1.1 AME102. Motifs clusters from https://www.vierstra.org/resources/motif_clustering127 were used, with one manually added cluster for the Coordinator motif, into which the TWST1 motifs from HOCOMOCO were moved.
Motif alignments to Coordinator were performed with meme suite v5.1.1 TOMTOM101 using a cutoff of q-value < 0.4. Motifs from the same TF (counting orthologous human and mouse TFs as the same) and in the same cluster were collapsed, keeping the one with the best alignment.
Motif matches in the genome were calculated using meme suite v5.1.1 FIMO103 (for analyses of Coordinator, double E-box, and single E-box motifs in hg38 and mm39) using options –max-stored-scores 5000000 and PWMScan104 (for annotating other motifs on hg38) using a p-value threshold of 0.001 and a background frequency of 0.25 for all bases. A p-value threshold of 10−4 was used to define motif presence for Coordinator, double E-box, single E-box, NEUROD1 (NDF1_HUMAN.H11MO.0.A) motifs, while a threshold of 10−3 was used for the HD dimer (ALX1_HUMAN.H11MO.0.B) and HD monomer motif (PRRX2_HUMAN.H11MO.0.C). For the HD monomer motif, instances overlapping Coordinator or HD dimer motifs were excluded.
ATAC-seq and ChIP-seq peaks were ranked by summit p-values as reported by MACS2 and summits ± 100 bp were used for AME and analyses of TF depletion-responsive ATAC peaks.
The double E-box motif was generated by using STREME105 de novo motif discovery to compare TWIST1 ChIP peaks (summits ± 100 bp) with significantly stronger vs weaker binding in ALX1FV ALX4− cells compared to WT hCNCCs.
For comparisons of quantitative TWIST1 binding strength in hCNCC and HEK293 with and without ALX4, merged TWIST1 summits were classified as Coordinator-containing if they had a Coordinator motif with p < 10−4 within 100 bp of the summit and the strongest Coordinator motif had a more significant p-value than the strongest double E-box motif; as double E-box-containing if they had a double E-box motif with p < 10−4 within 100 bp of the summit and the strongest double E-box motif had a more significant p-value than the strongest Coordinator motif; or otherwise as neither.
Motif logo plots were generated with meme suite v4.12.0 ceqlogo.
IP-MS analysis
For data analysis, the .RAW data files were checked using Preview (Protein Metrics) to verify calibration and quality metrics. Data were processed using Byonic (Protein Metrics) to identify peptides and infer proteins. Proteins were held to a false discovery rate of 1%, using standard approaches described previously128 (Elias and Gygi, 2007). Known contaminants and any proteins with peptides detected in a control IP with the same V5 antibody on untagged hCNCC protein extracts were excluded.
Structure determination and refinement
The structure was solved by molecular replacement using program Phaser106 as implemented in Phenix107 and CCP4108 with the structure of TCF4 (PDB: 6OD3) as a search model for TCF4 and TWIST1, and NMR structure of ALX4 (PDB: 2M0C) as a search model for ALX4. After the positioning of proteins, the density of DNA was clear and the molecule was built manually using Coot110. However, we did not find any density for the BRG1 fragment. The rigid body refinement with REFMAC5 was followed by restrain refinement with REFMAC5109, as implemented in CCP4. Resulting statistics of the refinement are presented in Table S6. Structural alignments and figures were generated with PyMOL. The resulting structure was submitted to Protein Data Bank with ID 8OSB.
Human-chimpanzee enhancer divergence analysis
We scanned the set of human and chimp genomic sequences corresponding to 106,331 orthologous regulatory regions using meme suite v5.1.1 FIMO, with either the original Coordinator PWM or altered PWMs with duplicated or removed weak A positions in the linker region. Since altered linker length PWM matches can in some cases still match to the original Coordinator sequence, to avoid confounding with original Coordinator sequence, altered linker matches that directly overlap known Coordinator motif were removed from further analysis. Next, we performed outer join of the scan results, filling missing data with values of the scan p-value threshold. Changes in motif strength (between human and chimp) were calculated as the log p-value ratio and compared with changes with log2 fold changes of the H3K27ac signal (from ref 19) using Pearson correlation. Similar results were obtained using PWM with linkers of variable lengths with no base preference at all.
EMSA quantification
Images were quantified using Fiji “measure” tool and the fraction of bound DNA was calculated by dividing the background-subtracted signal of the bound DNA band by the sum of bound and unbound signal. Data were fit to Hill equations using nls in R.
LocusZoom plots
LocusZoom plots were constructed from summary statistics of the facial shape GWAS by White et al. (available from GWAS Catalog: GCST90007181– GCST90007306). Since SNP-phenotype associations were tested across 63 facial modules and meta-analyzed using two independent cohorts, the set of p-values used for plotting was determined for each lead SNP separately based on the module-cohort combination where it yielded the lowest p-value. Linkage disequilibrium (LD) with the lead SNP was calculated with PLINK 1.9129 based on the EUR samples from the 1000 Genomes Project Phase 3 v5 dataset (available at: http://ftp.1000genomes.ebi.ac.uk/vol1/ftp/release/20130502/) and protein coding genes including their exons were annotated using NCBI RefSeq annotations (available at: http://hgdownload.soe.ucsc.edu/goldenPath/hg19/bigZips/genes/hg19.ncbiRefSeq.gtf.gz).
Facial Morphs
Following White et al.57, the lead SNPs at loci encoding each of the Coordinator-binding TFs (PRRX1, MSX1, TWIST1, ALX1, and ALX4) were tested for association with facial shape in a European cohort from the US comprising 4,680 individuals. Specifically, for each facial module and each SNP, canonical correlation (CCA) analysis was performed on the pre-residualized principal components (PCs) that describe the facial variation within that module. CCA yielded multivariate effect size estimates for the PCs, which can be interpreted as the axis of shape variation maximally correlated with the SNP under investigation. While a SNP was tested across all 63 facial modules, only the effect in the most significant facial module was visualized. To do so, the average face, M, was first deformed to the positive shape as M + 3Σ and to the negative shape as M − 3Σ, with Σ being the difference in 3D shape for one standard deviation along the shape axis. Normal distances were then calculated for each vertex on the negative shape to their corresponding vertex on the positive shape. The normal distances were then visualized with a heatmap on an average face whereby blue represents an inward depression and red represents an outward protrusion.
Brain Morphs
Similar to the facial segmentation by White et al.57, Naqvi et al.58 segmented the cortical surface into 285 hierarchical modules. For each lead SNP at a locus encoding one of the Coordinator-binding TFs (TWIST1, ALX1, and ALX4), p-values corresponding to the modules of hierarchical level 5 were visualized on an average brain after normalizing the −log10(p-values) with respect to the maximum value at each locus.
S-LDSC analysis
GWAS summary statistics for facial shape (full face, segment 1) and brain shape (full brain, segment 1) were obtained from Figshare (https://doi.org/10.6084/m9.figshare.c.5089841.v1)58. Height GWAS summary statistics were downloaded from the Price laboratory website (https://alkesgroup.broadinstitute.org/UKBB/). LD scores were created for each annotation (corresponding to a set of differential or control distal ATAC-seq peaks) using the 1000G Phase 3 population reference. Each annotation’s heritability enrichment for a given trait was computed by adding the annotation to the baselineLD model and regressing against trait chi-squared statistics using HapMap3 SNPs with the stratified LD score regression package v.1.0.1113. We note that the TWIST1-dependent peak sets span 0.67% and 0.73% of SNPs for acute depletion and long-term loss, respectively (based on 1000 Genomes SNP annotation in individuals of European ancestry, which encompass our GWAS populations), above the 0.5% defined as a large annotation130. Accessibility-matched distal peaks were selected from peaks with a log2 fold change between −0.5 and 0.5 and adjusted p-value > 0.1 using the Matching package for R v4.10–8 with distance.tolerance = 0.01 and ties = F114.
Supplementary Material
Table S2. List of contacts within 4 Å in the ALX4-TWIST1 interface, related to Figure 6.
Table S4. Accession numbers of publicly available datasets, related to STAR Methods.
Table S6. X-ray crystallography data collection and refinement statistics, related to Figure 6.
Figure S1. Coordinator and OCT:SOX motif enrichment in open chromatin regions, related to Figure 1 A. Coordinator motif frequency in ranked ATAC peaks ordered left to right from strongest to weakest, split by whether they overlap a TSS and grouped into bins of 1000 peaks. B. Rankings of OCT:SOX and its constituent SOX/1 motif in enrichment in the top 10,000 distal accessible regions, for all DNase-seq and ATAC-seq datasets on ENCODE. Points are jittered to avoid overplotting. Zoom-in highlights the pluripotent stem cell samples among those with OCT:SOX motif enrichment. C. Rankings of the Ebox/CAGATGG and HD/2 motif clusters in enrichment in the top 10,000 distal accessible regions, for all DNase-seq and ATAC-seq datasets on ENCODE. Points are jittered to avoid overplotting. Purple circles indicate samples with Coordinator motif enrichment (Coordinator rank < 10 and Coordinator rank < E-box and HD ranks). Zoom-in highlights samples lacking Coordinator enrichment despite enrichment of both E-box and HD motifs. D. Top motif clusters enriched in distal ATAC-seq peaks of chick and mouse forelimbs60. Coordinator is highlighted in purple, the best E-box motif match to Coordinator (Ebox/CAGATGG) in blue, and the best homeodomain motif match to Coordinator (HD/2) in red.
Figure S2. Candidate Coordinator-binding factors and a cell line without Coordinator activity, related to Figure 2 A. All bHLH and SNAI TFs with known motifs aligned to the E-box portion of Coordinator (highlighted by bounding box). B. TWIST1 is the TF with the highest correlation between TF RNA levels and Coordinator enrichment. C. TWIST1 RNA level is correlated with Coordinator motif enrichment p-value (same samples as in Figure 1D,E). D. All HD TFs with known motifs aligned to the HD portion of Coordinator (highlighted by bounding box). E. Scatter plot of TWIST1 vs average of all candidate Coordinator-binding HD TF expression in all CCLE cell lines. Both axes show log2(TPM+1) values. RS4;11 cells are highlighted in red. F. Frequencies of double E-box and single E-box motifs in ranked TWIST1 ChIP-seq peaks, in bins of 1000 peaks (as in Figure 2B).
Figure S3. Validation of degron-tagging and ALX4 knockout, related to Figure 3 A. Western blot of TWIST1 depletion time course in TWIST1FV hCNCCs, with HSP90 as a loading control. IB: immunoblot. B. Western blot comparisons of tagged and untagged TF protein levels using endogenous antibodies, with HSP90 or Histone H3 as loading controls. C. Sanger sequencing genotyping of ALX1FV ALX4− lines. The guide RNA used to generate the edits shown above traces in teal.
Figure S4. Effects of TWIST1 depletion on accessibility, H3K27ac, and enhancer activity, related to Figure 4 A. MA plot of TWIST1 3 h depletion. Significant (adjusted p-value < 0.05) upregulated and downregulated peaks are colored in red and blue, respectively. B. Scatter plot of 3 h vs 24 h ATAC fold changes. Red line indicates y = x. C. Scatter plots of ATAC vs H3K27ac fold changes upon 3 h and 24 h of TWIST1 depletion. Red line indicates y = x. D. Mean signal plots of TF binding, ATAC, and H3K27ac across TWIST1 depletion (dTAGV-1) time points (0 h to 24 h), at enhancers with loss of accessibility upon TWIST1 depletion. E. Luciferase enhancer reporter activity with and without TWIST1 depletion. SOX9 EC1.45 indicates the “min1-min2” enhancer from ref23, Mut indicates a mutant version of the enhancer with substitutions at all high information content positions within the E-box portions of all four Coordinator motifs, SV40 is the SV40 enhancer, and Neg indicates a control plasmid lacking an enhancer insert. Points are biological replicates transfected independently (n=3).
Figure S5. Acute and long-term depletions of Coordinator-binding TFs, related to Figure 5 A. Scatter plot of TWIST1 acute 24 h vs long-term depletion effects on accessibility at distal open chromatin. Red line indicates y = x. B. Bar plot of number of significant changes (FDR < 0.05) in ATAC-seq upon long-term depletions. C. Scatter plot of ALX1 vs MSX1 long-term depletion effects on accessibility at distal open chromatin. Red line indicates y = x. D. Bar plot of number of significant changes (FDR < 0.05) in ATAC-seq upon acute depletions. E. Table of number of distal regions changing in accessibility upon MSX1 and/or TWIST1 long-term depletion. NS, not significant. F. Frequencies of HD motifs in regions responsive to ALX and/or TWIST1 long-term depletions. NS, not significant. G. Bar plots of the fraction of genes responsive to ALX1 depletion that are also responsive to TWIST1 depletion, for acute (in ALX4- background) and long-term (in ALX4+ background). NS, not significant. H. Volcano plot of MSX1 RNA-seq data. Significantly (FDR < 0.05) upregulated genes are highlighted in red/orange and downregulated genes are in blue. Selected genes are labeled and highlighted in darker colors.
Figure S6. DNA guiding of TWIST1-HD interactions and variation among bHLH and HD TFs, related to Figure 6 A. Western blots of HEK293 cells transfected with plasmids encoding V5-TWIST1 or loop-swap mutants (sequences in Figure 6F or Figure S6C) and various homeodomain TFs, with CTCF as a loading control. IB, immunoblot. Saturated pixels are colored magenta. Cropped images are from same ECL reaction and exposure. B. Most enriched known motif in the top 1000 ChIP-seq peaks for each of the six transfections shown in Figure 6F and Figure S6C. C. Extent of Coordinator motif binding preference of V5-tagged TWIST1 and various loop mutants derived from NEUROD1 expressed in HEK293 cells (see Figure S6A for protein levels) with (magenta) or without ALX4 (gray). D. Left, Pearson correlation between the strength of wild-type Coordinator motif or variants with modified spacer lengths and the human-chimp divergence in H3K27ac. Right, example of data used for correlation calculation, for the wild-type Coordinator motif. E. Electrophoretic mobility shift assay (EMSA) probe sequences (upper left), estimated Kd and Hill coefficients (n) for F-J. F-J. EMSA gels and Hill curve fits (for I,J) for WT vs homeodomain motif mutant sequence (F), WT vs E-box motif mutant sequence (G), WT with vs without ALX4 and WT vs homeodomain motif mutant sequence (H), WT vs partial E-box sequence (I), and WT vs spacer mutant (J).
Figure S7. Face, brain shape, and height heritability in Coordinator-binding TF loci and genomic targets, related to Figure 7 A. The 63 hierarchical facial segments used to define facial shape phenotypes associated with each SNP. B-D. LocusZoom plots (left) show SNPs in each locus (B, TWIST1; C, ALX1; D, ALX4) plotted by p-value of association with brain shape, colored by linkage disequilibrium (r2) to the lead SNP from each peak (purple diamond). Horizontal line indicates genome-wide significance threshold. Morphs (right) show the regions in the brain with highest significance of association with each lead SNP, with the top image of each pair showing an external view of the left hemisphere and the bottom image showing an internal view. E,F. Fold enrichment of SNPs associated with brain shape (E) or height (F) in distal ATAC peaks differentially accessible upon TF depletion or loss, with accessibility-matched control sets. Horizontal line indicates the enrichment in all hCNCC distal ATAC peaks, with flanking dashed lines indicating error bars. Error bars represent s.e.m.
Table S1. Immunoprecipitation-mass spectrometry data, related to Figure 6.
Table S3. Motif clusters enriched in Dlx1/2/5 ChIP-seq peaks from embryonic mouse forebrain, related to Figure 6.
Table S5. Primers used in this study, related to STAR Methods.
Highlights.
Mutually-dependent binding of TWIST1 and homeodomain TFs in embryonic mesenchyme
TF co-binding drives enhancer accessibility and shared transcriptional regulation
Weak TF-TF contacts guided by DNA mediate selectivity of cooperating partners
TWIST1, partners, and bound targets enriched for face shape-associated SNPs
Acknowledgments
We thank Katherine Xue, Raquel Fueyo, Christina Jensen, Tiffany Chern, and Liang-Fu Chen for critical feedback, and Hannah Long for generating the pGL3-noSV40-humanEC1.45_min1-2_4xEboxMutant plasmid. Mass spectrometry data were collected by the Vincent Coates Foundation Mass Spectrometry Laboratory, Stanford University Mass Spectrometry (RRID:SCR_017801). This work was supported in part by NIH P30 CA124435 utilizing the Stanford Cancer Institute Proteomics/Mass Spectrometry Shared Resource. Protein production was performed by the Protein Sciences Facility in the Karolinska Institutet Department of Medical Biochemistry and Biophysics.
pAAV-GFP was a gift from John Gray (Addgene plasmid #32395)84, pDGM6 was a gift from David Russell (Addgene plasmid #110660)85, PB-iNEUROD1_P2A_GFP_Puro was a gift from Prashant Mali (Addgene plasmid #168803)86, and pCAG-NLS-HA-Bxb1 was a gift from Pawel Pelczar (Addgene plasmid #51271)87.
This work was supported by HHMI-Damon Runyon Cancer Research Foundation Fellowship (DRG-2420-21), Stanford School of Medicine Dean’s Postdoctoral Fellowship, and NIH training grant 2T32AR007422-36A1 to S.K., Helen Hay Whitney Fellowship to S.N., Distinguished Professor Award from the Swedish Research Council to J.T., and NIH grant R35 GM131757, the Nomis Foundation, funding from the Howard Hughes Medical Institute, a Lorry Lokey endowed professorship, and a Stinehart Reed award to J.W.
Footnotes
Publisher's Disclaimer: This is a PDF file of an unedited manuscript that has been accepted for publication. As a service to our customers we are providing this early version of the manuscript. The manuscript will undergo copyediting, typesetting, and review of the resulting proof before it is published in its final form. Please note that during the production process errors may be discovered which could affect the content, and all legal disclaimers that apply to the journal pertain.
Declaration of interests
J.W. is a paid scientific advisory board member at Camp4 and Paratus Sciences. J.T. has a consultancy agreement with DeepMind Technologies. J.W. is an advisory board member at Cell Press journals, including Cell, Molecular Cell, and Developmental Cell.
References
- 1.Kim S, and Wysocka J (2023). Deciphering the multi-scale, quantitative cis-regulatory code. Mol. Cell 83, 373–392. 10.1016/j.molcel.2022.12.032. [DOI] [PMC free article] [PubMed] [Google Scholar]
- 2.Lambert SA, Jolma A, Campitelli LF, Das PK, Yin Y, Albu M, Chen X, Taipale J, Hughes TR, and Weirauch MT (2018). The Human Transcription Factors. Cell 172, 650–665. 10.1016/j.cell.2018.01.029. [DOI] [PubMed] [Google Scholar]
- 3.Lee QY, Mall M, Chanda S, Zhou B, Sharma KS, Schaukowitch K, Adrian-Segarra JM, Grieder SD, Kareta MS, Wapinski OL, et al. (2020). Pro-neuronal activity of Myod1 due to promiscuous binding to neuronal genes. Nat. Cell Biol 22, 401–411. 10.1038/s41556-020-0490-3. [DOI] [PubMed] [Google Scholar]
- 4.Lewis EB (1978). A gene complex controlling segmentation in Drosophila. Nature 276, 565–570. 10.1038/276565a0. [DOI] [PubMed] [Google Scholar]
- 5.Dennis DJ, Han S, and Schuurmans C (2019). bHLH transcription factors in neural development, disease, and reprogramming. Brain Res. 1705, 48–65. 10.1016/j.brainres.2018.03.013. [DOI] [PubMed] [Google Scholar]
- 6.Murre C (2019). Helix–loop–helix proteins and the advent of cellular diversity: 30 years of discovery. Genes Dev. 33, 6–25. 10.1101/gad.320663.118. [DOI] [PMC free article] [PubMed] [Google Scholar]
- 7.Berger MF, Badis G, Gehrke AR, Talukder S, Philippakis AA, Peña-Castillo L, Alleyne TM, Mnaimneh S, Botvinnik OB, Chan ET, et al. (2008). Variation in Homeodomain DNA Binding Revealed by High-Resolution Analysis of Sequence Preferences. Cell 133, 1266–1276. 10.1016/j.cell.2008.05.024. [DOI] [PMC free article] [PubMed] [Google Scholar]
- 8.Jolma A, Yan J, Whitington T, Toivonen J, Nitta KR, Rastas P, Morgunova E, Enge M, Taipale M, Wei G, et al. (2013). DNA-Binding Specificities of Human Transcription Factors. Cell 152, 327–339. 10.1016/j.cell.2012.12.009. [DOI] [PubMed] [Google Scholar]
- 9.Morgunova E, and Taipale J (2017). Structural perspective of cooperative transcription factor binding. Curr. Opin. Struct. Biol 47, 1–8. 10.1016/j.sbi.2017.03.006. [DOI] [PubMed] [Google Scholar]
- 10.Jolma A, Yin Y, Nitta KR, Dave K, Popov A, Taipale M, Enge M, Kivioja T, Morgunova E, and Taipale J (2015). DNA-dependent formation of transcription factor pairs alters their binding specificity. Nature 527, 384–388. 10.1038/nature15518. [DOI] [PubMed] [Google Scholar]
- 11.Li P, Spolski R, Liao W, Wang L, Murphy TL, Murphy KM, and Leonard WJ (2012). BATF-JUN is critical for IRF4-mediated transcription in T cells. Nature 490, 543–546. 10.1038/nature11530. [DOI] [PMC free article] [PubMed] [Google Scholar]
- 12.Luna-Zurita L, Stirnimann CU, Glatt S, Kaynak BL, Thomas S, Baudin F, Samee MAH, He D, Small EM, Mileikovsky M, et al. (2016). Complex Interdependence Regulates Heterotypic Transcription Factor Distribution and Coordinates Cardiogenesis. Cell 164, 999–1014. 10.1016/j.cell.2016.01.004. [DOI] [PMC free article] [PubMed] [Google Scholar]
- 13.Monahan K, Schieren I, Cheung J, Mumbey-Wafula A, Monuki ES, and Lomvardas S (2017). Cooperative interactions enable singular olfactory receptor expression in mouse olfactory neurons. eLife 6, e28620. 10.7554/eLife.28620. [DOI] [PMC free article] [PubMed] [Google Scholar]
- 14.Soufi A, Garcia MF, Jaroszewicz A, Osman N, Pellegrini M, and Zaret KS (2015). Pioneer Transcription Factors Target Partial DNA Motifs on Nucleosomes to Initiate Reprogramming. Cell 161, 555–568. 10.1016/j.cell.2015.03.017. [DOI] [PMC free article] [PubMed] [Google Scholar]
- 15.Michael AK, Grand RS, Isbel L, Cavadini S, Kozicka Z, Kempf G, Bunker RD, Schenk AD, Graff-Meyer A, Pathare GR, et al. (2020). Mechanisms of OCT4-SOX2 motif readout on nucleosomes. Science 368, 1460–1465. 10.1126/science.abb0074. [DOI] [PubMed] [Google Scholar]
- 16.Farley EK, Olson KM, Zhang W, Brandt AJ, Rokhsar DS, and Levine MS (2015). Suboptimization of developmental enhancers. Science 350, 325–328. 10.1126/science.aac6948. [DOI] [PMC free article] [PubMed] [Google Scholar]
- 17.Sahu B, Hartonen T, Pihlajamaa P, Wei B, Dave K, Zhu F, Kaasinen E, Lidschreiber K, Lidschreiber M, Daub CO, et al. (2022). Sequence determinants of human gene regulatory elements. Nat. Genet, 1–12. 10.1038/s41588-021-01009-4. [DOI] [PMC free article] [PubMed] [Google Scholar]
- 18.De Val S, Chi NC, Meadows SM, Minovitsky S, Anderson JP, Harris IS, Ehlers ML, Agarwal P, Visel A, Xu S-M, et al. (2008). Combinatorial regulation of endothelial gene expression by ets and forkhead transcription factors. Cell 135, 1053–1064. 10.1016/j.cell.2008.10.049. [DOI] [PMC free article] [PubMed] [Google Scholar]
- 19.Prescott SL, Srinivasan R, Marchetto MC, Grishina I, Narvaiza I, Selleri L, Gage FH, Swigut T, and Wysocka J (2015). Enhancer Divergence and cis-Regulatory Evolution in the Human and Chimp Neural Crest. Cell 163, 68–83. 10.1016/j.cell.2015.08.036. [DOI] [PMC free article] [PubMed] [Google Scholar]
- 20.Moore JE, Purcaro MJ, Pratt HE, Epstein CB, Shoresh N, Adrian J, Kawli T, Davis CA, Dobin A, Kaul R, et al. (2020). Expanded encyclopaedias of DNA elements in the human and mouse genomes. Nature 583, 699–710. 10.1038/s41586-020-2493-4. [DOI] [PMC free article] [PubMed] [Google Scholar]
- 21.Dong R, Yang R, Zhan Y, Lai H-D, Ye C-J, Yao X-Y, Luo W-Q, Cheng X-M, Miao J-J, Wang J-F, et al. (2020). Single-Cell Characterization of Malignant Phenotypes and Developmental Trajectories of Adrenal Neuroblastoma. Cancer Cell 38, 716–733.e6. 10.1016/j.ccell.2020.08.014. [DOI] [PubMed] [Google Scholar]
- 22.Plikus MV, Wang X, Sinha S, Forte E, Thompson SM, Herzog EL, Driskell RR, Rosenthal N, Biernaskie J, and Horsley V (2021). Fibroblasts: origins, definitions, and functions in health and disease. Cell 184, 3852–3872. 10.1016/j.cell.2021.06.024. [DOI] [PMC free article] [PubMed] [Google Scholar]
- 23.Long HK, Osterwalder M, Welsh IC, Hansen K, Davies JOJ, Liu YE, Koska M, Adams AT, Aho R, Arora N, et al. (2020). Loss of Extreme Long-Range Enhancers in Human Neural Crest Drives a Craniofacial Disorder. Cell Stem Cell 27, 765–783.e14. 10.1016/j.stem.2020.09.001. [DOI] [PMC free article] [PubMed] [Google Scholar]
- 24.Minoux M, Holwerda S, Vitobello A, Kitazawa T, Kohler H, Stadler MB, and Rijli FM (2017). Gene bivalency at Polycomb domains regulates cranial neural crest positional identity. Science 355, eaal2913. 10.1126/science.aal2913. [DOI] [PubMed] [Google Scholar]
- 25.Harenza JL, Diamond MA, Adams RN, Song MM, Davidson HL, Hart LS, Dent MH, Fortina P, Reynolds CP, and Maris JM (2017). Transcriptomic profiling of 39 commonly-used neuroblastoma cell lines. Sci. Data 4, 170033. 10.1038/sdata.2017.33. [DOI] [PMC free article] [PubMed] [Google Scholar]
- 26.Paliou C, Guckelberger P, Schöpflin R, Heinrich V, Esposito A, Chiariello AM, Bianco S, Annunziatella C, Helmuth J, Haas S, et al. (2019). Preformed chromatin topology assists transcriptional robustness of Shh during limb development. Proc. Natl. Acad. Sci 116, 12390–12399. 10.1073/pnas.1900672116. [DOI] [PMC free article] [PubMed] [Google Scholar]
- 27.Andrey G, Schöpflin R, Jerković I, Heinrich V, Ibrahim DM, Paliou C, Hochradel M, Timmermann B, Haas S, Vingron M, et al. (2017). Characterization of hundreds of regulatory landscapes in developing limbs reveals two regimes of chromatin folding. Genome Res. 27, 223–233. 10.1101/gr.213066.116. [DOI] [PMC free article] [PubMed] [Google Scholar]
- 28.Di Giammartino DC, Kloetgen A, Polyzos A, Liu Y, Kim D, Murphy D, Abuhashem A, Cavaliere P, Aronson B, Shah V, et al. (2019). KLF4 is involved in the organization and regulation of pluripotency-associated three-dimensional enhancer networks. Nat. Cell Biol 21, 1179–1190. 10.1038/s41556-019-0390-6. [DOI] [PMC free article] [PubMed] [Google Scholar]
- 29.Marthandan S, Baumgart M, Priebe S, Groth M, Schaer J, Kaether C, Guthke R, Cellerino A, Platzer M, Diekmann S, et al. (2016). Conserved Senescence Associated Genes and Pathways in Primary Human Fibroblasts Detected by RNA-Seq. PloS One 11, e0154531. 10.1371/journal.pone.0154531. [DOI] [PMC free article] [PubMed] [Google Scholar]
- 30.Wang L, Tang Q, Xu J, Li H, Yang T, Li L, Machon O, Hu T, and Chen Y (2020). The transcriptional regulator MEIS2 sets up the ground state for palatal osteogenesis in mice. J. Biol. Chem 295, 5449–5460. 10.1074/jbc.RA120.012684. [DOI] [PMC free article] [PubMed] [Google Scholar]
- 31.Tissières V, Geier F, Kessler B, Wolf E, Zeller R, and Lopez-Rios J (2020). Gene Regulatory and Expression Differences between Mouse and Pig Limb Buds Provide Insights into the Evolutionary Emergence of Artiodactyl Traits. Cell Rep. 31, 107490. 10.1016/j.celrep.2020.03.054. [DOI] [PMC free article] [PubMed] [Google Scholar]
- 32.Oomen ME, Hansen AS, Liu Y, Darzacq X, and Dekker J (2019). CTCF sites display cell cycle-dependent dynamics in factor binding and nucleosome positioning. Genome Res. 29, 236–249. 10.1101/gr.241547.118. [DOI] [PMC free article] [PubMed] [Google Scholar]
- 33.Risca VI, Denny SK, Straight AF, and Greenleaf WJ (2017). Variable chromatin structure revealed by in situ spatially correlated DNA cleavage mapping. Nature 541, 237–241. 10.1038/nature20781. [DOI] [PMC free article] [PubMed] [Google Scholar]
- 34.Zeid R, Lawlor MA, Poon E, Reyes JM, Fulciniti M, Lopez MA, Scott TG, Nabet B, Erb MA, Winter GE, et al. (2018). Enhancer invasion shapes MYCN-dependent transcriptional amplification in neuroblastoma. Nat. Genet 50, 515–523. 10.1038/s41588-018-0044-9. [DOI] [PMC free article] [PubMed] [Google Scholar]
- 35.Chang AT, Liu Y, Ayyanathan K, Benner C, Jiang Y, Prokop JW, Paz H, Wang D, Li H-R, Fu X-D, et al. (2015). An evolutionarily conserved DNA architecture determines target specificity of the TWIST family bHLH transcription factors. Genes Dev. 29, 603–616. 10.1101/gad.242842.114. [DOI] [PMC free article] [PubMed] [Google Scholar]
- 36.Desanlis I, Kherdjemil Y, Mayran A, Bouklouch Y, Gentile C, Sheth R, Zeller R, Drouin J, and Kmita M (2020). HOX13-dependent chromatin accessibility underlies the transition towards the digit development program. Nat. Commun 11, 2491. 10.1038/s41467-020-16317-2. [DOI] [PMC free article] [PubMed] [Google Scholar]
- 37.Iyyanar PPR, Wu Z, Lan Y, Hu Y-C, and Jiang R (2022). Alx1 Deficient Mice Recapitulate Craniofacial Phenotype and Reveal Developmental Basis of ALX1-Related Frontonasal Dysplasia. Front. Cell Dev. Biol 10. [DOI] [PMC free article] [PubMed] [Google Scholar]
- 38.Minoux M, and Rijli FM (2010). Molecular mechanisms of cranial neural crest cell migration and patterning in craniofacial development. Dev. Camb. Engl 137, 2605–2621. 10.1242/dev.040048. [DOI] [PubMed] [Google Scholar]
- 39.Barretina J, Caponigro G, Stransky N, Venkatesan K, Margolin AA, Kim S, Wilson CJ, Lehár J, Kryukov GV, Sonkin D, et al. (2012). The Cancer Cell Line Encyclopedia enables predictive modelling of anticancer drug sensitivity. Nature 483, 603–607. 10.1038/nature11003. [DOI] [PMC free article] [PubMed] [Google Scholar]
- 40.Rada-Iglesias A, Bajpai R, Prescott S, Brugmann SA, Swigut T, and Wysocka J (2012). Epigenomic Annotation of Enhancers Predicts Transcriptional Regulators of Human Neural Crest. Cell Stem Cell 11, 633–648. 10.1016/j.stem.2012.07.006. [DOI] [PMC free article] [PubMed] [Google Scholar]
- 41.Bajpai R, Chen DA, Rada-Iglesias A, Zhang J, Xiong Y, Helms J, Chang C-P, Zhao Y, Swigut T, and Wysocka J (2010). CHD7 cooperates with PBAF to control multipotent neural crest formation. Nature 463, 958–962. 10.1038/nature08733. [DOI] [PMC free article] [PubMed] [Google Scholar]
- 42.Fan X, Waardenberg AJ, Demuth M, Osteil P, Sun JQJ, Loebel DAF, Graham M, Tam PPL, and Fossat N (2020). TWIST1 Homodimers and Heterodimers Orchestrate Lineage-Specific Differentiation. Mol. Cell. Biol 40, e00663–19. 10.1128/MCB.00663-19. [DOI] [PMC free article] [PubMed] [Google Scholar]
- 43.Nabet B, Roberts JM, Buckley DL, Paulk J, Dastjerdi S, Yang A, Leggett AL, Erb MA, Lawlor MA, Souza A, et al. (2018). The dTAG system for immediate and target-specific protein degradation. Nat. Chem. Biol 14, 431–441. 10.1038/s41589-018-0021-8. [DOI] [PMC free article] [PubMed] [Google Scholar]
- 44.Nabet B, Ferguson FM, Seong BKA, Kuljanin M, Leggett AL, Mohardt ML, Robichaud A, Conway AS, Buckley DL, Mancias JD, et al. (2020). Rapid and direct control of target protein levels with VHL-recruiting dTAG molecules. Nat. Commun 11, 4687. 10.1038/s41467-020-18377-w. [DOI] [PMC free article] [PubMed] [Google Scholar]
- 45.Shaner NC, Lambert GG, Chammas A, Ni Y, Cranfill PJ, Baird MA, Sell BR, Allen JR, Day RN, Israelsson M, et al. (2013). A bright monomeric green fluorescent protein derived from Branchiostoma lanceolatum. Nat. Methods 10, 407–409. 10.1038/nmeth.2413. [DOI] [PMC free article] [PubMed] [Google Scholar]
- 46.Naqvi S, Kim S, Hoskens H, Matthews HS, Spritz RA, Klein OD, Hallgrímsson B, Swigut T, Claes P, Pritchard JK, et al. (2023). Precise modulation of transcription factor levels identifies features underlying dosage sensitivity. Nat. Genet, 1–11. 10.1038/s41588-023-01366-2. [DOI] [PMC free article] [PubMed] [Google Scholar]
- 47.Qu S, Tucker SC, Zhao Q, deCrombrugghe B, and Wisdom R (1999). Physical and genetic interactions between Alx4 and Cart1. Development 126, 359–369. 10.1242/dev.126.2.359. [DOI] [PubMed] [Google Scholar]
- 48.Zalc A, Sinha R, Gulati GS, Wesche DJ, Daszczuk P, Swigut T, Weissman IL, and Wysocka J (2021). Reactivation of the pluripotency program precedes formation of the cranial neural crest. Science 371, eabb4776. 10.1126/science.abb4776. [DOI] [PMC free article] [PubMed] [Google Scholar]
- 49.Simões-Costa M, and Bronner ME (2015). Establishing neural crest identity: a gene regulatory recipe. Dev. Camb. Engl 142, 242–257. 10.1242/dev.105445. [DOI] [PMC free article] [PubMed] [Google Scholar]
- 50.Bildsoe H, Loebel DAF, Jones VJ, Chen Y-T, Behringer RR, and Tam PPL (2009). Requirement for Twist1 in frontonasal and skull vault development in the mouse embryo. Dev. Biol 331, 176–188. 10.1016/j.ydbio.2009.04.034. [DOI] [PubMed] [Google Scholar]
- 51.Vincentz JW, Firulli BA, Lin A, Spicer DB, Howard MJ, and Firulli AB (2013). Twist1 Controls a Cell-Specification Switch Governing Cell Fate Decisions within the Cardiac Neural Crest. PLOS Genet. 9, e1003405. 10.1371/journal.pgen.1003405. [DOI] [PMC free article] [PubMed] [Google Scholar]
- 52.Kos R, Reedy MV, Johnson RL, and Erickson CA (2001). The winged-helix transcription factor FoxD3 is important for establishing the neural crest lineage and repressing melanogenesis in avian embryos. Development 128, 1467–1479. 10.1242/dev.128.8.1467. [DOI] [PubMed] [Google Scholar]
- 53.Teng L, Mundell NA, Frist AY, Wang Q, and Labosky PA (2008). Requirement for Foxd3 in the maintenance of neural crest progenitors. Development 135, 1615–1624. 10.1242/dev.012179. [DOI] [PMC free article] [PubMed] [Google Scholar]
- 54.Markman S, Zada M, David E, Giladi A, Amit I, and Zelzer E (2023). A single-cell census of mouse limb development identifies complex spatiotemporal dynamics of skeleton formation. Dev. Cell 10.1016/j.devcel.2023.02.013. [DOI] [PubMed] [Google Scholar]
- 55.Connerney J, Andreeva V, Leshem Y, Muentener C, Mercado MA, and Spicer DB (2006). Twist1 dimer selection regulates cranial suture patterning and fusion. Dev. Dyn 235, 1334–1346. 10.1002/dvdy.20717. [DOI] [PubMed] [Google Scholar]
- 56.Gordân R, Shen N, Dror I, Zhou T, Horton J, Rohs R, and Bulyk ML (2013). Genomic Regions Flanking E-Box Binding Sites Influence DNA Binding Specificity of bHLH Transcription Factors through DNA Shape. Cell Rep. 3, 1093–1104. 10.1016/j.celrep.2013.03.014. [DOI] [PMC free article] [PubMed] [Google Scholar]
- 57.White JD, Indencleef K, Naqvi S, Eller RJ, Hoskens H, Roosenboom J, Lee MK, Li J, Mohammed J, Richmond S, et al. (2021). Insights into the genetic architecture of the human face. Nat. Genet 53, 45–53. 10.1038/s41588-020-00741-7. [DOI] [PMC free article] [PubMed] [Google Scholar]
- 58.Naqvi S, Sleyp Y, Hoskens H, Indencleef K, Spence JP, Bruffaerts R, Radwan A, Eller RJ, Richmond S, Shriver MD, et al. (2021). Shared heritability of human face and brain shape. Nat. Genet 53, 830–839. 10.1038/s41588-021-00827-w. [DOI] [PMC free article] [PubMed] [Google Scholar]
- 59.Claes P, Roosenboom J, White JD, Swigut T, Sero D, Li J, Lee MK, Zaidi A, Mattern BC, Liebowitz C, et al. (2018). Genome-wide mapping of global-to-local genetic effects on human facial shape. Nat. Genet 50, 414–423. 10.1038/s41588-018-0057-4. [DOI] [PMC free article] [PubMed] [Google Scholar]
- 60.Ringel AR, Szabo Q, Chiariello AM, Chudzik K, Schöpflin R, Rothe P, Mattei AL, Zehnder T, Harnett D, Laupert V, et al. (2022). Repression and 3D-restructuring resolves regulatory conflicts in evolutionarily rearranged genomes. Cell 185, 3689–3704.e21. 10.1016/j.cell.2022.09.006. [DOI] [PMC free article] [PubMed] [Google Scholar]
- 61.Chen ZF, and Behringer RR (1995). twist is required in head mesenchyme for cranial neural tube morphogenesis. Genes Dev. 9, 686–699. 10.1101/gad.9.6.686. [DOI] [PubMed] [Google Scholar]
- 62.Beverdam A, Brouwer A, Reijnen M, Korving J, and Meijlink F (2001). Severe nasal clefting and abnormal embryonic apoptosis in Alx3/Alx4 double mutant mice. Development 128, 3975–3986. 10.1242/dev.128.20.3975. [DOI] [PubMed] [Google Scholar]
- 63.Krawchuk D, Weiner SJ, Chen Y-T, Lu BC, Costantini F, Behringer RR, and Laufer E (2010). Twist1 activity thresholds define multiple functions in limb development. Dev. Biol 347, 133–146. 10.1016/j.ydbio.2010.08.015. [DOI] [PMC free article] [PubMed] [Google Scholar]
- 64.Qu S, Tucker SC, Ehrlich JS, Levorse JM, Flaherty LA, Wisdom R, and Vogt TF (1998). Mutations in mouse Aristaless-like4 cause Strong’s luxoid polydactyly. Development 125, 2711–2721. 10.1242/dev.125.14.2711. [DOI] [PubMed] [Google Scholar]
- 65.Bensoussan-Trigano V, Lallemand Y, Saint Cloment C, and Robert B (2011). Msx1 and Msx2 in limb mesenchyme modulate digit number and identity. Dev. Dyn. Off. Publ. Am. Assoc. Anat 240, 1190–1202. 10.1002/dvdy.22619. [DOI] [PubMed] [Google Scholar]
- 66.ten Berge D, Brouwer A, Korving J, Martin JF, and Meijlink F (1998). Prx1 and Prx2 in skeletogenesis: roles in the craniofacial region, inner ear and limbs. Development 125, 3831–3842. 10.1242/dev.125.19.3831. [DOI] [PubMed] [Google Scholar]
- 67.Martin JF, Bradley A, and Olson EN (1995). The paired-like homeo box gene MHox is required for early events of skeletogenesis in multiple lineages. Genes Dev. 9, 1237–1249. 10.1101/gad.9.10.1237. [DOI] [PubMed] [Google Scholar]
- 68.Howard TD, Paznekas WA, Green ED, Chiang LC, Ma N, Luna RIOD, Delgado CG, Gonzalez-Ramos M, Kline AD, and Jabs EW (1997). Mutations in TWIST, a basic helix–loop–helix transcription factor, in Saethre-Chotzen syndrome. Nat. Genet 15, 36–41. 10.1038/ng0197-36. [DOI] [PubMed] [Google Scholar]
- 69.Kim S, Twigg SRF, Scanlon VA, Chandra A, Hansen TJ, Alsubait A, Fenwick AL, McGowan SJ, Lord H, Lester T, et al. (2017). Localized TWIST1 and TWIST2 basic domain substitutions cause four distinct human diseases that can be modeled in Caenorhabditis elegans. Hum. Mol. Genet 26, 2118–2132. 10.1093/hmg/ddx107. [DOI] [PMC free article] [PubMed] [Google Scholar]
- 70.Uz E, Alanay Y, Aktas D, Vargel I, Gucer S, Tuncbilek G, Eggeling F. von, Yilmaz E, Deren O, Posorski N, et al. (2010). Disruption of ALX1 Causes Extreme Microphthalmia and Severe Facial Clefting: Expanding the Spectrum of Autosomal-Recessive ALX-Related Frontonasal Dysplasia. Am. J. Hum. Genet 86, 789–796. 10.1016/j.ajhg.2010.04.002. [DOI] [PMC free article] [PubMed] [Google Scholar]
- 71.Kayserili H, Uz E, Niessen C, Vargel I, Alanay Y, Tuncbilek G, Yigit G, Uyguner O, Candan S, Okur H, et al. (2009). ALX4 dysfunction disrupts craniofacial and epidermal development. Hum. Mol. Genet 18, 4357–4366. 10.1093/hmg/ddp391. [DOI] [PubMed] [Google Scholar]
- 72.Twigg SRF, Versnel SL, Nürnberg G, Lees MM, Bhat M, Hammond P, Hennekam RCM, Hoogeboom AJM, Hurst JA, Johnson D, et al. (2009). Frontorhiny, a Distinctive Presentation of Frontonasal Dysplasia Caused by Recessive Mutations in the ALX3 Homeobox Gene. Am. J. Hum. Genet 84, 698–705. 10.1016/j.ajhg.2009.04.009. [DOI] [PMC free article] [PubMed] [Google Scholar]
- 73.Mavrogiannis LA, Antonopoulou I, Baxová A, Kutílek S, Kim CA, Sugayama SM, Salamanca A, Wall SA, Morriss-Kay GM, and Wilkie AO (2001). Haploinsufficiency of the human homeobox gene ALX4 causes skull ossification defects. Nat. Genet 27, 17–18. 10.1038/83703. [DOI] [PubMed] [Google Scholar]
- 74.Sergi C, and Kamnasaran D (2011). PRRX1 is mutated in a fetus with agnathia-otocephaly. Clin. Genet 79, 293–295. 10.1111/j.1399-0004.2010.01531.x. [DOI] [PubMed] [Google Scholar]
- 75.Lamichhaney S, Berglund J, Almén MS, Maqbool K, Grabherr M, Martinez-Barrio A, Promerová M, Rubin C-J, Wang C, Zamani N, et al. (2015). Evolution of Darwin’s finches and their beaks revealed by genome sequencing. Nature 518, 371–375. 10.1038/nature14181. [DOI] [PubMed] [Google Scholar]
- 76.Cretekos CJ, Wang Y, Green ED, Program NCS, Martin JF, Rasweiler JJ, and Behringer RR (2008). Regulatory divergence modifies limb length between mammals. Genes Dev. 22, 141–151. 10.1101/gad.1620408. [DOI] [PMC free article] [PubMed] [Google Scholar]
- 77.Yang J, Mani SA, Donaher JL, Ramaswamy S, Itzykson RA, Come C, Savagner P, Gitelman I, Richardson A, and Weinberg RA (2004). Twist, a Master Regulator of Morphogenesis, Plays an Essential Role in Tumor Metastasis. Cell 117, 927–939. 10.1016/j.cell.2004.06.006. [DOI] [PubMed] [Google Scholar]
- 78.Castanon I, Von Stetina S, Kass J, and Baylies MK (2001). Dimerization partners determine the activity of the Twist bHLH protein during Drosophila mesoderm development. Development 128, 3145–3159. 10.1242/dev.128.16.3145. [DOI] [PubMed] [Google Scholar]
- 79.Leptin M (1991). twist and snail as positive and negative regulators during Drosophila mesoderm development. Genes Dev. 5, 1568–1576. 10.1101/gad.5.9.1568. [DOI] [PubMed] [Google Scholar]
- 80.Zeitlinger J, Zinzen RP, Stark A, Kellis M, Zhang H, Young RA, and Levine M (2007). Whole-genome ChIP–chip analysis of Dorsal, Twist, and Snail suggests integration of diverse patterning processes in the Drosophila embryo. Genes Dev. 21, 385–390. 10.1101/gad.1509607. [DOI] [PMC free article] [PubMed] [Google Scholar]
- 81.Square T, Jandzik D, Romášek M, Cerny R, and Medeiros DM (2017). The origin and diversification of the developmental mechanisms that pattern the vertebrate head skeleton. Dev. Biol 427, 219–229. 10.1016/j.ydbio.2016.11.014. [DOI] [PubMed] [Google Scholar]
- 82.Lindtner S, Catta-Preta R, Tian H, Su-Feher L, Price JD, Dickel DE, Greiner V, Silberberg SN, McKinsey GL, McManus MT, et al. (2019). Genomic Resolution of DLX-Orchestrated Transcriptional Circuits Driving Development of Forebrain GABAergic Neurons. Cell Rep. 28, 2048–2063.e8. 10.1016/j.celrep.2019.07.022. [DOI] [PMC free article] [PubMed] [Google Scholar]
- 83.Slattery M, Riley T, Liu P, Abe N, Gomez-Alcala P, Dror I, Zhou T, Rohs R, Honig B, Bussemaker HJ, et al. (2011). Cofactor Binding Evokes Latent Differences in DNA Binding Specificity between Hox Proteins. Cell 147, 1270–1282. 10.1016/j.cell.2011.10.053. [DOI] [PMC free article] [PubMed] [Google Scholar]
- 84.Gray JT, and Zolotukhin S (2011). Design and construction of functional AAV vectors. Methods Mol. Biol. Clifton NJ 807, 25–46. 10.1007/978-1-61779-370-7_2. [DOI] [PubMed] [Google Scholar]
- 85.Gregorevic P, Blankinship MJ, Allen JM, Crawford RW, Meuse L, Miller DG, Russell DW, and Chamberlain JS (2004). Systemic delivery of genes to striated muscles using adeno-associated viral vectors. Nat. Med 10, 828–834. 10.1038/nm1085. [DOI] [PMC free article] [PubMed] [Google Scholar]
- 86.Dailamy A, Parekh U, Katrekar D, Kumar A, McDonald D, Moreno A, Bagheri P, Ng TN, and Mali P (2021). Programmatic introduction of parenchymal cell types into blood vessel organoids. Stem Cell Rep. 16, 2432–2441. 10.1016/j.stemcr.2021.08.014. [DOI] [PMC free article] [PubMed] [Google Scholar]
- 87.Hermann M, Stillhard P, Wildner H, Seruggia D, Kapp V, Sánchez-Iranzo H, Mercader N, Montoliu L, Zeilhofer HU, and Pelczar P (2014). Binary recombinase systems for high-resolution conditional mutagenesis. Nucleic Acids Res. 42, 3894–3907. 10.1093/nar/gkt1361. [DOI] [PMC free article] [PubMed] [Google Scholar]
- 88.Melnikov I, Svensson O, Bourenkov G, Leonard G, and Popov A (2018). The complex analysis of X-ray mesh scans for macromolecular crystallography. Acta Crystallogr. Sect. Struct. Biol 74, 355–365. 10.1107/S2059798318002735. [DOI] [PMC free article] [PubMed] [Google Scholar]
- 89.Bourenkov GP, and Popov AN (2010). Optimization of data collection taking radiation damage into account. Acta Crystallogr. D Biol. Crystallogr 66, 409–419. 10.1107/S0907444909054961. [DOI] [PMC free article] [PubMed] [Google Scholar]
- 90.Kabsch W (2010). XDS. Acta Crystallogr. D Biol. Crystallogr 66, 125–132. 10.1107/S0907444909047337. [DOI] [PMC free article] [PubMed] [Google Scholar]
- 91.Jiang H, Lei R, Ding S-W, and Zhu S (2014). Skewer: a fast and accurate adapter trimmer for next-generation sequencing paired-end reads. BMC Bioinformatics 15, 182. 10.1186/1471-2105-15-182. [DOI] [PMC free article] [PubMed] [Google Scholar]
- 92.Langmead B, and Salzberg SL (2012). Fast gapped-read alignment with Bowtie 2. Nat. Methods 9, 357–359. 10.1038/nmeth.1923. [DOI] [PMC free article] [PubMed] [Google Scholar]
- 93.Danecek P, Bonfield JK, Liddle J, Marshall J, Ohan V, Pollard MO, Whitwham A, Keane T, McCarthy SA, Davies RM, et al. (2021). Twelve years of SAMtools and BCFtools. GigaScience 10, giab008. 10.1093/gigascience/giab008. [DOI] [PMC free article] [PubMed] [Google Scholar]
- 94.Zhang Y, Liu T, Meyer CA, Eeckhoute J, Johnson DS, Bernstein BE, Nusbaum C, Myers RM, Brown M, Li W, et al. (2008). Model-based Analysis of ChIP-Seq (MACS). Genome Biol. 9, R137. 10.1186/gb-2008-9-9-r137. [DOI] [PMC free article] [PubMed] [Google Scholar]
- 95.Quinlan AR, and Hall IM (2010). BEDTools: a flexible suite of utilities for comparing genomic features. Bioinformatics 26, 841–842. 10.1093/bioinformatics/btq033. [DOI] [PMC free article] [PubMed] [Google Scholar]
- 96.Love MI, Huber W, and Anders S (2014). Moderated estimation of fold change and dispersion for RNA-seq data with DESeq2. Genome Biol. 15, 550. 10.1186/s13059-014-0550-8. [DOI] [PMC free article] [PubMed] [Google Scholar]
- 97.Robinson JT, Thorvaldsdóttir H, Winckler W, Guttman M, Lander ES, Getz G, and Mesirov JP (2011). Integrative Genomics Viewer. Nat. Biotechnol 29, 24–26. 10.1038/nbt.1754. [DOI] [PMC free article] [PubMed] [Google Scholar]
- 98.Ramírez F, Ryan DP, Grüning B, Bhardwaj V, Kilpert F, Richter AS, Heyne S, Dündar F, and Manke T (2016). deepTools2: a next generation web server for deep-sequencing data analysis. Nucleic Acids Res. 44, W160–W165. 10.1093/nar/gkw257. [DOI] [PMC free article] [PubMed] [Google Scholar]
- 99.Soneson C, Love MI, and Robinson MD (2016). Differential analyses for RNA-seq: transcript-level estimates improve gene-level inferences. Preprint at F1000Research, 10.12688/f1000research.7563.2 10.12688/f1000research.7563.2. [DOI] [PMC free article] [PubMed] [Google Scholar]
- 100.Neumann T, Herzog VA, Muhar M, von Haeseler A, Zuber J, Ameres SL, and Rescheneder P (2019). Quantification of experimentally induced nucleotide conversions in high-throughput sequencing datasets. BMC Bioinformatics 20, 258. 10.1186/s12859-019-2849-7. [DOI] [PMC free article] [PubMed] [Google Scholar]
- 101.Gupta S, Stamatoyannopoulos JA, Bailey TL, and Noble WS (2007). Quantifying similarity between motifs. Genome Biol. 8, R24. 10.1186/gb-2007-8-2-r24. [DOI] [PMC free article] [PubMed] [Google Scholar]
- 102.McLeay RC, and Bailey TL (2010). Motif Enrichment Analysis: a unified framework and an evaluation on ChIP data. BMC Bioinformatics 11, 165. 10.1186/1471-2105-11-165. [DOI] [PMC free article] [PubMed] [Google Scholar]
- 103.Grant CE, Bailey TL, and Noble WS (2011). FIMO: scanning for occurrences of a given motif. Bioinformatics 27, 1017–1018. 10.1093/bioinformatics/btr064. [DOI] [PMC free article] [PubMed] [Google Scholar]
- 104.Ambrosini G, Groux R, and Bucher P (2018). PWMScan: a fast tool for scanning entire genomes with a position-specific weight matrix. Bioinformatics 34, 2483–2484. 10.1093/bioinformatics/bty127. [DOI] [PMC free article] [PubMed] [Google Scholar]
- 105.Bailey TL (2021). STREME: accurate and versatile sequence motif discovery. Bioinformatics 37, 2834–2840. 10.1093/bioinformatics/btab203. [DOI] [PMC free article] [PubMed] [Google Scholar]
- 106.McCoy AJ, Grosse-Kunstleve RW, Adams PD, Winn MD, Storoni LC, and Read RJ (2007). Phaser crystallographic software. J. Appl. Crystallogr 40, 658–674. 10.1107/S0021889807021206. [DOI] [PMC free article] [PubMed] [Google Scholar]
- 107.Adams PD, Afonine PV, Bunkóczi G, Chen VB, Davis IW, Echols N, Headd JJ, Hung L-W, Kapral GJ, Grosse-Kunstleve RW, et al. (2010). PHENIX: a comprehensive Python-based system for macromolecular structure solution. Acta Crystallogr. D Biol. Crystallogr 66, 213–221. 10.1107/S0907444909052925. [DOI] [PMC free article] [PubMed] [Google Scholar]
- 108.Winn MD, Ballard CC, Cowtan KD, Dodson EJ, Emsley P, Evans PR, Keegan RM, Krissinel EB, Leslie AGW, McCoy A, et al. (2011). Overview of the CCP4 suite and current developments. Acta Crystallogr. D Biol. Crystallogr 67, 235–242. 10.1107/S0907444910045749. [DOI] [PMC free article] [PubMed] [Google Scholar]
- 109.Murshudov GN, Vagin AA, and Dodson EJ (1997). Refinement of macromolecular structures by the maximum-likelihood method. Acta Crystallogr. D Biol. Crystallogr 53, 240–255. 10.1107/S0907444996012255. [DOI] [PubMed] [Google Scholar]
- 110.Emsley P, Lohkamp B, Scott WG, and Cowtan K (2010). Features and development of Coot. Acta Crystallogr. D Biol. Crystallogr 66, 486–501. 10.1107/S0907444910007493. [DOI] [PMC free article] [PubMed] [Google Scholar]
- 111.Schrödinger LLC (2015). The PyMOL Molecular Graphics System, Version 1.8.
- 112.Schindelin J, Arganda-Carreras I, Frise E, Kaynig V, Longair M, Pietzsch T, Preibisch S, Rueden C, Saalfeld S, Schmid B, et al. (2012). Fiji: an open-source platform for biological-image analysis. Nat. Methods 9, 676–682. 10.1038/nmeth.2019. [DOI] [PMC free article] [PubMed] [Google Scholar]
- 113.Finucane HK, Bulik-Sullivan B, Gusev A, Trynka G, Reshef Y, Loh P-R, Anttila V, Xu H, Zang C, Farh K, et al. (2015). Partitioning heritability by functional annotation using genome-wide association summary statistics. Nat. Genet 47, 1228–1235. 10.1038/ng.3404. [DOI] [PMC free article] [PubMed] [Google Scholar]
- 114.Sekhon JS (2011). Multivariate and Propensity Score Matching Software with Automated Balance Optimization: The Matching package for R. J. Stat. Softw 42, 1–52. 10.18637/jss.v042.i07. [DOI] [Google Scholar]
- 115.Kent WJ, Sugnet CW, Furey TS, Roskin KM, Pringle TH, Zahler AM, and Haussler D (2002). The Human Genome Browser at UCSC. Genome Res. 12, 996–1006. 10.1101/gr.229102. [DOI] [PMC free article] [PubMed] [Google Scholar]
- 116.Corces MR, Trevino AE, Hamilton EG, Greenside PG, Sinnott-Armstrong NA, Vesuna S, Satpathy AT, Rubin AJ, Montine KS, Wu B, et al. (2017). An improved ATAC-seq protocol reduces background and enables interrogation of frozen tissues. Nat. Methods 14, 959–962. 10.1038/nmeth.4396. [DOI] [PMC free article] [PubMed] [Google Scholar]
- 117.Meers MP, Bryson TD, Henikoff JG, and Henikoff S (2019). Improved CUT&RUN chromatin profiling tools. eLife 8, e46314. 10.7554/eLife.46314. [DOI] [PMC free article] [PubMed] [Google Scholar]
- 118.Liu N, Hargreaves VV, Zhu Q, Kurland JV, Hong J, Kim W, Sher F, Macias-Trevino C, Rogers JM, Kurita R, et al. (2018). Direct Promoter Repression by BCL11A Controls the Fetal to Adult Hemoglobin Switch. Cell 173, 430–442.e17. 10.1016/j.cell.2018.03.016. [DOI] [PMC free article] [PubMed] [Google Scholar]
- 119.Herzog VA, Reichholf B, Neumann T, Rescheneder P, Bhat P, Burkard TR, Wlotzka W, von Haeseler A, Zuber J, and Ameres SL (2017). Thiol-linked alkylation of RNA to assess expression dynamics. Nat. Methods 14, 1198–1204. 10.1038/nmeth.4435. [DOI] [PMC free article] [PubMed] [Google Scholar]
- 120.Savitsky P, Bray J, Cooper CDO, Marsden BD, Mahajan P, Burgess-Brown NA, and Gileadi O (2010). High-throughput production of human proteins for crystallization: the SGC experience. J. Struct. Biol 172, 3–13. 10.1016/j.jsb.2010.06.008. [DOI] [PMC free article] [PubMed] [Google Scholar]
- 121.Morgunova E, Yin Y, Jolma A, Dave K, Schmierer B, Popov A, Eremina N, Nilsson L, and Taipale J (2015). Structural insights into the DNA-binding specificity of E2F family transcription factors. Nat. Commun 6, 10050. 10.1038/ncomms10050. [DOI] [PMC free article] [PubMed] [Google Scholar]
- 122.Yin Y, Morgunova E, Jolma A, Kaasinen E, Sahu B, Khund-Sayeed S, Das PK, Kivioja T, Dave K, Zhong F, et al. (2017). Impact of cytosine methylation on DNA binding specificities of human transcription factors. Science 356, eaaj2239. 10.1126/science.aaj2239. [DOI] [PMC free article] [PubMed] [Google Scholar]
- 123.Zander U, Bourenkov G, Popov AN, de Sanctis D, Svensson O, McCarthy AA, Round E, Gordeliy V, Mueller-Dieckmann C, and Leonard GA (2015). MeshAndCollect: an automated multicrystal data-collection workflow for synchrotron macromolecular crystallography beamlines. Acta Crystallogr. D Biol. Crystallogr 71, 2328–2343. 10.1107/S1399004715017927. [DOI] [PMC free article] [PubMed] [Google Scholar]
- 124.Patro R, Duggal G, Love MI, Irizarry RA, and Kingsford C (2017). Salmon provides fast and bias-aware quantification of transcript expression. Nat. Methods 14, 417–419. 10.1038/nmeth.4197. [DOI] [PMC free article] [PubMed] [Google Scholar]
- 125.Khan A, Fornes O, Stigliani A, Gheorghe M, Castro-Mondragon JA, van der Lee R, Bessy A, Chèneby J, Kulkarni SR, Tan G, et al. (2018). JASPAR 2018: update of the open-access database of transcription factor binding profiles and its web framework. Nucleic Acids Res. 46, D260–D266. 10.1093/nar/gkx1126. [DOI] [PMC free article] [PubMed] [Google Scholar]
- 126.Kulakovskiy IV, Vorontsov IE, Yevshin IS, Sharipov RN, Fedorova AD, Rumynskiy EI, Medvedeva YA, Magana-Mora A, Bajic VB, Papatsenko DA, et al. (2018). HOCOMOCO: towards a complete collection of transcription factor binding models for human and mouse via large-scale ChIP-Seq analysis. Nucleic Acids Res. 46, D252–D259. 10.1093/nar/gkx1106. [DOI] [PMC free article] [PubMed] [Google Scholar]
- 127.Vierstra J, Lazar J, Sandstrom R, Halow J, Lee K, Bates D, Diegel M, Dunn D, Neri F, Haugen E, et al. (2020). Global reference mapping of human transcription factor footprints. Nature 583, 729–736. 10.1038/s41586-020-2528-x. [DOI] [PMC free article] [PubMed] [Google Scholar]
- 128.Elias JE, and Gygi SP (2007). Target-decoy search strategy for increased confidence in large-scale protein identifications by mass spectrometry. Nat. Methods 4, 207–214. 10.1038/nmeth1019. [DOI] [PubMed] [Google Scholar]
- 129.Purcell S, Neale B, Todd-Brown K, Thomas L, Ferreira MAR, Bender D, Maller J, Sklar P, Bakker P.I.W. de, Daly MJ, et al. (2007). PLINK: A Tool Set for Whole-Genome Association and Population-Based Linkage Analyses. Am. J. Hum. Genet 81, 559–575. 10.1086/519795. [DOI] [PMC free article] [PubMed] [Google Scholar]
- 130.Tashman KC, Cui R, O’Connor LJ, Neale BM, and Finucane HK (2021). Significance testing for small annotations in stratified LD-Score regression. Preprint at medRxiv, 10.1101/2021.03.13.21249938 10.1101/2021.03.13.21249938. [DOI] [Google Scholar]
Associated Data
This section collects any data citations, data availability statements, or supplementary materials included in this article.
Supplementary Materials
Table S2. List of contacts within 4 Å in the ALX4-TWIST1 interface, related to Figure 6.
Table S4. Accession numbers of publicly available datasets, related to STAR Methods.
Table S6. X-ray crystallography data collection and refinement statistics, related to Figure 6.
Figure S1. Coordinator and OCT:SOX motif enrichment in open chromatin regions, related to Figure 1 A. Coordinator motif frequency in ranked ATAC peaks ordered left to right from strongest to weakest, split by whether they overlap a TSS and grouped into bins of 1000 peaks. B. Rankings of OCT:SOX and its constituent SOX/1 motif in enrichment in the top 10,000 distal accessible regions, for all DNase-seq and ATAC-seq datasets on ENCODE. Points are jittered to avoid overplotting. Zoom-in highlights the pluripotent stem cell samples among those with OCT:SOX motif enrichment. C. Rankings of the Ebox/CAGATGG and HD/2 motif clusters in enrichment in the top 10,000 distal accessible regions, for all DNase-seq and ATAC-seq datasets on ENCODE. Points are jittered to avoid overplotting. Purple circles indicate samples with Coordinator motif enrichment (Coordinator rank < 10 and Coordinator rank < E-box and HD ranks). Zoom-in highlights samples lacking Coordinator enrichment despite enrichment of both E-box and HD motifs. D. Top motif clusters enriched in distal ATAC-seq peaks of chick and mouse forelimbs60. Coordinator is highlighted in purple, the best E-box motif match to Coordinator (Ebox/CAGATGG) in blue, and the best homeodomain motif match to Coordinator (HD/2) in red.
Figure S2. Candidate Coordinator-binding factors and a cell line without Coordinator activity, related to Figure 2 A. All bHLH and SNAI TFs with known motifs aligned to the E-box portion of Coordinator (highlighted by bounding box). B. TWIST1 is the TF with the highest correlation between TF RNA levels and Coordinator enrichment. C. TWIST1 RNA level is correlated with Coordinator motif enrichment p-value (same samples as in Figure 1D,E). D. All HD TFs with known motifs aligned to the HD portion of Coordinator (highlighted by bounding box). E. Scatter plot of TWIST1 vs average of all candidate Coordinator-binding HD TF expression in all CCLE cell lines. Both axes show log2(TPM+1) values. RS4;11 cells are highlighted in red. F. Frequencies of double E-box and single E-box motifs in ranked TWIST1 ChIP-seq peaks, in bins of 1000 peaks (as in Figure 2B).
Figure S3. Validation of degron-tagging and ALX4 knockout, related to Figure 3 A. Western blot of TWIST1 depletion time course in TWIST1FV hCNCCs, with HSP90 as a loading control. IB: immunoblot. B. Western blot comparisons of tagged and untagged TF protein levels using endogenous antibodies, with HSP90 or Histone H3 as loading controls. C. Sanger sequencing genotyping of ALX1FV ALX4− lines. The guide RNA used to generate the edits shown above traces in teal.
Figure S4. Effects of TWIST1 depletion on accessibility, H3K27ac, and enhancer activity, related to Figure 4 A. MA plot of TWIST1 3 h depletion. Significant (adjusted p-value < 0.05) upregulated and downregulated peaks are colored in red and blue, respectively. B. Scatter plot of 3 h vs 24 h ATAC fold changes. Red line indicates y = x. C. Scatter plots of ATAC vs H3K27ac fold changes upon 3 h and 24 h of TWIST1 depletion. Red line indicates y = x. D. Mean signal plots of TF binding, ATAC, and H3K27ac across TWIST1 depletion (dTAGV-1) time points (0 h to 24 h), at enhancers with loss of accessibility upon TWIST1 depletion. E. Luciferase enhancer reporter activity with and without TWIST1 depletion. SOX9 EC1.45 indicates the “min1-min2” enhancer from ref23, Mut indicates a mutant version of the enhancer with substitutions at all high information content positions within the E-box portions of all four Coordinator motifs, SV40 is the SV40 enhancer, and Neg indicates a control plasmid lacking an enhancer insert. Points are biological replicates transfected independently (n=3).
Figure S5. Acute and long-term depletions of Coordinator-binding TFs, related to Figure 5 A. Scatter plot of TWIST1 acute 24 h vs long-term depletion effects on accessibility at distal open chromatin. Red line indicates y = x. B. Bar plot of number of significant changes (FDR < 0.05) in ATAC-seq upon long-term depletions. C. Scatter plot of ALX1 vs MSX1 long-term depletion effects on accessibility at distal open chromatin. Red line indicates y = x. D. Bar plot of number of significant changes (FDR < 0.05) in ATAC-seq upon acute depletions. E. Table of number of distal regions changing in accessibility upon MSX1 and/or TWIST1 long-term depletion. NS, not significant. F. Frequencies of HD motifs in regions responsive to ALX and/or TWIST1 long-term depletions. NS, not significant. G. Bar plots of the fraction of genes responsive to ALX1 depletion that are also responsive to TWIST1 depletion, for acute (in ALX4- background) and long-term (in ALX4+ background). NS, not significant. H. Volcano plot of MSX1 RNA-seq data. Significantly (FDR < 0.05) upregulated genes are highlighted in red/orange and downregulated genes are in blue. Selected genes are labeled and highlighted in darker colors.
Figure S6. DNA guiding of TWIST1-HD interactions and variation among bHLH and HD TFs, related to Figure 6 A. Western blots of HEK293 cells transfected with plasmids encoding V5-TWIST1 or loop-swap mutants (sequences in Figure 6F or Figure S6C) and various homeodomain TFs, with CTCF as a loading control. IB, immunoblot. Saturated pixels are colored magenta. Cropped images are from same ECL reaction and exposure. B. Most enriched known motif in the top 1000 ChIP-seq peaks for each of the six transfections shown in Figure 6F and Figure S6C. C. Extent of Coordinator motif binding preference of V5-tagged TWIST1 and various loop mutants derived from NEUROD1 expressed in HEK293 cells (see Figure S6A for protein levels) with (magenta) or without ALX4 (gray). D. Left, Pearson correlation between the strength of wild-type Coordinator motif or variants with modified spacer lengths and the human-chimp divergence in H3K27ac. Right, example of data used for correlation calculation, for the wild-type Coordinator motif. E. Electrophoretic mobility shift assay (EMSA) probe sequences (upper left), estimated Kd and Hill coefficients (n) for F-J. F-J. EMSA gels and Hill curve fits (for I,J) for WT vs homeodomain motif mutant sequence (F), WT vs E-box motif mutant sequence (G), WT with vs without ALX4 and WT vs homeodomain motif mutant sequence (H), WT vs partial E-box sequence (I), and WT vs spacer mutant (J).
Figure S7. Face, brain shape, and height heritability in Coordinator-binding TF loci and genomic targets, related to Figure 7 A. The 63 hierarchical facial segments used to define facial shape phenotypes associated with each SNP. B-D. LocusZoom plots (left) show SNPs in each locus (B, TWIST1; C, ALX1; D, ALX4) plotted by p-value of association with brain shape, colored by linkage disequilibrium (r2) to the lead SNP from each peak (purple diamond). Horizontal line indicates genome-wide significance threshold. Morphs (right) show the regions in the brain with highest significance of association with each lead SNP, with the top image of each pair showing an external view of the left hemisphere and the bottom image showing an internal view. E,F. Fold enrichment of SNPs associated with brain shape (E) or height (F) in distal ATAC peaks differentially accessible upon TF depletion or loss, with accessibility-matched control sets. Horizontal line indicates the enrichment in all hCNCC distal ATAC peaks, with flanking dashed lines indicating error bars. Error bars represent s.e.m.
Table S1. Immunoprecipitation-mass spectrometry data, related to Figure 6.
Table S3. Motif clusters enriched in Dlx1/2/5 ChIP-seq peaks from embryonic mouse forebrain, related to Figure 6.
Table S5. Primers used in this study, related to STAR Methods.
Data Availability Statement
All sequencing datasets have been deposited in NCBI GEO and are publicly available at accession GSE230319. Accession numbers of reanalyzed publicly available datasets are listed in Table S4. ENCODE datasets were downloaded from https://www.encodeproject.org/. CCLE data were downloaded from https://depmap.org/portal/download/all/, Release 22Q1 “CCLE_expression.csv” and “sample_info.csv”. Mass spectrometry peptide spectrum match counts are provided in Table S1. The TWIST1-TCF4-ALX4 crystal structure atomic coordinates and diffraction data have been deposited to Protein Data Bank under accession 8OSB.
All original code have been deposited to Zenodo and is publicly available as of the date of publication. DOI is listed in the key resources table.
Any additional information required to reanalyze the data reported in this paper is available from the lead contact upon request.
Key resources table
| REAGENT or RESOURCE | SOURCE | IDENTIFIER |
|---|---|---|
| Antibodies | ||
| Mouse monoclonal TWIST1 (WT, ChIP, CUT&RUN) | Abcam | Cat# ab50887; RRID:AB_883294 |
| Mouse monoclonal ALX4 (WB, CUT&RUN) | Novus Bio | Cat# NBP2-45490; RRID:AB_3073561 |
| Rabbit polyclonal ALX1 (WB) – discontinued | Novus Bio | Cat# NBP1-88189 |
| Rabbit polyclonal MSX1 (WB) – discontinued | Origene | Cat# TA590129 |
| Mouse monoclonal PRRX1 (WB) | Santa Cruz Biotechnology | Cat# sc-293386; RRID:AB_3073562 |
| Rabbit polyclonal CTCF (WB, CUT&RUN) | Cell Signaling | Cat# 2899; RRID:AB_2086794 |
| Rabbit monoclonal HSP90 (WB) | Cell Signaling | Cat# 4877; RRID: RRID:AB_2233307 |
| Rabbit monoclonal V5 tag (WB, IP) | Abcam | Cat# ab206566; RRID:AB_2819156 |
| Mouse monoclonal Flag tag (WB) | Sigma | Cat# F1804; RRID:AB_262044 |
| Donkey polyclonal anti-rabbit IgG (H+L) HRP (WB) | Jackson Immunoresearch | Cat# 711-035-152; RRID:AB_10015282 |
| Goat polyclonal anti-mouse IgG (H+L) HRP (WB) | Jackson Immunoresearch | Cat# 115-005-003; RRID:AB_2338447 |
| Rabbit polyclonal V5 tag (ChIP) | Abcam | Cat# ab15828; RRID:AB_443253 |
| Rabbit polyclonal H3K27ac (ChIP) | Active Motif | Cat# 39133; RRID:AB_2561016 |
| Rabbit monoclonal AP-2α (ChIP, CUT&RUN) | Cell Signaling | Cat# 3215; RRID:AB_2227429 |
| Mouse monoclonal AP-2α (ChIP) | Novus Bio | Cat# NB100-74359; RRID:AB_1048155 |
| Mouse monoclonal TCF3 (E2A) (CUT&RUN) | Santa Cruz Biotechnology | Cat# sc-133074; RRID:AB_2199147 |
| Rabbit polyclonal anti-mouse IgG (H+L) (CUT&RUN) | Abcam | Cat# ab46540; RRID:AB_2614925 |
| Chemicals, peptides, and recombinant proteins | ||
| mTeSR 1 | Stem Cell Technologies | Cat# 85850 |
| Matrigel Growth Factor Reduced (GFR) Basement Membrane Matrix | Corning | Cat# 356231 |
| ReLeSR | Stem Cell Technologies | Cat# 05872 |
| mTeSR Plus | Stem Cell Technologies | Cat# 100-0276 |
| RPMI-1640 | Gibco | Cat# 11875093 |
| Antibiotic-antimycotic | Sigma-Aldrich | Cat# A5955 |
| DMEM High glucose with L-glutamine, sodium pyruvate | Cytiva | Cat# SH30243.01 |
| GlutaMAX | Gibco | Cat# 35050061 |
| Non-essential amino acids | Gibco | Cat# 1114-0050 |
| Complete ES Cell Medium with 15% FBS | Millipore | Cat# ES-101-B |
| mLIF | Millipore | Cat# ESG1107 |
| SpeI-HF | NEB | Cat# R3133S |
| XbaI | NEB | Cat# R0145S |
| Gibson assembly master mix | NEB | Cat# E2611S |
| SalI-HF | NEB | Cat# R3138S |
| BclI | NEB | Cat# R0160S |
| Polyethylenimine | Sigma | Cat# 408719 |
| Opti-MEM | Gibco | Cat# 31985070 |
| Benzonase | Millipore | Cat# 71205-3 |
| OptiPrep Density Gradient medium | Sigma-Aldrich | Cat# D1556-250ML |
| Pluronic F-68 | Gibco | Cat# 240 4-0032 |
| Turbo DNase | Invitrogen | Cat# AM2238 |
| Collagenase IV | Gibco | Cat# 17104019 |
| KnockOut DMEM | Gibco | Cat# 10829018 |
| DMEM/F12 1:1 medium, with L-glutamine; without HEPES | Cytiva | Cat# SH30271.FS |
| Neurobasal Medium | Gibco | Cat# 21103049 |
| N2 NeuroPlex | Gemini Bio | Cat# 400-163 |
| Gem21 NeuroPlex | Gemini Bio | Cat# 400-160 |
| EGF | Peprotech | Cat# AF-100-15 |
| bFGF | Peprotech | Cat# 100-18B |
| Bovine insulin | Gemini Bio | Cat# 700-112P |
| Accutase | Sigma-Aldrich | Cat# A6964-100ML |
| Human fibronectin | Millipore | Cat# FC010-10MG |
| BSA | Gemini Bio | Cat# 700-104P |
| BMP2 | Peprotech | Cat# 120-02 |
| CHIR-99021 | Selleckchem | Cat# S2924 |
| dTAGV-1 | Tocris | Cat# 6914/5 |
| Y-27632 RHO/ROCK pathway inhibitor | Stem Cell Technologies | Cat# 72304 |
| Alt-R S.p. HiFi Cas9 nuclease V3 | Integrated DNA Technologies | Cat# 1081059 |
| QuickExtract DNA Extraction Solution | Lucigen | Cat# QE9050 |
| Lipofectamine 2000 | Invitrogen | Cat# 11668019 |
| FuGENE 6 | Promega | Cat# E2691 |
| cOmplete EDTA-free protease inhibitor cocktail | Roche | Cat# 11873580001 |
| NuPAGE LDS Sample Buffer | Invitrogen | Cat# NP0007 |
| 4–12% Novex Tris-glycine gels | Invitrogen | Cat# XV04125PK20 |
| 4–20% Novex Tris-glycine gels | Invitrogen | Cat# XV04205PK20 |
| Nitrocellulose membrane | GE Healthcare | Cat# 10600003 |
| Amersham enhanced chemiluminescence (ECL) Prime reagent | Cytiva | Cat# RPN2232 |
| DNase I | Worthington | Cat# LS006331 |
| Ampure XP beads | Beckman Coulter | Cat# A63881 |
| Methanol-free 16% formaldehyde solution | Pierce | Cat# 28908 |
| RNase A | Thermo | Cat# EN0531 |
| Proteinase K | Thermo | Cat# EO0491 |
| Dynabeads Protein A | Invitrogen | Cat# 10002D |
| Dynabeads Protein G | Invitrogen | Cat# 10004D |
| Concanavalin A beads | Epicypher | Cat# 21-1401 |
| pAG-MNase | Epicypher | Cat# 15-1016 |
| E. coli spike-in DNA | Epicypher | Cat# 18-1401 |
| TRIzol | Invitrogen | Cat# 15596018 |
| 4-thiouridine | Carbosynth | Cat# NT06186 |
| Iodoacetamide | G Biosciences | Cat# 786-078 |
| 0.05% Trypsin-EDTA | Gibco | Cat# 25300054 |
| phosSTOP | Roche | Cat# 4906845001 |
| Trypsin/LysC | Promega | Cat# V5071 |
| 0.02% ProteaseMax | Promega | Cat# V2071 |
| NEBuffer 2 | NEB | Cat# B7002S |
| LightShift Poly (dI-dC) | Thermo | Cat# 20148E |
| Critical commercial assays | ||
| OptiSeal tubes | Beckman Coulter | Cat# 362183 |
| Amicon Ultra-15 100K filter | Millipore | Cat# UFC910008 |
| LightCycler 480 Probes Master | Roche | Cat# 04707494001 |
| P3 Primary Cell 4D-Nucleofector X Kit L | Lonza | Cat# V4XP-3034 |
| Quick-DNA mini prep kit | Zymo | Cat# D3024 |
| Dual-Luciferase Reporter assay kit | Promega | Cat# E1960 |
| BCA Protein Assay | Thermo | Cat# 23225 |
| TD enzyme | Illumina | Cat# 20034197 |
| DNA Clean & Concentrator-5 | Zymo | Cat# D4013 |
| NEBNext Ultra II Q5 master mix | NEB | Cat# M0544 |
| Qubit dsDNA high sensitivity | Invitrogen | Cat# Q33231 |
| TPX 1.5 ml tubes | Diagenode | Cat# c30010010-50 |
| ChIP DNA Clean & Concentrator-5 | Zymo | Cat# D5205 |
| NEBNext Ultra II DNA | NEB | Cat# E7645S |
| RNA Clean & Concentrator-5 | Zymo | Cat# R1013 |
| Qubit RNA broad range assay | Invitrogen | Cat# Q10210 |
| QuantSeq 3’ mRNA-Seq Library Prep FWD | Lexogen | Cat# 113.96 |
| Direct-zol RNA miniprep | Zymo | Cat# R2052 |
| Dynabeads Antibody Coupling kit | Invitrogen | Cat# 14311D |
| JCSG crystallization kit | Molecular Dimensions | |
| Deposited data | ||
| ChIP-seq, ATAC-seq, CUT&RUN, RNA-seq | This paper | GEO: GSE230319 |
| Crystal structure of TWIST1, TCF4, ALX4, BRG1 bound to DNA | This paper | PDB: 8OSB |
| Experimental models: Cell lines | ||
| Human: Female H9 human embryonic stem cells (hESCs) | WiCell | WA09; RRID:CVCL_9773 |
| Human: Female RS4;11 cells | ATCC | CRL-1873; RRID:CVCL_0093 |
| Human: Female HEK293 cells | ATCC | CRL-1573; RRID:CVCL_0045 |
| Human: Female 293FT cells | Invitrogen | R70007; RRID:CVCL_6911 |
| Mouse: O9-1 cells | Millipore | SCC049; RRID:CVCL_GS42 |
| Experimental models: Organisms/strains | ||
| Mouse: CD-1 | Charles River Laboratories | RRID:MGI:5649524 |
| Oligonucleotides | ||
| Primers for cloning and genotyping, see Table S5 | ||
| HDR oligos and gRNAs for CRISPR/Cas9 editing, see Table S5 | ||
| Recombinant DNA | ||
| pAAV-GFP | Gray et al84 | Addgene 32395 |
| pCAG-NLS-HA-Bxb1 | Hermann et al87 | Addgene 51271 |
| PB-iNEUROD1_P2A_GFP_Puro | Dailamy et al86 | Addgene 168803 |
| pAAV-hSOX9-dTAG-mNeonGreen-V5 | Naqvi et al46 | Addgene 194971 |
| pDGM6 | Gregorevic et al85 | Addgene 110660 |
| pRL | Promega | N/A |
| pGL3-SV40_control | Promega | N/A |
| pUC19 | NEB | Cat# N3041S |
| pGL3-noSV40 | Long et al23 | N/A |
| pGL3-noSV40humanEC1.45_min1-2 | Long et al23 | Addgene 173952 |
| pcDNA3.1_MSX1-Flag | Genscript | OHu18516D |
| pcDNA3.1_PRRX1a-Flag | Genscript | OHu23742D |
| pcDNA3.1_PRRX1b-Flag | Genscript | OHu15551D |
| pcDNA3.1_PHOX2A-Flag | Genscript | OHu18020D |
| pAAV_FKBP-V5-TWIST1 | This paper | N/A |
| pAAV_FKBP-V5-ALX1 | This paper | N/A |
| pAAV_FKBP-V5-PRRX1 | This paper | N/A |
| pAAV_MSX1-FKBP-mNeonGreen-V5 | This paper | N/A |
| pGL3-noSV40-humanEC1.45_min1-2_4XEboxMutant | This paper | N/A |
| pCAG_TWIST1 | This paper | N/A |
| pCAG_ALX4-Flag-HA | This paper | N/A |
| pcDNA3.1_ALX4-Flag | This paper | N/A |
| pcDNA3.1_V5-TWIST1 | This paper | N/A |
| pcDNA3.1_V5-NEUROD1 | This paper | N/A |
| pcDNA3.1_V5-TWIST1_NEUROD1loop | This paper | N/A |
| pcDNA3.1_V5-TWIST1_NEUROG2loop | This paper | N/A |
| pcDNA3.1_V5-TWIST1_HAND2loop | This paper | N/A |
| pcDNA3.1_V5-TWIST1_TAL1loop | This paper | N/A |
| pcDNA3.1_V5-TWIST1_NEUROD1ins | This paper | N/A |
| pcDNA3.1_V5-TWIST1_NEUROG2ins | This paper | N/A |
| pcDNA3.1_V5-TWIST1_HAND2ins | This paper | N/A |
| pcDNA3.1_V5-TWIST1_TAL1ins | This paper | N/A |
| pcDNA3.1_V5-TWIST1_P139S | This paper | N/A |
| pcDNA3.1_V5-TWIST1_L138Y | This paper | N/A |
| pcDNA3.1_V5-TWIST1_L138F | This paper | N/A |
| pcDNA3.1_V5-TWIST1_NEUROD1L | This paper | N/A |
| pcDNA3.1_V5-TWIST1_NEUROD1R | This paper | N/A |
| pcDNA3.1_V5-TWIST1_NEUROD1M | This paper | N/A |
| Software and algorithms | ||
| Dozor-MeshBest | Melnikov et al88 | N/A |
| BEST | Bourenkov and Popov89 | https://www.embl-hamburg.de/BEST/ |
| XDS | Kabsch90 | https://xds.mr.mpg.de/ |
| skewer v0.2.2 | Jiang et al91 | https://github.com/relipmoc/skewer |
| bowtie2 v2.4.1 | Langmead and Salzberg92 | https://bowtie-bio.sourceforge.net/bowtie2/index.shtml |
| samtools v1.10 | Danecek et al93 | https://samtools.sourceforge.net/ |
| MACS2 v2.2.7.1 | Zhang et al94 | https://github.com/macs3-project/MACS |
| bedtools | Quinlan and Hall95 | https://github.com/arq5x/bedtools2 |
| DESeq2 | Love et al96 | https://bioconductor.org/packages/release/bioc/html/DESeq2.html |
| IGV v2.7.2 | Robinson et al97 | https://igv.org/ |
| deeptools | Ramirez et al98 | https://deeptools.readthedocs.io/en/develop/index.html |
| tximport | Soneson et al99 | https://bioconductor.org/packages/release/bioc/html/tximport.html |
| slamdunk v0.4.3 | Neumann et al100 | https://t-neumann.github.io/slamdunk/ |
| MEME Suite v5.1.1 TOMTOM | Gupta et al101 | https://meme-suite.org/meme/doc/download.html |
| MEME Suite v5.1.1 AME | McLeay and Bailey102 | https://meme-suite.org/meme/doc/download.html |
| MEME Suite v5.1.1 FIMO | Grant et al103 | https://meme-suite.org/meme/doc/download.html |
| PWMScan | Ambrosini et al104 | https://epd.expasy.org/pwmtools/pwmtools/ |
| MEME Suite v5.1.1 STREME | Bailey et al105 | https://meme-suite.org/meme/doc/download.html |
| MEME Suite v4.12.0 ceqlogo | Timothy Bailey lab | https://meme-suite.org/meme/doc/download.html |
| Preview | Protein Metrics | https://proteinmetrics.com/resources/preview-a-program-for-surveying-shotgun-proteomics-tandem-mass-spectrometry-data/ |
| Byonic | Protein Metrics | https://proteinmetrics.com/byonic/ |
| Phaser | McCoy et al106 | https://www.phaser.cimr.cam.ac.uk/index.php/Phaser_Crystallographic_Software |
| Phenix | Adams et al107 | https://phenix-online.org/ |
| CCP4 | Winn et al108 | https://www.ccp4.ac.uk/ |
| REFMAC5 | Murshudov et al109 | https://www.ccp4.ac.uk/ |
| Coot | Emsley et al110 | https://www2.mrc-lmb.cam.ac.uk/personal/pemsley/coot/ |
| PyMOL | 111 | https://www.pymol.org/2 |
| Fiji | Schindelin et al112 | https://fiji.sc/ |
| LD score regression v1.0.1 | Finucane et al113 | https://github.com/bulik/ldsc |
| Matching package for R v4.10-8 | Sekhon114 | https://cran.r-project.org/web/packages/Matching/index.html |
| UCSC Kent tools | Kent et al115 | https://genome.ucsc.edu/ |
| Original code | This paper | https://zenodo.org/doi/10.5281/zenodo.7847852 |
| Other | ||
| Beckman VTi 50 rotor | Beckman Coulter | N/A |
| Bioruptor Plus | Diagenode | N/A |
| Amersham ImageQuant 800 | Cytiva | N/A |
| Countess II | Invitrogen | N/A |
| NovaSeq X Plus | Illumina | N/A |
| NovaSeq 6000 | Illumina | N/A |
| HiSeq X Ten | Illumina | N/A |
| Acquity M-Class UPLC | Waters | N/A |
| Orbitrap Q Exactive HF-X | Thermo | RRID:SCR_018703 |
| Orbitrap Exploris 480 | Thermo | RRID:SCR_022215 |
| LightCycler 480 | Roche | N/A |
| Lonza 4D-Nucleofector | Lonza | N/A |