

Abstract
Azobenzene disperse dyes are the fastest-growing category of commercial dyestuffs and have been found in indoor house dust and in children’s polyester apparel. Azobenzene disperse dyes are implicated as potentially allergenic; however, little experimental data is available on allergenicity of these dyes. Here, we examine the binding of azobenzene disperse dyes to nucleophilic peptide residues as a proxy for their potential reactivity as electrophilic allergenic sensitizers. The Direct Peptide Reactivity Assay (DPRA) was utilized via both a spectrophotometric method and a high-performance liquid chromatography (HPLC) method. We tested dyes purified from commercial dyestuffs as well as several known transformation products. All dyes were found to react with nucleophilic peptides in a dose-dependent manner with pseudo-first order kinetics (rate constants as high as 0.04 hr−1). Rates of binding reactivity were also found to correlate to electrophilic properties of dyes as measured by Hammett constants and electrophilicity indices. Reactivities of polyester shirt extracts were also tested for DPRA activity and the shirt extracts with high measured abundances of azobenzene disperse dyes were observed to induce greater peptide reactivity. Results suggest that azobenzene disperse dyes may function as immune sensitizers, and that clothing containing these dyes may pose risks for skin sensitization.
Keywords: clothing, azobenzene disperse dyes, skin sensitization, peptide binding, electrophilicity, children’s exposures
1. Introduction
Azobenzene disperse dyes are currently the most abundant and fastest-growing class of commercial dyestuffs. They are used to color synthetic fabrics such as polyester, nylon, and acrylic1,2, and comprise roughly 70% of the nearly 10 million tons of industrial dye colorants used annually.3,4 While the chemical structures of azobenzene disperse dyes can vary widely, each dye is based on a p-aminoazobenzene core substructure. Extensive functionalization of this core structure with substituents including halogens (commonly bromine or chlorine), nitro groups, alkoxy, and others induces different color properties and electrophilicities.5–8 Due to their potential for electrophilic reactivity, some dyes are known to be mutagens and are also implicated as contact allergens; para-aminoazobenzene, the core structure of azo dyes, is among the most well characterized mutagens and skin sensitizers.9–15 Azobenzene disperse dyes can be removed from fibers by abrasion, leaching into water, or by transfer onto skin when worn16; recently, our group and others detected azobenzene disperse dyes in children’s clothing and indoor house dust.7, 17–20 The electrophilic properties of azobenzene disperse dyes, coupled with their ubiquitous occurrence in clothing and indoor environments, highlight the need to study the potential for these compounds to act as immune sensitizers.
Sensitizers are defined as chemicals that cause “a substantial proportion of exposed people or animals to develop an allergic reaction after repeated exposure to the chemical” (Basketter et al., 2008; Kimber and Dearman, 2005).21–22 Sensitization most commonly manifests as allergic contact dermatitis (ACD), an adverse health effect that frequently develops in workers and consumers exposed to skin-sensitizing substances and products; the Organization for Cooperation and Development (OECD) states that contact dermatitis accounts for 10% to 15% of all occupational diseases.23 To act as a sensitizer, chemicals must be sufficiently lipophilic and of a small enough size (<500 Da) to pass through cell membranes, and must covalently bind to a protein and be recognized by antigens or antibodies to stimulate an immune response (i.e. hapten).21, 24 In fact, Landsteiner and Jacobs (1936) showed correspondence between a chemical’s ability to react with aniline – a model nucleophile – and the ability to sensitize, indicating that electrophilicity is a necessary condition for sensitization.25–26 Electrophilic organic compounds, such as substituted benzenes and aryl or heterocyclic diazo compounds, most often bind covalently with nucleophilic protein residues and act as haptenic compounds.27–30 Covalent binding to proteins is key in nearly all hypersensitivity reactions and is a strong indicator for determining allergenic sensitization potential.21, 31
While azo dyes are well implicated in observational studies and clinical reports as allergens, particularly with respect to skin allergies32–40, very few experimental data exist characterizing the allergenicity of individual azo dyes. Scarcity of data is due in part to the lack of available purified dye chemical standards, and perhaps also to sparse testing requirements for dyes used in clothing. Furthermore, allergenicity is difficult to test in the laboratory: in addition to the challenge of accounting for both biological and environmental factors, allergenicity is a complex multi-step pathway. To better understand these mechanisms, an adverse outcome pathway (AOP) for skin sensitization has been established and validated by the EU Reference Laboratory for Alternatives to Animal Testing (EURL-ECVAM)41–42; this AOP specifies that the formation of a hapten-protein complex is the molecular initiating event in skin sensitization. Similar pathways have also been proposed for other types of immune sensitization such as respiratory sensitization.31, 43–44 Generally, while hapten-protein complex formation is only the first step in a complicated immune mechanism, complex formation is likely indicative of a compound’s potential behavior as an immune sensitizer.
The in vitro direct peptide reactivity assay (DPRA) tests the ability of a chemical to bind covalently to a protein and, thus, behave as a hapten.45–51 Here, we explore the hypothesis that azobenzene disperse dyes may function as haptens and bind covalently to proteins, initiating a potential sensitization AOP. The primary objective of this research was to evaluate the binding reactivity of twelve azobenzene disperse dyes previously identified in house dust and in polyester apparel extracts, as well as several of their reductive transformation products, to two distinct peptide residues (cysteine-based peptides and lysine-based peptides), using both a spectrophotometric DPRA and a modified HPLC-based DPRA (detailed in Appendix A in Supplementary Materials). We also examined the kinetics of the dye-peptide reaction to determine both observed rate constants and half-lives for each azobenzene disperse dye – peptide reaction pair, and to examine relationships among dye reactivity, chemical structure, and electrophilicity.
2. Experimental Procedures
2.1. Peptides and test chemicals
We used two model peptides, both acetylated on the N-terminus: a cysteine-containing peptide (Ac-RFAACAA-COOH) and an analogous lysine-containing peptide (Ac-RFAAKAA-COOH), to represent proteins with different types of nucleophilic moieties; these model peptides have been used in previously-published DPRA protocols.45, 52–53 All peptides were purchased from JPT Peptides (>95% purity; Berlin, Germany). These peptides were kept frozen (−20°C) until immediately prior to experimental testing.
Twelve purified azobenzene disperse dyes were tested in this study: Disperse Blue 183:1, Disperse Blue 373, Disperse Blue 79:1, Disperse Orange 25, Disperse Orange 37, Disperse Orange 44, Disperse Orange 61, Disperse Orange 73, Disperse Red 354, Disperse Red 50, Disperse Red 73, and Disperse Violet 93. These dyes have been shown to be present in polyester apparel and are commonly detected in indoor house dust.7 Seven of the 12 dyes (DB183:1, DB9:1, DO44, DO73, DR354, DR50, and DR73) were purified from raw dyestuffs; a detailed explanation of the dye purification and characterization process has been published previously.7 Analytical standards of Disperse Orange 25 and Disperse Orange 37 were purchased [Sigma-Aldrich; 95% purity]. Analytical standards of Disperse Orange 61, Disperse Violet 93, and Disperse Blue 373 were provided via a gift from Professor Gisela Umbuzeiro, School of Technology, UNICAMP, Limeira, Brazil. Three reductive cleavage products of azobenzene disperse dyes were also tested: 2-bromo-4,6-dinitroaniline (BDNA), 2,6-dibromo-4-nitroaniline (DBNA), and 2-chloro-4-nitroaniline (CNA) [Sigma-Aldrich; 95% purity].
Positive and negative controls were also included for DPRA assays in this study, and were selected based on previous reports for each peptide in each assay. Positive controls included 2,4-dinitrochlorobenzene for the cysteine peptide in both the spectrophotometric and HPLC assays; p-phenylenediamine in the lysine spectrophotometric assay; cinnamaldehyde for both cysteine and lysine peptides in the HPLC assay; and p-benzoquinone in the lysine HPLC assay. Chlorobenzene was used as the negative control in all assays. All positive and negative control chemicals were purchased from Sigma-Aldrich [>95% purity].
2.2. Spectrophotometric DPRA
We adapted the spectrophotometric DPRA protocol published by Cho et al. (2014).52 In accordance with this protocol, immediately prior to each experiment, cysteine peptides were diluted to 0.4mM with 100mM sodium phosphate buffer (pH 8.0, 1mM EDTA); lysine peptides were diluted to 0.2mM with 100mM sodium phosphate buffer (pH 10.0, 1mM EDTA). Chemical reaction stock solutions of each dye were first prepared at 100mM in ethyl acetate, then diluted to 2mM with 100mM sodium phosphate buffer (pH 8.0, 1mM EDTA) for cysteine reactions, and to 2mM with isopropanol for lysine reactions; dosing solutions of each dye were then prepared at concentrations of 1mM, 0.5mM, 0.1mM, 0.05mM, and 0.01mM, again in buffer for cysteine reactions and in isopropanol for lysine reactions. (BDNA, DBNA, and CNA were not tested in the spectrophotometric assay.)
For each cysteine reaction, in a 96-well plate (light-proof, black, clear bottom; Corning), 90μL of cysteine reaction solution and 90μL of chemical reaction solution were reacted for 24hr at room temperature. For each lysine reaction, in an identical 96-well plate, 100μL of peptide reaction solution and 100μL of chemical reaction solution were reacted for 24hr at room temperature. For each plate, three replicate wells at each concentration of each dye were tested. Chemical-only controls were prepared for each concentration of each dye by incubating either 90μL or 100μL of chemical reaction solution (for cysteine and lysine, respectively) with the phosphate buffer. Peptide-only controls were prepared by incubating 90μL of peptide solution with 90μL of buffer for cysteine reactions, and by incubating 100μL of peptide solution with 100μL of isopropanol for lysine reactions. Solvent-only control wells consisted solely of 180μL buffer for cysteine plates, and consisted of 100μL buffer and 100uL isopropanol for lysine plates.
After 24hrs, the optical density of the cysteine reaction plates was measured and recorded using a UV-Vis microplate spectrophotometer (SpectraMax M5, Molecular Devices) at an absorbance wavelength = 412nm. 20μL of a 10mM 5,5’-dithiobis-2-nitrobenzoic acid (DTNB) solution solubilized in 100mM sodium phosphate buffer (pH 8.0, 1mM EDTA) was then added to each plate well; the plate was incubated for three minutes to achieve complete reaction between unreacted peptide and DTNB. The plate’s optical density was then measured again under identical UV-Vis conditions.
The fluorescence intensity of the plate was measured after 24 hours and recorded using a fluorometer (SpectraMax; excitation 390nm; emission 465nm, 475nm) for all lysine reactions. 20μL of a 20mM fluorescamine solution (prepared in DMSO) was then added to each plate well; the plate was incubated for three minutes to achieve complete reaction between unreacted peptide and fluorescamine. The plate’s fluorescence intensity was then measured again under identical conditions.
2.3. HPLC-based DPRA
The HPLC-based DPRA has previously been published and validated to test cysteine reactivity at a reaction concentration of 0.5mM, to test lysine reactivity at a concentration of 25mM, and to test chemicals at concentrations of 5mM (a 1:10 ratio for cysteine, and a 1:50 ratio for lysine).45, 53 However, in order to produce dose-response and kinetic data for the assays and to reduce consumption of both test chemicals and peptides, we designed our HPLC-based DPRA assay conditions to mimic the concentrations used in the spectrophotometric assay of 0.2mM (cysteine) and 0.1mM (lysine). Optimization of these parameters is detailed in Appendix B in Supplementary Materials.
Immediately prior to each experiment, cysteine peptides were diluted to 0.4mM with 100mM sodium phosphate buffer (pH 8.0, 1mM EDTA); lysine peptides were diluted to 0.2mM with 100mM sodium phosphate buffer (pH 10.0, 1mM EDTA). Stock solutions of each dye and each aniline transformation product were prepared at 1mM in methanol for cysteine reactions, and at 1mM in isopropanol for lysine reactions; dosing dilutions of each compound were then prepared at concentrations of 0.5mM, 0.1mM, 0.05mM, and 0.01mM, again in methanol for cysteine reactions and in isopropanol for lysine reactions.
For each cysteine reaction, in a muffled amber glass LC-MS vial, 200μL of peptide solution (0.4mM cysteine; 0.2mM lysine) and 200μL of test chemical solution (in methanol for cysteine assay; in isopropanol for lysine assay) were combined. Three replicates were prepared per test chemical solution. Chemical-only controls were prepared for each concentration of each dye by incubating 200μL of test chemical solution with 200μL of buffer. Peptide-only controls were prepared by incubating 200μL of peptide solution with 200μL of methanol (for cysteine) or isopropanol (for lysine). Solvent-only controls were prepared by incubating 200μL of peptide buffer (pH 8.0 for cysteine; pH 10.0 for lysine) with 200μL of solvent (methanol for cysteine; isopropanol for lysine). A calibration curve for each peptide was also created.
All vials were vortexed gently, capped, and placed in the dark in a temperature-controlled HPLC autosampler (30°C; Dionex UltiMate 3000) for 24hr. Following incubation, the unreacted peptide in each vial was quantified by reversed-phase HPLC with UV detection. The chromatographic system comprised a Thermo Dionex UltiMate 3000 pump fitted with an AccuCore aQ C18 column [2.6μm particle size; 2.1mm x 30mm] (Thermo). Using the autosampler, 5μl were injected onto the column (30°C); separation was achieved using a 1.0ml/min flow rate with a gradient of mobile phase A (0.1% TFA in water) and mobile phase B (0.1% TFA in acetonitrile) over a 3.5 minute period with a 1.5 minute equilibration beforehand. The gradient was held at 95% A/5% B for the equilibration; the gradient was then shifted to 10% A/90% B over the next 3 minutes and held for 0.5 minutes. Depletion of peptides was monitored by a diode array detector (Dionex UltiMate 3000) and verified against an external linear calibration curve. Specifically, UV-Vis absorbance was monitored at 220nm; changes in the parent compound peaks and formation of hapten-protein complexes were also monitored at 450nm, 565nm, and 625nm (average absorbance wavelengths for orange, red, and blue/violet, respectively). No additional adduct peaks were observed at any of these wavelengths over the course of any dye-peptide reactions.
2.4. HPLC-based kinetic DPRA
To evaluate the kinetics of azobenzene disperse dye and transformation product reaction with peptides, the reaction of 0.5mM of each compound to 0.2mM cysteine and 0.1mM lysine was monitored at five specific time intervals over 24 hours. Samples were analyzed utilizing the HPLC method as described above; three replicates were prepared per test chemical solution. Samples were analyzed at 0hr, 2hr, 8hr, 16hr, and 24hr.
2.5. Calculation of spectrophotometric peptide depletion ratio
For each spectrophotometric experiment, following treatment and incubations, chemical reactivity with the probe peptide was measured as the peptide depletion ratio: an expression of the proportion of free peptide that reacted with a chemical after incubation. Because dyes are chromophores and therefore may interfere spectrophotometrically upon reaction with the peptide and/or the detection reagent, background signals due to dye and reagent interference were considered.51 We included a peptide-only control, a chemical-only control, and a solvent-only control in our microplate assay; we measured the spectrophotometric values before and after addition of detection reagents. To account for background signals and possible interferences in our calculations of peptide depletion, we utilized the percent peptide depletion calculations as outlined by Cho et al. (2014).52
Peptide depletion ratios were calculated as means ± standard error of the mean, and were obtained from three independent experiments on different days, which were carried out in triplicate. Following OECD guidelines, chemicals were classified as haptens when inducing greater than 10% depletion of cysteine peptides or greater than 30% depletion of lysine peptides.23, 46
2.6. Calculation of HPLC peptide depletion ratio and reaction kinetics
For each experiment (both dose-response and kinetic), following incubations and HPLC analysis, the peptide peak area for each sample was measured (at each timepoint). Chemical-only controls and solvent-only controls were analyzed to assess for chemical background. Linearity of peptide response was measured via the calibration curve; peptide-only controls were analyzed over 24hrs to ensure no loss of signal for unreacted peptide due to degradation or loss to adsorption. Per experiment, original peptide concentration (the peptide in the reaction vial at time zero) was determined as the average peptide peak areas of the three peptide-only control replicates. Peptide depletion was calculated as the difference between peptide peak area of the reaction vial and average peptide-only peak area, expressed as a percent loss:52
Pt=0 = peptide peak area at time zero (Peptide Only Control)
Pt=n = peptide peak area @ time n (eg. 24hrs) (Peptide-Chemical Reactions)
Percent depletion ratios were obtained from three replicate experiments on different days and are expressed as means ± standard error of the mean.
For each kinetic experiment, the percent peptide depletion was calculated for each replicate at each timepoint; all percent peptide depletion values were then converted to peptide concentrations (mM) using the following equation:52
Per compound, all data was plotted in GraphPad Prism software as concentration vs. time (hrs.) according to first-order decay and according to second order decay ; linear regressions for each kinetic model were calculated using GraphPad Prism (Version 9.4.1 for Windows, GraphPad Software, San Diego, CA).
2.7. Statistical Analyses
All statistical analyses were performed using GraphPad Prism statistical software. We used statistical analyses to evaluate the relationships between structural properties of dyes – specifically the Hammett constant and the electrophilicity index of each dye – and rate constants for each dye in the DPRA (both cysteine and lysine assays). We also utilized statistical analyses to examine the relationship between known dye loadings in samples of polyester textiles and percent peptide depletion for each dye in the DPRA. For each of these evaluations, a Shapiro-Wilkes test first indicated that data were not normally distributed; therefore, we used non-parametric statistics to examine associations. Spearman correlations were thus used to assess correlations; p<0.05 was considered to be statistically significant.
3. Results
3.1. Assay validation
Data for all positive and negative controls used in the DPRA assay are shown in Figure SM-1, A–H in Supplementary Materials. We compared our positive and negative control results to those published by Cho et al. (2014)52 for the spectrophotometric assays, and to those published by Gerberick et al. (2007)45 for the HPLC assays. Detailed assay validation procedures are reported in Appendix B in Supplementary Materials. Validation procedures produced results in agreement with these previously-published studies within the desired working range of our assay (Figures SM-1 and SM-2). HPLC calibration curves revealed that both cysteine and lysine peptides responded in a linear manner over the desired working range (see Figure SM-3).
3.2. Azobenzene disperse dyes induced peptide depletion in a dose-dependent manner
Reactivities of cysteine and lysine when incubated with representative azobenzene disperse dyes evaluated in this study (DB79:1, DO25, DR354, DV93) are shown in the peptide depletion plots in Figure 1 and Figure 2. Dose-response curves for the other eight tested dyes (Figure SM-4, A–H and Figure SM-5, A–H) and percent peptide depletion for all dyes in the HPLC and spectrophotometric assays (Tables SM-1 and SM2) can be found in Supplementary Materials. Because OECD guidelines classify a chemical as a hapten when inducing greater than 10% depletion of cysteine peptides or greater than 30% depletion of lysine peptides,23, 46 EC10 values for dyes in the cysteine HPLC assay and EC30 values for dyes in the lysine HPLC assay were also calculated (Table SM-3). Cysteine-dye reactivity was dose-dependent as measured by the HPLC assay, but little to no dose response was observed in the spectrophotometric assay. Conversely, lysine-dye reactivity appeared greater (on a percent-depletion basis) as measured by the spectrophotometric assay than when measured by the HPLC assay; only one dye, DV93, demonstrated sufficient binding in the lysine HPLC assay to calculate an EC30 value (0.31mM). Experiments also showed much greater precision among replicates in the HPLC assays than in the spectrophotometric assays.
Figure 1:

Dose-response data for four representative azobenzene dyes measured in the cysteine assay: DB 79:1 (Panel A), DO 25 (Panel B), DR 354 (Panel C), and DV 93 (Panel D). (Cysteine dose-response plots for the other azobenzene dyes in this study can be found in Supplementary Materials, Figure SM-4, A–H.) Varying concentrations of each dye were incubated with 0.2mM cysteine. Measurements were made following a 24hr. incubation period. Open circles represent spectrophotometric assay results; closed circles represent HPLC assay results. A nonlinear regression (sigmoidal fit) is plotted for the HPLC data for each compound. All points represent the average of three experimental trials (n=3); error bars represent standard error of the mean.
Figure 2:

Dose-response data for four representative azobenzene dyes measured in the lysine assay: DB 79:1 (Panel A), DO 25 (Panel B), DR 354 (Panel C), and DV 93 (Panel D). (Lysine dose-response plots for the other azobenzene dyes in this study can be found in Supplementary Materials, Figure SM-5, A–H.) Varying concentrations of each dye were incubated with 0.1mM lysine. Measurements were made following a 24hr. incubation period. Open circles represent spectrophotometric assay results; closed circles represent HPLC assay results. A nonlinear regression (sigmoidal fit) is plotted for the HPLC data for each compound. All points represent the average of three experimental trials (n=3); error bars represent standard error of the mean.
Upon careful examination of data from the spectrophotometric assay (Figure 1; Figure 2; Figure SM-4, A–H; Figure SM-5, A–H), our results indicate that absorbance from azobenzene disperse dyes interfered with the response in spectrophotometric assays. The spectrophotometric cysteine assay produced consistently lower peptide depletion values than did the cysteine HPLC assay; our results indicate that azobenzene disperse dyes interfered with the DTNB absorbance response in the spectrophotometric cysteine assay. By contrast, the spectrofluorometric lysine assay produced consistently higher peptide depletion values than did the lysine HPLC assay. Protic solvents such as isopropanol are known to react with fluorescamine to form addition products, drastically reducing the ability of fluorescamine to bind to free (unreacted) peptide54–56; it is thus possible that the isopropanol in the reaction wells caused an artificially low fluorescence reading, leading to an overprediction of lysine binding activity. More detail supporting these conclusions can be found in Appendix C in Supplementary Materials. Because of these artifacts, we determined that the spectrophotometric assay was not suitable to measure the binding of dyes (or other highly chromophoric compounds) to cysteine or lysine peptides; As a result, only data from the HPLC assays is further analyzed in this study.
In the HPLC assay, DB79:1 induced the greatest average cysteine depletion at the highest tested concentration (80% at 0.5mM), and also showed a potent EC10 value (0.005mM). DR354 and DO73 each induced 75% cysteine depletion at 0.5mM, yet produced more potent EC10 values than did DB79:1 (0.003mM). Other potent cysteine-binding dyes included DR73, which produced an EC10 of 0.004mM, and DV93, which produced an EC10 of 0.007mM. Overall, EC30 values revealed that DB79:1, DO73, DR354, DR73, and DV93 reacted readily with cysteine nucleophilic residues, even at low concentrations.
3.3. Azobenzene disperse dyes follow pseudo-first order rate kinetics in reactions with peptide residues
Linear models were used with the data collected from the kinetic experiments to examine the reactions for observed first-order and second-order kinetic behavior. Without exception, all reactions of azobenzene disperse dyes and transformation products fit best to pseudo-first-order kinetics: the rate of dye or transformation product reaction was observed to be proportional to their concentration, and a plot of versus time (hours) revealed an approximately linear relationship, while second-order kinetic models resulted in uniformly poor fits to the observed data. Coefficients of linearity ranged from 0.63 to 0.97 (Table 1). Based on these linear models, a pseudo-first order rate constant (: the slope of the first-order linear regression model) and associated half-life was calculated for each compound in each peptide assay (Table 1). Rate constants and half-lives should be approximately independent of concentration; therefore, we use these kinetic parameters as measures of hapten potency.
Table 1.
First-order rate constants, half-lives, and linearity coefficients for azobenzene disperse dyes (above the dashed line) and transformation products (below the dashed line).
| Compound | Cysteine First Order Rate Constant (hr−1) | Lysine First Order Rate Constant (hr−1) | Cysteine Half Life (T1/2 (hr.)) | Lysine Half Life (T1/2 (hr.)) | Cysteine Coefficient of Linearity (R2) | Lysine Coefficient of Linearity (R2) |
|---|---|---|---|---|---|---|
| DB 183:1 | 0.032 | 0.012 | 21.6 | 58.1 | 0.92 | 0.92 |
| DB 373 | 0.018 | 0.006 | 39.2 | 110 | 0.92 | 0.84 |
| DB 79:1 | 0.040 | 0.007 | 17.2 | 97.5 | 0.90 | 0.92 |
| DO 25 | 0.006 | 0.008 | 125 | 90.3 | 0.93 | 0.94 |
| DO 37 | 0.012 | 0.009 | 56.4 | 79.9 | 0.90 | 0.93 |
| DO 44 | 0.015 | 0.011 | 46.2 | 63.7 | 0.91 | 0.93 |
| DO 61 | 0.012 | 0.007 | 59.8 | 103 | 0.85 | 0.89 |
| DO 73 | 0.019 | 0.006 | 36.2 | 123 | 0.88 | 0.82 |
| DR 354 | 0.010 | 0.007 | 68.0 | 104 | 0.84 | 0.96 |
| DR 50 | 0.009 | 0.010 | 80.6 | 72.8 | 0.81 | 0.95 |
| DR 73 | 0.018 | 0.008 | 37.5 | 87.3 | 0.94 | 0.88 |
| DV 93 | 0.012 | 0.015 | 58.1 | 44.8 | 0.96 | 0.95 |
| BDNA | 0.005 | 0.003 | 136 | 239 | 0.81 | 0.76 |
| DBNA | 0.007 | 0.011 | 105 | 61.9 | 0.91 | 0.97 |
| CNA | 0.003 | 0.001 | 248 | 578 | 0.70 | 0.63 |
According to calculated values, DO25, DO44, DR50, and DV93 reacted at approximately the same rate with cysteine as with lysine, whereas DO37, DO61, DR354, DR73, and BDNA reacted at approximately twice the rate with cysteine as they do with lysine. The dyes DB183:1, DB373, DO73, DB79:1 and CNA reacted with cysteine at approximately 3-5 times the lysine reaction rate. Figure 3 shows four examples (DB79:1, DO25, DR354, DV93) of these differences between cysteine and lysine reaction rates; the increases in compound reactivity from one compound to another in each peptide assay showed key differences. For example, while the reaction rate of DV93 hardly changed between the cysteine and the lysine assays, DV93 was observed to be the most reactive of these four dyes in the lysine assay ( is two-fold higher). In the lysine assay, for DV93 was two-fold higher than for DB79:1 (which showed near-identical to those for DO25 and DR354). However, DB79:1 was approximately three-fold higher than for DV93 in the cysteine assay, while of DR354 indicated reactivity double that of DO25. First-order kinetic plots and their linear regression models for each dye in each assay can be found in Supplementary Materials (Figure SM-6, A–B).
Figure 3.
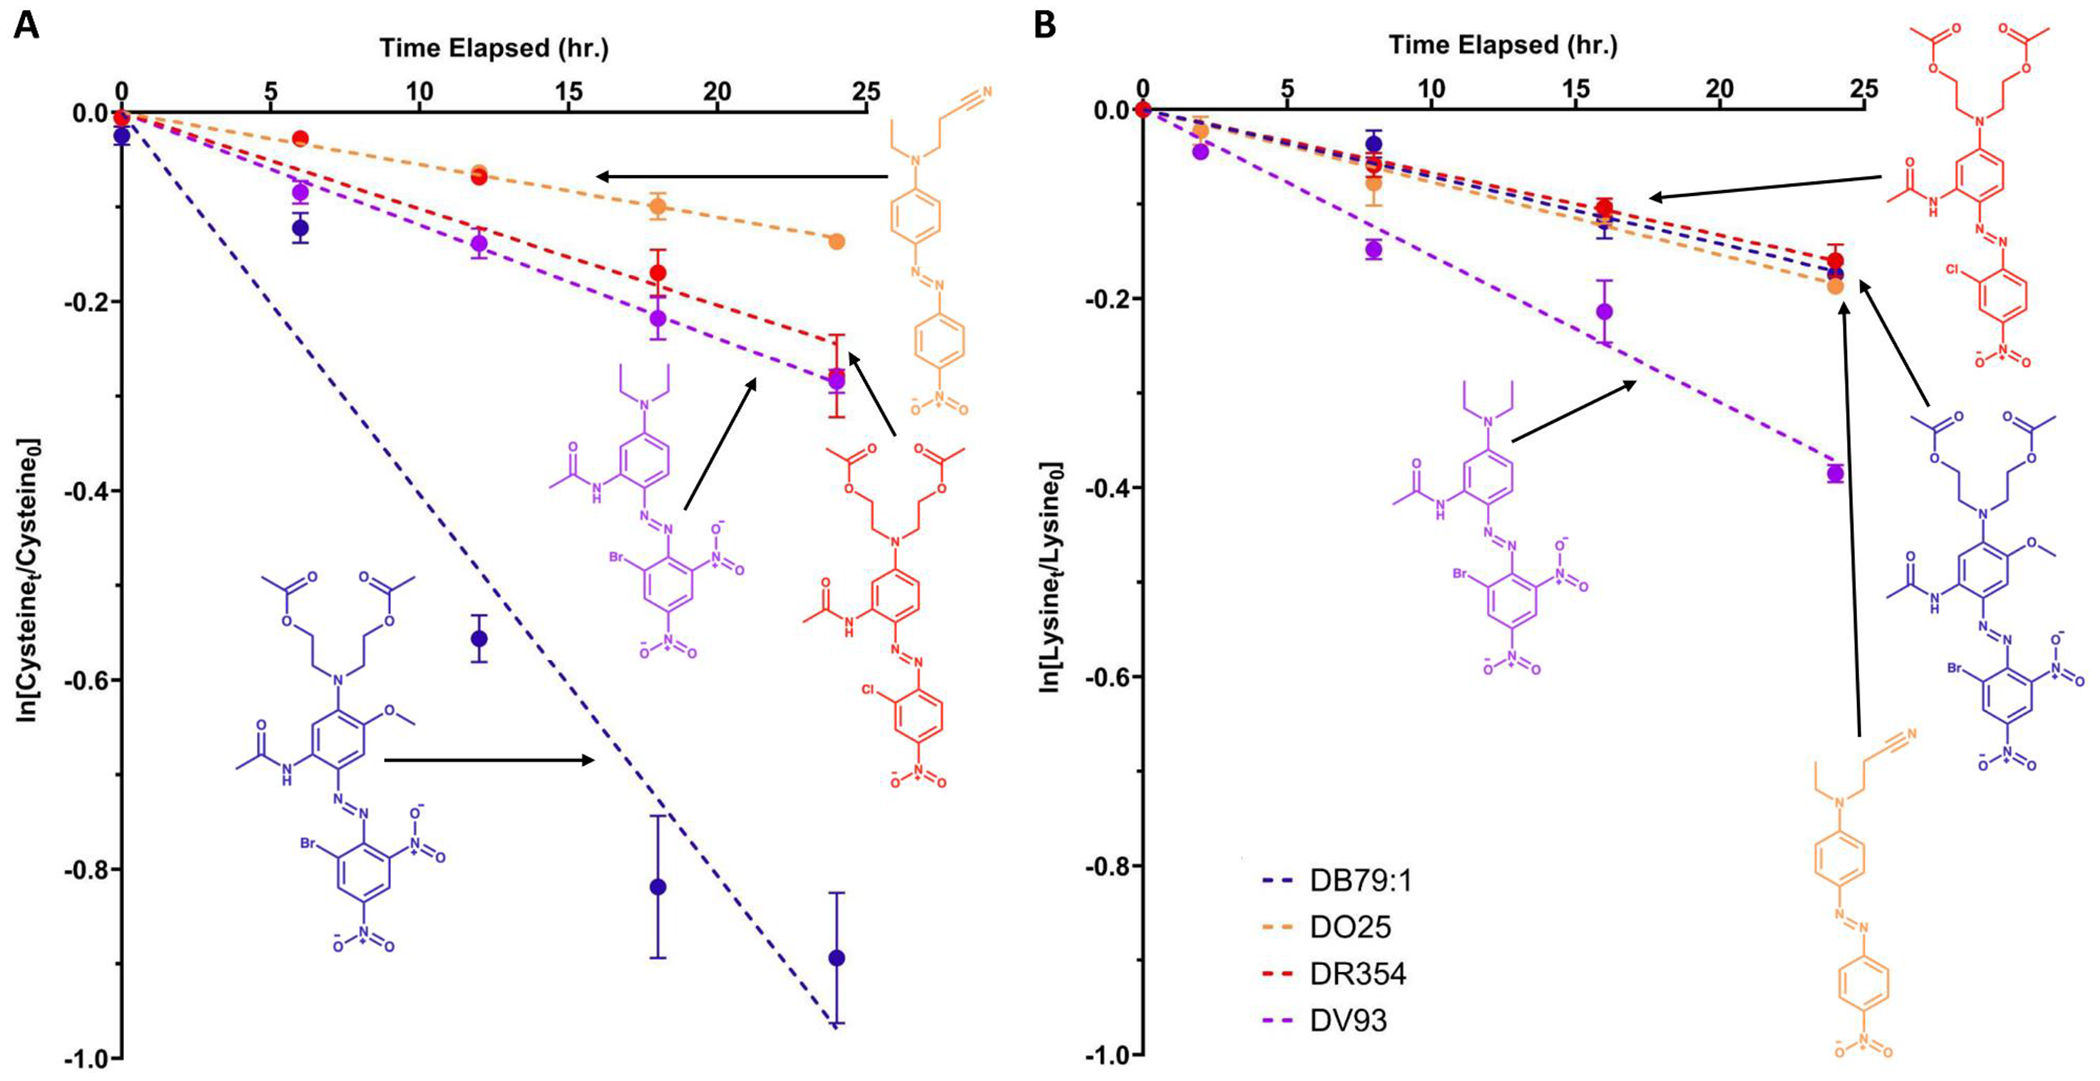
Examples of first-order rate kinetics of dye binding to nucleophilic peptides cysteine (Panel A, left) and lysine (Panel B, right). In each plot, reaction rates for four dyes are shown: DB79:1, DO25, DR354, and DV93 (0.5mM solutions for each). All data represent the average of three experimental replicates; error bars represent standard error of the mean.
We also utilized the rate constants from the cysteine assay (Table 1) to further sub-categorize dyes and anilines into GHS categories 1A and 1B. According to GHS guidelines, a substance is classified as Category 1 if: “(a) there is evidence in humans that the substance can lead to sensitization by skin contact in a substantial number of persons or (b) there are positive results from an appropriate animal test. Chemicals in sub-category 1A show a high frequency of occurrence in humans and/or a high potency in animals and can be presumed to potentially produce significant sensitization in humans. Sub-category 1B chemicals show a low to moderate frequency of occurrence in humans and/or a low to moderate potency in animals and can be presumed to potentially produce significant sensitization in humans” (29CFR 1910.1200).47, 49–50 The kinetic DPRA subcategorizes compounds specifically by using the maximum observed logarithmic rate constant observed in the cysteine assay at any time point over the tested range (log kmax) (values from the lysine assay are not used in the kDPRA, nor in the GHS sub-categorizations). If the log kmax ≥ −2.0, the compound is categorized as GHS subcategory 1A; if the log kmax < −2.0, the compound is categorized as GHS subcategory 1B or not classified.49 By these metrics, using the cysteine rate constants in Table 1, DR354, DO37, DO61, DV93, DO44, DB373, DR73, DO73, DB183:1, and DB79:1 may be classified as sub-category 1A compounds; DR50, DO25, BDNA, DBNA, and CAN may be classified as sub-category 1B compounds. Given that the Category 1 definition is contingent upon reactions occurring in “a substantial number of persons,” further studies are needed to validate and reproduce these sub-category classifications.
We initially hypothesized that because the transformation products BDNA, DBNA, and CNA are smaller and less bulky than the parent azobenzene dyes (with fewer spatial obstructions to binding), yet contain the same reactive moieties as parent dyes such as halogens, nitro groups, and amino groups that will likely bind to nucleophilic peptides, they would be highly reactive in the peptide reactivity assays and would react more rapidly than their respective parent dyes. Figure 4 illustrates the kinetics of BDNA reaction compared to the corresponding parent dyes DB373, DB79:1, and DV93 in both the cysteine and the lysine assays; analogous results for DBNA, can, and their corresponding parent dyes evaluated in this study can be found in Supplementary Materials (Figure SM-7, A–B). With one exception (DBNA and DO61 in the lysine assay), results disproved our hypothesis and instead demonstrated that of the azobenzene disperse dyes and transformation products evaluated in this study, the dyes were more reactive with peptides than the putative transformation products. For example, in both the cysteine and lysine assays, the three dyes that can reductively cleave to form BDNA (DB373, DB79:1, DV93) all had at least two-fold higher than that of BDNA. In the cysteine assay, DB373 was three times as reactive as BDNA; in the lysine assay, DV93 was approximately four times as reactive as BDNA. BDNA’s bromine atom and two nitro groups make it highly electron-dense; while these functional groups should make BDNA highly reactive with nucleophilic protein residues, it was found to be much less electrophilic than its parent dyes within this assay.
Figure 4.

First-order rate kinetics of peptide binding for the dye transformation product BDNA and the corresponding parent azobenzene disperse dyes evaluated in this study, in the cysteine assay (Panel A, left) and in the lysine assay (Panel B, right). All plotted points are the average of three experimental replicates; error bars represent standard error of the mean. Analogous plots for rate kinetics of transformation products DBNA and CNA compared to their respective parent azobenzene disperse dyes evaluated in this study can be found in Supplementary Materials (Figure SM-7, A–B).
3.4. Extracts of azobenzene disperse dye-containing textiles induced peptide depletion in a concentration-dependent manner
We utilized the HPLC-based DPRA assay to further understand the human exposure-relevance of azobenzene disperse dyes in products by examining the peptide reactivity induced by extracts of polyester shirts we had previously examined for disperse dye presences and quantities (Figure 5).7 Recent literature has established the ability to use the DPRA to test mixtures of unknown composition under identical assay conditions as those used to test individual compounds57; in the current study, we tested solvent extracts of 100mg samples of nine of these same shirts (three replicate incubations each) using the cysteine and lysine HPLC-based DPRA assays. Details of the shirt selections, extractions, and dye levels have been previously published.7 The nine extracts included: seven extracts that contained azobenzene disperse dyes for which we had analytical standards (Black Shirt A, Black Shirt C, Black Shirt E, Black Shirt F, Red Shirt A, Red Shirt C, Blue Shirt C), one extract that contained low levels of azobenzene compounds for which we did not have analytical standards but detected via non-targeted analysis (Orange Shirt), and one extract that did not contain any azobenzene disperse dyes and that served as our dye-negative control (White Shirt). We summed the chromatographic peak area (normalized to para red d-4 [Toronto Research Chemicals]) of each detected azobenzene feature in the shirt samples7; these summed chromatographic peak areas were plotted against the percent peptide depletion induced in the cysteine assay and in the lysine assay relationship between peptide reactivity and the total detectable azobenzene disperse dye load in the shirt extracts (Figure 5).
Figure 5:

Peptide depletion induced by azobenzene-containing polyester shirt extracts after 24 hours of incubation, plotted against the total LC-MS peak area (in area counts) of all detected azobenzene compounds in the shirt extracts. Incubations with 0.1mM Lysine are plotted as grey circles; incubations with 0.2mM Cysteine are plotted as black triangles. Error bars represent standard error of the mean from three experimental trials (n=3).
Results of the extract DPRA assays showed that generally, textile extracts with higher total azobenzene disperse dye abundance (via chromatographic peak area) induced greater peptide depletion in the assay. While Spearman correlation analyses did not reveal a statistically significant correlation between total azobenzene peak area and peptide depletion in either assay (r = 0.57 and p = 0.12 in cysteine assay; r = 0.17 and p = 0.68 in lysine assay), the magnitude of the coefficient for cysteine (r = 0.57) is suggestive of a trend and is higher than the magnitude of the correlation for lysine (r=0.17). Given the small sample size, we may be underpowered to observe a significant association for cysteine. While no shirt extract induced higher than 15% lysine depletion, all shirt extracts with azobenzene disperse dyes for which we had standards induced 25% or higher cysteine depletion, and two shirt extracts – Black Shirt A and Blue Shirt C – induced 80% or higher cysteine depletion. The quantifiable azobenzene disperse dyes in Black Shirt A were predominantly DB373 (72.3 μg dye/g shirt), DO61 (302 μg dye/g shirt), and DV93 (90.4 μg dye/g shirt); the quantifiable azobenzene disperse dyes in Blue Shirt C were DB183:1 (150 μg dye/g shirt) and DR354 (90.5 μg dye/g shirt).7 Each of these compounds individually showed dose-dependent cysteine depletion in the HPLC assay as described above.
In both assays, the white shirt extract, which contained no detectable azobenzene disperse dyes, induced less than 10% peptide reaction over 24hrs; the orange shirt extract, which contained low relative abundances of azobenzene compounds (but likely contained other dyes, due to its orange hue), induced 20% or less peptide reaction. While the orange shirt extract (and all other textile extracts tested) was likely to contain other chemicals in addition to dyes, the difference between responses observed for the “low azobenzene disperse dye” white & orange textile extracts and the other colored shirt extracts was apparently correlated to the presences of azobenzene disperse dyes in the shirt extracts. A two-tailed t-test between the cysteine depletion of three orange shirt replicates and the cysteine depletion of the other colored shirt extracts showed that Black Shirt A, Black Shirt D, Black Shirt F, and Blue Shirt C each induced cysteine depletion at significantly higher levels (p < 0.05) than the orange shirt extract (see Supplementary Materials, Table SM-4).
4. Discussion
4.1. Azobenzene disperse dyes may function as skin sensitizers
Our results demonstrate that azobenzene disperse dyes react covalently to nucleophilic proteins in a dose-dependent manner and via pseudo-first order kinetics, and thus that they may contribute to the molecular initiating event of skin sensitization. While occupational and clinical evidence have previously shown azobenzene disperse dyes to cause allergic skin reactions32, 35–39; whole animal models have demonstrated allergenicity of azobenzene disperse dyes33, 58–60; and azobenzene disperse dyes have been shown to be biologically reactive through other electrophilic mechanisms such as mutagenicity9, 17, 61–66, to our knowledge this study is the first to provide quantitative experimental evidence that azobenzene disperse dyes are reactive with nucleophilic peptide residues. Sonnenburg et al. (2012) previously found that eight azobenzene disperse dyes, including DO37 tested in this study, reacted strongly in the loose-fit coculture-based sensitization assay (LCSA), which measures downstream binding to human keratinocytes and allogenic dendritic cell-related cells.67 While our results address only the molecular initiation step of sensitization, the findings that azobenzene disperse dyes are reactive with nucleophilic peptide residues are concordant with Sonnenburg et al.’s findings and offer new and specific insights into structural differences that may influence the molecular initiating event of sensitization.
Our results showed that the reductive transformation products of azobenzene disperse dyes that we tested (BDNA, DBNA, and CNA) were less reactive than the corresponding parent dyes (Figure 4, Figure SM-7). Likewise, Sonnenburg et al. (2012) tested cleavage products corresponding to the eight azo dyes in their study – including 2,6-dichloro-4-nitroaniline (DCNA), the chlorinated analog of DBNA – and found that while cleavage products were still reactive, they reacted with EC50 values an order of magnitude higher than their parent compounds.67 These results are interesting because historically, only the aromatic amine cleavage products of azobenzene disperse dyes have been given regulatory attention due to toxicological concern; our results, in concordance with Sonnenburg et al., suggest that more toxicological research is needed on the parent dyes themselves and on the molecular pathways of parent dye reactivity.
4.2. Peptide reactivity induced by azobenzene disperse dyes correlates to structural features of dyes
We found intriguing differences in reactivity – among dyes of similar structure, and between different halogenated analogs – for the two peptides tested in our DPRA assay. For example, it is interesting to note the differences in reaction rates among DO25, DO37, and DO61 (Table 1): DO37 is the chlorinated analog of DO25, while DO61 is the brominated analog. Our results showed that DO37 and DO61 both induced peptide reactivity at twice the rate of the non-halogenated DO25 in the cysteine assay. Our results also showed interesting differences in reactivity among azo dyes between the two peptides: while some dyes showed little-to-no differences in reactivity between peptides, other dyes such as DB79:1 showed large reaction rate differences.
These reactivity differences may be attributable in part to the structural differences and polarizability present in the dye molecules according to hard-soft acid-base chemistry: while ‘hard’ acids and bases are small, compact, and non-polarizable, ‘soft’ acids are larger with a more diffuse distribution of electrons and thus are strongly polarizable. Hard acids react preferentially with hard bases, while soft acids react preferentially with soft bases.68–70 Bromine is considered a “softer base” than chlorine – that is, while both halogens have a diffuse distribution of electrons and are polarizable, bromine is more polarizable than chlorine.71 Therefore, given a set of compounds which differ only in their halogen identities such as DO25 (no halogen), DO37 (chlorine), and DO61 (bromine), it may be that the halogenated compounds are more polarizable than DO25, leading to more potent binding. Where the reactivity of DB79:1 between peptides is concerned, DB79:1 is a brominated compound; the thiol group of cysteine has a more diffuse distribution of electrons and is therefore more polarizable than lysine’s amino group.72–73 The structural differences between peptides indicate that cysteine may be a ‘softer’ acid than lysine and may therefore bind more readily with electrophilic dyes whose moieties include softer bases.
We also examined structure-based reactivity differences among dyes by calculating Hammett constants for each dye.74 A full explanation of Hammett constants, how they are calculated, and how we structured our calculations in this study can be found in Appendix D in Supplementary Materials.75–84 Hammett constants (based on Disperse Orange 25, as explained in Appendix D) were plotted against DPRA reaction rate constants according to the Hammett equation: , where is the total Hammett coefficient per compound (the sum of all substituents per dye) and ρ is the slope of the regression model. Figure 6 shows this relationship between Hammett constants and rate constants for azobenzene disperse dyes in the cysteine and lysine assays; plots for transformation products are shown in Supplementary Materials (Figure SM-8, A–B). While Spearman correlation analyses did not show a statistically significant correlation between Hammett constants and rate constants for either the cysteine (r = 0.37, p = 0.24) or lysine (r = 0.05, p = 0.88) assays, it is visually apparent from Figure 6 that the Hammett constant for brominated and chlorinated compounds generally increase as the rate of reaction increases. Given the small sample size, we may be underpowered to observe a significant association; however, these observations suggest that brominated azo dyes have greater rates of reaction with the thiol group of the cysteine peptide, and indicate that brominated azo dyes in particular should be prioritized for further allergenicity testing.
Figure 6:

Calculated Hammett constants of each azobenzene disperse dye, plotted against the log of the ratio of dye rate constant to reference dye rate constant in the cysteine (Panel A, circles) and lysine (Panel B, triangles) assays. Red data points represent brominated compounds; blue data points represent chlorinated compounds; and green data points represent non-halogenated compounds.
We examined the electrophilicity index – a measure of susceptibility to nucleophilic attack85–86 – of each dye and transformation product as a measure of structure-based reactivity, since nucleophile/electrophile activity is expected to be crucial in hapten-protein reaction. Methods for calculating electrophilicity indices can be found in Appendix E in Supplementary Materials. Figure 7 shows each compound’s electrophilicity index plotted against reaction rate in the cysteine and lysine assays. Spearman correlation analyses showed a statistically significant correlation between electrophilicity indices and rate constants in the cysteine assay (r = 0.69, p = 0.01), although not in the lysine assay (r = 0.14, p = 0.63). Accordingly, it is apparent from Figure 7 that, particularly in the cysteine assay, dyes with higher electrophilicities have larger rate constants. This may indicate that the ‘soft acid’ properties and reactivity of the thiol group on the cysteine (as discussed above) contribute to cysteine’s ability to act as a better nucleophile in the presence of azobenzene disperse dyes and transformation products. Figure 7 also demonstrates that the observed trend in reactivity vs. electrophilicity held regardless of whether the dye was halogenated, suggested that regardless of the dye or transformation product’s structure, measured or calculated electrophilicity may be used as a predictor of a dye’s hapten reactivity. Electrophilicity may therefore be one useful predictive tool in assessing skin sensitization potential of azobenzene disperse dyes. Further studies are needed to characterize these reaction products via high-resolution mass spectrometry in order to gain further specific insights into how structure-related properties affect binding rates of dyes with nucleophilic peptides.
Figure 7.

Calculated electrophilicity index of each dye and transformation product, plotted against the compound’s rate constant in the cysteine (Panel A, circles) and lysine (Panel B, triangles) assays. Red data points represent brominated compounds; blue data points represent chlorinated compounds; and green data points represent non-halogenated compounds.
4.3. Clothing containing azobenzene disperse dyes may pose risks for skin sensitization
It is known that wearing clothing containing azobenzene disperse dyes can induce skin sensitization; several studies document the allergenicity of azo dyes via allergic contact dermatitis from dye-containing textiles.32, 35–39 While Spearman correlation analyses did not show a statistically significant correlation between electrophilicity index and rate constant in either assay (r = 0.45 and p = 0.10 in cysteine assay; r = 0.01 and p = 0.97 in lysine assay), our results in the cysteine assay suggest that azobenzene disperse dyes in extracts of shirts may contribute to nucleophilic peptide binding, and that binding can occur even at low concentrations. Additionally, in both assays, the white shirt extract, which contained no detectable azobenzene disperse dyes7, induced less than 10% peptide reaction over 24hrs; while this depletion may be related to the presences of additional additives in the shirts (such as antioxidants, bleaches, or plasticizers), this contrast suggests that dyes were responsible for at least some of the peptide binding observed in extracts of colored textiles. These findings in turn suggest that azobenzene disperse dyes may act as potential haptens in the molecular initiating event of skin sensitization. Given these results and our previous findings of the prevalence of azobenzene disperse dyes in clothing and in the indoor environment, further research is urgently needed to examine the allergenicity of azobenzene disperse dyes, and in particular studies are needed to assess potential human exposure through release of azobenzene disperse dyes from clothing during wear.
The haptenic behavior of azobenzene disperse dyes in textiles and clothing has implications beyond an allergic reaction only to a specific dye: allergenicity to azo dyes has also been shown to lead to cross-reactivity and to allergic reactions induced by numerous other dyes in clothing.87–88 It is also known that both adults and children can display sensitization to disperse dyes from clothing even without a clinical history of textile or atopic dermatitis.32, 36 Given that the children’s polyester shirt extracts tested in this study induced up to >90% peptide depletion, haptenic azobenzene disperse dyes should be prioritized for further patch, allergy and immunological testing specifically where children’s exposures are concerned.
Additionally, haptenic behavior of azobenzene disperse dyes in textiles and clothing has implications beyond skin sensitization alone. Exposure via inhalation is also a possible risk, given that dyes are applied to textile microfibers and humans are known to ingest these fibers. Chen et al. (2022) estimated that human exposures to additives via inhalation of clothing microplastic fibers are estimated to be up to 6440 μg/person annually for predominant additives such as PFAS.89 Given that our work shows that azobenzene disperse dyes are present in house dust at similar orders of magnitude to PFAS, exposures to azobenzene disperse dyes via inhalation of clothing microfibers may occur at similar rates as those estimated by Chen et al. It is also known that many skin sensitizers as predicted by the DPRA also test positive as respiratory sensitizers44, suggesting that if azobenzene disperse dyes are in fact inhaled via microfibers, they may be of concern where respiratory allergies are concerned. Further research on transport of dyes via microfibers, and on respiratory risks of azobenzene dyes, is needed.
Supplementary Material
Highlights:
Two methods of Direct Peptide Reactivity Assay were compared for chromophoric dyes
Azobenzene disperse dyes react with nucleophilic peptides via pseudo-first order kinetics
Polyester shirt extracts containing dyes also react with nucleophilic peptides
Binding rates correlate with Hammett constants and electrophilicity indices
Acknowledgements:
The authors wish to thank Dr. Gisela de Aragão Umbuzeiro for supplying the analytical standards Disperse Orange 61, Disperse Violet 93, and Disperse Blue 373 utilized in this study (BEX 14540/13–4). The authors also wish to thank Christopher Kassotis, PhD (Wayne State University), for his assistance in optimizing the spectrophotometric DPRA; and Janice Mayer and Marco Hall (Thermo Fisher Scientific) for their assistance with HPLC software and hardware used in the HPLC assay.
Funding Statement:
Research reported in this publication was supported by the National Institute of Environmental Health Sciences of the National Institutes of Health under Award Number T32ES021432 (Duke University Program in Environmental Health) and R21ES034098. The content is solely the responsibility of the authors and does not necessarily represent the official views of the National Institutes of Health.
This work was also supported by grants from the National Institute of Environmental Health Sciences (R01 ES016099 and U2C ES030851); and by a generous donation from the Falk family.
Abbreviations:
- ACD
allergic contact dermatitis
- AOP
adverse outcome pathway
- BDNA
2-bromo-4,6-dinitroaniline
- CNA
2-chloro-4-nitroaniline
- DPRA
Direct Peptide Reactivity Assay
- DB183:1
Disperse Blue 183:1
- DB373
Disperse Blue 373
- DB79:1
Disperse Blue 79:1
- DBNA
2,6-dibromo-4-nitroaniline
- DO25
Disperse Orange 25
- DO37
Disperse Orange 37
- DO44
Disperse Orange 44
- DO61
Disperse Orange 61
- DO73
Disperse Orange 73
- DR354
Disperse Red 354
- DR50
Disperse Red 50
- DR73
Disperse Red 73
- DTNB
5,5’-dithiobis-2-nitrobenzoic acid
- EURL-ECVAM
European Union Reference Laboratory for Alternatives to Animal Testing
- HPLC
High Performance Liquid Chromatography
- OECD
Organization for Cooperation and Development
Footnotes
Publisher's Disclaimer: This is a PDF file of an unedited manuscript that has been accepted for publication. As a service to our customers we are providing this early version of the manuscript. The manuscript will undergo copyediting, typesetting, and review of the resulting proof before it is published in its final form. Please note that during the production process errors may be discovered which could affect the content, and all legal disclaimers that apply to the journal pertain.
CRediT Authorship Contributions
K.E.O. – Conceptualization, Methodology, Formal Analysis, Investigation, Data Curation, Writing Original Draft, Writing Review and Editing, Visualization
R.M.T. – Methodology, Validation, Writing Review and Editing, Supervision
H.M.S. – Conceptualization, Methodology, Validation, Resources, Writing Review and Editing, Supervision, Project Administration, Funding Acquisition
P.L.F. – Conceptualization, Methodology, Software, Validation, Resources, Writing Review and Editing, Supervision, Project Administration, Funding Acquisition
Declaration of interests
The authors declare that they have no known competing financial interests or personal relationships that could have appeared to influence the work reported in this paper.
References
- 1.Benkhaya S, M’ rabet S, El Harfi A (2020a). A review on classifications, recent synthesis and applications of textile dyes. Inorg. Chem. Commun 115, 107891. 10.1016/j.inoche.2020.107891 [DOI] [PMC free article] [PubMed] [Google Scholar]
- 2.Waring DR (1984). Heterocyclic Dyes and Pigments, in: Comprehensive Heterocyclic Chemistry. 10.1016/B978-008096519-2.00012-6 [DOI] [Google Scholar]
- 3.Dawson JF (1991). Azobenzene disperse dyes-past development and future prospects. J. Soc. Dye. Colour 107, 395–400. 10.1111/j.1478-4408.1991.tb01285.x [DOI] [Google Scholar]
- 4.Drumond Chequer FM, Junqueira D, de Oliveir DP (2011). Azo Dyes and Their Metabolites: Does the Discharge of the Azo Dye into Water Bodies Represent Human and Ecological Risks?, in: Advances in Treating Textile Effluent. 10.5772/19872 [DOI] [Google Scholar]
- 5.Chen B, Ni S, Sun L, Luo X, Zhang Q, Song Y, Zhong Q, Fang Y, Huang C, Chen S, Wu W (2018). Intramolecular charge transfer tuning of azo dyes: Spectroscopic characteristic and third-order nonlinear optical properties. Dye. Pigment 158, 474–481. 10.1016/j.dyepig.2018.05.063 [DOI] [Google Scholar]
- 6.El-Ghamaz NA, El-Bindary AA, El-Boz RA (2017). Electrical and optical properties of new azo dyes derived from m-aminophenol. Synth. Met 226, 207–214. 10.1016/j.synthmet.2017.02.005 [DOI] [Google Scholar]
- 7.Overdahl KE, Gooden D, Bobay B, Getzinger GJ, Stapleton HM, Ferguson PL (2021). Characterizing azobenzene disperse dyes in commercial mixtures and children’s polyester clothing. Environ. Pollut 287, 117289. 10.1016/j.envpol.2021.117299 [DOI] [PMC free article] [PubMed] [Google Scholar]
- 8.Porobić SJ, Božić B, Dramićanin MD, Vitnik V, Vitnik Ž, Marinović-Cincović M, Mijin D (2020). Absorption and fluorescence spectral properties of azo dyes based on 3-amido-6-hydroxy-4-methyl-2-pyridone: Solvent and substituent effects. Dye. Pigment 175, 108139. 10.1016/j.dyepig.2019.108139 [DOI] [Google Scholar]
- 9.Brüschweiler BJ, Merlot C (2017). Azo dyes in clothing textiles can be cleaved into a series of mutagenic aromatic amines which are not regulated yet. Regul. Toxicol. Pharmacol 88, 214–226. 10.1016/j.yrtph.2017.06.012 [DOI] [PubMed] [Google Scholar]
- 10.Chequer FMD, Lizier TM, de Felício R, Zanoni MVB, Debonsi HM, Lopes NP, de Oliveira DP (2015). The azo dye Disperse Red 13 and its oxidation and reduction products showed mutagenic potential. Toxicol. Vitr 29(7), 1906–1915. 10.1016/j.tiv.2015.08.001 [DOI] [PubMed] [Google Scholar]
- 11.Rawat D, Sharma RS, Karmakar S, Arora LS, Mishra V (2018). Ecotoxic potential of a presumably non-toxic azo dye. Ecotoxicol. Environ. Saf 148: 528–537. 10.1016/j.ecoenv.2017.10.049 [DOI] [PubMed] [Google Scholar]
- 12.Rocha OP, Cesila CA, Christovam EM, Barros S.B. de M., Zanoni MVB, de Oliveira DP (2017). Ecotoxicological risk assessment of the “Acid Black 210” dye. Toxicology. 376, 113–119. 10.1016/j.tox.2016.04.002 [DOI] [PubMed] [Google Scholar]
- 13.Vacchi FI, Vendemiatti J.A. de S., da Silva BF, Zanoni MVB, Umbuzeiro G. de A. (2017). Quantifying the contribution of dyes to the mutagenicity of waters under the influence of textile activities. Sci. Total Environ 601–602, 230-236. 10.1016/j.scitotenv.2017.05.103 [DOI] [PubMed] [Google Scholar]
- 14.Vacchi FI, Vendemiatti JAS, Brosselin V, Ferreira da Silva B, Maria MV, DeMeo M, Bony S, Devaux A, Umbuzeiro GA (2016). Combining different assays and chemical analysis to characterize the genotoxicity of waters impacted by textile discharges. Environ. Mol. Mutagen 57, 559–571. 10.1002/em.22034 [DOI] [PubMed] [Google Scholar]
- 15.Ventura-Camargo B. de C., de Angelis D. de F., Marin-Morales MA (2016). Assessment of the cytotoxic, genotoxic and mutagenic effects of the commercial black dye in Allium cepa cells before and after bacterial biodegradation treatment. Chemosphere. 161, 325–332. 10.1016/j.chemosphere.2016.06.085 [DOI] [PubMed] [Google Scholar]
- 16.Malinauskiene L, Bruze M, Ryberg K, Zimerson E, Isaksson M (2013). Contact allergy from disperse dyes in textiles: a review. Contact Dermatitis. 68(2), 65–75. 10.1111/cod.12001 [DOI] [PubMed] [Google Scholar]
- 17.Dhungana B, Peng H, Kutarna S, Umbuzeiro G, Shrestha S, Liu J, Jones PD, Subedi B, Giesy JP, Cobb GP (2019). Abundances and concentrations of brominated azo dyes detected in indoor dust. Environ. Pollut 252, 784–793. 10.1016/j.envpol.2019.05.153 [DOI] [PubMed] [Google Scholar]
- 18.Ferguson PL, Stapleton HM (2017). Comment on “Mutagenic Azo Dyes, Rather Than Flame Retardants, Are the Predominant Brominated Compounds in House Dust.” Environ. Sci. Technol 51(6), 3588–3590. 10.1021/acs.est.7b00372 [DOI] [PubMed] [Google Scholar]
- 19.Kutarna S, Tang S, Hu X, Peng H (2021). Enhanced Nontarget Screening Algorithm Reveals Highly Abundant Chlorinated Azo Dye Compounds in House Dust. Environ. Sci. Technol 55, 4729–4739. 10.1021/acs.est.0c06382 [DOI] [PubMed] [Google Scholar]
- 20.Peng H, Saunders DMV, Sun J, Jones PD, Wong CKC, Liu H, Giesy JP (2016). Mutagenic azo dyes, rather than flame retardants, are the predominant brominated compounds in house dust. Environ. Sci. Technol 50, 12669–12677. 10.1021/acs.est.6b03954 [DOI] [PubMed] [Google Scholar]
- 21.Basketter D, Darlenski R, Fluhr JW (2008). Skin irritation and sensitization: Mechanisms and new approaches for risk assessment. Skin Pharmacol. Physiol 21, 191–202. 10.1159/000135635 [DOI] [PubMed] [Google Scholar]
- 22.Kimber I, Dearman R (2005). What makes a chemical a respiratory sensitizer? Curr. Opin. Allergy Clin. Immunol 5, 119–124. 10.1097/01.ALL.0000162302.82233.93 [DOI] [PubMed] [Google Scholar]
- 23.Kimber I, Basketter DA, Gerberick GF, Dearman RJ (2002). Allergic contact dermatitis. Int. Immunopharmacol 2, 201–211. 10.1016/S1567-5769(01)00173-4 [DOI] [PubMed] [Google Scholar]
- 24.Committees ES, 2012. “Annex VI: Chemical Reports of Skin Sensitizers.” 1–23. [Google Scholar]
- 25.Jordan WP (1983). Allergic contact dermatitis to simple chemicals: A molecular approach. J. Am. Acad. Dermatol 8, 575. 10.1016/S0190-9622(83)80070-X [DOI] [Google Scholar]
- 26.Landsteiner K, Jacobs J (1936). Studies on the sensitization of animals with simple chemical compounds: III Anaphylaxis induced by arsphenamine. J. Exp. Med 64, 717–721. 10.1084/JEM.64.5.717 [DOI] [PMC free article] [PubMed] [Google Scholar]
- 27.Divkovik M, Pease CK, Gerberick GF, Basketter DA (2013). Hapten – protein binding : from theory to practical application in the in vitro prediction of skin sensitization. Contact Dermatitis. 53(4), 189–200. 10.1111/j.0105-1873.2005.00683.x [DOI] [PubMed] [Google Scholar]
- 28.Elahi EN Wright Z, Hinselwood D, Hotchkiss SAM, Basketter DA, Pease CKS (2004). Protein Binding and Metabolism Influence the Relative Skin Sensitization Potential of Cinnamic Compounds. Chem. Res. Toxicol 17, 301–310. 10.1021/TX0341456 [DOI] [PubMed] [Google Scholar]
- 29.Lower GM, Lanphear SP, Johnson BM, Bryan GT (1977). Aryl and heterocyclic diazo compounds as potential environmental electrophiles. J Toxicol. Environ. Health 2(5), 1095–1107. 10.1080/15287397709529507 [DOI] [PubMed] [Google Scholar]
- 30.Patlewicz G, Kuseva C, Kesova A, Popova I, Zhechev T, Pavlov T, Roberts DW, Mekenyan O (2014). Towards AOP application – Implementation of an integrated approach to testing and assessment (IATA) into a pipeline tool for skin sensitization. Regul. Toxicol. Pharmacol 69, 529–545. 10.1016/J.YRTPH.2014.06.001 [DOI] [PubMed] [Google Scholar]
- 31.Lalko JF, Kimber I, Gerberick GF, Foertsch LM, Api AM, Dearman RJ (2012). The Direct Peptide Reactivity Assay: Selectivity of Chemical Respiratory Allergens. Toxicol. Sci 129, 421–431. 10.1093/TOXSCI/KFS205 [DOI] [PubMed] [Google Scholar]
- 32.Giusti F, Massone F, Bertoni L, Pellacani G, Seidenari S (2003). Contact Sensitization to Disperse Dyes in Children. Pediatr. Dermatol 20, 393–397. 10.1046/j.1525-1470.2003.20504.x [DOI] [PubMed] [Google Scholar]
- 33.Hatch KL, Maibach HI (1995). Textile dye dermatitis. J. Am. Acad. Dermatol 32, 631–639. 10.1016/0190-9622(95)90350-X [DOI] [PubMed] [Google Scholar]
- 34.Pratt M, Taraska V (2000). Disperse Blue dyes 106 and 124 are common causes of textile dermatitis and should serve as screening allergens for this condition. Am. J. Contact Dermat 11, 30–41. 10.1016/S1046-199X(00)90030-7 [DOI] [PubMed] [Google Scholar]
- 35.Seidenari S, Manzini BM, Danese P, Motolese A (1990). Patch and prick test study of 593 healthy subjects. Contact Dermatitis. 23, 162–167. 10.1111/j.1600-0536.1990.tb04777.x [DOI] [PubMed] [Google Scholar]
- 36.Seidenari S, Manzini BM, Danese P (1991). Contact sensitization to textile dyes: description of 100 subjects. Contact Dermatitis. 24, 253–258. 10.1111/j.1600-0536.1991.tb01718.x [DOI] [PubMed] [Google Scholar]
- 37.Seidenari S, Manzini BM, Schoiavi ME, Motolese A (1995). Prevalence of contact allergy to non-disperse azo dyes for natural fibers: a study in 1814 consecutive patients. Contact Dermatitis. 33, 118–122. 10.1111/j.1600-0536.1995.tb00512.x [DOI] [PubMed] [Google Scholar]
- 38.Seidenari S, Mantovani L, Manzini BM, Pignatti M (1997). Cross-sensitizations between azo dyes and para-amino compound. A study of 236 azo-dye-sensitive subjects. Contact Dermatitis. 36, 91–96. 10.1111/j.1600-0536.1997.tb00420.x [DOI] [PubMed] [Google Scholar]
- 39.Seidenari S, Giusti F, Massone F, Mantovani L (2002). Sensitization to disperse dyes in a patch test population over a five-year period. Am. J. Contact Dermat 13, 101–107. 10.1053/ajcd.2002.34570 [DOI] [PubMed] [Google Scholar]
- 40.Wigger-Alberti W, Eisner P (2003). Occupational Contact Dermatitis in the Textile Industry, in: Eisner P, Hatch K, Wigger-Alberti W (Eds.), Current Problems In Dermatology: Textiles and the Skin. Karger, Basel, pp. 114–122. [DOI] [PubMed] [Google Scholar]
- 41.The Adverse Outcome Pathway for Skin Sensitisation Initiated by Covalent Binding to Proteins. (2014). OECD Series on Testing and Assessment. 10.1787/9789264221444-EN [DOI] [Google Scholar]
- 42.EU Reference Laboratory for alternatives to animal testing | EU Science Hub [WWW Document], n.d https://ec.europa.eu/jrc/en/eurl/ecvam (accessed 10.5.21).
- 43.Kimber I, Dearman RJ, Basketter DA, Boverhof DR (2014). Chemical respiratory allergy: Reverse engineering an adverse outcome pathway. Toxicology 318: 32–39. 10.1016/j.tox.2014.02.001 [DOI] [PubMed] [Google Scholar]
- 44.Dik S, Rorije E, Schwillens P, van Loveren H, Ezendam J (2016). Can the Direct Peptide Reactivity Assay Be Used for the Identification of Respiratory Sensitization Potential of Chemicals? Toxicological Sciences. 153(2), 361–371. 10.1093/toxsci/kfwl30 [DOI] [PubMed] [Google Scholar]
- 45.Gerberick GF, Vassallo JD, Foertsch LM, Price BB, Chaney JG, Lepoittevin JP (2007). Quantification of Chemical Peptide Reactivity for Screening Contact Allergens: A Classification Tree Model Approach. Toxicol. Sci 97, 417–427. 10.1093/TOXSCI/KFM064 [DOI] [PubMed] [Google Scholar]
- 46.Test No. 442C: In Chemico Skin Sensitisation. (2021). OECD Guidelines for the Testing of Chemicals, Section 4. 10.1787/9789264229709-EN [DOI] [Google Scholar]
- 47.Wareing B, Urbisch D, Kolle SN, Honarvar N, Sauer UG, Mehling A, Landsiedel R (2017). Prediction of skin sensitization potency sub-categories using peptide reactivity data. Toxicol. Vitr 45, 134–145. 10.1016/JTIV.2017.08.015 [DOI] [PubMed] [Google Scholar]
- 48.Wong CL, Lam A-L, Smith MT, Ghassabian S (2016). Evaluation of a High-Throughput Peptide Reactivity Format Assay for Assessment of the Skin Sensitization Potential of Chemicals. Front. Pharmacol 7, 53. 10.3389/FPHAR.2016.00053 [DOI] [PMC free article] [PubMed] [Google Scholar]
- 49.Natsch A, Haupt T, Wareing B, Landsiedel R, Kolle SN (2020). Predictivity of the kinetic direct peptide reactivity assay (kDPRA) for sensitizer potency assessment and GHS subclassification. ALTEX - Altern. to Anim. Exp 37, 652–664. 10.14573/ALTEX.2004292 [DOI] [PubMed] [Google Scholar]
- 50.Wareing B, Kolle SN, Birk B, Alépée N, Haupt T, Kathawala R, Kern PS, Nardelli L, Raabe H, Rucki M, Ryan CA, Verkaart S, Westerink WMA, Landsiedel R, Natsch A (2020). The kinetic direct peptide reactivity assay (kDPRA): Intra-and inter-laboratory reproducibility in a seven-laboratory ring trial. ALTEX - Altern. to Anim. Exp 37, 639–651. 10.14573/ALTEX.2004291 [DOI] [PubMed] [Google Scholar]
- 51.Jeong YH, An S, Shin K, Lee TR (2013). Peptide reactivity assay using spectrophotometric method for high-throughput screening of skin sensitization potential of chemical haptens. Toxicol. Vitr 27, 264–271. 10.1016/J.TIV.2012.08.032 [DOI] [PubMed] [Google Scholar]
- 52.Cho SA, Jeong YH, Kim JH, Kim S, Cho JC, Heo Y, Suh K. Do, An S, Shin K (2014). Method for detecting the reactivity of chemicals towards peptides as an alternative test method for assessing skin sensitization potential. Toxicol. Lett 225, 185–191. 10.1016/JTOXLET.2013.12.007 [DOI] [PubMed] [Google Scholar]
- 53.Gerberick GF, Vassallo JD, Bailey RE, Chaney JG, Morrall SW, Lepoittevin JP (2004). Development of a Peptide Reactivity Assay for Screening Contact Allergens. Toxicol. Sci 81, 332–343. 10.1093/TOXSCI/KFH213 [DOI] [PubMed] [Google Scholar]
- 54.Böhlen P, Stein S, Dairman W, Udenfriend S (1973). Fluorometric assay of proteins in the nanogram range. Arch. Biochem. Biophys 155, 213–220. 10.1016/S0003-9861(73)80023-2 [DOI] [PubMed] [Google Scholar]
- 55.De Bernardo S, Weigele M, Toome V, Manhart K, Leimgruber W, Böhlen P, Stein S, Udenfriend S (1974). Studies on the reaction of fluorescamine with primary amines. Arch. Biochem. Biophys 163, 390–399. 10.1016/0003-9861(74)90490-1 [DOI] [PubMed] [Google Scholar]
- 56.Wenska G, Koput J, Pedzinski T, Marciniak B, Karolczak J, Golankiewicz B (2006). Effect of Hydroxylic Solvent on the Fluorescence Behavior of Some Bioactive 9-Oxo-imidazo[1,2-a]purine Derivatives. J. Phys. Chem. A 110, 11025–11033. 10.1021/jp062680j [DOI] [PubMed] [Google Scholar]
- 57.Marcelis Q, Deconinck E, Rogiers V, Vanhaecke T, Desmedt B (2023). Applicability of the DPRA on mixture testing: challenges and opportunities. Immunotoxicology 97(9): 2453–2461. 10.1007/s00204-023-03551-y [DOI] [PMC free article] [PubMed] [Google Scholar]
- 58.Hatch KL (1984). Chemicals and Textiles: Part I: Dermatological Problems Related to Fiber Content and Dyes. Text. Res. J 54, 664–682. 10.1177/004051758405401005 [DOI] [Google Scholar]
- 59.Hausen BM (1993). Contact allergy to Disperse Blue 106 and Blue 124 in black “velvet” clothes. Contact Dermatitis. 28, 169–173. 10.1111/J.1600-0536.1993.TB03381.X [DOI] [PubMed] [Google Scholar]
- 60.Hausen BM, Brandão FM (1986). Disperse Blue 106, a strong sensitizer. Contact Dermatitis. 15, 102–103. 10.1111/J.1600-0536.1986.TB01294.X [DOI] [PubMed] [Google Scholar]
- 61.Bafana A, Devi SS, Chakrabarti T (2011). Azo dyes: Past, present and the future. Environ. Rev 10.1139/all-018 [DOI] [Google Scholar]
- 62.Chung KT, Cerniglia CE (1992). Mutagenicity of azo dyes: Structure-activity relationships. Mutat. Res. Genet. Toxicol 277, 201–220. 10.1016/0165-1110(92)90044-A [DOI] [PubMed] [Google Scholar]
- 63.De Aragão Umbuzeiro G, Freeman HS, Warren SH, De Oliveira DP, Terao Y, Watanabe T, Claxton LD (2005). The contribution of azo dyes to the mutagenic activity of the Cristais River. Chemosphere. 60(1), 55–64. 10.1016/j.chemosphere.2004.ll.100 [DOI] [PubMed] [Google Scholar]
- 64.Novotný Č, Dias N, Kapanen A, Malachová K, Vándrovcová M, Itävaara M, Lima N (2006). Comparative use of bacterial, algal and protozoan tests to study toxicity of azo- and anthraquinone dyes. Chemosphere. 63, 1436–1442. 10.1016/j.chemosphere.2005.10.002 [DOI] [PubMed] [Google Scholar]
- 65.Platzek T (2013). Overview on toxicity and exposure to azo dyes and aromatic amines. Toxicol. Lett 221, S53. 10.1016/j.toxlet.2013.06.193 [DOI] [Google Scholar]
- 66.Tsuda S, Matsusaka N, Madarame H, Ueno S, Susa N, Ishida K, Kawamura N, Sekihashi K, Sasaki YF (2000). The comet assay in eight mouse organs: Results with 24 azo compounds. Mutat. Res. - Genet. Toxicol. Environ. Mutagen 465, 11–26. 10.1016/S1383-5718(99)00199-0 [DOI] [PubMed] [Google Scholar]
- 67.Sonnenburg A, Ahuja V, Schreiner M, Platzek T, Stahlmann R (2012). Assessment of the sensitizing potential of textile disperse dyes and some of their metabolites by the loose-Wt coculture-based sensitization assay (LCSA). Arch. Toxicol 86, 733–740. 10.1007/s00204-012-0811-9 [DOI] [PubMed] [Google Scholar]
- 68.Ayers PW (2005). An elementary derivation of the hard/soft-acid/base principle. J. Chem. Phys 122, 141102. 10.1063/l.1897374 [DOI] [PubMed] [Google Scholar]
- 69.Ayers PW, Parr RG, Pearson RG (2006). Elucidating the hard/soft acid/base principle: A perspective based on half-reactions. J. Chem. Phys 124, 194107. 10.1063/l.2196882 [DOI] [PubMed] [Google Scholar]
- 70.Ayers PW (2006). The physical basis of the hard/soft acid/base principle. Faraday Discuss. 135, 161–190. 10.1039/B606877D [DOI] [PubMed] [Google Scholar]
- 71.Riel AMS, Jessop MJ, Decato DA, Massena CJ, Nascimento VR, Berryman OB (2017). Experimental investigation of halogen-bond hard–soft acid–base complementarity. Acta. Crystallogr. B. Struct. Sci. Cryst. Eng. Mater 73, 203–209. 10.1107/S2052520617001809 [DOI] [PMC free article] [PubMed] [Google Scholar]
- 72.Ning C, Bao P, Zhang D, Li L, Chen L, Fang H, Tang Y, Zhou C (2020). Reduction and coordination properties of l-Lysine/l-arginine/l-cysteine for the improvement of the color of cured sausage. Food Chem 312, 126122. 10.1016/J.FOODCHEM.2019.126122 [DOI] [PubMed] [Google Scholar]
- 73.Wible RS, Sutter TR (2017). Soft Cysteine Signaling Network: The Functional Significance of Cysteine in Protein Function and the Soft Acids/Bases Thiol Chemistry That Facilitates Cysteine Modification. Chem. Res. Toxicol 30, 729–762. 10.1021/ACS.CHEMRESTOX.6B00428 [DOI] [PubMed] [Google Scholar]
- 74.Hansch C, Leo A, Taft RW (1991). A Survey of Hammett Substituent Constants and Resonance and Field Parameters. Chem. Rev 91, 165–195. 10.1021/cr00002a004 [DOI] [Google Scholar]
- 75.Brown EV, Granneman GR (1975). Cis-Trans Isomerism in the Pyridyl Analogs of Azobenzene. A Kinetic and Molecular Orbital Analysis. J. Am. Chem. Soc 97, 621–627. 10.1021/ja00836a025 [DOI] [Google Scholar]
- 76.Christoforou D, Happer D (1983). The application of the Hammett equation to 13C N.M.R. spectrometry. VI. Remote ring effects in azobenzenes and stilbenes. Aust. J. Chem 36, 2083–2094. 10.1071/CH9832083 [DOI] [Google Scholar]
- 77.Doll P, Shi F, Kelly S, Wnek W (1999). The Problem of Catalytic Fading with Ink-Jet Inks. Int. Conf. Digit. Print. Technol 325–328. [Google Scholar]
- 78.De Maria P, Fontana A, Gasbarri C, Siani G, Zanirato P (2009). Kinetics of the Z-E isomerization of monosubstituted azobenzenes in polar organic and aqueous micellar solvents. Arkivoc. 8, 16–29. 10.3998/ark.5550190.0010.803 [DOI] [Google Scholar]
- 79.Runtsch LS, Barber DM, Mayer P, Groll M, Trauner D, Broichhagen J (2015). Azobenzene-based inhibitors of human carbonic anhydrase II. Beilstein J. Org. Chem 11127 11, 1129–1135. 10.3762/BJOC.ll.127 [DOI] [PMC free article] [PubMed] [Google Scholar]
- 80.Sidir YG, Sidir I, Berber H, Tasal E (2015). An experimental study on relationship between hammett substituent constant and electronic absorption wavelength of some azo dyes. Bitlis Eren Univ. J. Sci. Technol 1, 7–7. 10.17678/beuscitech.47153 [DOI] [Google Scholar]
- 81.Yamada S, Bessho J, Nakasato H, Tsutsumi O (2018). Color tuning donor–acceptor-type azobenzene dyes by controlling the molecular geometry of the donor moiety. Dye. Pigment 150, 89–96. 10.1016/J.DYEPIG.2017.ll.002 [DOI] [Google Scholar]
- 82.Pierpoint AC, Hapeman CJ, Torrents A (2001). Linear Free Energy Study of Ring-Substituted Aniline Ozonation for Developing Treatment of Aniline-Based Pesticide Wastes. J. Agric. Food Chem 49, 3827–3832. 10.1021/JF010123l [DOI] [PubMed] [Google Scholar]
- 83.Ertl P (2021). A Web Tool for Calculating Substituent Descriptors Compatible with Hammett Sigma Constants. ChemRxiv. 10.26434/CHEMRXIV.14215964.Vl [DOI] [Google Scholar]
- 84.Perrin DD (1964). Dissociation Constants of Inorganic Acids and Bases in Aqueous Solution. Commission on Electroanalytical Chemistry, Analytical Chemistry Division. 75–101. [Google Scholar]
- 85.Maynard AT, Huang M, Rice WG, Coveil DG (1998). Reactivity of the HIV-1 nucleocapsid protein p7 zinc finger domains from the perspective of density-functional theory. Proc. Natl. Acad. Sci 95, 11578–11583. 10.1073/PNAS.95.20.11578 [DOI] [PMC free article] [PubMed] [Google Scholar]
- 86.Parr RG, Szentpály LV, Liu S (1999). Electrophilicity Index. J. Am. Chem. Soc 121, 1922–1924. 10.1021/JA983494X [DOI] [Google Scholar]
- 87.Nakagawa M, Kawai K, Kawai Ky. (1996). Multiple azo disperse dye sensitization mainly due to group sensitizations to azo dyes. Contact Dermatitis. 34, 6–11. 10.1111/j.1600-0536.1996.tb02103.x [DOI] [PubMed] [Google Scholar]
- 88.Keshava C, Nicolai S, Vulimiri SV, Cruz FA, Ghoreishi N, Knueppel S, Lenzner A, Tarnow P, Vanselow JT, Schulz B, Persad A, Baker N, Thayer KA, Williams AJ, Pirow R (2023). Application of systematic evidence mapping to identify available data on the potential human health hazards of selected market-relevant azo dyes. Environment International. 107952. 10.1016/j.envint.2023.107952 [DOI] [PMC free article] [PubMed] [Google Scholar]
- 89.Chen Y, Chen Q, Zhang Q, Zuo C, Shi H (2022). An Overview of Chemical Additives on (Micro)Plastic Fibers: Occurrence, Release, and Health Risks. Rev Environ Contam Toxicol. 260(1), 22. 10.1007/s44169-022-00023-9 [DOI] [Google Scholar]
Associated Data
This section collects any data citations, data availability statements, or supplementary materials included in this article.