

Abstract
Background
The number of older people is increasing worldwide and public expenditure on residential aged care facilities (ACFs) is expected to at least double, and possibly triple, by 2050. Co‐ordinated and timely care in residential ACFs that reduces unnecessary hospital transfers may improve residents' health outcomes and increase satisfaction with care among ACF residents, their families and staff. These benefits may outweigh the resources needed to sustain the changes in care delivery and potentially lead to cost savings. Our systematic review comprehensively and systematically presents the available evidence of the effectiveness, safety and cost‐effectiveness of alternative models of providing health care to ACF residents.
Objectives
Main objective
To assess the effectiveness and safety of alternative models of delivering primary or secondary health care (or both) to older adults living in ACFs.
Secondary objective
To assess the cost‐effectiveness of the alternative models.
Search methods
We searched CENTRAL, MEDLINE, Embase, five other databases and two trials registers (WHO ICTRP, ClinicalTrials.gov) on 26 October 2022, together with reference checking, citation searching and contact with study authors to identify additional studies.
Selection criteria
We included individual and cluster‐randomised trials, and cost/cost‐effectiveness data collected alongside eligible effectiveness studies. Eligible study participants included older people who reside in an ACF as their place of permanent abode and healthcare professionals delivering or co‐ordinating the delivery of healthcare at ACFs. Eligible interventions focused on either ways of delivering primary or secondary health care (or both) or ways of co‐ordinating the delivery of this care. Eligible comparators included usual care or another model of care. Primary outcomes were emergency department visits, unplanned hospital admissions and adverse effects (defined as infections, falls and pressure ulcers). Secondary outcomes included adherence to clinical guideline‐recommended care, health‐related quality of life of residents, mortality, resource use, access to primary or specialist healthcare services, any hospital admissions, length of hospital stay, satisfaction with the health care by residents and their families, work‐related satisfaction and work‐related stress of ACF staff.
Data collection and analysis
Two review authors independently selected studies for inclusion, extracted data, and assessed risk of bias and certainty of evidence using GRADE. The primary comparison was any alternative model of care versus usual care.
Main results
We included 40 randomised trials (21,787 participants; three studies only reported number of beds) in this review.
Included trials evaluated alternative models of care aimed at either all residents of the ACF (i.e. no specific health condition; 11 studies), ACF residents with mental health conditions or behavioural problems (12 studies), ACF residents with a specific condition (e.g. residents with pressure ulcers, 13 studies) or residents requiring a specific type of care (e.g. residents after hospital discharge, four studies). Most alternative models of care focused on 'co‐ordination of care' (n = 31). Three alternative models of care focused on 'who provides care' and two focused on 'where care is provided' (i.e. care provided within ACF versus outside of ACF). Four models focused on the use of information and communication technology. Usual care, the comparator in all studies, was highly heterogeneous across studies and, in most cases, was poorly reported. Most of the included trials were susceptible to some form of bias; in particular, performance (89%), reporting (66%) and detection (42%) bias.
Compared to usual care, alternative models of care may make little or no difference to the proportion of residents with at least one emergency department visit (risk ratio (RR) 1.01, 95% confidence interval (CI) 0.84 to 1.20; 7 trials, 1276 participants; low‐certainty evidence), but may reduce the proportion of residents with at least one unplanned hospital admission (RR 0.74, 95% CI 0.56 to 0.99, I2 = 53%; 8 trials, 1263 participants; low‐certainty evidence). We are uncertain of the effect of alternative models of care on adverse events (proportion of residents with a fall: RR 1.15, 95% CI 0.83 to 1.60, I² = 74%; 3 trials, 1061 participants; very low‐certainty evidence) and adherence to guideline‐recommended care (proportion of residents receiving adequate antidepressant medication: RR 5.29, 95% CI 1.08 to 26.00; 1 study, 65 participants) as the certainty of the evidence is very low. Compared to usual care, alternative models of care may have little or no effect on the health‐related quality of life of ACF residents (MD ‐0.016, 95% CI ‐0.036 to 0.004; I² = 23%; 12 studies, 4016 participants; low‐certainty evidence) and probably make little or no difference to the number of deaths in residents of ACFs (RR 1.03, 95% CI 0.92 to 1.16, 24 trials, 3881 participants, moderate‐certainty evidence).
We did not pool the cost‐effectiveness or cost data as the specific costs associated with the various alternative models of care were incomparable, both across models of care as well as across settings. Based on the findings of five economic evaluations (all interventions focused on co‐ordination of care), we are uncertain of the cost‐effectiveness of alternative models of care compared to usual care as the certainty of the evidence is very low.
Authors' conclusions
Compared to usual care, alternative models of care may make little or no difference to the number of emergency department visits but may reduce unplanned hospital admissions. We are uncertain of the effect of alternative care models on adverse events (i.e. falls, pressure ulcers, infections) and adherence to guidelines compared to usual care, as the certainty of the evidence is very low. Alternative models of care may have little or no effect on health‐related quality of life and probably have no effect on mortality of ACF residents compared to usual care. Importantly, we are uncertain of the cost‐effectiveness of alternative models of care due to the limited, disparate data available.
Keywords: Aged, Humans, Health Personnel, Homes for the Aged, Primary Health Care, Quality of Life, Secondary Care
Plain language summary
Alternative ways to organise delivery of health care to older adults living in aged care facilities
What is the aim of this review?
This Cochrane review set out to determine if providing residents of aged care facilities (ACF) with the same care as usual care, just delivered in a different way (alternative models of care), is better in terms of emergency department transfers, unplanned hospital admissions, adverse events, adherence to clinical guideline‐recommended care, health‐related quality of life, mortality and costs. For example, are multidisciplinary teams (alternative model) a better way of delivering care to residents of ACFs compared to providing care through individual practitioners (usual care)?
Key messages
Compared to usual care, alternative models of care may reduce unplanned hospital admissions, but may make little or no difference to the number of emergency department visits and the health‐related quality of life of ACF residents, and probably make little or no difference to mortality. We are uncertain of the effect of alternative models of care on adverse events (i.e. falls, pressure ulcers, infections) and adherence to guideline‐recommended care. Importantly, we are uncertain whether alternative models of care are cost‐effective due to the limited, conflicting data available.
Studies differed widely in terms of intervention characteristics, health care settings and descriptions of usual care and this hindered many analyses in this review. Future studies should provide a detailed description of what intervention and usual care constitutes in their setting.
What was studied in this review?
The world's population is ageing and the number of persons living in residential ACFs is growing worldwide. ACF residents are often frail, elderly people with multiple health conditions that require intensive medical care. When an ACF is not able to deliver appropriate health care, residents are often transferred to a hospital for treatment. Such transfers are often burdensome and traumatic for ACF residents and their families and may lead to increased costs. Alternative models of care, designed to provide care that is better co‐ordinated and more timely, aim to reduce unnecessary hospital transfers and improve residents' well‐being. Alternative models of care may be more expensive to implement (e.g. employ more healthcare personnel) but may lead to cost savings down the line (e.g. more residents receive care in ACF, avoiding costly hospital transfers). The synthesised evidence in this review compares the effect of alternative models of care with usual care on the number of emergency department transfers, unplanned hospital admissions, adverse events, adherence to clinical guideline‐recommended care, health‐related quality of life, mortality and costs (i.e. does the model deliver better value for money compared to usual care).
What are the main results of this review?
We identified 40 studies (with in total 21,787 participants; three studies did not provide number of participants) conducted in 15 countries. The study participants differed with respect to their health needs. In 11 studies, the alternative model of care was aimed at all ACF residents (with mixed health needs/conditions). Other studies included residents with mental health conditions or behavioural problems (12 studies), ACF residents with a specific condition (e.g. residents with pressure ulcers; 13 studies) or residents requiring a specific type of care (e.g. residents after discharge from a hospital; four studies). In most (31) of the studies, the alternative model of care focused on 'co‐ordination of care'. In three studies, the alternative models of care focused on 'who provides care' (e.g. nurse practitioner‐led care using best practice guide instead of GP‐led care) and in two studies, alternative models of care focused on 'where care is provided' (i.e. investigating alternative locations for the provision of care, for example within ACF versus outside of ACF). In four studies, the alternative models of care focused on the use of information and communications technology for the provision of care to ACF residents. In all studies, the alternative model of care was compared with usual care.
We found that, compared to usual care, alternative models of care may make little or no difference to the number of emergency department visits; however, the number of unplanned hospital admissions may be reduced. We are uncertain of the effect of alternative models of care on adverse events and adherence to clinical guideline‐recommended care compared with usual care. Alternative models of care may have little or no effect on ACF residents' health‐related quality of life and probably make little or no difference to mortality. Based on the findings of five studies that provided full economic evaluations (all alternative models of care focused on 'co‐ordination of care'), we are uncertain whether alternative models of care are more cost‐effective than usual care.
What are the limitations of the evidence?
Our confidence in the evidence is limited because participants in the studies were aware of which treatment they were getting. Usual care was poorly described by most of the studies. Usual care differs across countries and regions, so this lack of information limits our interpretation, contextualisation and generalisation of the comparisons. Not all of the studies provided data about outcomes we were looking to assess.
How up‐to‐date is this review?
The review authors searched for studies published up to October 2022.
Summary of findings
Summary of findings 1. Summary of findings: Any alternative model of care versus usual care.
| Any alternative model of care compared with usual care for residents of aged care facilities | ||||||
|
Patient or population: residents of aged care facilities Settings: residential aged care facility Intervention: any alternative model of care Comparison: usual care | ||||||
| Outcomes | Illustrative comparative risks* (95% CI) | Relative effect (95% CI) | No of participants (studies) | Certainty of the evidence (GRADE) | Comments | |
| Assumed risk | Corresponding risk | |||||
| With usual care | With alternative model of care | |||||
|
Emergency department (ED) visits: proportion of residents with at least one ED visit at longest follow‐up (follow‐up: 1 to 32 months) |
200 per 1000 | 2 more per 1000 (from 32 fewer to 40 more) | RR 1.01 (0.84 to 1.20) | 1276 (7) | ⊕⊕⊝⊝ lowa | Eleven studies reported on ED visits and measured this in different ways. Based on a meta‐analysis of 7 studies, alternative models of care may make little or no difference to the proportion of residents with at least one ED visit compared to usual care. Other measures were mean number of ED visits per resident and rate of ED visits per person‐time. We are uncertain of the effect of alternative models of care on these measures of ED visits as the certainty of the evidence for both of these outcomes is very low. Three studies not incorporated into the meta‐analyses reported the following: Haines 2020 reported a reduction in the mean number of unplanned hospital transfers per site in the intervention group, per 9‐week block; Wu 2010 reported that there were no ED visits in either group; Cavalieri 1993 reported that emergency room visits were "more frequent for the usual care group than the intervention group". |
|
Unplanned hospital admissions: proportion of residents with at least one unplanned hospital admission at longest follow‐up (follow‐up: 21 days to 32 months) |
320 per 1000 | 83 fewer per 1000 (141 fewer to 3 fewer) | RR 0.74 (0.56 to 0.99) | 1263 (8) | ⊕⊕⊝⊝ lowb | Twelve studies reported on unplanned hospital admissions and measured this in different ways. Based on a meta‐analysis of 8 studies, alternative models of care may reduce the proportion of residents with unplanned hospitalisations compared to usual care. Other measures were mean number of unplanned admissions per resident and rate of unplanned hospital admissions. While we are uncertain of the effect of alternative models of care on the mean number of unplanned admissions per resident, as the certainty of the evidence is very low,alternative models of care may make little or no difference to the rate of unplanned hospital admissions compared to usual care. Haines 2020 (not included in any meta‐analysis) reported a reduction in the mean number of unplanned hospital admissions per site, per 9‐week block in the intervention group. |
|
Adverse events/falls: proportion of residents with a fall at longest follow‐up (follow‐up: 1 to 24 months) |
255 per 1000 | 38 more per 1000 (from 43 fewer to 153 more) | RR 1.15 (0.83 to 1.60) | 1061 (3) | ⊕⊝⊝⊝ very lowc | Eight studies reported on adverse events (including falls, pressure ulcers and infections) and measured these outcomes in different ways. Six studies reported on falls. Based on a meta‐analysis of 3 studies, we are uncertain of the effect of alternative models of care on the proportion of residents with a fall compared to usual care,as the certainty of the evidence is very low. Other measures were mean number of falls per resident, rate of falls, proportion of residents with an injurious fall, mean number of injurious falls, incidence of pressure ulcers, proportion of residents with an infection, mean number of infections per resident and infection rate per person‐time. Alternative models of care may have little or no effect on the mean number of falls per resident compared to usual care. We are uncertain of the effect of alternative models of care on the rate of falls, proportion of residents with an injurious fall, mean number of injurious falls, incidence of pressure ulcers, proportion of residents with an infection, mean number of infections per resident and infection rate per person‐time as the certainty of the evidence for these outcomes is very low. |
|
Adherence to clinical guideline‐recommended care: proportion of residents with adequate antidepressant therapy at longest follow‐up (follow‐up: 3 months) |
45 per 1000 | 195 more per 1000 (from 4 more to 1125 more) | RR 5.29 (1.08 to 26.00) | 65 (1) | ⊕⊝⊝⊝ very lowd | Three studies reported on adherence to clinical guideline‐recommended care and measured it in different ways. Based on one study assessing adequate antidepressant therapy, we are uncertain of the effect of alternative models of care on adherence to guidelines compared to usual care as the certainty of the evidence is very low. Other measures of guideline‐recommended care were adequate antipsychotic therapy, adequate antibiotic prescription and medication appropriateness.We are uncertain of the effect of alternative models of care on these outcomesas the certainty of the evidence is very low. |
|
Health‐related quality of life (mean difference) at longest follow‐up (EQ‐5D, scale 0 to 1, higher is better) (follow‐up: 1 to 21 months) |
The mean change from baseline (in EQ‐5D‐3L index score) after 6 months in the usual care group was 0.07e | — | MD 0.016 lower (0.036 lower to 0.004 higher)f | 4016 (12) | ⊕⊕⊝⊝ lowg | Fourteen studies reported on health‐related quality of life. Based on a meta‐analysis of 12 studies, alternative models of care may have little or no effect on health‐related quality of life compared to usual care. Findings of the 2 studies not included in meta‐analysis: De Luca 2016 reported a higher median EUROQoL score in the intervention group compared to the usual care group; Harvey 2014 did not provide any data but reports the following regarding quality of life: "There were no significant differences between groups in quality of life at baseline and no significant changes within either group over time." |
|
Mortality: proportion of residents who died at longest follow‐up (follow‐up: 1 to 24 months) |
205 per 1000 | 6 more per 1000 (from 16 fewer to 33 more) | RR 1.03 (0.92 to 1.16) | 3881 (24) | ⊕⊕⊕⊝ moderateh | Twenty‐five studies reported on this outcome. Based on a meta‐analysis of 24 studies, alternative models of care probably make little or no difference tothe proportion of residents who died compared to usual care. Haines 2020 (not included in meta‐analysis) reported a higher mean number of deaths per site, per 9‐week block in the intervention group. |
|
Resource use: cost‐effectiveness evaluations (6 to 21 months) |
Not pooled | Not pooled | Not pooled | 2341 (5) | ⊕⊝⊝⊝ very lowi | Eleven studies reported on costs of care or cost‐effectiveness evaluations (or both). Due to the heterogeneity of the interventions, settings and study time frames, it was not possible to pool cost estimates. Based on 5 economic evaluations, we are uncertain of the cost‐effectiveness of alternative models of care compared to usual care as the certainty of the evidence is very low. Other reported measures included total cost of health care, cost of primary/secondary care, inpatient cost, ED admissions cost, medication costs, informal care costs, staff costs and intervention implementation costs. |
| *The basis for the assumed risk (e.g. the median control group risk across studies) is provided in footnotes. The corresponding risk (and its 95% confidence interval) is based on the assumed risk in the comparison group and the relative effect of the intervention (and its 95% CI). CI: confidence interval; ED: emergency department; MD: mean difference; RR: risk ratio | ||||||
| GRADE Working Group grades of evidence High certainty: Further research is very unlikely to change our confidence in the estimate of effect. Moderate certainty: Further research is likely to have an important impact on our confidence in the estimate of effect and may change the estimate. Low certainty: Further research is very likely to have an important impact on our confidence in the estimate of effect and is likely to change the estimate. Very low certainty: We are very uncertain about the estimate. | ||||||
aDowngraded once for serious risk of bias (all studies at high risk of performance bias, one study at high risk of detection bias) and once for serious imprecision (analyses not powered to detect important harm or benefit).
bDowngraded once for serious risk of bias (all studies at high risk of performance bias) and once for serious inconsistency (I2 = 59%).
cDowngraded once for serious risk of bias (two studies at unclear risk of selection and detection bias), once for serious inconsistency (I2 = 74%) and once for serious imprecision (very wide CIs, which include both no effect and important harm).
dDowngraded once for serious risk of bias (one study at high risk of performance bias), once for serious indirectness (one study limited to a population with mental health problems and intervention related to medication use, which limits the generalisability of findings to other care models/other resident populations) and twice for very serious imprecision (wide confidence intervals that include no appreciable benefit and very large benefit).
eData from usual care group in Man 2020. Man 2020 was deemed to be the most representative study (Stern 2014 (weight 21%) and Van den Block 2020 (weight 27.8%) ‐ no baseline SD provided for control groups).
fHealth‐related quality of life was assessed using different instruments in the eligible studies, so we combined the data using a standardised mean difference. We used the SD provided by Man 2020 (0.4 on a 0 to 1 EQ‐5D index scale) for quality of life at baseline in the usual care group to back‐translate the SMD (SMD ‐0.04, 95% CI ‐0.09 to 0.01) to the MD (Higgins 2021).
gDowngraded once for serious risk of bias (all studies at high risk of performance bias) and once for serious publication bias.
hDowngraded once for serious publication bias.
iDowngraded once for serious risk of bias (all studies at high risk of performance bias), once for serious inconsistency and once for serious imprecision.
Background
In almost every country in the world, the number and proportion of older people is increasing. It is projected that by 2050, one in six (16%) people in the world will be over 65 years of age, almost double the rate noted in 2019 of one in 11 (9%) (UN 2019). The number of people aged 80 years or older is projected to triple, from 143 million in 2019 to 426 million in 2050 (UN 2019).
Across Organisation for Economic Co‐operation and Development (OECD) countries, an average of 10.8% of people aged 65 years and over received long‐term care in 2017. This represents a 5% increase compared with 2007 (OECD 2019). Most OECD countries allocate approximately 1% to 1.5% of their gross domestic product (GDP) to long‐term care of the elderly. However, given the current ageing trends, public long‐term care expenditure is expected to at least double, and possibly triple, by 2050 (OECD 2011). Identifying the most efficient models of long‐term care that best serve the needs of older aged people has been included as a strategic objective in the WHO Global Strategy and Action Plan on Ageing and Health (WHO 2017).
Residents of aged care facilities (ACFs) are often frail with a number of chronic health conditions (e.g. diabetes or heart conditions) that require regular monitoring and management. In the event of an injury, altered mental state, acute infection, or exacerbation or complication of an underlying condition, residents require acute care services. Currently, people living in residential care are commonly transported to hospital for care that might otherwise be managed within the residential care facility. Available evidence suggests that complications associated with underlying conditions may be prevented with earlier identification of risk and appropriate management (Bowman 2001; Lemoyne 2019). Recent reviews have found that 4% to 55% of all acute transfers of nursing home residents are classified as inappropriate and are associated with a high risk of complications and mortality (Dwyer 2017; Lemoyne 2019).
Description of the condition
Hospitalisation of residents of ACFs is distressing and often burdensome for both the residents and their families, and potentially more costly for all (King 2013; Wong 2010). Locating specialised nurses, nursing teams, general practitioners (GPs) and specialist physicians (e.g. geriatricians) in ACFs, or improving collaboration between these healthcare professionals and ACF staff, may improve co‐ordination and quality of care, reduce unplanned hospital transfers, enhance resident well‐being and resident and staff satisfaction, and potentially reduce healthcare costs (Lemoyne 2019).
Description of the intervention
The way in which primary or secondary medical care (or a combination of these) is delivered to residents of ACFs is the main focus of this review. Our focus is not limited to a single model or intervention, but rather covers a number of alternative ways in which primary or secondary care can be organised and delivered to older adults living in ACFs. In the absence of agreed‐upon definitions, the term primary care is often used interchangeably with first level of contact with the healthcare system. Primary care may be provided by a range of professionals, including primary care physicians and nurses. Primary care covers preventive, curative and rehabilitative services (OECD 2023; WHO 2023). Secondary care is specialist care, usually following a referral from a primary care provider (WHO 2023). Our review will investigate the effectiveness and cost‐effectiveness of different models of providing health care in this population. Possible models of delivering medical care to residents of ACFs may include, but are not limited to, the following.
Hospital in‐reach models of care (provision of care in ACFs by hospital staff, as an alternative to in‐patient stay)
In‐reach services are provided by hospital staff to residents of ACFs requiring acute care. Services provided by in‐reach models may include advanced assessment and management of unwell or injured residents, provision of subcutaneous fluids and intramuscular medications, catheter or percutaneous endoscopic gastrostomy troubleshooting, and specialist palliative care support. An example of an in‐reach service model is Hospital in the Nursing Home (HiNH). In this model, clinical staff are allocated to manage older adults living in ACFs with actual or potential acute symptoms, which would otherwise require either an emergency department visit or hospital admission (Fan 2015).
Nurse‐led care alone or within the context of a complex care co‐ordination intervention
Examples of nurse‐led care include care delivered to residents of ACFs by nurse practitioners co‐located in the ACF and working in collaboration with GPs (primary care) (Arendts 2018) or gerontology nurse specialists co‐located in the ACF and providing staff education and care co‐ordination within a multidisciplinary team (Boyd 2014; Connolly 2013; Connolly 2015).
Provision of general practitioner services within ACFs
Such models include the Continuity of Care model, where GPs continue to provide care for long‐term patients when they move into an ACF through regular on‐site visits; the ACF Panel model, where GPs either take on patients from nearby residential ACFs or become the dedicated GP for a residential ACF; the GPs with Special Interest in Residential Aged Care model, where GPs provide regularly scheduled services to groups of patients in a number of different ACFs; the Longitudinal General Practice Team model, where GPs work with nurse practitioners to provide team‐based care to residents of ACFs; and ACF‐based models of GP care, where GPs are employed by, and have their practices located within, ACFs (Haines 2020; Reed 2015).
Multidisciplinary team care
Residents of ACFs often have multiple morbidities that require care from different healthcare professionals. Effective interventions for chronic diseases generally rely on multidisciplinary team approaches. Multidisciplinary integrated care at ACFs may be an alternative for providing care on request (Boorsma 2011a).
Provision of primary care or specialist services through video‐conferencing (telehealth) versus face‐to‐face
Modern technologies provide the ability to incorporate video conferencing/telehealth as part of medical care for the elderly without a need for travel. An example of the use of telehealth in nursing homes can be video consultations by a wound specialist for patients with problematic, non‐healing wounds (Dobke 2008).
How the intervention might work
Inadequate training or understaffing (or both) of ACFs’ workforces may limit their ability to manage the chronic or acute care needs of residents, resulting in increased emergency department visits and unplanned hospital admissions, some of which may be unnecessary. Not only are these costly, they are often traumatic for the ACF resident and their family.
Alternatively, in order to attend to residents' chronic or acute care needs, a GP could be on‐site, or an ACF staff member could be dedicated to co‐ordinating the delivery of care by both internally and externally located physicians. This may lead to improved access to guideline‐recommended and better co‐ordinated care, which is expected to result in reduced emergency department visits and unplanned hospital admissions. Well co‐ordinated and timely care, without unnecessary hospital transfers, is hypothesised to improve health outcomes of residents and to increase satisfaction with care among the residents, their families and staff. The benefits associated with reducing the number of hospital transfers and unplanned admissions may outweigh the resources needed to sustain the changes in care delivery, and potentially lead to cost savings. Interventions of interest and expected pathways to outcomes of interest are presented in Figure 1.
1.
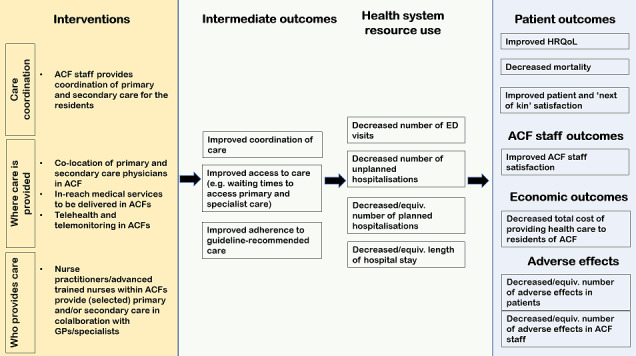
Intervention logic model
Why it is important to do this review
This topic is important given that the increasing number and proportion of older people globally will increase the demand for efficient and effective aged care services (Davies 2011). The costs of caring for older people, particularly residents of ACFs, who are often frail with multiple comorbidities, is significant and increasing (OECD 2011). Delivering clinically effective and cost‐effective primary or specialist medical or nursing care (or both) to residents of ACFs will not only improve residents’ access to, and quality of, care, but may also reduce the rate of emergency department visits and unplanned hospital admissions. It is expected that this will improve the physical and psychological well‐being of ACF residents and their families, and ultimately reduce the total costs of providing medical care for older adults living in ACFs.
A variety of different models of providing better health care for residents of ACFs have been postulated and investigated. Our systematic review aims to comprehensively and systematically collate the available evidence of the effectiveness, safety and cost‐effectiveness of the different models of providing health care to residents of ACFs.
Objectives
Main objective
To assess the effectiveness and safety of alternative models of delivering primary or secondary health care (or both) to older adults living in ACFs.
Secondary objective
To assess the cost‐effectiveness of the alternative models.
Methods
Criteria for considering studies for this review
Types of studies
We included randomised controlled trials, including cluster‐randomised trials. Cluster‐randomised trials were required to have at least two intervention and two control sites to be considered eligible for inclusion, to reduce potential bias from site‐specific confounding (EPOC 2017). Cross‐over trials were not included.
The following types of economic evaluation studies were considered for inclusion: full economic evaluation studies (i.e. cost‐effectiveness analyses, cost‐utility analyses, cost‐benefit analyses), partial economic evaluations (i.e. cost analyses, cost‐description studies, cost‐outcome descriptions), and randomised trials reporting more limited information, such as estimates of resource use or costs associated with intervention(s) and comparator(s). We only considered relevant health economics studies conducted alongside effectiveness studies that met the eligibility criteria for the effectiveness component of this review (Aluko 2020). We considered studies irrespective of their publication date, publication status or language of publication. Where possible, we translated the studies published in non‐English languages.
Types of participants
Eligible study participants included healthcare professionals delivering or co‐ordinating healthcare to older adults living in ACFs, and older people residing in a care home as their place of permanent abode. We defined older people as those aged 60 years or over, and we included all participants in studies where the mean age was 60 years or more.
Aged care facilities are called different things in different countries. The terms “care home”, “residential aged care facility”, “nursing home”, “aged care”, “residential/subacute/extended aged care settings”, “restorative care”, “rest homes”, “skilled nursing facilities” and “homes for the aged” are used interchangeably. No matter what the facility is called, only facilities that meet all the criteria for ‘care home’ set out in Crocker 2013 and Ward 2008 were eligible for inclusion. Such facilities provide:
communal living facilities for long‐term care (as opposed to hospital, where there is an expectation that this care is time‐limited);
overnight accommodation;
nursing or personal care; and
care for people with illness, disability or dependence.
Types of interventions
Eligible interventions focused on either ways of delivering primary or secondary health care (or both) or ways of co‐ordinating the delivery of this care. The term primary care is often used interchangeably with first level of contact with the healthcare system. Primary care may be provided by a range of professionals including primary care physicians and nurses and covers preventive, curative and rehabilitative services (OECD 2023; WHO 2023). Secondary care is specialist care, usually following a referral from a primary care provider (WHO 2023).
Eligible models of care delivery had to investigate changes to at least one of the following delivery arrangement domains (Cochrane Effective Practice and Organisation of Care (EPOC) taxonomy of health system interventions; EPOC 2015):
co‐ordination of the primary or secondary (or both) health care, or management of the primary or specialist (or both) care processes (e.g. continuity of care models; protocols for care decisions or decision support; nurse practitioners working collaboratively with GPs; care provision by multidisciplinary teams);
where the primary or secondary (or both) health care is provided (e.g. co‐location of primary medical care or secondary care services within ACFs; Hospital in the Nursing Home; in‐reach of specialists or specialised nursing teams for routine or emergency care; telemedicine to assist with provision of primary/secondary care services to residents of ACFs); or
who provides the primary or secondary (or both) health care (e.g. provision of primary or secondary care services (or both) to residents of ACFs by nurse practitioners; medical treatment provided by multidisciplinary teams of experts).
We considered studies irrespective of the medical specialisation of the healthcare professional involved in delivering the various models of health care. We excluded care provided by allied health professionals (e.g. physiotherapy) or pharmacist‐led interventions, except when they were part of a multidisciplinary team or were providing primary or specialist medical care to residents of ACFs.
Eligible comparators included usual care or another model of care, as defined by the trialists. A key aspect of this review is that both the experimental group and the comparison group needed to receive the same primary or specialist healthcare services, just in a different way (e.g. primary care services provided by a GP who is a staff member of the ACF versus provision of primary care to ACF residents on request by an external GP). A detailed description of usual care was important for a meaningful interpretation of the effects of interventions in this review, because the organisation and delivery of medical care to residents in ACFs was expected to be different within and between countries. We described the interventions, including usual care, using the Template for Intervention Description and Replication (TIDieR) checklist (Hoffmann 2014).
We excluded studies focusing on ways of providing dental care. We also excluded studies looking at more effective ways of providing general care to ACF residents, such as bathing or feeding. We excluded studies focused primarily on nursing staffing models for existing staff employed within ACFs (i.e. how existing ACF nursing and personal care attendant staffing is organised to meet resident/patient needs, including the mix and level of skills, and staffing ratios), as this is the focus of a separate Cochrane review (Hodgkinson 2011).
Medication review for older people in residential care is a focus of several other Cochrane reviews (Alldred 2016; LaMantia 2010; Rankin 2018), so this intervention was not considered in this review unless it was part of a more complex intervention (e.g. general medical in‐reach review) that includes other eligible elements. Studies investigating the introduction of new treatments (i.e. adding services such as cognitive behavioural therapy for dementia; or social prescribing, e.g. visits from school children or music therapy providers), were not considered in this review. Interventions focused exclusively on education of staff, skill development or quality improvement (e.g. interventions that focus primarily on education, information campaigns, audit and feedback, provider reminders, computerised medical records, enhanced automated patient monitoring systems, financial incentives, guideline implementation or guideline adherence) were also outside the scope of this review.
Types of outcome measures
The outcomes in this review were designed to capture the key health, quality‐of‐care and economic effects of alternative ways of delivering or co‐ordinating healthcare (or both) to older adults living in ACFs. While cognitive and functional status outcomes are relevant outcomes to this patient population, they were not the focus of this review, which aims to investigate the effects of different ways of delivering or co‐ordinating the same primary or secondary healthcare. Studies were not selected based on outcomes reported.
Primary outcomes
Emergency department visits, reported at longest follow‐up
Unplanned hospital admissions, reported at longest follow‐up
Adverse effects (defined as infections, falls and pressure ulcers), reported at longest follow‐up
Secondary outcomes
Adherence to clinical guideline‐recommended care, reported at longest follow‐up
Health‐related quality of life of residents, as measured by generic scales (e.g. 36‐item Short Form Health Survey (SF‐36) (mental component score) or EuroQol 5 dimensions (EQ5D)) at longest follow‐up. If no generic scale was provided, we used a disease‐specific quality of life scale, if available.
Mortality, reported at longest follow‐up
Resource use (i.e. resources needed to deliver the intervention, total costs of care or types of care (e.g. hospital care, GP care), economic outcomes from cost‐effectiveness analyses, cost‐utility analyses or cost‐benefit analyses)
Access to primary or specialist healthcare services (e.g. waiting times to see the GP or specialist), reported at longest follow‐up
Any hospital admissions, reported at longest follow‐up
Length of stay for any hospital admission, reported at longest follow‐up
Residents’ satisfaction with the health care received, as measured by the trial and reported at longest follow‐up
'Next of kin' satisfaction with the health care provided to the resident, as measured by the trial and reported at longest follow‐up
Work‐related satisfaction of ACF staff, pertaining to the health care provided to the residents, as measured in the trial and reported at longest follow‐up
Work‐related stress/burnout of ACF staff, as measured in the trial and reported at longest follow‐up
Search methods for identification of studies
Electronic searches
The review authors developed the search strategies in consultation with the Cochrane EPOC Information Specialist. We searched the following databases for primary studies, from inception to 26 October 2022. See Appendix 1 for search strategies.
Cochrane Central Register of Controlled Trials (CENTRAL 2022, Issue 10), in the Cochrane Library;
MEDLINE via Ovid (1946 to 26 October 2022);
Embase via Ovid (1980 to 2022 week 43);
Age Line EBSCO (1944 to 2022 week 43);
CINAHL EBSCO (Cumulative Index to Nursing and Allied Health Literature) (1980 to 2022 week 43).
The following databases were searched to identify eligible economic evaluations:
NHS Economic Evaluation Database (NHS EED 2015, Issue 2);
Cost-Effectiveness Analysis Registry (CEA) 1976 to 2022 week 43;
MEDLINE Ovid from 2015 to 2022 week 43.
Search strategies comprised keywords and controlled vocabulary terms. We did not apply any limits on language and we searched all databases from inception to 26 October 2022. We used a study design filter to identify randomised trials. The study design filter was developed by the Cochrane EPOC Information Specialist, and published in our protocol, after peer review (Putrik 2021). It is a slight modification of the Cochrane highly sensitive search strategy (Lefebvre 2021) and is widely used in EPOC reviews (Purgato 2023).
Searching other resources
To identify completed but unpublished, ongoing and planned trials, the following registries were searched on 26 October 2022:
World Health Organization International Clinical Trials Registry Platform (WHO ICTRP; www.who.int/ictrp);
US National Institutes of Health Ongoing Trials Register (ClinicalTrials.gov; www.clinicaltrials.gov).
We searched the Cochrane Database of Systematic Reviews (CDSR) and the Database of Abstracts of Reviews of Effects (DARE) for related systematic reviews. We screened the included studies of these reviews to identify any additional eligible studies. We also handsearched reference lists of all included studies to identify additional potentially eligible studies. We contacted authors of included studies to clarify reported published information, or to seek unpublished results/data if needed. See Appendix 1 for search strategies.
Data collection and analysis
Selection of studies
We imported all records retrieved from the search into Covidence (www.covidence.org) to facilitate deduplication and subsequent independent duplicate screening of titles and abstracts and potentially eligible full‐text papers. We also used Covidence to facilitate the assessment of risk of bias in included studies.
Two of four review authors (PP, LG, AL, HR) independently screened titles and abstracts for potentially eligible studies. The full texts of all potentially eligible studies were independently screened by two review authors (PP, LG, AL, HR) to identify eligible studies. We listed all studies excluded at this stage, together with reasons for exclusion, in the Characteristics of excluded studies table. We resolved any disagreement through discussion; if required, we consulted a senior author (DOC or RB).
We collated multiple reports of the same study so that each study rather than each published report is the unit of analysis in the review. We reported basic information on any eligible ongoing studies we identified. We recorded the study selection process in sufficient detail to complete a PRISMA flow diagram (Liberati 2009).
Data extraction and management
We adapted the Cochrane EPOC standard data collection form and used it to extract study characteristics and outcome data (EPOC 2017). We piloted the form on at least one eligible study in the review. Two review authors (PP, LG, AL, HR) independently extracted the following study characteristics from the included studies:
Methods: study design, number of study centres and location, study setting, withdrawals, date of study, duration of follow‐up.
Participants: number, mean age, age range, gender, severity of condition(s) where relevant, inclusion criteria, exclusion criteria, other relevant ACF resident characteristics.
Intervention and categorised: classified according to the EPOC taxonomy of health system interventions and described using TIDieR checklist (Hoffmann 2014), including the nature of primary or specialist healthcare provided.
Outcomes: all outcomes planned and reported on, with time points and methods of data collection.
Notes: funding source for trial, conflicts of interest of trial authors, ethical approval.
We developed a data extraction form for economic evaluations based on the format and guidelines used to produce structured abstracts of economic evaluations for inclusion in the NHS EED, adapted to the specific requirements of this review. We resolved differences in extracted data by consensus or by involving a fourth review author (DOC). If important information was missing from the full‐text article, we contacted the authors of the publication to obtain it.
Assessment of risk of bias in included studies
Two review authors (PP, LN, AL, HR) independently assessed risk of bias for each included study using the Cochrane risk of bias tool (Higgins 2011) and additional criteria specified by Cochrane EPOC (EPOC 2017). Any disagreement was resolved by discussion or by consulting a senior author (DOC or RB). The risk of bias assessment included the following domains.
Random sequence generation
Allocation concealment
Blinding of participants and personnel
Blinding of outcome assessment
Incomplete outcome data
Selective outcome reporting
Other bias (bias due to problems not covered by sources of bias specified above; for cluster‐randomised trials, the following specific issues were assessed: recruitment bias, baseline imbalance, protection against contamination, incorrect analysis)
We judged each study to be at high, low or unclear risk of bias for each domain listed above, and we provided justification for our judgement in the risk of bias table for each study. We assessed information from study reports, protocols, trial registration documents or correspondence with trialists to support our judgement. Where information on risk of bias is related to correspondence with trialists or unpublished data, we noted this in the risk of bias table. We summarised the risk of bias judgements across different studies for each of the domains listed and included the summary figure generated by Review Manager software (Review Manager 2020). If the clusters of a cluster‐randomised trial were all allocated to the treatment groups at the same time, we judged allocation concealment to be low risk, even if the study authors did not provide explicit information regarding the allocation concealment process.
When considering intervention effects, we took account of the risk of bias for the studies that contribute to that outcome and incorporated this into our judgements about the certainty of the evidence. A summary assessment of the risk of bias of each study was done using three key domains: sequence generation and allocation concealment (selection bias), and blinding of outcome assessors (detection bias). Studies were considered to be at low risk of bias if the three key domains were at low risk of bias; unclear risk of bias if at least one of the domains was unclear risk of bias and none of the domains were at high risk of bias; and high risk of bias if at least one of the key domains was at high risk of bias.
Each economic evaluation was classified as: (1) a type of full economic evaluation; (2) a type of partial economic evaluation; or (3) a type of effectiveness study (e.g. a randomised trial) reporting more limited information on the resource use or costs associated with an intervention. For types (1) and (2), the economic studies were classified as a single study design (e.g. an economic evaluation alongside a randomised trial) or a model‐based evaluation, involving the synthesis of evidence derived from multiple studies or data sources.
We used the CHEC checklist to assess the quality of reporting of health economics studies (Evers 2005). We assessed whether the included studies described methods, assumptions, data and possible biases in a way that is transparent and is easily accessible to critical readers (Aluko 2020). In assessing the methodological quality of economic evaluations, we aimed to identify the key uncertainties in each study and assess the applicability and relevance of each economic evaluation to different settings.
Measures of treatment effect
We estimated the effect of the intervention on dichotomous outcomes using risk ratios, together with the appropriate associated 95% confidence interval. We used the number of patients with the event as the numerator and the number of participants randomised to the group as the denominator. For rate data (e.g. number of events in a period of time) we have used a rate ratio, which compares the rate of events in the two groups by dividing one by the other. The natural logarithms of the rate ratios were combined across studies using the generic inverse variance method.
We estimated the effect of the intervention on continuous outcomes by calculating the mean difference (MD), together with the appropriate associated 95% confidence interval. We used a standardised mean difference (SMD), with 95% confidence interval, to combine data from trials that measure the same outcome but use different scales. We standardised the data to their effect size by dividing the estimated mean difference by its standard deviation. We always back‐translated to an understandable unit to make it meaningful to the users of the review. If some studies reported endpoint data and others reported change‐from‐baseline data (with standard errors), we combined these in the meta‐analysis if the outcomes were reported using the same scale (Deeks 2020). We ensured that an increase in scores for continuous outcomes could be interpreted in the same way for each outcome. We explained the direction of effect to the reader, and reported where the directions were reversed if this was necessary. We calculated the MD or SMD based on the number of participants analysed at that time point. If the number of participants analysed is not presented for each time point, we used the number of participants randomised to each group at baseline and noted this in the table of included studies 'Notes' section.
For all included outcomes, we prepared a structured summary of effects that included the intervention effect estimate, its 95% confidence interval, P value and the method of statistical analysis used to calculate it.
Unit of analysis issues
We checked to see that analyses in the eligible studies were performed at the same level as the allocation to ensure that unit of analysis errors were avoided. Data from cluster‐randomised trials had to be appropriately adjusted for clustering when presenting the data at the individual patient level. If the data from cluster‐randomised trials were not adjusted correctly, we re‐analysed the results based on guidance provided in Chapter 23 of the Cochrane Handbook for Systematic Reviews of Interventions (Higgins 2019). Adjusting for clustering required dividing the original sample size (and number of events in the case of dichotomous data) by the design effect, which was calculated from the average cluster size and the intra‐cluster correlation coefficient (ICC). Where the ICC was not reported, we imputed the most commonly reported value from studies, where it was reported.
Dealing with missing data
If data were missing, we contacted study investigators in order to verify key study characteristics and obtain missing outcome data where possible (e.g. when a study was identified as abstract only). For all outcomes, we analysed the data on an intention‐to‐treat basis. That is, we included all participants randomised to each group in the analyses, and analysed data according to initial group allocation, irrespective of whether or not participants received, or complied with, the planned intervention. Where intention‐to‐treat analyses were not possible due to missing data, we conducted available case analysis; that is, we only included the number of participants in whom the outcome was measured in both the intervention and control groups.
Assessment of heterogeneity
Where a meta‐analysis of the study data was feasible, we used the I² statistic to assess heterogeneity among the trials in each analysis. If we identified substantial heterogeneity (I2 = 50% to 90%) or considerable heterogeneity (I2 = 75% to 100%) (Deeks 2020), we noted this in the text and explored this heterogeneity through the pre‐specified subgroup analyses (see Subgroup analysis and investigation of heterogeneity). We used caution in interpreting meta‐analysis results with high levels of unexplained heterogeneity.
Assessment of reporting biases
If we were unable to contact study authors to obtain missing outcome data, or they could not provide it, and the missing data were thought to introduce serious bias, we explored the impact of including such studies in the overall assessment of results. Where we identified more than 10 studies reporting on the same outcome, we generated funnel plots using Review Manager software (Review Manager 2020) and visually examined them for asymmetry, to explore possible reporting or publication biases (Higgins 2019; Sterne 2011).
For the economic evaluation, a common reporting bias is the non‐reporting of planned economic evaluations. Wherever possible, we followed up studies that planned to do an economic evaluation in the study protocol but had not yet reported or published these findings, in order to access these data.
Data synthesis
We combined study data in meta‐analyses only when it was meaningful to do so, i.e. if the interventions, participants, outcomes and the underlying question were similar enough for pooling to make sense. We carried out the statistical analysis using Review Manager software (Review Manager 2020). We used a random‐effects model to combine the data, as there is heterogeneity between studies attributable to the different settings, populations and interventions (for example, different models of care, with different usual care protocols, varying skills of the nursing staff, age and disease condition of ACF residents).
We assessed the combined effect of intervention using the standardised mean difference (SMD) for continuous outcomes and risk ratio (RR) for dichotomous outcomes and analysed using the inverse variance and Mantel‐Haenszel methods, respectively (Deeks 2020). For cluster‐randomised trials, we either used the adjusted data as provided by the study authors, or we adjusted the unadjusted/raw data, using either the ICC provided by the study authors or a conventional ICC of 0.05 prior to the inclusion in meta‐analysis.
If trialists report medians and interquartile ranges, it may be because their data are not normally distributed. Where this was the case, we made a note of this and considered the implications of the skewed data on the study findings. If a study had multiple trial arms, we extracted and analysed data from the relevant arms. Where two comparisons (e.g. intervention A versus usual care and intervention B versus usual care) must be entered into the same meta‐analysis, we halved the control group to avoid double‐counting.
Study authors used different ways to present outcome data, both within and across studies. We presented the findings and the certainty of the evidence for all of the analyses. We selected one analysis per outcome as a primary analysis, based on the outcome with the most evidence (most number of studies). The primary analysis for each outcome is reported in the summary of findings table, with the findings of the other analyses incorporated into the 'Comments' section of the table. Only the primary analyses were subjected to subgroup and sensitivity analyses, where necessary.
There are currently no agreed‐upon methods for pooling combined estimates of cost‐effectiveness, extracted from multiple economic evaluations, using meta‐analysis or other quantitative synthesis methods. However, if comparable measures of resource use and costs were available from two or more studies undertaken in a similar setting for a common intervention and comparator, we pooled these using meta‐analysis.
We adjusted cost estimates collected from multiple studies to a common reference year and currency using a two‐step process. Firstly, we converted the reported currency to Australian dollars using the Purchasing Power Parity (PPP) between the reported currency and the Australian dollar in the year for which each study reported costs had been estimated (https://data.oecd.org/conversion/purchasing-power-parities-ppp.htm). Secondly, we updated the converted cost estimates to 2021 cost values using the Australian Consumer Price Index for health expenditure (https://www.abs.gov.au/statistics/economy/price-indexes-and-inflation/monthly-consumer-price-index-indicator/). Where meta‐analyses of resource use or cost data were conducted, we included a structured summary in the 'Results' section to comment on the direction and magnitude of results and their precision. Where meta‐analyses could not be conducted, we provided a summary of the results of included economic evaluations in a table, supplemented by a structured summary description in the 'Results'.
Subgroup analysis and investigation of heterogeneity
Where possible, we conducted subgroup analyses for the following factors.
Type of model according to relevant EPOC delivery arrangement categories, i.e. where care is provided; who provides care; co‐ordination of care.
Type of health care being provided, i.e. primary, secondary.
Age of the ACF patients (less than 80 years versus 80 years or more): increasing age is often associated with decreasing physical/psychological well‐being, so it is possible that different models are more or less effective in very old residents.
Type of condition being treated: it is possible that different models are more effective for different conditions (e.g. patients with dementia might respond differently to a particular model of care compared to patients with congestive heart failure).
Sensitivity analysis
Where possible, we performed the following sensitivity analyses to assess the robustness of our conclusions and explore their impact on effect sizes.
Restricting the analysis to studies with a low risk of bias.
Assessing the impact of timing of assessment: short‐term (up to 12 months; if multiple time points were available, we selected the closest to six months) and longer‐term (12 to 24 months; if multiple time points were available, we selected the closest to 18 months).
We conducted the review according to the published protocol and reported any deviations from it in the Differences between protocol and review section of the review.
Summary of findings and assessment of the certainty of the evidence
We created a summary of findings table for the main intervention comparison: any alternative model of care versus usual care. Due to the expected heterogeneity across interventions, we considered creating additional summary of findings tables to reflect findings based on different interventions with similar content (e.g. care provided by multidisciplinary teams or care provided via teleconsultations at a distance). However, due to the limited evidence available per EPOC intervention category, we felt that it would not be meaningful to create additional summary of findings tables. We had planned to split comparisons according to the characteristics of the control intervention if 'usual care' was considered substantially different across trials. Usual care was not well described in most studies, which did not allow further splitting of comparison groups in a meaningful way.
The following outcomes were included in the summary of findings table, together with the certainty of the evidence for each (findings of the additional analyses for each outcome were included in the comments section): proportion of residents with at least one emergency department (ED) visit; proportion of residents with at least one unplanned hospital admission; adverse events ‐ proportion of residents with a fall; adherence to clinical guideline‐recommended care ‐ proportion of residents receiving adequate antidepressant therapy; mean health‐related quality of life per resident; proportion of residents who died; and total costs of care. No other important outcomes emerged during the review process.
Using GRADEpro GDT software (GRADEpro GDT), two of the review authors (PP, LN) independently, and in duplicate, assessed the certainty of the evidence (high, moderate, low or very low) using the five GRADE considerations (risk of bias, consistency of effect, imprecision, indirectness and publication bias) (Guyatt 2008; Higgins 2019). We were guided by the methods and recommendations described in Chapter 14 of the Cochrane Handbook for Systematic Reviews of Interventions (Higgins 2019), and the EPOC worksheets (EPOC 2015). We provided justification for our decisions using table footnotes and we inserted comments to aid readers' understanding of the findings, where necessary. These decisions were checked by all authors and any disagreements on certainty ratings were resolved by discussion.
If a study provided data on an outcome, but these data could not be included in the meta‐analyses, we added a comment to the summary of findings table, noting if the findings support or contradict the summary estimate of effect from the meta‐analyses. We used plain language statements to report these findings in the review (Cochrane Norway 2019).
In order to be consistent with our judgement, we used the following rules when deciding whether or not to downgrade for imprecision (Schünemann 2022):
If the CI includes no effect AND appreciable harm/benefit, we conclude there is serious imprecision. RR < 0.75 or RR > 1.25 are interpreted as appreciable harm or benefit.
If the CI does not include 'no effect', we calculate the sample size that would be needed for an adequately powered individual study. If the number of participants exceeds this number, precision is sufficient.
If the CI includes no effect and NO appreciable harm/benefit, we calculate the sample size that would be needed for an adequately powered individual study. If the number of participants exceeds this number, precision is sufficient.
Results
Description of studies
Results of the search
A PRISMA flow diagram of the screening and selection process is presented in Figure 2. The search identified 9372 records. After removal of duplicates, we screened 6412 records (6358 studies). We retrieved 184 studies for full‐text screening. There were 40 trials that met our inclusion criteria (Agar 2017; Arendts 2018; Bellantonio 2008; Boorsma 2011a; Boyd 2014; Brodaty 2003; Cavalieri 1993; Chapman 2007; Connolly 2015; Cordato 2018; Crotty 2004; Crotty 2019; De Luca 2016; Dy 2013; Forbat 2020; Grabowski 2014; Haines 2020; Harvey 2014; Kim 2020; Kolcu 2020; Kotynia‐English 2005; Kovach 2006; Leontjevas 2013; Lichtwarck 2018; Lin 2010; Lin 2014; Loeb 2005; Loeb 2006; Man 2020; McSweeney 2012; Neyens 2009; Pieper 2016; Rubenstein 1990; Rutten 2022; Stern 2014; Temkin‐Greener 2018; Uy 2008; Van den Block 2020; Wu 2010; Zwijsen 2014).
2.
Study flow diagram
We excluded 125 studies: 61 had not evaluated an alternative model of care (wrong intervention), 39 used ineligible study designs, 21 studies were conducted in a setting other than an ACF (wrong setting) and four had an ineligible study population (see Excluded studies). Five studies were labelled as awaiting classification; see Characteristics of studies awaiting classification (Bagaragaza 2021; Bath 2001; Palmer 2020; Sillies 2022; Umpierrez 2021).
We identified 14 ongoing trials; see Characteristics of ongoing studies (Brucken 2022; Choi 2020; Dantoine 2019; Kaasalainen 2019; Kapp 2022; Moore 2022; Muller 2020; Papaioannou 2021; Piau 2018; Sourdet 2018; Spichiger 2021; Sunner 2020; Tchalla 2019; Tesky 2019).
Included studies
A description of the 40 included trials (21,787 participants (Boyd 2014, Grabowski 2014 and Haines 2020 only reported number of beds; four studies reported staff outcomes, 5856 participants)) is provided in the Characteristics of included studies table. A brief description of the study design, population, intervention and comparator in the included studies is provided in Table 2 and below.
1. Brief description of characteristics of included studies.
| Study ID | Design | Population | Intervention | Comparator (usual care) |
| WHO PROVIDES CARE (staffing models) | ||||
|
Haines 2020 Australia |
Stepped‐wedge cRCT | Residents of ACFs, not further limited to a specific subgroup | GP co‐located in ACF | Residents seen by external GPs not directly linked with facility staff |
| WHO PROVIDES CARE (Role expansion or task shifting) | ||||
|
Arendts 2018 Australia |
cRCT | Residents of ACFs, not further limited to a specific subgroup | Nurse practitioners led care using best practice guide | Residents received usual care and were assigned to GPs who were responsible for their care. Neither NPs nor the resource folder of best practice guidelines were available. |
|
Kolcu 2020 Turkey |
RCT | Residents of ACFs with hypertension | A nurse‐led hypertension management programme | The participants in the control group received the routine care provided in their nursing home (clinical evaluation every 6 months, procurement and administration of anti‐hypertension medications, and blood pressure measurement twice a day and when patients reported feeling unwell) |
| WHERE CARE IS PROVIDED (Site of service delivery) | ||||
|
Man 2020 Australia |
cRCT | Residents of ACFs with visual impairment |
Residential ocular care (ROC) model The ROC model of eye care includes an on‐site eye examination by an optometrist with expertise in domiciliary and low vision care. Four intervention options were provided to help improve vision based on the individual participants’ eye history. These include: (1) refraction and spectacle provision; (2) cataract surgery; (3) referral to an ophthalmologist for medical and surgical treatments for conditions likely to cause loss of sight or ocular discomfort; and (4) low vision rehabilitation for untreatable eye disease. If a clinical need is identified, participants will be eligible to receive more than one intervention pathway (e.g. spectacles and low vision rehabilitation aids/services). For all pathways, transportation costs for initial consultations and for up to 2 follow‐up consultations (to either a public or private care provider) were funded by the study. |
Residents with visual impairment in the usual care group were referred for an evaluation to the eye care service associated with the facility or a practitioner of their choice |
|
Uy 2008 Australia |
RCT | Residents of ACFs recovering after hip fracture | Inpatient multidisciplinary rehabilitation programme | Residents were discharged back to the RACF soon after surgery for the hip fracture |
| COORDINATION OF CARE (Teams) | ||||
|
Boorsma 2011a the Netherlands |
cRCT | Residents of ACFs, not further limited to a specific subgroup | The multidisciplinary integrated care model | The GP was responsible for medical care and offered it on request. There was neither co‐ordination nor structured planning of care. Multidisciplinary meetings were mostly not attended by the family physicians. |
|
Boyd 2014 New Zealand |
cRCT | Residents of ACFs, not further limited to a specific subgroup | Geriatric nurse specialist (GNS)‐led care including quality improvement, staff education and multidisciplinary care (The Residential Aged Care Integration Program (RACIP)) | Comparison facilities did not receive GNS on‐site intervention |
|
Connolly 2015 New Zealand |
cRCT | Residents of ACFs, not further limited to a specific subgroup | GNS‐led care including quality improvement, staff education and multidisciplinary care (Aged Care Healthcare Utilization Study (ARCHUS)) | Residents in control facilities received usual District Health Boards support, which did not include any of the elements listed in the intervention description |
|
Bellantonio 2008 USA |
RCT | Residents of RACFs with mental health conditions or behavioural problems | Multidisciplinary team care | Usual clinical care consisted of a medical evaluation conducted by the resident’s primary care physician 30 days before move‐in or within 7 days of admission, as per facility policy. The content and subsequent frequency of medical evaluations was at the discretion of the primary care physician; no team approach. |
|
Brodaty 2003 Australia |
RCT | Residents of ACFs with mental health conditions or behavioural problems | Arm 1: Multidisciplinary psychogeriatric case management Arm 2: Multidisciplinary team assessment with resulting treatment plan provided to a GP |
Immediate feedback was provided if psychopathology that was a danger to the resident, e.g. suicidality, was uncovered |
|
Chapman 2007 USA |
RCT | Residents of ACFs with mental health conditions or behavioural problems | Multidisciplinary team care (Advanced Illness Care Teams (AICT) intervention) | Residents received all the services typically provided by the facility, including medication management and monitoring, ongoing nursing care, social‐recreational activities, pastoral care, occupational and physical therapies, and social work services |
|
Crotty 2004 Australia |
cRCT | Residents of ACFs with mental health conditions or behavioural problems | Multidisciplinary case conferencing | Not described |
|
Lin 2010 Taiwan |
RCT | Residents of ACFs, not further limited to a specific subgroup | A hospital‐based (outreach) multidisciplinary approach to improve nutritional status of RACF residents | In the control group, usual care, including a medical doctor, nurse and pharmacist, was adopted for each participant |
|
Leontjevas 2013 The Netherlands |
Stepped‐wedge cRCT | Residents of ACFs with mental health conditions or behavioural problems | Act in Case of Depression (AiD) Multidisciplinary care programme | When the units were not receiving the intervention, no specific information about AiD was provided to nursing‐home staff and residents. No structural approach to depression management was used: depression was assessed after indications of possible depression were reported by nursing staff, a resident or any other informant; teams did not use multidisciplinary pathways for depression treatment, which was provided ad hoc and was mainly in the form of drugs |
|
McSweeney 2012 Australia |
cRCT | Residents of RACFs with mental health conditions or behavioural problems | Multidisciplinary team care | Control RACFs participated in the assessment component of the study, but no advice was offered regarding the management of depression during the intervention phase |
|
Neyens 2009 the Netherlands |
cRCT | Residents of ACFs with mental health conditions or behavioural problems | Multifactorial fall prevention programme applied by a multidisciplinary team | Not described |
|
Temkin‐Greener 2018 USA |
cRCT | Residents of ACFs, not further limited to a specific subgroup | Palliative care through teamwork (IMPACTT) | Not described in the published report. Additional information provided by authors via email: “Usual care meant no active palliative care teams operating on site. While palliative care may be provided in US nursing homes, largely via a contractual relationship with hospice, on site palliative care teams do not exist” |
|
Zwijsen 2014 The Netherlands |
Stepped‐wedge cRCT | Residents of ACFs with mental health conditions or behavioural problems | Multidisciplinary team care | Not described |
|
Stern 2014 Canada |
Stepped‐wedge cRCT | Residents of ACFs with pressure ulcers | Enhanced Multidisciplinary Team (EMDT) care | Wound care within RACFs was typically provided by RNs, RPNs, personal support workers and nutritionists, who may or may not have had expertise in wound care. Access to other disciplines was available, typically on a reactive basis. |
|
Wu 2010 Taiwan |
cRCT | Residents of ACFs who are highly disabled | Multidisciplinary team care | Participants were provided usual nursing and personal care with some professional care (i.e. physician, physical therapist and dietitian visits) when necessary |
|
Crotty 2019 Australia |
RCT | Residents of ACFs recovering after hip fracture | In‐reach multidisciplinary rehabilitation | Participants continued treatments (which may include sessions of physiotherapy) according to usual practice in the RACF. The control group on all sites will receive orthogeriatric care in hospital and medical care from a general practitioner after discharge. |
| COORDINATION OF CARE (Discharge planning) | ||||
| Cordato 2018 Australia | RCT | Residents of ACFs discharged back to ACF after hospital admission | Regular Early Assessment Post‐Discharge (REAP) following acute hospitalisation protocol of co‐ordinated specialist geriatrician and nurse practitioner visits | Usual post‐discharge care administered by their usual general practitioner (or primary care physician) and nursing staff at their RACF |
|
Harvey 2014 Australia |
RCT | Residents of ACFs discharged back to ACF after hospital admission | Geriatrician‐led discharge from hospital to RACF (The Residential Care Intervention Program in the Elderly (RECIPE) | The usual care group was managed by the treating medical unit according to standard hospital protocols and received standard discharge planning, with follow‐up at the RACF by their primary care physician service |
| COORDINATION OF CARE (Case management) | ||||
|
Agar 2017 Australia |
cRCT | Residents of RACFs with mental health conditions or behavioural problems | Facilitated case conferencing with family, multidisciplinary nursing home staff and external health professionals (e.g. general practitioners (GPs)) | No staff education, training or support was provided. No restrictions were placed on nursing homes’ education programme, or approach to care planning and decision‐making. |
|
Forbat 2020 Australia |
Stepped‐wedge cRCT | Residents of ACFs with short prognosis and high symptom burden | Specialist Palliative Care Needs Rounds (triage meetings, case‐based education, case conferences) | Usual care involves access to the specialist palliative care team’s two nurses who work in residential aged care. No embedded ‘triage’ element in the form of the needs rounds and limited case‐based education for staff. Essentially, the usual care is reactive, whereas the trial intervention is proactive and anticipatory. |
|
Lichtwarck 2018 Norway |
cRCT | Residents of ACFs with mental health conditions or behavioural problems | Intervention arm: Targeted Interdisciplinary Model for Evaluation and Treatment of Neuropsychiatric Symptoms (TIME) | Brief education‐only intervention. The staff in both the intervention and control nursing homes were offered a 2‐hour lecture covering dementia and NPS. |
|
Van den Block 2020 Belgium, England, Finland, Italy, the Netherlands, Poland and Switzerland |
cRCT | Residents of ACFs, not further limited to a specific subgroup | Palliative Care for Older People (PACE) Steps to Success | Care as usual (no further details provided) |
| COORDINATION OF CARE (Care pathway) | ||||
|
Kotynia‐English 2005 Australia |
RCT | Residents of ACFs upon admission to the facility | Early psychiatric intervention (screening at admission followed by referral (in case of positive screening) to a multidisciplinary psychogeriatric team) | Subjects in the control group received standard care (i.e. positive screening did not automatically trigger a referral) |
|
Kovach 2006 USA |
cRCT | Residents of ACFs with mental health conditions or behavioural problems | Serial Trial Intervention (STI): clinical protocol designed to address the problems of pain and other unmet needs | The control group nurses received common misconceptions about ageing, the physical effects of ageing, reversible and irreversible causes of dementia, stages of Alzheimer’s disease, and various approaches to treating behaviours and physical conditions associated with dementia. Videotapes were shown on management of common behaviours associated with dementia. |
|
Loeb 2005 Canada |
cRCT | Residents of ACFs, not further limited to a specific subgroup | Diagnostic and treatment algorithm for urinary tract infections using a multifaceted approach | Nurses and physicians in control nursing homes were notified about the study and were informed about how data were going to be collected |
|
Loeb 2006 Canada |
cRCT | Residents of ACFs with pneumonia or lower respiratory tract infections | Clinical Pathway to assess whether patient needs to be transferred to hospital | Care for residents allocated to usual care treatment was left up to the resident’s physician (the physician and RACF staff made treatment decisions, including antimicrobial use and transfer to hospital) |
|
Pieper 2016 the Netherlands |
cRCT | Residents of ACFs with mental health conditions or behavioural problems | Stepwise Multidisciplinary Intervention for Challenging Behaviour in Advanced Dementia (STA OP!) | Healthcare professionals working on units in the control condition received training without the stepwise component and focused on general nursing skills, dementia management and pain. The nurses and nursing home physicians were informed which residents of their units have a CMAI, NPI‐NH or MDS‐RAI pain scale score higher than threshold at pre‐test (week 0). |
|
Rutten 2022 the Netherlands |
cRCT | Residents of ACFs with (suspected) urinary tract infections | An Electronic Health Record Integrated Decision Tool and Supportive interventions to improve antibiotic prescribing for UTIs | Care as usual is provided without any restrictions |
| COORDINATION OF CARE (Comprehensive geriatric assessment) | ||||
|
Cavalieri 1993 USA |
RCT | Residents of RACFs upon admission to the facility | Comprehensive Geriatric Assessment Team | Care following traditional medical model, in which patients are managed entirely by individual physicians who have not had formal training in geriatrics |
|
Rubenstein 1990 USA |
RCT | Residents of ACFs after fall | Comprehensive post‐fall assessment based on principles of geriatric assessment | Residents in the control group did not receive the assessment and no recommendations were transmitted |
| COORDINATION OF CARE (Continuity of care) | ||||
|
Kim 2020 South Korea |
Incomplete stepped‐wedge cRCT | Residents of ACFs, not further limited to a specific subgroup | Systems for Person‐centered Elder Care (SPEC) (Integrated care model based on Wagner’s Chronic Care Model) | While “the usual practice” may not be identical across RACFs, no RACF provided standardised CGA or implemented evidence passed care planning in a systematic way |
| INFORMATION AND COMMUNICATION TECHNOLOGY (Telemedicine) | ||||
|
De Luca 2016 Italy |
RCT | Residents of ACFs, not further limited to a specific subgroup | Telemonitoring for patient's vital signs | The control group received standard nursing care |
|
Dy 2013 USA |
RCT | Residents of ACFs with diabetes | Use of telemedicine to improve glycaemic management | Usual care (not described) |
|
Grabowski 2014 USA |
cRCT | Residents of ACFs, not further limited to a specific subgroup | Telemedicine consultation during off‐hours | Evening or weekend calls were directed to the covering physician in the group practice, with off‐hours care typically provided by telephone from a remote location |
|
Lin 2014 Taiwan |
RCT | Residents of ACFs with chronic stroke | Telerehabilitation | The therapist conducted conventional balance training programmes following a simple to complex principle. The small ball and peg bars are used for hand manipulation during sitting and standing balance training. |
ACF: aged care facility; CGA: comprehensive geriatric assessment; cRCT: clustered randomised controlled trial; GNS: geriatric nurse specialist; GP: general practitioner; NP: nurse practitioner; NPS: neuropsychiatric symptoms; RACF: residential aged care facility; RCT: randomised controlled trial; UTI: urinary tract infection
Study design and setting
Fourteen studies were randomised controlled trials (Bellantonio 2008; Brodaty 2003; Cavalieri 1993; Chapman 2007; Cordato 2018; Crotty 2019; De Luca 2016; Dy 2013; Harvey 2014; Kolcu 2020; Kotynia‐English 2005; Lin 2014; Rubenstein 1990; Uy 2008), 26 were cluster‐randomised trials (Agar 2017; Arendts 2018; Boorsma 2011a; Boyd 2014; Connolly 2015; Crotty 2004; Forbat 2020; Grabowski 2014; Haines 2020; Kim 2020; Kovach 2006; Leontjevas 2013; Lichtwarck 2018; Lin 2010; Loeb 2005; Loeb 2006; Man 2020; McSweeney 2012; Neyens 2009; Pieper 2016; Rutten 2022; Stern 2014; Temkin‐Greener 2018; Van den Block 2020; Wu 2010; Zwijsen 2014), of which eight had a stepped‐wedge design (Forbat 2020; Haines 2020; Kim 2020; Leontjevas 2013; Neyens 2009; Stern 2014; Temkin‐Greener 2018; Zwijsen 2014). Most studies (n = 13) were conducted in Australia (Agar 2017; Arendts 2018; Brodaty 2003; Cordato 2018; Crotty 2004; Crotty 2019; Forbat 2020; Haines 2020; Harvey 2014; Kotynia‐English 2005; Man 2020; McSweeney 2012; Uy 2008) and the USA (n = 8) (Bellantonio 2008; Cavalieri 1993; Chapman 2007; Dy 2013; Grabowski 2014; Kovach 2006; Rubenstein 1990; Temkin‐Greener 2018); six studies were conducted in the Netherlands (Boorsma 2011a; Leontjevas 2013; Neyens 2009; Pieper 2016; Rutten 2022; Zwijsen 2014), three in Taiwan (Lin 2010; Lin 2014; Wu 2010), three in Canada (Loeb 2005; Loeb 2006; Stern 2014), two in New Zealand (Boyd 2014; Connolly 2015), one in Turkey (Kolcu 2020), one in Norway (Lichtwarck 2018), one in Italy (De Luca 2016), one in South Korea (Kolcu 2020), and one study was conducted in seven European countries, namely Belgium, England, Finland, Italy, the Netherlands, Poland and Switzerland (Van den Block 2020). All studies were published in English.
Participants
Participants in 11 studies were elderly residents of ACFs not limited to any particular subgroup (Arendts 2018; Boorsma 2011a; Boyd 2014; Connolly 2015; De Luca 2016; Grabowski 2014; Haines 2020; Kim 2020; Lin 2010; Temkin‐Greener 2018; Van den Block 2020). Twelve studies included participants with mental health conditions or behavioural problems (Agar 2017; Bellantonio 2008; Brodaty 2003; Chapman 2007; Crotty 2004; Kovach 2006; Leontjevas 2013; Lichtwarck 2018; McSweeney 2012; Neyens 2009; Pieper 2016; Zwijsen 2014). The remaining studies included residents after hip fracture (two studies Crotty 2019; Uy 2008), after hospital admission (two studies Cordato 2018; Harvey 2014), upon admission to ACF (two studies Cavalieri 1993; Kotynia‐English 2005), with urinary tract infection or pneumonia infection (three studies Loeb 2005; Loeb 2006; Rutten 2022), with high levels of disability (two studies Forbat 2020; Wu 2010), after a fall (one study Rubenstein 1990), with hypertension (one study Kolcu 2020), with visual impairment (one study Man 2020), with pressure ulcers (one study Stern 2014), with chronic stroke (one study Lin 2014), or with diabetes (one study Dy 2013).
Mean age was reported by all but four studies, of which one reported median age (De Luca 2016) and three did not report any information on baseline age (Grabowski 2014; Haines 2020; Loeb 2005). Mean age ranged from 75 to 90 years (Agar 2017; Arendts 2018; Bellantonio 2008; Boorsma 2011a; Boyd 2014; Brodaty 2003; Cavalieri 1993; Chapman 2007; Connolly 2015; Cordato 2018; Crotty 2004; Crotty 2019; Dy 2013; Forbat 2020; Harvey 2014; Kim 2020; Kolcu 2020; Kotynia‐English 2005; Kovach 2006; Leontjevas 2013; Lichtwarck 2018; Lin 2010; Lin 2014; Loeb 2006; Man 2020; McSweeney 2012; Neyens 2009; Pieper 2016; Rubenstein 1990; Rutten 2022; Stern 2014; Temkin‐Greener 2018; Uy 2008; Van den Block 2020; Wu 2010; Zwijsen 2014). From 33 studies that reported the gender composition of study participants, in all but two (Cordato 2018; Kolcu 2020), more than half of participants were women.
Interventions
Most interventions (n = 31) were alternative models of care delivery focused on 'co‐ordination of care', with 16 studies in the subcategory 'Teams' (Bellantonio 2008; Boorsma 2011a; Boyd 2014; Brodaty 2003; Chapman 2007; Connolly 2015; Crotty 2004; Crotty 2019; Leontjevas 2013; Lin 2010; McSweeney 2012; Neyens 2009; Stern 2014; Temkin‐Greener 2018; Wu 2010; Zwijsen 2014), two studies in 'Discharge planning' (Cordato 2018; Harvey 2014), four studies in 'Case management' (Agar 2017; Forbat 2020; Lichtwarck 2018; Van den Block 2020), six studies in 'Care pathways' (Kotynia‐English 2005; Kovach 2006; Loeb 2005; Loeb 2006; Pieper 2016; Rutten 2022), two in 'Comprehensive geriatric assessment' (Cavalieri 1993; Rubenstein 1990), and one in 'Continuity of care' (Kim 2020).
Three interventions were alternative models of care focused on 'who provides care', with one study in the subcategory 'Staffing models' (GP co‐located in RACF versus care provided by external GP) (Haines 2020) and two studies in the subcategory 'Role expansion or task shifting' (nurse practitioner‐led care versus GP‐led care) (Arendts 2018; Kolcu 2020).
Two studies were focused on 'where care is provided' and investigated alternative locations for the provision of care (i.e. within ACF versus outside of ACF) (Man 2020; Uy 2008). The remaining four studies investigated the effects of telemedicine provided to ACF residents (De Luca 2016; Dy 2013; Grabowski 2014; Lin 2014).
All but one study (Cordato 2018) had one intervention and one control group. Cordato 2018 had two intervention groups and a control. See Appendix 2 and Appendix 3 for TIDieR descriptions of interventions.
The comparator in all studies was usual care. Overall, studies provided limited information on what usual care entailed (see Table 2; Appendix 4). Four studies did not provide any details on how usual care was provided (Crotty 2004; De Luca 2016; Dy 2013; Neyens 2009). Based on the included studies, the only comparison in this review was any alternative model of care compared with usual care.
Outcomes
None of the studies measured all the outcomes of interest in this review. One study did not measure any of the outcomes included in this review (Chapman 2007). In our Table 1, the evidence for the effectiveness of any alternative model of care was based on 11 studies for emergency department visits, 12 studies for unplanned hospital admissions, eight studies for adverse effects, three studies for adherence to clinical guideline‐recommended care, 14 studies for health‐related quality of life, 25 studies for mortality and 11 studies for total costs of care. An overview of outcomes assessed in each of the included studies is presented in Table 3.
2. Overview of outcomes included in the review.
| Outcome/study ID | 1. ED visits | 2. Unplanned hospital admissions | 3. Adverse effects | 4. Adherence to clinical‐guideline‐recommended care | 5. Health‐related quality of life | 6. Mortality | 7. Resource use | 8. Access to primary or specialist healthcare services | 9. Any hospital admissions | 10. Length of stay for any hospital admission | 11. Residents’ satisfaction with the health care received | 12. 'Next of kin' satisfaction with the health care provided to the resident | 13. Work‐related satisfaction of ACF staff | 14. Work‐related stress/burnout of ACF staff |
| WHO PROVIDES CARE (staffing models) | ||||||||||||||
| Haines 2020 | Yes | Yes | Yes | No | No | Yes | Yes | No | Yes (unplanned) | No | No | No | Yes | No |
| WHO PROVIDES CARE (Role expansion or task shifting) | ||||||||||||||
| Arendts 2018 | Yes | Yes | No | No | Yes | Yes | No | No | Yes (unplanned) | Yes (NR) | No | No | No | No |
| Kolcu 2020 | No | No | No | No | Yes | Yes | No | No | No | No | No | No | No | No |
| WHERE CARE IS PROVIDED (Site of service delivery) | ||||||||||||||
| Man 2020 | No | No | Yes | No | Yes | Yes | No | No | No | No | No | No | No | No |
| Uy 2008 | No | No | No | No | No | Yes | No | No | No | No | No | No | No | No |
| COORDINATION OF CARE (Teams) | ||||||||||||||
| Boorsma 2011a | No | Yes (NR) | No | No | Yes | Yes | Yes | No | Yes | Yes (NR) | Yes | No | No | No |
| Boyd 2014 | No | Yes | No | No | No | No | No | No | Yes (unplanned) | No | No | No | No | No |
| Connolly 2015 | No | Yes | No | No | No | Yes | No | No | Yes (unplanned) | Yes | No | No | No | No |
| Bellantonio 2008 | Yes | Yes | No | No | No | Yes | No | No | Yes (unplanned) | No | No | No | No | No |
| Brodaty 2003 | No | No | No | Yes | No | Yes (NR) | No | No | No | No | No | No | No | No |
| Chapman 2007 | No | No | No | No | No | No | No | No | No | No | No | No | No | No |
| Crotty 2004 | No | No | No | Yes | No | Yes | Yes | No | No | No | No | No | No | No |
| Lin 2010 | No | No | No | No | No | Yes | No | No | No | No | No | No | No | No |
| Leontjevas 2013 | No | No | No | No | Yes | No | No | No | No | No | No | No | No | No |
| McSweeney 2012 | No | No | No | No | No | Yes | No | No | Yes | No | No | No | No | No |
| Neyens 2009 | No | No | Yes | No | No | No | No | No | No | No | No | No | No | No |
| Temkin‐Greener 2018 | No | No | No | No | No | No | No | No | Yes | No | No | No | Yes | No |
| Zwijsen 2014 | No | No | No | No | Yes | No | Yes | No | No | No | No | No | Yes | Yes |
| Stern 2014 | Yes | No | Yes* | No | Yes | No | Yes | No | Yes | No | No | No | No | No |
| Wu 2010 | Yes | No | Yes | No | No | No | No | No | Yes | No | No | No | No | No |
| Crotty 2019 | No | Yes (injurious falls leading to hospital admission) | Yes | No | Yes | Yes | Yes | No | Yes (injurious falls leading to hospital admission) | No | No | No | No | No |
| COORDINATION OF CARE (Discharge planning) | ||||||||||||||
| Cordato 2018 | Yes | Yes | No | No | Yes (NR) | Yes | Yes | No | Yes | Yes | No | No | No | No |
| Harvey 2014 | Yes | Yes | No | No | Yes | Yes | No | No | Yes | Yes | Yes | No | No | No |
| COORDINATION OF CARE (Case management) | ||||||||||||||
| Agar 2017 | Yes | No | Yes (NR) | No | Yes (NR) | Yes | Yes (NR) | No | Yes | Yes | No | Yes | No | No |
| Forbat 2020 | No | Yes | No** | No | No | Yes | Yes | No | Yes (unplanned) | Yes | No | No | No | No |
| Lichtwarck 2018 | No | No | No | No | Yes | Yes | No | No | No | No | No | No | No | No |
| Van den Block 2020 | Yes | No | No | No | Yes | No | Yes | No | Yes | Yes | No | Yes | No | No |
| COORDINATION OF CARE (Care pathway) | ||||||||||||||
| Kotynia‐English 2005 | No | No | No | No | No | Yes | No | No | No | No | No | No | No | No |
| Loeb 2005 | No | Yes | No | No | No | Yes | No | No | Yes | No | No | No | No | No |
| Loeb 2006 | Yes | Yes | Yes | No | Yes | Yes | Yes | No | Yes (unplanned) | Yes | No | No | No | No |
| Pieper 2016 | No | No | No | No | Yes | Yes | No | No | No | No | No | No | No | No |
| Rutten 2022 | No | Yes | No | Yes | No | Yes | No | No | Yes | No | No | No | No | No |
| COORDINATION OF CARE (Comprehensive geriatric assessment) | ||||||||||||||
| Cavalieri 1993 | Yes | No | No | No | No | No | No | No | Yes | No | No | No | No | No |
| Rubenstein 1990 | No | No | Yes | No | No | Yes | No | No | Yes | Yes | No | No | No | No |
| COORDINATION OF CARE (Continuity of care) | ||||||||||||||
| Kim 2020 | Yes (NR) | No | No** | No | Yes (NR) | Yes | Yes (NR) | No | Yes (NR) | Yes (NR) | Yes (NR) | No | Yes (NR) | No |
| INFORMATION AND COMMUNICATION TECHNOLOGY (Telemedicine) | ||||||||||||||
| De Luca 2016 | No | No | No | No | Yes | No | No | No | No | No | No | No | No | No |
| Dy 2013 | No | No | No | No | No | Yes | No | No | No | No | No | No | Yes (NR) | No |
| Grabowski 2014 | No | No | No | No | No | No | Yes | No | Yes | No | No | No | No | No |
| Lin 2014 | No | No | No | No | No | No | No | No | No | No | Yes | No | No | No |
NR – outcome listed in protocol/trial registration form but results not reported.
*Pressure ulcers were the primary focus of the study and only patients with pressure ulcers were recruited; rate of reduction of pressure ulcers and time to healing was the primary outcome of the study and not an adverse effect.
**Authors reported that no adverse events were observed in any of the study groups. Not used in meta‐analyses as the authors have not specified whether falls, infections or pressure ulcers were considered as adverse effects.
Excluded studies
The most common reason for excluding studies was ineligible intervention (not an alternative model of care) followed by ineligible study design. Details of the excluded studies, with reasons for exclusion, are provided in the Characteristics of excluded studies table.
Risk of bias in included studies
See the risk of bias tables in the Characteristics of included studies table, Figure 3 for a graph of risk of bias items presented as percentages across all included studies and Figure 4 for a summary of judgements about each risk of bias item.
3.
Risk of bias graph: review authors' judgements about each risk of bias item presented as percentages across all included studies.
4.
Risk of bias summary: review authors' judgements about each risk of bias item for each included study.
Allocation
We judged random sequence generation adequate (low risk) in 30 included studies (Agar 2017; Arendts 2018; Boorsma 2011a; Brodaty 2003; Connolly 2015; Cordato 2018; Crotty 2004; Crotty 2019; Forbat 2020; Haines 2020; Harvey 2014; Kim 2020; Kolcu 2020; Kotynia‐English 2005; Kovach 2006; Leontjevas 2013; Lin 2014; Loeb 2005; Loeb 2006; Man 2020; McSweeney 2012; Neyens 2009; Pieper 2016; Rubenstein 1990; Rutten 2022; Stern 2014; Temkin‐Greener 2018; Uy 2008; Van den Block 2020; Zwijsen 2014). Ten studies did not provide sufficient details and were rated as unclear risk of bias (Bellantonio 2008; Boyd 2014; Cavalieri 1993; Chapman 2007; De Luca 2016; Dy 2013; Grabowski 2014; Lichtwarck 2018; Lin 2010; Wu 2010).
Allocation concealment was appropriate (low risk) in 27 studies (Agar 2017; Arendts 2018; Bellantonio 2008; Boorsma 2011a; Boyd 2014; Connolly 2015; Crotty 2004; Forbat 2020; Grabowski 2014; Haines 2020; Harvey 2014; Kim 2020; Kovach 2006; Leontjevas 2013; Lichtwarck 2018; Loeb 2005; Loeb 2006; Man 2020; McSweeney 2012; Neyens 2009; Pieper 2016; Stern 2014; Temkin‐Greener 2018; Uy 2008; Van den Block 2020; Wu 2010; Zwijsen 2014). In the remaining 13 studies, allocation concealment was poorly described and was judged as an unclear risk of bias (Brodaty 2003; Cavalieri 1993; Chapman 2007; Cordato 2018; Crotty 2019; De Luca 2016; Dy 2013; Kolcu 2020; Kotynia‐English 2005; Lin 2010; Lin 2014; Rubenstein 1990; Rutten 2022).
Blinding
Due to the nature of the interventions that involve changes in how care is organised and provided, blinding was rarely possible in practice. We judged all but six studies (Chapman 2007; Kotynia‐English 2005; Kovach 2006; Lin 2010; Rubenstein 1990; Uy 2008) to be at high risk of performance bias. In the two studies with unclear risk of bias, one study did not contribute any outcomes to this review (Chapman 2007) and the second study described efforts to blind personnel but did not report whether residents were also blinded to the treatment allocation (Rubenstein 1990). We judged three studies to have a low risk of performance bias despite the lack of blinding because the outcome these studies contributed to this review was mortality, which is unlikely to be subject to performance bias (Kotynia‐English 2005; Lin 2010; Uy 2008). Kovach 2006 described residents and personnel being blinded, and we judged this study to be at low risk of bias.
Seven studies were at high risk of detection bias (Agar 2017; De Luca 2016; Dy 2013; Lin 2014; Pieper 2016; Van den Block 2020; Zwijsen 2014) and for 10 studies it was unclear whether outcome assessment could be biased (Bellantonio 2008; Brodaty 2003; Chapman 2007; Crotty 2019; Kolcu 2020; Lin 2010; Loeb 2005; Man 2020; Neyens 2009; Rubenstein 1990). We rated the remaining 23 studies at a low risk of detection bias. In these studies, outcome assessors were adequately blinded or, where blinding was not explicitly described, data on the outcomes that the study contributed to this review were extracted from administrative charts.
Incomplete outcome data
We rated attrition bias as low risk in all but five studies, which provided insufficient detail about dropouts and were rated as having an unclear risk of bias (Arendts 2018; Brodaty 2003; Cavalieri 1993; De Luca 2016; Kovach 2006). We judged none of the studies to be at high risk of attrition bias.
Selective reporting
We judged 14 studies at low risk of reporting bias (Arendts 2018; Boorsma 2011a; Crotty 2019; Haines 2020; Leontjevas 2013; Lichtwarck 2018; Loeb 2006; McSweeney 2012; Pieper 2016; Rutten 2022; Stern 2014; Temkin‐Greener 2018; Van den Block 2020; Zwijsen 2014). One study did not report on all outcomes specified in the protocol and was judged to be at high risk of selective reporting (Man 2020). We judged the remaining 25 studies to be at unclear risk of reporting bias, with the most common reason being the absence of trial registration or protocol.
Other potential sources of bias
From 14 individual randomised trials, we detected no other source of bias in eight studies (Bellantonio 2008; Brodaty 2003; Cavalieri 1993; Cordato 2018; Crotty 2019; Kolcu 2020; Kotynia‐English 2005; Rubenstein 1990). We rated the six remaining studies as having unclear risk of other bias. Unclear risk of contamination bias was noted in two studies (Chapman 2007; Harvey 2014), imbalances at baseline after randomisation that were not accounted for in the analyses or no information about baseline differences were noted in another two studies (De Luca 2016; Dy 2013), unclear reporting that hindered assessment of potential bias was noted in Lin 2014 and one study recruited only 11 participants due to early termination of the trial for external reasons (Uy 2008).
From 26 cluster‐randomised trials, no other source of bias was detected in 11 studies (Boorsma 2011a; Connolly 2015; Forbat 2020; Grabowski 2014; Leontjevas 2013; Lin 2010; Loeb 2005; Loeb 2006; Man 2020; Temkin‐Greener 2018; Van den Block 2020). We judged nine studies at high risk of bias (Agar 2017; Arendts 2018; Boyd 2014; Crotty 2004; Kim 2020; Kovach 2006; Pieper 2016; Stern 2014; Wu 2010). The most common source of bias was recruitment bias and incorrect analyses. The remaining seven studies were at unclear risk of bias. All but one stepped‐wedge trial (Stern 2014) accounted for time‐trends in the analyses.
None of the 11 studies that included economic evaluation met all 19 criteria used to assess the completeness of reporting (Boorsma 2011a; Cordato 2018; Crotty 2004; Crotty 2019; Forbat 2020; Grabowski 2014; Haines 2020; Loeb 2006; Stern 2014; Van den Block 2020; Zwijsen 2014). Two studies met all but one criterion (scoring a NO on 'ethical and distributional issues discussed appropriately') (Cordato 2018; Crotty 2019), three studies met 17 criteria (Crotty 2004; Haines 2020; Stern 2014), five studies met 11 to 16 criteria (Boorsma 2011a; Forbat 2020; Grabowski 2014; Van den Block 2020; Zwijsen 2014), and one study only sufficiently reported on 7 of the 19 criteria specified in CHEC (Loeb 2006). Ten of the studies did not sufficiently describe ethical and distributional issues; generalisability of findings was the second least well‐reported item (not sufficiently reported by 6 of 11 studies) (CHEC assessment results, Table 4).
3. CHEC items assessment for studies with economic analyses.
| CHEC item | Boorsma 2011a | Stern 2014 | Crotty 2019 | Zwijsen 2014 | Van den Block 2020 | Forbat 2020 | Cordato 2018 | Loeb 2006 | Grabowski 2014 | Crotty 2004 | Haines 2020 |
| 1. Is the study population clearly described? | Y | Y | Y | Y | Y | Y | Y | Y | Y | Y | Y |
| 2. Are competing alternatives clearly described? | Y | Y | Y | Y | Y | Y | Y | Y | Y | Y | Y |
| 3. Is a well‐defined research question posed in answerable form? | Y | Y | Y | Y | Y | Y | Y | Y | N | Y | Y |
| 4. Is the economic study design appropriate to the stated objective? | Y | Y | Y | Y | Y | Y | Y | N | N | Y | Y |
| 5. Is the chosen time horizon appropriate in order to include relevant costs and consequences? | N | Y | Y | Y | Y | Y | Y | Y | Y | Y | Y |
| 6. Is the actual perspective chosen appropriate? | Y | Y | Y | Y | Y | Y | Y | Y | N | Y | Y |
| 7. Are all important and relevant costs for each alternative identified? | Y | Y | Y | N | N | Y | Y | N | N | Y | Y |
| 8. Are all costs measured appropriately in physical units? | Y | Y | Y | Y | Y | Y | Y | N | Y | N | Y |
| 9. Are costs valued appropriately? | Y | Y | Y | Y | Y | Y | Y | N | Y | Y | Y |
| 10. Are all important and relevant outcomes for each alternative identified? | Y | Y | Y | Y | N | N | Y | N | N | Y | Y |
| 11. Are all outcomes measured appropriately? | Y | Y | Y | Y | N | N | Y | N | Y | Y | Y |
| 12. Are outcomes valued appropriately? | Y | Y | Y | Y | NA | NA | Y | NA | Y | Y | NA |
| 13. Is an incremental analysis of costs and outcomes of alternatives performed? | Y | Y | Y | Y | N | N | Y | N | N | Y | Y |
| 14. Are all future costs and outcomes discounted appropriately? | Y | Y | Y | Y | Y | Y | Y | Y | Y | Y | Y |
| 15. Are all important variables, whose values are uncertain, appropriately subjected to sensitivity analysis? | Y | Y | Y | Y | Y | Y | Y | N | Y | Y | Y |
| 16. Do the conclusions follow from the data reported? | Y | Y | Y | N | Y | Y | Y | N | Y | Y | Y |
| 17. Does the study discuss the generalisability of the results to other settings and patient/client groups? | N | N | N | N | Y | Y | Y | N | N | Y | Y |
| 18. Does the article indicate that there is no potential conflict of interest of study researcher(s) and funder(s)? | Y | Y | Y | Y | Y | Y | Y | Y | Y | Y | Y |
| 19. Are ethical and distributional issues discussed appropriately? | N | N | Y | N | N | N | N | N | N | N | N |
Y ‐ yes, N ‐ no, NA ‐ not applicable
Effects of interventions
See: Table 1
Main comparison: Any alternative model of care versus usual care
Based on the included studies, the only comparison in this review was any alternative model of care compared with usual care. See Table 1 and structured summary of effects tables organised by EPOC categories (Table 5; Table 6; Table 7; Table 8; Table 9; Table 10; Table 11; Table 12; Table 13).Please note that the in‐text tables 1 to 7 provide details relating to the outcomes and the additional tables 4 to 12 provide further details relating to EPOC categories. Economic outcomes are summarised in additional Table 14 and Table 15.
4. Structured summary of effects in trials from WHO PROVIDES CARE category.
| Study ID | Outcome definition | Timing of the measurement | Intervention group | Control group | Effect estimate metric | 95% CI | Statistical test | P value | Notes | ||
| Outcome | N participants | Outcome | N participants | ||||||||
| 1. Emergency department visits, reported at longest follow‐up | |||||||||||
|
Haines 2020 SWcRCT |
Unplanned hospital transfers, mean (SD) | Per facility per 9‐week block during the stepped‐wedge trial period | 14 (9) | Mean (SD) occupied bed‐days 6255 (1800) | 19 (10) | Mean (SD) occupied bed‐days 6610 (2219) | IRR 0.81 | 0.66 to 1.01 | GLMM | P = 0.06 | — |
|
Arendts 2018 cRCT |
ED transfers, total number | End of study follow‐up (min 12 months or until death, max 32 months) | 98 | 101 | 121 | 99 | NR | NR | NR | NR | Mean (SD) follow‐up 604 (276) days (all participants) |
| Number of patients with at least one ED transfer | End of study follow‐up (min 12 months or until death, max 32 months) | 63 | 101 | 60 | 99 | NR | NR | Pearson X2 | P = 0.10 | — | |
| Rate of transfers per resident/year | 12 months | 0.66 | 101 | 0.70 | 99 | NR | NR | NR | NR | Study authors: "there was no difference in rate of transfers" | |
| 2. Unplanned hospital admissions, reported at longest follow‐up | |||||||||||
|
Haines 2020 SWcRCT |
Unplanned hospital admissions, mean (SD) | Per facility per 9‐week block during the stepped‐wedge trial period | 9 (6) | Mean (SD) occupied bed‐days 6255 (1800) | 13 (7) | Mean (SD) occupied bed‐days 6610 (2219) | IRR 0.74 | 0.56 to 0.96 | GLMM | P = 0.024 | — |
|
Arendts 2018 cRCT |
Hospitalisation resulting from ED visit, total n | End of study follow‐up (min 12 months or until death, max 32 months) | 56 | 101 | 70 | 99 | NR | NR | NR | NR | Study abstract: "98 ED visits by intervention participants, resulting in 56 hospitalisations, compared with 121 ED visits and 70 hospitalisations for controls (risk reduction = 8%, 95% CI = −1% −17%, p = 0.10)" |
| Hospitalisation resulting from ED visit, number of patients with at least one visit | End of study follow‐up (min 12 months or until death, max 32 months) | 39 | 101 | 46 | 99 | NR | NR | NR | NR | Data provided by authors via email | |
| 3. Adverse effects (defined as infections, falls and pressure ulcers), reported at longest follow‐up | |||||||||||
|
Haines 2020 SWcRCT |
Any infection (urinary tract, gastrointestinal or respiratory) | Per facility per 9‐week block during the stepped‐wedge trial period | 25 (16) | Mean (SD) occupied bed‐days 6255 (1800) | 20 (11) | Mean (SD) occupied bed‐days 6610 (2219) | 1.42 | 1.18 to 1.70 | GLMM | P < 0.001 | — |
| New urinary tract infections | Per facility per 9‐week block during the stepped‐wedge trial period | 11 (8) | Mean (SD) occupied bed‐days 6255 (1800) | 10 (5) | Mean (SD) occupied bed‐days 6610 (2219) | IRR 1.68 | 1.29 to 2.20 | GLMM | P < 0.001 | — | |
| New gastrointestinal infections | Per facility per 9‐week block during the stepped‐wedge trial period | 2 (6) | Mean (SD) occupied bed‐days 6255 (1800) | 1 (4) | Mean (SD) occupied bed‐days 6610 (2219) | NR | NR | GLMM | NR | — | |
| New respiratory infections | Per facility per 9‐week block during the stepped‐wedge trial period | 12 (11) | Mean (SD) occupied bed‐days 6255 (1800) | 9 (7) | Mean (SD) occupied bed‐days 6610 (2219) | IRR 1.23 | 0.94 to 1.62 | GLMM | P = 0.12 | — | |
| Falls | Per facility per 9‐week block during the stepped‐wedge trial period | 59 (25) | Mean (SD) occupied bed‐days 6255 (1800) | 56 (25) | Mean (SD) occupied bed‐days 6610 (2219) | IRR 1.05 | 0.94 to 1.18 | GLMM | P = 0.35 | — | |
| New pressure areas | Per facility per 9‐week block during the stepped‐wedge trial period | 4 (3) | Mean (SD) occupied bed‐days 6255 (1800) | 4 (4) | Mean (SD) occupied bed‐days 6610 (2219) | IRR 1.11 | 0.71 to 1.74 | GLMM | P = 0.64 | — | |
| 4. Adherence to clinical guideline‐recommended care, reported at longest follow‐up | |||||||||||
| Outcome not measured in any of the trials | |||||||||||
| 5. Health‐related quality of life of residents, as measured by generic scales (e.g. 36‐item Short Form Health Survey (SF‐36) (mental component score) or EuroQol 5 dimensions (EQ5D)) at longest follow‐up. If no generic scale was available, we used a disease‐specific quality of life scale, if available. | |||||||||||
|
Arendts 2018 cRCT |
Health‐related quality of life, EQ‐5D‐3L, mean (95% CI) | Baseline to 12 months (all alive at baseline and 12 months, respectively) | 0.44 (0.37 to 0.50) SD*: 0.29 |
87 | 0.44 (0.37 to 0.51) SD*: 0.34 |
90 | NR | NR | NR | NR | *SD calculated by review authors This outcome is used in meta‐analyses as a more conservative estimate: all patients from baseline are included and not limited to those who were alive at 12 months |
| Health‐related quality of life, EQ‐5D‐3L, mean (95% CI) | Weighted over 1 year (all alive from baseline) | 0.37 (0.31 to 0.43) SD*: 0.31 |
101 | 0.39 (0.33 to 0.45) SD*: 0.30 |
99 | NR | NR | NR | NR | *SD calculated by review authors | |
|
Kolcu 2020 RCT |
SF‐36 quality of life, total score | 24 weeks | NR | 38 | NR | 38 | Z = ‐3.422 | NR | The Mann‐Whitney U‐test | P < 0.001 | Values per intervention group not reported; difference favours intervention group |
| SF‐36 quality of life, physical component | 24 weeks | 58.42 | 38 | 44.36 | 38 | Z = 3.586 MD 14.06* |
6.92 to 21.19 | The Mann‐Whitney U‐test | P = 0.000 | *Mean difference not reported by the authors; calculated from the group means | |
| SF‐36 quality of life, mental component | 24 weeks | 64.24 | 38 | 53.93 | 38 | Z = ‐2.919 MD 10.31* |
3.66 to 16.97 | The Mann‐Whitney U‐test | P = 0.004 | *Mean difference not reported by the authors; calculated from the group means | |
| SF‐36 quality of life, physical functioning | 24 weeks | 52.70 | 38 | 30.67 | 38 | Z = ‐2.518 MD 22.03* |
6.68 to 37.37 | The Mann‐Whitney U‐test | P = 0.012 | *Mean difference not reported by the authors; calculated from the group means | |
| SF‐36 quality of life, role‐physical | 24 weeks | 85.81 | 38 | 46.62 | 38 | Z = ‐3.746 MD 39.19* |
19.71 to 58.66 | The Mann‐Whitney U‐test | P = 0.000 | *Mean difference not reported by the authors; calculated from the group means | |
| SF‐36 quality of life, pain | 24 weeks | 47.83 | 38 | 48.10 | 38 | Z = ‐0.23 MD ‐0.27* |
‐5.72 to 10.58 | The Mann‐Whitney U‐test | P = 0.816 | *Mean difference not reported by the authors; calculated from the group means | |
| SF‐36 quality of life, general health | 24 weeks | 49.13 | 38 | 35.21 | 38 | Z = 3.38 MD 13.92* |
5.73 to 22.11 | The Mann‐Whitney U‐test | P = 0.001 | *Mean difference not reported by the authors; calculated from the group means | |
| SF‐36 quality of life, vitality | 24 weeks | 56.62 | 38 | 61.21 | 38 | Z = ‐2.20 MD ‐4.59* |
‐9.49 to ‐0.30 | The Mann‐Whitney U‐test | P = 0.028 | *Mean difference not reported by the authors; calculated from the group means | |
| SF‐36 quality of life, social functioning | 24 weeks | 71.95 | 38 | 61.48 | 38 | Z = ‐2.46 MD 10.47* |
1.17 to 19.77 | The Mann‐Whitney U‐test | P = 0.014 | *Mean difference not reported by the authors; calculated from the group means | |
| SF‐36 quality of life, role‐emotional | 24 weeks | 85.58 | 38 | 53.15 | 38 | Z = ‐3.02 MD 32.43* |
12.49 to 52.38 | The Mann‐Whitney U‐test | P = 0.003 | *Mean difference not reported by the authors; calculated from the group means | |
| SF‐36 quality of life, mental health | 24 weeks | 57.94 | 38 | 58.59 | 38 | Z = ‐0.42 MD ‐0.65* |
‐5.85 to 4.56 | The Mann‐Whitney U‐test | P = 0.674 | *Mean difference not reported by the authors; calculated from the group means | |
| 6. Mortality, reported at longest follow‐up | |||||||||||
|
Arendts 2018 cRCT |
Number of patients who died | End of study follow‐up (max 32 months) | 32 | 101 | 21 | 99 | NR | NR | NR | NR | — |
|
Kolcu 2020 RCT |
Number of patients who died | 24 weeks | 1 | 38 | 1 | 38 | NR | NR | NR | NR | — |
|
Haines 2020 SWcRCT |
Number of patients who died, mean (SD) | Per facility per 9‐week block during the stepped‐wedge trial period | 6 (3) | Mean (SD) occupied bed‐days 6255 (1800) | 3 (3) | Mean (SD) occupied bed‐days 6610 (2219) | IRR 1.31 | 0.94 to 1.82 | GLMM | 0.12 | — |
| 7. Resource use (i.e. resources needed to deliver the intervention, total costs of care or types of care (e.g. hospital care, GP care), economic outcomes from cost‐effectiveness analyses, cost‐utility analyses or cost‐benefit analyses) | |||||||||||
| Economic outcomes reported in Table 14 | |||||||||||
| 8. Access to primary or specialist healthcare services (e.g. waiting times to see the GP or specialist), reported at longest follow‐up | |||||||||||
| Outcome not measured in any of the trials | |||||||||||
| 9. Any hospital admissions, reported at longest follow‐up | |||||||||||
| Outcome not measured in any of the trials | |||||||||||
| 10. Length of stay for any hospital admission, at longest follow‐up | |||||||||||
|
Arendts 2018 cRCT |
Total number of hospital bed‐days | End of study follow‐up (min 12 months or until death, max 32 months) | 285 | 101 (39 patients had an admission) | 290 | 99 (46 patients had an admission) | NR | NR | NR | NR | Data provided by authors via email (SD not provided) |
| 11. Residents’ satisfaction with the health care received, as measured by the trial and reported at longest follow‐up | |||||||||||
| Outcome not measured in any of the trials | |||||||||||
| 12. 'Next of kin' satisfaction with the health care provided to the resident, as measured by the trial and reported at longest follow‐up | |||||||||||
| Outcome not measured in any of the trials | |||||||||||
| 13. Work‐related satisfaction of ACF staff, pertaining to the health care provided to the residents, as measured in the trial and reported at longest follow‐up | |||||||||||
|
Haines 2020 SWcRCT |
Survey question with a 5‐point Likert scale for ‘overall I am extremely satisfied with …. as place to work’, % of those who agreed or strongly agreed (0% to 100%) | 2012 for control group (end of pre‐trial period, none of the facilities received intervention) 2015 for intervention group (end of trial period, all facilities have received intervention for at least 7 x 9‐week periods) |
972 | 1409 | 1155 | 1500 | Beta ‐0.25 | ‐0.64 to 0.13 | Ordered logit regression | P = 0.20 | — |
| 14. Work‐related stress/burnout of ACF staff, as measured in the trial and reported at longest follow‐up | |||||||||||
| Outcome not measured in any of the trials | |||||||||||
ACF: aged care facility; cRCT: cluster‐randomised controlled trial; ED: emergency department; GLMM: generalised linear mixed model; GP: general practitioner; IRR: incidence rate ratio; LMM: linear mixed model; NR: not reported; SD: standard deviation; SWcRCT: stepped‐wedge cluster‐randomised controlled trial
5. Structured summary of effects in trials from WHERE CARE IS PROVIDED category.
| Study ID | Outcome definition | Timing of the measurement | Intervention group | Control group | Effect estimate metric | 95% CI | Statistical test | P value | Notes | ||||
| Outcome | N participants | Outcome | N participants | ||||||||||
| 1. Emergency department visits, reported at longest follow‐up | |||||||||||||
| Outcome not measured in any of the trials | |||||||||||||
| 2. Unplanned hospital admissions, reported at longest follow‐up | |||||||||||||
| Outcome not measured in any of the trials | |||||||||||||
| 3. Adverse effects (defined as infections, falls and pressure ulcers), reported at longest follow‐up | |||||||||||||
|
Man 2020 cRCT |
Number of falls in past 9 months (mean (SE)) | 6 months (over the period 9 months, 3 months before the intervention + 6 months follow‐up) | 0.54 (0.15), SD = 1.24 | 68 | 0.60 (0.18), SD = 1.17 | 42 | Rate ratio = 0.90 | 0.39 to 2.06 | Multivariable random intercept model adjusted for age, years lived in RACF, smoking | NR | ITT analyses | ||
| Number of injurious falls in past 9 months (mean (SE)) | 6 months (over the period 9 months, 3 months before the intervention + 6 months follow‐up) | 0.20 (0.10), SD = 0.82 | 68 | 0.24 (0.13), SD = 0.84 | 42 | Rate ratio = 0.82 | 0.18 to 3.62 | Multivariable random intercept model adjusted for age, years lived in RACF, smoking | NR | ITT analyses | |||
| Number of falls in past 9 months (mean (SD)) | 6 months (over the period 9 months, 3 months before the intervention + 6 months follow‐up) | 0.69 (1.20) | 68 | 0.60 (1.01) | 42 | Rate ratio = 1.16 | 0.53 to 2.53 | Unadjusted model | NR | ITT analyses | |||
| Number of injurious falls in past 9 months (mean (SD)) | 6 months (over the period 9 months, 3 months before the intervention + 6 months follow‐up) | 0.24 (0.84) | 68 | 0.31 (0.81) | 42 | Rate ratio = 0.76 | 0.18 to 3.26 | Unadjusted model | NR | ITT analyses | |||
| 4. Adherence to clinical guideline‐recommended care, reported at longest follow‐up | |||||||||||||
| Outcome not measured in any of the trials | |||||||||||||
| 5. Health‐related quality of life of residents, as measured by generic scales (e.g. 36‐item Short Form Health Survey (SF‐36) (mental component score) or EuroQol 5 dimensions (EQ5D)) at longest follow‐up. If no generic scale was available, we used a disease‐specific quality of life scale, if available. | |||||||||||||
|
Man 2020 cRCT |
Health‐related quality of life (EQ‐5D‐3L index), mean (SE) | 6 months | 0.06 (0.03) SD* = 0.29 |
95 | 0.07 (0.06) SD* = 0.55 |
83 | Between‐group difference = 0.00 | ‐0.11 to 0.12 | Multivariable random intercept model adjusted for treatment, time points, interactions between treatment and time, age, years lived in the facility, smoking, education, use of a hearing aid | 0.938 | ITT *SD calculated by review authors as SE*sqrt(N) |
||
| 6. Mortality, reported at longest follow‐up | |||||||||||||
|
Man 2020 cRCT |
Number of deaths | 6 months | 9 | 95 | 6 | 83 | NR | NR | NR | NR | Extracted from flowchart | ||
|
Uy 2008 RCT |
Number of deaths | 4 months | 1 | 4 | 0 | 7 | NR | NR | NR | NR | Trial terminated earlier than planned | ||
| 7. Resource use (i.e. resources needed to deliver the intervention, total costs of care or types of care (e.g. hospital care, GP care), economic outcomes from cost‐effectiveness analyses, cost‐utility analyses or cost‐benefit analyses) | |||||||||||||
| Outcome not measured in any of the trials | |||||||||||||
| 8. Access to primary or specialist healthcare services (e.g. waiting times to see the GP or specialist), reported at longest follow‐up | |||||||||||||
| Outcome not measured in any of the trials | |||||||||||||
| 9. Any hospital admissions, reported at longest follow‐up | |||||||||||||
| Outcome not measured in any of the trials | |||||||||||||
| 10. Length of stay for any hospital admission, at longest follow‐up | |||||||||||||
| Outcome not measured in any of the trials | |||||||||||||
| 11. Residents’ satisfaction with the health care received, as measured by the trial and reported at longest follow‐up | |||||||||||||
| Outcome not measured in any of the trials | |||||||||||||
| 12. 'Next of kin' satisfaction with the health care provided to the resident, as measured by the trial and reported at longest follow‐up | |||||||||||||
| Outcome not measured in any of the trials | |||||||||||||
| 13. Work‐related satisfaction of ACF staff, pertaining to the health care provided to the residents, as measured in the trial and reported at longest follow‐up | |||||||||||||
| Outcome not measured in any of the trials | |||||||||||||
| 14. Work‐related stress/burnout of ACF staff, as measured in the trial and reported at longest follow‐up | |||||||||||||
| Outcome not measured in any of the trials | |||||||||||||
ACF: aged care facility; cRCT: cluster‐randomised controlled trial; CI: confidence interval; GP: general practitioner; ITT: intention‐to‐treat; NR: not reported; RACF: residential aged care facility; SD: standard deviation; SE: standard error
6. Structured summary of effects in trials from CO‐ORDINATION OF CARE (Teams) category.
| Study ID | Outcome definition | Timing of the measurement | Intervention group | Control group | Effect estimate metric | 95% CI | Statistical test | P value | Notes | ||
| Outcome | N participants | Outcome | N participants | ||||||||
| 1. Emergency department visits, reported at longest follow‐up | |||||||||||
|
Bellantonio 2008 RCT |
Number of patients with at least one ED transfer | 9 months | 9 (see notes) | 48 | 11 (see notes) | 52 | Risk reduction ‐12% | ‐65% to 126% | Chi2 test | P = 0.80 | Number of events in intervention and control group calculated by review authors* |
|
Stern 2014 SWcRCT |
Emergency department visits, mean rate per 1000 patient‐days | 4 to 14 months | NR | 94 | NR | 67 | IRR 1.3 | 0.58 to 2.90 | Negative binomial regression model | P = 0.52 | |
|
Wu 2010 cRCT |
Emergency department visits, incidence per 1000 bed‐days | 12 months | 0 | 32 | 0 | 42 | NR | NR | Paired t‐test | P > 0.05 | |
| 2. Unplanned hospital admissions, reported at longest follow‐up | |||||||||||
|
Bellantonio 2008 RCT |
Number of patients with at least one unanticipated hospitalisation | 9 months | 12 (see notes) | 48 | 22 (see notes) | 52 | Risk reduction ‐ 45% | ‐74% to 18% | Chi2 test | P = 0.13 | Number of events in intervention and control group calculated by review authors* |
|
Connolly 2015 cRCT |
All acute admissions, n | 14 months | n = 608 | 1123 (888 person‐years) |
n = 491 | 875 (735 person‐years) |
NR | NR | NR | NR | > 1 admission per person possible |
| All acute admissions, rate per person‐year | 14 months | 0.68 | (888 person‐years) | 0.67 | 735 person‐years | RR 1.02 | 0.83 to 1.26 | Re‐randomisation test | P = 0.84 | — | |
|
Boyd 2014 cRCT |
Acute hospitalisation, rate per 1000 bed‐days | 12 months | 1.37 | N beds = 1425 Total bed‐days 520,125 N patients NR |
1.40 | N beds = 1128 Total bed‐days 411,720 N patients NR |
NR | NR | NR | NR | — |
| Acute hospitalisation, n | 12 months | 710 | N beds = 1425 Total bed‐days 520,125 N patients NR |
578 | N beds = 1128 Total bed‐days 411,720 N patients NR |
NR | NR | NR | NR | — | |
| Mean admission increase per facility | 12 months | 3.10 (SD not reported) | N beds = 1425 Total bed‐days 520,125 N patients NR |
8.76 (SD not reported) | N beds = 1128 Total bed‐days 411,720 N patients NR |
Mean difference 5.66 admissions fewer per facility for the intervention group than for the comparison group | 0.38 to 10.94 | — | — | Source: text on pg1965; controlled for the mean total beds | |
| 3. Adverse effects (defined as infections, falls and pressure ulcers), reported at longest follow‐up | |||||||||||
|
Crotty 2019 RCT |
Number of residents with a fall | 4 weeks | 56 | 119 | 39 | 121 | Chi2 = 5.5155* | NR | NR | P = 0.02* | *Calculated by review authors |
| Number of residents with an injurious fall | 4 weeks | 12 | 119 | 15 | 121 | Chi2 = 0.3214* | NR | NR | P = 0.57* | *Calculated by review authors | |
| Total number of falls | 4 weeks | 162 | 119 | 96 | 121 | NR | NR | NR | NR | Review authors calculated fall rate per person‐time; see Appendix 5 | |
| Number of residents who reported 1 or more adverse event | 4 weeks | 78 | 119 | 60 | 121 | Chi2 = 6.2532* | NR | NR | P = 0.01* | *Calculated by review authors; source: Table S6 supplement Not used in meta‐analyses as it is not clear which specific adverse events are included |
|
|
Neyens 2009 cRCT |
Number of falls, n per patient per year | 12 months | 2.09 | 249 169.5 patient‐years |
2.54 | 269 166.3 patient‐years |
Rate ratio: 0.79* 0.64** |
0.43 to 1.47 0.43 to 0.96 |
Random‐effects regression | 0.459 0.029 |
*Adjusted for length of stay **Adjusted for ward‐related and patient‐related parameters; unclear whether this analysis was pre‐planned (no protocol) |
|
Wu 2010 cRCT |
Pneumonia, incidence per 1000 bed‐days | 12 months | 0 | 32 | 0 | 42 | NR | NR | Paired t‐test | P > 0.05 | — |
| Urinary tract infection, incidence per 1000 bed‐days | 12 months | 0 | 32 | 0.26 | 42 | NR | NR | Paired t‐test | P > 0.05 | — | |
| 4. Adherence to clinical guideline‐recommended care, reported at longest follow‐up | |||||||||||
|
Brodaty 2003 RCT Case management vs control |
Adequacy of pharmacotherapy; % of residents receiving adequate antidepressant therapy | 12 weeks | 8 | 21 | 1 | 22 | NR | NR | Chi2 for 3 groups (2 treatment arms and control) (Chi2 = 8.057) | P = 0.018 | Depression patients |
| Adequacy of pharmacotherapy; % of residents receiving adequate antidepressant therapy | 12 weeks | 8 | 22 | 1 | 22 | NR | NR | Chi2 for 3 groups (2 treatment arms and control) (Chi2 = 8.057) | P = 0.018 | Depression patients | |
| Adequacy of pharmacotherapy; % of residents receiving adequate antidepressant therapy | 12 weeks | 4 | 19 | 0 | 16 | NR | NR | Chi2 for 3 groups (2 treatment arms and control) (Chi2 = 2.655) | P = 0.103 | Psychosis patients | |
| Adequacy of pharmacotherapy; % of residents receiving adequate antidepressant therapy | 12 weeks | 2 | 17 | 0 | 16 | NR | NR | Chi2 for 3 groups (2 treatment arms and control) (Chi2 = 2.655) | P = 0.103 | Psychosis patients | |
|
Crotty 2004 cRCT |
Medication Appropriateness Index (MAI), continuous score, the higher the more inappropriate the medication use | Longest follow‐up (exact timing not reported) | 3.5 (1.4 to 5.6) | 50 | 3.7 (1.6 to 5.7) | 54 | NR | NR | NR | NR | — |
| 5. Health‐related quality of life of residents, as measured by generic scales (e.g. 36‐item Short Form Health Survey (SF‐36) (mental component score) or EuroQol 5 dimensions (EQ5D)) at longest follow‐up. If no generic scale was available, we used a disease‐specific quality of life scale, if available. | |||||||||||
|
Boorsma 2011a cRCT |
SF‐12, scale 0 to 100, mean (SD) | 6 months | 42.31 (6.04) | 201 | 42.56 (6.35) | 139 | Group*time 1.02 |
NR | LMM | P = 0.35 | — |
|
Crotty 2019 RCT |
EQ5D‐5L, mean (SE) | 12 months | 0.24 (0.02) SD = 0.22* |
117** | 0.30 (0.02) SD = 0.22* |
118** | MD 0.06 | ‐0.006 to 0.13 | LMM | P = 0.07 | *SD calculated by review authors as SE*sqrt(N) |
| DEMQOL sum score, the higher the better the quality of life, mean (SE) | 12 months | 95.9 (2.0) | 29** | 88.5 (1.6) | 41** | MD ‐7.4 | ‐12.5 to ‐ 2.3 | LMM | P = 0.0051 | **For sum scores, deceased patients were treated as missing; for index scores (utility), patients who were deceased were assigned a zero value | |
| DEMQOL‐proxy sum score, the higher the better the quality of life, mean (SE) | 12 months | 101.9 (1.3) | 60** | 98.7 (1.4) | 66** | MD 3.1 | ‐0.62 to 6.9 | LMM | P = 0.1023 | **For sum scores, deceased patients were treated as missing; for index scores (utility), patients who were deceased were assigned a zero value | |
|
Leontjevas 2013 SWcRCT |
EQ5D‐5L, VAS 0 to 100 (100 best heath state) | Difference between the intervention and control (repeatedly measured over a period of 20 months), after adjusting for confounders | 3.4 (0.5 to 6.3) in both dementia and somatic units | 1505 (in total) | NR | NR | NR | NR | LMM adjusted for sex, age, region, time points | P = 0.023 in both dementia and somatic units Difference between dementia and somatic units P = 0.366 |
Study authors confirm beta is MD; we used results for dementia unit in analyses |
|
Stern 2014 SWcRCT |
EQ5D (unclear 3L or 5L, authors have not responded) | 4 to 14 months | NR | 94 | NR | 67 | Beta 0.03 | ‐0.029 to 0.088 | LMM adjusted for wound stage, Charlson Comorbidity Index, pressure ulcer recurrence, bed bound, and urinary or faecal incontinence | P = 0.32 | — |
|
Zwijsen 2014 SWcRCT |
QUALIDEM, subscale 'care relationship', range 0 to 21 | 20 months | NR | 634 residents in total, no numbers per group | NR | 634 residents in total, no numbers per group | MD 0.57* | ‐0.57 to 2.7 | LMM adjusted for time | NR | EQ5D was used to calculate QALY *Mean difference over mean time spent in both the intervention and usual care group |
| QUALIDEM, subscale 'positive affect', range 0 to 18 | 20 months | NR | — | NR | — | MD ‐0.32* | ‐1.5 to 1.9 | LMM adjusted for time | NR | — | |
| QUALIDEM, subscale 'negative affect', range 0 to 9 | 20 months | NR | 636 residents in total, no numbers per group | NR | 636 residents in total, no numbers per group | MD 0.16* | ‐0.56 to 1.2 | LMM adjusted for time | NR | — | |
| QUALIDEM, subscale 'restlessness tense behaviour', range 0 to 9 | 20 months | NR | 638 residents in total, no numbers per group | NR | 638 residents in total, no numbers per group | MD ‐1.1* | ‐2.0 to 0.44 | LMM adjusted for time | NR | — | |
| QUALIDEM, subscale 'social relations', range 0 to 18 | 20 months | NR | 632 residents in total, no numbers per group | 632 residents in total, no numbers per group | MD 1.6* | 0.18 to 3.4 | LMM adjusted for time | NR | — | ||
| 6. Mortality, reported at longest follow‐up | |||||||||||
|
Bellantonio 2008 RCT |
Number of patients who died | 9 months | 5 (see notes) | 48 | 13 (see notes) | 52 | Risk reduction ‐63% | ‐88% to 15% | Chi2 test | P = 0.08 | Number of events in intervention and control group calculated by review authors* |
|
Boorsma 2011a cRCT |
Number of patients who died | 6 months | 28 | 201 | 25 | 139 | OR 1.09 | 0.87 to 1.38 | GLMM | P = 0.44 | — |
|
Connolly 2015 cRCT |
Number of patients who died Deaths of residents, mean rate per person‐year |
14 months | 240 0.27 |
1123 888 person‐years |
179 0.24 |
875 735 person‐years |
RR 1.11 | 0.76 to 1.61 | Re‐randomisation test | P = 0.62 | — |
|
Crotty 2004 cRCT |
Number of patients who died | Longest follow‐up (exact timing not reported) | 18 | 50 | 15 | 54 | NR | NR | NR | NR | — |
|
Crotty 2019 RCT |
Number of patients who died | 12 months | 58 | 119 | 52 | 121 | NR | NR | NR | NR | — |
|
McSweeney 2012 cRCT |
Number of patients who died | 15 weeks | 3 | 21 | 1 | 23 | NR | NR | NR | NR | Numbers extracted from flowchart |
|
Lin 2010 cRCT |
Number of patients who died | 6 months | 12 | 125 | 14 | 249 | NR | NR | NR | NR | Numbers extracted from flowchart |
| 7. Resource use (i.e. resources needed to deliver the intervention, total costs of care or types of care (e.g. hospital care, GP care), economic outcomes from cost‐effectiveness analyses, cost‐utility analyses or cost‐benefit analyses) | |||||||||||
| Economic outcomes reported in Table 14 | |||||||||||
| 8. Access to primary or specialist healthcare services (e.g. waiting times to see the GP or specialist), reported at longest follow‐up | |||||||||||
| Outcome not measured in any of the trials | |||||||||||
| 9. Any hospital admissions, reported at longest follow‐up | |||||||||||
|
Boorsma 2011a cRCT |
Any admissions to hospital, n patients with ≥ 1 admission | 6 months | 22 | 142 | 12 | 85 | OR 1.32 | 0.94 to 1.87 | GLMM | Interaction P = 0.11 | ICC = ‐0.02; interpreted as 0, so data not further adjusted for clustering; Per‐protocol N values used in analyses; study is at low risk of selection bias, no imbalances at baseline; imbalance at the end of the study (due to dropout of 2 control facilities for reasons not related to the trial); did not affect results |
|
McSweeney 2012 cRCT |
Any admissions to hospital, n patients | 15 weeks | 1 | 21 | 0 | 23 | NR | NR | NR | NR | Numbers extracted from flowchart |
|
Temkin‐Greener 2018 cRCT |
Number of hospitalisations in the last 90 days of life (excluding last hospital stay if death occurred in a hospital), IRR (post‐ vs pre‐period) | The last 90 days of life | 1.068 | 2852 | 1.035 | 2978 | IRR | 2978 | Re‐randomisation approach | 0 and 3% (intervention/control, respectively) of iteration with P < 0.05, equivalent to non‐significant results | IRR < 1 indicates improvement in the post‐period |
|
Stern 2014 SWcRCT |
Hospitalisation, mean rate | 4‐14 months | NR | 94 | NR | 67 | IRR 1.2 | 0.62‐ 2.36 | Negative binomial regression | P = 0.59 | — |
|
Wu 2010 cRCT |
Hospitalisation, rate per 1000 bed‐days | 12 months | 0.07 | 42 | 0.09 | 32 | NR | NR | Paired t‐test | P > 0.05 | Number of patients hospitalised NR |
| 10. Length of stay for any hospital admission, at longest follow‐up | |||||||||||
|
Connolly 2015 cRCT |
Acute hospital bed‐days, n | 14 months | 3716 | 1,123 888 person‐years |
3239 | 875 735 person‐years |
NR | NR | NR | NR | — |
| Acute hospital bed‐days, mean rate per person‐year | 14 months | 4.18 | 1,123 888 person‐years |
4.41 | 875 735 person‐years |
RR 0.95 | 0.81 to 1.10 | Re‐randomisation test | P = 0.51 | — | |
| 11. Residents’ satisfaction with the health care received, as measured by the trial and reported at longest follow‐up | |||||||||||
|
Boorsma 2011a cRCT |
Quality of care through residents’ eyes, brief QUOTE tool, scale 16 to 64 | 6 months | 56.32 (6.47) | 201 | 56.1 (6.64) | 139 | Group*time 1.56 |
NR | LMM | 0.12 | — |
| 12. 'Next of kin' satisfaction with the health care provided to the resident, as measured by the trial and reported at longest follow‐up | |||||||||||
| Outcome not measured in any of the trials | |||||||||||
| 13. Work‐related satisfaction of ACF staff, pertaining to the health care provided to the residents, as measured in the trial and reported at longest follow‐up | |||||||||||
|
Zwijsen 2014 SWcRCT |
Job satisfaction, the Leiden Quality of Work Questionnaire for nurses, scale 6 to 24 | 21 months | NR | 327 | 18 | 318 | Adjusted/unadjusted beta 0.93/0.89 | Adjusted*/unadjusted 95% CI (0.48 to 1.38)/ (0.44 to 1.34) | LMM | NR | *adjusted for age, sex and working experience |
| 14. Work‐related stress/burnout of ACF staff, as measured in the trial and reported at longest follow‐up | |||||||||||
|
Zwijsen 2014 SWcRCT |
Emotional exhaustion, UBOS‐C scale 0 to 48 | 21 months | NR | 327 | 11 | 318 | Adjusted/unadjusted beta 0.51/1.37 | Adjusted*/unadjusted 95% CI (‐0.20 to 1.21)/ (0.00 to 2.74) | LMM | NR | *adjusted for age, sex and working experience |
| Depersonalisation, UBOS‐C scale 0 to 30 | 21 months | NR | 327 | 3 | 318 | Adjusted/unadjusted OR 1.28/1.42 | Adjusted*/unadjusted 95% CI (0.83 to 1.96)/ (0.96 to 2.11) | GLMM | NR | *adjusted for age, sex and working experience | |
| Personal accomplishment, UBOS‐C scale 0 to 42 | 21 months | NR | 327 | 11 | 318 | Adjusted/unadjusted beta 0.65/0.57 | Adjusted*/unadjusted 95% CI (‐0.05 to 1.35)/ (‐0.10 to 1.25) | LMM | NR | *adjusted for age, sex and working experience | |
| Job demands, the Leiden Quality of Work Questionnaire for nurses, scale 5 to 20 | 21 months | NR | 327 | 12 | 318 | Adjusted/unadjusted beta ‐0.20/‐0.22 | Adjusted*/unadjusted 95% CI (‐0.52 to 0.12)/(‐0.45 to 0.09) | LMM | NR | *adjusted for age, sex and working experience | |
*Based on information from the published full text (i.e. "The primary outcome of interest was defined as time to any unanticipated transition out of assisted living, defined as permanent nursing facility admission, first ED visit, or first hospitalization. Separate analyses were then conducted for each of these three individual transitions. Subjects could have multiple transitions, but only the first transition of each type was included in the analysis"), we assume that the data for ED visits and unplanned hospital admission reflect the number of patients with one visit or admission. Using data reported in Table 2, Table 3 and the text (i.e. "A summary of the individual transitions, which were not mutually exclusive, revealed that 50 subjects permanently transitioned to a nursing facility, 34 were hospitalised, 20 were admitted to the ED and 18 died. Eighty‐six percent of residents who permanently relocated to a nursing facility had a prior ED visit or hospitalization"), we estimated the number of participants with ED visit, unplanned hospital admission and death. The risk ratio in the estimated results is a little bit higher compared to the reported results, most likely because the reported results are adjusted for age, sex and site.
Example: the N deaths in intervention/control is calculated as 5/48 (= 0.104)/13/52 (= 0.250) = 0.417 (risk reduction = 1 ‐ 0.417 = ‐0.583). The discrepancy with the estimate in the manuscript (‐63%) can be explained by adjustment for age, sex and study site. The authors have not responded to an email request to provide raw numbers.
ACF: aged care facility; cRCT: cluster‐randomised controlled trial; CI: confidence interval; ED: emergency department; GLMM: generalised linear mixed model; GP: general practitioner; ICC: intra‐cluster correlation coefficient; IRR: incidence rate ratio; LMM: linear mixed model; MD: mean difference; NR: not reported; OR: odds ratio; QALY: quality‐adjusted life year; RCT: randomised controlled trial; RR: risk ratio; SD: standard deviation; SE: standard error; SWcRCT: stepped‐wedge cluster‐randomised controlled trial
7. Structured summary of effects in trials from CO‐ORDINATION OF CARE (Discharge planning) category.
| Study ID | Outcome definition | Timing of the measurement | Intervention group | Control group | Effect estimate metric | 95% CI | Statistical test | P value | Notes | ||
| Outcome | N participants | Outcome | N participants | ||||||||
| 1. Emergency department visits, reported at longest follow‐up | |||||||||||
|
Cordato 2018 RCT |
Proportion of residents with at least 1 ED visit during the follow‐up | 6 months | 9 | 22 | 14 | 21 | — | — | — | — | Data provided by study authors |
| Number of ED visits per 1000 person‐days | 6 months | 13 ED visits (ED episodes of care) = 4.1 ED visits per 1000 person‐days | 3186 total person‐days in study for whole intervention group | 26 ED visits (ED episodes of care) = 9.4 ED visits per 1000 person‐days | 2760 total person‐days in study for whole control Group | — | — | — | — | Data on person‐days provided by study authors | |
| Episodes of care in ED, n | 6 months | 13 | 22 | 26 | 21 | NR | NR | NR | NR | One patient could have > 1 ED visit 3268/3030 live‐days per group |
|
| Episodes of care in ED, mean (SD) | 6 months | 0.6 (0.9) | 22 | 1.2 (1.3) | 21 | NR | NR | t‐test | P = 0.6 | — | |
|
Harvey 2014 RCT |
Emergency department visits without subsequent hospital admission, n | 6 months | 19 | 57 | 28 | 59 | NR | NR | Chi2 test | P = 0.4 | One patient could have > 1 ED visit. Chi2 test is not appropriate for this analysis Total of 28 ED presentations from controls and 19 from the intervention group (P = 0.4) |
| Emergency department visits with subsequent hospital admission, n | 6 months | 29 | 57 | 26 | 59 | NR | NR | NR | NR | See Table 3 published paper | |
| Proportion of residents with at least 1 ED visit without subsequent hospital admission | 6 months | 14 | 57 | 17 | 59 | NR | NR | NR | NR | Data provided by study authors | |
| Proportion of residents with at least 1 ED visit with subsequent hospital admission | 6 months | 21 | 57 | 19 | 59 | NR | NR | NR | NR | Data provided by study authors | |
| Proportion of residents with at least 1 ED visit with or without subsequent hospital admission | 6 months | 35 | 57 | 36 | 59 | NR | NR | NR | NR | Data provided by study authors | |
| 2. Unplanned hospital admissions, reported at longest follow‐up | |||||||||||
|
Harvey 2014 RCT |
Acute care admissions, mean (SD) | 6 months | 0.51 (0.76) | 57 | 0.44 (0.79) | 59 | NR | NR | t‐test | P = 0.60 | — |
| Acute care readmissions, total number | 6 months | 29 | 57 | 26 | 59 | NR | NR | Chi2 test | P = 0.47 | — | |
| Proportion of patients with an admission following the ED visit | 6 months | 21 | 57 | 19 | 59 | NR | NR | NR | NR | Data provided by study authors | |
|
Cordato 2018 RCT |
Hospital admissions, n admissions | 6 months | 7 | 22 | 18 | 21 | NR | NR | NR | NR | One patient could have > 1 admission Authors confirmed via email communication that all hospitalisations were unplanned |
| Hospital admissions, mean (SD) | 6 months | 0.3 (0.6) | 22 | 0.9 (1.0) | 21 | NR | NR | t‐test | P = 0.03 | Authors confirmed via email communication that all hospitalisations were unplanned | |
| 3. Adverse effects (defined as infections, falls and pressure ulcers), reported at longest follow‐up | |||||||||||
| Outcome not measured in any of the trials | |||||||||||
| 4. Adherence to clinical guideline‐recommended care, reported at longest follow‐up | |||||||||||
| Outcome not measured in any of the trials | |||||||||||
| 5. Health‐related quality of life of residents, as measured by generic scales (e.g. 36‐item Short Form Health Survey (SF‐36) (mental component score) or EuroQol 5 dimensions (EQ5D)) at longest follow‐up. If no generic scale was available, we used a disease‐specific quality of life scale, if available. | |||||||||||
|
Cordato 2018 RCT |
The Assessment of Quality of Life (AQoL; if MMSE ≥ 20) or the DEMQOL (if MMSE < 20; family acted as proxy) as quality of life measures | 6 months | NR | 22 | NR | 21 | NR | NR | NR | NR | Data provided by study authors. Additional comment by authors: "Data collection for Quality of Life was incomplete due to patient death, participant difficulties with completion of questionnaires (standardised questionnaires proved onerous for these frail patients) etc. These data have not been submitted for publication to date." |
| 6. Mortality, reported at longest follow‐up | |||||||||||
|
Cordato 2018 RCT |
Deaths of residents, n | 6 months | 8 | 22 | 6 | 21 | NR | NR | NR | NR | — |
|
Harvey 2014 RCT |
Deaths of residents, n | 6 months | 22 | 57 | 22 | 59 | NR | NR | Chi2 test | P > 0.05 | — |
| 7. Resource use (i.e. resources needed to deliver the intervention, total costs of care or types of care (e.g. hospital care, GP care), economic outcomes from cost‐effectiveness analyses, cost‐utility analyses or cost‐benefit analyses) | |||||||||||
| Economic outcomes reported in Table 14 | |||||||||||
| 8. Access to primary or specialist healthcare services (e.g. waiting times to see the GP or specialist), reported at longest follow‐up | |||||||||||
| Outcome not measured in any of the trials | |||||||||||
| 9. Any hospital admissions, reported at longest follow‐up | |||||||||||
|
Harvey 2014 RCT |
Acute and sub‐acute hospitalisation, n | 6 months | 33 | 57 | 32 | 59 | NR | NR | Chi2 test | P = 0.61 | Published paper Table 3; 1 patient could have > 1 hospitalisation Additional information provided by authors: "Our primary outcome measure was unplanned 6 month hospital readmissions and this mainly relates to acute unplanned admissions. Some of the acute admissions were followed by subacute rehabilitation/geriatric evaluation and management admissions before people returned to their aged cate facilities." |
| Readmission rate overall | 6 months | 22 | 57 | 20 | 59 | — | — | — | — | Text of published paper: overall readmission rate was 36%; used these data in our analyses | |
| Acute and sub‐acute hospitalisation, mean (SD) | 6 months | 0.58 (0.84) | 57 | 0.54 (0.93) | 59 | NR | NR | t‐test | P = 0.8 | — | |
| 10. Length of stay for any hospital admission, at longest follow‐up | |||||||||||
|
Cordato 2018 RCT |
Inpatient days, n | 6 months | 47 | 22 | 122 | 21 | NR | NR | NR | NR | — |
| Inpatient days, mean (SD) | 6 months | 2.1 (4.3) | 22 | 5.8 (7.3) | 21 | NR | NR | t‐test | P = 0.05 | — | |
|
Harvey 2014 RCT |
Number of bed‐days, n | 6 months | 271 | 57 | 372 | 59 | NR | NR | NR | NR | — |
| Number of bed‐days, mean (SD) | 6 months | 4.8 (9.2) | 57 | 6.3 (17.2) | 59 | NR | NR | t‐test | P = 0.55 | — | |
| 11. Residents’ satisfaction with the health care received, as measured by the trial and reported at longest follow‐up | |||||||||||
|
Harvey 2014 RCT |
Overall satisfaction, % satisfied = number of respondents selecting “useful or very useful” or “satisfied or very satisfied” and for response times “very good or excellent” | 6 months | 19 | 20 | 14 | 24 | NR | NR | Chi2 test | P = 0.006 | Participation rate (49%) |
| 12. 'Next of kin' satisfaction with the health care provided to the resident, as measured by the trial and reported at longest follow‐up | |||||||||||
| Outcome not measured in any of the trials | |||||||||||
| 13. Work‐related satisfaction of ACF staff, pertaining to the health care provided to the residents, as measured in the trial and reported at longest follow‐up | |||||||||||
| Outcome not measured in any of the trials | |||||||||||
| 14. Work‐related stress/burnout of ACF staff, as measured in the trial and reported at longest follow‐up | |||||||||||
| Outcome not measured in any of the trials | |||||||||||
ACF: aged care facility; CI: confidence interval; ED: emergency department; GP: general practitioner; MMSE: Mini‐Mental State Examination; NR: not reported; RCT: randomised controlled trial; SD: standard deviation
8. Structured summary of effects in trials from CO‐ORDINATION OF CARE (Case management) category.
| Study ID | Outcome definition | Timing of the measurement | Intervention group | Control group | Effect estimate metric | 95% CI | Statistical test | P value | Notes | ||
| Outcome | N participants | Outcome | N participants | ||||||||
| 1. Emergency department visits, reported at longest follow‐up | |||||||||||
|
Agar 2017 cRCT |
ED presentation without hospital admission, n | Last months of life | 6 | 67 | 6 | 64 | NR | NR | NR | P > 0.05 | Outcome based on residents who died Authors have not reported whether one patient could have multiple ED admissions. Analyses for this review made this assumption. |
|
Van den Block 2020 cRCT |
Residents with at least 1 ED visit (Did the resident visit the ED in the last month of life? (yes)) | Measured over the last month of life, at T1 + T2 time points: 13 through 17 months (one measurement per resident) (email authors: "In PACE, data was collected retrospectively for deceased residents. Each measurement point (T0, T1 and T1) comprised of different deceased residents. We handled the T1 and T2 data of deceased residents as one group (post‐intervention) because of a lower‐than‐expected response rate." |
72 | 385 | 71 | 533 | Cluster adjusted OR 1.38 | 0.73 to 2.62 | Cluster‐adjusted OR from GLMM | Interaction P = 0.32 | — |
| 2. Unplanned hospital admissions, reported at longest follow‐up | |||||||||||
|
Forbat 2020 SWcRCT |
Hospital admissions > 24 h, n per facility‐month | 74 months control/124 months intervention | 4.3 | 1700 | 5.6 | 1152 | NR | NR | NR | NR | Authors do not explicitly define the outcome as unplanned hospital admissions, however "reducing time in acute hospitals" is the aim of the study; see Appendix 5 |
| Hospital admissions (< 24 h, presentations to hospital), n per facility‐month | 74 months control/124 months intervention | 1 | 1700 | 1.1 | 1152 | NR | NR | NR | NR | Authors do not explicitly define the outcome as unplanned hospital admissions, however "reducing time in acute hospitals" is the aim of the study; see Appendix 5 | |
| 3. Adverse effects (defined as infections, falls and pressure ulcers), reported at longest follow‐up | |||||||||||
|
Forbat 2020 SWcRCT |
Harms, adverse events, unintended consequences | 74 months control/124 months intervention | 0 | 1700 | 0 | 1152 | NR | NR | NR | NR | Not used in meta‐analyses as authors have not specified whether falls, infections or pressure ulcers were considered as adverse effects |
| 4. Adherence to clinical guideline‐recommended care, reported at longest follow‐up | |||||||||||
| Outcome not measured in any of the trials | |||||||||||
| 5. Health‐related quality of life of residents, as measured by generic scales (e.g. 36‐item Short Form Health Survey (SF‐36) (mental component score) or EuroQol 5 dimensions (EQ5D)) at longest follow‐up. If no generic scale was available, we used a disease‐specific quality of life scale, if available. | |||||||||||
|
Lichtwarck 2018 cRCT |
Quality of Life in Late‐stage Dementia Scale, higher scores indicate lesser quality of life, mean value (95% CI per group) | Week 12 | 27.2 (25.3 to 29.1) | 86 | 29.6 (27.8 to 31.5) | 116 | Standardised mean difference from 9 to 12 weeks 0.17 | NR | LMM | 0.044 | ICC = 14.6% |
|
Van den Block 2020 cRCT |
Quality of life EQ‐5D‐5L (scale 0 to 1) | 13 through 17 months (one measurement per resident) (email authors: "In PACE, data was collected retrospectively for diseased residents. Each measurement point (T0, T1 and T1) comprised of different diseased residents. We handled the T1 and T2 data of diseased residents as one group (post‐intervention) because of a lower‐than‐expected response rate. Therefore, the EQ5D values are averages of all residents included on T1 and T2)" |
0.186*/0.160** | 425 | 0.196*/0.160** | 558 | MD ‐0.038* | 0.087 to 0.011 (Possible typo in published paper; we assumed it should be ‐0.087 and used this in the analyses; authors have not responded) |
LMM adjusted for age, gender, disease severity, baseline case mix, country and treatment group | 0.13 | *Reported by staff member; **reported by relative We used an overall estimate of effect (MD ‐0.038, 95% CI 0.087 to 0.011; LMM adjusted for age, gender, disease severity, baseline case mix, country and treatment group) in the analyses (see Wichmann 2020) |
| 6. Mortality, reported at longest follow‐up | |||||||||||
|
Agar 2017 cRCT |
Number of patients who died | 18 months | 67 | 156 | 64 | 130 | NR | NR | NR | NR | Other study outcomes are analysed only for residents who died |
|
Forbat 2020 SWcRCT |
Death of the residents, n | 74 months control/124 months intervention | 303 | 1700 | 234 | 1152 | NR | NR | NR | NR | — |
|
Lichtwarck 2018 cRCT |
Death of the residents, n | Week 12 | 10 | 104 | 5 | 125 | NR | NR | NR | NR | Extracted from the flowchart |
| 7. Resource use (i.e. resources needed to deliver the intervention, total costs of care or types of care (e.g. hospital care, GP care), economic outcomes from cost‐effectiveness analyses, cost‐utility analyses or cost‐benefit analyses) | |||||||||||
| Economic outcomes reported in Table 14 | |||||||||||
| 8. Access to primary or specialist healthcare services (e.g. waiting times to see the GP or specialist), reported at longest follow‐up | |||||||||||
| Outcome not measured in any of the trials | |||||||||||
| 9. Any hospital admissions, reported at longest follow‐up | |||||||||||
|
Agar 2017 cRCT |
At least one hospital admission, n | Last months of life | 13 | 67 | 11 | 64 | NR | NR | NR | P > 0.05 | Outcome based on residents who died |
|
Van den Block 2020 cRCT |
Any hospital admission (Was the resident admitted to a hospital in the last month of life? (yes)) | Measured over the last month of life, at T1 + T2 time points: 13 through 17 months (one measurement per resident) (email authors: "In PACE, data was collected retrospectively for diseased residents. Each measurement point (T0, T1 and T1) comprised of different diseased residents. We handled the T1 and T2 data of diseased residents as one group (post‐intervention) because of a lower‐than‐expected response rate" |
100 (99 in Table 4) | 371 | 127 | 517 | OR 0.98 | 0.57 to 1.66 | Cluster‐adjusted OR from GLMM | Interaction P = 0.93 | See Honinx 2020 |
|
Forbat 2020 SWcRCT |
Hospital admissions > 24 h, n per facility‐month | 74 months control/124 months intervention | 4.3 | 1700 | 5.6 | 1152 | NR | NR | NR | NR | Authors do not explicitly define the outcome as unplanned hospital admissions, however "reducing time in acute hospitals" is the aim of the study; used this data for Unplanned admissions; see Appendix 5 |
| Hospital admissions (< 24 h, presentations to hospital), n per facility‐month | 74 months control/124 months intervention | 1 | 1700 | 1.1 | 1152 | NR | NR | NR | NR | Authors do not explicitly define the outcome as unplanned hospital admissions, however "reducing time in acute hospitals" is the aim of the study; see Appendix 5 | |
| 10. Length of stay for any hospital admission, at longest follow‐up | |||||||||||
|
Agar 2017 cRCT |
Hospital lengths of stay, median (IQR) | Last months of life | 2 (4) | 67 | 5 (5) | 64 | NR | NR | NR | P > 0.05 | Outcome based on residents who died |
|
Forbat 2020 SWcRCT |
Bed‐days, n per facility‐month | 74 months control/124 months intervention | 27 | 1700 | 39 | 1152 | — | — | — | — | — |
| Length of stay for those admitted and discharged, mean (SD) days per resident | 74 months control/124 months intervention | 6.4 (8.3) | 1700 | 6.9 (9.1) | 1152 | Adjusted treatment effect* ‐0.22 | ‐0.44 to ‐0.01 | GLMM | 0.038 | *Adjusted for demographics, resident characteristics, fidelity and duration of exposure (analyses not pre‐specified in the protocol) | |
|
Van den Block 2020 cRCT |
If admitted to hospital in last month of life, average length of stay in hospital in days (cluster‐unadjusted mean, SD) | Measured over the last month of life, at T1 + T2 time points: 13 through 17 months (one measurement per resident) (email authors: "In PACE, data was collected retrospectively for diseased residents. Each measurement point (T0, T1 and T1) comprised of different diseased residents. We handled the T1 and T2 data of diseased residents as one group (post‐intervention) because of a lower‐than‐expected response rate." |
7.08 (5.75) (unadjusted mean LOS per admitted resident) | 100 admitted/371 | 7.31 (7.36) (unadjusted mean LOS per admitted resident) | 127 admitted/517 | Adjusted estimated geometric MD 0.85 | 0.53 to 1.31 | GLMM | Interaction P = 0.44 | Honinx 2020: Table 3; mean (SD) LOS for those not admitted: 0 (0); used online calculator (http://atozmath.com/CONM/Ch2_CombinedSD.aspx) to calculate combined mean and SD of admitted residents and non‐admitted residents; calculated combined mean (SD): 1.9084 (4.3337) intervention; 1.7957 (4.8175) control |
| 11. Residents’ satisfaction with the health care received, as measured by the trial and reported at longest follow‐up | |||||||||||
| Outcome not measured in any of the trials | |||||||||||
| 12. 'Next of kin' satisfaction with the health care provided to the resident, as measured by the trial and reported at longest follow‐up | |||||||||||
|
Agar 2017 cRCT |
Family/caregiver satisfaction with care during last 90 days of life (satisfaction with care ‐ end of life in dementia (SWC ‐ EOLD), mean (SD) | 4 to 6 weeks after resident's death | 31.0 (5.3) | 67 | 30.3 (4.2) | 64 | NR | NR | NR | NR | Outcome based on residents who died; "ICCs for the CAD‐EOLD and SWC‐EOLD were less than assumed (0.008 and negative respectively)" |
|
Van den Block 2020 cRCT |
Relatives’ perception of the quality of end‐of‐life care with End‐of‐Life in Dementia – Satisfaction with Care (EOLDSWC) (range 10 to 40) (Higher scores indicate better quality of end‐of‐life care) |
13 through 17 months (one measurement per resident), at T1+T2 time points: 13 through 17 months (one measurement per resident) (email authors: "In PACE, data was collected retrospectively for diseased residents. Each measurement point (T0, T1 and T1) comprised of different diseased residents. We handled the T1 and T2 data of diseased residents as one group (post‐intervention) because of a lower‐than‐expected response rate." |
32.27 (30.88 to 33.66) | 215 | 32.33 (31.01 to 33.64) | 256 | Baseline‐adjusted MD between groups post‐intervention 1.72 |
‐0.15 to 3.59 | LMM | 0.07* | *Interaction effect of group (control and intervention) and time point (baseline and post‐intervention), calculated with a mixed linear regression model. Differences were calculated in change (post‐intervention minus baseline) between the intervention and control groups (interaction group x time). |
| 13. Work‐related satisfaction of ACF staff, pertaining to the health care provided to the residents, as measured in the trial and reported at longest follow‐up | |||||||||||
| Outcome not measured in any of the trials | |||||||||||
| 14. Work‐related stress/burnout of ACF staff, as measured in the trial and reported at longest follow‐up | |||||||||||
| Outcome not measured in any of the trials | |||||||||||
ACF: aged care facility; cRCT: cluster‐randomised controlled trial; CI: confidence interval; ED: emergency department; GLMM: generalised linear mixed model; GP: general practitioner; LMM: linear mixed model; LOS: length of stay; MD: mean difference; NR: not reported; OR: odds ratio; RCT: randomised controlled trial; SD: standard deviation; SWcRCT: stepped‐wedge cluster‐randomised controlled trial
9. Structured summary of effects in trials from CO‐ORDINATION OF CARE (Care pathway) category.
| Study ID | Outcome definition | Timing of the measurement | Intervention group | Control group | Effect estimate metric | 95% CI | Statistical test | P value | Notes | ||
| Outcome | N participants | Outcome | N participants | ||||||||
| 1. Emergency department visits, reported at longest follow‐up | |||||||||||
|
Loeb 2006 cRCT |
Visits to ED without admission, n residents | 30 days | 7 | 314 | 14 | 347 | NR | NR | NR | NR | — |
| Visits to ED without admission, weighted mean rate per facility (%) | 30 days | 1.2 | 314 | 1.6 | 347 | MD 0.4 | ‐1.9 to 2.8 | t‐test weighted by an inverse variance | P = 0.072 | — | |
| 2. Unplanned hospital admissions, reported at longest follow‐up | |||||||||||
| Outcome not measured in any of the trials | |||||||||||
|
Loeb 2005 cRCT |
Admission to hospital for sepsis of suspected urinary origin or of unknown origin, rate per 1000 resident‐days | 12 months | 0.026 | 2156 | 0.018 | 2061 | Weighted MD 0.008 | ‐0.025 to 0.039 | Paired t‐test weighted by size of the nursing home | NR | — |
|
Loeb 2006 cRCT |
Number of residents with hospitalisation, n residents | 30 days | 34 | 314 | 76 | 347 | NR | NR | NR | NR | "Of the residents in the clinical pathway group who were hospitalized, 4 were admitted for reasons other than pneumonia or lower respiratory tract infection, 1 for each of the following: elective surgery, fecal impaction, vertigo (at the family’s insistence), and high international normalized ratio. In the usual care group, 2 residents were transferred for reasons other than pneumonia (1 due to stroke and 1 due to gastrointestinal bleed)" |
| Hospitalisation, weighted mean rate per facility (%) | 30 days | 8 | 314 | 20 | 347 | MD ‐12 | ‐5 to ‐18 | t‐test weighted by an inverse binomial variance | p=0.001 | Review authors divided the mean and 95% CI by 100 to adjust for the %; no further adjustments for clustering | |
|
Rutten 2022 cRCT |
Urinary tract infection‐related hospitalisations, n | 21 days | 4 | 132 residents/180 suspected infections | 1 | 106 residents/101 suspected infections | NR | NR | NR | NR | For analyses in this review, N residents is taken as denominator |
| 3. Adverse effects (defined as infections, falls and pressure ulcers), reported at longest follow‐up | |||||||||||
|
Loeb 2006 cRCT |
Catheter‐related urinary infections, n residents | 30 days | 0 | 314 | 1 | 347 | NR | NR | NR | NR | — |
| Catheter‐related urinary infections, weighted mean rate per facility (%) | 30 days | NR | 314 | NR | 347 | MD 0.3 | ‐0.94 to 1.61 | t‐test weighted by an inverse binomial variance | P > 0.99 | — | |
| Skin and soft tissue infections, n residents | 30 days | 8 | 314 | 5 | 347 | NR | NR | NR | NR | — | |
| Skin and soft tissue infections, weighted mean rate per facility (%) | 30 days | NR | 314 | NR | 347 | MD ‐1.1 | ‐1.2 to 3.8 | t‐test weighted by an inverse binomial variance | P = 0.30 | — | |
| Falls, weighted mean rate per facility (%) | 30 days | 10.9 | 314 | 9.5 | 347 | MD ‐1.3 | ‐6.6 to 3.9 | t‐test weighted by an inverse binomial variance | P = 0.60 | — | |
| 4. Adherence to clinical guideline‐recommended care, reported at longest follow‐up | |||||||||||
|
Rutten 2022 cRCT |
Appropriate antibiotic prescriptions, n | 21 days | 71 | 114 | 28 | 57 | OR 1.83 | 0.82 to 4.12 | GEE | P value interaction intervention*group 0.14 | Appropriate antibiotic prescription defined as prescribed in compliance with the treatment advice generated by the decision tool > 1 prescription per resident possible OR adjusted for patient characteristics 1.43 (0.57 to 3.62), P = 0.45 |
| 5. Health‐related quality of life of residents, as measured by generic scales (e.g. 36‐item Short Form Health Survey (SF‐36) (mental component score) or EuroQol 5 dimensions (EQ5D)) at longest follow‐up. If no generic scale was available, we used a disease‐specific quality of life scale, if available. | |||||||||||
|
Loeb 2006 cRCT |
The minimum Data Set Health Status Index V2 (0(dead)‐1(full health)), mean (95% CI)) change from baseline | 30 days | ‐0.032 (‐0.044 to ‐0.019) | 314 | ‐0.037 (‐0.050 to 0.023) | 347 | MD ‐0.005 | (‐0.022 to 0.012) | t‐test weighted by inverse variance | P = 0.055 | Only mean change from baseline provided (no baseline value, no mean at follow‐up for intervention and control) |
|
Pieper 2016 cRCT |
Quality of life, QUALIDEM scale ‘care relationship’, mean change (β (SE) from linear mixed model (unadjusted/adjusted for Katz ADL index and Reisberg GDS*)) | Average over period 3 to 6 months | 0.03 (0.22)/0.03 (0.22) | 148 | Reference group | 140 | NR | ‐0.40 to 0.47/‐0.40 to 0.47 | LMM | NR | *GDS ‐ The Global Deterioration Scale |
| Quality of life, QUALIDEM scale ‘Positive affect’, mean change (β (SE) from linear mixed model (unadjusted/adjusted for Katz ADL index and Reisberg GDS*)) | Average over period 3 to 6 months | ‐0.21 (0.32)/‐0.20 (0.32) | 148 | Reference group | 140 | NR | ‐0.84 to 0.43/‐0.84 to 0.43 | LMM | NR | *GDS ‐ The Global Deterioration Scale |
|
| Quality of life, QUALIDEM scale ‘Negative affect’, mean change (β (SE) from linear mixed model (unadjusted/adjusted for Katz ADL index and Reisberg GDS*)) | Average over period 3 to 6 months | ‐0.10 (0.19)/‐0.10 (0.19) | 148 | Reference group | 140 | NR | ‐0.47 to 0.26/‐0.47 to 0.27 | LMM | NR | *GDS ‐ The Global Deterioration Scale |
|
| Quality of life, QUALIDEM scale ‘Restless tense behavior’, mean change (β (SE) from linear mixed model (unadjusted/adjusted for Katz ADL index and Reisberg GDS*)) | Average over period 3 to 6 months | ‐0.98 (0.32)/‐0.98 (0.32) | 148 | Reference group | 140 | NR | ‐1.60 to ‐0.36/‐1.60 to ‐0.36 | LMM | NR | *GDS ‐ The Global Deterioration Scale |
|
| Quality of life, QUALIDEM scale ‘Social relations’, mean change (β (SE) from linear mixed model (unadjusted/adjusted for Katz ADL index and Reisberg GDS*)) | Average over period 3 to 6 months | 0.23 (0.25)/0.23 (0.25) | 148 | Reference group | 140 | NR | ‐0.26 to 0.72/‐0.26 to 0.72 | LMM | NR | *GDS ‐ The Global Deterioration Scale |
|
| Quality of life, QUALIDEM scale ‘Social isolation’, mean change (β (SE) from linear mixed model (unadjusted/adjusted for Katz ADL index and Reisberg GDS*)) | Average over period 3 to 6 months | 0.64 (0.27)/0.65 (0.27) | 148 | Reference group | 140 | NR | 0.12 to 1.17/0.12 to 1.17 | LMM | NR | *GDS ‐ The Global Deterioration Scale |
|
| 6. Mortality, reported at longest follow‐up | |||||||||||
|
Kotynia‐English 2005 RCT |
Death of the residents, n | 12 months | 15 | 53 | 8 | 53 | X=2.72 | NR | Pearson's Chi2 | 0.099 | — |
|
Loeb 2005 cRCT |
Death of the residents, mean rate per 1000 resident‐days | 12 months | 1.11 | 2156 | 1.09 | 2061 | Weighted MD 0.07 | ‐0.22 to 0.36 | Paired t‐test weighted by size of the nursing home | NR | Number of deaths in each group calculated by review authors based on the reported mortality rate per group: 741/1896 intervention, 740/1858 control |
|
Loeb 2006 cRCT |
Death of the residents, n | 30 days | 24 | 314 | 32 | 347 | NR | NR | NR | NR | — |
| Death of the residents, weighted mean rate (%) | 30 days | 3.1 | 314 | 6.0 | 347 | MD 2.9 | ‐2.0 to 7.9 | t‐test weighted by an inverse binomial variance | P = 0.23 | — | |
|
Pieper 2016 cRCT |
Death of the residents, n | 6 months | 29 | 148 | 29 | 140 | NR | NR | NR | NR | Extracted from flowchart |
|
Rutten 2022 cRCT |
Urinary tract infection‐related death of the residents, n | 21 days | 4 | 132 residents/180 suspected infections | 2 | 106 residents/101 suspected infections | NR | NR | NR | NR | For analyses in this review, N residents is taken as denominator |
| 7. Resource use (i.e. resources needed to deliver the intervention, total costs of care or types of care (e.g. hospital care, GP care), economic outcomes from cost‐effectiveness analyses, cost‐utility analyses or cost‐benefit analyses) | |||||||||||
| Economic outcomes reported in Table 14 | |||||||||||
| 8. Access to primary or specialist healthcare services (e.g. waiting times to see the GP or specialist), reported at longest follow‐up | |||||||||||
| Outcome not measured in any of the trials | |||||||||||
| 9. Any hospital admissions, reported at longest follow‐up | |||||||||||
|
Loeb 2005 cRCT |
All‐cause admission to hospital, rate per 1000 resident‐days | 12 months | 0.98 | 2156 | 0.81 | 2061 | MD 0.17 | ‐0.14 to 0.48 | Paired t‐test weighted by size of the nursing home | P > 0.05 | — |
|
Rutten 2022 cRCT |
Urinary tract infection‐related hospitalisations, n | 21 days | 4 | 132 residents/180 suspected infections | 1 | 106 residents/101 suspected infections | NR | NR | NR | NR | For analyses in this review, N residents is taken as denominator |
| 10. Length of stay for any hospital admission, at longest follow‐up | |||||||||||
|
Loeb 2006 cRCT |
Hospital days per resident, weighted mean rate | 30 days | 0.79 | 314 | 1.74 | 347 | MD 0.95 | 0.34 to 1.55 | t‐test weighted by an inverse variance | P = 0.004 | — |
| 11. Residents’ satisfaction with the health care received, as measured by the trial and reported at longest follow‐up | |||||||||||
| Outcome not measured in any of the trials | |||||||||||
| 12. 'Next of kin' satisfaction with the health care provided to the resident, as measured by the trial and reported at longest follow‐up | |||||||||||
| Outcome not measured in any of the trials | |||||||||||
| 13. Work‐related satisfaction of ACF staff, pertaining to the health care provided to the residents, as measured in the trial and reported at longest follow‐up | |||||||||||
| Outcome not measured in any of the trials | |||||||||||
| 14. Work‐related stress/burnout of ACF staff, as measured in the trial and reported at longest follow‐up | |||||||||||
| Outcome not measured in any of the trials | |||||||||||
ACF: aged care facility; cRCT: cluster‐randomised controlled trial; CI: confidence interval; ED: emergency department; GEE: generalised estimating equations; GP: general practitioner; LMM: linear mixed model; MD: mean difference; NR: not reported; OR: odds ratio; SE: standard error
10. Structured summary of effects in trials from CO‐ORDINATION OF CARE (Comprehensive geriatric assessment) category.
| Study ID | Outcome definition | Timing of the measurement | Intervention group | Control group | Effect estimate metric | 95% CI | Statistical test | P value | Notes | ||
| Outcome | N participants | Outcome | N participants | ||||||||
| 1. Emergency department visits, reported at longest follow‐up | |||||||||||
|
Cavalieri 1993 RCT |
Emergency room visits, n | 12 months | NR | 33 | NR | 36 | NR | NR | NR | P > 0.05 | — |
| 2. Unplanned hospital admissions, reported at longest follow‐up | |||||||||||
| Outcome not measured in any of the trials | |||||||||||
| 3. Adverse effects (defined as infections, falls and pressure ulcers), reported at longest follow‐up | |||||||||||
|
Rubenstein 1990 RCT |
N residents with subsequent falls, N (%) | 2 years | 64 (81.0%) | 79 | 68 (83.9%) | 81 | Percent difference (NR) | ‐8.9‐14.7 | z‐test of proportions | P > 0.05 | — |
| Mean (SE) subsequent falls per subject | 2 years | 4,09 (0.53) SD* = 4.71 |
79 | 4.51 (0.53) SD* = 4.77 |
81 | MD (NR) | NR | t‐test | P > 0.05 | *SD calculated by review authors as SE*sqrt(N) | |
| 4. Adherence to clinical guideline‐recommended care, reported at longest follow‐up | |||||||||||
| Outcome not measured in any of the trials | |||||||||||
| 5. Health‐related quality of life of residents, as measured by generic scales (e.g. 36‐item Short Form Health Survey (SF‐36) (mental component score) or EuroQol 5 dimensions (EQ5D)) at longest follow‐up. If no generic scale was available, we used a disease‐specific quality of life scale, if available. | |||||||||||
| Outcome not measured in any of the trials | |||||||||||
| 6. Mortality, reported at longest follow‐up | |||||||||||
|
Rubenstein 1990 RCT |
Number of deaths, N (%) | 2 years | 17 (21.5%) | 79 | 21 (25.9%) | 81 | Percent difference (NR) | ‐8.8‐17.6 | z‐test for proportions | P > 0.05 | — |
| 7. Resource use (i.e. resources needed to deliver the intervention, total costs of care or types of care (e.g. hospital care, GP care), economic outcomes from cost‐effectiveness analyses, cost‐utility analyses or cost‐benefit analyses) | |||||||||||
| Outcome not measured in any of the trials | |||||||||||
| 8. Access to primary or specialist healthcare services (e.g. waiting times to see the GP or specialist), reported at longest follow‐up | |||||||||||
| Outcome not measured in any of the trials | |||||||||||
| 9. Any hospital admissions, reported at longest follow‐up | |||||||||||
|
Cavalieri 1993 RCT |
Hospital admission, mean n | 12 months | 0.6 | 33 | 0.6 | 36 | NR | NR | NR | P > 0.05 | — |
|
Rubenstein 1990 RCT |
Subjects hospitalised, N (%) | 2 years | 36 (45.6%) | 79 | 50 (61.7%) | 81 | Percent difference (NR) | 0.8‐31.4 | z‐test for proportions | P < 0.05 | — |
| Mean (SE) admissions per subject | 2 years | 0.66 (0.10) SD* = 0.89 |
79 | 1.25 (0.15) SD* = 1.35 |
81 | MD (NR) | NR | t‐test | P < 0.01 | *SD calculated by review authors as SE*sqrt(N) | |
| 10. Length of stay for any hospital admission, at longest follow‐up | |||||||||||
| Outcome not measured in any of the trials | |||||||||||
| 11. Residents’ satisfaction with the health care received, as measured by the trial and reported at longest follow‐up | |||||||||||
| Outcome not measured in any of the trials | |||||||||||
| 12. 'Next of kin' satisfaction with the health care provided to the resident, as measured by the trial and reported at longest follow‐up | |||||||||||
| Outcome not measured in any of the trials | |||||||||||
| 13. Work‐related satisfaction of ACF staff, pertaining to the health care provided to the residents, as measured in the trial and reported at longest follow‐up | |||||||||||
| Outcome not measured in any of the trials | |||||||||||
| 14. Work‐related stress/burnout of ACF staff, as measured in the trial and reported at longest follow‐up | |||||||||||
| Outcome not measured in any of the trials | |||||||||||
ACF: aged care facility; CI: confidence interval; GP: general practitioner; MD: mean difference; NR: not reported; RCT: randomised controlled trial; SD: standard deviation; SE: standard error
11. Structured summary of effects in trials from CO‐ORDINATION OF CARE (Continuity of care) category.
| Author, year; design | Outcome definition | Timing of the measurement | Intervention group | Control group | Effect estimate metric | 95% CI | Statistical test | P value | Notes | ||
| Outcome | N participants | Outcome | N participants | ||||||||
| 1. Emergency department visits, reported at longest follow‐up | |||||||||||
| Outcome measured but not reported as published or unpublished data | |||||||||||
| 2. Unplanned hospital admissions, reported at longest follow‐up | |||||||||||
| Outcome not measured in any of the trials | |||||||||||
| 3. Adverse effects (defined as infections, falls and pressure ulcers), reported at longest follow‐up | |||||||||||
|
Kim 2020 incomplete SWcRCT |
Important adverse events or side effects (not further defined) | 6 months | 0 | 431 (at baseline) | 0 | 482 (at baseline) | NR | NR | NR | NR | Not used in meta‐analyses as authors have not specified whether falls, infections or pressure ulcers were considered as adverse effects |
| 4. Adherence to clinical guideline‐recommended care, reported at longest follow‐up | |||||||||||
| Outcome not measured in any of the trials | |||||||||||
| 5. Health‐related quality of life of residents, as measured by generic scales (e.g. 36‐item Short Form Health Survey (SF‐36) (mental component score) or EuroQol 5 dimensions (EQ5D)) at longest follow‐up. If no generic scale was available, we used a disease‐specific quality of life scale, if available. | |||||||||||
| Outcome measured but not reported as published or unpublished data | |||||||||||
| 6. Mortality, reported at longest follow‐up | |||||||||||
|
Kim 2020 incomplete SWcRCT |
Death of the residents, n | 3 months | 19 | 482 | 17 | 525 | NR | NR | NR | NR | Extracted from flowchart |
| 7. Resource use (i.e. resources needed to deliver the intervention, total costs of care or types of care (e.g. hospital care, GP care), economic outcomes from cost‐effectiveness analyses, cost‐utility analyses or cost‐benefit analyses) | |||||||||||
| Outcome measured but not reported as published or unpublished data | |||||||||||
| 8. Access to primary or specialist healthcare services (e.g. waiting times to see the GP or specialist), reported at longest follow‐up | |||||||||||
| Outcome not measured in any of the trials | |||||||||||
| 9. Any hospital admissions, reported at longest follow‐up | |||||||||||
| Outcome measured but not reported as published or unpublished data | |||||||||||
| 10. Length of stay for any hospital admission, at longest follow‐up | |||||||||||
| Outcome measured but not reported as published or unpublished data | |||||||||||
| 11. Residents’ satisfaction with the health care received, as measured by the trial and reported at longest follow‐up | |||||||||||
| Outcome measured but not reported as published or unpublished data | |||||||||||
| 12. 'Next of kin' satisfaction with the health care provided to the resident, as measured by the trial and reported at longest follow‐up | |||||||||||
| Outcome not measured in any of the trials | |||||||||||
| 13. Work‐related satisfaction of ACF staff, pertaining to the health care provided to the residents, as measured in the trial and reported at longest follow‐up | |||||||||||
| Outcome measured but not reported as published or unpublished data | |||||||||||
| 14. Work‐related stress/burnout of ACF staff, as measured in the trial and reported at longest follow‐up | |||||||||||
| Outcome not measured in any of the trials | |||||||||||
ACF: aged care facility; CI: confidence interval; GP: general practitioner; NR: not reported; SWcRCT: stepped‐wedge cluster‐randomised controlled trial
12. Structured summary of effects in trials from ICT (Telemedicine) category.
| Study ID | Outcome definition | Timing of the measurement | Intervention group | Control group | Effect estimate metric | 95% CI | Statistical test | P value | Notes | ||
| Outcome | N participants | Outcome | N participants | ||||||||
| 1. Emergency department visits, reported at longest follow‐up | |||||||||||
| Outcome not measured in any of the trials | |||||||||||
| 2. Unplanned hospital admissions, reported at longest follow‐up | |||||||||||
| Outcome not measured in any of the trials | |||||||||||
| 3. Adverse effects (defined as infections, falls and pressure ulcers), reported at longest follow‐up | |||||||||||
| Outcome not measured in any of the trials | |||||||||||
| 4. Adherence to clinical guideline‐recommended care, reported at longest follow‐up | |||||||||||
| Outcome not measured in any of the trials | |||||||||||
| 5. Health‐related quality of life of residents, as measured by generic scales (e.g. 36‐item Short Form Health Survey (SF‐36) (mental component score) or EuroQol 5 dimensions (EQ5D)) at longest follow‐up. If no generic scale was available, we used a disease‐specific quality of life scale, if available. | |||||||||||
|
De Luca 2016 RCT |
EQ‐5D, median (IQR) | Follow‐up (no details) | 8.0 (7.5 to 9.0) | 32 | 5.0 (4.0 to 6.0) | 27 | NR | NR | NR | NR | Authors reported "At follow‐up (T1) we found significant differences concerning EUROQoL (p=0.001)" |
| 6. Mortality, reported at longest follow‐up | |||||||||||
|
Dy 2013 RCT |
Number of residents who died | 6 months | 3 | 12 | 2 | 11 | NR | NR | NR | NR | Death from comorbidities not related to the intervention |
| 7. Resource use (i.e. resources needed to deliver the intervention, total costs of care or types of care (e.g. hospital care, GP care), economic outcomes from cost‐effectiveness analyses, cost‐utility analyses or cost‐benefit analyses) | |||||||||||
| Economic outcomes reported in Table 14 | |||||||||||
| 8. Access to primary or specialist healthcare services (e.g. waiting times to see the GP or specialist), reported at longest follow‐up | |||||||||||
| Outcome not measured in any of the trials | |||||||||||
| 9. Any hospital admissions, reported at longest follow‐up | |||||||||||
|
Grabowski 2014 cRCT |
Any hospitalisation, per 1000 nursing home resident days | 11 months | 3.16 | NR | 3.58 | NR | NR | NR | NR | NR | Also presented by subgroups: more and less engaged facilities |
| % reduction in hospitalisations compared to baseline | 11 months | 9.7 (from 3.50 to 3.16) | NR | 5.3 (from 3.78 to 3.58) | NR | NR | NR | NR | NR | — | |
| 10. Length of stay for any hospital admission, at longest follow‐up | |||||||||||
| Outcome not measured in any of the trials | |||||||||||
| 11. Residents’ satisfaction with the health care received, as measured by the trial and reported at longest follow‐up | |||||||||||
|
Lin 2014 RCT |
Residents' satisfaction with the system, mean score on a 1 to 5 Likert scale, the higher the better | 4 weeks | 3.7 (0.2) | 11 | 3.6 (0.2) | 9 | NR | NR | Non‐parametric Mann‐Whitney U‐test | P > 0.05 | — |
| Residents' satisfaction with the environment, mean score on a 1 to 5 Likert scale, the higher the better | 4 weeks | 3.8 (0.1) | 11 | 3.9 (0.1) | 9 | NR | NR | Non‐parametric Mann‐Whitney U‐test | P > 0.05 | — | |
| 12. 'Next of kin' satisfaction with the health care provided to the resident, as measured by the trial and reported at longest follow‐up | |||||||||||
| Outcome not measured in any of the trials | |||||||||||
| 13. Work‐related satisfaction of ACF staff, pertaining to the health care provided to the residents, as measured in the trial and reported at longest follow‐up | |||||||||||
|
Dy 2013 USA |
Nurse satisfaction survey (details not provided) | 6 months | NR | 12 | NR | 11 | NR | NR | NR | NR | Skilled nursing facility nurses reported that the videoconferences were a good use of their time and skills and were effective for delivery of endocrinology consults (3 of 5 nurses completed the survey) |
| 14. Work‐related stress/burnout of ACF staff, as measured in the trial and reported at longest follow‐up | |||||||||||
| Outcome not measured in any of the trials | |||||||||||
ACF: aged care facility; CI: confidence interval; cRCT: cluster‐randomised controlled trial; GP: general practitioner; IQR: interquartile range; NR: not reported; RCT: randomised controlled trial
13. Structured summary of costs outcomes.
| Study ID | EPOC category | Outcome definition | Timing of the measurement | Intervention group | Control group | Effect estimate metric | 95% CI | Statistical test | P value | Notes | ||
| Outcome | N participants | Outcome | N participants | |||||||||
| Total costs | ||||||||||||
|
Haines 2020 cRCT |
Who provides care (staffing models) | Total cost to aged care provider (ACP), per occupied bed‐day in AUD 2019 | Between 18 and 30 months, depending on the cluster | 181.0/191* | Mean (SD) occupied bed‐days 6255 (1800) Total occupied bed‐days 437,635 |
197.4/209* | Mean (SD) occupied bed‐days 6610 (2219) Total occupied bed‐days 330493 |
MD 16.4/17.4* | NR | NR | NR | Income per occupied bed‐day (OBD) increased from 240.8 (control) to 266.9 (intervention). In total, there were cost savings of AUD 9.7 per OBD after the implementation of the new model of care |
|
Haines 2020 cRCT |
Who provides care (staffing models) | Total costs to government (Federal and state; summed costs for Aged Care Funding Instrument, hospital, medicare, ambulance), per occupied bed day in AUD 2019 | Between 18 to 30 months depending on the cluster | 176.2/186* | Mean (SD) occupied bed‐days 6255 (1800) Total occupied bed‐days 437635 |
192.8/204* | Mean (SD) occupied bed‐days 6610 (2219) Total occupied bed‐days 330493 |
MD 16.6/17.5* | NR | NR | NR | There was a cost increase of AUD 19.6 per OBD for the federal government, driven mainly by increases in ACFI subsidies, and costs savings of AUD 3.0 per OBD for state governments, driven mainly by decreased costs of unplanned hospital transfers |
|
Boorsma 2011a cRCT |
Co‐ordination of care (Teams) | Total costs (informal care hours, primary and secondary care, medication use and intervention costs), mean (SD) per person in Euros (2007) | 6 months | 2061 (163)/ 6233 (493)* |
181 | 1656 (163)/ 5008 (493)* |
120 | MD 405/1225* |
‐13 to 826/‐39 to 2498* | NR | NR | Costs were calculated on an annual basis and then proportioned for the 6‐month trial |
|
Stern 2014 SWcRCT |
Co‐ordination of care (Teams) | Total direct care costs (personnel, treatment and supplies, hospital costs), mean per person in Canadian dollars (2012) | The time horizon was time until residents were first in a wound‐free state or were censored from the PUMTT study, whichever came first | 10,048/ 17,709* |
94 | 10,697/ 18,853* |
67 | MD ‐649/‐1144 |
NR | NR | NR | — |
|
Crotty 2019 RCT |
Co‐ordination of care (Teams) | Total costs (Australian Medicare costs including medical benefits schedule fees, pharmaceutical benefits schedule, inpatient costs (AR‐DRGs), intervention costs), mean (SD) per person in AUD (2015/16) | 12 months | 7,977 (825)/9568 (990)* | 119 | 5900 (855)/ 7077 (1026)* |
121 | MD 2097/ 2491* |
‐220 to 4360/ ‐264 to 5230* |
NR | NR | 95% CI is bootstrap MD |
|
Zwijsen 2014 SWcRCT |
Co‐ordination of care (Teams) | Costs of medication, physician time, psychologist time, training costs, mean (SD) per resident in Euros (2013) | 21 months | 931 (482)/ 2323 (1203)* |
325 | 483 (570)/ 1205 (1422)* |
327 | MD 276/ 689* |
237 to 349/ 591 to 871* |
LMM | NR | Because of the stepped‐wedge design, costs differences were adjusted for the amount of time a resident spent in a particular condition and clustering at the level of a care institution |
|
Forbat 2020 SWcRCT |
Co‐ordination of care (Case management) | Costs per facility‐month, AUD (2015/2016) | 124/74 months intervention/control | 3385/124 * 1286 AUD per day = 35,108/ 42,112* |
NR | 2876/74 *1286 AUD per day = 49.974/ 59,944* |
NR | MD 14,866/ 17,832* |
NR | NR | NR | — |
| Co‐ordination of care (Case management) | Overall net savings across 12 sites, AUD (2015/2016) | 12 months | NR | NR | NR | NR | MD 1,759,011/ 2,109,950* |
Needs Rounds were delivered by senior nurses, employed as nurse practitioners or clinical nurse consultants. To report a net cost‐saving, maximum staffing during the trial is based on 2 full‐time nurse practitioners, where annual salaries (plus on‐costs) were approximately AUD 381,716. Consequently, the overall annual estimated net cost‐saving across 12 sites was AUD 1,759,011 (USD 1.3 m; GBP 0.98 m), based on 12 monthly savings of AUD 14,866 × 12 sites, minus annual staffing of AUD 381,716. | ||||
|
Van den Block 2020 cRCT |
Co‐ordination of care (Case management) | Total costs (hospital admissions, visits of healthcare professionals, received intensive treatments like CPR or surgery (yes or no), intervention costs) in Euros (2017), mean | 1 month prior to death | 1963/ 4384 |
425 | 1410/ 3149 |
558 | ‐983^/ 2196 |
‐1762 to ‐321/‐3936 to ‐717 | Bootstrapping | Mixed model, non‐parametric bootstrapping | ^adjusted for age, gender, resident’s disease severity, country, baseline measurement and group |
|
Cordato 2018 RCT |
Co‐ordination of care (Discharge planning) | Total costs (including hospitalisations, ED costs, GP costs, intervention costs, investigative costs) mean (SD) per person in AUD (1 July 2014) | 6 months | 4175 (5006)/ 5317 (6375)* |
22 | 8358 (9051)/ 10,643 (11,526)* |
21 | Cohen’s d 0.57 MD ‐5327^ |
154 to 9221/ 196 to 11,743* |
t‐test | 0.07 | 95% CI is bootstrapped ^Calculated by review authors |
|
Loeb 2006 cRCT |
Co‐ordination of care (Care pathway) | Total initial assessment and treatment costs per resident, mean cost per resident in US dollars (2005, initially Canadian dollars 2005 were used and converted to US dollars at USD 1 = CAD 1.20) | 30 days | 165/ 443* |
314 | 77/ 207* |
347 | MD 87/ 234* |
83; 91 | NR | NR | Detailed costs (and mean utilisation) are also provided, namely: nurse administration of components of the clinical pathway, oxygen, hydration, chest radiograph |
|
Grabowski 2014 cRCT |
ICT (Telemedicine) | Change in Medicare expenditures per home per year, US dollars (presumably 2011) | 12 months | NR | NR | NR | NR | MD ‐99,000 favouring intervention homes/ ‐220,779 |
NR | NR | NR | Calculations based on pre‐post difference instead of control‐treatment group difference; also provided data for more and less engaged homes |
| Costs per type of care: Primary care | ||||||||||||
|
Boorsma 2011a cRCT |
Co‐ordination of care (Teams) | Primary care costs, mean (SD) per person in Euros (2007) | 6 months | 299 (37)/904 (112)* | 181 | 389 (74)/ 1176 (224)* |
120 | MD ‐88/ ‐272* |
‐277 to 48/ ‐837 to 145 |
NR | NR | — |
|
Zwijsen 2014 SWcRCT |
Co‐ordination of care (Teams) | Physician costs, mean (SD) per resident in Euros (2013) | 21 months | 288 (141)/ 288 (352)* |
325 | 136 (131)/ 339 (327)* |
327 | MD 101/ 252* |
89 to 106/ 222 to 265 |
LMM | NR | Because of the stepped‐wedge design, costs differences were adjusted for the amount of time a resident spent in a particular condition and clustering at the level of a care institution |
|
Cordato 2018 RCT |
Co‐ordination of care (Discharge planning) | GP costs (routine visits), mean (SD) per person in AUD (1 July 2014) | 6 months | 440 (304)/ 560 (387)* |
22 | 355 (257)/ 452 (327)* |
21 | Cohen’s d ‐0.30 MD^ ‐85/‐108* |
‐245 to 82/ ‐312 to 104* |
t‐test | 0.33 | 95% CI is bootstrapped ^Calculated by review authors |
| Co‐ordination of care (Discharge planning) | GP costs (non‐routine visits), mean (SD) per person in AUD (1 July 2014) | 6 months | 136 (161)/ 173 (205)* |
22 | 270 (212)/ 344 (270)* |
21 | Cohen’s d 0.72 MD^ 134/171* |
28 to 240/ 36 to 306* |
t‐test | 0.02 | 95% CI is bootstrapped ^Calculated by review authors |
|
| Costs per type of care: Secondary care | ||||||||||||
|
Boorsma 2011a cRCT |
Co‐ordination of care (Teams) | Secondary care costs, mean (SD) per person in Euros (2007) | 6 months | 745 (143)/ 2253 (432)* |
181 | 533 (135)/ 1612 (408)* |
120 | MD 215/ 641* |
‐146 to 579/ ‐441 to 1751* |
NR | NR | — |
|
Zwijsen 2014 SWcRCT |
Co‐ordination of care (Teams) | Costs of psychologist, mean (SD) per resident in Euros (2013) | 21 months | 312 (258)/ 779 (644)* |
325 | 178 (196)/ 444 (489)* |
327 | MD 59/ 147* |
51 to 75/ 127 to 187* |
LMM | NR | Because of the stepped‐wedge design, costs differences were adjusted for the amount of time a resident spent in a particular condition and clustering at the level of a care institution |
| Costs per type of care: Inpatient costs | ||||||||||||
|
Stern 2014 SWcRCT |
Co‐ordination of care (Teams) | Hospital costs (inpatient and ambulatory (ER) costs, mean per person in Canadian dollars (2012) | The time horizon was time until residents were first in a wound‐free state or were censored from the PUMTT study, whichever came first | 6102/ 10,754* |
94 | 4397/ 7749* |
67 | MD 1705/ 3005* |
NR | NR | NR | Inpatient and ambulatory (ER) costs are also provided separately |
|
Crotty 2019 RCT |
Co‐ordination of care (Teams) | Inpatient costs (Australian Medicare costs inpatient costs (AR‐DRGs), mean (SD) per persons in AUD (2015/16) | 12 months | 2945 (762)/ 3533 (914)* |
119 | 3174 (829)/ 3807 (994)* |
121 | MD ‐229/ ‐275* |
‐2479 to 1,683/ ‐2974 to 2019* |
NR | NR | 95% CI is bootstrap MD |
|
Cordato 2018 RCT |
Co‐ordination of care (Discharge planning) | Inpatient costs, mean (SD) per person in AUD (1 July 2014) | 6 months | 2168 (4492)/ 2761 (5720)* |
22 | 6238 (7907)/ 7944 (10,069)* |
21 | Cohen’s d 0.63 MD^ 4079/5183* |
412 to 7797/ 525 to 9930 |
t‐test | 0.04 | 95% CI is bootstrapped ^Calculated by review authors |
|
Loeb 2006 cRCT |
Co‐ordination of care (Care pathway) | Total hospitalisation costs, mean cost per resident in US dollars (2005, initially Canadian dollars 2005 were used and converted to US dollars at USD 1 = CAD 1.20) | 30 days | 1018/2735* | 314 | 2122/5702* | 347 | MD ‐1103/ ‐2963* |
‐295 to ‐1912/ ‐793 to ‐5137* |
NR | NR | Detailed costs (and mean utilisation) are also provided, namely: intensive care unit length of stay, non−intensive care unit length of stay, emergency department visit, physician fees, diagnostic imaging, ambulance transport, inpatient costs including administration |
| Costs per type of care: Emergency department (ED) costs | ||||||||||||
|
Cordato 2018 RCT |
Co‐ordination of care (Discharge planning) | ED costs, mean (SD) per person in AUD (1 July 2014) | 6 months | 617 (840)/786 (1070)* | 22 | 1383 (1437)/ 1761 (1830)* |
21 | Cohen’s d 0.65 MD^ 766/975* |
98 to 1540/ 125 to 1962* |
t‐test | 0.04 | 95% CI is bootstrapped ^Calculated by review authors |
| Costs per type of care: Medication costs | ||||||||||||
|
Boorsma 2011a cRCT |
Co‐ordination of care (Teams) | Medication costs, mean (SD) per person in Euros (2007) | 6 months | 419 (40)/1267 (121)* | 181 | 429 (31)/ 1297 (94)* |
120 | MD ‐8/‐30* | ‐84 to 114/ 254 to 345* |
NR | NR | — |
|
Stern 2014 SWcRCT |
Co‐ordination of care (Teams) | Treatment and supplies costs, mean per person in Canadian dollars (2012) | The time horizon was time until residents were first in a wound‐free state or were censored from the PUMTT study, whichever came first | 2322/ 4092* |
94 | 4849/ 8546* |
67 | MD ‐2527/ ‐4454* |
NR | NR | NR | Treatment and supplies costs are also provided separately |
|
Crotty 2019 RCT |
Co‐ordination of care (Teams) | Medication costs (Australian Medicare Pharmaceutical Benefits Schedule, mean (SD) per persons in AUD (2015/16) | 12 months | 1164 (210) | 119 | 983 (111) | 121 | MD 180 | ‐214 to 787 | NR | NR | 95% CI is bootstrap MD |
|
Crotty 2004 cRCT |
Co‐ordination of care (Teams) | Total monthly cost of medication, mean (SD) change pre‐post, AUD (reference year not provided, used 2003) | 3 months | 5.72 (9.47)/12 (20)* | 50 | 3.37 (5.79)/ 7 (13)* |
54 | MD (point estimate not reported) | NR | t‐test | P = 0.84 | Pre‐post change per group compared |
|
Zwijsen 2014 SWcRCT |
Co‐ordination of care (Teams) | Medication costs, mean (SD) per resident in Euros (2013) | 21 months | 141 (311)/ 352 (776)* |
325 | 168 (455)/ 419 (1135)* |
327 | MD ‐69/ 172* |
‐136 to ‐ 25/ ‐339 to ‐62* |
LMM | NR | Because of the stepped‐wedge design, costs differences were adjusted for the amount of time a resident spent in a particular condition and clustering at the level of a care institution |
| Costs per type of care: Informal care | ||||||||||||
|
Boorsma 2011a cRCT |
Co‐ordination of care (Teams) | Informal care costs, mean (SD) per person in Euros (2007) | 6 months | 367 (47)/ 1110 (142)* |
181 | 282 (32)/853 (97)* | 120 | MD 77/ 257* |
‐10 to 204/ ‐30 to 617* |
NR | NR | — |
| Personnel costs | ||||||||||||
|
Stern 2014 SWcRCT |
Co‐ordination of care (Teams) | Personnel costs (study nurse, MDT, ET, facility nurse), mean per person in Canadian dollars (2012) | The time horizon was time until residents were first in a wound‐free state or were censored from the PUMTT study, whichever came first. | 1624/2862* | 94 | 1451/2557* | 67 | MD 173/305* | NR | NR | NR | Study nurse, MDT, enterostomal therapist, facility nurse costs are also provided separately |
| Intervention implementation costs | ||||||||||||
|
Boorsma 2011a cRCT |
Co‐ordination of care (Teams) | Implementation costs of the multidisciplinary integrated care costs in the intervention group and of the costs of the multidisciplinary meetings in the control group, costs per person in Euros (2007) | 6 months | 225/680* | 181 | 23/70* | 120 | MD 202/611* | NR | NR | NR | — |
|
Crotty 2019 RCT |
Co‐ordination of care (Teams) | Intervention costs, mean (SD) per persons in AUD (2015/16) | 12 months | 2298 (76)/ 1297 (94)* |
119 | NA – no intervention costs in control group | 121 | NA | NA | NA | NA | — |
|
Haines 2020 cRCT |
Who provides care (staffing models) | Intervention costs (GP recruitment, setting up a consulting room and medication cabinets), per occupied bed‐day in AUD 2019 | Between 18 and 30 months, depending on the cluster | 0.33/0.35* | Mean (SD) occupied bed‐days 6255 (1800) |
NA – no intervention costs in control group | Mean (SD) occupied bed‐days 6610 (2219) | NA | NA | NA | NA | — |
|
Zwijsen 2014 SWcRCT |
Co‐ordination of care (Teams) | Training costs, mean (SD) per resident in Euros (2013) | 21 months | 190 (0)/ 474 (0)* |
325 | NA – no intervention costs in control group | 327 | NA | NA | LMM | NR | Because of the stepped‐wedge design, costs differences were adjusted for the amount of time a resident spent in a particular condition and clustering at the level of a care institution |
|
Cordato 2018 RCT |
Co‐ordination of care (Discharge planning) | REAP intervention costs for medical specialist, mean (SD) per person in AUD (1 July 2014) | 6 months | 666 (253)/848 (322)* | 22 | NA – no intervention costs in control group | 21 | NA | NA | NA | NA | — |
| Co‐ordination of care (Discharge planning) | REAP intervention costs for nursing practitioner, mean (SD) per person in AUD (1 July 2014) | 6 months | 74 (30)/ 94 (38)* |
22 | NA – no intervention costs in control group | 21 | NA | NA | NA | NA | — | |
* converted to AUD for 2021
CI: confidence interval; CPR: cardiopulmonary resuscitation; cRCT: cluster‐randomised controlled trial; ED: emergency department; EPOC: Cochrane Effective Practice and Organisation of Care; ER: emergency room; GP: general practitioner; ICT: information and communications technology; LMM: linear mixed model; MD: mean difference; MDT: multidisciplinary team; NA: not applicable; NR: not reported; OBD: occupied bed‐day; RCT: randomised controlled trial; REAP: regular early assessment post‐discharge; SD: standard deviation; SWcRCT: stepped‐wedge cluster‐randomised controlled trial
14. Structured summary of results of economic evaluations.
| Study ID | EPOC category | Outcome measured | Timing of assessment | Perspective of economic evaluation | Results | Authors' conclusions |
|
Boorsma 2011a cRCT |
Co‐ordination of care (Teams) | ICER for QALY | 6 months | Societal perspective | ICER = EUR ‐248,308 (intervention had higher costs than usual care) | Negative ICER indicates that EUR 248,308 should be invested per QALY lost for alternative model of care vs usual care. The CEA curve shows that the maximum probability that Multidisciplinary Integrated Care is cost‐effective in comparison with usual care was 0.14 regardless of the willingness to pay. |
|
Crotty 2019 RCT |
Co‐ordination of care (Teams) | ICER for QALY | 12 months | Healthcare system perspective | ICER = AUD 328,685 (95% CI 82,654 to 75,007,056, i.e. intervention had higher costs than usual care) | Positive ICER indicates that EUR 328,685 should be invested per QALY gained for alternative model of care vs usual care. The ICER based on QALYs is substantially greater than the implicit cost‐effectiveness threshold of AUD 50,000 per QALY gained (applied by regulatory bodies in Australia at the moment of publication of the results), implying that the intervention would not be considered cost‐effective even if an extended time horizon had been applied. |
|
Stern 2014 SWcRCT |
Co‐ordination of care (Teams) | Willingness to pay for a wound‐free day | The time horizon was time until residents were first in a wound‐free state or were censored from the PUMTT study, whichever came first | Healthcare system perspective | Statistical model predicted that adopting EMDTs would shorten the mean time to healing, resulting in an average of 45.65 additional wound‐free days per resident compared with the use of UCTs. The base‐case cost comparison estimated that the use of EMDTs would reduce direct care costs until healing by CAD 649 per resident compared with the use of UCTs. It follows that the EMDT strategy dominates the usual care team strategy (i.e. it provides improved health outcomes yet lowers costs, such that the additional cost per additional wound‐free day is negative). EMDTs therefore appear to be cost‐effective regardless of MOHLTC’s willingness to pay for an additional wound‐free day. This is also true for those scenario analyses in which only the costs associated with hospitalisations or dressings were excluded from the comparison. Since the use of EMDTs resulted in cost savings under these scenarios, EMDTS are cost‐effective regardless of MOHLTC’s willingness to pay for an additional wound‐free day. It should be noted that there is significant uncertainty in our analyses. Accounting for this uncertainty, the probability that EMDTs are cost‐effective is estimated to be 55.8%. |
Authors assumed that MOHLTC has a WTP of CAD 50,000 per additional quality‐adjusted lifeyear (QALY). This is equivalent to CAD 50,000/365 = CAD 137 per additional quality‐adjusted life‐day (QALD). Previous research found that the disutility associated with a pressure ulcer is 0.731 − 0.675 = 0.056 for residents at high risk of developing pressure ulcers. Each additional wound‐free day may therefore be assumed to increase a resident’s total QALDs by about 0.056. This implies that MOHLTC has a WTP threshold of 137 × 0.056 = CAD 7.67 per additional wound‐free day. |
|
Zwijsen 2014 SWcRCT |
Co‐ordination of care (Teams) | ICER for QALY | 21 months | Healthcare system perspective | ICER = EUR ‐3353 (intervention had higher costs than usual care) | Negative ICER indicates that EUR 3353 should be invested per QALY lost for alternative model of care vs usual care. The probability of an alternative model of care being cost‐effective was 0 for all possible ceiling ratios. |
|
Van den Block 2020 cRCT |
Co‐ordination of care (Case management) | ICER for QALY | Measured over the last month of life, 13 through 17 months after the roll‐out of the intervention | Healthcare system perspective | ICER not calculated. Adjusted mean differences in costs resource use (EUR ‐983.28, 95% CI EUR ‐1762.22 to EUR ‐321.46) and quality of life (EQ‐5D‐5L, range 0 to 1: ‐0.038, 95% CI 0.087 to 0.011) during last month of life. Alternative model of care cheaper, with a similar effect on quality of life as usual care. | Alternative care model dominated the usual care. It appeared cheaper (EUR ‐983.28) and not significantly different on the EQ‐5D5L. However, the mean result was a small but potentially meaningful decrease in quality of life. |
CEA: cost‐effectiveness analysis; CI: confidence interval; cRCT: cluster‐randomised controlled trial; EMDT: enhanced multidisciplinary team; EPOC: Cochrane Effective Practice and Organisation of Care; ICER: incremental cost‐effectiveness ratio; MOHLTC: Ministry of Health and Long‐Term Care; QALY: quality‐adjusted life year; RCT: randomised controlled trial; SWcRCT: stepped‐wedge cluster‐randomised controlled trial; WTP: willingness‐to‐pay
Emergency department (ED) visits
Eleven studies (10 studies: 2682 participants; Haines 2020: number of participants not reported, mean occupied bed‐days per nine‐week block 12,865) reported on ED visits (Agar 2017; Arendts 2018; Bellantonio 2008; Cavalieri 1993; Cordato 2018; Haines 2020; Harvey 2014; Loeb 2006; Stern 2014; Van den Block 2020; Wu 2010). Kim 2020 listed this outcome in their study protocol but did not provide any data on ED visits in the published paper. Nine studies investigated co‐ordination of care models, involving multidisciplinary care teams (Bellantonio 2008; Stern 2014; Wu 2010), discharge planning (Cordato 2018; Harvey 2014), care pathways (Loeb 2006), geriatric assessment (Cavalieri 1993) and palliative care case management (Agar 2017; Van den Block 2020). Two studies investigated alternative locations of providing care (Arendts 2018; Haines 2020). Data on ED visits were provided in different ways, both across and within studies (see Table 1 below for details).
Proportion of residents with at least one ED visit
Seven studies (2417 participants; 1276 after adjustment for clustering) provided data for this outcome (Agar 2017; Arendts 2018; Bellantonio 2008; Cordato 2018; Harvey 2014; Loeb 2006; Van den Block 2020). Bellantonio 2008 did not provide details on the proportion of residents with at least one ED visit per group, but we were able to calculate this using the change in risk data provided (see Table 8). Based on a meta‐analysis of seven studies (Agar 2017; Arendts 2018; Bellantonio 2008; Cordato 2018; Harvey 2014; Loeb 2006; Van den Block 2020), compared to usual care, alternative models of care may have little or no effect on the number of residents with at least one ED visit (risk ratio (RR) 1.01, 95% confidence interval (CI) 0.84 to 1.20; I2 = 0%; 7 trials, 1276 participants; low‐certainty evidence; see Analysis 1.1; Table 1). We downgraded the certainty of the evidence due to serious risk of bias (all studies had high risk of performance bias) and serious imprecision (analysis was underpowered to detect important benefit or harm).
1.1. Analysis.
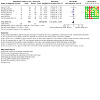
Comparison 1: Any alternative model of care versus usual care, Outcome 1: ED visits (proportion of residents with at least one ED visit)
Subgroup analyses
No heterogeneity was detected between the study data in the meta‐analysis (Analysis 1.1), so we conducted no subgroup analyses.
Sensitivity analyses
Sensitivity analyses indicated that there was little change in effect estimates when restricting studies to those at low overall risk of bias (RR 1.00, 95% CI 0.80 to 1.25; 3 trials, 447 participants; see Analysis 1.2). Only one study at low overall risk of bias was considered to have long‐term follow‐up (i.e. between 18 and 32 months) (Haines 2020). Although the 95% confidence intervals reflected both a reduction and an increase in ED visits, the direction and magnitude of the effect estimate suggest a beneficial effect of the alternative model of care (Haines 2020 incidence rate ratio 0.81, 95% CI 0.66 to 1.01, P = 0.06, as extracted from the published paper).
1.2. Analysis.
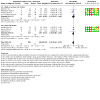
Comparison 1: Any alternative model of care versus usual care, Outcome 2: ED visits (proportion of residents with at least one ED visit): sensitivity analysis by risk of bias
Mean number of ED visits per resident
Two studies (725 participants; 704 after adjustment for clustering) reported on the mean number of ED visits per resident (Cordato 2018; Loeb 2006). Based on a meta‐analysis of the data, we are uncertain of the effect of alternative models of care, compared to usual care, on the mean number of ED visits per aged care facility resident as the certainty of the evidence is very low (mean difference (MD) ‐0.20, 95% CI ‐0.76 to 0.35; I² = 67%; 2 trials, 704 participants; very low‐certainty evidence; Analysis 1.3). We downgraded the certainty of the evidence due to serious risk of bias (both studies at high risk of performance bias), serious inconsistency (I² = 67%) and serious imprecision (wide confidence intervals that include both important benefit and harm).
1.3. Analysis.
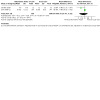
Comparison 1: Any alternative model of care versus usual care, Outcome 3: ED visits (mean number of ED visits per resident)
Rate of ED visits per person‐time
Four studies (Cordato 2018, Stern 2014 and Wu 2010: 241 participants; Haines 2020: number of participants not reported, mean occupied bed‐days 12,865) reported ED visits as a mean rate per exposure time (e.g. per 1000 bed‐days or per 1000 patient‐days or per facility per nine‐week block). Cordato 2018 and Stern 2014 provided a mean ED visit rate per 1000 patient‐days; Wu 2010 reported ED visit incidence per 1000 bed‐days; Haines 2020 reported the mean rate per facility per nine‐week block, which was not comparable with other exposure time units. A meta‐analysis of data from two studies shows that compared to usual care, we are uncertain of the effect of alternative models of care on ED visit rate per 1000 patient‐days (RR 0.73, 95% CI 0.25 to 2.15; I2 = 77%; 2 trials, 204 participants; very low‐certainty evidence; see Analysis 1.4) (Cordato 2018; Stern 2014). We downgraded the certainty of the evidence for serious risk of bias (both studies at high risk of performance bias), serious inconsistency (I2 = 77%) and serious imprecision (wide confidence interval that includes important benefit and harm). The Haines 2020 effect estimate suggests a slight reduction in the incidence of ED visits (mean number of unplanned hospital transfers per site, per nine‐week block: incidence rate ratio (IRR) 0.81, 95% CI 0.66 to 1.01). Wu 2010 reported that there were no ED visits in either group.
1.4. Analysis.
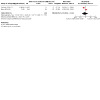
Comparison 1: Any alternative model of care versus usual care, Outcome 4: ED visits: logarithm of rate ratio per person‐time
Table 1. Studies providing ED visit data (ordered by EPOC intervention category)
|
Study ID Overall risk of bias (based on selection and detection bias) |
Participants (P) Intervention (I) Comparator (C) |
Timing of assessment | Description of outcome data provided |
Summary estimate of effect (SEE) (95% CI) Sample size |
Note |
| EPOC: co‐ordination of care (Teams) | |||||
|
Bellantonio 2008 RCT UNCLEAR |
P: With mental/behavioural problems I: Multidisciplinary team care C: Usual GP‐led care |
9 months | Number of patients with at least 1 ED transfer | Risk difference: ‐12% (95% CI ‐65% to 126%) I: 48 C: 52 |
As extracted from published paper; adjusted for age, sex and site; only SEE and variance provided by study authors; number of events per group calculated by review authors. See Table 7 for details. |
|
Stern 2014 Stepped‐wedge cRCT LOW |
P: With pressure ulcers I: Multidisciplinary team care C: Usual care |
Between 4 and 14 months, depending on the cluster | ED visits, mean rate per 1000 patient‐days | IRR 1.30 (95% CI 0.58 to 2.90) I: 94 C: 67 |
As extracted from published paper (ED visit rate larger during intervention); event rate per group not provided |
|
Wu 2010 cRCT UNCLEAR |
P: Highly disabled I: Multidisciplinary team care C: Usual care |
12 months | ED visits, incidence per 1000 bed‐days | 0 ED visits in both intervention and control arms I: 32 C: 42 |
As extracted from published paper; there were no ED visits in either of the study groups |
| EPOC: co‐ordination of care (Discharge planning) | |||||
|
Harvey 2014 RCT LOW |
P: Discharged from hospital back to ACF I: Geriatrician‐led hospital discharge C: Usual GP‐led care |
6 months | Number of patients presenting to ED at least once | RR 1.01 (95% CI 0.75 to 1.34) I: 57 C: 59 |
See Analysis 1.1 (additional data provided by study authors, see Table 8) |
| Total number of ED visits during the study period | I: 19 ED visits per 57 residents C: 28 ED visits per 59 residents |
||||
|
Cordato 2018 RCT UNCLEAR |
P: Discharged from hospital back to ACF I: Regular early assessment post‐discharge following acute hospitalisation C: Usual GP‐led care |
6 months | Proportion of residents with at least 1 ED visit, n | RR 0.61 (95% CI 0.34 to 1.10) I: 22 C: 21 |
See Analysis 1.1 |
| Episodes of care in ED, total number | I: 13 episodes per 22 residents C: 26 episodes per 21 residents |
One patient probably had multiple ED visits; number of episodes in the control group exceeds the sample size; not able to calculate RR | |||
| Rate of ED visits per 1000 person‐days | Rate ratio: 0.43 (95% CI 0.22 to 0.84) I: 4.1 ED visits per 1000 person‐days C: 9.4 ED visits per 1000 person‐days |
Calculated by review authors based on data provided by study authors (online calculator) | |||
| Episodes of care in ED, mean (SD) | MD ‐0.60 (95% CI ‐1.27 to 0.07) I: 22 C: 21 |
See Analysis 1.3 | |||
| EPOC: co‐ordination of care (Care pathways) | |||||
|
Loeb 2006 cRCT LOW |
P: With respiratory tract infection I: Clinical pathway to decide whether hospital transfer is needed C: Usual care without clinical pathway |
30 days | ED visits without admission, proportion of residents | RR 0.66 (95% CI 0.16 to 2.70) I: 314 C: 347 |
See Analysis 1.1, adjusted for clustering using ICC 0.05 |
| ED visits without admission, weighted mean percent per facility | MD ‐0.40 (95% CI ‐2.98 to 2.18) I: 314 C: 347 |
Group means weighted by size of nursing home and adjusted for clustering; for Analysis 1.3 divided group means by 100 to get unit value instead of percentage | |||
| EPOC: co‐ordination of care (Comprehensive geriatric assessment) | |||||
|
Cavalieri 1993 RCT UNCLEAR |
P: ACF residents, not limited to subgroup I: CGA team C: Usual care led by physician without geriatrics training |
12 months | ED transfers, total number | SEE not reported P > 0.05 I: 33 C: 36 |
As extracted from published paper; event rate per group not provided; authors state that emergency room visits were more frequent for usual care than for intervention |
| EPOC: co‐ordination of care (Case management) | |||||
|
Agar 2017 cRCT HIGH |
P: With mental/behavioural problems I: Palliative care facilitated family case conferencing C: Usual care |
Last month of life | Number of patients with at least 1 ED visit in last month of life | RR 0.95 (95% CI 0.26 to 3.54) I: 67 C: 64 |
See Analysis 1.1; adjusted for clustering using ICC 0.05 |
|
Van den Block 2020 cRCT HIGH |
P: ACF residents, not limited to subgroup I: Palliative care case management programme C: Usual care |
1 month (last month of life) | Number of patients with at least 1 ED visit in last month of life | RR 1.38 (95% CI 0.94 to 2.03) I: 425 C: 558 |
See Analysis 1.1; adjusted for clustering using ICC 0.05 |
| EPOC: WHO (Role expansion/task shifting) | |||||
|
Arendts 2018 cRCT LOW |
P: ACF residents, not limited to subgroup I: Nurse practitioners led care using best practice guide C: Usual GP‐led care |
12 months up to 32 months | Number of patients with at least 1 ED transfer | RR 1.02 (0.71 to 1.45) I: 101 C: 99 |
See Analysis 1.1; adjusted for clustering using ICC 0.05 |
| Total number of ED transfers during study period | 98 ED transfers intervention (101 participants); 121 ED transfers control (99 participants) |
||||
| EPOC: WHO (Staffing models) | |||||
|
Haines 2020 Stepped‐wedge cRCT LOW |
P: ACF residents, not limited to subgroup I: GP co‐located in ACF C: Care provided by externally located GP |
Between 18 and 30 months, depending on the cluster | Unplanned hospital transfers, mean (SD) per site per 9‐week block | IRR 0.81 (95% CI 0.66 to 1.01) P = 0.06 Mean (SD) occupied bed‐days I: 6255 (1800) C: 6610 (2219) |
As extracted from published paper; mean number of unplanned hospital transfers (SD) per site, per 9‐week block: 14 (9) intervention, 19 (10) control |
| ACF: aged care facility; C: control; CGA: comprehensive geriatric assessment; CI: confidence interval; cRCT: cluster‐randomised controlled trial; ED: emergency department; EPOC: Cochrane Effective Practice and Organisation of Care; GP: general practitioner; I: intervention; ICC: intra‐cluster correlation coefficient; IRR: incidence rate ratio; MD: mean difference; RCT: randomised controlled trial; RR: risk ratio; SD: standard deviation; SEE: summary estimate of effect; WHO: World Health Organization | |||||
Unplanned hospital admissions
Of the 12 studies (10 studies: 9528 participants; Boyd 2014: number of participants not reported, 2553 beds; Haines 2020: number of participants not reported, mean occupied bed‐days per nine‐week block 12,865) reporting on the number of unplanned hospital admissions, nine studies investigated alternative models of care related to the co‐ordination of care, involving multidisciplinary care teams (Bellantonio 2008; Boyd 2014; Connolly 2015; Crotty 2019), discharge planning (Cordato 2018; Harvey 2014), care pathways (Loeb 2005; Loeb 2006) and case management (Forbat 2020; Rutten 2022). Two studies investigated alternative locations of providing care (Arendts 2018; Haines 2020). Boorsma 2011a included this outcome in the study protocol but did not report any results. Unplanned hospital admissions were reported in different ways, both across and within studies (see Table 2 below for details).
Proportion of residents with at least one unplanned hospital admission
Eight studies (3611 participants; 1263 after adjustment for clustering) reported on the proportion of residents with at least one unplanned hospital admission (Arendts 2018; Bellantonio 2008; Cordato 2018; Crotty 2019; Harvey 2014; Loeb 2006; Connolly 2015; Rutten 2022). Based on a meta‐analysis of these eight studies, compared to usual care, alternative models of care may reduce the number of unplanned hospital admissions in residents of aged care facilities (RR 0.74, 95% CI 0.56 to 0.99; I2 = 53%; 8 trials, 1263 participants; low‐certainty evidence;see Analysis 1.5; Table 1). We downgraded the certainty of the evidence due to serious risk of bias (all studies were at high risk of performance bias) and serious inconsistency (I2 = 53%).
1.5. Analysis.
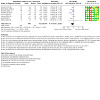
Comparison 1: Any alternative model of care versus usual care, Outcome 5: Unplanned hospital admissions (proportion of residents with at least one unplanned hospital admission)
Subgroup analysis
Grouping the studies by EPOC delivery arrangement categories (i.e. where care is provided; who provides care; co‐ordination of care) did not explain the heterogeneity, with seven of the eight studies investigating models of care related to co‐ordination of care (RR 0.73, 95% CI 0.52 to 1.01; I2 = 59%, see Analysis 1.6). When the studies were grouped by the type of health care being provided (i.e. primary or secondary care) there was no heterogeneity between the three studies providing primary care to residents; however, there was substantial heterogeneity between the four studies providing both primary and secondary care to residents (I2 = 53%, see Analysis 1.7). It was not possible to subgroup the studies based on the age of the included residents. In Analysis 1.8 we grouped the studies by the type of condition being treated. Results of interventions in a general residential aged care facility population (Arendts 2018; Connolly 2015) and residents with (suspected) infections (Loeb 2006; Rutten 2022) were consistent (I2 = 0%), while other subgroups either showed high heterogeneity (recently discharged; I2 = 73%) or had only one study per subgroup.
1.6. Analysis.
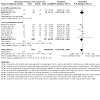
Comparison 1: Any alternative model of care versus usual care, Outcome 6: Unplanned hospital admissions (proportion of residents with at least one unplanned hospital admission): subgroup analysis by EPOC category
1.7. Analysis.
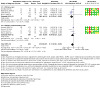
Comparison 1: Any alternative model of care versus usual care, Outcome 7: Unplanned hospital admissions (proportion of residents with at least one unplanned hospital admission): subgroup analysis by type of care provided
1.8. Analysis.
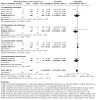
Comparison 1: Any alternative model of care versus usual care, Outcome 8: Unplanned hospital admissions (proportion of residents with at least one unplanned hospital admission): subgroup analysis by resident's condition
Sensitivity analyses
Restricting the meta‐analysis to studies with low overall risk of bias (Arendts 2018; Connolly 2015; Harvey 2014; Loeb 2006) reduced the effect estimate (RR 0.87, 95% CI 0.65 to 1.16; 4 trials, 752 participants; I2 = 75%, see Analysis 1.9). Restricting the meta‐analysis to studies with follow‐up longer than 12 months also reduced the effect estimate (RR 0.95, 95% CI 0.79 to 1.15; 2 trials, 382 participants; I2 = 0%, see Analysis 1.10).
1.9. Analysis.
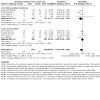
Comparison 1: Any alternative model of care versus usual care, Outcome 9: Unplanned hospital admissions (proportion of residents with at least one unplanned hospital admission): sensitivity analysis by risk of bias
1.10. Analysis.
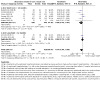
Comparison 1: Any alternative model of care versus usual care, Outcome 10: Unplanned hospital admissions (proportion of residents with at least one unplanned hospital admission): sensitivity analysis by timing of effect
Mean number of unplanned hospital admissions per resident
Three studies (848 participants; 820 after adjustment for clustering) presented the mean number of unplanned hospital admissions per group (Cordato 2018; Harvey 2014) and mean weighted percentage per facility (Loeb 2006). A meta‐analysis of these studies suggests that compared to usual care, we are uncertain of the effect of alternative models of care on the mean number of unplanned hospital admissions in residents of aged care facilities as the certainty of the evidence is very low (MD ‐0.14, 95% CI ‐0.38 to 0.10; I2 = 63%; 3 trials, 820 participants; very low‐certainty evidence, see Analysis 1.11) (Cordato 2018; Harvey 2014; Loeb 2006). We downgraded the certainty of the evidence due to serious risk of bias (all studies at high risk of performance bias), serious inconsistency (I2 = 63%) and serious imprecision (wide confidence interval that crosses the line of no effect and includes both important benefit and harm).
1.11. Analysis.
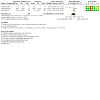
Comparison 1: Any alternative model of care versus usual care, Outcome 11: Unplanned hospital admissions (mean number of unplanned hospital admissions per resident)
Rate of unplanned hospital admissions (per person‐time)
Five studies (three studies: 7928 participants; Boyd 2014: number of participants not reported, 2553 beds; Haines 2020: number of participants not reported, mean occupied bed‐days per nine‐week block 12,865) provided data for the rate of unplanned hospital admissions (Haines 2020: mean (SD) admissions per facility per nine‐week block; Forbat 2020: mean admission rate per facility‐month; Boyd 2014; Connolly 2015; Loeb 2005: mean admission rate per person‐year or per 1000 bed‐days). A meta‐analysis of rate data from four studies shows that compared to usual care, alternative models of care may make little or no difference to the rate of unplanned hospital admissions (RR 0.93, 95% CI 0.78 to 1.12; I2 = 75%; 4 trials, 9968 participants; low‐certainty evidence; see Analysis 1.12) (Boyd 2014; Connolly 2015; Forbat 2020; Loeb 2005). We downgraded the certainty of the evidence due to serious risk of bias (performance bias in all studies) and serious inconsistency (I2 = 75%). We were unable to include the unplanned hospital admissions data from Haines 2020 in the meta‐analysis as the unit of analysis was not comparable with the other studies. Haines 2020 found that having a GP located within the aged care facility reduced the incidence rate of unplanned hospital admissions in residents of aged care facilities (mean admissions per facility per nine‐week block: IRR 0.74, 95% CI 0.56 to 0.96; mean (SD) occupied bed‐days 6255 (1800) in the intervention and 6610 (2219) in the control).
1.12. Analysis.
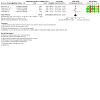
Comparison 1: Any alternative model of care versus usual care, Outcome 12: Unplanned hospital admissions (logarithm of rate ratio)
Table 2. Studies providing unplanned hospital admission data (ordered by EPOC intervention category)
|
Study ID Overall risk of bias (based on selection and detection bias) |
Participants (P) Intervention (I) Comparator (C) |
Timing of assessment | Description of outcome data provided |
Summary estimate of effect (SEE) (95% CI) Sample size |
Note |
| EPOC: co‐ordination of care (Care pathways) | |||||
|
Rutten 2022 cRCT UNCLEAR |
P: Urinary tract infection I: Decision tool for antibiotic prescription integrated into EHR C: Usual care without decision tool |
21 days | Admission to hospital for suspected urinary tract infection, n | RR 1.61 (95% CI 0.15 to 17.26) I: 132 residents (180 infections) C: 106 residents (101 infections) |
Authors provided number of infections (one resident could have multiple infections) and number of residents as denominator. Number of residents is used for this analysis. See Analysis 1.5, adjusted for clustering using ICC 0.05 |
|
Loeb 2005 cRCT UNCLEAR |
P: ACF residents, not limited to subgroup I: Clinical pathway for urinary tract infection C: Usual care without clinical pathway |
12 months | Admission to hospital for sepsis of suspected urinary origin or of unknown origin, rate per 1000 resident‐days | MD 0.008 (95% CI ‐0.025 to 0.039) I: 2156 residents C: 2061 residents |
0.026 per 1000 resident‐days intervention arm, 0.018 per 1000 resident‐days control arm; raw data per group not provided so MD as extracted from published paper; MD weighted by size of nursing home; adjusted for clustering |
|
Loeb 2006 cRCT LOW |
P: Lower respiratory tract infection I: Clinical pathway to decide whether hospital transfer is needed C: Usual care without clinical pathway |
30 days | Number of residents with hospitalisation, n | RR 0.49 (95% CI 0.27 to 0.9) I: 314 residents C: 347 residents |
See Analysis 1.5, adjusted for clustering using ICC 0.05 4 and 2 residents (intervention and control, respectively) admitted for reasons other than pneumonia or lower respiratory tract infection |
| Hospitalisation, weighted mean admission rate per facility | MD ‐12% (95% CI ‐18.8% to ‐5.2%) I: 314 C: 347 |
See Analysis 1.11; weighted mean admission rate: 8% in clinical pathway group vs 20% in usual care group (group means and SD already adjusted for clustering) | |||
| EPOC: co‐ordination of care (Teams) | |||||
|
Bellantonio 2008 RCT UNCLEAR |
P: With mental/behavioural problems I: MDT care C: Usual GP‐led care |
9 months | Number of residents with at least 1 unanticipated hospitalisation | Change in risk: ‐45% (95% CI ‐74% to 18%) I: 48 C: 52 |
Event rate per group not provided; data extracted from published paper (adjusted for sex, age and study site). Number of residents per group was calculated by review authors, see Table 7 for details. |
|
Connolly 2015 cRCT LOW |
P: ACF residents, not limited to subgroup I: GNS‐led care including multidisciplinary team care C: Usual care not including elements of the intervention |
14 months | Proportion of residents with at least 1 acute admission | RR 0.97 (95% CI 0.79 to 1.19) 608/1123 intervention residents; 491/875 control residents |
See Analysis 1.5; adjusted for clustering using ICC 0.05; assumed 1 admission per person |
| All acute admissions, rate per person‐year | Rate ratio 1.02 (95% CI 0.83 to 1.26) I: 888 person‐years C: 734 person‐years |
As extracted from published paper; adjusted for clustering | |||
|
Crotty 2019 RCT UNCLEAR |
P: After hip fracture I: In‐reach MDT rehabilitation care C: Usual GP‐led care |
1 month | Number of residents with injurious fall resulting in hospitalisation, n | RR 0.81 (95% CI 0.40 to 1.66) I: 119 C: 121 |
See Analysis 1.5 |
| EPOC: co‐ordination of care (Discharge planning) | |||||
|
Cordato 2018 RCT UNCLEAR |
P: Discharged from hospital back to ACF I: Regular early assessment post‐discharge following acute hospitalisation C: Usual GP‐led care |
6 months | Hospital admissions, n | RR 0.37 (95% CI 0.20 to 0.70) I: 22 C: 21 |
See Analysis 1.5; assumed 1 admission per resident |
| Hospital admissions, mean (SD) | MD ‐0.60 (95% CI ‐1.10 to ‐0.10 I: 22 C: 21 |
See Analysis 1.11 | |||
|
Harvey 2014 RCT LOW |
P: Discharged from hospital back to ACF I: Geriatrician‐led hospital discharge C: Usual GP‐led care |
6 months | Number of patients with at least 1 acute care readmission (i.e. presented to ED and subsequently admitted) | RR 1.14 (95% CI 0.69 to 1.89) I: 57 C: 59 |
See Analysis 1.5; data from study authors, see Table 8 for details |
| Acute care admissions, total n | I: 29 (57 residents C: 26 (59 residents |
||||
| Acute care admissions, mean (SD) | MD 0.07 (95% CI ‐0.21 to 0.35) I: 57 C: 59 |
See Analysis 1.11 | |||
| EPOC: co‐ordination of care (Case management) | |||||
|
Forbat 2020 Stepped‐wedge cRCT LOW |
P: High burden, short prognosis I: Specialist palliative care needs rounds C: Usual care (no needs round) |
I: 124 months C: 74 months |
Number of hospitalisations > 24 h per facility‐month | IRR 0.76 (95% CI 0.67 to 0.87) I: 1700 C: 1152 |
IRR calculated by review authors (see Appendix 5); adjusted for clustering |
| I: 124 months C: 74 months |
Number of hospitalisations < 24 h per facility‐month | IRR 0.88 (95% CI 0.66 to 1.18) I: 1700 C: 1152 |
IRR calculated by review authors (see Appendix 5); adjusted for clustering | ||
|
Boyd 2014 cRCT UNCLEAR |
P: ACF residents, not limited to subgroup I: GNS‐led care including multidisciplinary team care C: Usual care not including elements of the intervention |
12 months | Acute hospitalisation (rate per 1000 bed‐days) | IRR 0.97(95% CI 0.87 to 1.09) I: 1425 (520,125 total bed‐days) C: 1128 (411,720 total bed‐days) |
IRR calculated by review authors (see Appendix 5); study authors did not adjust for clustering |
| EPOC: WHO (role expansion/task shifting) | |||||
|
Arendts 2018 cRCT LOW |
P: ACF residents, not limited to subgroup I: Nurse practitioners led care using best practice guide C: Usual GP‐led care |
12 to 32 months | Hospitalisation resulting from ED visit (no. patients) | RR 0.81 (95% CI 0.48 to 1.37) I: 101 C: 99 |
See Analysis 1.5, adjusted for clustering using ICC 0.05 |
| EPOC: WHO (Staffing models) | |||||
|
Haines 2020 Stepped‐wedge cRCT LOW |
P: ACF residents, not limited to subgroup I: GP co‐located in ACF C: Care provided by externally located GP |
Between 18 and 30 months, depending on the cluster | Unplanned hospital admissions, mean (SD) per facility per 9‐week block | IRR 0.74 (95% CI 0.56 to 0.96) P = 0.024 Mean (SD) occupied bed‐days I: 6255 (1800) C: 6610 (2219) |
As extracted from published paper; unclear if study authors adjusted for clustering |
| ACF: aged care facility; C: control; CGA: comprehensive geriatric assessment; CI: confidence interval; cRCT: cluster‐randomised controlled trial; ED: emergency department; EPOC: Cochrane Effective Practice and Organisation of Care; GNS: geriatric nurse specialist; GP: general practitioner; I: intervention; ICC: intra‐cluster correlation coefficient; IRR: incidence rate ratio; MD: mean difference; MDT: multidisciplinary team; RCT: randomised controlled trial; RR: risk ratio; SD: standard deviation; SEE: summary estimate of effect; WHO: World Health Organization | |||||
Adverse effects (defined as falls, pressure ulcers and infections)
In our protocol, we defined adverse effects as falls, pressure ulcers and infections. Unless a study provided us with the data on one of these specified outcomes, we have not included it in this outcome (i.e. we have not included data from studies reporting on undefined or "any adverse events" in this outcome). Specifically, Forbat 2020 reported on harms, adverse events and unintended consequences, and Kim 2020 reported on the number of adverse events/side effects but neither study specifies whether or not the adverse events included falls, pressure ulcers or infections. Therefore, we have not included the data from these studies in this outcome. Agar 2017 stated that data on adverse events (including falls with/without injury and skin tears) would be collected, however no data were reported.
Six studies (five studies: 1776 participants; Haines 2020: number of participants not reported, mean occupied bed‐days per nine‐week block 12,865) provide data on falls (Crotty 2019; Haines 2020; Loeb 2006; Man 2020; Neyens 2009; Rubenstein 1990), two studies (Stern 2014: 119 participants; Haines 2020: mean occupied bed‐days per nine‐week block 12,865) reported on pressure ulcers, and three studies (Loeb 2006 and Wu 2010: 757 participants; Haines 2020: mean occupied bed‐days per nine‐week block 12,865) report on infections. Six studies included particularly vulnerable patient populations (i.e. postsurgical repair for hip fracture or falls: Crotty 2019; Rubenstein 1990; patients with mental or behavioural issues: Neyens 2009; highly disabled patients: Wu 2010; patients with pressure ulcers: Stern 2014; patients with lower respiratory tract infections: Loeb 2006). The participants included in Haines 2020 and Man 2020 were a general, mixed population of aged care residents.
Falls
Of the six studies reporting on the number of falls (five studies: 1776 participants; Haines 2020: number of participants not reported, mean occupied bed‐days per nine‐week block 12,865), two studies specifically investigated interventions aimed at preventing falls: Neyens 2009 assessed an intervention (i.e. a general medical assessment and an additional specific fall risk evaluation tool) applied by a multidisciplinary falls prevention team on falls in patients with mental and behavioural issues; Rubenstein 1990 assessed the effect of a post‐fall assessment, coupled with referrals for specific treatment and preventive interventions, on recurrent fall rates in frail, institutionalised, elderly persons who had previously fallen. The number of falls was the primary outcome in both Crotty 2019 (assessed the effect of in‐reach rehabilitation delivered by a multidisciplinary team in aged care residents recovering from surgical repair for hip fracture) and Haines 2020 (assessed the effect of in‐house GPs in a mixed population of aged care residents on number of falls). In Loeb 2006 (assessed the effect of hospital transfer care pathway in lower respiratory tract infection patients) and Man 2020 (assessed the effect of residential occular care in visually impaired patients), the number of falls was not the primary focus of the study. Fall data were provided as dichotomous or continuous (mean number of falls or rate of falls over time), details of which are provided in Table 3 below.
Proportion of residents with a fall
Three studies (1080 participants; 1061 after adjustment for clustering) provided data for this outcome (Crotty 2019; Loeb 2006; Rubenstein 1990). Based on a meta‐analysis of the data, we are uncertain of the effect of alternative models of care, compared to usual care, on the proportion of residents with a fall as the certainty of the evidence is very low (RR 1.15, 95% CI 0.83 to 1.60; I² = 74%; 3 trials, 1061 participants; very low‐certainty evidence; see Analysis 1.13; Table 1). We downgraded the certainty of the evidence due to serious risk of bias (two studies with unclear selection and detection bias), serious inconsistency (I² = 74%) and very serious imprecision (wide confidence intervals that include no effect and important harm).
1.13. Analysis.
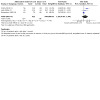
Comparison 1: Any alternative model of care versus usual care, Outcome 13: Adverse events/falls (proportion of residents with a fall)
Subgroup analysis
All three studies evaluated interventions classified as 'co‐ordination of care' in residents older than 80 years, so no subgroup analyses by EPOC category or age were possible. When subgrouping the studies by type of care (primary versus primary and secondary care), data from studies providing primary care found no effect of the alternative models of care compared to usual care on the proportion of residents with a fall (RR 0.98, 95% CI 0.85 to 1.12; I2 = 0%; 2 trials, 821 participants; Analysis 1.14). Data from the only study providing both primary and secondary care shows an increase in the proportion of residents with a fall in the intervention group compared with the control group (RR 1.46, 95% CI 1.06 to 2.01; 1 study, 240 participants; Analysis 1.14). Subgrouping by condition was not possible as each of the three studies included very different types of participants (residents with hip fracture, residents with a recent fall, residents with respiratory tract infections, see Table 2 for details).
1.14. Analysis.
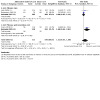
Comparison 1: Any alternative model of care versus usual care, Outcome 14: Adverse events/falls (proportion of residents with a fall): subgroup analysis by type of care provided
Sensitivity analysis
Only one of the three studies was at low overall risk of bias (Loeb 2006). Findings reported by Loeb 2006 were consistent with the results of the main analysis (RR 1.14, 95% CI 0.72 to 1.79; see Analysis 1.15). Limiting the analyses to data collected in the long term (i.e. 12 to 24 months follow‐up) reflects the findings of one study (Rubenstein 1990: 160 participants), which assessed falls after 24 months follow‐up. Analysing the data by timing of follow‐up shows that in the short term (up to 12 months follow‐up), alternative models of care seem to increase the proportion of residents with a fall compared to usual care (RR 1.34, 95% CI 1.03 to 1.75; I2 = 0%; 2 trials, 901 participants; Analysis 1.16). In the long term, alternative models of care do not seem to affect the proportion of residents with a fall compared to usual care (RR 0.97, 95% CI 0.84 to 1.11; 1 study, 160 participants; Analysis 1.16).
1.15. Analysis.
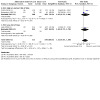
Comparison 1: Any alternative model of care versus usual care, Outcome 15: Adverse events/falls (proportion of residents with a fall): sensitivity analysis by risk of bias
1.16. Analysis.
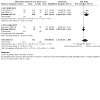
Comparison 1: Any alternative model of care versus usual care, Outcome 16: Adverse events/falls (proportion of residents with a fall): sensitivity analysis by timing of effects
Mean number of falls per resident
Two studies (338 participants; 270 after adjustment for clustering) reported the mean number of falls per resident (Man 2020; Rubenstein 1990). Compared to usual care, alternative models of care may have little or no effect on the mean number of falls per resident in aged care facilities (MD ‐0.06, 95% CI ‐0.13 to 0.00; I2 = 0%; 2 trials, 270 participants; low‐certainty evidence; see Analysis 1.17). We downgraded the certainty of the evidence for serious risk of bias (both studies at unclear risk of detection bias, one study at unclear risk of selection bias) and serious imprecision (wide confidence interval that crosses the line of no effect, analyses underpowered).
1.17. Analysis.
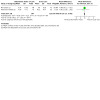
Comparison 1: Any alternative model of care versus usual care, Outcome 17: Adverse events/falls (mean number of falls per resident)
Rate of falls per person‐time
Five studies (four studies: 1096 participants (788 after adjustment for clustering); Haines 2020: number of participants not reported, mean occupied bed‐days per nine‐week block 12,865) provided data for this outcome (Crotty 2019; Haines 2020; Man 2020; Neyens 2009; Rubenstein 1990). A meta‐analysis of data from four studies showed that, compared to usual care, we are uncertain of the effect of alternative models of care on the fall rate in aged care residents (RR 1.07, 95% CI 0.70 to 1.65; I² = 85%; 4 trials, 1028 participants; very low‐certainty evidence; see Analysis 1.18) (Crotty 2019; Man 2020; Neyens 2009; Rubenstein 1990). We downgraded the certainty of the evidence due to serious risk of bias (all studies at unclear risk of detection bias, two studies at unclear risk of selection bias), serious inconsistency (I² = 85%) and very serious imprecision (wide confidence interval includes no effect and both important benefit and important harm). Although Haines 2020 reported an increase in the incidence of falls (per facility per nine‐week block) with the alternative model of care, the 95% confidence interval around the point estimate indicated both an increase and a decrease in falls compared with usual care (IRR 1.05, 95% CI 0.94 to 1.18, as extracted from the published paper).
1.18. Analysis.
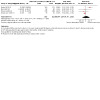
Comparison 1: Any alternative model of care versus usual care, Outcome 18: Adverse events/falls (logarithm of rate ratio)
Proportion of residents with an injurious fall
Crotty 2019 provided data on the proportion of residents with an injurious fall leading to hospital admission. Compared to usual care, we are uncertain of the effect of alternative models of care on the proportion of residents with an injurious fall as the certainty of the evidence is very low (RR 0.81, 95% CI 0.40 to 1.66; 1 trial, 240 participants; very low‐certainty evidence; see Analysis 1.19). We downgraded the certainty of the evidence for indirectness (one study only), serious risk of bias (unclear detection bias) and very serious imprecision (wide confidence interval that crosses the line of no effect and includes both important benefit and important harm).
1.19. Analysis.
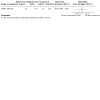
Comparison 1: Any alternative model of care versus usual care, Outcome 19: Adverse events/injurious falls (proportion of residents with an injurious fall)
Mean number of injurious falls per resident
Man 2020 reported on injurious falls but did not stipulate how they defined an injurious fall and whether or not the injurious fall led to hospital admission. We are uncertain of the effect of alternative models of care on the mean number of injurious falls per resident compared with usual care, as the certainty of the evidence is very low (MD ‐0.04, 95% CI ‐0.36 to 0.28; 1 trial, 110 participants; very low‐certainty evidence; see Analysis 1.20). We downgraded the certainty of evidence for serious risk of bias (unclear detection bias), indirectness (one study only) and very serious imprecision (wide confidence interval that crosses the line of no effect and includes both an important benefit and important harm).
1.20. Analysis.
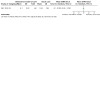
Comparison 1: Any alternative model of care versus usual care, Outcome 20: Adverse events/injurious falls (mean number of injurious falls per resident)
Table 3. Studies reporting fall data (ordered by EPOC intervention category)
|
Study ID Overall risk of bias (based on selection and detection bias) |
Participants (P) Intervention (I) Comparator (C) |
Timing of assessment | Description of outcome data provided |
Summary estimate of effect (SEE) (95% CI) Sample size |
Note |
| EPOC: co‐ordination of care (Teams) | |||||
|
Crotty 2019 RCT UNCLEAR |
P: After hip fracture I: In‐reach MDT rehabilitation care C: Usual GP‐led care |
1 month | Number of residents with a fall | RR 1.46 (95% CI 1.06 to 2.01) | See Analysis 1.13; calculated incidence rate ratio using total number of falls (I: 162, C: 96) and estimating person‐time (see Appendix 5) and Analysis 1.18 |
| Number of residents with an injurious fall | RR 0.81 (95% CI 0.40 to 1.66) | See Analysis 1.19 | |||
|
Neyens 2009 cRCT UNCLEAR |
P: With mental/behavioural problems I: MDT fall prevention programme C: Usual care |
12 months | Number of falls, n per patient per year | IRR 0.83 (95% CI 0.71 to 0.95) I: 355 falls in 169.5 patient‐years C: 422 falls in 166.3 patient‐years |
IRR calculated by review authors; data extracted from published paper: rate ratio adjusted for length of stay: 0.79 (95% CI 0.43 to 1.47); rate ratio adjusted for ward‐related and patient‐related parameters: 0.64, 95% CI 0.43 to 0.96); study authors adjusted for clustering |
| EPOC: co‐ordination of care (Care pathways) | |||||
|
Loeb 2006 cRCT LOW |
P: Lower respiratory tract infection patients I: Clinical pathway to decide whether hospital transfer is needed C: Usual care without clinical pathway |
30 days | Falls (%), weighted mean rate per facility | MD ‐1.3 (95% CI ‐6.6 to 3.9) I: 314 C: 347 |
MD as extracted from published paper as no raw data provided; MD weighted by size of nursing home and adjusted for clustering. Raw number of residents with a fall not provided and calculated by review authors (mean% falls intervention facilities: 10.9 (314 residents); mean% falls control facilities: 9.5 (347 residents); see Analysis 1.13 |
| EPOC: co‐ordination of care (Comprehensive geriatric assessment) | |||||
|
Rubenstein 1990 RCT UNCLEAR |
P: After fall I: Comprehensive geriatric assessment C: Usual care |
24 months | Number of residents with subsequent falls | RR 0.97 (95% CI 0.84 to 1.11) | See Analysis 1.13 |
| Mean (SE) subsequent falls per subject | MD ‐0.42 (95% CI ‐1.89 to 1.05) | See Analysis 1.17 | |||
| EPOC: WHO (Staffing models) | |||||
|
Haines 2020 Stepped‐wedge cRCT LOW |
P: ACF residents, not limited to subgroup I: GP co‐located in ACF C: Care provided by externally located GP |
Between 18 and 30 months, depending on the cluster | Falls, mean (SD) per facility per 9‐week block | IRR 1.05 (95% CI 0.94 to 1.18) I: Mean (SD) occupied bed‐ days 6255 (1800) C: Mean (SD) occupied bed‐ days 6610 (2219) |
As extracted from published paper; unclear if study authors adjusted for clustering |
| EPOC: WHERE (site of service delivery) | |||||
|
Man 2020 cRCT UNCLEAR |
P: With visual impairment I: Residential on‐site ocular care model C: Ocular care provided by service associated with facility |
6 months (over a period of 9 months, 3 months before the intervention + 6 months follow‐up) | Number of falls in past 9 months, mean (SE) | MD ‐0.06 (95% CI ‐0.13 to 0.01) | See Analysis 1.17 |
| Rate ratio 0.90 (95% CI 0.39 to 2.06) | As extracted from published paper; rate ratio estimate from mixed model adjusted for age, years lived in ACF, smoking. For unadjusted estimate, see Table 6 | ||||
| Number of injurious falls in past 9 months, mean (SE) | MD ‐0.04 (95% CI ‐0.36 to 0.28) | See Analysis 1.20 | |||
| Rate ratio 0.82 (95% CI 0.18 to 3.62) | As extracted from published paper; rate ratio estimate from mixed model adjusted for age, years lived in ACF, smoking. For unadjusted estimate, see Table 6 | ||||
| ACF: aged care facility; C: control; CGA: comprehensive geriatric assessment; CI: confidence interval; cRCT: cluster‐randomised controlled trial; ED: emergency department; EPOC: Cochrane Effective Practice and Organisation of Care; GP: general practitioner; I: intervention; ICC: intra‐cluster correlation coefficient; IRR: incidence rate ratio; MD: mean difference; MDT: multidisciplinary team; RCT: randomised controlled trial; RR: risk ratio; SD: standard deviation; SE: standard error; SEE: summary estimate of effect; WHO: World Health Organization | |||||
Incidence of pressure ulcers
Two studies reported data on pressure ulcers (Stern 2014: 119 participants; Haines 2020: number of participants not reported, mean occupied bed‐days per nine‐week block 12,865). In Stern 2014, patients with pressure ulcers were recruited, and prevention and treatment of pressure ulcers was the primary focus of the study. Although the percentage of wounds healed (i.e. the probability of healing at six months, without adjustment for pressure ulcer stage) was higher during the intervention period (53.4%, 95% CI 41.4 to 62.9) compared to the control period (35.0%, 95% CI 22.4 to 45.6), the overlapping 95% confidence intervals reflect no difference between the groups (Stern 2014). The pressure ulcer incidence rate (IRR 1.12, 95% CI 0.74 to 1.68, P = 0.59) reflects a higher incidence of pressure ulcers during the intervention period compared with the control period, but the 95% confidence intervals include both benefit and harm. Similarly, the pressure ulcer prevalence was higher during the intervention phase (2.40%, 95% CI 1.81% to 3.19%) compared to the control phase (2.22%, 95% CI 1.79% to 2.76%), but the overlapping 95% confidence intervals show no difference between the groups (P = 0.6). Haines 2020 provided data on pressure ulcers as an adverse event and not the primary study outcome as in Stern 2014. Haines 2020 findings were similar to that of Stern 2014 in that providing a mixed population of aged care residents with an in‐facility GP increased the incidence of pressure ulcers compared to usual care; however, the 95% confidence intervals include both an increase and a decrease in the incidence of pressure ulcers with the intervention (IRR 1.11, 95% CI 0.71 to 1.74). Based on the findings of these two studies, we are uncertain of the effect of alternative models of care on the incidence of pressure ulcers in residents of aged care facilities compared to usual care, as the certainty of the evidence is very low. Wedowngraded the certainty of evidence due to serious risk of performance bias in both studies and very serious risk of imprecision (wide confidence intervals cross the line of no effect and include important benefit and harm).
Proportion of residents with an infection
Based on data from one study (Loeb 2006, 680 participants; 254 after adjustment for clustering), we are uncertain of the effects of alternative models of care on the proportion of aged care residents with an infection compared to usual care as the certainty of the evidence is very low (RR 1.65, 95% CI 0.28 to 9.70; 1 trial, 254 participants; very low‐certainty evidence;see Analysis 1.21). We downgraded the certainty of evidence for indirectness (one study only) and very serious risk of imprecision (wide confidence interval that crosses the line of no effect and includes very important benefit and harm).
1.21. Analysis.
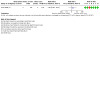
Comparison 1: Any alternative model of care versus usual care, Outcome 21: Adverse events/infections (proportion of residents with an infection)
Mean number of infections per resident
Loeb 2006 reported the weighted mean difference in catheter‐related urinary infections (0.30, 95% CI ‐0.94 to 1.60; as extracted from published paper) and skin and soft tissue infections (‐1.10, 95% CI ‐1.20 to 3.80; as extracted from published paper; MD weighted by the size of the nursing home, very low‐certainty evidence) between the alternative model (care pathway) and usual care (Table 4). We downgraded the certainty of the evidence for indirectness (one study only) and very serious risk of imprecision (wide confidence interval that crosses the line of no effect and includes very important benefits and harm).
Infection rate per person‐time
Haines 2020 reported the incidence rate of any infection (urinary tract, gastrointestinal or respiratory; IRR 1.42, 95% CI 1.18 to 1.70; mean (SD) occupied bed‐days intervention: 6255 (1800), control: 6610 (2219), as reported by study authors) with an alternative model (GP co‐located in ACF) compared to usual care. Wu 2010 reported the incidence of pneumonia (0 cases in both groups) and urinary tract infections (intervention: 0 per 1000 bed‐days, control: 0.26 per 1000 bed‐days) (Table 4). Compared to usual care, we are uncertain of the effect of alternative models of care on infection rate in ACF residents as the certainty of the evidence is very low. We downgraded the certainty of the evidence for serious risk of bias (high risk of performance bias), serious inconsistency and serious imprecision.
Table 4. Studies reporting on number of infections (ordered by EPOC intervention category).
|
Study ID Overall risk of bias (based on selection and detection bias) |
Participants (P) Intervention (I) Comparator (C) |
Timing of assessment | Description of outcome data provided |
Summary estimate of effect (SEE) (95% CI) Sample size |
Note |
| EPOC: co‐ordination of care (Care pathways) | |||||
|
Loeb 2006 cRCT LOW |
P: With respiratory tract infection I: Clinical pathway to decide whether hospital transfer is needed C: Usual care without clinical pathway |
30 days | Catheter‐related urinary infections, n | RR 0.37 (95% CI 0.02 to 8.90) I: 314 C: 347 |
See Analysis 1.21 Catheter‐related urinary infections (weighted mean difference per facility 0.3, 95% CI ‐0.94 to 1.6; as extracted from published paper; MD weighted by size of nursing home) Published text states: no catheter‐related urinary infections in intervention, 1 catheter‐related urinary infections in control |
| Skin and soft tissue infections, n | RR 1.65 (95% CI 0.28 to 9.70) I: 314 C: 347 |
See Analysis 1.21 Skin and soft tissue infections (weighted mean difference per facility ‐1.1, 95% CI ‐1.2 to 3.8; as extracted from published paper; MD weighted by size of nursing home) Published text states: 8 skin and soft tissue infections in intervention, 5 skin and soft tissue infections in control |
|||
| EPOC: co‐ordination of care (Teams) | |||||
|
Wu 2010 cRCT UNCLEAR |
P: Highly disabled I: MDT care C: Usual care |
12 months | Pneumonia, incidence per 1000 bed‐days | 0 cases in both groups I: 32 C: 42 |
As extracted from published paper |
| Urinary tract infection, incidence per 1000 bed‐days | I: 0 per 1000 bed‐days C: 0.26 per 1000 bed‐days I: 32 C: 42 |
As extracted from published paper | |||
| EPOC: WHO (Staffing models) | |||||
|
Haines 2020 Stepped‐wedge cRCT LOW |
P: ACF residents, not limited to subgroup I: GP co‐located in ACF C: Care provided by externally located GP |
Between 18 and 30 months, depending on the cluster | Any infection (urinary tract, gastrointestinal or respiratory) | IRR 1.42 (95% CI 1.18 to 1.70) Mean (SD) occupied bed‐days I: 6255 (1800) C: 6610 (2219) |
As extracted from published paper New urinary tract infections (IRR 1.68, 95% CI 1.29 to 2.20) New gastrointestinal infections (study authors report: NC = not calculated: auxiliary ordinary least squares regression: P < 0.80) New respiratory infections (IRR 1.23, 95% CI 0.94 to 1.62) |
| ACF: aged care facility; C: control; CGA: comprehensive geriatric assessment; CI: confidence interval; cRCT: cluster‐randomised controlled trial; ED: emergency department; EPOC: Cochrane Effective Practice and Organisation of Care; GP: general practitioner; I: intervention; ICC: intra‐cluster correlation coefficient; IRR: incidence rate ratio; MD: mean difference; MDT: multidisciplinary team; RCT: randomised controlled trial; RR: risk ratio; SD: standard deviation; SEE: summary estimate of effect; WHO: World Health Organization | |||||
Adherence to clinical guideline‐recommended care
Three studies (551 participants) measured adherence to clinical guideline‐recommended care, all in relation to medication use (Brodaty 2003; Crotty 2004; Rutten 2022). Brodaty 2003 assessed the effects of either multidisciplinary psychogeriatric case management (group 1) or multidisciplinary team assessment with the resulting treatment plan provided to a GP (group 2) with usual care. Crotty 2004 studied the effects of multidisciplinary case conferencing compared to usual care. Rutten 2022 studied the appropriateness of antibiotic prescription when using a decision tool integrated into electronic health records. Two studies recruited residents of ACFs with mental health conditions or behavioural problems (Brodaty 2003; Crotty 2004) and one study the general resident population of ACFs (Rutten 2022). One study had an overall low risk of bias (Crotty 2004) and two had an unclear risk of bias (Brodaty 2003; Rutten 2022).
Proportion of residents receiving adequate antidepressant therapy
Brodaty 2003 reported the proportion of residents with depression (with or without psychosis) receiving adequate antidepressant therapy following either multidisciplinary psychogeriatric case management (RR 8.38, 95% CI 1.14 to 61.37; 43 participants; see Analysis 1.22) or multidisciplinary team assessment (RR 8.00, 95% CI 1.09 to 58.71; 44 participants; see Analysis 1.22) compared to usual care. We are uncertain of the effect of alternative models of care on the proportion of residents receiving adequate antidepressant medication compared to usual care as the certainty of the evidence is very low (RR 5.29, 95% CI 1.08 to 26.00; I2 = 0%; 1 study, 65 participants; very low‐certainty evidence; see Analysis 1.23; Table 1). We downgraded the evidence for serious risk of bias (high risk of performance bias), indirectness (one study limited to a population with mental health problems and intervention related to medication use, which limits the generalisability of findings to other care models/other resident populations) and very serious imprecision (wide confidence interval that includes no appreciable benefit and very large benefit).
1.22. Analysis.
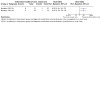
Comparison 1: Any alternative model of care versus usual care, Outcome 22: Adherence to clinical guideline‐recommended care (proportion of residents with adequate antidepressant therapy)
1.23. Analysis.
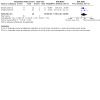
Comparison 1: Any alternative model of care versus usual care, Outcome 23: Adherence to clinical guideline‐recommended care (proportion of residents with adequate antidepressant therapy, two intervention arms combined)
Proportion of residents receiving adequate antipsychotic therapy
Brodaty 2003 also reported on the proportion of residents with psychosis (without depression) receiving adequate antipsychotic treatment following either multidisciplinary psychogeriatric case management (RR 7.65, 95% CI 0.44 to 132.16; 35 participants; Analysis 1.24) or multidisciplinary team assessment (RR 4.72, 95% CI 0.24 to 91.4; 35 participants; see Analysis 1.24) compared to usual care. We are uncertain of the effect of either alternative model of care on the proportion of residents receiving adequate antipsychotic therapy compared to usual care as the certainty of the evidence is very low (RR 3.21, 95% CI 0.42 to 24.44; I2 = 0%; 1 study, 52 participants; very low‐certainty evidence; see Analysis 1.25). We downgraded the evidence for serious risk of bias (high risk of performance bias), indirectness (one study limited to a population with mental health problems and intervention related to medication use, which limits the generalisability of findings to other care models/other resident populations) and very serious imprecision (wide confidence intervals that include no effect and very important harm and benefit).
1.24. Analysis.
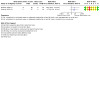
Comparison 1: Any alternative model of care versus usual care, Outcome 24: Adherence to clinical guideline‐recommended care (proportion of residents with adequate antipsychotic therapy)
1.25. Analysis.
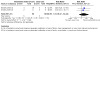
Comparison 1: Any alternative model of care versus usual care, Outcome 25: Adherence to clinical guideline‐recommended care (proportion of residents with adequate antipsychotic therapy, two arms combined)
Proportion of residents receiving appropriate antibiotic therapy
Rutten 2022 reported on the proportion of residents with urinary tract infections receiving appropriate antibiotic therapy following implementation and uptake of a decision tool integrated into electronic health records versus usual care (RR 1.24, 95% CI 0.86 to 1.78; 295 participants/171 infections; Analysis 1.26). We are uncertain of the effect of the alternative models of care on the proportion of residents receiving antibiotic therapy compared to usual care as the certainty of the evidence isvery low. We downgraded the evidence for serious risk of bias, indirectness (one study limited to a population with mental health problems and intervention related to medication use, which limits the generalisability of findings to other care models/other resident populations) and serious imprecision (wide confidence intervals that include no effect and very important harm).
1.26. Analysis.
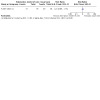
Comparison 1: Any alternative model of care versus usual care, Outcome 26: Adherence to clinical guideline‐recommended care (proportion of residents with adequate antibiotic therapy)
Medication Appropriateness Index
Crotty 2004 assessed the appropriateness of medication on 10 criteria: indication, effectiveness, dosage, correct directions, practical directions, drug‐drug interactions, drug‐disease interactions, duplication, duration and expense. Appropriate/marginally appropriate responses scored 0, inappropriate responses scored 1. Crotty 2004 reported no difference in mean Medication Appropriateness Index score (MD ‐0.20, 95% CI ‐3.75 to 3.35; 71 participants; very low‐certainty evidence; see Analysis 1.27) between the residents who received multidisciplinary case conferencing (mean 3.5, 95% CI 1.4 to 5.6; 50 participants, as reported by study authors) and those who received usual care (mean 3.7, 95% CI 1.6 to 5.7; 54 participants, as reported by study authors). We are uncertain of the effect of alternative models of care on guideline‐recommended medication appropriateness in ACF residents compared to usual care as the certainty of the evidence is very low. We downgraded the certainty of the evidence due to serious risk of bias (high risk of performance bias), indirectness (one study limited to population with mental health problems and intervention related to medication use, which limits the generalisability of findings to other care models/other resident populations) and very serious imprecision (wide confidence intervals that include no effect as well as both important benefit and harm).
1.27. Analysis.
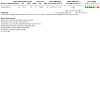
Comparison 1: Any alternative model of care versus usual care, Outcome 27: Adherence to clinical guidelines (MAI)
Health‐related quality of life of residents
As specified in our protocol, if a study provided quality of life data using numerous different instruments, we preferentially extracted data from the generic scales (e.g. 36‐item Short Form Health Survey (SF‐36) (mental component score) or EuroQol 5 dimensions (EQ5D)) at longest follow‐up. We only used disease‐specific quality of life scale data if this was the only measure of quality of life.
Fourteen studies (4967 participants) reported on the health‐related quality of life of aged care residents using different instruments and scales, both within and across studies: seven studies (2609 participants) used EQ‐5D (Arendts 2018; Crotty 2019; De Luca 2016; Leontjevas 2013; Man 2020; Stern 2014; Van den Block 2020); one study (76 participants) used the SF‐36 questionnaire (Kolcu 2020); one study (340 participants) used the SF‐12 questionnaire (Boorsma 2011a); one study (680 participants) used the Minimum Data Set Health Status Index (based on the components of the Minimum Data Set version 2) (Loeb 2006); three studies (1176 participants) used dementia‐specific tools to measure quality of life: Quality of Life in Late‐stage Dementia Scale (QUALID, Lichtwarck 2018, QUALIDEM, Pieper 2016 and Zwijsen 2014). Harvey 2014 assessed quality of life using the Quality of Life‐Alzheimer’s Disease (QOL‐AD) instrument. In addition to the EQ‐5D scale, Crotty 2019 also reported dementia‐specific quality of life (health‐related quality of life for people with dementia, DEMQOL). Agar 2017, Cordato 2018 and Kim 2020 appeared to have assessed quality of life but have not reported the data (see below Table 5).
As we identified more than 10 studies reporting on the same outcome, we were able to generate a funnel plot (see Figure 5) to visually examine the data for asymmetry and to explore possible reporting or publication biases (Higgins 2019; Sterne 2011). A meta‐analysis of 12 studies shows that, compared to usual care, alternative models of care may have little or no effect on the health‐related quality of life of ACF residents (standardised mean difference (SMD) ‐0.04, 95% CI ‐0.09 to 0.01; I² = 23%; 12 trials, 4016 participants; Analysis 1.28; Table 1; back‐translated to a typical scale using the standard deviation of the control group at baseline from the most representative trial Man 2020 (0 to 1 scale); MD ‐0.016 with 95% CI from ‐0.036 to 0.004; low‐certainty evidence) (Arendts 2018; Boorsma 2011a; Crotty 2019; Kolcu 2020; Leontjevas 2013; Lichtwarck 2018; Loeb 2006; Man 2020; Pieper 2016; Stern 2014; Van den Block 2020; Zwijsen 2014). We downgraded the certainty of the evidence due to serious risk of bias (all studies at a high risk of performance bias) and serious publication bias (see Figure 5).
5.
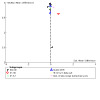
1.28. Analysis.
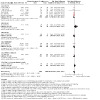
Comparison 1: Any alternative model of care versus usual care, Outcome 28: Quality of life (standardised mean difference)
Pieper 2016 and Zwijsen 2014 studied the effects of multidisciplinary care teams in dementia patients and reported quality of life using five subscales of the QUALIDEM instrument. We arbitrarily chose to use the data for the subscale "positive affect" in the meta‐analysis. In a small randomised study (59 participants), De Luca 2016 assessed the effectiveness of a telehealth care model on the health‐related quality of life in aged care residents compared to usual care. De Luca 2016 only reported the median and interquartile range (IQR) for the intervention (8.0, IQR 7.5 to 9.0, n = 32) and control group (5.0, IQR 4.0 to 6.0, n = 27)(see below Table 5). We did not include the data in the meta‐analysis as it is highly likely that these data are skewed. Harvey 2014 did not provide any data but reported the following regarding quality of life, "at baseline 33 (58%) of the intervention group and 35 (59%) of controls completed the QOL‐AD instrument. Due to increasing frailty and the high mortality rate, only 93% repeated the questionnaire at one month and 66% at six months. There were no significant differences between groups in quality of life at baseline and no significant changes within either group over time".
Subgroup analyses
The heterogeneity (I² = 44%) was not considerable, so we did not investigate differences between the alternative models of care further.
Sensitivity analyses
Limiting the meta‐analysis to studies with low overall risk of bias did not meaningfully alter the estimate of effect (SMD ‐0.07, 95% CI ‐0.12 to ‐0.01; MD ‐0.02, 95% CI ‐0.048 to ‐0.004; 5 trials: Arendts 2018; Boorsma 2011a; Leontjevas 2013; Loeb 2006; Stern 2014, 1418 participants; see Analysis 1.29). Limiting the analysis to studies with follow‐up longer than 12 months also did not substantially alter the findings (SMD ‐0.06, 95% CI ‐0.10 to ‐0.02; MD ‐0.024, 95% CI ‐0.04 to ‐0.008; 4 trials: Leontjevas 2013Stern 2014; Van den Block 2020; Zwijsen 2014, 2573 participants; see Analysis 1.30).
1.29. Analysis.
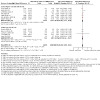
Comparison 1: Any alternative model of care versus usual care, Outcome 29: Quality of life (standardised mean difference): sensitivity analysis by risk of bias
1.30. Analysis.
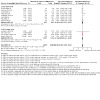
Comparison 1: Any alternative model of care versus usual care, Outcome 30: Quality of life (standardised mean difference): sensitivity analysis by timing of effect
Table 5. Studies reporting on health‐related quality of life arranged by EPOC category
|
Study ID Overall risk of bias (based on selection and detection bias) |
Participants (P) Intervention (I) Comparator (C) |
Timing of assessment | Description of outcome data provided |
Summary estimate of effect (SEE) (95% CI) Sample size |
Note |
| EPOC: co‐ordination of care (Teams) | |||||
|
Boorsma 2011a cRCT LOW |
P: Residents of ACFs, not further limited to a specific subgroup I: Multidisciplinary integrated care C: Usual GP‐led care |
6 months | SF‐12, scale 0 to 100, mean (SD) | SMD ‐0.04 (95% CI ‐0.34 to 0.26) I: 201 C: 139 |
SMD calculated by review authors (Analysis 1.31); adjusted for clustering using ICC 0.02 reported in paper |
|
Crotty 2019 RCT UNCLEAR |
P: After hip fracture I: In‐reach multidisciplinary rehabilitation care C: Usual GP‐led care |
12 months | EQ‐5D‐3L, mean (SE) | SMD ‐0.27 (95% CI ‐0.53 to ‐0.01) I: 117 C:118 |
SMD calculated by review authors, see Analysis 1.31; study authors also provided summary estimate of effect: MD 0.06 (95% CI ‐0.006 to 0.13, quality of life lower in intervention) |
| Health‐related quality of life in patients with dementia (DEMQOL) sum score, the higher the better the quality of life, mean (SE) | MD ‐7.4 (95% CI ‐12.5 to ‐2.3) |
As provided by study authors | |||
| DEMQOL‐proxy sum score, the higher the better the quality of life, mean (SE) | MD 3.1 (95% CI ‐0.62 to 6.9) | As provided by study authors | |||
|
Leontjevas 2013 Stepped‐wedge cRCT LOW |
P: With mental/behavioural problems I: Multidisciplinary care C: Usual GP‐led care |
20 months | EQ‐5D‐5L, visual analogue scale 0 to 100 (100 = best heath state), difference between the intervention and control (repeatedly measured over a period of 20 months) | SMD 0.13 (95% CI ‐2.78 to 3.03) I: 170 C: 170 |
SMD calculated from MD extracted from the published paper: MD 3.4, 95% CI 0.5 to 6.3), adjusted for confounders, clustering and time‐trends |
|
Stern 2014 Stepped‐wedge cRCT LOW |
P: With pressure ulcers I: Multidisciplinary care C: Usual care |
Between 4 and 14 months, depending on the cluster | EQ‐5D (unclear 3L or 5L), beta coefficient from linear mixed model | SMD ‐0.08 (95% CI ‐0.14 to ‐0.02) I: 94 C: 67 |
SMD calculated from MD extracted from the published paper: MD ‐0.03 (95% CI ‐0.09 to 0.03) Adjusted for patient age and other confounders (sex, diabetes, BMI) |
|
Zwijsen 2014 Stepped‐wedge cRCT HIGH |
P: Residents of ACFs with mental health conditions or behavioural problems I: Multidisciplinary care C: Usual care |
20 months | Dementia‐specific quality of life instrument (QUALIDEM), subscale "positive affect", range 0 to 18 | SMD ‐0.01 (95% CI ‐0.19 to 0.16) I: 318 C: 318 |
SMD calculated from MD extracted from the published paper: MD ‐0.32 (95% CI ‐1.5 to 1.9; derived using a linear mixed model, adjusting for time spent in intervention phase) See Table 7 for data provided by the study authors on the other QUALIDEM subscales (i.e. QUALIDEM, subscale 'care relationship', range 0 to 21; QUALIDEM, subscale 'negative affect', range 0 to 9; QUALIDEM, subscale 'restlessness tense behaviour', range 0 to 9; QUALIDEM, subscale 'social relations', range 0 to 18) |
| EPOC: co‐ordination of care (Case management) | |||||
|
Van den Block 2020 cRCT HIGH |
P: Residents of ACF, not limited to subgroup I: Palliative care including advance care planning, tailored review of residents' needs and multidisciplinary approach C: Usual care |
Between 13 and 17 months | EQ‐5D‐5L, mean | SMD ‐0.05 (95% CI ‐0.10 to 0.00) I: 425 C: 558 |
SMD calculated from MD extracted from the published paper: MD ‐0.038 (95% CI ‐0.087 to 0.011). Overall estimate of effect as provided by study authors; linear mixed model adjusted for age, gender, disease severity, baseline case mix, country and treatment group |
|
Lichtwarck 2018 cRCT UNCLEAR |
P: Residents of ACFs with mental health conditions or behavioural problems I: Targeted Interdisciplinary Model for Evaluation and Treatment of Neuropsychiatric Symptoms (TIME) C: Usual care | 12 weeks | Quality of Life in Late‐stage Dementia Scale, higher scores indicate lesser quality of life, mean value (95% CI per group) | SMD 0.25 (95% CI ‐0.03 to 0.53) I: 86 C: 116 |
SMD calculated in RevMan, see Analysis 1.31 after converting scale 11 to 55, higher = worse, to 0 to 100, higher is better; study authors adjusted for clustering using linear mixed model (ICC = 14.6%) |
| EPOC: co‐ordination of care (care pathways) | |||||
|
Loeb 2006 cRCT LOW |
P: With respiratory tract infection I: Clinical pathway to decide whether hospital transfer is needed C: Usual care without clinical pathway |
30 days | The Minimum Data Set Health Status Index (scale 0 to 1); weighted mean change from baseline (95% CI) | SMD 0.02 (95% CI ‐0.13 to 0.17) I: 314 C: 347 |
SMD calculated in RevMan, see Analysis 1.31; already adjusted for clustering |
|
Pieper 2016 cRCT HIGH |
P: ACF residents with mental health conditions or behavioural problems I: Stepwise Multidisciplinary Intervention for Challenging Behaviour in Advanced Dementia (STA OP!) C: Usual care (training without stepwise component) | Average over period 3 to 6 months | QUALIDEM: subscale ‘Positive affect’ (scale 0 to 12), mean change (β, SE) from linear mixed model (unadjusted/adjusted for Katz ADL index and Reisberg global deterioration scale) | SMD ‐0.04 (95% CI ‐0.67 to 0.60) I: 148 C: 140 |
SMD calculated from β (‐0.2) and SE (0.32) as reported in paper; data already adjusted for clustering, time, the Reisberg global deterioration scale and the Katz index, because of a significant difference between the 2 groups at baseline (analysis Model 2) |
| EPOC: WHO (role expansion/task shifting) | |||||
|
Arendts 2018 cRCT LOW |
P: ACF residents, not limited to subgroup I: Nurse practitioners led care using best practice guide C: Usual GP‐led care |
12 months | EQ‐5D‐3L, weighted over 1 year (all alive from baseline), mean (95% CI) | SMD ‐0.06 (95% CI ‐0.51 to 0.38) I: 101 C: 99 |
SMD calculated in RevMan, see Analysis 1.31, adjusted for clustering ICC 0.05 |
|
Kolcu 2020 RCT UNCLEAR |
P: ACF residents with hypertension I: Nurse‐led hypertension management programme C: Usual care |
24 weeks | Short form (SF)‐36 quality of life, mental component (scale 0 to 100) | SMD 0.71 (95% CI 0.25 to 1.18) | SMD calculated in RevMan, see Analysis 1.31. For additional quality of life data provided by study authors (SF‐36 quality of life, total score, general health, mental health, pain, physical component, physical functioning, role‐emotional, role‐physical, social functioning, vitality), see Table 5 |
| EPOC: WHERE (site of service delivery) | |||||
|
Man 2020 cRCT UNCLEAR |
P: With visual impairment I: Residential on‐site ocular care model C: Ocular care provided by service associated with the facility |
6 months | EQ‐5D‐3L index (scale: 0 to 1), mean (SE) | SMD 0.00 (95% CI ‐0.12 to 0.12) I: 95 C: 83 |
SMD calculated from MD extracted from published paper: MD 0.00 (95% CI ‐0.11 to 0.12). Study authors adjusted for clustering using LMM |
| EPOC: ICT (Telemedicine) | |||||
|
De Luca 2016 RCT HIGH |
P: ACF residents, not limited to subgroup I: Telemonitoring for patient's vital signs C: Usual care |
End of follow‐up (no details provided) | EQ‐5D (unclear 3L or 5L), median (IQR) | Not available I: 32 C: 27 |
Only reported the median and IQR for the intervention (8.0, IQR 7.5 to 9.0, n = 32) and control group (5.0, IQR 4.0 to 6.0, n = 27); small sample size; it is highly likely the data are skewed so did not convert median to mean and IQR to SD |
| ACF: aged care facility; BMI: body mass index; C: control; CGA: comprehensive geriatric assessment; CI: confidence interval; cRCT: cluster‐randomised controlled trial; ED: emergency department; EPOC: Cochrane Effective Practice and Organisation of Care; GP: general practitioner; I: intervention; ICC: intra‐cluster correlation coefficient; IQR: interquartile range; IRR: incidence rate ratio; LMM: linear mixed model; MD: mean difference; RCT: randomised controlled trial; RR: risk ratio; SD: standard deviation; SE: standard error; SEE: summary estimate of effect; SMD: standardised mean difference; WHO: World Health Organization | |||||
Mortality
Twenty‐five studies (24 studies: 12,322 participants (3881 after adjustment for clustering); Haines 2020: number of participants not reported, mean occupied bed‐days per nine‐week block 12,865) reported on mortality (Agar 2017; Arendts 2018; Bellantonio 2008; Boorsma 2011a; Connolly 2015; Cordato 2018; Crotty 2004; Crotty 2019; Dy 2013; Forbat 2020; Haines 2020; Harvey 2014; Kim 2020; Kolcu 2020; Kotynia‐English 2005; Lichtwarck 2018; Lin 2010; Loeb 2005; Loeb 2006; Man 2020; McSweeney 2012; Pieper 2016; Rubenstein 1990; Rutten 2022; Uy 2008). As we identified more than 10 studies reporting on the same outcome, we were able to generate a funnel plot (see Figure 6) to visually examine the data for asymmetry and to explore possible reporting or publication biases (Higgins 2019; Sterne 2011). Based on the data from 24 of the 25 studies, compared to usual care, alternative models of care probably make little or no difference to the number of deaths in residents of aged care facilities (RR 1.03, 95% CI 0.92 to 1.16; I2 = 0%; 24 trials, 3881 participants; Analysis 1.32; Table 1; moderate‐certainty evidence). We downgraded the certainty of the evidence for serious publication bias (see Figure 6). Haines 2020 reported higher mortality in the intervention group compared to usual care (IRR 1.31, 95% CI 0.94 to 1.82; P = 0.12).
6.
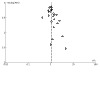
Funnel plot of comparison: 1 Any alternative model of care vs usual care, outcome: 1.17 Mortality (number of deaths) adjustment for clustering in cRCTs.
1.32. Analysis.
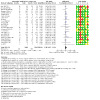
Comparison 1: Any alternative model of care versus usual care, Outcome 32: Mortality (proportion of residents who died)
Subgroup analyses
No heterogeneity was detected between the study data in the meta‐analysis (Analysis 1.32), so no subgroup analyses were necessary.
Sensitivity analyses
Restricting the meta‐analysis to studies with low overall risk of bias (Arendts 2018; Boorsma 2011a; Crotty 2004; Connolly 2015; Forbat 2020; Kim 2020; Kotynia‐English 2005; McSweeney 2012; Harvey 2014; Loeb 2006; Uy 2008) did not alter the results (Analysis 1.33); nor did analyses by the timing of assessment (short versus long term) (see Analysis 1.34).
1.33. Analysis.
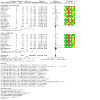
Comparison 1: Any alternative model of care versus usual care, Outcome 33: Mortality (proportion of residents who died): sensitivity analyses by risk of bias
1.34. Analysis.
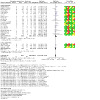
Comparison 1: Any alternative model of care versus usual care, Outcome 34: Mortality (proportion of residents who died): sensitivity analysis by timing of effect
Resource use
Eleven studies (10,291 participants from nine studies, Grabowski 2014 and Haines 2020 only reported number of beds) provided data on cost‐effectiveness or total cost associated with the alternative model of care, compared with usual care (Boorsma 2011a; Cordato 2018; Crotty 2004; Crotty 2019; Forbat 2020; Grabowski 2014; Haines 2020; Loeb 2006; Stern 2014; Van den Block 2020; Zwijsen 2014). Five studies assessed the effect of multidisciplinary care teams (Boorsma 2011a; Crotty 2004; Crotty 2019; Stern 2014; Zwijsen 2014), two studies investigated case management models (Forbat 2020; Van den Block 2020), one study examined discharge planning (Cordato 2018), one study looked at care pathways (Loeb 2006), and one study assessed the effect of telemedicine (Grabowski 2014). Agar 2017 stated that cost‐utility analyses would be conducted; however, no results were reported.
Ten studies provided total costs (as defined by study authors) of health care and associated intervention costs per trial arm (Boorsma 2011a; Cordato 2018; Crotty 2019; Forbat 2020; Grabowski 2014; Haines 2020; Loeb 2006; Stern 2014; Van den Block 2020; Zwijsen 2014), three studies reported on costs of primary care (Boorsma 2011a; Cordato 2018; Zwijsen 2014), and two studies provided costs of secondary care (Boorsma 2011a; Zwijsen 2014). Inpatient costs were reported by four studies (Cordato 2018; Crotty 2019; Loeb 2006; Stern 2014) and one study provided costs of ED admissions (Cordato 2018). Medication costs were reported in five studies (Boorsma 2011a; Crotty 2004; Crotty 2019; Stern 2014; Zwijsen 2014) and one study provided costs of informal care (Boorsma 2011a) and staff costs (Stern 2014). Four studies reported on the costs associated with the implementation of the intervention (Boorsma 2011a; Cordato 2018; Crotty 2019; Zwijsen 2014).
We did not pool the cost‐effectiveness or cost data as the specific costs associated with the various alternative models of care were not comparable, both across models of care as well as across settings (see Table 14). Healthcare systems differ between countries, so resource use and cost outcomes are setting (country)‐specific. The detailed reports show very different apportionment of costs between different items in different countries. The time horizons over which costs were estimated were highly heterogeneous. The five studies providing full economic evaluations by relating costs to health outcomes are summarised below and are included in Table 1.
Economic outcomes from cost‐effectiveness, cost‐utility or cost‐benefit analyses
Five studies, all assessing alternative models of care related to co‐ordination of care, reported cost‐effectiveness analyses (see Table 15) (Boorsma 2011a; Crotty 2019; Stern 2014; Van den Block 2020; Zwijsen 2014). Crotty 2019, Stern 2014, Van den Block 2020 and Zwijsen 2014 assessed cost‐effectiveness from the perspective of the healthcare system. Boorsma 2011a provided an economic evaluation from the societal perspective with a time frame of six months. Three studies concluded that the alternative model of care was not cost‐effective (Boorsma 2011a; Crotty 2019; Zwijsen 2014). Boorsma 2011a and Zwijsen 2014 both reported a negative incremental cost‐effectiveness ratio (ICER) as the alternative model of care was more expensive and did not improve quality of life compared to usual care. Crotty 2019 reported an ICER based on quality‐adjusted life year (QALY) of AUS 328,685 (i.e. the amount that should be invested per QALY gained for the alternative model of care versus usual care). This ICER based on QALYs is substantially greater than the implicit cost‐effectiveness threshold of AUS 50,000 per QALY gained (applied by regulatory bodies in Australia at the time of publication of the results). Conversely, Van den Block 2020 and Stern 2014 both found the alternative model of care to be cheaper (the reduction of costs was driven by a combination of shorter length of hospitalisation and the type of wards residents were admitted to in the study by Van den Block 2020 and by cancellations of prescribed negative pressure wound therapy (NPWT) by the outreach advanced practice nurse offset by an increase in costs related to increased number of hospital admissions in the intervention period in Stern 2014). This reduction of costs was either with better health outcomes compared with usual care (Stern 2014: the alternative model of care reduced mean time to healing of pressure ulcers by 45.65 days) or with similar health outcomes to usual care (Van den Block 2020: quality of life was not different between the groups). Based on the findings of these five studies, we are uncertain of the cost‐effectiveness of alternative models of care compared to usual care as the certainty of the evidence is very low(Table 1). We downgraded the evidence due to serious risk of bias (all studies at high risk of performance bias), serious inconsistency and serious imprecision. Other reported measures included the total cost of health care, cost of primary/secondary care, inpatient cost, ED admissions cost, medication costs, informal care costs, staff costs and intervention implementation costs (see Table 14).
Access to primary or specialist healthcare services
Access to primary or specialist healthcare services was not assessed in any of the included studies.
Any hospital admissions
In many cases, studies reported on any hospital admission without specifying whether or not the hospital admission was planned or unplanned. If a study provided data on "all hospital admissions" and then sub‐categorised the admissions into planned/unplanned/acute then we only used the "all hospital admissions" data for this outcome. If the study only provided "unplanned/acute hospital admissions", we included these data in this outcome for completeness. Twenty‐two studies (19 studies: 17,436 participants; Boyd 2014: number of participants not reported, 2553 beds; Grabowski 2014: number of participants not reported, mean number of beds 318; Haines 2020: number of participants not reported, mean occupied bed‐days per nine‐week block 12,865) provided data for this outcome (Agar 2017; Arendts 2018; Bellantonio 2008; Boyd 2014; Boorsma 2011a; Cavalieri 1993; Connolly 2015; Cordato 2018; Crotty 2019; Forbat 2020; Grabowski 2014; Haines 2020; Harvey 2014; Loeb 2005; Loeb 2006; McSweeney 2012; Rubenstein 1990; Rutten 2022; Stern 2014; Temkin‐Greener 2018; Van den Block 2020; Wu 2010). Kim 2020 stipulated hospital admission as an outcome but has not reported the results (see below Table 6).
Proportion of residents with at least one hospital admission
Thirteen studies (5424 participants; 2366 after adjustment for clustering) provided data for this outcome (Agar 2017; Arendts 2018; Bellantonio 2008; Boorsma 2011a; Connolly 2015; Cordato 2018; Crotty 2019; Harvey 2014; Loeb 2006; McSweeney 2012; Rubenstein 1990; Rutten 2022; Van den Block 2020). As we identified more than 10 studies reporting on the same outcome, we were able to generate a funnel plot (see Figure 7) to visually examine the data for asymmetry and to explore possible reporting or publication biases (Higgins 2019; Sterne 2011). Based on a meta‐analysis of these data, compared to usual care, alternative models of care may reduce the proportion of residents in aged care facilities with at least one hospital admission (RR 0.83, 95% CI 0.70 to 0.99; I² = 35%; 13 trials, 2366 participants; low‐certainty evidence; see Analysis 1.35). We downgraded the certainty of the evidence for serious risk of bias (all studies at high or unclear performance bias) and serious publication bias (see Figure 7).
7.
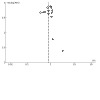
Funnel plot of comparison: 1 Any alternative model of care vs usual care, outcome: 1.16 Any hospital admission (number of residents with at least one admission).
1.35. Analysis.
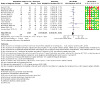
Comparison 1: Any alternative model of care versus usual care, Outcome 35: Any hospital admission (proportion of residents with at least one hospital admission)
Subgroup analyses
The heterogeneity (Analysis 1.35; I² = 35%) was not considerable, so we did not conduct any subgroup analyses.
Sensitivity analyses
Limiting analysis to studies with overall low risk of bias reduces the effect somewhat (RR 0.91, 95% CI 0.73 to 1.14; I² = 20%; 6 trials, 1023 participants; Analysis 1.36). Only Rubenstein 1990 (two years) and Connolly 2015 (14 months) were considered to have long‐term follow‐up (RR 0.87, 95% CI 0.66 to 1.13; I² = 56%; 2 trials, 465 participants; Analysis 1.37).
1.36. Analysis.
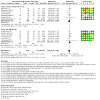
Comparison 1: Any alternative model of care versus usual care, Outcome 36: Any hospital admission (proportion of residents with at least one hospital admission): sensitivity analysis by risk of bias
1.37. Analysis.
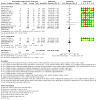
Comparison 1: Any alternative model of care versus usual care, Outcome 37: Any hospital admission (proportion of residents with at least one hospital admission): sensitivity by timing of effect
Mean number of hospital admissions
Although five studies (1077 participants) provided data for this outcome (Cavalieri 1993; Cordato 2018; Harvey 2014; Loeb 2006; Rubenstein 1990), we could only combine the data from four studies (Cordato 2018; Harvey 2014; Loeb 2006; Rubenstein 1990) (Table 6). Compared to usual care, we are uncertain of the effect of alternative models of care on the mean number of hospital admissions in residents of aged care facilities as the certainty of the evidence is very low (MD ‐0.27, 95% CI ‐0.54 to 0.00; I2 =73%; 4 trials, 980 participants; Analysis 1.38;very low‐certainty evidence). We downgraded the certainty of evidence for serious risk of bias (unclear or high risk of performance bias in all studies), serious inconsistency (I2 = 73%) and serious imprecision (wide confidence interval that includes no effect and important benefit). Cavalieri 1993 did not provide sufficient data to be included in the meta‐analysis, but stated that there was no difference between the two groups (comprehensive geriatric assessment team group versus usual care group) in hospital admissions (mean was 0.6 for each group, but we are not sure if this is the mean hospital admission per patient or the mean rate of hospital admission per follow‐up).
1.38. Analysis.
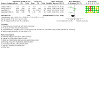
Comparison 1: Any alternative model of care versus usual care, Outcome 38: Any hospital admission (mean number of hospital admissions per resident)
Hospital admission rate per person‐time
Nine studies (six studies: 8169 participants; Boyd 2014: number of participants not reported, 2553 beds; Grabowski 2014: number of participants not reported, mean number of beds 318; Haines 2020: number of participants not reported, mean occupied bed‐days per nine‐week block 12,865) provided data on rate of hospital admissions per person‐time (Boyd 2014; Connolly 2015; Cordato 2018; Forbat 2020; Grabowski 2014; Haines 2020; Loeb 2005; Stern 2014; Wu 2010). Haines 2020 reported the unplanned hospital admissions incidence rate ratio per facility per nine‐week block. Grabowski 2014 reported the rate of hospital admission per 1000 nursing home resident‐days but did not provide a measure of variation around the estimate of effect. Similarly, Wu 2010 reported hospitalisation incidence rate per 1000 bed‐days but did not provide a measure of variation around the estimate of effect (see below Table 6). A meta‐analysis of rate data from six studies shows that compared to usual care, we are uncertain of the effect of alternative models of care on hospital admission rate (RR 0.91, 95% CI 0.75 to 1.11; I2 = 71%; 6 trials, 11,824 participants; very low‐certainty evidence; see Analysis 1.39) (Boyd 2014; Connolly 2015; Cordato 2018; Forbat 2020; Loeb 2005; Stern 2014). We downgraded the certainty of evidence due to serious risk of bias (all studies at high risk of performance bias), serious inconsistency (I2 = 71%) and serious imprecision (wide confidence intervals include no effect and important benefit). Haines 2020 reported a reduction in the unplanned hospital admissions incidence rate ratio (IRR 0.74, 95% CI 0.56 to 0.96) per facility per nine‐week block during the stepped‐wedge trial period and a reduction in mean (SD) transfers per facility per nine‐week block during the stepped‐wedge trial period (intervention: 9 (6); control: 13 (7)). Grabowski 2014 reported a lower rate of hospital admission per 1000 nursing home resident‐days with the intervention (intervention: 3.16, control: 3.58) but did not report any variation around the estimate of effect. Similarly, Wu 2010 reported a lower hospitalisation incidence rate per 1000 bed‐days (intervention: 0.07, control: 0.09) but did not report any variation around the estimate of effect.
1.39. Analysis.
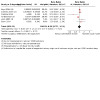
Comparison 1: Any alternative model of care versus usual care, Outcome 39: Any hospital admission (logarithm of rate ratio)
Temkin‐Greener 2018 used a difference‐in‐difference analytic model to assess the effect of palliative care teams on the number of hospitalisations (excluding last hospital stay if death occurred in a hospital) in the last 90 days of life. The effect of the intervention was determined by comparing the pre‐intervention and intervention periods and the difference‐in‐differences (i.e. comparing the performance differentials between the intervention and control group pre and during the intervention). Temkin‐Greener 2018 reported no difference in the number of hospitalisations pre‐ and post‐intervention (only period after roll‐out of the intervention including training of staff) in the control and intervention groups (IRR I: 1.068, C: 1.035, a value < 1 indicates improvement in the post‐period; 5830 participants, percentage of P < 0.05 based on re‐randomisation I: 0%, C: 3%).
Table 6. Studies reporting on any hospital admission (ordered by EPOC category)
|
Study ID Overall risk of bias (based on selection and detection bias) |
Participants (P) Intervention (I) Comparator (C) |
Timing of assessment | Description of outcome data provided |
Summary estimate of effect (SEE) (95% CI) Sample size |
Note |
| EPOC: co‐ordination of care (Care pathways) | |||||
|
Loeb 2005 cRCT UNCLEAR |
P: ACF residents, not limited to subgroup I: Clinical pathway for urinary tract infection C: Usual care without clinical pathway |
12 months | All‐cause admission to the hospital, rate per 1000 resident‐days | MD 0.17 (95% CI ‐0.14 to 0.48) I: 2156 C: 2061 |
MD as extracted from published paper; MD weighted by size of nursing home; adjusted for clustering |
|
Loeb 2006 cRCT LOW |
P: Lower respiratory tract infection I: Clinical pathway to decide whether hospital transfer is needed C: Usual care without clinical pathway |
30 days | Number of residents with hospitalisation, n | RR 0.49 (95% CI 0.27 to 0.90) I: 314 residents C: 347 residents |
See Analysis 1.35, adjusted for clustering using ICC 0.05 |
| Hospitalisation, weighted mean admission rate per facility | MD ‐12% (95% CI ‐18.8% to ‐5.2%) I: 314 C: 347 |
See Analysis 1.38; weighted mean admission rate: 8% in clinical pathway group vs 20% in usual care group (group means and SD already adjusted for clustering) | |||
|
Rutten 2022 cRCT UNCLEAR |
P: Urinary tract infection I: Decision tool for antibiotic prescription intergrated in Electronic Health Record C: Usual care without decision tool |
21 days | Admission to hospital for suspected urinary tract infection, n | RR 1.21 (95% CI 0.11 to 12.96) I: 132 residents C: 80 residents |
Number of residents is used for this analysis See Analysis 1.35, adjusted for clustering using ICC 0.05 |
| EPOC: co‐ordination of care (Teams) | |||||
|
Bellantonio 2008 RCT UNCLEAR |
P: With mental/behavioural problems I: Multidisciplinary team care C: Usual GP‐led care |
9 months | Number of residents with at least 1 unanticipated hospitalisation | Change in risk: ‐45% (95% CI ‐74% to 18%) I: 48 C: 52 |
Event rate per group not provided, data extracted from published paper (adjusted for sex, age and study site). Number of residents per group was calculated by review authors; see Table 7 for details. |
|
Connolly 2015 cRCT LOW |
P: ACF residents, not limited to subgroup I: Gerontology nurse specialist‐led care including multidisciplinary team care C: Usual care not including elements of the intervention |
14 months | Proportion of residents with at least 1 acute admission | RR 0.97 (95% CI 0.79 to 1.19) 608/1123 intervention residents; 491/875 control residents |
See Analysis 1.35; adjusted for clustering using ICC 0.05; assumed 1 admission per person |
| All acute admissions, rate per person‐year | Rate ratio 1.02 (95% CI 0.83 to 1.26) I: 888 person‐years C: 734 person‐years |
As extracted from published paper; adjusted for clustering | |||
|
Crotty 2019 RCT UNCLEAR |
P: After hip fracture I: In‐reach multidisciplinary rehabilitation care C: Usual GP‐led care |
1 month | Number of residents with injurious fall resulting in hospitalisation, n | RR 0.81 (95% CI 0.40 to 1.66) I: 119 C: 121 |
See Analysis 1.35 |
|
Boorsma 2011a cRCT LOW |
P: ACF residents, not limited to subgroup I: Multidisciplinary integrated care model C: Usual GP‐led care |
6 months | Any admission to hospital, number of patients with ≥ 1 admission | RR 1.10 (95% CI 0.57 to 2.10) I: 142 C: 85 |
See Analysis 1.35; negligible ICC (‐0.02) reported, indicated no clustering effect so data extracted as published; per protocol data used; study is at low risk of selection bias, no imbalances at baseline; imbalance at the end of the study (due to dropout of 2 control facilities for reasons not related to the trial) ‐ did not affect results |
|
McSweeney 2012 cRCT HIGH |
P: With mental/behavioural problems I: Multidisciplinary care C: Usual care |
15 weeks | Any admissions to hospital, number of patients | RR 3.27 (95% CI 0.14 to 76.21) I: 21 C: 23 |
See Analysis 1.35 |
|
Stern 2014 Stepped‐wedge cRCT UNCLEAR |
P: With pressure ulcers I: Multidisciplinary care C: Usual care |
Between 4 and 14 months, depending on the cluster | Hospitalisation, mean rate | IRR 1.20 (95% CI 0.62 to 2.36) I: 94 C: 67 |
IRR as provided by study authors |
|
Temkin‐Greener 2018 cRCT LOW |
P: ACF residents, not limited to subgroup I: Multidisciplinary palliative care C: Usual care |
10 months | Number of hospitalisations in the last 90 days of life (excluding last hospital stay if death occurred in a hospital), IRR (post‐ vs pre‐ period) | IRR I: 1.068 IRR C: 1.035 P value: 0 and 3% (intervention and control, respectively) of iteration with P < 0.05, equivalent to non‐significant results I: 2852 C: 2978 |
Difference in difference analysis |
|
Wu 2010 cRCT UNCLEAR |
P: Highly disabled I: Multidisciplinary care C: Usual care |
12 months | Hospitalisation, rate per 1000 bed‐days | I: 0.07 per 1000 bed‐days C: 0.09 per 1000 bed‐days; P > 0.05 I: 42 C: 32 |
Wu 2010 did not report any variation around the estimate of effect |
| EPOC: co‐ordination of care (Discharge planning) | |||||
|
Cordato 2018 RCT UNCLEAR |
P: Discharged from hospital back to ACF I: Regular early assessment post‐discharge following acute hospitalisation C: Usual GP‐led care |
6 months | Hospital admissions, n | RR 0.37 (95% CI 0.20 to 0.70) I: 22 C: 21 |
See Analysis 1.35; assumed 1 admission per resident |
| Hospital admissions, mean (SD) | MD ‐0.60 (95% CI ‐1.10 to ‐0.10 I: 22 C: 21 |
See Analysis 1.38 | |||
| Hospital admission rate per person‐days | I: 7 per 3186 person‐days C: 18 per 2760 person‐days |
See Analysis 1.39 | |||
|
Harvey 2014 RCT LOW |
P: Discharged from hospital back to ACF I: Geriatrician‐led hospital discharge C: Usual GP‐led care |
6 months | Number of patients with at least 1 acute care readmission (i.e. presented to ED and subsequently admitted) | RR 1.14 (95% CI 0.69 to 1.89) I: 57 C: 59 |
See Analysis 1.35; data from study authors, see Table 8 for details |
| Acute care admissions, mean (SD) | MD 0.07 (95% CI ‐0.21 to 0.35) I: 57 C: 59 |
See Analysis 1.38 | |||
| EPOC: co‐ordination of care (Case management) | |||||
|
Agar 2017 cRCT HIGH |
P: With mental/behavioural problems I: Palliative care facilitated family case conferencing C: Usual care |
Last month of life | At least 1 hospital admission | RR 1.09 (95% CI 0.44 to 2.71) I: 67 C: 64 |
See Analysis 1.35, adjusted for clustering using ICC 0.05 |
|
Forbat 2020 Stepped‐wedge cRCT LOW |
P: High burden, short prognosis I: Specialist palliative care needs rounds C: Usual care (no needs round) |
I: 124 months C: 74 months |
Number of hospitalisations > 24 h per facility‐month | IRR 0.76 (95% CI 0.67 to 0.87) I: 1700 C: 1152 |
IRR calculated by review authors (see Appendix 5); adjusted for clustering |
| I: 124 months C: 74 months |
Number of hospitalisations < 24 h per facility‐month | IRR 0.88 (95% CI 0.66 to 1.18) I: 1700 C: 1152 |
IRR calculated by review authors (see Appendix 5); adjusted for clustering | ||
|
Boyd 2014 cRCT UNCLEAR |
P: ACF residents, not limited to subgroup I: Gerontology nurse specialist‐led care including multidisciplinary team care C: Usual care not including elements of the intervention |
12 months | Acute hospitalisation (rate per 1000 bed‐days) | IRR 0.97(95% CI 0.87 to 1.09) I: 1425 (520,125 total bed‐days) C: 1128 (411,720 total bed‐days) |
IRR calculated by review authors (see Appendix 5); study authors did not adjust for clustering |
|
Van den Block 2020 cRCT HIGH |
P: ACF residents, not limited to subgroup I: Palliative care case management programme C: Usual care |
1 month (last month of life) | Number of patients admitted to the hospital in the last month of life for more than 24 h | RR 1.04 (95% CI 0.78 to 1.40) I: 425 C: 558 |
See Analysis 1.35; adjusted for clustering using ICC 0.05 |
| EPOC: co‐ordination of care (comprehensive geriatric assessment) | |||||
|
Cavalieri 1993 RCT UNCLEAR |
P: ACF residents, not limited to subgroup I: Comprehensive geriatric assessment team C: Usual care led by physician without geriatrics training |
12 months | Hospital admission, mean per resident | Intervention mean: 0.6 Control mean: 0.6 I: 33 C: 36 |
Cavalieri 1993 stated that there was no difference between the 2 groups in hospital admissions; not clear if this is the mean hospital admission per patient or the mean rate of hospital admission per follow‐up |
|
Rubenstein 1990 RCT UNCLEAR |
P: After all I: Comprehensive geriatric assessment C: Usual care |
24 months | Subjects hospitalised, n | RR 0.74 (95% CI 0.55 to 0.99) P = 0.04 I: 79 C: 81 |
RR calculated by review authors in RevMan, see Analysis 1.35 |
| Mean (SE) admissions per subject | MD ‐0.59 (95% CI ‐0.94 to ‐0.24) P = 0.001 I: 79 C: 81 |
MD calculated by review authors in RevMan, see Analysis 1.38 | |||
| EPOC: WHO (Role expansion/task shifting) | |||||
|
Arendts 2018 cRCT LOW |
P: ACF residents, not limited to subgroup I: Nurse practitioners led care using best practice guide C: Usual GP‐led care |
12 to 32 months | Hospitalisation resulting from ED visit (number of patients) | RR 0.81 (95% CI 0.48 to 1.37) I: 101 C: 99 |
See Analysis 1.35, adjusted for clustering using ICC 0.05 |
| EPOC: WHO (Staffing models) | |||||
|
Haines 2020 Stepped‐wedge cRCT LOW |
P: ACF residents, not limited to subgroup I: GP co‐located in ACF C: Care provided by externally located GP |
Between 18 and 30 months, depending on the cluster | Unplanned hospital admissions, mean (SD) per facility per 9‐week block | IRR 0.74 (95% CI 0.56 to 0.96) P = 0.024 Mean (SD) occupied bed‐days I: 6255 (1800) C: 6610 (2219) |
As extracted from published paper; unclear if study authors adjusted for clustering |
| EPOC: WHERE (ICT) | |||||
|
Grabowski 2014 cRCT UNCLEAR |
P: ACF residents, not limited to subgroup I: Telemedicine consultation during off‐hours C: Telephone consultation by covering physician |
11 months | Any hospitalisation, rate per 1000 resident‐days | I: 3.16 per 1000 nursing home resident‐days C: 3.58 per 1000 nursing home resident‐days I: not reported C: not reported |
Grabowski 2014 did not report any variation around the estimate of effect; % reduction in hospitalisations compared to baseline (intervention: ‐9.7%, control: ‐5.3%) |
| ACF: aged care facility; C: control; CGA: comprehensive geriatric assessment; CI: confidence interval; cRCT: cluster‐randomised controlled trial; ED: emergency department; EPOC: Cochrane Effective Practice and Organisation of Care; GP: general practitioner; I: intervention; ICC: intra‐cluster correlation coefficient; IRR: incidence rate ratio; MD: mean difference; RCT: randomised controlled trial; RR: risk ratio; SD: standard deviation; SEE: summary estimate of effect; WHO: World Health Organization | |||||
Length of stay for any hospital admission
Nine studies (6188 participants) provided data on length of hospital stay (Agar 2017; Arendts 2018; Connolly 2015; Cordato 2018; Forbat 2020; Harvey 2014; Loeb 2006; Rubenstein 1990; Van den Block 2020). Two studies appear to have assessed this outcome but have not published the data (Boorsma 2011a; Kim 2020). Eight studies assessed alternative models of care involving co‐ordination of care (Connolly 2015: multidisciplinary team care led by geriatric nurse specialists; Cordato 2018 and Harvey 2014: discharge planning; Agar 2017, Forbat 2020 and Van den Block 2020: case management involving specialist palliative care; Loeb 2006: care pathways to assist with hospital admission decision in patients with respiratory tract infections; Rubenstein 1990: comprehensive geriatric assessment post‐fall). Arendts 2018 assessed the effect of nurse practitioner‐led care in residents of aged care facilities. All of the studies, except Arendts 2018 and Van den Block 2020, assessed the length of hospital stay per total number of residents in the group, irrespective of whether or not the resident had been admitted. Arendts 2018 and Van den Block 2020 reported the mean length of hospital stay per admission (Arendts 2018)/admitted resident (Van den Block 2020).
Mean length of hospital stay per resident
Based on a meta‐analysis of data from five studies, compared to usual care, alternative models of care may reduce the mean number of inpatient days in residents of aged care facilities (MD ‐1.22, 95% CI ‐2.31 to ‐0.14; I² = 78%; 5 trials, 2689 participants; low‐certainty evidence; see Analysis 1.40) (Cordato 2018; Forbat 2020; Harvey 2014; Loeb 2006; Rubenstein 1990). We downgraded the certainty of the evidence for serious risk of bias (all studies have high risk of performance bias) and serious inconsistency (I² = 78%).
1.40. Analysis.
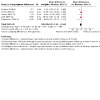
Comparison 1: Any alternative model of care versus usual care, Outcome 40: Length of hospital stay (mean number of days per resident)
Subgroup analyses
All of the studies included in Analysis 1.40 involved some type of co‐ordination of care, so subgroup analyses by EPOC category of care were not possible. It was also not possible to subgroup the studies based on the age of the study participants or the specific condition being treated (see Table 7 below for details). Subgrouping the study data by type of care provided seemed to explain the heterogeneity somewhat. Although there was still substantial heterogeneity (I² = 86%) between the two studies that provided primary care (Loeb 2006; Rubenstein 1990), there was minimal heterogeneity (I² = 48%) between the remaining three studies that provided both primary and secondary care to the aged care residents (see Analysis 1.41).
1.41. Analysis.
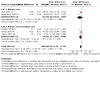
Comparison 1: Any alternative model of care versus usual care, Outcome 41: Length of hospital stay (mean number of days per resident): subgroup analysis by type of care provided
Sensitivity analyses
Limiting the analysis to studies with low overall risk of bias (Forbat 2020; Harvey 2014; Loeb 2006) changed the results somewhat (MD ‐0.53, 95% CI ‐1.17 to 0.10; I² = 61%; 3 trials, 3629 participants; see Analysis 1.42). Of the six studies included in the meta‐analysis, only Rubenstein 1990 (follow‐up two years) had long‐term follow‐up (Analysis 1.43). Rubenstein 1990, assessing the effect of a specialised post‐fall assessment to detect causes and underlying risk factors for falls and to recommend preventative and therapeutic interventions specifically in aged care residents who had fallen in the past seven days, showed the largest effect of all six studies (MD ‐6.35, 95% CI ‐10.23 to ‐2.47).
1.42. Analysis.
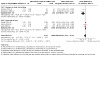
Comparison 1: Any alternative model of care versus usual care, Outcome 42: Length of hospital stay (mean number of days per resident): sensitivity analysis by risk of bias
1.43. Analysis.
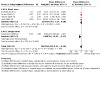
Comparison 1: Any alternative model of care versus usual care, Outcome 43: Length of hospital stay (mean number of days per resident): sensitivity analysis by timing of effect
Mean length of hospital stay per admitted resident
Arendts 2018 and Van den Block 2020 reported the mean length of hospital stay per admission (Arendts 2018)/admitted resident (Van den Block 2020). A meta‐analysis of the data shows we are uncertain of the effect of alternative models of care on the mean number of hospital days per admitted aged care resident, compared to usual care, as the certainty of the evidence is very low (MD 0.25, 95% CI ‐1.42 to 1.92; I² = 0%; 2 trials, 225 participants; Analysis 1.45). We downgraded the certainty of the evidence for serious risk of bias (both studies at high risk of performance bias) and very serious imprecision (wide confidence intervals that include no effect as well as both important benefit and important harm).
1.45. Analysis.
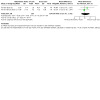
Comparison 1: Any alternative model of care versus usual care, Outcome 45: Length of hospital stay (mean number of days per admission/admitted resident)
Mean rate of hospital bed‐days per person‐time
Connolly 2015 reported the mean rate of acute hospital bed‐days per person‐year. Compared to usual care, alternative models of care may have little or no effect on the mean rate of hospital bed‐days per person‐time(RR 0.95, 95% CI 0.81 to 1.10, as provided by study authors; 1 trial, 1998 participants; low‐certainty evidence). We downgraded the certainty of the evidence for serious risk of bias (study at high risk of performance bias) and indirectness (one study only).
Median (IQR) length of hospital stay
Agar 2017 compared the effects of facilitated (family) case conferencing (FCC) with usual care (UC) on end‐of‐life care in aged care facility residents with advanced dementia. Agar 2017 only reported the median and IQR for the intervention (2 days, IQR 4, n = 67) and control group (5 days, IQR 5, n = 64). We did not include these data in the meta‐analysis as it is highly likely that the data are skewed.
Table 7. Structured summary of effects arranged by EPOC category: Length of stay for any hospital admission
|
Study ID Overall risk of bias (based on selection and detection bias) |
Participants (P) Intervention (I) Comparator (C) |
Timing of assessment | Description of outcome data provided |
Summary estimate of effect (SEE) (95% CI) Sample size |
Note |
| EPOC: co‐ordination of care (Care pathways) | |||||
|
Loeb 2006 cRCT LOW |
P: With respiratory tract infection I: Clinical pathway to decide whether hospital transfer is needed C: Usual care without clinical pathway |
30 days | Hospital days per resident, weighted mean per resident | MD ‐0.95 (95% CI ‐0.34 to ‐1.55) I: 314 C: 347 |
Weighted MD, as provided in published paper, adjusted for clustering and nursing home size of nursing home (study authors also provided mean number of hospital days per resident, 95% CI) |
| EPOC: co‐ordination of care (Comprehensive geriatric assessment) | |||||
|
Rubenstein 1990 RCT UNCLEAR |
P: Post fall I: Comprehensive geriatric assessment C: Usual care |
24 months | Hospital days per patient (mean, SE) | MD ‐6.35 (95% CI ‐10.24 to ‐2.46) I: 79 C: 81 |
MD calculated by review authors (see Analysis 1.44) |
| EPOC: co‐ordination of care (Case management) | |||||
|
Agar 2017 cRCT HIGH |
P: With mental/behavioural problems I: palliative care facilitated family case conferencing C: usual care |
Last month of life | Hospital length of stay, median (IQR) | I: 2 (4) C: 5 (5) I: 67 C: 64 |
|
|
Forbat 2020 Stepped‐wedge cRCT LOW |
P: High burden, short prognosis I: Specialist palliative care needs rounds C: Usual care (no needs round) |
I: 1477 (124 months) C: 1290 (74 months) |
Length of stay for those admitted and discharged, mean (SD) | Adjusted mean difference: ‐0.22 (95% CI ‐0.44 to ‐0.01) | MD, as provided in published paper, adjusted for demographics, resident characteristics, fidelity and duration of exposure (study authors also provide total bed‐days and total bed‐days per facility‐month per group) |
|
Van den Block 2020 cRCT HIGH |
P: ACF residents, not limited to subgroup I: Palliative care including advance care planning, tailored review of residents' needs and MDT approach C: Usual care |
Between 13 and 17 months | If admitted to hospital in the last month of life, average length of stay in hospital (days) cluster‐unadjusted mean (SD) |
MD 0.11 (95% CI ‐0.66 to 0.88) | See Analysis 1.44 (adjusted using ICC 0.05); study authors provide unadjusted mean (SD) for admitted residents: 7.08 (5.75) intervention; 7.31 (7.36) control; calculated combined mean and SD for all residents (admitted residents and non‐admitted residents, combined mean (SD): 1.9084 (43337) intervention; 1.7957 (48175) control; http://atozmath.com/CONM/Ch2_CombinedSD.aspx |
| EPOC: co‐ordination of care (Discharge planning) | |||||
|
Cordato 2018 RCT UNCLEAR |
P: Discharged from hospital back to ACF I: Regular early assessment post‐discharge following acute hospitalisation C: Usual GP‐led care |
6 months | Inpatient days, mean (SD) | MD ‐3.70 (95% CI ‐7.30 to ‐0.10) I: 22 C: 21 |
MD calculated by review authors (see Analysis 1.44); (study authors also provide total number of inpatient days) |
|
Harvey 2014 RCT LOW |
P: Discharged from hospital back to ACF I: Geriatrician‐led hospital discharge C: Usual GP‐led care |
6 months | Number of bed‐days, mean (SD) | MD ‐1.50 (95% CI ‐6.50 to 3.50) I: 57 C: 59 |
MD calculated by review authors (see Analysis 1.44); (study authors also provide total number of bed‐days over 6 months follow‐up) |
| EPOC: co‐ordination of care (Teams) | |||||
|
Connolly 2015 cRCT LOW |
P: ACF residents, not limited to subgroup I: GNS‐led care, including multidisciplinary care C: Usual care not including elements of the intervention |
14 months | Acute hospital bed‐days, mean rate per person‐year | Rate ratio 0.95 (95% CI 0.81 to 1.10) I: 1123 (888 person‐years C: 875 (735 person‐years) |
Rate ratio, as provided in published paper (study authors also provide total number of bed‐days per group; rate of bed‐days per person‐years per group) |
| EPOC: WHO (role expansion/task shifting) | |||||
|
Arendts 2018 cRCT LOW |
P: ACF residents, not limited to subgroup I: Nurse practitioners led care using best practice guide C: Usual GP‐led care |
Min 12 months (max up to 32 months) | Mean number of hospital bed‐days per admission | MD 0.95 (95% CI ‐1.67 to 3.57) I: 101 C: 99 |
See Analysis 1.45; MD calculated by review authors using data provided by study author (intervention: 56 hospital admissions by 39 patients, 285 bed‐days; SD admission = 6.4; control: 70 hospital admissions by 46 patients, 290 bed‐days; SD admission = 5.8) |
| ACF: aged care facility; C: control; CGA: comprehensive geriatric assessment; CI: confidence interval; cRCT: cluster‐randomised controlled trial; ED: emergency department; EPOC: Cochrane Effective Practice and Organisation of Care; GNS: geriatric nurse specialist; GP: general practitioner; I: intervention; ICC: intra‐cluster correlation coefficient; IRR: incidence rate ratio; MD: mean difference; RCT: randomised controlled trial; RR: risk ratio; SD: standard deviation; SEE: summary estimate of effect; WHO: World Health Organization | |||||
Residents’ satisfaction with the health care received
Three studies (487 participants) reported on residents' satisfaction with the care received (Boorsma 2011a; Harvey 2014; Lin 2014). Kim 2020 assessed this outcome but did not provide results. Boorsma 2011a (low overall risk of bias) assessed satisfaction with care in a trial of a multidisciplinary integrated care in residential aged care facilities using the brief 'QUality Of care Through the patients Eyes' (QUOTE‐Elderly) tool (scale 16 to 64, higher score indicates better satisfaction) and found no difference between the study groups (mean (SD) I: 56.32 (6.47), C: 56.10 (6.64); MD 0.22, 95% CI ‐2.69 to 3.13; 1 trial, 81 participants;very low‐certainty evidence; Analysis 1.46). We downgraded the certainty of the evidence due to serious risk of performance bias, indirectness (one study only) and very serious imprecision. Harvey 2014 (low overall risk of bias) assessed 'Overall satisfaction' (% satisfied) in a trial of a geriatrician‐led outreach service of residential care facility residents and found higher percent satisfaction with intervention compared to usual care (RR 1.63, 95% CI 1.14 to 2.32; 1 trial, 44 participants; very low‐certainty evidence; Analysis 1.47; Table 8). We downgraded the certainty of evidence due to serious risk of performance bias, indirectness (one study only) and very serious imprecision. Lin 2014 (high overall risk of bias) studied a telerehabilitation intervention versus conventional care in a long‐term care facility and assessed 'Residents satisfaction with the system' using a 1 to 5 Likert scale (mean (SD) I: 3.7 (0.2), C: 3.6 (0.2), non‐parametric Mann‐Whitney U‐test P > 0.05; as reported by study authors) and 'Residents satisfaction with the environment' (mean (SD) I: 3.8 (0.1), C: 3.9 (0.1), non‐parametric Mann‐Whitney U‐test P > 0.05; as reported by study authors) and found no differences between the groups for either of these domains.
1.46. Analysis.
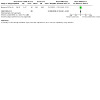
Comparison 1: Any alternative model of care versus usual care, Outcome 46: Residents’ satisfaction with the health care received (mean satisfaction score)
1.47. Analysis.
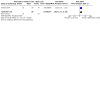
Comparison 1: Any alternative model of care versus usual care, Outcome 47: Proportion of residents’ satisfied with the health care received
'Next of kin' satisfaction with the health care provided to the resident
Relatives' satisfaction with the health care provided to the resident was reported by two studies (Agar 2017; Van den Block 2020: 1269 participants (421 after adjustment for clustering), both at high overall risk of bias) using the same tool (End‐of‐Life in Dementia – Satisfaction with Care: EOLD‐SWC; higher scores, greater satisfaction). Agar 2017 investigated the effect of facilitated family case conferencing by specially trained Palliative Care Planning Coordinators on quality of end‐of‐life care. Van den Block 2020 examined the effect of the Palliative Care for Older People (PACE) Steps to Success Program (multicomponent, integrating basic non‐specialist care for palliation within aged care facilities) on quality of end‐of‐life care in nursing home residents. Based on a meta‐analysis of the data from these two studies, alternative models of care may make little or no difference to relatives’ perception of the quality of end‐of‐life care, compared to usual care (MD ‐0.05, 95% CI ‐0.20 to 0.09; 2 trials, 421 participants; I2 = 0%; Analysis 1.48; low‐certainty evidence). We downgraded the certainty of the evidence for serious risk of performance and detection bias and indirectness.
1.48. Analysis.
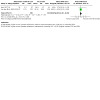
Comparison 1: Any alternative model of care versus usual care, Outcome 48: 'Next of kin' satisfaction with the health care received
Work‐related satisfaction of ACF staff, pertaining to the health care provided to the residents
Two studies (Zwijsen 2014: 380 unique staff members; Haines 2020: number of participants not reported, responses obtained from 1500 and 1409 staff members in two survey rounds) reported on work‐related satisfaction of ACF staff. The response rate to postintervention surveys in Temkin‐Greener 2018 was very low (n = 466; response rate = 21%), with three treatment and nine control homes not participating at all, which precluded the authors from conducting the difference in difference analyses comparing treatment and control facilities with regard to the intervention’s impact on palliative and end‐of‐life care processes. Haines 2020 (low overall risk of bias) investigated recruitment of general practitioners as staff members and redefined roles for registered nurses in a general resident population and reported the results of a survey question 'Overall I am extremely satisfied with {ACF} as place to work' (five‐point Likert scale). The difference in satisfaction between control and intervention groups was not significant (ordered logit regression coefficient ‐0.25, 95% CI ‐0.64 to 0.13) (Table 5). Zwijsen 2014 (high overall risk of bias) assessed the effects of a multidisciplinary care approach dementia special care unit and measured job satisfaction using the Leiden Quality of Work Questionnaire for nurses (range 6 to 24) and reported an adjusted MD of 0.93 (95% CI 0.48 to 1.38; very low‐certainty evidence), favouring the intervention group (see Table 7). We downgraded the certainty of the evidence due to high risk of performance and detection bias, indirectness and imprecision. Dy 2013 (high overall risk of bias; investigating telemedicine (teleconsultations with endocrinologists in nursing facility residents with diabetes)) conducted a survey among nurses but did not report the quantitative results, merely stating "nursing staff at the skilled nursing facility expressed high satisfaction".
Work‐related stress/burnout of ACF staff
One study (Zwijsen 2014, 380 unique staff members, high risk of bias), assessing the effect of a multidisciplinary care approach in dementia special care unit residents, measured four outcomes related to work‐related stress of ACF staff and found no differences between intervention and control groups on 'Emotional exhaustion' (Utreschtse Burnout Scale‐C (UBOS‐C), scale 0 to 48; adjusted beta 0.51, adjusted 95% CI ‐0.20 to 1.21, very low‐certainty evidence), 'Depersonalisation' (UBOS‐C, scale 0 to 30; adjusted OR 1.28, adjusted 95% CI 0.83 to ‐1.96, very low‐certainty evidence), 'Personal accomplishment' (UBOS‐C, scale 0 to 42; adjusted beta 0.65, adjusted 95% CI ‐0.05 to 1.35, very low‐certainty evidence) and 'Job demands' (measured using the Leiden Quality of Work Questionnaire, scale 5 to 20; adjusted beta ‐0.20, adjusted 95% CI ‐0.52 to 0.12, very low‐certainty evidence). All analyses were adjusted for age, sex and working experience. We downgraded the certainty of the evidence in the four analyses above due to high risk of performance and detection bias, indirectness and imprecision. The relatively low mean scores (25 out of the possible 120 points) on the subscales of the UBOS‐C questionnaire for burnout before the start of the intervention indicate that the responders were at low risk of burnout.
Discussion
Summary of main results
We found 40 randomised trials, including 21,787 participants, and 14 ongoing studies comparing alternative models of care for delivering or co‐ordinating primary or secondary health care (or both) to older adults living in aged care facilities with usual care.
Compared with usual care, alternative models of care may make little or no difference to the number of emergency department visits but may reduce unplanned hospital admissions. We are uncertain of the effect of alternative models of care on adverse events (i.e. falls, pressure ulcers, infections) and adherence to guideline‐recommended care compared to usual care, as the certainty of the evidence is very low. Alternative models of care may have little or no effect on health‐related quality of life and probably have no effect on mortality of ACF residents compared to usual care. We are uncertain about the cost‐effectiveness of alternative models of care as the certainty of the evidence is very low. Only five of 40 studies provided a full economic evaluation of the alternative model of care. The data was not pooled as it was too heterogeneous in terms of the content of the interventions, types of participants, countries and the time frames of the analyses. We found no studies reporting on access to primary or specialist healthcare services.
Overall completeness and applicability of evidence
In consultation with the Cochrane EPOC Information Specialist, we developed and conducted a comprehensive search of the literature for randomised controlled trials addressing the review question. We manually searched the reference lists of included studies for additional eligible trials that may have been missed by the search strategy. We did not search the grey literature for eligible studies as we felt that the search would likely yield quasi‐experimental studies describing the local implementation and evaluation initiatives of alternative care models that have not been formally registered as a trial or reported in a peer‐reviewed journal.
For this review, eligible interventions focused on ways of delivering primary or secondary (or both) health care or ways of co‐ordinating the delivery of this care. Furthermore, eligible models of care delivery had to investigate changes to at least one of the following delivery arrangement domains (Cochrane Effective Practice and Organisation of Care (EPOC) Group taxonomy of health system interventions; EPOC 2015):
co‐ordination of the primary or secondary (or both) health care, or management of the primary or secondary (or both) care processes;
where the primary or secondary (or both) health care is provided; or
who provides primary or secondary (or both) health care.
The majority of the eligible studies (31 studies) assessed alternative models of care focused on improving the co‐ordination of care. Of the 31 studies assessing 'co‐ordination of care' models, 16 studies specifically assessed the effect of multidisciplinary teams (Bellantonio 2008; Boorsma 2011a; Boyd 2014; Brodaty 2003; Chapman 2007; Connolly 2015; Crotty 2004; Crotty 2019; Leontjevas 2013; Lin 2010; McSweeney 2012; Neyens 2009; Stern 2014; Temkin‐Greener 2018; Wu 2010; Zwijsen 2014), two studies assessed the effect of 'Discharge planning' (Cordato 2018; Harvey 2014), four studies assessed 'Case management' (Agar 2017; Forbat 2020; Lichtwarck 2018; Van den Block 2020), six examined 'Care pathways' (Kotynia‐English 2005; Loeb 2005; Loeb 2006; Pieper 2016; Rutten 2022), two examined 'Comprehensive geriatric assessment' (Cavalieri 1993; Rubenstein 1990), and one investigated 'Continuity of care' (Kim 2020). Fewer studies assessed alternative models of care related to 'where care is provided' (two studies) and 'who provides care' (three studies). Four studies assessed the use of information and communications technology (ICT) as an alternative way of providing care compared to usual care. Although the available evidence is spread across all of the EPOC delivery arrangement domains, the majority of the evidence pertains to the co‐ordination of care, in particular the use of multidisciplinary teams as an alternative way of delivering care to aged care facility residents.
Alternative models of care focused on 'who provides care' specifically assessed GPs co‐located in ACFs compared to care provided by external GPs (Haines 2020), and 'Role expansion or task shifting' (nurse‐practitioner led care versus GP‐led care) (Arendts 2018; Kolcu 2020). Alternative models of care focused on 'where care is provided' specifically investigated alternative locations for the provision of care (i.e. within ACF versus outside of ACF) (Man 2020; Uy 2008).
For pragmatic reasons, we compared the clinical and cost‐effectiveness of any/all alternative models of care (as a whole) with usual care. While this provides the reader with a more statistically powerful overview of the results, it is possible that important information and details are lost in the higher level (versus granular level) interpretation of the results. There was large heterogeneity in the content of the alternative models of care, even within the same EPOC delivery arrangement domains. The types of interventions adopted and the principal target population groups for the interventions are likely to be affected by the issues and concerns faced by the residents as well as the care providers of the facilities. Even though the interventions may appear similar in "broader" aspects of interventions, specifics of interventions may have been guided by the needs of the residents and care providers in the facilities, and studies provided insufficient data to incorporate these differences in the analyses. This may have implications for the cost‐effectiveness and implementation of the alternative models of care. We did not have enough studies or enough outcome data from studies with similar models to conduct more refined analyses. It is possible that several of the more complex models might be classified into more than one EPOC category and classification was done based on what was considered the most prominent component of the intervention. Furthermore, an understanding of what constitutes usual care is important for interpreting the comparisons. Usual care may differ substantially between countries and settings. Unfortunately, most of the studies provided limited information on what constituted usual care in the trial setting. In our analyses, we were unable to distinguish between different levels or types of usual care for more refined comparisons.
Studies included a wide range of participants. In approximately one‐third of the studies, the alternative model of care was offered to all ACF residents (i.e. without a specific health condition or comorbidity, 11 studies). In the remaining studies, the alternative models of care were aimed at residents with specific conditions (i.e. residents with mental health or behavioural problems and residents with pressure ulcers) or residents requiring a specific type of care (e.g. residents recovering from a hip fracture). In this instance, the generalisability of the review findings may be limited/may need to be tailored to specific resident populations assessed in these studies.
Although our review includes studies from numerous different countries, the distribution was highly unbalanced with more than a third of the studies (15, 38%) conducted in Australia and New Zealand, and another 11 studies conducted in the USA and Canada. Ten studies were based in Europe, and only four in Asia. We found no studies from Africa or South America. Evidence of the clinical and cost‐effectiveness of alternative models of care in ACF residents in low‐ and middle‐income countries is rare or non‐existent.
Importantly, despite 40 included randomised trials, less than a third of studies provided data on each of the three primary outcomes: ED visits, unplanned hospital admissions and adverse events. The only outcome reported on in more than half of the studies was mortality. This limited our ability to conduct subgroup analyses by EPOC delivery arrangement domain, type of health care provided or condition being treated for most outcomes. Where subgroup analyses were performed, the number of studies per group was fewer than 10, which means the results of these comparisons should be interpreted with caution. In all but three studies that reported on the mean age of participants, the mean age was > 80 years old, which precluded subgroup analyses by age of ACF residents for all outcomes.
Quality of the evidence
Most of the included trials were susceptible to some form of bias; in particular, performance (89%), reporting (66%) and detection (42%) bias. Due to the nature of the interventions examined in this review, blinding of ACF staff and residents was not possible in most of the studies, hence the large proportion of studies with performance bias. We consistently downgraded the certainty of the evidence for most outcomes based on the possibility that knowledge of the allocated intervention may bias the performance of the ACF staff member responsible for health care delivery decision‐making (i.e. deciding whether or not the resident should be transferred to the ED or admitted to hospital).
None of the pre‐specified outcomes had high‐certainty evidence. Mortality was the only outcome with moderate‐certainty evidence. The remaining outcomes had either low‐ or very low‐certainty evidence. For all of the outcomes except mortality, we downgraded the certainty of the evidence once for high risk of performance bias. Additional reasons for downgrading the certainty of the evidence included serious inconsistency (I2 > 50% for pooled analyses or contradictory findings for economic evaluations; proportion of residents with at least one ED visit, proportion of residents with at least one adverse event and cost‐effectiveness evaluations), serious indirectness (adherence to guideline‐recommended care was measured in one study limited to a population with mental health problems and an intervention related to medication use, which limits the generalisability of findings to other care models/other resident populations) and serious or very serious imprecision (analyses were not powered to detect important harm or benefit or wide confidence intervals that included no effect as well as important benefit or important harm; proportion of residents with at least one ED visit, proportion of residents with at least one adverse event, adherence to guideline‐recommended care and cost‐effectiveness evaluations). Publication bias could only be assessed for two outcomes (i.e. more than 10 studies contributed data to the meta‐analysis): mortality and health‐related quality of life. Due to a high likelihood of publication bias for both outcomes, we downgraded the certainty of the evidence for these two outcomes. We cannot exclude the presence of publication bias for other outcomes where there were not enough studies to reliably assess the risk of this bias (i.e. fewer than 10 studies contributed data to the outcome).
Potential biases in the review process
We aimed to minimise bias at each stage of this review by conducting the review according to the Cochrane Handbook for Systematic Reviews of Interventions guidance (Higgins 2019), and in accordance with our published protocol (Putrik 2021). To the best of our knowledge, we identified all relevant trials meeting the review's eligibility criteria by searching major electronic databases and trial registries, and reference checking. At least two review authors independently screened, selected and extracted data, and judged the risk of bias in studies and the certainty of the evidence. Publication bias was detected for quality of life and mortality. For other outcomes, there were too few studies to formally assess the presence of publication bias. None of the review authors were involved in the conduct of the included trials.
Agreements and disagreements with other studies or reviews
A number of systematic and narrative reviews have examined the effectiveness of alternative ways of caring for residents of aged care facilities. The majority of the evidence in these reviews is based on data from non‐randomised studies (Barker 2018; Davies 2011; Konetzka 2008; Santosaputri 2019). In contrast, our Cochrane review includes data from randomised trials only. Our review includes any type of alternative model of care and we pooled data on all alternative models of care compared to usual care on various outcomes related to resource use and health outcomes of interest, specifically aimed at residents of aged care facilities. The key findings of the systematic reviews most closely aligned with our Cochrane review are discussed below.
Santosaputri 2019 found little or no difference in rates of hospitalisation (including emergency department visits, hospital admission or readmission), mortality, adverse events (including, but not limited to falls and infections), quality of life and cost between geriatric‐focused interventions (i.e. interventions led by staff with geriatrics expertise) and usual care in nursing home residents (based on data from 16 studies, including seven RCTs). Barker 2018 assessed whether or not improved health outcomes would be observed in residents of aged care facilities when practitioners (i.e. primary care generalist, generalist specialist, nurse practitioner or a specialist multidisciplinary teams), with enhanced expertise and experience relevant to this patient population, are involved in the delivery of first‐line primary care. Data from 22 experimental studies (five randomised, 17 non‐randomised) and four observational studies suggested that involving a specialist doctor in first‐line care of aged care residents had little or no effect on unplanned hospital transfer but may improve prescribing practices. Interventions in which specialist nurses were added to the usual primary care provider team were associated with reductions in unplanned hospital transfers.
Davies 2011 examined the evidence for the benefits of interventions designed to develop, promote or facilitate integrated working between care home or nursing home staff and healthcare practitioners. Based on the data from 10 quantitative studies (four randomised trials), one mixed methods study, two process evaluations, three qualitative and one action research study, the study authors concluded that, compared with usual care, studies showed little or no difference in outcomes including costs, prescribing, mortality, disruptive behaviour, depression, hospital admissions, functional status, wound healing and bowel‐related problems. Konetzka 2008 reviewed the effect of interventions to reduce hospitalisations from long‐term care settings (including nursing homes and home healthcare settings) and found that there was weak evidence suggestive of a potentially beneficial effect for interventions that increased skilled staffing (i.e. introduced physician assistants and nurse practitioners) in long‐term care settings, improved the hospital‐to‐home transition by improving communication between providers and by educating patients, substituted home health care for selected hospital admissions and aligned reimbursement policies so that providers do not have a financial incentive to hospitalise.
Authors' conclusions
Implications for practice.
Compared to usual care, alternative models of care may make little or no difference to the number of emergency department visits but may reduce unplanned hospital admissions by 27% (158 to 7 fewer in intervention group compared to usual care). We are uncertain of the effect of alternative models of care on adverse events (i.e. falls, pressure ulcers, infections) and adherence to guideline‐recommended care compared to usual care, as the certainty of the evidence is very low. Alternative models of care may have little or no effect on health‐related quality of life and probably have no effect on mortality of aged care facility (ACF) residents compared to usual care. Importantly, we are uncertain of the cost‐effectiveness of alternative models of care due to the limited, disparate data available. Residential aged care facilities may be encouraged to consider efforts for better co‐ordination of care, reconsidering where, and by whom, care is provided, as well as the use of information technologies. Currently, it is not known if alternative models of care, as a whole, reduce costs, while delivering the same or better health care to residents of ACFs.
Implications for research.
A considerable body of evidence on the effects of alternative models of providing care to ACF residents from many countries across the globe has been accumulated over the past 30 years. More than half of the studies were conducted in the last decade and another 14 studies were identified as ongoing, which reflects the increasing interest in this topic as a result of an ageing population and a growing number of very old people requiring institutionalised care. Future studies should strongly consider including resource use outcomes as well as conducting a full economic evaluation of the alternative model of care next to assessing effects on residents' health. Sufficient details need to be provided as to which services were included in cost analyses. Studies should also measure satisfaction outcomes in residents, their families and ACF staff. Workload and burn‐out complaints are other outcomes that have so far received too little attention in existing studies (only one of 38 studies assessed this outcome). Of the 14 ongoing studies, 10 plan to conduct an economic evaluation, five stipulated that they will assess patient and 'next of kin' satisfaction and only three will assess staff outcomes. This implies some improvement compared to older studies, however further alignment of studies' scope and outcomes with the information required for decision‐making at a health system level is warranted. As the heterogeneity of healthcare settings and poor description of usual care hindered many analyses in this review, future studies should provide a detailed description of what intervention and usual care constitutes in their setting.
History
Protocol first published: Issue 3, 2021
Acknowledgements
Editorial and peer reviewer contributions
Cochrane Effective Practice and Organisation of Care (EPOC) and the Cochrane Central Editorial Service team supported the authors in the development of this review.
The following people conducted the editorial process for this article:
Sign‐off Editor (final editorial decision): Carmel Hughes, School of Pharmacy, Queen's University Belfast.
Managing Editors (selected peer reviewers, provided editorial guidance to authors, edited the article): Lara Kahale and Leanne Jones, Cochrane Central Editorial Service.
Editorial Assistant (conducted editorial policy checks, collated peer reviewer comments and supported the editorial team): Sara Hales‐Brittain, Cochrane Central Editorial Service.
Copy Editor (copy editing and production): Jenny Bellorini, Cochrane Central Production Service.
Peer reviewers (provided comments and recommended an editorial decision): Kadambari Rawal BDS, CAGS, MSD, FASGD, FICD, FACD, Clinical Associate Professor, Boston University Henry M. Goldman School of Dental Medicine; Attending Dentist, Department of Medicine, Long Term Care Facilities of Hebrew Senior Life; Lecturer, Oral Health Policy & Epidemiology, Harvard School of Dental Medicine (clinical/content review); M. Mahmud Khan, Department of Health Policy and Management, College of Public Health, University of Georgia, Athens, GA, USA (clinical/content review); Brian Duncan (consumer review); Jen Hilgart (methods review); Jo Platt, Central Editorial Service Information Specialist (search review).
Cochrane Effective Practice and Organisation of Care (EPOC) is supported by the National Institute for Health Research (NIHR) via Cochrane Infrastructure funding. The views and opinions expressed herein are those of the authors and do not necessarily reflect those of the Systematic Reviews Programme, NIHR, National Health Service (NHS), or the Department of Health.
The Australasian Satellite of Cochrane EPOC is supported by Monash University.
Appendices
Appendix 1. Search strategies
Cochrane Central Register of Controlled Trials (CENTRAL), in the Cochrane Library
Search date: 26 October 2022
| No. | Search terms | Results |
| 1 | aged/ | 431781 |
| 2 | "aged, 80 and over"/ | 110202 |
| 3 | frail elderly/ | 1527 |
| 4 | (geriatric? or senior? or elderly).ti,ab,kf. | 110775 |
| 5 | (old* adult? or old* person? or old* people or old* patient?).ti,ab,kf. | 51839 |
| 6 | geriatrics/ | 419 |
| 7 | "health services for the aged"/ | 918 |
| 8 | or/1‐7 | 544216 |
| 9 | long‐term care/ | 2311 |
| 10 | (long‐term adj2 (care or healthcare or service? or treatment? or patient? or resident?)).ti,ab,kf. | 26747 |
| 11 | (long stay adj2 (care or healthcare or service? or treatment? or patient? or resident?)).ti,ab,kf. | 253 |
| 12 | (function* adj2 (dependen* or independen* or limit* or decline* or status or impair*)).ti,ab,kf. | 42029 |
| 13 | (candidate? adj3 (institution* or deinstitution* or home or place*)).ti,ab,kf. | 123 |
| 14 | (residential adj3 (care or healthcare or facilit*)).ti,ab,kf. | 1761 |
| 15 | residential facilities/ | 1966 |
| 16 | assisted living facilities/ | 118 |
| 17 | (assisted living facilit* or assisted care facilit*).ti,ab,kf. | 202 |
| 18 | group homes/ | 97 |
| 19 | (group? adj (home? or living)).ti,ab,kf. | 678 |
| 20 | halfway houses/ | 35 |
| 21 | halfway houses/ | 29 |
| 22 | intermediate care facilities/ | 29 |
| 23 | skilled nursing facilities/ | 149 |
| 24 | hospice?.ti,ab,kf. | 1625 |
| 25 | hospices/ | 81 |
| 26 | (care home? or care facilit* or restorative care or rest home? or nursing facilit*).ti,ab,kf. | 6234 |
| 27 | or/9‐26 | 78418 |
| 28 | homes for the aged/ | 1298 |
| 29 | nursing homes/ | 2839 |
| 30 | nursing home?.ti,ab,kf. | 8028 |
| 31 | (aged care or (aged adj3 home?)).ti,ab,kf. | 1074 |
| 32 | 8 and 27 | 23539 |
| 33 | or/28‐32 | 30236 |
| 34 | telemedicine/ | 5420 |
| 35 | nurse clinicians/ | 312 |
| 36 | nurse practitioners/ | 611 |
| 37 | nurse specialists/ | 328 |
| 38 | nursing staff, hospital/ | 924 |
| 39 | ((care or healthcare or service?) adj5 model?).ti,ab,kf. | 10585 |
| 40 | (((primary care or nurs*) adj1 (geriatric* or gerontolog*)) or advance* practice nurs*).ti,ab,kf. | 806 |
| 41 | (hospital adj4 home).ti,ab,kf. | 4044 |
| 42 | (mobile health* or telehealth* or ehealth or mhealth or telemedicine or tele‐health* or e‐health or m‐health or tele‐medicine).ti,ab,kf. | 13243 |
| 43 | (videoconferenc* or video‐conferenc*).ti,ab,kf. | 2415 |
| 44 | ((care or healthcare or service?) adj2 deliver*).ti,ab,kf. | 9263 |
| 45 | (family doctor? or family physician? or general practitioner? or general practice?).ti,ab,kf. | 24087 |
| 46 | ((integrat* or coordinat* or co‐ordinat* or collaborat* or cooperat* or co‐operat* or interdisciplin* or inter‐disciplin* or multidisciplin* or multi‐disciplin*) adj3 (team? or care or healthcare or intervention? or program* or model?)).ti,ab,kf. | 28753 |
| 47 | (in‐reach or inreach).ti,ab,kf. | 158 |
| 48 | (nurse? adj2 (clinician* or speciali* or practitioner*)).ti,ab,kf. | 5041 |
| 49 | (nurs* adj (led or manage* or deliver* or run or ran)).ti,ab,kf. | 5499 |
| 50 | delivery of health care/ | 1696 |
| 51 | delivery of health care, integrated/ | 812 |
| 52 | remote consultation/ | 781 |
| 53 | ((specialist? or shared) adj1 (care or healthcare)).ti,ab,kf. | 1426 |
| 54 | patient care team/ | 3484 |
| 55 | continuity of patient care/ | 1264 |
| 56 | ((coordinat* or co‐ordinat*) adj2 (care or healthcare or service* or program* or approach* or management or team care or team treatment* or team assessment* or team consultation*)).ti,ab,kf. | 3436 |
| 57 | (team* adj2 (care or treatment* or assessment* or consultation* or healthcare or service* or program* or approach*)).ti,ab,kf. | 7454 |
| 58 | (care adj2 continuity).ti,ab,kf. | 1194 |
| 59 | og.fs. | 14603 |
| 60 | or/34‐59 | 109371 |
| 61 | 33 and 60 | 4298 |
The first search update was transposed to CENTRAL via OVID
MEDLINE (OVID) Search date: 26 October 2022
| 1 | aged/ | 6527623 |
| 2 | "aged, 80 and over"/ | 1953874 |
| 3 | frail elderly/ | 26484 |
| 4 | (geriatric? or senior? or elderly).ti,ab,kf. | 677553 |
| 5 | (old* adult? or old* person? or old* people or old* patient?).ti,ab,kf. | 402634 |
| 6 | geriatrics/ | 61495 |
| 7 | "health services for the aged"/ | 36057 |
| 8 | or/1‐7 | 6957156 |
| 9 | long‐term care/ | 54359 |
| 10 | (long‐term adj2 (care or healthcare or service? or treatment? or patient? or resident?)).ti,ab,kf. | 169942 |
| 11 | (long stay adj2 (care or healthcare or service? or treatment? or patient? or resident?)).ti,ab,kf. | 2333 |
| 12 | (function* adj2 (dependen* or independen* or limit* or decline* or status or impair*)).ti,ab,kf. | 313096 |
| 13 | (candidate? adj3 (institution* or deinstitution* or home or place*)).ti,ab,kf. | 741 |
| 14 | (residential adj3 (care or healthcare or facilit*)).ti,ab,kf. | 13826 |
| 15 | residential facilities/ | 11274 |
| 16 | assisted living facilities/ | 3007 |
| 17 | (assisted living facilit* or assisted care facilit*).ti,ab,kf. | 1633 |
| 18 | group homes/ | 2007 |
| 19 | (group? adj (home? or living)).ti,ab,kf. | 6207 |
| 20 | halfway houses/ | 2127 |
| 21 | halfway houses/ | 1294 |
| 22 | intermediate care facilities/ | 1420 |
| 23 | skilled nursing facilities/ | 9613 |
| 24 | hospice?.ti,ab,kf. | 26694 |
| 25 | hospices/ | 10689 |
| 26 | (care home? or care facilit* or restorative care or rest home? or nursing facilit*).ti,ab,kf. | 64886 |
| 27 | or/9‐26 | 613845 |
| 28 | homes for the aged/ | 28835 |
| 29 | nursing homes/ | 74133 |
| 30 | nursing home?.ti,ab,kf. | 64250 |
| 31 | (aged care or (aged adj3 home?)).ti,ab,kf. | 9517 |
| 32 | 8 and 27 | 204587 |
| 33 | or/28‐32 | 288163 |
| 34 | telemedicine/ | 61512 |
| 35 | nurse clinicians/ | 16739 |
| 36 | nurse practitioners/ | 36499 |
| 37 | nurse specialists/ | 440 |
| 38 | nursing staff, hospital/ | 93445 |
| 39 | ((care or healthcare or service?) adj5 model?).ti,ab,kf. | 87634 |
| 40 | (((primary care or nurs*) adj1 (geriatric* or gerontolog*)) or advance* practice nurs*).ti,ab,kf. | 12209 |
| 41 | (hospital adj4 home).ti,ab,kf. | 18351 |
| 42 | (mobile health* or telehealth* or ehealth or mhealth or telemedicine or tele‐health* or e‐health or m‐health or tele‐medicine).ti,ab,kf. | 70328 |
| 43 | (videoconferenc* or video‐conferenc*).ti,ab,kf. | 7170 |
| 44 | ((care or healthcare or service?) adj2 deliver*).ti,ab,kf. | 118854 |
| 45 | (family doctor? or family physician? or general practitioner? or general practice?).ti,ab,kf. | 201744 |
| 46 | ((integrat* or coordinat* or co‐ordinat* or collaborat* or cooperat* or co‐operat* or interdisciplin* or inter‐disciplin* or multidisciplin* or multi‐disciplin*) adj3 (team? or care or healthcare or intervention? or program* or model?)).ti,ab,kf. | 249349 |
| 47 | (in‐reach or inreach).ti,ab,kf. | 1065 |
| 48 | (nurse? adj2 (clinician* or speciali* or practitioner*)).ti,ab,kf. | 41729 |
| 49 | (nurs* adj (led or manage* or deliver* or run or ran)).ti,ab,kf. | 26829 |
| 50 | delivery of health care/ | 205708 |
| 51 | delivery of health care, integrated/ | 27187 |
| 52 | remote consultation/ | 10636 |
| 53 | ((specialist? or shared) adj1 (care or healthcare)).ti,ab,kf. | 11318 |
| 54 | patient care team/ | 135522 |
| 55 | continuity of patient care/ | 40016 |
| 56 | ((coordinat* or co‐ordinat*) adj2 (care or healthcare or service* or program* or approach* or management or team care or team treatment* or team assessment* or team consultation*)).ti,ab,kf. | 32622 |
| 57 | (team* adj2 (care or treatment* or assessment* or consultation* or healthcare or service* or program* or approach*)).ti,ab,kf. | 64236 |
| 58 | (care adj2 continuity).ti,ab,kf. | 16025 |
| 59 | og.fs. | 994867 |
| 60 | or/34‐59 | 1958343 |
| 61 | 33 and 60 | 50376 |
| 62 | exp randomized controlled trial/ | 1104192 |
| 63 | controlled clinical trial.pt. | 189117 |
| 64 | randomi#ed.ti,ab. | 1318689 |
| 65 | placebo.ab. | 429170 |
| 66 | randomly.ti,ab. | 688927 |
| 67 | Clinical Trials as topic.sh. | 395099 |
| 68 | trial.ti. | 475820 |
| 69 | or/62‐68 | 2781925 |
| 70 | exp animals/ not humans/ | 9844342 |
| 71 | 69 not 70 | 2553895 |
| 72 | 61 and 71 | 4106 |
| 73 | cost‐benefit analysis/ | 174216 |
| 74 | (cost* adj2 (effective* or utilit* or benefit* or analys*)).ti,ab,kf. | 341902 |
| 75 | (economic* adj evaluation?).ti,ab,kf. | 26849 |
| 76 | or/73‐75 | 418096 |
| 77 | 61 and 76 | 1848 |
| 78 | limit 77 to dt=20210201‐20221026 | 324 |
| 79 | 78 not 72 | 184 |
The first search update was transposed to CENTRAL via OVID
Embase Ovid
Search date: 26 October 2022
| No. | Search terms | Results |
| 1 | aged/ | 6716106 |
| 2 | very elderly/ | 491629 |
| 3 | frail elderly/ | 22287 |
| 4 | (geriatric? or senior? or elderly).ti,ab,kw. | 1007578 |
| 5 | (old* adult? or old* person? or old* people or old* patient?).ti,ab,kw. | 594016 |
| 6 | geriatrics/ | 72005 |
| 7 | elderly care/ | 82998 |
| 8 | geriatric care/ | 30202 |
| 9 | or/1‐8 | 7303957 |
| 10 | long term care/ | 276148 |
| 11 | (long‐term adj2 (care or healthcare or service? or treatment? or patient? or resident?)).ti,ab,kw. | 253142 |
| 12 | (long stay adj2 (care or healthcare or service? or treatment? or patient? or resident?)).ti,ab,kw. | 3308 |
| 13 | (function* adj2 (dependen* or independen* or limit* or decline* or status or impair*)).ti,ab,kw. | 485086 |
| 14 | (candidate? adj3 (institution* or deinstitution* or home or place*)).ti,ab,kw. | 1355 |
| 15 | (residential adj3 (care or healthcare or facilit*)).ti,ab,kw. | 17895 |
| 16 | residential home/ | 15401 |
| 17 | assisted living facility/ | 5642 |
| 18 | (assisted living facilit* or assisted care facilit*).ti,ab,kw. | 2460 |
| 19 | (group? adj (home? or living)).ti,ab,kw. | 7953 |
| 20 | halfway house/ | 2594 |
| 21 | halfway hous*.ti,ab,kw. | 585 |
| 22 | hospice?.ti,ab,kw. | 47395 |
| 23 | hospice/ | 30751 |
| 24 | (care home? or care facilit* or restorative care or rest home? or nursing facilit*).ti,ab,kw. | 94167 |
| 25 | or/10‐24 | 1079430 |
| 26 | home for the aged/ | 24506 |
| 27 | nursing home/ | 115686 |
| 28 | nursing home?.ti,ab,kw. | 87028 |
| 29 | (aged care or (aged adj3 home?)).ti,ab,kw. | 11805 |
| 30 | 9 and 25 | 279157 |
| 31 | or/26‐30 | 401125 |
| 32 | telemedicine/ | 68722 |
| 33 | clinical nurse specialist/ | 5070 |
| 34 | nurse practitioner/ | 52622 |
| 35 | nurse specialist/ | 2073 |
| 36 | ((care or healthcare or service?) adj5 model?).ti,ab,kw. | 131118 |
| 37 | (((primary care or nurs*) adj1 (geriatric* or gerontolog*)) or advance* practice nurs*).ti,ab,kw. | 15489 |
| 38 | (hospital adj4 home).ti,ab,kw. | 29243 |
| 39 | (mobile health* or telehealth* or ehealth or mhealth or telemedicine or tele‐health* or e‐health or m‐health or tele‐medicine).ti,ab,kw. | 100589 |
| 40 | (videoconferenc* or video‐conferenc*).ti,ab,kw. | 11595 |
| 41 | ((care or healthcare or service?) adj2 deliver*).ti,ab,kw. | 164674 |
| 42 | (family doctor? or family physician? or general practitioner? or general practice?).ti,ab,kw. | 271993 |
| 43 | ((integrat* or coordinat* or co‐ordinat* or collaborat* or cooperat* or co‐operat* or interdisciplin* or inter‐disciplin* or multidisciplin* or multi‐disciplin*) adj3 (team? or care or healthcare or intervention? or program* or model?)).ti,ab,kw. | 400781 |
| 44 | (in‐reach or inreach).ti,ab,kw. | 1843 |
| 45 | (nurse? adj2 (clinician* or speciali* or practitioner*)).ti,ab,kw. | 66411 |
| 46 | (nurs* adj (led or manage* or deliver* or run or ran)).ti,ab,kw. | 36911 |
| 47 | health care delivery/ | 381404 |
| 48 | Integrated health care system/ | 24615 |
| 49 | teleconsultation/ | 24921 |
| 50 | ((specialist? or shared) adj1 (care or healthcare)).ti,ab,kw. | 19461 |
| 51 | patient care/ | 647686 |
| 52 | ((coordinat* or co‐ordinat*) adj2 (care or healthcare or service* or program* or approach* or management or team care or team treatment* or team assessment* or team consultation*)).ti,ab,kw. | 50740 |
| 53 | (team* adj2 (care or treatment* or assessment* or consultation* or healthcare or service* or program* or approach*)).ti,ab,kw. | 108670 |
| 54 | (care adj2 continuity).ti,ab,kw. | 23182 |
| 55 | "organization and management"/ | 850073 |
| 56 | or/32‐55 | 2690960 |
| 57 | 31 and 56 | 71273 |
| 58 | random*.ti,ab. | 3495667 |
| 59 | factorial*.ti,ab. | 86012 |
| 60 | (crossover* or cross over*).ti,ab. | 233421 |
| 61 | ((doubl* or singl*) adj blind*).ti,ab. | 510560 |
| 62 | (assign* or allocat* or volunteer* or placebo*).ti,ab. | 2305861 |
| 63 | crossover procedure/ | 138369 |
| 64 | single blind procedure/ | 89879 |
| 65 | randomized controlled trial/ | 1381540 |
| 66 | double blind procedure/ | 384038 |
| 67 | or/58‐66 | 5243030 |
| 68 | exp animal/ not human/ | 10876620 |
| 69 | 67 not 68 | 4727723 |
| 70 | 57 and 69 | 7940 |
| 71 | limit 70 to embase | 4263 |
Age Line EBSCO
Search date: 3 January 2023
| No. | Search terms | Results |
| S1 | DE "Long Term Care" | 19222 |
| S2 | DE "Board and Care Homes" OR DE "Skilled Nursing Facilities" | 2065 |
| S3 | DE "Assisted Living Facilities" | 2984 |
| S4 | TI hospice OR AB hospice | 7015 |
| S5 | TI (long‐term N2 (care or healthcare or service? or treatment? or patient? or resident?)) OR AB (long‐term N2 (care or healthcare or service? or treatment? or patient? or resident?)) | 26021 |
| S6 | TI (long stay N2 (care or healthcare or service? or treatment? or patient? or resident?)) or AB (long stay N2 (care or healthcare or service? or treatment? or patient? or resident?)) | 583 |
| S7 | TI (function* N2 (dependen* or independen* or limit* or decline* or status or impair*)) OR AB (function* N2 (dependen* or independen* or limit* or decline* or status or impair*)) | 15401 |
| S8 | TI (candidate? N3 (institution* or deinstitution* home or place*)) OR AB (candidate? N3 (institution* or deinstitution* home or place*)) | 42 |
| S9 | TI (residential N3 (care or healthcare or facilit*)) OR AB (residential N3 (care or healthcare or facilit*)) | 4209 |
| S10 | TI (assisted living facilit* or assisted care facilit*) OR AB (assissted living facilit* or assisted care facilit*) | 2781 |
| S11 | TI (group? N0 (home? or living)) OR AB (group? N0 (home? or living?)) | 651 |
| S12 | TI halfway hous* OR AB halfway hous* | 28 |
| S13 | TI hospice? OR AB hospice? | 7015 |
| S14 | TI (care home? or care facilit* or resporative care or rest home? or nursing facilit*) OR AB (care home? or care facilit* or resporative care or rest home? or nursing facilit*) | 36252 |
| S15 | DE "Homes for the Elderly" | 1514 |
| S16 | DE "Nursing Homes" | 23986 |
| S17 | TI nursing home? OR AB nursing home? | 31537 |
| S18 | TI (aged care or (aged N3 home?)) OR AB (aged care or (aged N3 home?)) | 6749 |
| S19 | DE "Telemedicine" | 1043 |
| S20 | (DE "Nurse Practicioners") AND (DE "Gerontological Nursing" OR DE "Nurses") | 6999 |
| S21 | TI (nursing staff N5 hospital) OR AB (nursing staff N5 hospital) | 90 |
| S22 | (DE "Health Services") OR (DE "Service Coordination") | 19361 |
| S23 | DE "Interdisciplinary Team Care" OR DE "Continuum of Care" | 4586 |
| S24 | TI ((care or healthcare of service?) N5 model?) OR AB ((care or healthcare of service?) N5 model?) | 6623 |
| S25 | TI (((primary care of nurs*) N1 (geriatric* or gerontolog*)) or advance* practice nurs*) OR AB (((primary care of nurs*) N1 (geriatric* or gerontolog*)) or advance* practice nurs*) | 6628 |
| S26 | TI (hospital N4 home) OR AB (hospital N4 home) | 3886 |
| S27 | TI (mobile health* or telehealth* or ehealth or mhealth or telemedicine or tele‐health* or e‐health or m‐health or tele‐medicine) OR AB (mobile health* or telehealth* or ehealth or mhealth or telemedicine or tele‐health* or e‐health or m‐health or tele‐medicine) | 901 |
| S28 | TI (videoconferenc* or video‐conference*) OR AB (videoconferenc* or video‐conference*) | 182 |
| S29 | TI ((care of healthcare of service?) N2 deliver*) OR AB ((care of healthcare of service?) N2 deliver*) | 7807 |
| S30 | TI (family doctor? or family physician? or general practitioner? or general practice?) OR AB (family doctor? or family physician? or general practitioner? or general practice?) | 3204 |
| S31 | TI ((integrat* or coordinat* or co‐ordinat* of collaborat* or cooperat* or co‐operat* or interdisciplin* or inter‐disciplin* or multidisciplin* or multi‐disciplin*) N3 (team? or care or healthcare or intervention? or program* or model?)) OR AB ((integrat* or coordinat* or co‐ordinat* of collaborat* or cooperat* or co‐operat* or interdisciplin* or inter‐disciplin* or multidisciplin* or multi‐disciplin*) N3 (team? or care or healthcare or intervention? or program* or model?)) | 10248 |
| S32 | TI (in‐reach or inreach) OR AB (in‐reach or inreach) | 4322 |
| S33 | Ti (nurse? N2 (clinician* or speciali* or practitioner*)) OR AB (nurse? N2 (clinician* or speciali* or practitioner*)) | 1684 |
| S34 | TI (nurs* N0 (led or manage* or deliver* or run or ran)) OR AB (nurs* N0 (led or manage* or deliver* or run or ran)) | 509 |
| S35 | TI ((specialist? or shared) N1 (care or healthcare)) OR AB ((specialist? or shared) N1 (care or healthcare)) | 533 |
| S36 | TI ((coordinat* or co‐ordinat*) N2 (care or healthcare or service* or program* or approach* or management or team care of team treatment* or team assessment* or team consultation*)) OR AB ((coordinat* or co‐ordinat*) N2 (care or healthcare or service* or program* or approach* or management or team care of team treatment* or team assessment* or team consultation*)) | 3378 |
| S37 | TI (team* N2 (care or treatment* or assessment* of consultation* or healthcare or service* or program* or approach*)) OR AB (team* N2 (care or treatment* or assessment* of consultation* or healthcare or service* or program* or approach*)) | 3003 |
| S38 | TI (care N2 continuity) OR AB (care N2 continuity( | 718 |
| S39 | S19 OR S20 OR S21 OR S22 OR S23 OR S24 OR S25 OR S26 OR S27 OR S28 OR S29 OR S30 OR S31 OR S32 OR S33 OR S34 OR S35 OR S36 OR S37 OR 38 | 55525 |
| S40 | DE "Randomized Controlled Trials" | 4974 |
| S41 | DE "Controlled Clinical Trials" | 304 |
| S42 | TI (randomis* or randomiz* or randomly) OR AB (randomis* or randomiz* or randomly) | 14041 |
| S43 | TX clinical trial | 3736 |
| S44 | TX randomized controlled trial | 7144 |
| S45 | S40 OR S41 OR S42 OR S43 OR S44 | 16572 |
| S46 | S1 OR S2 OR S3 OR S4 OR S5 OR S6 OR S7 OR S8 OR S9 OR S10 OR S11 OR S12 OR S13 OR S14 OR S15 OR S16 OR S17 OR 18 | 46341 |
| S47 | S39 AND S45 AND S46 | 651 |
CINAHL EBSCO
Search date: 26 October 2022
| No. | Search terms | Results |
| S1 | (MH "Aged") OR (MH "Aged, 80 and Over") OR (MH "Centenarians") OR (MH "Frail Elderly") | 1.790.128 |
| S2 | (MH "Geriatrics") | 12.382 |
| S3 | (MH "Health Services for the Aged") | 14.856 |
| S4 | TI (geriatric? or senior? or elderly) OR AB (geriatric? or senior? or elderly) | 279.702 |
| S5 | TI (old* adult? or old* person? or old* people or old* patient?) OR AB (old* adult? or old* person? or old* people or old* patient?) | 294.942 |
| S6 | S1 OR S2 OR S3 OR S4 OR S5 | 1.885.279 |
| S7 | (MH "Long Term Care") | 54.936 |
| S8 | (MH "Residential Facilities") OR (MH "Halfway Houses") OR (MH "Skilled Nursing Facilities") | 19.544 |
| S9 | (MH "Assisted Living") | 6.492 |
| S10 | (MH "Hospices") | 6.688 |
| S11 | TI (long‐term N2 (care or healthcare or service? or treatment? or patient? or resident?)) OR AB (long‐term N2 (care or healthcare or service? or treatment? or patient? or resident?)) | 81.269 |
| S12 | TI (long stay N2 (care or healthcare or service? or treatment? or patient? or resident?)) OR AB (long stay N2 (care or healthcare or service? or treatment? or patient? or resident?)) | 1.955 |
| S13 | TI (function* N2 (dependen* or independen* or limit* or decline* or status or impair*)) OR AB (function* N2 (dependen* or independen* or limit* or decline* or status or impair*)) | 115.557 |
| S14 | TI (candidate? N3 (institution* or deinstitution* or home or place*)) OR AB (candidate? N3 (institution* or deinstitution* or home or place*)) | 376 |
| S15 | TI (residential N3 (care or healthcare or facilit*)) OR AB (residential N3 (care or healthcare or facilit*)) | 13.395 |
| S16 | TI (assisted living facilit* or assisted care facilit*) OR AB (assisted living facilit* or assisted care facilit*) | 2.103 |
| S17 | TI (group? N0 (home? or living)) OR AB (group? N0 (home? or living)) | 2.514 |
| S18 | TI halfway hous* OR AB halfway hous* | 166 |
| S19 | TI hospice? OR AB hospice? | 26.772 |
| S20 | TI (care home? or care facilit* or restorative care or rest home? or nursing facilit*) OR AB (care home? or care facilit* or restorative care or rest home? or nursing facilit*) | 144.279 |
| S21 | S7 OR S8 OR S9 OR S10 OR S11 OR S12 OR S13 OR S14 OR S15 OR S16 OR S17 OR S18 OR S19 OR S20 | 393.565 |
| S22 | (MH "Housing for the Elderly") | 3.877 |
| S23 | (MH "Nursing Homes") | 24.431 |
| S24 | TI nursing home? OR AB nursing home? | 50.499 |
| S25 | TI (aged care or (aged N3 home?)) OR AB (aged care or (aged N3 home?)) | 37.692 |
| S26 | S6 AND S21 | 76.505 |
| S27 | S22 OR S23 OR S24 OR S25 OR S26 | 176.003 |
| S28 | (MH "Remote Consultation") OR (MH "Telehealth+") | 77.849 |
| S29 | (MH "Nurse Practitioners") OR (MH "Advanced Practice Nurses") OR (MH "Clinical Nurse Specialists") | 64.413 |
| S30 | (MH "Nursing Staff, Hospital") | 54.755 |
| S31 | (MH "Health Care Delivery") OR (MH "Health Care Delivery, Integrated") | 142.748 |
| S32 | (MH "Multidisciplinary Care Team") OR (MH "Continuity of Patient Care") | 124.722 |
| S33 | TI ((care or healthcare or service?) N5 model?) OR AB ((care or healthcare or service?) N5 model?) | 74.430 |
| S34 | TI (((primary care or nurs*) N1 (geriatric* or gerontolog*)) or advance* practice nurs*) OR AB (((primary care or nurs*) N1 (geriatric* or gerontolog*)) or advance* practice nurs*) | 22.364 |
| S35 | TI (hospital N4 home) OR AB (hospital N4 home) | 17.297 |
| S36 | TI (mobile health* or telehealth* or ehealth or mhealth or telemedicine or tele‐health* or e‐health or m‐health or tele‐medicine) OR AB (mobile health* or telehealth* or ehealth or mhealth or telemedicine or tele‐health* or e‐health or m‐health or tele‐medicine) | 42.429 |
| S37 | TI (videoconferenc* or video‐conferenc*) OR AB (videoconferenc* or video‐conferenc*) | 4.426 |
| S38 | TI ((care or healthcare or service?) N2 deliver*) OR AB ((care or healthcare or service?) N2 deliver*) | 100.592 |
| S39 | TI (family doctor? or family physician? or general practitioner? or general practice?) OR AB (family doctor? or family physician? or general practitioner? or general practice?) | 93.198 |
| S40 | TI ((integrat* or coordinat* or co‐ordinat* or collaborat* or cooperat* or co‐operat* or interdisciplin* or inter‐disciplin* or multidisciplin* or multi‐disciplin*) N3 (team? or care or healthcare or intervention? or program* or model?)) OR AB ((integrat* or coordinat* or co‐ordinat* or collaborat* or cooperat* or co‐operat* or interdisciplin* or inter‐disciplin* or multidisciplin* or multi‐disciplin*) N3 (team? or care or healthcare or intervention? or program* or model?)) | 168.295 |
| S41 | TI (in‐reach or inreach) OR AB (in‐reach or inreach) | 80.487 |
| S42 | TI (nurse? N2 (clinician* or speciali* or practitioner*)) OR AB (nurse? N2 (clinician* or speciali* or practitioner*)) | 56.469 |
| S43 | TI (nurs* N0 (led or manage* or deliver* or run or ran)) OR AB (nurs* N0 (led or manage* or deliver* or run or ran)) | 38.224 |
| S44 | TI ((specialist? or shared) N1 (care or healthcare)) OR AB ((specialist? or shared) N1 (care or healthcare)) | 12.299 |
| S45 | TI ((coordinat* or co‐ordinat*) N2 (care or healthcare or service* or program* or approach* or management or team care or team treatment* or team assessment* or team consultation*)) OR AB ((coordinat* or co‐ordinat*) N2 (care or healthcare or service* or program* or approach* or management or team care or team treatment* or team assessment* or team consultation*)) | 28.023 |
| S46 | TI (team* N2 (care or treatment* or assessment* or consultation* or healthcare or service* or program* or approach*)) OR AB (team* N2 (care or treatment* or assessment* or consultation* or healthcare or service* or program* or approach*)) | 53.758 |
| S47 | TI (care N2 continuity) OR AB (care N2 continuity) | 12.849 |
| S48 | S28 OR S29 OR S30 OR S31 OR S32 OR S33 OR S34 OR S35 OR S36 OR S37 OR S38 OR S39 OR S40 OR S41 OR S42 OR S43 OR S44 OR S45 OR S46 OR S47 | 935.196 |
| S49 | S27 AND S48 | 42.220 |
| S50 | (MH "Random Assignment") | 142.459 |
| S51 | (MH "Clinical Trials+") | 658.361 |
| S52 | TI ( randomis* or randomiz* or randomly) OR AB ( randomis* or randomiz* or randomly) | 692.446 |
| S53 | PT clinical trial | 221.253 |
| S54 | PT randomized controlled trial | 274.210 |
| S55 | S50 OR S51 OR S52 OR S53 OR S54 | 1.044.063 |
| S56 | S49 AND S55 | 4.432 |
| S57 | S56 Limiters ‐ Exclude MEDLINE records | 1.506 |
Appendix 2. Template for Intervention Description and Replication (TIDieR) checklist for intervention group in included studies
Haines 2020
| Study ID | Haines 2020 |
| WHY | 1) Co‐locating GP in residential care leads to more timely care provision and thus better access 2) Task shifting from registered nurses to care assistants allows registered nurses to be more involved in care planning for the residents |
| WHAT (materials) | No specific materials reported |
| WHAT (procedures) | Intervention model of care provided in the residential ACF: GPs were employed as salaried staff by Bupa Aged Care. One full‐time GP was employed for every 150 residents at a facility; it was anticipated that some homes would share GPs because of size and geographic proximity. Clinical Managers reported directly to the residential ACF’s General Manager and supported the GP in managing the medical practice to provide high‐quality health services to the residents of the residential ACF. Clinical managers were the link between Care Managers and the GP in the delivery of collaborative, integrated healthcare including assessment, care planning and clinical intervention. Care managers managed delivery of care to residents and facilitated a high standard in ongoing assessment, care planning, evaluation and clinical governance. Care managers were responsible for approximately 40 residents (in the control model of care, Care managers were responsible for residents across all the facilities). “Registered Nurse in Charge” supervised the delivery of person‐centred care to residents (delivering high standards in ongoing assessment, care planning, evaluation, and clinical governance), as delegated by the Care Manager. Other registered nurses or endorsed enrolled nurses were selected as team leaders of a small group of personal care attendants responsible for a “community” of residents. Registered nurses did not perform the medication trolley round. Medications were instead pre‐packaged, kept in the resident’s room, and a trained personal care attendant ensured that residents adhered to medication as prescribed. Personal Care Attendants were trained, utilising a nationally recognised education module, to undertake their new role of assisting residents with medication administration. The timing of medication distribution transitioned from scheduled rounds at 8am, 12 midday and 6pm (with exceptions for particular medications), under the old model of care, to scheduled rounds at 8am, 2pm and 8pm (with exceptions for particular medications). Residents were also asked to provide input on the timing of their medications. Organisational change facilitators were employed by the provider organisation to oversee the changes in roles at the participating sites during each site’s “black‐out” period. They led workshops with staff on explaining the new roles in the new model, brainstorming and problem‐solving the likely challenges to introducing the model of care, provided one‐on‐one discussions with staff about changing of roles, and undertook recruitment for the new positions. Most homes got one additional care manager as part of the staff structure supporting the new model. They also provided information sessions for residents and family. |
| WHO PROVIDED | Intervention was provided in the residential ACF by a GP and registered or endorsed enrolled nurses who were members of ACF staff (more detailed list provided below). Intervention was initiated and co‐ordinated by BUPA Aged Care.
|
| HOW | Face‐to‐face on‐site |
| WHERE | 15 ACFs in 4 states of Australia |
| WHEN AND HOW MUCH | Stepped wedge trial with intervention implemented over 90 weeks (7 clusters) and 54‐week follow‐up period. Training of staff at the initial intervention sites and recruiting of GPs commenced on 4 March 2013; data for the intervention period was collected from 8 July 2013. The trial period concluded on 21 September 2014, and the prospective follow‐up concluded on 4 October 2015. A GP was present for at least 5 weeks in 91 of the 148 9‐week site blocks during the intervention and prospective follow‐up periods. |
| TAILORING | Tailoring is not explicitly reported, however it is implicitly part of the intervention itself, e.g. focus on person‐centred care |
| MODIFICATIONS | No changes to intervention are reported |
| HOW WELL (planned) | It is not reported whether adherence was explicitly studied |
| HOW WELL (actual) | 4 ACFs (facilities 7, 8, 14, 15) were not able to recruit a GP at any time during the trial or prospective follow‐up; 4 additional ACFs (facilities 2, 3, 6, 9) did not have a GP for the entire period of the trial or prospective follow‐up |
| Details of any co‐interventions | No co‐interventions reported |
ACF: residential care facility; GP: general practitioner
Arendts 2018
| Author, year | Arendts 2018 |
| WHY | Qualitative data indicate that many residents, their family and carers would prefer acute care (i.e. short‐term treatment for urgent illness or injury) be delivered in the residential ACF setting without hospitalisation. If this preference is to be met, available and co‐ordinated clinical care by dedicated practitioners is required, rather than relying upon existing residential ACF staff. |
| WHAT (materials) | NPs used best practice resource folder (provided as supplementary) for the care processes being delivered and co‐ordinated as part of the trial. This contained guidelines for comprehensive medical assessment; patient ± family education regarding diagnosis and prognosis; care pathways for specific acute illnesses; palliative care plan for management of current and anticipated future symptoms; advance care planning; medication review; and a review of unplanned hospitalisations at regular meetings utilising root cause analyses. |
| WHAT (procedures) | Consenting residents in the intervention facilities were assigned to NPs that worked with general (primary care) practitioners in a collaborative arrangement. In this study, the NPs had an autonomous scope of practice that included independent diagnosis and prescribing, but conferred with the PCP as needed. The NPs were responsible for resident care, ranging from care co‐ordination (where subacute and chronic care processes developed for individual residents were integrated into ongoing care provided by facility staff and other primary care providers), through to providing unplanned acute care for enrolled residents. NPs used a best practice resource folder (see above). |
| WHO PROVIDED | Experienced NPs |
| HOW | Face‐to‐face on‐site |
| WHERE | Six residential ACFs in Australia |
| WHEN AND HOW MUCH | NPs provided care on a continuous basis. The practitioners visited intervention facilities for a minimum of 3 days a week, with an on‐call arrangement to meet urgent needs through telephone advice or unplanned visits to the residential ACF as required. The intensity and frequency of individual resident contact depended on individual patient needs. Use of guidelines was continuous. Staff education (provided by NP) to ensure understanding of and utilisation of the best practice resource folder occurred at least monthly. |
| TAILORING | The intensity and frequency of individual resident contact depended on individual patient needs |
| MODIFICATIONS | No changes to intervention are reported |
| HOW WELL (planned) | It is not reported whether adherence was explicitly studied |
| HOW WELL (actual) | Not reported |
| Details of any co‐interventions | No co‐interventions reported |
RACF: residential care facility; PCP: primary care physician; NP: nurse practitioner
Kolcu 2020
| Study ID | Kolcu 2020 |
| WHY | Evidence shows that HT management increases quality of life through positive lifestyle changes. It is hypothesised that a nurse‐led programme with attention to lifestyle through education, exercises and motivational interviews will improve quality of life, medication adherence and HT management. |
| WHAT (materials) | Individual action plans (details not provided). Medicine boxes were distributed to manage medication. |
| WHAT (procedures) | The programme consisted of individual and group interventions together with actions taken at the institutional level. These interventions included 6 sessions of health education followed by 4 brief motivational meetings held at 1‐week intervals for each older adult in the intervention group. Those who did not want to participate in group education sessions were given individual education. An action plan was created together with the patients before the motivational meetings, the effectiveness of the practices specified in the action plan were discussed at these meetings and each new meeting was arranged individually in accordance with the participants’ needs. Blood pressure and anthropometric measurements were repeated at each motivational meeting. Institutional arrangements included removing saltshakers from tables, distributing medicine boxes and planning appropriate areas for doing regular exercise. The participants were encouraged to consume a DASH diet, which is rich in fruits and vegetables, low in fat, and rich in potassium, magnesium, calcium, fibre and protein. Immobile patients were exercised with active and passive movements 3 days a week. |
| WHO PROVIDED | Researcher and nurses at the nursing home |
| HOW | Face‐to‐face on‐site |
| WHERE | Two nursing homes in Istanbul, Turkey |
| WHEN AND HOW MUCH | Intervention duration was 20 weeks and included 6 sessions of health education, medication adherence follow‐up, distribution of medicine boxes, in‐bed exercise for immobile participants (20 min, 3 days/week for 4 participants), relaxation exercises to reduce stress (quantity not provided), and brief motivational meetings (quantity not provided). |
| TAILORING | Tailoring was part of the intervention (i.e. action plans were created together with the patient before the motivational meetings and the effectiveness of the practices specified in the action plan were discussed at these meetings. In addition, each new meeting was arranged individually in accordance with the participants’ needs. |
| MODIFICATIONS | No changes to intervention are reported |
| HOW WELL (planned) | Not reported |
| HOW WELL (actual) | Not reported |
| Details of any co‐interventions | No co‐interventions reported |
Man 2020
| Study ID | Man 2020 |
| WHY | Compared with community‐dwelling individuals, the prevalence of vision impairment in the Australian residential care community has been reported as almost fourfold higher at 46.4%, despite the availability of subsidised public healthcare. Adequate refractive correction was shown to improve vision in up to 50% of individuals in RACFs. Other prospective studies have shown that residents who receive correction or cataract surgery demonstrate short‐term improvements in vision, quality of life and increased participation in activities of daily living, and better mental health outcomes. For ocular conditions that cause irreversible or progressive vision loss, remaining vision can still be maximised through provision of low vision rehabilitation. Evidence from community‐living older adults has found improvements in vision‐related quality of life and participation. It is hypothesised that these interventions can also benefit RACF residents. |
| WHAT (materials) | No specific materials reported |
| WHAT (procedures) | The ROC model of eye care includes an on‐site eye examination by an optometrist with expertise in domiciliary and low vision care. Four intervention options were provided to help improve vision based on the individual participants’ eye history. These included: (1) Refractive correction An optometrist from the ACO performed a detailed refraction for distance and near vision and measure best corrected VAs. Participants were allocated to the refractive correction pathway if they met the following criteria:
If participants met the above criteria, they were prescribed, dispensed, and supplied with the appropriate spectacles from a selected range according to their visual needs and activities. One pair of spectacles (or two if separate distance and reading glasses were needed) was provided and dispensed by the ACO and funded by the study. (2) Cataract surgery The ACO optometrist determined whether a participant was referred for cataract surgery assessment by an ophthalmologist following the grading of lens opacities using the grading World Health Organization (WHO) Simplified Cataract Grading System. Participants were allocated to the cataract surgery pathway if they met the following criteria:
If spectacles were required following cataract surgery, these were dispensed by ACO and funded by the study. (3) Referral to an ophthalmologist A referral to an ophthalmologist was provided if the participant had unexplained poor VA (< 6/12; 0.3 LogMAR) that was not due to uncorrected refractive error or cataract or showed evidence of AMD, DR or glaucoma, and was not currently receiving ophthalmic advice/treatment for these conditions. Following medical consultation with a resident, treatment options, both surgical and medical, could be offered through the public health system, at the discretion of the treating ophthalmologist. Treatment options could include intraocular injections for conditions such as wet AMD and DR, surgical interventions for advanced glaucoma (i.e. trabeculoplasty), and the provision of topical medication for glaucoma, ocular inflammation, lid disease and ocular infection. Other retinal eye conditions that require referral include (but are not limited to): retinal vein occlusion or emboli; macular hole; retinal detachments; retinal collaterals; and naevus. The study co‐ordinator liaised with the residential facility in organising the initial ophthalmologist appointment and two subsequent follow‐up appointments as required. (4) Low vision rehabilitation Participants with VA < 6/12 (0.3 LogMAR) not correctable by either refraction or cataract surgery were eligible for the low vision rehabilitation pathway. An ACO optometrist undertook an initial comprehensive vision and ophthalmic review and provided low vision aids where appropriate at no cost. The type of low vision aids provided was determined by the level of VI, the level of magnification required to perform desired tasks and the participant’s ability to use aids of different designs. Detailed demonstration, training and instruction on aids were given to the participant. Details of this examination were forwarded with referral to the nearest Vision Australia centre, Australia’s leading provider of blindness and low vision rehabilitation services, where an appointment was scheduled within 8 weeks. At this appointment, a Vision Australia Occupational Therapist conducted a “Techniques for Daily Living” session with the participant, focusing on areas of difficulty and concern. Each session was adapted to the individual circumstances of the resident, but based around application of the following techniques:
For all pathways, transportation costs for initial consultations and for up to 2 follow‐up consultations (to either a public or private care provider) were funded by the study. |
| WHO PROVIDED | Optometrist with expertise in domiciliary and low vision care conducted initial screening and referred to other professionals as described above |
| HOW | Face‐to‐face on‐site |
| WHERE | 38 aged care facilities in Australia |
| WHEN AND HOW MUCH | Following the baseline assessment, participants received the ROC intervention or usual care The extent of care received depended on the intervention pathway selected for each patient |
| TAILORING | Tailoring is not explicitly reported, however it is implicitly part of the intervention itself |
| MODIFICATIONS | No changes to intervention are reported |
| HOW WELL (planned) | It is not reported whether adherence was explicitly studied |
| HOW WELL (actual) | Not reported |
| Details of any co‐interventions | No co‐interventions reported |
RACF: residential care facility; ROC ‐ residential ocular care; VA ‐ visual acuity; ACO ‐ Australian College of Optometry
Uy 2008
| Study ID | Uy 2008 |
| WHY | Inpatient interdisciplinary rehabilitation, compared to rehabilitation at NH, was expected to improve outcomes after surgery |
| WHAT (materials) | No specific materials reported |
| WHAT (procedures) | The intervention group was provided with an inpatient multidisciplinary rehabilitation programme that was provided using the system of accelerated rehabilitation. When ambulating, or when it was clear that the patient would be unable to ambulate, the patient was discharged to the NH with instructions for continuing mobilisation. |
| WHO PROVIDED | Interdisciplinary hospital‐based team |
| HOW | Face‐to‐face on‐site |
| WHERE | 1 hospital for intervention group, NHs for control group (all in Northern Sydney, Australia) |
| WHEN AND HOW MUCH | The duration of the intervention was the number of days in which the participant was in the inpatient rehabilitation ward |
| TAILORING | Intervention duration was set according to the patient needs |
| MODIFICATIONS | No changes to intervention are reported |
| HOW WELL (planned) | It is not reported whether adherence was explicitly studied |
| HOW WELL (actual) | Not reported |
| Details of any co‐interventions | No co‐interventions reported |
NH: nursing home
Boorsma 2011
| Study ID | Boorsma 2011 |
| WHY | Older people need more complex professional care due to chronic diseases and associated disabilities. Inspired by the chronic disease management model, a multidisciplinary integrated care model was developed to address these needs. Multidisciplinary approach to care for frail and vulnerable older residents can lead to anticipation of complex care needs, better co‐ordination and, as a result, better quality of care. This should translate into better quality of life for residents. |
| WHAT (materials) | Baseline and 6 months interview/questionnaire: InterRAI‐LTCF ‐ a comprehensive, standardised instrument for evaluating the needs, strengths and preferences of those in chronic care and NH institutional settings. |
| WHAT (procedures) | Disease management was made operational in the process of care in 3 sequential steps (further details provided in supplementary material):
|
| WHO PROVIDED | Multidisciplinary team, which consisted of PCP, NH physician, nurse, psychotherapist and other involved disciplines |
| HOW | Face‐to‐face on‐site |
| WHERE | 10 residential care homes in the Netherlands |
| WHEN AND HOW MUCH | Assessment every 3 months, further discussed in a multidisciplinary care meeting followed up by an individual multidisciplinary consultation for the frailest residents |
| TAILORING | Care plan was tailored to the residents' needs based on the outcome of the interview; additional multidisciplinary consultation offered to frailest residents (however, this is part of the intervention itself) |
| MODIFICATIONS | No changes to intervention are reported |
| HOW WELL (planned) | Process outcomes: percentage of residents with completed assessments; number of multidisciplinary meetings held (meeting minutes); the numbers of agreed‐on medical, nursing and social actions, based on content analysis of care plans; and opinions of participating professionals regarding the intervention protocol, as obtained by interviews with staff and family physicians. |
| HOW WELL (actual) | Percentage of residents with completed assessments: 55.2% (implementation delay = cause of low number) number of multidisciplinary meetings held (meeting minutes): 40; outcomes of assessment of 93 residents discussed Numbers of agreed‐on medical, nursing and social actions, based on content analysis of care plans: the number of recommended actions per resident was 3.67 in the intervention facility meetings and 2.26 in the control facility meetings |
| Details of any co‐interventions | No co‐interventions reported |
NH: nursing home; PCP: Primary Care Physician
Boyd 2014
| Study ID | Boyd 2014 |
| WHY | Maintaining resident wellness through proactive assessment and early intervention is key to decreasing the need for acute hospitalisation. |
| WHAT (materials) | No specific materials reported |
| WHAT (procedures) | Each full‐time equivalent GNS was responsible for 14 or 15 facilities (average 49 beds per facility) within a specified geographic region. The district health board employed the GNSs, who had at least 1 year of postgraduate education or a Master’s degree in nursing. All had more than 10 years of gerontology experience. The GNS intervention provided clinical support, education, and clinical coaching through on‐site visits every other month and delivery of standardised gerontology education sessions for residential ACF nurses and care assistants. Ad hoc on‐site clinical coaching to discuss residents of concern occurred at the request of facility staff. GNSs provided care co‐ordination and comprehensive geriatric assessments for residents of concern as needed. The GNS also provided care co‐ordination for residents transitioning across healthcare settings, although much of this work was not well captured in GNS records, and therefore it is difficult to quantify how many residents or how much time was spent on this activity. |
| WHO PROVIDED | Gerontology nurse specialists |
| HOW | Face‐to‐face on‐site |
| WHERE | 54 long‐term care facilities in New Zealand |
| WHEN AND HOW MUCH | The GNS intervention provided clinical support, education and clinical coaching through on‐site visits every other month and delivery of standardised gerontology education sessions for residential ACF nurses and care assistants (mean 5.5 sessions per facility in 12 months). Ad hoc on‐site clinical coaching to discuss residents of concern (mean 2.3 sessions per facility in 12 months) occurred at the request of facility staff. The GNS was on site at each facility for a mean of 1.9 hours per month. GNSs provided care co‐ordination and comprehensive geriatric assessments for residents of concern as needed (mean 2.6 assessments per facility in 12 months). The GNS also provided care co‐ordination for residents transitioning across healthcare settings, although much of this work was not well captured in GNS records, and therefore it is difficult to quantify how many residents or how much time was spent on this activity. |
| TAILORING | Tailoring is not explicitly reported, however it is implicitly part of the intervention itself, e.g. "GNSs provided care co‐ordination and comprehensive geriatric assessments for residents of concern as needed" |
| MODIFICATIONS | No changes to intervention are reported |
| HOW WELL (planned) | It is not reported whether adherence was explicitly studied |
| HOW WELL (actual) | Not reported |
| Details of any co‐interventions | During the trial, there were interventions that all facilities in the district received (intervention and comparison facilities). The Registered Nurse Care Guides were developed as a quick evidence‐based reference for common geriatric problems and to provide guidance about when to seek medical or advanced nursing consultation. These guides were developed through a collective workgroup of residential ACF nurses and managers and the GNS team. Education sessions specifically targeted at aged care facility staff were held every 3 months at a central location. These sessions facilitated staff peer support across aged care facilities. Intervention and comparison facilities had access to a wound care clinical nurse specialist who performed wound assessments as requested by facilities. |
ACF: residential care facility; GNS ‐ gerontology nurse specialist
Connolly 2015
| Study ID | Connolly 2015 |
| WHY | Older people in residential aged care are a vulnerable group with a high risk of emergency acute admission to hospital. Many hospitalisations could be avoided by improved management or by providing treatment within the facility, with better outcomes for residents. |
| WHAT (materials) | No specific materials reported |
| WHAT (procedures) | The intervention included:
|
| WHO PROVIDED | RACF staff and multidisciplinary team, which consisted of geriatrician, primary care physician, pharmacist, gerontology nurse specialist (GNS) and facility nurse |
| HOW | Face‐to‐face on‐site care and multidisciplinary meetings to discuss residents (typically 6 residents discussed per meeting, with priority given to new admissions, the recently hospitalised, those with recent 'incidents' (e.g. fall) and those on 9 or more medications) |
| WHERE | 36 LTC facilities (4 levels of residential ACFs) across New Zealand |
| WHEN AND HOW MUCH | The intervention continued for nine months with the intensity of the intervention decreasing over time to foster facility independence prior to the conclusion of active involvement, including months 6 and 8 where facilities did not receive any input by the GNSs. The GNSs began the intervention with one new facility per month in order to allow sufficient time for the organisation and delivery of the intervention. |
| TAILORING | No tailoring reported |
| MODIFICATIONS | No changes to intervention are reported |
| HOW WELL (planned) | Adherence was assessed by researchers by measuring number of multidisciplinary team meetings and case discussions, as well as GNS visits. No specific strategies to improve fidelity are reported. |
| HOW WELL (actual) | One control facility withdrew before follow‐up was complete. Fifty‐two of a planned 54 multidisciplinary team meetings were held; 281 case discussions (263 residents, 23.4% of the intervention arm resident population) occurred. All GNS visits occurred as per protocol. |
| Details of any co‐interventions | No co‐interventions reported |
ACF: aged care facility; GNS ‐ gerontology nurse specialist; LTC: long‐term care
Bellantonio, 2008
| Study ID | Bellantonio 2008 |
| WHY | Maintaining resident wellness through multidisciplinary team assessment and early intervention minimises unanticipated transitions (permanent relocation to a nursing facility, ED visit, hospitalisation, death) Attention to potentially troublesome clinical symptoms from a geriatric perspective might prevent unanticipated transitions from dementia‐specific assisted living facilities. The rationale for the team composition was based on clinical observations that most transitions from assisted living occur because of acute medical, psychiatric or functional event or change. |
| WHAT (materials) | No specific materials reported |
| WHAT (procedures) | Independent assessment occurred at Days 7, 30, 120 and 320 after admission. The timing of the assessments lies in the Connecticut Department of Public Health regulations requiring a plan of care within 7 days of admission and repeated at least once every 3 months. The rationale for conducting a second assessment 30 days after admission was that residents with cognitive impairment frequently have difficulty adjusting after a move to a new environment. The geriatrician and geriatrics advanced practice nurse conducted medical and cognitive evaluations and made recommendations regarding behavioural symptoms. The physical therapist evaluated physical function, gait and balance and assessed the need for ongoing physical therapy and assistive devices. The dietitian evaluated nutritional status and provided dietary recommendations. The medical social worker assessed guardianship issues, long‐term planning and the psychosocial adjustment of the residents and families. The entire team, together with staff nurses, met bimonthly to discuss the most recent assessments and provide recommendations to the PCP, the facility director, and families. Members of the team were available for in‐person or telephone consultation with facility staff members throughout the study period to address any interceding issues, although this was rarely required. |
| WHO PROVIDED | Geriatrician or geriatrics advanced practice nurse, a physical therapist, a dietitian and a medical social worker |
| HOW | Face‐to‐face on‐site |
| WHERE | 2 dementia‐specific assisted living facilities in Connecticut, USA |
| WHEN AND HOW MUCH | Independent assessment occurred at Days 7, 30, 120 and 320 after admission. The timing of the assessments lies in the Connecticut Department of Public Health regulations requiring a plan of care within 7 days of admission and repeated at least once every 3 months. |
| TAILORING | Tailoring is not explicitly described, however it was implicitly part of the intervention, e.g. individual patient assessment with personalised recommendations. |
| MODIFICATIONS | No changes to intervention are reported |
| HOW WELL (planned) | It is not reported whether adherence was explicitly studied |
| HOW WELL (actual) | Not reported |
| Details of any co‐interventions | No co‐interventions reported |
PCP: primary care physician; ED ‐ emergency department
Brodaty 2003
Arm 1: Multidisciplinary psychogeriatric case management
| Study ID | Brodaty 2003 |
| WHY | Combination of psychosocial, social and pharmacological treatment by a multidisciplinary team was expected to improve care provided |
| WHAT (materials) | Individual treatment plans were developed by a multidisciplinary team (details not provided) |
| WHAT (procedures) | The treatments were supervised by 2 geriatric psychiatrists and administered by a multidisciplinary team, including a senior registrar in psychogeriatrics, a psychologist experienced in aged care and a registered nurse experienced in NH care. Case managers were allocated to individual residents, and treatment plans were sent to NHs and GPs at the commencement of treatment. Liaison with a resident’s GP occurred when pathology investigations or further general medical assessment were required. Psychosocial interventions for depression (4–8 hours over 12 weeks) included the case manager providing individual supportive therapy to the resident and encouragement to participate more in pleasurable activities. Interventions for psychosis included nurse education on management of psychosis and, where possible, treatment of sensory impairments. In both groups, residents were encouraged to participate more in general activities, families were prompted to participate in the program, and behavioural management programs were developed to address specific behavioural disturbances. |
| WHO PROVIDED | Treatments were supervised by 2 geriatric psychiatrists and administered by a multidisciplinary team including a senior registrar in psychogeriatrics, a psychologist experienced in aged care and a registered nurse experienced in NH care. Case managers were allocated to individual residents. Case managers had clinical training (not administrative). |
| HOW | Face‐to‐face on‐site |
| WHERE | 11 NHs in eastern Sydney, Australia |
| WHEN AND HOW MUCH | Psychosocial interventions for depression (4 to 8 hours over 12 weeks) The prescriptive guidelines formulated for pharmacotherapy were as follows. Residents identified as requiring antidepressant medication were prescribed a short‐acting selective serotonin reuptake inhibitor (SSRI)—either paroxetine, 20 mg/day, or sertraline, 50 mg/day, with options to increase the dose for nonresponders stepwise to 1.5 times that dose by week 4 or twice the dose by week 8. Depressed residents who were already on SSRI treatment had the dose of medication increased or were switched to an alternative SSRI in addition to psychosocial management. Residents identified as requiring antipsychotic medication, i.e. those for whom psychosis was causing distress or contributing to behavioural disturbance, were prescribed haloperidol. Haloperidol treatment was commenced at 0.5 mg/day and increased in 0.5 mg steps, titrated according to response and side effects to a maximum of 3 mg/day. Psychotic residents already on treatment with an antipsychotic had the dose of their medication increased. |
| TAILORING | Individual care plans were composed (as part of the intervention itself) |
| MODIFICATIONS | No changes to intervention are reported |
| HOW WELL (planned) | It is not reported whether adherence was explicitly studied |
| HOW WELL (actual) | Not reported |
| Details of any co‐interventions | In both intervention groups, residents were encouraged to participate more in general activities, families were prompted to participate in the programme and behavioural management programmes were developed to address specific behavioural disturbances. |
GP: general practitioner; NH: nursing home; PCP: primary care physician
Brodaty 2003
Arm 2: Multidisciplinary team assessment with resulting treatment plan provided to a GP with an on‐demand specialist psychogeriatric consultation
| Study ID | Brodaty 2003 |
| WHY | Management plan and better co‐ordination of care between NH staff and GP with multidisciplinary team was expected to improve care |
| WHAT (materials) | Management plan composed for each resident (details not provided) |
| WHAT (procedures) | Management plans were provided in writing to the NH staff and to the resident’s GP. The project team was available to provide further consultation on request from nursing staff or a GP during the 12‐week treatment phase. This style of service provision represented current practice in NHs with access to psychogeriatric services. |
| WHO PROVIDED | Multidisciplinary team provided care plan, and actual care to residents was provided by GP and NH staff. The project team was available to provide further consultation on request from nursing staff or a GP during the 12‐week treatment period. It is not clear who was on the project team. |
| HOW | Individual face‐to‐face on‐site |
| WHERE | 11 nursing homes in eastern Sydney, Australia |
| WHEN AND HOW MUCH | Overall duration 12 weeks Care plan was composed once; further details on doses and frequency are not provided |
| TAILORING | Individual care plans were composed (as part of the intervention itself) |
| MODIFICATIONS | No changes to intervention are reported |
| HOW WELL (planned) | It is not reported whether adherence was explicitly studied |
| HOW WELL (actual) | Not reported |
| Details of any co‐interventions | In both intervention groups, residents were encouraged to participate more in general activities, families were prompted to participate in the programme and behavioural management programmes were developed to address specific behavioural disturbances. |
GP: general practitioner; NH: nursing home
Chapman 2007
| Study ID | Chapman 2007 |
| WHY | Interdisciplinary care teams improve comfort, care and well‐being of NH residents with advanced dementia |
| WHAT (materials) | No specific materials reported |
| WHAT (procedures) | AICTs used a holistic approach that addressed 4 domains of care: (i) Medical issues: A review was made of each resident’s medical conditions, level of physical pain and medications (including psychotropic medications). A care plan was developed and implemented with the assistance of the AICT team physician and the nursing staff. The intervention plans in the medical domain included a special focus on pain management and the reduction or elimination of antipsychotic medications that can exacerbate dementia symptoms. (ii) Meaningful activity issues: The AICTs reviewed the activity programme of each participating resident and identified new activities to maintain and enhance engagement. Activities were individualised by focusing on the predementia and current interests of residents and by talking with family members about residents’ hobbies, work‐related interests and any other preferences that may not have been known by staff. (iii) Psychological issues: Residents’ mental health problems and symptoms were reviewed, as well as any emotional and family dynamic issues. On the basis of this review, a care plan was developed and implemented. (iv) Behavioural concerns: A review was made of agitation and other behavioural problems such as apathy that often affect residential ACF residents with dementia. Residents’ behaviour was monitored in the first two AICT meetings. Care plans were developed and implemented in conjunction with input from nurse’s aides and other direct care staff. |
| WHO PROVIDED | AICTs consisted of staff working in each of the participating units at the two NHs. Team members included those from the disciplines of medicine, nursing, social work, psychology, physical and occupational therapy, and nutrition. Residents and their families were invited to participate in a planning meeting and a final meeting of each AICT that occurred during week 3 and week 8 of the intervention period. |
| HOW | Face‐to‐face on‐site |
| WHERE | 2 NHs in the northeastern USA |
| WHEN AND HOW MUCH | Each AICT met five times (weeks 1, 2, 3, 5 and 8) during the 8‐week intervention period. Residents and their families were invited to participate in a planning meeting and a final meeting of each AICT that occurred during week 3 and week 8 of the intervention period. |
| TAILORING | Each resident's care plan was tailored to his/her needs |
| MODIFICATIONS | No changes to intervention are reported |
| HOW WELL (planned) | Study authors, both experienced and licensed clinical social workers, provided in‐person or telephone consultation to the AICTs during meetings and conducted treatment fidelity checks. Further details not reported. No further details regarding intervention fidelity/adherence. |
| HOW WELL (actual) | Not reported |
| Details of any co‐interventions | Both of the participating homes thoroughly addressed the advance care planning needs of each resident during the admission and care planning process and updated plans on a regular basis. |
ACF: residential care facility; AICT: advanced illness care team; NH: nursing home
Crotty 2004
| Study ID | Crotty 2004 |
| WHY | The management of patients in residential aged care is often challenging owing to the presence of complex disability, chronic conditions and polypharmacy. The prevalence of behavioural problems is high with up to 82% of NH residents demonstrating activity disturbances or aggression, and pain is common. Psychotropic drugs are often used, which compounds the risk of falls, hip fractures and further functional decline in this at‐risk frail patient group. Evidence from Canada suggests that 40% of residents in aged care facilities are on at least one inappropriate drug with 10% receiving two or more inappropriate medication orders concurrently. The risk of having inappropriate medications increases with the number of residents in the facility and is more likely for female residents. There is limited available evidence concerning strategies to improve the pharmacological management of patients with behavioural problems. It is believed that multidisciplinary case conferences involving GP, geriatrician, pharmacist and residential ACFs staff could improve management of challenging behaviour and optimise medication use. |
| WHAT (materials) | No specific materials reported |
| WHAT (procedures) | GPs were advised that facility staff had nominated their patient for the study and they were invited to attend 2 multidisciplinary case conferences conducted 6 to 12 weeks apart. The times of the case conference were negotiated around the GP needs. The resident’s GP, a geriatrician, a pharmacist, residential care staff and a representative of the Alzheimer’s Association of South Australia attended the case conferences, which were held at the facility. Residential care staff expanded on any issues in the case notes that required discussion and the Alzheimer’s Association of South Australia representative discussed non‐pharmacological management of dementia‐related behaviour. Each case conference was chaired by the GP, who used their medical records in addition to case notes from the facility. A problem list was developed by the GP in conjunction with the care staff and a medication review was conducted prior to each case conference. |
| WHO PROVIDED | Outreach geriatric team (a geriatrician, a pharmacist and a representative of the Alzheimer’s Association of South Australia) plus resident’s GP and residential care staff attended the case conferences |
| HOW | Multidisciplinary case conferences |
| WHERE | 10 NHs in southern Adelaide, Australia |
| WHEN AND HOW MUCH | Two case conferences were conducted 6 to 12 weeks apart |
| TAILORING | GP and facility staff drew up a problem list and medication review prior to each case conference; so tailoring to the needs of each patient was part of the intervention. |
| MODIFICATIONS | No changes to intervention are reported |
| HOW WELL (planned) | It is not reported whether adherence was explicitly studied |
| HOW WELL (actual) | Twenty‐seven (93%) GPs agreed to participate in the first multidisciplinary case conference, with 26 GPs attending the second. |
| Details of any co‐interventions | All facilities in the study, including those in the control group, received a half‐day workshop provided by the Alzheimer’s Association of South Australia, which examined the use of a toolkit in the management of challenging behaviours. |
ACF: residential care facility; GP: general practitioner; NH: nursing home
Lin 2010
| Study ID | Lin 2010 |
| WHY | Prevalence of malnutrition is as high as 30% in institutionalised elderly people in Taiwan. Malnutrition is a major risk factor for all‐cause mortality in the elderly. Malnutrition in the elderly can lead to increased hospital length of stay, infections, poor wound healing, pressure sores, increased readmission rates, decreased cognitive function and increased medical expenditures. The best model of care to improve nutritional status remains controversial. Therefore, this study tested two different care models. |
| WHAT (materials) | Dietary suggestions and meal plans based on 3‐day dietary records (details not provided) |
| WHAT (procedures) | Team members visited residents every two weeks; dietician provided dietary suggestions with follow‐up every 2 weeks. Three‐day dietary records were used to evaluate dietary status and were sent to team members for further nutritional plans. |
| WHO PROVIDED | Multidisciplinary care‐team (including a medical doctor, nurse, dietitian and pharmacist) and study team members |
| HOW | Face‐to‐face individual sessions |
| WHERE | In the long‐term care facility |
| WHEN AND HOW MUCH | 6 months; team members visited residents every 2 weeks in each group. Dietitian gave each resident their dietary suggestions, with follow‐up every 2 weeks. |
| TAILORING | Tailoring is not explicitly reported, however it is implicitly part of the intervention itself, e.g. each resident received individual dietary suggestions. |
| MODIFICATIONS | None reported |
| HOW WELL (planned) | Not reported |
| HOW WELL (actual) | Not reported |
| Details of any co‐interventions | No co‐interventions reported |
Leontjevas 2013
| Study ID | Leontjevas 2013 |
| WHY | In view of the under‐recognition of depression in nursing homes, adequate depression management should include structural depression screening and diagnostic procedures (depression assessment). It was hypothesised that depression prevalence reduces in both dementia special‐care units and somatic nursing‐home units when standard care is transferred to a structural approach to depression management, including assessment procedures. |
| WHAT (materials) | No specific materials reported |
| WHAT (procedures) | For this trial, a multidisciplinary care programme, Act in Case of Depression (AiD), was developed that involves nursing staff, activity therapists, psychologists, and physicians. The programme has three components: structured assessment with two‐step screening and a diagnostic procedure; multidisciplinary treatment; and monitoring of treatment effects. AiD prescribes pathways for collaborative treatment, for which several treatment protocols can be used. Nursing‐home staff could use other evidence‐based protocols when deemed necessary, but were requested to follow the pathways for collaborative treatment including psychosocial interventions. The research team explained the programme in formal sessions and offered support to the nursing‐home staff. Depression assessment contains 3 elements:
For depression treatment, a collaborative approach is prescribed. Although the NH professionals can diverge from the AiD guidelines for a specific therapy, they should provide psychosocial interventions and consider a pharmacological treatment in accordance to the pathways. The AiD treatment pathways prescribe the use of 3 treatment modules by the multidisciplinary team:
Treatment is evaluated in multidisciplinary meetings of physician, psychologist and nursing staff. |
| WHO PROVIDED | Multidisciplinary team that involves nursing staff, activity therapists, psychologists and physicians |
| HOW | Face‐to‐face on‐site |
| WHERE | 12 nursing homes (33 units) across 4 provinces in the Netherlands |
| WHEN AND HOW MUCH | The quantity of treatment received was tailored to patients’ needs assessed during the screening phase. |
| TAILORING | Tailoring is not explicitly reported, however it is implicitly part of the intervention itself, e.g. multidisciplinary treatment of depression was tailored to patient’s needs and the severity of symptoms. |
| MODIFICATIONS | No changes to intervention are reported |
| HOW WELL (planned) | The extent to which the multidisciplinary teams adhered to AiD (0% to 100%) was conceptualised for each unit as the proportion of residents who should have received AiD components for whom nursing‐home staff did assessment procedures and used treatment pathways. A score of 0% for assessment adherence meant that no structural assessment was undertaken for any of the unit’s residents. A score of 0% for treatment adherence meant that psychosocial treatment was not provided when prescribed and pharmacological treatment was not started or changed or monitored according to the AiD protocol when provided in usual care. The research team assigned scores on the basis of residents’ medical records and information from structured phone interviews with physicians, psychologists and unit managers. Uncertainties were clarified in additional interviews with the nursing home staff. |
| HOW WELL (actual) | Overall, mean adherence to depression assessment (76% (SD 18%)) across all units for all time points was higher than adherence to treatment pathways (40% (36%); P = 0.0005). Adherence to assessment was lower in dementia units (69% (19%)) than in somatic units (82% (15%); P = 0.045). Use of treatment pathways did not differ between dementia units (43% (SD 33%)) and somatic units (38% (40%); P = 0.745). Adherence to assessment (P = 0.394) and treatment (P = 0.729) did not differ between groups. |
| Details of any co‐interventions | No co‐interventions reported |
NH: nursing home
McSweeney 2012
| Study ID | McSweeney 2012 |
| WHY | The study hypothesised that individualised psychosocial care plan and appropriate medication may improve care of aged care residents with major depression (depression and dementia) |
| WHAT (materials) | Consultation by psychiatrist and psychologist regarding best‐practice management of depression to facility staff and GP (not reported whether specific materials were used); individually tailored, psychosocial care plan and medication care plan (details not provided). |
| WHAT (procedures) | A. Pre‐intervention screening B. Intervention Psychosocial component (psychologist liaised with care staff and family, and developed an individually tailored, psychosocial care plan): 4 to 6 suggested interventions (e.g. participation in facility lifestyle programmes, one‐on‐one supportive listening and reminiscence, increasing time spent in common areas, sensory stimulation activities etc.), instructions to attempt at least one intervention per day. Recommendations based on staffing resources (simple interventions easily implemented by nursing and care staff). Medical component (liaising with facility staff, a consultant psychiatrist wrote to treating GPs): start antidepressants (SSRI citalopram, start 10 mg); increase dose or switch drug (SNRI venlafaxine 37.5 mg) depending on response. C. Mid‐intervention reviews (2): first scheduled 1 month after the release of the care plan, which typically occurred within 2 weeks of the pre‐intervention assessment; feedback on the effectiveness of care plans, make adjustments if required; re‐administration of the CSDD by a psychologist and recording any changes in health status or medication regimes; second review scheduled for 1 month after the initial review. D. Post‐intervention screening: scheduled for approximately 15 weeks following the pre‐intervention assessment; conducted by a psychologist blind to study condition. Again, assessments conducted within 2 weeks of the due date were considered valid. The post‐intervention assessment comprised readministration of the CSDD, diagnostic assessment and supplementary measures. Families were also interviewed by the outcome assessor where possible. |
| WHO PROVIDED | Psychiatrist, psychologist, nursing staff, GP |
| HOW | Face‐to‐face on‐site |
| WHERE | 20 residential ACFs in Melbourne, Australia |
| WHEN AND HOW MUCH | Each care plan included 4 to 6 suggested psychosocial components (interventions), with instructions to attempt at least one intervention per day, information evaluation was conducted weekly, formal evaluation once mid‐intervention. Medication: at the study’s commencement, it was considered that if a resident was not taking an antidepressant, a trial of the SSRI citalopram would be recommended, at a starting dose of 10 mg. This was to be increased in increments of 10 mg every 2 weeks (depending on response) to a maximum of 40 mg. If the resident’s mood had not improved significantly within 2 weeks of the maximum dose being reached, a switch to the SNRI venlafaxine was to be recommended (following a 2‐week tapering and washout period). Venlafaxine was to commence at a starting dose of 37.5 mg and increased in increments of 37.5 mg every 2 weeks to a maximum dose of 150 mg. |
| TAILORING | Individualised psychosocial care plan; recommended interventions based on staff resources; individualised medication plan based on response and prior adverse events reported by GP. |
| MODIFICATIONS | No changes to intervention are reported |
| HOW WELL (planned) | Psychosocial care plans given to Nursing Unit Managers and Lifestyle Program/Activities staff with daily record sheet, to be completed for the first month. Staff were asked to note the intervention used on a particular day and to add a comment about the efficacy of the intervention. A brief informal review of intervention efficacy was conducted weekly during the first month following the release of the plan, and staff members were invited to contact the research team as needed. |
| HOW WELL (actual) | Psychosocial interventions: Records indicated that a regular attempt at implementing at least one of the recommended psychosocial interventions occurred in 16 of the 19 cases (84%). Only in 7 of the 19 (37%) cases could the attempt to implement the psychosocial intervention plan be described as thorough and frequent. For 3 of the 19 cases (16%), whether an attempt was made to implement any of the plan’s components could not be determined. Medication: a recommendation for increase in dosage of current antidepressant was made in 3 of the 19 cases, commencement of antidepressant in 4 cases and switch of antidepressant class in 7 cases. No recommendation was made in 5 cases. GPs implemented 7 of the 14 recommendations (50%) during the course of the study. At the outcome assessment, 59% of the intervention group had a change in their antidepressant treatment strategy, compared with only 19% of the control group (Fisher’s exact test, P = 0.02). |
| Details of any co‐interventions | No co‐interventions reported |
ACF: residential care facility; GP: general practitioner
Neyens 2009
| Study ID | Neyens 2009 |
| WHY | Research indicates that multifactorial interventions to prevent fall incidents can have positive effects. |
| WHAT (materials) | No specific materials reported |
| WHAT (procedures) | The intervention programme consisted of a general medical assessment focusing on fall risks, and an additional specific fall risk evaluation tool assessing fall history, medication intake, mobility and the use of assistive and protective aids. The total fall risk assessment resulted in general fall prevention activities or individually tailored fall prevention interventions for each patient. Each intervention ward installed a multidisciplinary fall prevention team, consisting of routine staff: a nursing home physician, 2 nurses, a physiotherapist and an occupational therapist. These teams co‐ordinated the intervention programme during fortnightly fall prevention conferences. They discussed each patient at admission, after a fall, at request of professionals on the ward and in any case at least twice a year, even if there had been no fall incident or request. General medical assessments were performed by medical staff when a patient was admitted or when there was a change in medical condition. The fall prevention teams carried out the fall risk evaluation tool of each patient, they discussed its outcome in conjunction with the findings of the general medical assessment and they decided which individual fall prevention activities were necessary. Then they, or colleagues, executed these specific fall prevention activities, which could include any or all of the following: anticipating the circumstances and causes of falls, critically reviewing and monitoring medication intake (type, number, dose and time of intake), individually designed exercise programmes, carefully (re)assessing the need for assistive and protective aids, and promoting the correct use of these aids. Overall, the occupational therapist screened the main areas of each ward using a checklist for environmental hazards. Besides specific fall prevention activities, the team could also implement general fall prevention activities, such as staff training and education. |
| WHO PROVIDED | Multidisciplinary fall prevention team, consisting of routine staff: a nursing home physician, 2 nurses, a physiotherapist and an occupational therapist. |
| HOW | Face‐to‐face on‐site |
| WHERE | 12 nursing homes in the Netherlands |
| WHEN AND HOW MUCH | The team discussed each patient at admission, after a fall, at request of professionals on the ward and in any case at least twice a year, even if there had been no fall incident or request. General medical assessments were performed by medical staff when a patient was admitted or when there was a change in medical condition. The time they or colleagues spent implementing fall prevention activities would vary based on what the team decided was necessary. |
| TAILORING | Tailoring is not explicitly described, however it is implicitly part of the intervention. |
| MODIFICATIONS | No changes to intervention are reported |
| HOW WELL (planned) | It is not reported whether adherence was explicitly studied |
| HOW WELL (actual) | Not reported |
| Details of any co‐interventions | No co‐interventions reported |
Temkin‐Greener 2018
| Study ID | Temkin‐Greener 2018 |
| WHY | The 2014 Institute of Medicine report recommended that healthcare providers caring for individuals with advanced illness have basic palliative care competencies in communication, inter‐professional collaboration and symptom management. These competency goals are hypothesised to improve the quality of care processes and outcomes for residents at the end of life. |
| WHAT (materials) | No specific materials were provided to patients. Staff were provided with NH‐specific palliative care guidelines and standards of practice for palliative care teams (pertaining to palliative care teams structure and operations), a case‐finding tool for identifying and prioritising those residents who may benefit most from palliative care team services, a template providing suggestions for structuring palliative care team operational guidelines, and a self‐rating tool for team members to assess their own strengths and weaknesses was made available to all treatment facilities (details not provided). |
| WHAT (procedures) | Staff/team training: 2 training‐education intervention components provided concurrently to each facility over a period of 4 weeks. Training dates were staggered for each NH, starting in October of 2013 and ending in August of 2014. TeamSTEPPS for Long‐Term Care: team‐specific knowledge, skills and attitudes that facilitate communication and co‐ordination of care necessary for proper assessment of residents' care needs and the delivery of quality care; 4 teachable‐learnable skills: leadership, communication, mutual support and situation monitoring, which support and enhance teams' ability to deliver safe, appropriate and high‐quality care; on average, between 5 and 12 staff per facility attended TeamSTEPPS training (at some training sessions as few as 4 staff were present). There was no apparent relationship between team attendance and facility size. ELNEC training and sustainability: End‐of‐life Nursing Education (ELNEC) geriatric curriculum (adapted specifically to fit the needs of the NH environment, targeting nurses and social workers with most of the modules providing supplementary sections and material specifically designed for the CNAs) to train direct care staff in the treatment facilities, including those who were to serve on the palliative care teams; 6 ELNEC‐geriatric training modules, focused on principles of palliative care, pain assessment and management, non‐pain symptom management, preparation for and care at the time of death, communication and bereavement, were provided to all palliative care team members. All of these workshops were taught by the study nurse interventionist who is a geriatric nurse practitioner certified in ELNEC‐geriatric content with significant NH practice experience. Participation rates in the ELNEC training varied across facilities. In the largest home (> 400 beds) 38 people attended on average, while in smaller homes (< 150 beds) the attendance ranged from 12 to 20. With the exception of 2 facilities, attendance at all 6 sessions was fairly constant across NHs. There was free online access to ELNEC modules for all of their staff for 3 years. At the moment of publication, only 5 of the 14 intervention homes have taken advantage of this continuing training, and module completion rates have been very modest in any given facility. Free access to the educational modules was also recently made available (after the intervention was completed) to the control homes. Active intervention phase (PCTeam activation and rounding; 2 months): facilities were to fully activate the palliative care practice guidelines developed earlier and round with the study nurse interventionist to identify and address any unmet palliative care needs. Passive phase (10 months): NHs continued to round without the active input of the study nurse interventionist. |
| WHO PROVIDED | NHs were not required to include specific disciplines in their PCTeams. All facilities included nursing and social work staff on their teams. Fewer than 50% of the treatment homes actually included CNAs as team members. Advanced clinical staff such as nurse practitioners or physician assistants (28.6%), or physicians (7.1%) were included. |
| HOW | Training: face‐to‐face group workshops and online afterwards. Care to residents was provided face‐to‐face on‐site. |
| WHERE | 14 NHs in USA |
| WHEN AND HOW MUCH | 4 weeks staff training; 2 months activation of PCTeams and rounding with study nurse interventionist; 10 months PCTeams and rounding without study nurse interventionist |
| TAILORING | Tailoring of care to individual needs was part of the intervention |
| MODIFICATIONS | No changes to intervention are reported |
| HOW WELL (planned) | Authors conducted rapid ethnographic assessments in all treatment facilities. These rapid ethnographic assessments were in‐depth interviews, with administrators and PCTeam staff, and were designed to complement other data in helping the authors to understand barriers and challenges in implementing and sustaining the intervention. |
| HOW WELL (actual) | Only 6 of the 14 facilities had consistently working PCTeams throughout the study period; at the end of second study year, only 9/14 intervention facilities completed the active intervention phase and only 6/14 completed both intervention phases within this originally expected time frame. The 5/14 remaining facilities experienced significant delays between the end of their TeamSTEPPS and ELNEC training and the start of the active intervention. |
| Details of any co‐interventions | No co‐interventions reported |
ACF: residential care facility; GP: general practitioner
Zwijsen 2014
| Study ID | Zwijsen 2014 |
| WHY | The Grip on Challenging Behaviour care program was developed using the current guidelines and models on challenging behaviour in dementia. It structures the process of detection, analysis, treatment and evaluation of the treatment of challenging behaviour and pre‐arranges multidisciplinary consultation. The care programme provides tools for multidisciplinary care teams that help them in taking the right steps and asking the right questions to identify and, if possible, treat the underlying problem of the challenging behaviour. |
| WHAT (materials) | Screening tool to detect signs of challenging behaviour (details not provided), structured analysis form (details not provided) |
| WHAT (procedures) | Care staff detected challenging behaviour in daily care after which they commenced using the structured analysis form (as described below). To ensure that no signs of challenging behaviour were missed during daily observations, every 6 months (prior to the standard multidisciplinary meeting about the resident, which is compulsory in The Netherlands), the units’ care staff filled in a screening tool to detect signs of challenging behaviour that they did not already address spontaneously. If signs of challenging behaviour were detected (either in daily care or by using the screening tool), a structured analysis form was used by the care staff. This form could also be used whenever signs of challenging behaviour were detected in daily care. Following this, the unit psychologist or the unit elderly care physician was called in to undertake further analysis. Both the physician and the psychologist had their own analysis form, based on and structured by the explanatory models of challenging behaviour and national guidelines. After the analysis was completed, the treatment goal, the outline of the treatment plan and an evaluation date ‐ all defined in a multidisciplinary meeting with the involved disciplines ‐ were filled‐in on the treatment form. At the predetermined evaluation date, a multidisciplinary evaluation took place by using a flowchart on the evaluation form. A full day of training was organised on the unit before the Grip on Challenging Behaviour care program was implemented on a DSCU. The training was split‐up into 2 sessions: 1 kick‐off meeting in which the care program was introduced and 1 follow‐up meeting 2 weeks after the care programme was implemented on the unit. In the training session, several models regarding challenging behaviour were discussed and used to explain different forms of behaviour, such as the unmet‐needs model, the model of progressive lowered stress threshold, and the adaptation‐coping model. Care teams were encouraged to think about their own residents and the behaviour of their residents in light of these models. Part of the training was also focused on the negative consequences of using psychoactive medication and on the alternatives to medication, in particular psychosocial interventions. |
| WHO PROVIDED | Nurses, psychologists and elderly care physicians developed the programme Care was provided by 'care staff', physician and psychologist |
| HOW | Face‐to‐face on‐site |
| WHERE | 17 NHs in the Netherlands |
| WHEN AND HOW MUCH | Structured analyses daily Every 6 months, fill in screening tool to detect signs of challenging behaviour One full day of training prior to implementation of the programme at the NH (1 kick‐off meeting and one follow‐up meeting 2 weeks later) |
| TAILORING | Tailoring of care to individual needs was part of the intervention |
| MODIFICATIONS | No changes to intervention are reported |
| HOW WELL (planned) | After the last assessment, a questionnaire about the degree of implementation of the care programme was distributed amongst the unit leader, the psychologist and the physician of the DSCUs. These key persons rated the percentage of cases with challenging behaviour they were currently treating by means of the care programme. When a DSCU consistently scored above average compared with the other DSCUs, they were categorised as ‘good implementation (score = 3),’ and when a DSCU consistently scored below average they were categorised as ‘poor implementation (score = 1).’ DSCUs scoring variably were categorised as ‘moderate implementation (score = 2).’ |
| HOW WELL (actual) | Five of the units consistently scored above average on the implementation questionnaire (good implementation; score = 3). Eight units scored moderately on the implementation (score = 2). Three units scored consistently below average (bad implementation; score = 1). The last unit, which moved to another location after T3, had not as yet implemented the care program. All but 1 care staff member (N = 16) believed the introduction of the care programme was necessary and judged the design of the care programme to be good, and, therefore, no analyses were possible on these data. There were differences in the care staff rating as to whether they believed the care programme would be able to decrease challenging behaviour on the unit. Twelve care staff members scored a rate of 6 or higher on this question (range 1 to 10; 12 care staff members scoring the CMAI of 45 residents) and 4 care staff members rated 5 or lower (4 care staff members scoring the CMAI of 22 residents). No significant differences were found in the CMAI scoring between these 2 groups (mean difference = 3 points, t (65) = 0.55, P = 0.59). The analyses of CMAI scoring by staff care members actively involved in the care programme and by care staff members who did not participate in the training of the care programme (N = 240 residents; 56 actively involved care staff members, 33 care staff members not involved) showed high correlation between raters (r > 0.70) and on both time points a non‐significant difference of 1 point between raters (t (69) = ‐0.446, P = 0.657, on T1 and t (169) = 1213, P = 0.227 on T2). |
| Details of any co‐interventions | No co‐interventions reported |
NH: nursing home; DSCU: dementia special care unit; CMAI: Cohen‐Mansfield Agitation Inventory
Stern 2014
| Study ID | Stern 2014 |
| WHY | Involving trained experts in care can increase staff awareness and skills about wound care and prevention. Telehealth reduces the need for physical transport of patients to expert teams. |
| WHAT (materials) | No specific materials reported |
| WHAT (procedures) | Phase 1: training of LTC staff by Advanced Practice Nurse (APN); Phase 2: remote support of the facility Wound Care Lead by the APN via email and telephone, with APN visiting the facility when necessary |
| WHO PROVIDED | Enhanced multidisciplinary team (EMDT) consisted of APNs (highly qualified; 3 months, 1 day/week in LTC; remainder of time support LTC wound care team from hospital) Expert wound care team (hospital‐based, remote support) consisted of NP, chiropodist, occupational therapist and plastic surgeon, plus additional experts as needed In LTC: wound care lead (registered nurse, registered practical nurse, personal support workers) |
| HOW | Phase 1: educational, mentoring individual, face‐to‐face Phase 2: remote support ICT (email, telephone) |
| WHERE | Phase 1: in LTC and referral to remote support from hospital‐based expert team Phase 2: remote support from hospital‐based expert team |
| WHEN AND HOW MUCH | Phase 1 was 3 months in length in each facility, phase 2 was 1 to 11 months in length. The wound care lead was to assess PUs, complete assessment and treatment forms, take digital photos, and transmit de‐identified data via email to the APNs every 2 weeks. APNs reviewed cases with the wound care lead via telephone and email, reviewing referral criteria with them, and consulting with the expert team accordingly. APNs would visit the facility when necessary or if requested to do so by the facility wound care lead. This process was repeated every 2 weeks for all PUs until healed, or until the end of the study period, whichever came first. |
| TAILORING | No tailoring reported |
| MODIFICATIONS | No changes to intervention are reported |
| HOW WELL (planned) | It is not reported whether adherence was explicitly studied |
| HOW WELL (actual) | Thirty‐seven of the 137 residents (27%) met the criteria for referral to the expert team. Twenty‐five of the 37 residents (68%) were actually referred to the team, with a total of 28 consultations. Twelve of the 37 residents (32%) were not referred to the EMDT despite meeting referral criteria; 2 of the 12 not referred to the EMDT were seen by specialists situated in hospitals adjacent to the LTC facilities, one APN felt facility lack of adherence to treatment recommendations made referrals for 4 residents futile, while no reason was cited for non‐referral of 6 residents. The NP attended all consultations, the chiropodist attended 16 (57%), the OT attended 13 (46%), the plastic surgeon attended 3 (11%), and an orthopaedic surgeon attended 1. A recommendation for change in treatment resulted from 7 of the 28 consultations (25%). Most consultations occurred by email followed by a telephone call (n = 25, 89%). Two consultations were face‐to‐face at the hospital‐based wound clinic, and 1 consultation occurred remotely via video‐link. |
| Details of any co‐interventions | No co‐interventions reported |
APN: advanced practice nurse; LTC: long‐term care; NP: nurse practitioner; OT: occupation therapist; PU: pressure ulcer
Wu 2010
| Study ID | Wu 2010 |
| WHY | The demands of LTCF residents are complex and often consist of a combination of medical, physical, psychological and social needs, which usually require a range of professionals and caregivers to provide treatment and care. However, in the current healthcare system, decentralisation and specialisation has resulted in fragmentation of patient care and loss of coherence between different health care professionals and caregivers. To reduce this fragmentation of care, integrated care models are developed in the modern healthcare system, and a gradual change from traditional LTCF care (supplier‐oriented, fragmentation and less coherence in the care) to integrated care (demand‐oriented, co‐operated and co‐ordinated provision of services) has occurred in many countries. In integrated care, members of each discipline have to actively work across the boundaries of their own profession and share parts of their disciplinary domain with other members. Therefore, the quality of their work should be guaranteed and improved (i.e. autonomy, communication and co‐operation). Various advantages of integrated care have been described, including greater efficiency and effectiveness, less duplication and waste, a more flexible service provision and better co‐ordination and continuity, improved quality of care and patient satisfaction, a more holistic and personalised approach of patients, more cost‐effectiveness, reduction of length of hospital stay and reduction in inappropriate hospitalisation. |
| WHAT (materials) | No specific materials reported |
| WHAT (procedures) | In this integrated care model, the team members actively visited the LTCF residents on a monthly basis as well as having the monthly interdisciplinary team meeting with the staff of the LTCF. |
| WHO PROVIDED | The interdisciplinary team is composed of a geriatrician, nurses, physical therapists, dietitians and social workers, which is supported by a municipal hospital. |
| HOW | Face‐to‐face on‐site visits to residents by the team as well as monthly interdisciplinary team meetings with the staff of the LTCF |
| WHERE | 7 LTCFs in northern Taipei, Taiwan |
| WHEN AND HOW MUCH | 12 months, monthly visits to residents and monthly interdisciplinary meetings |
| TAILORING | Tailoring is not explicitly reported, however it is implicitly part of the intervention itself, e.g. focus on person‐centred care. |
| MODIFICATIONS | No changes to intervention are reported |
| HOW WELL (planned) | It is not reported whether adherence was explicitly studied |
| HOW WELL (actual) | Not reported |
| Details of any co‐interventions | All residents in both models were provided skilled nursing intervention (e.g. feeding tube replacement, urinary catheter replacement, wound care instructions and so on), periodical functional status evaluation, nutrional status assessment and medical services if in need. Nutrional status assessment included serial anthropometrical measurements, laboratory tests and 7‐day diet diary. All particiants in both groups received physical function assessment (Barthel index) and nutritional assessments (mini nutrition assessment, MNA) every other month. |
LTCF: long‐term care facility
Crotty 2019
| Study ID | Crotty 2019 |
| WHY | Hip fractures are a common cause of suffering for residents of nursing care facilities and outcomes are poor. Most residents have dementia and are frail. In a retrospective cohort study of 60,111 US Medicare beneficiaries living in NHs, only 1 in 5 patients who had been fully independent or required limited supervision/assistance walking at baseline survived to regain their pre‐fracture level of walking 180 days after fracture. Guidelines for hip fracture management promote prompt surgery, early mobilisation and a team‐based rehabilitation approach to restoring function and mobility. The high risk of death and adverse outcomes means there is uncertainty about the benefits of health service resources allocated to rehabilitation in people living in nursing care facilities. |
| WHAT (materials) | No specific materials reported |
| WHAT (procedures) | Participants of the intervention group received visits from a hospital outreach team who provided a Comprehensive Geriatrics Assessment, physiotherapy and nutritional assessment and care plan. Physiotherapy included mobility and task specific training, graduated muscle strengthening exercises and training of care staff and family. The geriatrician met families within a fortnight to discuss progress. |
| WHO PROVIDED | A hospital outreach team: All the therapists who provided intervention to the trial participants worked as part of the home rehabilitation team of a major rehabilitation hospital. The 3‐ key disciplines involved were medical (geriatrician and ortho‐geriatric registrars), physiotherapy (with assistance as required from therapy assistants) and dietetics. Other disciplines referred to as necessary included rehabilitation nursing and speech pathology. |
| HOW | Face‐to‐face on‐site |
| WHERE | 76 nursing care facilities in South Australia |
| WHEN AND HOW MUCH | Participants allocated to the in‐reach rehabilitation received a median of 13 hours of rehabilitation in total over 4 weeks, excluding travel time. Nursing care facility residents were seen on the day of discharge or the following day in the NH by the in‐reach physiotherapist and received a median of 14 visits and 10.75 hours of therapy over 4 weeks. Each in‐reach participant was visited at the NCF within 48 working hours of their return home by the ortho‐geriatric registrar. The registrar undertook a health review focusing on medications, pain and comorbidities. In addition, a formal meeting with families was held with the geriatrician within the first fortnight to discuss progress, provide education and to discuss end of life planning if required. When malnutrition was identified as an issue using a validated screening tool, the dietician would attend the NH within the first 48 hours. |
| TAILORING | Interventions were adapted to not only each patient according to their clinical needs, but also each facility according to their culture, beliefs and health and safety guidelines. |
| MODIFICATIONS | No changes to intervention are reported |
| HOW WELL (planned) | It is not reported whether adherence was explicitly studied |
| HOW WELL (actual) | Patient adherence was high with all participants only missing a median of 1 physiotherapy session (range 0 to 7). |
| Details of any co‐interventions | No co‐interventions reported |
NH: nursing home; NCF: nursing care facility
Cordato 2018
| Study ID | Cordato 2018 |
| WHY | A key contributor identified for hospitalisations, diminished quality of life, death, healthcare costs and other failings in care for NH patients is the relative paucity of medical input afforded to NH residents within their facility. Participation of the resident’s PCP has been suggested as a common factor in successful trials. It was hypothesised that implementation of the Regular Early Assessment Post‐Discharge (REAP) protocol would result in reduction in readmissions to hospital and emergency department episodes of care, which would be cost‐effective months post hospital discharge. |
| WHAT (materials) | No specific materials reported |
| WHAT (procedures) | Regular conjoint geriatrician and NP evaluations in the participant’s usual place of residence, for a period of 6 months (first NH visit within 1 week after discharge from screening hospital admission, and then monthly visits). If REAP participants were rehospitalised during the study intervention period, monthly conjoint NH visits resumed upon discharge from hospital. |
| WHO PROVIDED | REAP clinicians were 7 geriatricians and one NP + usual GP/PCP |
| HOW | Face‐to‐face on‐site Staggered conjoint visits, with the NP accompanying the designated geriatrician on every study visit. The same clinician conducted each assessment on his or her allocated REAP intervention participant(s) for the duration of the participant’s study involvement for all but 2 participants. The REAP clinicians were instructed to assess directly, through interview and examination, the intervention participant(s) on each NH visit and to review other available data, including NH and hospital medical records as well as baseline standardised study measures of cognition, medication use and quality of life recorded by the independent blinded study rater. It was left to the discretion of the REAP clinician to recommend or arrange appropriate investigations and treatments including intravenous cannulation, administration of intravenous fluids or antibiotics or hospitalisation, in concert with the participant’s usual treating GP and NH staff. |
| WHERE | 21 NHs in New South Wales, Australia |
| WHEN AND HOW MUCH | First NH visit within 1 week after discharge from screening hospital admission, and then monthly visits if REAP participants were rehospitalised during the study intervention period; monthly conjoint NH visits resumed upon discharge from hospital. |
| TAILORING | Tailoring is not explicitly reported, however it is implicitly part of the intervention itself. |
| MODIFICATIONS | No changes to intervention are reported |
| HOW WELL (planned) | It is not reported whether adherence was explicitly studied |
| HOW WELL (actual) | Not reported |
| Details of any co‐interventions | No co‐interventions reported |
GPs: general practitioners; NPs: nurse practitioners; NH: nursing home; PCP: Primary Care Physician; REAP: regular early assessment post‐discharge
Harvey 2014
| Study ID | Harvey 2014 |
| WHY | Provision of optimal medical care within the facility was expected to improve quality of life, increase opportunities to discuss advanced care planning and document advanced directives, promote greater consumer engagement in their care, and improve communication between residential ACF and acute care clinicians. It was anticipated that if these aims were achieved then emergency department attendances would also be decreased. |
| WHAT (materials) | No specific materials reported |
| WHAT (procedures) | All intervention group patients were reviewed in the residential ACF within 4 days of discharge. At the first visit, a comprehensive assessment and a tailored care plan were developed. Appropriate services were provided and patients were offered further visits for review of intercurrent illness if required. The service also provided education and support to RCF staff and the patients’ PCP. |
| WHO PROVIDED | The Residential Care Intervention Program in the Elderly (RECIPE) team comprised 2 part‐time geriatricians and an aged care nurse consultant. |
| HOW | Face‐to‐face on‐site |
| WHERE | Residential ACFs in outer metropolitan Melbourne, Australia |
| WHEN AND HOW MUCH | Once post‐discharge from hospital and then as needed until the end of the 6‐month follow‐up. Research team visited 3 times during the 6‐month follow‐up. All intervention group patients were reviewed in the residential ACF within 4 days of discharge. At the first visit, a comprehensive assessment and a tailored care plan were developed. Appropriate services were provided and patients were offered further visits for review of intercurrent illness if required. The service also provided education and support to residential ACF staff and the patients’ PCP. |
| TAILORING | Individual care plans were composed (as part of the intervention itself) |
| MODIFICATIONS | No changes to intervention are reported |
| HOW WELL (planned) | It is not reported whether adherence was explicitly studied |
| HOW WELL (actual) | Not reported |
| Details of any co‐interventions | No co‐interventions reported |
ACF: residential care facility; PCP: primary care physician
Agar 2017
| Study ID | Agar 2017 |
| WHY | Palliative care planning for nursing home (NH) residents with advanced dementia is often suboptimal and is often compromised by poor communication and limited staff expertise. Authors hypothesised that facilitated family case conferencing for residents with advanced dementia will achieve better family‐rated EOL outcomes as defined by: a) better symptom‐related comfort in the last 7 days of life; b) more effective symptom management over the last 90 days of life; c) greater family satisfaction with care over the last 90 days of the resident’s life. |
| WHAT (materials) | Materials for interactive training (35h) for (Palliative Care Planning Coordinator) PCPCs were based on a previous resource developed by members of the team for case conferencing in aged care more generally, recently adapted to meet the specific needs of residents with advanced dementia and their families (NSW Division of General Practice (MNCDGP)) |
| WHAT (procedures) | A Palliative Care Planning Coordinator (PCPC) was appointed at each NH and trained to work on the project in a funded capacity. PCPC training: 1 week (35 h) interactive training during which they will be provided with materials and tuition on the principles of person‐centred palliative care for people with dementia as well as the organisation, conduct and documentation of case conferences and person‐centred care plans. Training was run by a multidisciplinary team including physicians, nurses and consumers. It will make use of experiential learning as well as didactic approaches, and illustrate key learning objectives with case studies. PCPC training will focus on how the intervention might best be adapted to local conditions at each nursing home and integrated within existing initiatives. Following training, PCPCs were supported on an ongoing basis by means of bi‐weekly teleconferences aimed at building peer support and group learning via a community of practice, as well as individual telephone support and site visits from the project team as required. PCPCs will be trained to: 1) use evidence‐based ‘triggers’ to identify residents with advanced dementia at a time point likely to benefit from a case conference; 2) organise, set an agenda, facilitate and document case conferences with optimal involvement from family, multidisciplinary nursing home staff and external health professionals (e.g. GPs); 3) develop and oversee implementation of palliative care plans; and 4) train other nursing home staff in person‐centred palliative care. |
| WHO PROVIDED | A Palliative Care Planning Coordinator (PCPC) appointed at each NH and trained to work on the project in a funded capacity for 16 h (0.4 full time equivalent) per week. PCPCs will be appointed from existing nursing staff at intervention nursing homes based on criteria relating to clinical training and expertise (typically a senior registered nurse), relationships with staff and identification by managers as a 'change champion' using established criteria. Facilitated case conferences will be guided by PCPCs with optimal involvement from family, multidisciplinary nursing home staff and external health professionals (e.g. GPs) |
| HOW | Face‐to‐face on‐site |
| WHERE | Nursing home |
| WHEN AND HOW MUCH | Facilitated case conferences were arranged according to identified needs of the residents (no further details provided) |
| TAILORING | Facilitated case conferences were tailored to identify residents' needs |
| MODIFICATIONS | No changes to intervention are reported |
| HOW WELL (planned) | Facility level dose was planned to be measured for 1) Extent to which PCPC able to work 2 days per week, 2) PCPC role diffused through RACF beyond PCPC, 3) PCPC reported manager to be supportive, 4) Evaluation by project team regarding extent that PCPCs were able to fulfil expectations and roles according to training/handbook Resident level dose was planned to be measured for 1) Number of case conferences, 2) Median number of professional carer disciplines other than RN and GP involved, 3) One or more case conference(s) attended by a GP? |
| HOW WELL (actual) | Fidelity to protocol (intervention 'dose') at the resident level was collected for use in per protocol analyses, but could not be measured as planned as many usual care (UC) nursing homes did not routinely collect detailed information about case conferences (e.g. triggers, attendance, issues discussed), and encouraging this data collection may have led to contamination. A simpler dose measure was used, namely whether or not participating residents received a case conference during their time in the study. Dose at the nursing home level consisted of 4 indicators concerning the extent to which PCPCs: 1) were able to work 2 days per week, 2) were supported by managers, 3) fulfilled expectations outlined in training, and 4) diffused their role among other staff. Each indicator was scored 0, 1 or 2, with 0 representing a lesser extent, 1 a moderate extent and 2 a large extent. |
| Details of any co‐interventions | No co‐interventions reported |
EOL: end of life; PCPC: Palliative Care Planning Coordinator; RACF: residential care facility
Forbat 2020
| Study ID | Forbat 2020 |
| WHY | Many residents will require specialist palliative care to manage complex symptoms to avoid hospitalisation at end of life. Yet there is limited robust evidence to support specific models of delivery in care homes, resulting in an urgent need to develop and test methods of improving the care of residents in their last months of life. |
| WHAT (materials) | No specific materials reported |
| WHAT (procedures) | The specialist palliative care intervention consisted of direct support (clinical work with residents) and indirect support in the form of ‘Needs Rounds’. Needs Rounds are monthly 60‐min triage meetings, where up to 10 residents who are at greatest risk of dying without a plan in place and who have a high symptom burden are discussed. Risk stratification and case‐finding was the theoretical model underpinning the intervention to promote equitable and efficient distribution of specialist palliative care services. Hence, care home staff were asked to prioritise residents for discussion in Needs Rounds who, for example, have been transferred from hospital while actively dying, or where staff would not be surprised if the resident died within 6 months. Needs rounds integrate case‐based education, with each resident’s bio‐psycho‐social status discussed to promote symptom management and identify opportunities to reinforce and extend staff knowledge. Discussion of residents at Needs Rounds frequently led to initiating case conferences (attended by the resident, GP, and care home staff), completion of advance care planning with resident input, management of current and anticipatory medicines, and identifying legally appointed alternate decision‐makers. Prior to commencement of the Needs Rounds, staff at each site were provided with a briefing regarding the aims of the model of care and practicalities of how it would function, including recommendations to develop a system for identifying residents to discuss. |
| WHO PROVIDED | Needs Rounds were run by specialist palliative care staff (two NPs and a clinical nurse consultant, who had access to advice from palliative medicine specialists for clinical decision making). All trial clinicians were based in the city’s specialist palliative care unit that provides outreach to care homes and provided the intervention face‐to‐face with care home staff. Care home staff attending Needs Rounds included registered nurses, enrolled nurses, nursing aides, activities co‐ordinators and managers. |
| HOW | Face‐to‐face on‐site |
| WHERE | 12 residential care homes in the Australian Capital Territory |
| WHEN AND HOW MUCH | Monthly 60 minute 'Needs Rounds' meetings. Other direct clinical work not specified. |
| TAILORING | Not explicitly reported. However, the following things would be individualised to each resident by nature of the intervention: case conferences (attended by the resident, GP and care home staff), completion of advance care planning with resident input, management of current and anticipatory medicines, and identifying legally appointed alternate decision‐makers. |
| MODIFICATIONS | No changes to intervention are reported |
| HOW WELL (planned) | The research team monitored all sites for fidelity to the intervention, grading them with a 3‐tier rating system, namely low, moderate and high fidelity. Fidelity was assessed by 3 methods. First, data were collected on the number of Needs Rounds offered and the proportion taken up. Second, a random sample of 20% of all audio recorded Needs Rounds were assessed for adherence to the Needs Rounds Checklist. Third, feedback from the specialist palliative care clinicians was assessed regarding site engagement with the intervention, for example, engagement in organising case conferences and uptake of actions following Needs Rounds. |
| HOW WELL (actual) | Of the 12 sites, 5 had high fidelity, 5 moderate and 2 had poor fidelity to the intervention procedures. |
| Details of any co‐interventions | No co‐interventions reported |
GP: general practitioner; NP: nurse practitioner
Lichtwarck 2018
| Study ID | Lichtwarck 2018 |
| WHY | Agitation in dementia is common and causes profound suffering for patients and caregivers. Because psychotropic drugs are associated with serious side effects, non‐pharmacological interventions are recommended as a first‐line approach. There is conflicting evidence about the effectiveness of non‐pharmacological interventions for agitation in patients with dementia. Trials of multicomponent interventions are requested. |
| WHAT (materials) | Lectures based on the ‘Targeted interdisciplinary model for evaluation and treatment of neuropsychiatric symptoms (TIME)’. Each staff member in the intervention NH will be provided with the TIME manual, which describes the intervention step by step. The TIME manual is available in Norwegian and English versions at www.tidmodell.no. Staff in the intervention group were also given access to an educational film about TIME and a website to support the intervention. |
| WHAT (procedures) | Intervention with TIME consists of three overlapping phases: a registration and assessment phase (duration 1 day to 4 weeks, depending on nature and burden of symptoms); a guided reflection phase, including one or more case conferences, with the goal to create a mutual understanding of the actual neuropsychiatric symptoms of the patient and to tailor a detailed treatment plan that will be tested in the next weeks (duration of case conference is approx. 1.5 hours where the staff, the leading registered nurse and the physician carry out a systematic reflection based on cognitive therapeutic principles); and an action and evaluation phase. These phases were adapted from and based on problem‐solving methods used in CBT and coincide with reviews describing the “state of the art” for management of Neuropsychiatric Symptoms. The actual assessment and treatment programme for individual patients is described in the TIME manual (step‐by‐step guide to implementing the model). The staff in the intervention NHs were offered a training program that included a 3‐hour lecture and role‐play following the steps in the TIME manual. In each ward of each NHs, 3 nurses who had the responsibility for implementing TIME were given 3 additional hours of lecture. One specialist registered nurse from the education and training team attended and supervised the TIME administrators’ first case conference on their first patient in their NH. |
| WHO PROVIDED | Education and training team, which consists of project management team (a physician with special competence in NH medicine and 2 specialist registered nurses in geriatrics) and 4 specialist registered nurses in old age psychiatry, all of whom were familiar with TIME, were responsible for conducting the education and training sessions for NH staff. NH staff (nurses and physicians) delivered intervention to patients. |
| HOW | Face‐to‐face on‐site |
| WHERE | 33 NHs in Norway |
| WHEN AND HOW MUCH | The time frame for the complete intervention with TIME varied from 1 to 2 weeks to up to 8 weeks depending on the severity and complexity of the neuropsychiatric symptoms to be approached and the resources available in the NH |
| TAILORING | Tailoring is not explicitly reported, however it is implicitly part of the intervention itself, e.g. through working systematically with the personal history of the residents in the case conference. |
| MODIFICATIONS | No changes to intervention are reported |
| HOW WELL (planned) | Focus group interviews with 4 to 5 NH staff and caregivers were planned to assess, among others, the feasibility of the intervention as well as barriers and facilitators to its implementation. The implementation of TIME was followed and assessed from the start of the study for 1 year following the study based on RE‐ALM framework (Reach, Efficacy, Adoption, Implementation and Maintenance). |
| HOW WELL (actual) | A case conference was performed for 91% of patients in the intervention NH. The staff performed 80% or more of the components in the model for approximately 89% of the included patients. |
| Details of any co‐interventions | The staff in both the intervention and control group were offered a 2‐hour lecture covering dementia and neuropsychiatric symptoms. This lecture represented the education‐only intervention administered to the staff of control homes. |
CBT: cognitive behavioural therapy; NH: nursing home
Van den Block 2020
| WHY | Available evidence on improving the quality of palliative care in LTCFs highlights the importance of a comprehensive approach in improving end of life care. Individual targeted interventions, such as training of care staff, appear ineffective if not embedded in a broader organisational approach. Rather than interventions targeting a specific element within a facility, innovative ‘complex’ palliative care interventions engaging with facilities and the wider system are needed. The complex palliative care intervention ‘PACE Steps to Success’ is developed as such a comprehensive intervention. It aims to ensure that residents receive high‐quality care in long‐term care facilities in Europe through facilitating organisational change and supporting care staff to develop their roles concerning palliative care. The intervention was based on the ‘Route to Success in Long‐term Care Facilities', a palliative care intervention developed in the UK. The Route to Success builds upon the well‐known palliative care intervention ‘Gold Standards Framework’ (GSF), which aims to improve palliative care within primary care and was later adapted for use in long‐term care facilities. |
| WHAT (materials) | Manager and facility staff information folder, facility PACE co‐ordinator information folder, and a Supporting Tools folder (details not provided). |
| WHAT (procedures) | Using a train‐the‐trainer approach, an external trainer supports staff in the nursing homes to introduce the PACE 6 Steps to Success Program (a palliative care approach) over the course of 1 year. The programme has 3 phases, implemented over a 12‐month period (2 months preparation, 6 months implementation of 6 steps and 4 months consolidation with ongoing support where needed). The 6 steps are:
|
| WHO PROVIDED | Nursing home staff |
| HOW | Face‐to‐face on‐site |
| WHERE | Nursing homes in Belgium, England, Finland, Italy, the Netherlands, Poland and Switzerland |
| WHEN AND HOW MUCH | Each country had “PACE country trainers” trained by experienced international trainers (trained during a 1‐week international workshop) and supported via monthly 1‐hour online group‐coaching sessions during the intervention period. Each nursing home had between 1 to 6 staff members as a designated PACE co‐ordinator; these staff members were provided training and support to develop the knowledge and skills to train all staff at their nursing home. Training for nursing home staff were via workshops, in addition to visits or contact every 7 to 10 days from the country trainer. Multidisciplinary palliative care meetings were held on a monthly basis to discuss residents identified as expected to live for less than 6 months. |
| TAILORING | Tailoring was part of the intervention as per the needs of the staff within the nursing homes. |
| MODIFICATIONS | No changes to the intervention are reported other than translation of trial materials and trainings from English into the relevant language of the country in which it was delivered. Cross‐cultural adaptation was also conducted in some nursing homes based on review meetings, but further details are not provided. |
| HOW WELL (planned) | The process evaluation followed the Reach, Effectiveness, Adoption, Implementation, Maintenance (RE‐AIM) framework. The process evaluation started in the pre‐phase of the intervention and ended 18 months after its start. Multiple methods, involving various participants, were used, including structured diaries, registries on training attendance and document adoption, individual and group interviews and evaluation questionnaires. To measure Reach, PACE co‐ordinators used attendance lists to register how many staff members attended each training session, multidisciplinary review meeting (step 3) or reflective debriefing session (step 6) until month 18 of the intervention. In addition, to assess Adoption, PACE co‐ordinators reported on the number of PACE documents (Looking and Thinking Ahead documents from step 1, and pain and depression assessments from step 4) that were completed and archived at the end of the consolidation period (month 12). The extent to which the intervention was implemented as intended was investigated by analysing structured diaries that country trainers completed on a weekly basis during the 12 months of the intervention, in which they kept track of all the activities they performed regarding the PACE Steps to Success Programme. In order to gain insight into the factors that affected the RE‐AIM components, the facilitators and barriers participants encountered during the implementation period, and their recommendations for broader implementation or preferred adaptions to the programme, semi‐structured group interviews using a topic‐list were performed with care staff members and PACE co‐ordinators, and individual interviews with facility managers (month 13 to 15). |
| HOW WELL (actual) | The implementation of the PACE Steps to Success Programme was feasible, but also highly variable within and across countries. The intervention was fully implemented as intended in 28 out of 37 LTCFs in terms of number, order and timing of training sessions; all 6 PACE Steps were taught, in the right order and within 8 months. Reach: The mean attendance rate on all 6 training steps varied widely between LTCFs, from 4% in one facility in The Netherlands up to 81% in one facility in Switzerland. A decrease in attendance could be discerned over time. Across all 37 LTCFs, the mean attendance rate for step 1 was 55% (median 58%, range 6% to 93%), for step 2, 52% (median 52%, range 5% to 100%), for step 3, 38% (median 38%, range 2% to 82%), for step 4, 43% (median 42%, range 2% to 94%), for step 5, 46% (median 42%, range 4% to 98%) and for step 6, 39% (median 35%, range 1% to 93%). Attendance rates were highest in Finland and Switzerland, and lowest in England. In total, 9 LTCFs had a low level of Reach, 21 LTCFs a medium level of Reach and 7 LTCFs a high level of Reach. Adoption: The proportion of residents with a completed Looking and Thinking Ahead document (PACE step 1) archived in the residents’ care file at the end of the consolidation period ranged from 6% (LTCF in Italy) to 186% (LTCF in The Netherlands). The latter high rate was caused by a high resident turnover in this facility (proportion calculated as ‘number of residents with document divided by number of beds’). Overall, adoption rates were highest in Poland and lowest in England, but fluctuated considerably within countries (Fig. 3). Applying the rating criteria resulted in 11 LTCFs with a low level of Adoption, 14 LTCFs with a medium level of Adoption and 12 LTCFs with a high level of Adoption (see Figure 2). The proportion of residents for whom a pain or depression assessment was completed was generally much lower than the proportion of residents with a completed Looking and Thinking Ahead document, except for a few LTCFs in Italy and Switzerland. This is because these assessment tools were presented as optional within the PACE Programme, i.e. pain assessments were advised especially for new residents on admission or for residents in pain, and depression assessments only when a resident was observed to be depressed. The proportion of residents with a pain assessment (PACE step 4a) completed and documented at the end of the consolidation period ranged from 0% (LTCFs in Belgium, The Netherlands and England) to 135% (LTCF in Italy) (see Figure 6 in Appendix). The proportion of residents with a depression assessment (PACE step 4b) completed and documented at the end of the consolidation period ranged from 0% (LTCFs in all countries except Finland and Poland) to 115% (LTCF in Poland). Implementation: The rating for Implementation consisted of 2 elements; fidelity (the extent to which the 6 steps were delivered as intended) and the care staffs’ appreciation of the trainer’s teaching competencies and the overall programme. First, fidelity scores ranged from 5 to 8 (out of 8) and were generally high in all countries. The intervention was fully implemented as intended in 28 out of 37 LCTFs in terms of number, order and timing of training sessions; all 6 PACE Steps were taught, in the right order and within 8 months. In 7 other LTCFs (3 in Belgium, 3 in The Netherlands and 1 in England), the 6 PACE Steps were taught, but not in the right order or not within 8 months. Only in 2 LTCFs (in Belgium and England) were not all 6 PACE steps taught, but still training was completed on 5 steps. Second, the combined score for satisfaction with the trainer’s teaching competencies and with the overall PACE Programme ranged, on a scale from 0 to 8, from 3.2 (LTCF in Finland) to 7.8 (LTCF in Poland). Overall, the satisfaction scores were highest in England and The Netherlands and lowest in Finland and Belgium. Combining the satisfaction scores with fidelity shows that only 2 LTCFs in Finland scored low, 24 LTCFs medium and 11 LTCFs high regarding level of Implementation. |
| Details of any co‐interventions | No co‐interventions reported |
LTCF: long‐term care facility
Kotinya‐English 2005
| Study ID | Kotynia‐English 2005 |
| WHY | The prevalence of psychological and behavioural disturbances among older adults living in residential care facilities is high, and it has been shown previously that people with such symptoms have poorer health outcomes. Delay in diagnosing and treating psychiatric disorders in RACFs is associated with increased frequency of physical restraint and psychotropic medication use, and high levels of morbidity. Early detection is hypothesised to improve management of psychiatric conditions and prevent long‐term adverse outcomes. |
| WHAT (materials) | No specific materials reported |
| WHAT (procedures) | All new admissions to the residential care facilities were screened systematically for the presence of psychiatric morbidity. This assessment was done by suitably trained research staff using the following instruments: Health of the Nation Outcome Scales for older adults (HoNOS 65+), Mini‐mental State Examination (MMSE), Geriatric Depression Scale (GDS) and Neuropsychiatric Inventory (NPI). For the purposes of this study, older adults were considered to have screened positive if they had a GDS‐15 score greater than 5 or an NPI score greater than zero in any of its 12 sections. Subjects in the intervention group who screened positive at the baseline assessment were reviewed within a 2‐week period by the Inner City Mental Health Service of Older Adults (ICMHSOA) and, if clinically appropriate, mental health services were introduced without the involvement of the research team. The ICMHSOA is a multidisciplinary psychogeriatric team that includes psychiatrists, psychologists, social workers and community nurses. As part of the clinical routine of the ICMHSOA, all referrals are initially assessed by a psychiatrist and a case manager. A preliminary management plan is then drawn up according to the needs of the patient, with other team members (e.g. psychologists) getting involved in the management of the patient if necessary. All patients referred to the unit are followed up systematically until the presenting complaint is resolved or adequately contained (normally within 3 months). |
| WHO PROVIDED | Initial screening presumably by RACF staff. Those who screened positive at the baseline were reviewed within a 2‐week period by the Inner City Mental Health Service of Older Adults (ICMHSOA). ICMHSOA is a multidisciplinary psychogeriatric team that includes psychiatrists, psychologists, social workers and community nurses. |
| HOW | Face‐to‐face on‐site screening. How ICMHSOA provided care is not described. |
| WHERE | 22 RACFs in Perth, Western Australia |
| WHEN AND HOW MUCH | All residents were screened systematically for the presence of psychiatric morbidity. All patients referred to the unit (who have a positive screening result) were followed up systematically until the presenting complaint is resolved or adequately contained (normally within 3 months). |
| TAILORING | No tailoring reported |
| MODIFICATIONS | No changes to intervention are reported |
| HOW WELL (planned) | It is not reported whether adherence was explicitly studied |
| HOW WELL (actual) | Not reported |
| Details of any co‐interventions | No co‐interventions reported |
Kovach 2006
| Study ID | Kovach 2006 |
| WHY | 45% to 80% of nursing home residents are in pain. Residents with dementia are consistently untreated or undertreated for pain. People with mild dementia can provide valid reports of pain, but people with more severe cognitive impairment are unable to clearly report pain. The consequences of need‐driven dementia‐compromised behaviour theory suggests that failure to recognise behaviours as symptoms leads to the undertreatment of many needs. To address these potentially unmet needs, the Serial Trial Intervention (STI) was developed for comfort assessment and management. The intervention was hypothesised to increase physical and affective assessment, pharmacological and non‐pharmacological treatment and nurse persistence to intervene. Patients receiving the intervention were hypothesised to have less discomfort and more resolution of behavioural symptoms. |
| WHAT (materials) | Nurses education included 8 digitally produced vignettes to show nurses using the following treatments in response to behavioural symptoms: use of medication, use of medication and non‐pharmacological treatments, use of verbal support only and use of a mix of verbal and other non‐pharmacological treatments. The 4 vignettes used to train nurses at treatment sites involved the steps of the STI, while the 4 vignettes used at control sites reflected standard care practices (vignettes not provided). Nurses recorded behaviours, assessments and treatments in daily logs. |
| WHAT (procedures) | STI intervention consisted of 5 steps: STI Step 1: Perform physical needs assessment that focuses on conditions associated with discomfort. If assessment is positive, a targeted intervention is implemented or the appropriate discipline is consulted to begin treatment. If the assessment is negative, or if treatment fails to decrease symptoms by at least 50%, the nurse moves to the next step. STI Step 2: Perform affective needs assessment that focuses on needs of people with dementia: (1) environmental stress threshold not exceeded, (2) balance between sensory‐stimulating and sensory‐calming activity throughout the day, and (3) receipt of meaningful human interaction each day. If assessment is positive, a targeted intervention is implemented or the appropriate discipline is consulted to begin treatment. If the assessment is negative, or if treatment fails to decrease symptoms by at least 50%, the nurse moves to the next step. STI Step 3: Administer a trial of non‐pharmacological comfort treatment(s). Treatments used are tailored to the person and the situation and are based on a list of psychosocial and environmental treatments that have been associated with decreasing agitated behaviours. If a trial of non‐pharmacological comfort treatment(s) does not ameliorate behaviours in a time frame likely to show outcomes, the nurse should move to step 4. STI Step 4: Administer a trial of analgesics by either administering the prescribed “as needed” (i.e. pro re nata) analgesic or obtaining orders to escalate a current analgesic. If there is not a response to a trial course of analgesics, consider consultation regarding further escalation or proceed to the next step. STI Step 5: Consult with other disciplines or practitioners (i.e. the nurse practitioner, physician, hospice, geropsychiatry). A trial of a prescribed psychotropic drug may be administered in this step if the behaviour continues and the nurse carefully considers alternatives and weighs the potential for side affects against the comfort needs of the resident. When residents exhibit changes in behaviour that are not effectively treated through basic care provided by the ancillary staff, the STI is initiated by the nurse. The STI process is stopped when behavioural symptoms decrease by 50% or more. Continued movement through steps of the STI is based on results of assessments and decreases in symptoms by less than 50% in time frames that have been established for specified treatments. If the behavioural symptom continues after completing all 5 steps, the process is repeated. Following baseline testing of participants, nurses in both the treatment and control groups spent 7 hours in an education session with 2 APNs. Intervention nurses were taught, using established training curricula, to use the steps of the STI. Classroom tests consisted of written case‐study examinations. Nurses were tested using these simulated cases until the STI process was used with ≥ 85% accuracy. Following education and successful testing, nurses in the treatment group began using the STI in response to behavioural symptoms. Nurses in both groups were trained to complete the daily logs in which they recorded behaviours, assessments and treatments (nurses were tested for interrater reliability with project staff; if percentage agreement was < 0.85, training and testing were repeated on another day until agreement was ≥ 0.850) for 1 month for each subject, beginning on the day the subject first exhibited a behaviour change not ameliorated by basic care treatments. If a subject showed no change in behaviour for 8 weeks, that person was dropped from the study. Two APNs visited treatment and control sites twice‐weekly to check and collect daily logs and answer questions. |
| WHO PROVIDED | Two APNs provided the education sessions to eligible day‐shift nurses (eligibility criteria included: nurses had to have at least 6 months of experience caring for people with dementia, work the day‐shift for 32 hours or more per week and provide consent). Two to 6 nurses from the day shift at each facility participated in the study. Of the 54 nurses participating, 46 were registered nurses (RNs) and 8 were licensed practical nurses (LPNs). |
| HOW | Face‐to‐face on‐site |
| WHERE | At the long‐term care facility |
| WHEN AND HOW MUCH | Each eligible participant was followed for 4 weeks. Care protocol was followed as and when necessary. |
| TAILORING | The care protocol was designed to be tailored to each patient's needs |
| MODIFICATIONS | No changes to intervention are reported |
| HOW WELL (planned) | It is not reported whether adherence was explicitly studied |
| HOW WELL (actual) | Not reported |
| Details of any co‐interventions | No co‐interventions reported |
APN: advance practice nurse
Loeb 2005
| Study ID | Loeb 2005 |
| WHY | Antimicrobial use for suspected urinary tract infections among NH residents is common and often inappropriate. Unnecessary use of antimicrobials in elderly people can lead to adverse consequences, including the development of multidrug antimicrobial resistance, drug‐related adverse effects, harmful drug interactions and excessive costs. Authors developed algorithms based on evidence from randomised trials to optimise antimicrobial use for suspected urinary tract infection in residents of NH. Authors hypothesised that introduction and adoption of the algorithms in a NH using a multifaceted intervention (education, written material, real time reminders and outreach visits) targeted to nurses and physicians would safely reduce antimicrobial use for suspected urinary tract infection. |
| WHAT (materials) | Hard copies of the algorithms provided to nurses and physicians, with written explanatory material; algorithms were also printed on pocket cards and distributed to the physicians and nursing staff at the start of the study, and mounted as large posters at all nursing stations. Videotaped version of the educational sessions. Nurses were asked to complete a one‐page log of presenting symptoms and signs for every resident in whom urinary tract infection was suspected, as a reminder to use the algorithms. Details or copies of materials are not provided in the publication. |
| WHAT (procedures) | Nurses and physicians of the NH were introduced to the diagnostic (ordering urine culture) and therapeutic (prescribing antimicrobials) algorithms using multifaceted approach including an interactive educational session (6 case scenarios lasting a total of 30 minutes to groups of 10 to 15 registered nurses or registered nursing assistants; participation asked to decide whether to order antibiotics and urine cultures and to justify their answers using the algorithms); distributed a videotaped version of a reconstruction of the small group sessions to NH for viewing by existing and new staff over the course of the study; provided copies of the algorithms, along with written explanatory material, to all the physicians who cared for the NH residents; met once individually with the physicians who cared for 80% or more of residents in each NH (algorithms explained to them using the six case scenarios, printed on pocket cards and distributed to the physicians and nursing staff at the start of the study, and mounted as large posters at all nursing stations. The physicians and nurses were asked to use the algorithms when assessing residents for fever or suspected urinary tract infection. Nurses were asked to complete a one‐page log of presenting symptoms and signs for every resident in whom urinary tract infection was suspected, as a reminder to use the algorithms. One staff member in each NH was assigned the role of reminding nurses to use the algorithms. |
| WHO PROVIDED | Study investigators conducted the educational sessions and met with the physician. One staff member was responsible for reminding staff to use algorithms. |
| HOW | Face‐to‐face group and individual sessions and passive reminders (posters, pocket cards). |
| WHERE | In the NH |
| WHEN AND HOW MUCH | Most of the interventions were once off (education session, videotape, individual meetings with physicians). It is not clear how/how often the responsible staff member reminded nurses and physicians to use the algorithms. Large posters and pocket cards provided ongoing information and reminders. The intervention homes were allowed a four‐week training period before data collection. Study investigators visited the NH every 3 months to address any questions that the staff had and to carry out audits of the records to check that antimicrobial prescriptions for suspected urinary tract infection had not been missed. |
| TAILORING | No |
| MODIFICATIONS | No changes to intervention are reported |
| HOW WELL (planned) | It is not reported whether adherence was explicitly studied |
| HOW WELL (actual) | Not reported |
| Details of any co‐interventions | No co‐interventions reported |
NH: nursing home
Loeb 2006
| Study ID | Loeb 2006 |
| WHY | Pneumonia and other respiratory tract infections are common among residents of NHs. These infections are one of the most frequent reasons for transferring residents to hospital. Hospitalisation may be associated with a reduction in quality of life, a decline in functional status, falls and other hazards. The economic costs associated with such hospital transfers are substantial. |
| WHAT (materials) | No specific materials reported |
| WHAT (procedures) | Residents were assessed clinically by study nurses according to the study protocol. The study nurse measured vital signs and assessed whether the resident was eating and drinking. Care was provided in the NH if residents met all of the following criteria: pulse of 100/min or less, respiratory rate of less than 30/min, systolic blood pressure of at least 90 mm Hg, oxygen saturation of at least 92% (or ≥ 90% if the resident had chronic obstructive pulmonary disease), and ability to eat and drink. If any 1 of these criteria was not met, the resident was transferred to the hospital. The nurse determined oxygen saturation by using a portable pulse oximeter initially without supplemental oxygen. If oxygen saturation was below the cut‐off level, the nurse would administer oxygen and wait for 30 minutes. If upon remeasurement oxygen saturation was above the cut‐off level, the criterion for on‐site treatment in the NH was met. Chest radiographs were performed in the NH by a mobile unit within 12 hours of enrolment. However, presence of an infiltrate compatible with pneumonia was not a criterion with respect to site of care. The research nurse administered hypodermoclysis in the NH to residents who were dehydrated. This was performed by inserting a 21‐gauge butterfly needle subcutaneously infusing saline at a rate of 30 mL per hour initially; if tolerated, it was increased to 60 mL per hour. The insertion site was checked hourly for the first 2 hours, then every 2 hours thereafter. Levofloxacin, administered as one 500 mg tablet orally once daily for 10 days, an antibiotic on the Ontario Drug Benefit Formulary and therefore paid for by the provincial government, was prescribed empirically as recommended in the Canadian pneumonia treatment guidelines. The dose was reduced to 250 mg for residents with known renal insufficiency. Residents who were initially treated in the NH but subsequently deteriorated such that they no longer met the criteria for NH treatment were transferred to hospital. For residents who were transferred to hospital, the pathway specified that they be transferred back to the NH once criteria for NH treatment were met. The research nurse informed the physician that the resident had been enrolled and informed him/her of any major change in the resident’s clinical status. However, physicians were not involved in the implementation of the various components of the clinical pathway. For residents taking warfarin, international normalised ratios were ordered and monitored by the resident’s PCP who was made aware that the resident was taking levofloxacin administered by the study nurse. |
| WHO PROVIDED | Study nurse provided all the assessments. The research nurse informed the physician that the resident had been enrolled and informed him/her of any major change in the resident’s clinical status. However, physicians were not involved in the implementation of the various components of the clinical pathway. For residents taking warfarin, international normalised ratios were ordered and monitored by the resident’s PCP who was made aware that the resident was taking levofloxacin administered by the study nurse. |
| HOW | Face‐to‐face on‐site |
| WHERE | 22 NHs in Hamilton, Ontario, Canada |
| WHEN AND HOW MUCH | Details reported in WHAT (procedures used in the intervention) |
| TAILORING | No tailoring reported |
| MODIFICATIONS | No changes to intervention are reported |
| HOW WELL (planned) | It is not reported whether adherence was explicitly studied |
| HOW WELL (actual) | Not reported |
| Details of any co‐interventions | No co‐interventions reported |
NH: nursing home; PCP: primary care physician
Pieper 2016
| Study ID | Pieper 2016 |
| WHY | The protocol is specifically designed for dementia patients with moderate to severe cognitive impairment, because in this particular group verbal communication is often impaired and healthcare professionals therefore have to rely (at least partly) on behavioural symptoms. Since it is often unclear whether these behavioural symptoms are a result of pain or affective discomfort, a systematic approach for exploring and managing the symptoms is needed. |
| WHAT (materials) | Each step of STA OP!‐protocol is systematically written down as a template for nurses and nursing home physicians (details not provided) |
| WHAT (procedures) | A comprehensive training programme (5 meetings, 3 hours each) for healthcare professionals to implement the STA OP!‐ protocol. STA OP! protocol: Step 0: Basic care needs fulfilled (for instance hunger, thirst, a need for glasses, hearing aids or toileting). Step 1: Physical needs assessment (nurse and nursing home physician); a brief physical nursing assessment; fill out an observational pain instrument (PACSLAC‐D); if assessments negative, a nursing home physician (or if available a nurse practitioner) performs a more comprehensive physical assessment to find other probable physical causes, such as inflammation, infection, acute illness or a chronic condition possibly responsible for the observed behaviour. For those residents already using pain medication or psychotropic drugs and still have behavioural symptoms possibly related to pain or affective discomfort, the nursing home physician will also assess whether the medication given is in accordance with the guidelines of the World Health Organization (WHO) and Verenso (the Dutch association of nursing home physicians) (also see Step 4 and 5). Step 2: Affective needs assessment: By using a needs‐oriented and tailored approach, the nurse assesses possible problems regarding environmental stress, a possible imbalance between sensory stimulating and sensory calming activities, or a lack in meaningful human interactions. The psychologist working in the nursing home can be consulted at this step. Step 3: Non‐pharmacological comfort interventions: In this step non‐pharmacological comfort interventions will be conducted and implemented, in line with the personal history of the resident. Examples of comfort interventions are soothing, supportive verbal communication, supportive touch and sensory stimulation by music, nice smells or soft materials. Step 4: Trial of analgesics: In this step of the protocol, the nursing home physician is advised to prescribe a trial of analgesics according to the validated pain ladder, developed by the World Health Organization. Specific guidelines for use in the elderly are given to each participating nursing home physician in a training session, and similarly for physicians working in control and intervention units. Step 5: Consultation of relevant other disciplines (e.g. psychiatrist) or trial of prescribed psychotropic drugs. In the protocol and training sessions, nursing home physicians are instructed to use the guidelines of the Dutch association of nursing home physicians (Verenso) for prescribing psychotropic medication. The Verenso guidelines clearly describe how and when psychotropic drugs are beneficial for dementia patients. In general, it is believed that this medication is only indicated for specific symptoms and for a fixed period. |
| WHO PROVIDED | A training centre, with very experienced trainers, provided the STA OP!‐training. These trainers are APNs or have other medical backgrounds and have specific professional expertise regarding dementia, pain and discomfort. STA OP!‐ protocol is implemented by nursing home physicians, psychologists, occupational therapists and level 3, 4 or 5 registered or certified nurses |
| HOW | Face‐to‐face on‐site |
| WHERE | In NH |
| WHEN AND HOW MUCH | The intervention was implemented on an as‐needed basis. Residents with moderate to severe dementia and challenging behaviour were assessed and treated using the protocol. Depending on the intervention chosen, a decision was made as to how and when to proceed to the subsequent step, but in general, when effects were lacking or were limited, the intervention did not take longer than 1 week. To promote use of the protocol in practice, the protocol was linked to structured daily or weekly team meetings, and focus groups were formed within the units of the institution to facilitate implementation. |
| TAILORING | Tailoring was part of the intervention itself (e.g. care tailored to the individuals needs following a step‐by‐step care protocol) |
| MODIFICATIONS | Not reported |
| HOW WELL (planned) | To promote use of the protocol in practice, the protocol was linked to structured daily or weekly team meetings, and focus groups were formed within the units of the institution to facilitate implementation. Project co‐ordinator (MP) performed site visits once a week, conducted fidelity checks with nursing staff and elderly care physicians regarding their use of the STA OP! protocol, and answered their questions regarding pain or affective discomfort. |
| HOW WELL (actual) | Of the 148 residents in the intervention condition, 39% were analysed using the STA OP! protocol. The mean number of steps assessed was 2.8 (SD 1.2). The training manual and forms used were found to be relevant and feasible. Factors inhibiting the implementation process at the i) organisational level concerned instability of the organisation and the team (e.g. involvement in multiple projects/new innovations, staff turnover/absence of essential disciplines or high workload). At the team level (ii), we found that presence of a person with a motivational leadership style facilitated the implementation. Also, interdisciplinary co‐operation through the design/setting of the multidisciplinary training, securing the intervention by use of clear agreements, and written reporting or transfers facilitated implementation. At the individual level (iii), perceived value of the stepwise working method, and enhanced awareness facilitated the implementation. |
| Details of any co‐interventions | All elderly care physicians responsible for the control and intervention units received additional training from an expert physician based on the current guidelines for pain and behaviour issued by the Dutch Association of Elderly Care Physicians and Social Geriatricians. The training in geriatric pain management focused on appropriate short‐ and long‐acting drugs for the treatment of acute and chronic pain, dose escalation, analgesic escalation and management of side effects. The training in geriatric behaviour treatment focuses on the appropriateness of the use of psychotropic medication for several indications and its side effects. In this additional training, it is stressed that other interventions are often more appropriate. This training is given by an experienced nursing home physician. |
APN: advanced practice nurse; SD: standard deviation
Rutten 2022
| Study ID | Rutten 2022 |
| WHY | Antibiotic overprescribing for suspected UTI in NH is common. Typical clinical scenarios in which antibiotics are inappropriately prescribed include response to non‐specific signs and symptoms or a positive urine test in the absence of symptoms referable to the urinary tract. These and other scenarios for inappropriate antibiotic prescribing were addressed in a recent international Delphi study which resulted in the development of a decision tool for the empiric treatment of UTI in frail older adults. This tool integrated into electronic health record (EHR) is hypothesised to improve appropriateness of antibiotic prescription. |
| WHAT (materials) | Decision tool integrated into EHR A pocket card with a summary of the e‐learning content (for distribution to residents or their family members) (not provided) Information material on actively monitoring residents who are not prescribed antibiotics, was provided to nursing staff for distribution to residents or their family members |
| WHAT (procedures) | Decision tool: decision tool automatically generates treatment advice when a physician reports pre‐structured clinical information in the EHR of residents with a suspected UTI and who provided informed consent; physician is free to deviate from the treatment advice and remains responsible for the treatment decision. All physicians receive a pocket card of the decision tool for situations without access to the EHR (and therefore to the decision tool). Education of staff Physician education 1) a 1‐hour interactive presentation about the content of the decision tool, provided by the research team, and 2) a role play to learn how to deal with pressure to prescribe antibiotics from residents, their family or nursing staff, and on how to train nursing staff on the content of the decision tool. Nursing staff education 1) A 6‐min video about dealing with suspected UTI in NH residents (based on a training module developed by prof. Sloane and his research group, University of North Carolina at Chapel Hill). In this video, particular attention is paid to standardised assessment of residents with suspected UTI and to other common causes of non‐specific signs and symptoms. A part of the nursing staff (i.e. at least 1 nurse per 10 residents) additionally completes a 20‐min e‐learning to become ‘experts’ with sufficient knowledge for education of other nursing staff. In the e‐learning, the video topics are discussed in more detail. Furthermore, attention is paid to how to deal with pressure from residents or their family asking for urine analysis or an antibiotic prescription. After finishing the e‐learning, ‘experts’ receive a pocket card with a summary of the e‐learning content. Finally, information material on actively monitoring residents who are not prescribed antibiotics, is provided to nursing staff for distribution to residents or their family members. |
| WHO PROVIDED | NH staff (physician and nurses) |
| HOW | Face‐to‐face on‐site |
| WHERE | NH |
| WHEN AND HOW MUCH | As needed by suspected UTI |
| TAILORING | No tailoring |
| MODIFICATIONS | Not reported |
| HOW WELL (planned) | Not reported (although protocol does mention that the implementation of the intervention process will be evaluated) |
| HOW WELL (actual) | Not reported |
| Details of any co‐interventions | No co‐intervention Authors initially aimed to conduct this study prior to publication of the updated national guideline, in which the decision tool subject to the study would be introduced, ensuring that only intervention group NHs had access to it. The guideline, however, became available before study onset, thus providing control group NHs access to the decision tool (albeit not EHR‐integrated). Although the authors did not actively implement the guideline in these NHs, participating in the study may have increased awareness for appropriate antibiotic prescribing, especially since physicians of the control group also filled out CRFs. This may have motivated them to prescribe antibiotics more carefully and make efforts in familiarising with this new guideline. If this is confirmed in the forthcoming process evaluation study, this may have resulted in a smaller than anticipated difference in appropriate antibiotic prescribing between the groups. |
UTI: urinary tract infection; EHR: electronic health record; NH: nursing home
Cavalieri 1993
| Study ID | Cavalieri 1993 |
| WHY | Comprehensive geriatric assessment has clearly emerged as a new approach to the management of the elderly patient in the United States. In fact, this multidisciplinary, multidimensional approach has been referred to as "the new technology of geriatrics". The effectiveness of comprehensive geriatric assessment has been demonstrated with the frail elderly in either a geriatric assessment unit or a geriatric rehabilitation unit. Several of the beneficial outcomes of this approach consist of improved diagnostic outcomes, reduced medication usage, prolonged survival, improved functional status, discharge placement to lower level of care, improved affect or cognition, and reduced medical care costs. Studies on comprehensive assessment have taken place, most commonly, in the acute care setting and, less commonly, in geropsychiatric units, geriatric rehabilitation programmes or the home care setting. At the time of writing, there are no published studies evaluating the effectiveness of comprehensive geriatric assessment in the NH setting. |
| WHAT (materials) | No specific materials reported |
| WHAT (procedures) | Comprehensive geriatric assessment, further details not described |
| WHO PROVIDED | Multidisciplinary team of geriatricians and geriatric NPs, all of whom have specialised training in providing care to older adults |
| HOW | Face‐to‐face on‐site |
| WHERE | 1 NH in New Jersey, USA |
| WHEN AND HOW MUCH | Comprehensive geriatric assessment was conducted at admission, 3, 6, 9 and 12 months |
| TAILORING | The care provided would be individual to patient but no specifics regarding tailoring are described |
| MODIFICATIONS | No changes to intervention are reported |
| HOW WELL (planned) | It is not reported whether adherence was explicitly studied |
| HOW WELL (actual) | Not reported |
| Details of any co‐interventions | No co‐interventions reported |
NH: nursing home
Rubenstein 1990
| Study ID | Rubenstein 1990 |
| WHY | Previous research identified a number of specific causes for falls. Specific diagnostic assessments have been advised to identify "high‐risk" patients (for example, aspects of the physical examination such as vision and muscle testing, medication profiling, Holter monitoring, gait testing, environmental assessment). Persons prone to falling can possibly benefit from a focused diagnostic assessment and preventive interventions ‐ both to prevent further falls and to reduce the frailty and morbidity associated with falls. Specific beneficial outcomes hypothesised to result from this intervention included reduction in recurrent fall rates, decreased morbidity related to falls and associated conditions (such as injuries, hospitalisation), and decreased mortality. |
| WHAT (materials) | No specific materials reported |
| WHAT (procedures) | Immediately after randomisation, patients assigned to the intervention group received the post‐fall diagnostic assessment. Assessment consisted of a complete physical examination, including a detailed quantitative neurologic and musculoskeletal assessment, visual acuity screening (Snellen chart), extended pulse and blood pressure assessment with attention to postural changes, assessment of footwear and foot problems, and a quantified balance and gait assessment using a 26‐point version of the Tinetti scale. Laboratory tests were then done, including complete blood count, urinalysis, creatinine, electrolytes, calcium, hepatic enzymes, serologic test for syphilis and free thyroxine index. A standard 12‐lead electrocardiogram was obtained as well as 24‐hour ambulatory cardiac (Holter) monitoring. Finally, the nurse practitioner did a careful environmental assessment of the resident's room and other relevant areas to identify potential hazards (for example, lighting, bed height, obstacles, floor condition). The nurse practitioner was thoroughly trained in the use of the protocol by the physician investigators. The first 10 cases were assessed independently by both the nurse practitioner and the physician investigators, and overall agreement for judgemental items on the physical examination was over 90%. Throughout the study, after the nurse practitioner's diagnostic assessment, one of the physician investigators reviewed all the data collected and re‐evaluated the resident if there was a questionable finding. This evaluation resulted in a list of the diagnostic impressions, which included the most likely primary cause for the fall, potentially contributing diseases and risk factors, and other findings of medical importance. The research team decided on the primary cause after carefully discussing all clinical information and gave a list of recommendations to the resident's primary care physician in a written report. It took an average of 3 weeks from the incident fall for the primary care physician to review the research team's final recommendations. The intervention was a one‐time occurrence. The nurse practitioner did not become involved in the treatment of subjects nor did she provide any further recommendations to the primary care physicians during the course of the study. |
| WHO PROVIDED | Nurse practitioners and primary care physician |
| HOW | Face‐to‐face on‐site |
| WHERE | A 732‐bed long‐term residential care facility providing multiple levels of care in Los Angeles, USA |
| WHEN AND HOW MUCH | It took an average of 3 weeks from the incident fall for the primary care physician to review the research team's final recommendations. The post‐fall assessment was a one‐time occurrence. |
| TAILORING | Tailoring was part of the intervention, as recommendations were given based on assessment of individual resident’s situation |
| MODIFICATIONS | No changes to intervention are reported |
| HOW WELL (planned) | Data on physician compliance with study recommendations and specific therapies instituted were collected for subjects in the intervention group. |
| HOW WELL (actual) | Physicians and other caregivers complied with nearly 62% of the recommendations, and 41% of intervention subjects received all of the recommended interventions. Compliance rates were slightly higher among board‐and‐care subjects than among skilled nursing subjects. |
| Details of any co‐interventions | No co‐interventions reported. |
Kim 2020
| Study ID | Kim 2020 |
| WHY | A theory driven (Chronic Care Model), technology‐enhanced, integrated care model was expected to improve quality of care provided to the older frail residents and ultimately improve their quality of life |
| WHAT (materials) | To support care planning, the Systems for Person‐centered Elder Care (SPEC) program provides the interRAI LTCF’s clinical assessment protocols book and also a set of checklist forms with possible action points for the triggered risks (a problem list). The action points in the checklists are activities for assessment, management, evaluation or co‐ordination to decrease the identified risks or promote the strength of older adults. The checklists are based on the interRAI CAPs; but the SPEC research team, through literature review and consultations from academic and clinical experts, has localised them to meet the needs of Korean NHs. The checklists are uploaded on the SPEC system, a prototype, cloud‐based ICT tool. In order to promote communication among stakeholders, the SPEC model provides tailored reports to three targeted stakeholders: NH administrators, contracted physicians and family members (details not provided). |
| WHAT (procedures) |
|
| WHO PROVIDED | Comprehensive Geriatric Assessment: the registered nurse ‐ social worker (RN‐SW) pair at each participating NH Individualised Need‐Based Care Planning: resident/family input; by the care team led by the RN‐SW pair at each home Interdisciplinary Case Conferences: formal face‐to‐face interdisciplinary team meetings by the care team led by the RN‐SW pair at each home and facilitated by the SPEC consultant Care co‐ordination: co‐ordination of care using tailored reports based on CGA/care planning between care staff (administrators and direct care members), families, and contracted physicians/medical institutions; the RN‐SW pair facilitated by the SPEC consultant ICT tool: a cloud‐based online ICT system; the on‐site SPEC co‐ordinators facilitated by the SPEC consultant; server manager is located at the SPEC research centre; help desk service is also provided |
| HOW | Comprehensive Geriatric Assessment: CGA‐based risk profile including key functional scales Individualised Need‐Based Care Planning: individualised need‐based care planning using standardised care protocols and checklists by on‐site SPEC co‐ordinator‐led interdisciplinary care teams, along with input from the resident/family regarding preferences and choices. Individualised, written care plans with goals, timeline and to‐do list in checklist form for each member of the care team; resident/family input Interdisciplinary Case Conferences: monthly formal face‐to‐face interdisciplinary team meetings for the care team to better understand complex case needs and develop a well‐co‐ordinated, targeted care plan; an optional intervention component due to limited financial and human resources. Care co‐ordination: co‐ordination of care using tailored reports based on CGA/care planning between care staff (administrators and direct care members), families, and contracted physicians/medical institutions to facilitate communication and promote quality of care; administrative decision‐making, order change or provision of information to residents and family, if needed; better collaboration with community resources and strengthening community linkages (e.g. contracted doctor, clinic, etc.) ICT tool: a cloud‐based online ICT system makes it easy to store and track resident data and generates various tailored reports. It also provides resources for care providers/managers. KakaoTalk, a free instant message and phone call service in South Korea, is also actively used for communication throughout the programme implementation and evaluation. |
| WHERE | 10 NHs in South Korea |
| WHEN AND HOW MUCH | Comprehensive Geriatric Assessment: at least one time for each of the participating residents; any time needed (e.g. condition change of residents) Individualized Need‐Based Care Planning: at least one time for each of the participating residents; any time plan change is needed Interdisciplinary Case Conferences: once a month on average and when a relevant case is found Care co‐ordination: any time needed but at least once a month when CGA and care planning are done ICT tool: any time needed |
| TAILORING | Intervention included tailoring of care to individual patient through individual care plans; no further tailoring reported |
| MODIFICATIONS | No changes to intervention are reported |
| HOW WELL (planned) | A process evaluation was conducted based on an evidence‐based framework for implementation fidelity using a mixed‐methods design. Quantitative data from consultant logbooks, NH documentation, an ICT system and a standardised questionnaire were collected from April 2015 to December 2016 and analyzed by calculating the descriptive statistics. Semi‐structured focus group interviews were held with multidisciplinary teams from the participating NHs. Qualitative data from a semi‐structured questionnaire and the focus group interviews were analyzed using content analysis. |
| HOW WELL (actual) | The SPEC program demonstrated good implementation fidelity, and adherence to the SPEC programme was strong in all aspects, such as content, coverage, frequency and duration. Of the participating on‐site co‐ordinators, 60% reported that the SPEC model positively impacted needs assessment and the reporting system for resident care. The important facilitating factors were tailored facilitating strategies, assurance of the quality of delivery and recruitment strategies |
| Details of any co‐interventions | No co‐interventions reported |
ICT: information and communications technology; NH: nursing home; LTCF: long‐term care facility
De Luca 2016
| Study ID | De Luca 2016 |
| WHY | Tele‐consultation appears convenient for patients who cannot be moved around, either because they are in a closed institution (a geriatric hospital or a prison or psychiatric ward, for example) or because they live in areas difficult to reach (namely rural areas). Moreover, growing evidence is demonstrating that, among the various advantages provided by tele‐health systems in the elderly, behavioural improvement may have a pivotal role. |
| WHAT (materials) | Each node of the telemedicine system used for patient monitoring consisted of a box that was connected to the monitor of a personal computer via VGA cable. The telemedicine devices used for monitoring vital signs of the elderly consisted of a pulse oximeter (Nonin Onyx 9500), aneroid sphygmomanometer (BOSO) and electrocardiograph (HeartViewTM). The data obtained from the measurement of vital parameters were transmitted from the telemedicine devices to the box via Bluetooth or wireless technology. Once the box was installed and activated, and the telemonitoring device configured, the user could access and manage the box through a remote control. The system automatically transmitted the recorded data to our telemedicine centre by using the local internet connection, without interaction of the involved subjects. The telemedicine service used the internet infrastructure on the territory, and was organised in accordance with a client/server architecture, where the two collection points (i.e. Oasi and Casa Pia) played the role of client, while the IRCCS "Bonino Pulejo" took the role of server. Here, all the information collected about the patients of the two nodes of the system was usually managed and archived. Each box was able to handle the medical instrumentation in dual modes: synchronously, for the sending of the data retrieved in real time, or asynchronously, for the delayed sending of the recorded measurements. |
| WHAT (procedures) | Once the server received the patient’s information, a technician of the telemedicine centre, who received appropriate training on e‐Health and telemedicine systems, managed and stored the data within the local server. Consequently, the neurologist, the psychologist and other health care professionals were able to check the patient conditions at any time. The health information communicated by the system included data of different types: (1) texts that usually accompany any other type of data in the form of patient’s medical history, personal data, etc.; (2) audio, such as sounds from a stethoscope; (3) medical time series, such as ECG, and other signals from the monitoring of the physiological parameters; (4) video, i.e. videoconferencing during patient’s consulting. In particular, desktop systems used for videoconference were add‐on hardware boards to normal personal computers, transforming them into videoconferencing devices. A range of different cameras and microphones were used with the board, containing the necessary codec and transmission interfaces. |
| WHO PROVIDED | The system allowed performance of the telecounselling by a skilled neurologist or psychologist. The patients’ needs or problems were either managed directly by the counsellor, or by a local nursing after the counsellor gave him the recommendation of the case. When the clinical conditions were potentially severe, so as to necessitate prompt specialised intervention, the patient was sent to the hospital. |
| HOW | Telemonitoring by the neurologist, the psychologist and other healthcare professionals |
| WHERE | NH via telemedicine monitoring |
| WHEN AND HOW MUCH | Three times per week + a weekly consultation either by a neurologist or a psychologist |
| TAILORING | No tailoring reported |
| MODIFICATIONS | No changes to intervention are reported |
| HOW WELL (planned) | It is not reported whether adherence was explicitly studied |
| HOW WELL (actual) | Not reported |
| Details of any co‐interventions | No co‐interventions reported |
NH: nursing home
Dy 2013
| Study ID | Dy 2013 |
| WHY | Treatment of diabetes in skilled nursing homes is suboptimal; assess feasibility and utility of telemedicine intervention to increase access to diabetes care in nursing home residents |
| WHAT (materials) | One‐Touch Ultra2 (LifeScan, Milpitas, CA) glucose monitoring devices; laptop computers (Latitude E6410; Dell, Round Rock, TX) with secure videoconferencing (VITAL; Govsphere, Syracuse, NY) and Skype (Microsoft, Redmond, WA) freeware (for audio) were used. Signals originating or terminating at the Diabetes Center were conveyed over the Internet via Intel (Santa Clara, CA) ProSet/wireless WIFI at up to 54 megabits per second (Mbps) and over distance along broadband Internet (Time Warner, New York, NY) at 10 Mbps or Clearwire (Bellevue, WA) 3ZG/4G WIMAX Internet to Govsphere’s dedicated Dell 2950 data center server, using https://secure sockets layer encryption over port 443. Signals originating or terminating at the SNF were conveyed locally over a Cisco (San Jose, CA) wireless router through their intranet network and for distance transmission using the Time Warner open public node or Clearwire 3G/4G WIMAX Internet. |
| WHAT (procedures) | Weekly or biweekly teleconsultations between an endocrinologist (Joslin Diabetes Center at Upstate Medical University) and the resident’s nurse and dietitian. One‐Touch Ultra2 (LifeScan, Milpitas, CA) glucose monitoring devices were used, and individual downloads were transmitted prior to televisits. Residents and family members who were able and willing attended the televisits. At televisits, point‐of‐care glucose levels, diet, medications and changes in medical conditions were reviewed, and recommendations related to changes in glycaemic control medications and diet were delivered. |
| WHO PROVIDED | Endocrinologist (Joslin Diabetes Center at Upstate Medical University) and the resident’s nurse and dietitian |
| HOW | Remotely (via teleconference) |
| WHERE | In the residential ACF |
| WHEN AND HOW MUCH | Weekly or biweekly teleconsultations over 6 months |
| TAILORING | Tailoring was part of the intervention (i.e. individualised advice provided to each resident based on point‐of‐care glucose levels, diet, medications and changes in medical conditions) |
| MODIFICATIONS | None described |
| HOW WELL (planned) | Not described |
| HOW WELL (actual) | Not described |
| Details of any co‐interventions | Intervention was provided in addition to usual care (no details provided) |
ACF ‐ aged care facility
Grabowski 2014
| Study ID | Grabowski 2014 |
| WHY | If a medical issue arises during the evening or weekend that cannot be addressed over the phone, the on‐call physician can either travel to the facility or recommend that the NH resident be transferred to a hospital. All too often, the on‐call physician recommends sending the resident to the emergency department. Telemedicine makes real‐time medical consultation available to NH patients and their families via two‐way videoconferencing. By providing patients with this direct contact, telemedicine could prevent costly hospitalisations of NH residents. |
| WHAT (materials) | No specific materials reported |
| WHAT (procedures) | Before the telemedicine service was introduced into the 6 NHs, separate training sessions were held for direct care staff members and physicians at each facility. The goals of these sessions were twofold. The first was to teach the staff members how to use the service. The second was to educate the physicians about the service and convince them to sign over their off‐hours coverage to it. Across the 6 treatment facilities, 90% of the physicians signed over their off‐hours coverage. Because an off‐hours phone consultation would not typically generate any reimbursement for the physician, this shifting of calls to the telemedicine service did not generally lead to lower revenue for the physician. The intervention consisted of introducing into the NH a cart with equipment for two‐way videoconferencing and a high‐resolution camera for use in wound care. When a NH resident had an off‐hours medical problem, a staff member brought the cart into the resident’s room and contacted the telemedicine service. The service’s medical call centre was staffed by a medical secretary and three providers: a registered nurse, a NP and a physician. Calls were triaged by the medical secretary to the appropriate provider at the call centre. |
| WHO PROVIDED | NH staff members and physicians Telemedicine provider staff ‐ a medical secretary and 3 providers: a registered nurse, a NP and a physician. |
| HOW | Telemedicine consultation |
| WHERE | 11 NHs in Massachusetts, USA |
| WHEN AND HOW MUCH | As needed, when a NH resident had an off‐hours medical problem |
| TAILORING | No tailoring reported |
| MODIFICATIONS | No changes to intervention are reported |
| HOW WELL (planned) | It is not reported whether adherence was explicitly studied |
| HOW WELL (actual) | Two facilities (D and F) categorised as 'less engaged' with the intervention based on frequency and types of telemedicine calls by month and facility, and 4 facilities (A, B, C, and E) as 'more engaged'. |
| Details of any co‐interventions | No co‐interventions reported |
NH: nursing home; NP: nurse practitioner
Lin 2014
| Study ID | Lin 2014 |
| WHY | The advantages of telerehabilitation for patients with neurological diseases include increased access to post‐acute rehabilitation services at long distance, and less cost than in‐patient services. Post‐stroke patients with functional disability will need long‐term rehabilitation care. Compared to individual therapy, short‐term group psychotherapy is a cost‐effective treatment strategy to reduce the cost of manpower for older adults living in LTCFs, as well as for stroke patients in rehabilitation units. The research hypotheses in this study would be: (1) significant improvement in balance and functional activity after telerehabilitation; (2) significant differences between telerehabilitation and conventional training groups on balance, functional activity, and satisfaction in patients with chronic stroke living in LTCFs. |
| WHAT (materials) | A WSN telerehabilitation system, including therapist end and client end, and a data center, was designed and established. The telerehabilitation systems at the "client end"(i.e. LTCF) included a personal computer with a PCI network card, two 55.88 cm screens (one regular screen for video communications and one touch screen for interactive games) and a Logitech webcam. |
| WHAT (procedures) | The online telerehabilitation functions in this pilot study included: (1) live video conferencing function in the Online Rehabilitation section; (2) Rehabilitation Education and Consultation Functions section; and (3) Assessment and Therapy Functions section. The high‐quality video conferencing system is implemented using Adobe® Media Server (Adobe® Systems Software Ireland Ltd., San Jose, CA, USA). A customised integration information window of the video and vital signs of the 2 client users can be shown on the screen of the therapist. Meanwhile, the live video of the therapist is shown on each screen of the client users, enabling them to follow the instruction of the therapist at the same time. The vital signs monitor was set at the official website. Through the aid of the information communication technology (ICT), the therapist can understand and monitor the progress of diseases, thereby effectively supervising the situation. The vital signs of heart rate (HR), oxygen saturation (SpO2), and blood pressure (BP) are measured online using the pulse oximeter (Ninon Medical, Plymouth, MN, USA) and blood pressure monitor sensors (Clever Chek, TD‐3250, Taidoc Technology Corp., New Taipei City, Taiwan), respectively, with the ZigBee wireless designed by a team member. The normal ranges were set in the software to give a precautionary signal when the responses of users are out of normal range. The alert would start when the responses of users during the rehabilitation program are in the contra‐indication range (i.e. HR > 140 b/min, SpO2 < 90%, SBP/DBP > 160/110). The therapist can control the vital sign sensors remotely using bidirectional sensor control technology; that is, turning the sensor into active mode or sleep mode. At the first visit, one volunteer or nonmedical person was instructed by the therapist about putting on and off the measuring device, such as arm cuff for blood pressure and fingertip for heart rate monitor; hence, he or she could assist the user as necessary. |
| WHO PROVIDED | The therapist (unclear if staff member of LTCF), 'therapist' provided balance training; volunteer/non‐medical person was present to monitor safety |
| HOW | Telemonitoring + one volunteer/nonmedical person was assigned at the 'patient end' for safety and assistance in both groups |
| WHERE | LTCF |
| WHEN AND HOW MUCH | 3 sessions per week for 4 weeks. Sessions approx 50 mins each |
| TAILORING | Tailoring was part of the intervention. Tailored according to severity and recovery of participants ‐ sequence, duration and intensity could be modified |
| MODIFICATIONS | No changes to intervention are reported |
| HOW WELL (planned) | It is not reported whether adherence was explicitly studied |
| HOW WELL (actual) | Not reported |
| Details of any co‐interventions | No co‐interventions reported |
LTCF ‐ long‐term care facility
Appendix 3. TIDieR information about intervention group available across studies
| Study ID | Information available | ||||||||||
| WHY (rationale, theory or goal of the elements essential to the intervention) | WHAT (physical or informational materials provided to the participants) |
WHAT (procedures used in the intervention) |
WHO PROVIDED (intervention providers) | HOW (modes of delivery) | WHERE (locations of the intervention) | WHEN AND HOW MUCH (the number of times the intervention was delivered and over what period) | TAILORING (if the intervention was planned to be personalised, titrated or adapted, then describe what, why, when and how)* | MODIFICATIONS (if the intervention was modified during the course of the study, describe the changes (what, why, when and how)) | HOW WELL (planned) (if intervention adherence or fidelity was assessed, describe how and by whom) | HOW WELL (actual) (if intervention adherence or fidelity was assessed, describe the extent to which the intervention was delivered as planned) | |
| WHO PROVIDES CARE (staffing models) | |||||||||||
| Haines 2020 | √ | X | √ | √ | √ | √ | √ | √ | X | X | √ |
| WHO PROVIDES CARE (Role expansion or task shifting) | |||||||||||
| Arendts 2018 | √ | √ | √ | √ | √ | √ | √ | √ | X | X | X |
| Kolcu 2020 | √ | X | √ | √ | √ | √ | √ | √ | X | X | X |
| WHERE CARE IS PROVIDED (Site of service delivery) | |||||||||||
| Man 2020 | √ | X | √ | √ | √ | √ | √ | √ | X | X | X |
| Uy 2008 | √ | X | X | √ | √ | √ | √ | √ | X | X | X |
| CO‐ORDINATION OF CARE (Teams) | |||||||||||
| Boorsma 2011 | √ | X | √ | √ | √ | √ | √ | √ | X | √ | √ |
| Boyd 2014 | √ | X | √ | √ | √ | √ | √ | √ | X | X | X |
| Connolly 2015 | √ | X | √ | √ | √ | √ | √ | X | X | √ | √ |
| Bellantonio, 2008 | √ | X | √ | √ | √ | √ | √ | √ | X | X | X |
| Brodaty 2003 | √ | X | √ | √ | √ | √ | √ | √ | X | X | X |
| Chapman 2007 | √ | X | √ | √ | √ | √ | √ | √ | X | X | X |
| Crotty 2004 | √ | X | √ | √ | √ | √ | √ | √ | X | X | √ |
| Lin 2010 | X | X | √ | √ | √ | √ | √ | √ | X | X | X |
| Leontjevas 2013 | √ | X | √ | √ | √ | √ | √ | √ | X | √ | √ |
| McSweeney2012 | √ | X | √ | √ | √ | √ | √ | √ | X | √ | √ |
| Neyens 2009 | √ | X | √ | √ | √ | √ | √ | √ | X | X | X |
| Temkin‐Greener 2018 | √ | X | √ | √ | √ | √ | √ | √ | X | √ | √ |
| Zwijsen 2014 | √ | X | √ | √ | √ | √ | √ | √ | X | √ | √ |
| Stern 2014 | √ | X | √ | √ | √ | √ | √ | X | X | X | √ |
| Wu 2010 | √ | X | √ | √ | √ | √ | √ | √ | X | X | X |
| Crotty 2019 | √ | X | √ | √ | √ | √ | √ | √ | X | X | √ |
| CO‐ORDINATION OF CARE (Discharge planning) | |||||||||||
| Cordato 2018 | √ | X | √ | √ | √ | √ | √ | √ | X | X | X |
| Harvey 2014 | √ | X | √ | √ | √ | √ | √ | √ | X | X | X |
| CO‐ORDINATION OF CARE (Case management) | |||||||||||
| Agar 2017 | √ | √ | √ | √ | √ | √ | √ | √ | X | √ | √ |
| Forbat 2020 | √ | X | √ | √ | √ | √ | √ | √ | X | √ | √ |
| Lichtwarck 2018 | √ | √ | √ | √ | √ | √ | √ | √ | X | √ | √ |
| Van den Block 2020 | √ | X | √ | √ | √ | √ | √ | √ | √ | √ | X |
| CO‐ORDINATION OF CARE (Care pathway) | |||||||||||
| Kotynia‐English 2005 | √ | X | √ | √ | √ | √ | √ | X | X | X | X |
| Kovach 2006 | √ | X | √ | √ | √ | √ | √ | √ | X | X | X |
| Loeb 2005 | √ | X | √ | √ | √ | √ | √ | X | X | X | X |
| Loeb 2006 | √ | X | √ | √ | √ | √ | √ | X | X | X | X |
| Pieper 2016 | √ | X | √ | √ | √ | √ | √ | √ | X | √ | √ |
| Rutten 2022 | √ | √ | √ | √ | √ | √ | √ | X | X | X | X |
| CO‐ORDINATION OF CARE (Comprehensive geriatric assessment) | |||||||||||
| Cavalieri 1993 | √ | X | √ | √ | √ | √ | √ | X | X | X | X |
| Rubenstein 1990 | √ | X | √ | √ | √ | √ | √ | √ | X | √ | √ |
| CO‐ORDINATION OF CARE (Continuity of care) | |||||||||||
| Kim 2020 | √ | X | √ | √ | √ | √ | √ | √ | X | √ | √ |
| INFORMATION AND COMMUNICATION TECHNOLOGY (Telemedicine) | |||||||||||
| De Luca 2016 | √ | √ | √ | √ | √ | √ | √ | X | X | X | X |
| Dy 2013 | √ | √ | √ | √ | √ | √ | √ | √ | X | X | X |
| Grabowski 2014 | √ | X | √ | √ | √ | √ | √ | X | X | X | √ |
| Lin 2014 | √ | √ | √ | √ | √ | √ | √ | √ | X | X | X |
| Note: while for most of the TIDierR items some information could be extracted from the study reports (as denoted by √), details are often lacking. See Appendix 2 for detailed intervention description according to TIDierR items. When materials used were described but not provided (e.g. as supplementary materials), the corresponding TIDieR item is denoted as X. *Tailoring was rarely explicitly reported, however it is denoted as √ when it was implicitly part of interventions with e.g. focus on person‐centred care or use of individual treatment plans. | |||||||||||
Appendix 4. TIDieR information about control group available across studies
| Study ID | Information available | ||||||||||
| WHY (rationale, theory or goal of the elements essential to the intervention) | WHAT (physical or informational materials provided to the participants) | WHAT (procedures used in the intervention) | WHO PROVIDED (intervention providers) | HOW (modes of delivery) | WHERE (locations of the intervention) | WHEN AND HOW MUCH (the number of times the intervention was delivered and over what period) | TAILORING (if the intervention was planned to be personalised, titrated or adapted, then describe what, why, when and how)* | MODIFICATIONS (if the intervention was modified during the course of the study, describe the changes (what, why, when and how)) | HOW WELL (planned) (if intervention adherence or fidelity was assessed, describe how and by whom) | HOW WELL (actual) (if intervention adherence or fidelity was assessed, describe the extent to which the intervention was delivered as planned) | |
| WHO PROVIDES CARE (staffing models) | |||||||||||
| Haines 2020 | X | X | √ | √ | √ | √ | X | X | X | X | X |
| WHO PROVIDES CARE (Role expansion or task shifting) | |||||||||||
| Arendts 2018 | X | X | X | √ | √ | √ | X | X | X | X | X |
| Kolcu 2020 | X | X | √ | X | √ | √ | X | X | X | X | X |
| WHERE CARE IS PROVIDED (Site of service delivery) | |||||||||||
| Man 2020 | X | X | X | X | √ | √ | X | X | X | X | X |
| Uy 2008 | X | X | X | X | √ | √ | X | X | X | X | X |
| CO‐ORDINATION OF CARE (Teams) | |||||||||||
| Boorsma 2011 | X | X | X | √ | √ | √ | X | X | X | X | X |
| Boyd 2014 | X | X | X | X | √ | √ | X | X | X | X | X |
| Connolly 2015 | X | X | X | X | √ | √ | X | X | X | X | X |
| Bellantonio, 2008 | X | X | √ | √ | √ | √ | X | X | X | X | X |
| Brodaty 2003 | X | X | √ | X | √ | √ | X | X | X | X | X |
| Chapman 2007 | X | X | √ | X | √ | √ | X | X | X | X | X |
| Crotty 2004 | X | X | X | X | X | X | X | X | X | X | X |
| Lin 2010 | X | X | X | √ | √ | √ | X | X | X | X | X |
| Leontjevas 2013 | X | X | √ | X | √ | √ | X | X | X | X | X |
| McSweeney2012 | X | X | X | X | X | √ | X | X | X | X | X |
| Neyens 2009 | X | X | X | X | X | X | X | X | X | X | X |
| Temkin‐Greener 2018 | X | X | √ | X | X | √ | X | X | X | X | X |
| Zwijsen 2014 | X | X | √ | √ | √ | √ | √ | X | X | X | X |
| Stern 2014 | X | X | X | √ | √ | √ | X | X | X | X | X |
| Wu 2010 | X | X | X | √ | √ | √ | X | X | X | X | X |
| Crotty 2019 | X | X | √ | √ | √ | √ | X | X | X | X | X |
| CO‐ORDINATION OF CARE (Discharge planning) | |||||||||||
| Cordato 2018 | X | X | X | √ | √ | √ | X | X | X | X | X |
| Harvey 2014 | X | X | √ | √ | √ | √ | X | X | X | X | X |
| CO‐ORDINATION OF CARE (Case management) | |||||||||||
| Agar 2017 | X | X | X | X | √ | √ | X | X | X | √ | X |
| Forbat 2020 | X | X | √ | √ | √ | √ | X | X | X | X | X |
| Lichtwarck 2018 | X | X | X | X | X | X | X | X | X | X | X |
| Van den Block 2020 | X | X | X | X | X | X | X | X | X | X | X |
| CO‐ORDINATION OF CARE (Care pathway) | |||||||||||
| Kotynia‐English 2005 | X | X | X | X | √ | √ | X | X | X | X | X |
| Kovach 2006 | X | X | X | X | X | X | X | X | X | X | X |
| Loeb 2005 | X | X | X | X | √ | √ | X | X | X | X | X |
| Loeb 2006 | X | X | X | √ | √ | √ | X | X | X | X | X |
| Pieper 2016 | X | X | X | √ | X | √ | X | X | X | X | X |
| Rutten 2022 | X | X | X | √ | √ | √ | X | X | X | X | X |
| CO‐ORDINATION OF CARE (Comprehensive geriatric assessment) | |||||||||||
| Cavalieri 1993 | X | X | X | √ | √ | √ | X | X | X | X | X |
| Rubenstein 1990 | X | X | X | X | X | √ | X | X | X | X | X |
| CO‐ORDINATION OF CARE (Continuity of care) | |||||||||||
| Kim 2020 | X | X | X | X | X | √ | X | X | X | X | X |
| INFORMATION AND COMMUNICATION TECHNOLOGY (Telemedicine) | |||||||||||
| De Luca 2016 | X | X | X | X | X | √ | X | X | X | X | X |
| Dy 2013 | X | X | X | X | X | X | X | X | X | X | X |
| Grabowski 2014 | X | X | √ | √ | √ | √ | X | X | X | X | X |
| Lin 2014 | X | X | √ | √ | √ | √ | X | X | X | X | X |
| See Table 2 and Characteristics of included studies for detailed description of the control group as provided by the studies. | |||||||||||
Appendix 5. Additional analyses
(Unplanned) hospitalisation: incidence rate ratio (Forbat 2020)
| No. of hospitalisations > 24 h | No. of hospitalisations < 24 h | |||
| Exposed | Unexposed | Exposed | Unexposed | |
| Cases | 528 | 415 | 123 | 83 |
| Person‐time | 124 | 74 | 124 | 74 |
| Incidence rate per facility‐month | 4.26 | 5.61 | 0.99 | 1.12 |
| Incidence rate ratio: point estimate (exposed/unexposed) | 0.76 | 0.88 | ||
| Incidence rate ratio: 95% CI | 0.67 to 0.87 | 0.66 to 1.18 | ||
Footnotes
See Table 2 Forbat 2020
Unplanned (acute) hospitalisation: incidence rate ratio (Boyd 2014)
| RAW | Per 1000 bed‐days | |||
| Exposed | Unexposed | Exposed | Unexposed | |
| Cases | 710 | 578 | 710 | 578 |
| Person‐time | 520125 | 411720 | 520.125 | 411.720 |
| Incidence rate | 0.001 | 0.0014 | 1.37 | 1.40 |
| Incidence rate ratio: point estimate (exposed/unexposed) | 0.97 | |||
| Incidence rate ratio: 95% CI | 0.87 to 1.09 | |||
Footnotes
See Table 2 Boyd 2014
Falls: incidence rate ratio (Crotty 2019)
| Including those who died | Exposed | Unexposed | Total |
| Cases | 162 | 96 | 258 |
| Person‐time | 3335 | 3388 | 6723 |
| Incidence rate | 0.05 | 0.03 | 0.04 |
| Incidence rate difference | 0.02 | 95% CI 0.01 to 0.03 | |
| Incidence rate ratio | 1.71 | 95% CI 1.32 to 2.23 | |
| Excluding those who died | Exposed | Unexposed | Total |
| Cases | 162 | 96 | 258 |
| Person‐time | 3052 | 2772 | 5824 |
| Incidence rate | 0.05 | 0.03 | 0.04 |
| Incidence rate difference | 0.02 | 95% CI 0.01 to 0.03 | |
| Incidence rate ratio | 1.53 | 95% CI 1.18 to 1.99 | |
Footnotes
Estimate patient days, assuming 10 and 22 patients died during the first 30 days (as per PRISMA flow diagram); estimated 2 IRR (including those who died (analysis 1) and excluding them (analysis 2)) the true rate will be somewhere in between. We used the first one for the review; we used 28 days instead of 30 for 4‐week assessment.
Data and analyses
Comparison 1. Any alternative model of care versus usual care.
| Outcome or subgroup title | No. of studies | No. of participants | Statistical method | Effect size |
|---|---|---|---|---|
| 1.1 ED visits (proportion of residents with at least one ED visit) | 7 | 1276 | Risk Ratio (M‐H, Random, 95% CI) | 1.01 [0.84, 1.20] |
| 1.2 ED visits (proportion of residents with at least one ED visit): sensitivity analysis by risk of bias | 7 | 1276 | Risk Ratio (M‐H, Random, 95% CI) | 1.01 [0.84, 1.20] |
| 1.2.1 High or unclear risk of bias | 4 | 829 | Risk Ratio (M‐H, Random, 95% CI) | 0.95 [0.63, 1.44] |
| 1.2.2 Low risk of bias | 3 | 447 | Risk Ratio (M‐H, Random, 95% CI) | 1.00 [0.80, 1.25] |
| 1.3 ED visits (mean number of ED visits per resident) | 2 | 704 | Mean Difference (IV, Random, 95% CI) | ‐0.20 [‐0.76, 0.35] |
| 1.4 ED visits: logarithm of rate ratio per person‐time | 2 | 204 | Risk Ratio (IV, Random, 95% CI) | 0.73 [0.25, 2.15] |
| 1.5 Unplanned hospital admissions (proportion of residents with at least one unplanned hospital admission) | 8 | 1263 | Risk Ratio (M‐H, Random, 95% CI) | 0.74 [0.56, 0.99] |
| 1.6 Unplanned hospital admissions (proportion of residents with at least one unplanned hospital admission): subgroup analysis by EPOC category | 8 | 1263 | Risk Ratio (M‐H, Random, 95% CI) | 0.74 [0.56, 0.99] |
| 1.6.1 Who provides care | 1 | 77 | Risk Ratio (M‐H, Random, 95% CI) | 0.81 [0.48, 1.37] |
| 1.6.2 Co‐ordination of care | 7 | 1186 | Risk Ratio (M‐H, Random, 95% CI) | 0.73 [0.52, 1.01] |
| 1.7 Unplanned hospital admissions (proportion of residents with at least one unplanned hospital admission): subgroup analysis by type of care provided | 8 | 1263 | Risk Ratio (M‐H, Random, 95% CI) | 0.74 [0.56, 0.99] |
| 1.7.1 Primary care | 4 | 559 | Risk Ratio (M‐H, Random, 95% CI) | 0.65 [0.47, 0.89] |
| 1.7.2 Primary and secondary care | 4 | 704 | Risk Ratio (M‐H, Random, 95% CI) | 0.80 [0.53, 1.22] |
| 1.8 Unplanned hospital admissions (proportion of residents with at least one unplanned hospital admission): subgroup analysis by resident's condition | 8 | 1263 | Risk Ratio (M‐H, Random, 95% CI) | 0.74 [0.56, 0.99] |
| 1.8.1 Recently discharged | 3 | 399 | Risk Ratio (M‐H, Random, 95% CI) | 0.71 [0.36, 1.41] |
| 1.8.2 Residents with infections | 2 | 382 | Risk Ratio (M‐H, Random, 95% CI) | 0.53 [0.29, 0.95] |
| 1.8.3 Mixed health residents | 2 | 382 | Risk Ratio (M‐H, Random, 95% CI) | 0.95 [0.79, 1.15] |
| 1.8.4 Mental/behavioural issues | 1 | 100 | Risk Ratio (M‐H, Random, 95% CI) | 0.59 [0.33, 1.06] |
| 1.9 Unplanned hospital admissions (proportion of residents with at least one unplanned hospital admission): sensitivity analysis by risk of bias | 8 | 1263 | Risk Ratio (M‐H, Random, 95% CI) | 0.74 [0.56, 0.99] |
| 1.9.1 High or unclear risk of bias | 4 | 511 | Risk Ratio (M‐H, Random, 95% CI) | 0.57 [0.38, 0.86] |
| 1.9.2 Low risk of bias | 4 | 752 | Risk Ratio (M‐H, Random, 95% CI) | 0.87 [0.65, 1.16] |
| 1.10 Unplanned hospital admissions (proportion of residents with at least one unplanned hospital admission): sensitivity analysis by timing of effect | 8 | 1263 | Risk Ratio (M‐H, Random, 95% CI) | 0.74 [0.56, 0.99] |
| 1.10.1 Short term < 12 months | 6 | 881 | Risk Ratio (M‐H, Random, 95% CI) | 0.66 [0.45, 0.97] |
| 1.10.2 Long term > 12 months | 2 | 382 | Risk Ratio (M‐H, Random, 95% CI) | 0.95 [0.79, 1.15] |
| 1.11 Unplanned hospital admissions (mean number of unplanned hospital admissions per resident) | 3 | 820 | Mean Difference (IV, Random, 95% CI) | ‐0.14 [‐0.38, 0.10] |
| 1.12 Unplanned hospital admissions (logarithm of rate ratio) | 4 | 9968 | Risk Ratio (IV, Random, 95% CI) | 0.93 [0.78, 1.12] |
| 1.13 Adverse events/falls (proportion of residents with a fall) | 3 | 1061 | Risk Ratio (M‐H, Random, 95% CI) | 1.15 [0.83, 1.60] |
| 1.14 Adverse events/falls (proportion of residents with a fall): subgroup analysis by type of care provided | 3 | 1061 | Risk Ratio (M‐H, Random, 95% CI) | 1.15 [0.83, 1.60] |
| 1.14.1 Primary care | 2 | 821 | Risk Ratio (M‐H, Random, 95% CI) | 0.98 [0.85, 1.12] |
| 1.14.2 Primary and secondary care | 1 | 240 | Risk Ratio (M‐H, Random, 95% CI) | 1.46 [1.06, 2.01] |
| 1.15 Adverse events/falls (proportion of residents with a fall): sensitivity analysis by risk of bias | 3 | 1061 | Risk Ratio (M‐H, Random, 95% CI) | 1.15 [0.83, 1.60] |
| 1.15.1 High or unclear risk of bias | 2 | 400 | Risk Ratio (M‐H, Random, 95% CI) | 1.17 [0.72, 1.90] |
| 1.15.2 Low risk of bias | 1 | 661 | Risk Ratio (M‐H, Random, 95% CI) | 1.14 [0.72, 1.79] |
| 1.16 Adverse events/falls (proportion of residents with a fall): sensitivity analysis by timing of effects | 3 | 1061 | Risk Ratio (M‐H, Random, 95% CI) | 1.15 [0.83, 1.60] |
| 1.16.1 Short‐term | 2 | 901 | Risk Ratio (M‐H, Random, 95% CI) | 1.34 [1.03, 1.75] |
| 1.16.2 Longer‐term | 1 | 160 | Risk Ratio (M‐H, Random, 95% CI) | 0.97 [0.84, 1.11] |
| 1.17 Adverse events/falls (mean number of falls per resident) | 2 | 270 | Mean Difference (IV, Random, 95% CI) | ‐0.06 [‐0.13, 0.00] |
| 1.18 Adverse events/falls (logarithm of rate ratio) | 4 | 1028 | Risk Ratio (IV, Random, 95% CI) | 1.07 [0.70, 1.65] |
| 1.19 Adverse events/injurious falls (proportion of residents with an injurious fall) | 1 | Risk Ratio (M‐H, Random, 95% CI) | Totals not selected | |
| 1.20 Adverse events/injurious falls (mean number of injurious falls per resident) | 1 | Mean Difference (IV, Random, 95% CI) | Totals not selected | |
| 1.21 Adverse events/infections (proportion of residents with an infection) | 1 | Risk Ratio (M‐H, Random, 95% CI) | Totals not selected | |
| 1.22 Adherence to clinical guideline‐recommended care (proportion of residents with adequate antidepressant therapy) | 1 | Risk Ratio (M‐H, Random, 95% CI) | Totals not selected | |
| 1.23 Adherence to clinical guideline‐recommended care (proportion of residents with adequate antidepressant therapy, two intervention arms combined) | 1 | 65 | Risk Ratio (M‐H, Random, 95% CI) | 5.29 [1.08, 26.00] |
| 1.24 Adherence to clinical guideline‐recommended care (proportion of residents with adequate antipsychotic therapy) | 1 | Risk Ratio (M‐H, Random, 95% CI) | Totals not selected | |
| 1.25 Adherence to clinical guideline‐recommended care (proportion of residents with adequate antipsychotic therapy, two arms combined) | 1 | 52 | Risk Ratio (M‐H, Random, 95% CI) | 3.21 [0.42, 24.44] |
| 1.26 Adherence to clinical guideline‐recommended care (proportion of residents with adequate antibiotic therapy) | 1 | Risk Ratio (M‐H, Fixed, 95% CI) | Totals not selected | |
| 1.27 Adherence to clinical guidelines (MAI) | 1 | Mean Difference (IV, Random, 95% CI) | Totals not selected | |
| 1.28 Quality of life (standardised mean difference) | 12 | 4016 | Std. Mean Difference (IV, Random, 95% CI) | ‐0.04 [‐0.09, 0.01] |
| 1.28.1 EQ‐5D | 6 | 1974 | Std. Mean Difference (IV, Random, 95% CI) | ‐0.06 [‐0.09, ‐0.02] |
| 1.28.2 SF‐36 | 1 | 76 | Std. Mean Difference (IV, Random, 95% CI) | 0.71 [‐0.01, 1.43] |
| 1.28.3 SF‐12 | 1 | 179 | Std. Mean Difference (IV, Random, 95% CI) | ‐0.04 [‐0.34, 0.26] |
| 1.28.4 QUALIDEM | 2 | 924 | Std. Mean Difference (IV, Random, 95% CI) | ‐0.02 [‐0.18, 0.15] |
| 1.28.5 Minimum data set | 1 | 661 | Std. Mean Difference (IV, Random, 95% CI) | 0.02 [‐0.13, 0.17] |
| 1.28.6 QoL in late‐stage dementia scale | 1 | 202 | Std. Mean Difference (IV, Random, 95% CI) | 0.25 [‐0.03, 0.53] |
| 1.29 Quality of life (standardised mean difference): sensitivity analysis by risk of bias | 12 | 4016 | Std. Mean Difference (IV, Random, 95% CI) | ‐0.04 [‐0.09, 0.01] |
| 1.29.1 High or unclear risk of bias | 7 | 2598 | Std. Mean Difference (IV, Random, 95% CI) | ‐0.01 [‐0.11, 0.09] |
| 1.29.2 Low risk of bias | 5 | 1418 | Std. Mean Difference (IV, Random, 95% CI) | ‐0.07 [‐0.12, ‐0.01] |
| 1.30 Quality of life (standardised mean difference): sensitivity analysis by timing of effect | 12 | 4016 | Std. Mean Difference (IV, Random, 95% CI) | ‐0.04 [‐0.09, 0.01] |
| 1.30.1 Short‐term | 8 | 1896 | Std. Mean Difference (IV, Random, 95% CI) | 0.01 [‐0.11, 0.13] |
| 1.30.2 Longer‐term | 4 | 2120 | Std. Mean Difference (IV, Random, 95% CI) | ‐0.06 [‐0.10, ‐0.02] |
| 1.31 Quality of life (no meta‐analysis, calculations for individual studies) | 6 | Std. Mean Difference (IV, Random, 95% CI) | Totals not selected | |
| 1.31.1 EQ‐5D | 2 | Std. Mean Difference (IV, Random, 95% CI) | Totals not selected | |
| 1.31.2 SF‐12 | 1 | Std. Mean Difference (IV, Random, 95% CI) | Totals not selected | |
| 1.31.3 SF‐36 | 1 | Std. Mean Difference (IV, Random, 95% CI) | Totals not selected | |
| 1.31.4 QoL in late‐stage dementia scale | 1 | Std. Mean Difference (IV, Random, 95% CI) | Totals not selected | |
| 1.31.6 Minimum Data Set Health Status Index | 1 | Std. Mean Difference (IV, Random, 95% CI) | Totals not selected | |
| 1.32 Mortality (proportion of residents who died) | 24 | 3881 | Risk Ratio (M‐H, Random, 95% CI) | 1.03 [0.92, 1.16] |
| 1.33 Mortality (proportion of residents who died): sensitivity analyses by risk of bias | 24 | 3881 | Risk Ratio (M‐H, Random, 95% CI) | 1.03 [0.92, 1.16] |
| 1.33.1 Unclear or high risk of bias | 14 | 2036 | Risk Ratio (M‐H, Random, 95% CI) | 1.02 [0.89, 1.18] |
| 1.33.2 Low risk of bias | 10 | 1845 | Risk Ratio (M‐H, Random, 95% CI) | 1.06 [0.87, 1.29] |
| 1.34 Mortality (proportion of residents who died): sensitivity analysis by timing of effect | 24 | 3920 | Risk Ratio (M‐H, Random, 95% CI) | 1.03 [0.92, 1.16] |
| 1.34.1 Short‐term | 21 | 3281 | Risk Ratio (M‐H, Random, 95% CI) | 1.07 [0.94, 1.22] |
| 1.34.2 Longer‐term | 3 | 639 | Risk Ratio (M‐H, Random, 95% CI) | 0.92 [0.73, 1.16] |
| 1.35 Any hospital admission (proportion of residents with at least one hospital admission) | 13 | 2366 | Risk Ratio (M‐H, Random, 95% CI) | 0.83 [0.70, 0.99] |
| 1.36 Any hospital admission (proportion of residents with at least one hospital admission): sensitivity analysis by risk of bias | 13 | 2366 | Risk Ratio (M‐H, Random, 95% CI) | 0.83 [0.70, 0.99] |
| 1.36.1 Unclear or high risk of bias | 7 | 1343 | Risk Ratio (M‐H, Random, 95% CI) | 0.75 [0.57, 1.00] |
| 1.36.2 Low risk of bias | 6 | 1023 | Risk Ratio (M‐H, Random, 95% CI) | 0.91 [0.73, 1.14] |
| 1.37 Any hospital admission (proportion of residents with at least one hospital admission): sensitivity by timing of effect | 13 | 2366 | Risk Ratio (M‐H, Random, 95% CI) | 0.83 [0.70, 0.99] |
| 1.37.1 Short‐term | 11 | 1901 | Risk Ratio (M‐H, Random, 95% CI) | 0.80 [0.63, 1.03] |
| 1.37.2 Longer‐term | 2 | 465 | Risk Ratio (M‐H, Random, 95% CI) | 0.87 [0.66, 1.13] |
| 1.38 Any hospital admission (mean number of hospital admissions per resident) | 4 | 980 | Mean Difference (IV, Random, 95% CI) | ‐0.27 [‐0.54, 0.00] |
| 1.39 Any hospital admission (logarithm of rate ratio) | 6 | Rate Ratio (IV, Random, 95% CI) | 0.91 [0.75, 1.11] | |
| 1.40 Length of hospital stay (mean number of days per resident) | 5 | Mean Difference (IV, Random, 95% CI) | ‐1.22 [‐2.31, ‐0.14] | |
| 1.41 Length of hospital stay (mean number of days per resident): subgroup analysis by type of care provided | 5 | Mean Difference (IV, Random, 95% CI) | ‐1.22 [‐2.31, ‐0.14] | |
| 1.41.1 Primary care | 2 | Mean Difference (IV, Random, 95% CI) | ‐3.30 [‐8.54, 1.95] | |
| 1.41.2 Primary and secondary care | 3 | Mean Difference (IV, Random, 95% CI) | ‐1.22 [‐3.42, 0.98] | |
| 1.42 Length of hospital stay (mean number of days per resident): sensitivity analysis by risk of bias | 5 | 3832 | Mean Difference (IV, Random, 95% CI) | ‐1.22 [‐2.31, ‐0.14] |
| 1.42.1 Unclear or high risk of bias | 2 | 203 | Mean Difference (IV, Random, 95% CI) | ‐4.93 [‐7.57, ‐2.29] |
| 1.42.2 Low risk of bias | 3 | 3629 | Mean Difference (IV, Random, 95% CI) | ‐0.53 [‐1.17, 0.10] |
| 1.43 Length of hospital stay (mean number of days per resident): sensitivity analysis by timing of effect | 5 | Mean Difference (IV, Random, 95% CI) | ‐1.22 [‐2.31, ‐0.14] | |
| 1.43.1 Short term | 4 | Mean Difference (IV, Random, 95% CI) | ‐0.70 [‐1.47, 0.08] | |
| 1.43.2 Longer term | 1 | Mean Difference (IV, Random, 95% CI) | ‐6.35 [‐10.23, ‐2.47] | |
| 1.44 Length of hospital stay (mean number of days per resident): no meta‐analysis, calculations for individual studies | 5 | Mean Difference (IV, Random, 95% CI) | Totals not selected | |
| 1.45 Length of hospital stay (mean number of days per admission/admitted resident) | 2 | 225 | Mean Difference (IV, Random, 95% CI) | 0.25 [‐1.42, 1.92] |
| 1.46 Residents’ satisfaction with the health care received (mean satisfaction score) | 1 | 81 | Mean Difference (IV, Random, 95% CI) | 0.22 [‐2.69, 3.13] |
| 1.47 Proportion of residents’ satisfied with the health care received | 1 | 44 | Risk Ratio (M‐H, Random, 95% CI) | 1.63 [1.14, 2.32] |
| 1.48 'Next of kin' satisfaction with the health care received | 2 | 421 | Mean Difference (IV, Random, 95% CI) | ‐0.05 [‐0.20, 0.09] |
1.31. Analysis.
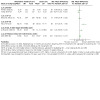
Comparison 1: Any alternative model of care versus usual care, Outcome 31: Quality of life (no meta‐analysis, calculations for individual studies)
1.44. Analysis.
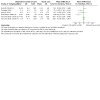
Comparison 1: Any alternative model of care versus usual care, Outcome 44: Length of hospital stay (mean number of days per resident): no meta‐analysis, calculations for individual studies
Characteristics of studies
Characteristics of included studies [ordered by study ID]
Agar 2017.
| Study characteristics | ||
| Methods |
Aim of the study: to compare the effects of facilitated (family) case conferencing (FCC) with usual care (UC) on end‐of‐life care Study design: cRCT Unit of randomisation: RACF Mean cluster size: 14 residents (286 residents received intervention or control in 20 nursing homes) Unit of analyses: individual resident Sample size calculation: Authors assumed an intracluster correlation coefficient (ICC) of 0.05 (estimated from unpublished data sourced from Dutch nursing homes), a sample size of 8 clusters per arm with 15 residents (who died during the study period and for whom EOL outcomes would be available) per cluster (i.e. N = 240 in total), was considered adequate to identify a between‐arm difference of 0.5 standard deviation (SD) on the EOLD scale with a two‐sided 5% significance level and power of 80%. Authors conservatively anticipated a 10% resident dropout rate (e.g. withdrawal of consent to participate in the study; resident moved to another nursing home). Allowing for this, a recruitment target of 272 people with advanced dementia (17 per site) was set. This calculation incorporated an estimate that almost all people (98%) meeting the inclusion criteria would die (and so yield data on EOL care) within the study period (< 18 months) based on review of dementia‐specific mortality data from local nursing homes and evidence from the literature relating to prognostic variables referred to above. In other words, with a 10% withdrawal rate and 2% survival rate, of 272 participants, the authors expected 27 to withdraw, and of the remaining 245, 5 to survive to the end of the study period, resulting in a total sample size of 240 available for analysis. |
|
| Participants |
Participants: people with advanced dementia living in residential care where surrogate decision‐maker needed for palliative care planning. Potentially eligible residents needed to have dementia documented in nursing home records and advanced dementia as determined by scores on the: 1) Functional Assessment Staging Tool (FAST) in dementia (≥ 6a, stable for 1 month), and 2) Australia‐modified Karnofsky Performance Status (AKPS) ≤ 50 Intervention group: n = 130 (outcomes collected on residents who died n = 67) Control group: n = 156 (outcomes collected on residents who died n = 64) Age: mean (SD) intervention/control 84.7 (7.9)/85.8 (8.2) Sex: proportion females intervention/control 61%/58% Comorbidities: not reported, all participants had dementia Setting: RACF Country: Australia |
|
| Interventions |
Intervention arm: Facilitated case conferencing (FCC) Theoretical frameworks underpinning FCC included the expected trajectory of advanced dementia and evidence‐based strategies for organisational culture change (clinical leadership and train‐the‐trainer). A Registered Nurse was trained as a Palliative Care Planning Coordinator (PCPC) in each nursing home working for 2 days per week or equivalent to: 1) identify residents with advanced dementia likely to benefit from a case conference; 2) organise, set an agenda, chair and document case conferences with optimal participation by family, multidisciplinary nursing home staff and external health professionals (e.g. General Practitioners (GPs)); 3) develop and oversee implementation of palliative care plans; and 4) train nursing and direct care staff in person‐centred palliative care. The key features of the case conference model were: use of pre‐defined specific clinical triggers for a case conference; use of a shared agenda setting model where the resident, their family and all multidisciplinary staff could specify a priori areas for discussion; required attendance of the resident or their substitute decision maker or family member(s); was facilitated by the PCPC to ensure optimal participation of attendees; and was followed by a communication strategy to summarise actions and plan arising from the case conference. Discussion topics were not limited and were individualised to what was seen as important for the resident; and could include care planning, current and future treatment decision‐making, information sharing, meeting resident preferences or needs and advance care planning. Duration of the intervention: 18 months Details of the intervention: see TIDieR checklist for full details of intervention (Appendix 2) Control arm: in nursing homes randomised to usual care, no staff education, training or support was provided. No restrictions were placed on nursing homes’ education programme, or approach to care planning and decision‐making. EPOC category: co‐ordination of care (subcategory: Case Management) Type of care: primary care (palliative care) |
|
| Outcomes |
Time points: baseline, every 2 weeks and every 3 months thereafter, up to 18 months; last month of life (not all outcomes measured at all time points) Primary outcomes: (family‐rated)end of life care (End of Life in Dementia (EOLD) scales) Secondary outcomes:
Loss of clusters and individuals: no loss of clusters or individuals reported Adjusted for clustering for each outcome: yes Method of cluster adjustment for each outcome: generalised linear mixed model ICC reported for each outcome: yes |
|
| Notes |
Outcomes used in this review:
Unit of analysis error: no Ethical approval and informed consent obtained: yes Funding source: Australian Department of Health (previously Department of Health and Ageing) Declarations of interest: none declared or detected Contact with author: yes Additional outcome data provided from author: no Trial registration: ACTRN12612001164886 |
|
| Risk of bias | ||
| Bias | Authors' judgement | Support for judgement |
| Random sequence generation (selection bias) | Low risk | Block randomisation of nursing homes used a computer‐generated allocation sequence |
| Allocation concealment (selection bias) | Low risk | Block randomisation occurred after initial consent. Nursing home managers were not blinded to allocation because they needed to make a fully informed decision regarding nursing home participation. All 20 consenting homes (from 49 approached) participated in the study. Reasons for declining to participate included a lack of interest in research, other research projects or confidence in their case conferencing and palliative care programmes. Email communication with authors: "None of the withdrawals took place after randomisation. The reasons those that pulled out gave generally related to a change of mind in the context of competing priorities and staffing challenges." |
| Blinding of participants and personnel (performance bias) Outcomes reported in summary of findings table | High risk | Due to the system‐level nature of the intervention, participating investigators, project managers and nursing home managers could not be blinded to the evaluative aim of the research or to nursing home allocation. Staff, residents and families at each nursing home were blinded to the evaluative aim of the study, but those in nursing homes allocated to the intervention arm were aware of associated changes to practice. |
| Blinding of outcome assessment (detection bias) Outcomes reported in summary of findings table | High risk | Research staff were blinded to the evaluative aim of the study and collected data from nursing homes in only one arm to reduce the likelihood they would notice systematic differences in practice. However, the lead investigator (MA), the national project co‐ordinator (TL), and two state‐based project managers remained unblinded for the purpose of liaising with implementation personnel and ensuring protocol fidelity. The assessment of end‐of‐life care outcomes and the nurse‐rated QoL were likely to be biased. Assessment of adverse events, hospitalisations, mortality and ED visits is unlikely to be subject to bias. |
| Incomplete outcome data (attrition bias) All outcomes | Low risk | Reasons for dropout are clearly reported; no substantial differences between study arms |
| Selective reporting (reporting bias) | Unclear risk | Published protocol available; not all outcome data on all pre‐specified time‐points has (yet) been published. |
| Other bias | High risk | Recruitment bias: HIGH ‐ written informed consent was collected after randomisation of nursing homes. Nurse was trained as a Palliative Care Planning Coordinator (PCPC) in each nursing home working for 2 days per week or equivalent to identify residents with advanced dementia likely to benefit from a case conference so it appears that recruitment occurred after randomisation. Baseline imbalance: UNCLEAR ‐ baseline differences in number of residents born in Australia; staff Knowledge Test on palliative care for Advanced Dementia (higher in intervention group), number of daily visitors (higher in intervention group). It is hard to know if any of these factors affected the outcomes of interest. Protection against contamination: LOW ‐ unlikely to be biased due to contamination/‘herd effects’ as the delivery of the intervention occurred as per RACF policy/practice and was not subject to participant choice or compliance Incorrect analysis: LOW ‐ analyses appropriately adjusted for clustering No other sources of bias detected. |
Arendts 2018.
| Study characteristics | ||
| Methods |
Aim of the study: to determine the effectiveness of NP care delivered by experienced nurse practitioners responsible for residents' care informed by a best practice guide for the care processes being delivered and co‐ordinated by those nurses Study design: cluster‐RCT Unit of randomisation: RACF Mean cluster size: 33 residents (101 residents from 3 clusters in intervention group and 99 residents from 3 clusters in control group) Unit of analyses: individual resident Sample size calculation: 250 patients for 80% power to detect this risk difference at a significance level of 0.05 (based on an estimated mean exposure time of 1 year). Previous research in the setting of this study showed an incidence of 75 transfers for each 100 RACF residents per year. However, as transfer rates are as low as 30/100 RACF residents/year in some jurisdictions, authors based their sample size estimates on this, with an assumption that halving this to 15 transfers/100 residents/year (i.e. relative risk = 0.5) would be clinically meaningful. |
|
| Participants |
Participants: permanent (non‐respite) RACF residents aged 65 years or older and with a life expectancy of more than 180 days Intervention group: n = 101 Control group: n = 99 Age: median (IQR) intervention/control 89 (8)/89 (9) Sex: proportion females intervention/control 82%/70% Comorbidities: median (IQR) intervention/control 6 (3)/6 (3) Setting: RACF Country: Australia |
|
| Interventions |
Intervention arm: Nurse practitioner led care using best practice guide In intervention facilities:
Duration of the intervention: participants were followed up (i.e. provided the specific type of care their facility was randomised to) for a minimum of 12 months unless dead or transferred to another facility Details of the intervention: see TIDieR checklist for full details of intervention (Appendix 2) Control arm: in control facilities, residents received usual care and were assigned to GPs who were responsible for their care. Neither NPs nor the resource folder of best practice guidelines was available. EPOC category: who provides care (subcategory: Role expansion or task shifting) Type of care: primary care |
|
| Outcomes |
Time points: baseline and every 6 months thereafter, up to a maximum of 32 months Primary outcomes: unplanned ED visits Secondary outcomes: health‐related QoL measured using Health Utility Index Mark 2/3 and the EuroQol (EQ‐5D‐3L), modified Barthel index, death, hospital inpatient admissions, total hospital bed‐days Loss of clusters and individuals: not reported Adjusted for clustering for each outcome: no Method of cluster adjustment for each outcome: n/a, analyses not adjusted for clustering ICC reported for each outcome: n/a, analyses not adjusted for clustering |
|
| Notes |
Outcomes used in this review:
Unit of analysis error: yes (correspondence with study author confirmed that the analysis did not account for clustering) Ethical approval and informed consent obtained: yes Funding source: a grant from the JO and JR Wicking Trust Declarations of interest: none declared or detected Contact with author: yes Additional outcome data provided from author: yes, authors provided data on the number of hospital admissions and number of patients with at least one hospital admission Trial registration: ACTRN12611000933954 |
|
| Risk of bias | ||
| Bias | Authors' judgement | Support for judgement |
| Random sequence generation (selection bias) | Low risk | "... three facilities randomly allocated as intervention and three as control." Additional information provided by authors via email: "We had three pairs of matched facilities and random coin toss decided which arm the facility was allocated" |
| Allocation concealment (selection bias) | Low risk | "We had three pairs of matched facilities and random coin toss decided which arm the facility was allocated" |
| Blinding of participants and personnel (performance bias) Outcomes reported in summary of findings table | High risk | Participants and personnel were not blinded; at least some outcomes would likely be influenced by the lack of blinding (i.e. ED visits, health‐related quality of life). |
| Blinding of outcome assessment (detection bias) Outcomes reported in summary of findings table | Low risk | It is unclear how assessors were blinded. "Where possible, outcomes will be assessed by researchers blinded to the allocation status of the patient." However, lack of blinding was unlikely to bias assessment of the primary outcomes included in this review (i.e. ED visits). |
| Incomplete outcome data (attrition bias) All outcomes | Unclear risk | A flowchart is not provided. Attrition is not clearly reported. |
| Selective reporting (reporting bias) | Low risk | Data on all outcomes specified in the protocol were provided in either in the published report or via email communication with the corresponding author. |
| Other bias | High risk | Recruitment bias: HIGH ‐ newly admitted residents enrolled at later stages who could choose the specific facility after randomisation Baseline imbalance: HIGH ‐ intervention residents had higher dependency burden (lower modified Barthel Index, a measure of functional status) Protection against contamination: LOW ‐ unlikely to be biased due to contamination/‘herd effects’ as the delivery of the intervention occurred as per RACF policy/practice and was not subject to participant choice or compliance Incorrect analysis: HIGH ‐ analyses not adjusted for clustering No other sources of bias detected. |
Bellantonio 2008.
| Study characteristics | ||
| Methods |
Aim of the study: to determine whether a multidisciplinary team intervention reduces unanticipated transitions from assisted living for persons with dementia Study design: RCT Unit of randomisation: individual resident Mean cluster size: n/a Unit of analyses: individual resident Sample size calculation: Sample size estimates were made assuming a 60% transition rate, based on previous work, with an assumption of a 50% reduction in the rate of transfer between groups, with a power of 0.80, assuming a one‐sided test, carried out at the 0.05 level of statistical significance. |
|
| Participants |
Participants: Persons with dementia moving into 2 dementia‐specific assisted living facilities Intervention group: n = 48 Control group: n = 52 Age: mean (SD) intervention/control 83.4 (6.0)/81.1 (7.7) Sex: proportion females intervention/control: 50%/75% Comorbidities: mean n chronic diseases intervention/control 2.1 (1.6)/1.8 (1.3) Setting: dementia‐specific assisted living facilities. Assisted living staff provide assistance with ADLs and co‐ordination of medical care. Country: USA |
|
| Interventions |
Intervention arm: multidisciplinary team care Intervention components: Four systematic, multidisciplinary assessments conducted by a geriatrician or geriatrics advanced practice nurse, a physical therapist, a dietitian, and a medical social worker during the first 9 months of their residence in assisted living. Geriatrician and geriatrics advanced practice nurse conducted medical and cognitive evaluations and made recommendations regarding behavioural symptoms. Physical therapist evaluated physical function, gait and balance, and assessed the need for ongoing physical therapy and assistive devices. Dietitian evaluated nutritional status and provided dietary recommendations. Medical social worker assessed guardianship issues, long‐term planning, and the psychosocial adjustment of the residents and families. Independent assessment occurred at Days 7, 30, 120 and 320 after admission. The entire team, together with staff nurses, met bimonthly to discuss the most recent assessments and provide recommendations to the primary care physician, the facility director and families. Members of the team were available for in‐person or telephone consultation with facility staff members throughout the study period. Duration of the intervention: first 9 months of the residence in the RACF (or until resident permanently moved out of the facility) Details of the intervention: see TIDieR checklist for full details of intervention (Appendix 2) Control arm: usual clinical care consisted of a medical evaluation conducted by the resident’s primary care physician 30 days before move‐in or within 7 days of admission, as per facility policy The content and subsequent frequency of medical evaluations was at the discretion of the primary care physician. A team approach was not employed in usual care. To account for the attention provided to intervention group subjects, one of the authors (SB) assessed control subjects’ cognitive status using the same measure at the same time intervals as the intervention group. Results of assessments were made available to the resident’s primary care physician, without recommendations. EPOC category: co‐ordination of care (subcategory: Teams) Type of care: primary care |
|
| Outcomes |
Time points: 9 months Primary outcomes: any unanticipated transition out of assisted living, defined as permanent nursing facility admission, first ED visit or first hospitalisation Secondary outcomes: mortality, separate analyses for each of the three aforementioned unanticipated transitions out of assisted living Loss of clusters and individuals: no Adjusted for clustering for each outcome: n/a Method of cluster adjustment for each outcome: n/a ICC reported for each outcome: n/a |
|
| Notes |
Outcomes used in this review: ED visits, measured at 9 months Unplanned hospital admissions, measured at 9 months Mortality, measured at 9 months Unit of analysis error: no Ethical approval and informed consent obtained: yes Funding source: not reported Declarations of interest: not reported Contact with author: no Additional outcome data provided from author: no Trial registration: not reported |
|
| Risk of bias | ||
| Bias | Authors' judgement | Support for judgement |
| Random sequence generation (selection bias) | Unclear risk | "The research assistant randomly assigned intervention or control.... no blocking, stratification, or sequencing was used in the randomization" |
| Allocation concealment (selection bias) | Low risk | Sealed envelopes were used (however, it is not stated whether these were sequentially numbered or opaque). |
| Blinding of participants and personnel (performance bias) Outcomes reported in summary of findings table | High risk | Participants and personnel were not blinded, and primary outcomes would likely be influenced by the lack of blinding (i.e. ED visits and unplanned hospital admissions). |
| Blinding of outcome assessment (detection bias) Outcomes reported in summary of findings table | Unclear risk | "A researcher who was not part of the intervention team ascertained transition as well as reasons for transitions through weekly contacts with staff." It is unclear whether staff (unblinded) could have influenced how transitions (ED visits and unplanned hospital admissions) were reported. |
| Incomplete outcome data (attrition bias) All outcomes | Low risk | Reasons for non‐participation are well reported. The results in tables 2 and 3 do not report N for the groups, so it is unclear whether any participants dropped out. However, given the setting of the intervention, it is unlikely that participants could drop out of the intervention. |
| Selective reporting (reporting bias) | Unclear risk | Protocol/trial registration are not available, so it is unclear whether all outcomes are reported. |
| Other bias | Low risk | No other sources of bias detected. |
Boorsma 2011a.
| Study characteristics | ||
| Methods |
Aim of the study: to evaluate the effectiveness and cost‐effectiveness of a multidisciplinary integrated care model (inspired by the chronic disease model) to improve quality of care of elderly residents of residential care facilities Study design: cRCT Unit of randomisation: RACF Mean cluster size: 46 residents Unit of analyses: individual resident Sample size calculation: Authors needed to include at least 100/85 × 64 × 110% = 82 persons in each group (assuming a dropout rate of 15% during the 6 months follow‐up). Sample size calculations are based on the expected effects of the intervention on the main outcome measures concerning quality of care and functional health. Authors used an alpha of 0.05, power of 80% and inflation of 10% because of anticipated intra‐cluster correlation in the homes for the elderly. Regarding health‐related quality of life, Cohen's D effect size ranged from 0.5 to 3.8 in their meta‐analysis. To detect a fair benefit, i.e. effect size = 0.5, a minimum of 64 persons was needed in each group. For functional health and disability, the authors anticipated a comparable effect size and consequently identical sample size. |
|
| Participants |
Participants: RACF residents who are not terminally ill Intervention group: n randomised = 291, n baseline assessment = 201 Control group: n randomised = 171, n baseline assessment = 139 Age: mean (SD) intervention/control 85.8 (6.2)/85.5 (8) Sex: proportion females intervention/control 76%/74% Comorbidities: mean (SD) chronic somatic diseases intervention/control 1.5 (1.3)/1.5 (1.2) Setting: RACF Country: the Netherlands |
|
| Interventions |
Intervention arm: the multidisciplinary integrated care model Intervention components:
Duration of the intervention: 6 months Details of the intervention: see TIDieR checklist for full details of intervention (Appendix 2) Control arm: In usual care facilities, the GP was responsible for medical care and offered it on request. There was neither co‐ordination nor structured planning of care. Multidisciplinary meetings were mostly not attended by the family physicians. EPOC category: co‐ordination of care (subcategory: Teams) Type of care: primary and secondary care |
|
| Outcomes |
Time points: outcomes were measured at 6 months following the start of intervention Primary outcomes: quality of care (32 risk‐adjusted quality of care indicators), health‐related QoL measured using SF‐12 Secondary outcomes: individual quality of care indicators, Quality Adjusted Life Years using health utilities measured with the EuroQOL, QoL measured by a short version of QUOTE‐Elderly instrument, functional health measured by COOP‐WONCA charts, ADL and IADL disability measured by GARS, unplanned hospital admissions, mortality, resource use, any hospital admissions, length of stay for any hospital admission, residents’ satisfaction with the health care received Loss of clusters and individuals: no loss of clusters; from intervention/control groups 147/87 completed follow‐up Adjusted for clustering for each outcome: yes Method of cluster adjustment for each outcome: multilevel models ICC reported for each outcome: yes |
|
| Notes |
Outcomes used in this review:
Unit of analysis error: no Ethical approval and informed consent obtained: yes Funding source: Grant from ZONMW (the Netherlands Organisation for Health Research and Development). The funders had no role in study design, data collection and analysis, decision to publish or preparation of the manuscript. Declarations of interest: none declared or detected Contact with author: no Additional outcome data provided from author: no Trial registration: ISRCTN11076857 |
|
| Risk of bias | ||
| Bias | Authors' judgement | Support for judgement |
| Random sequence generation (selection bias) | Low risk | Homes ranked on percentage of psychogeriatric patients, then matched; then balanced for number of residents. Randomisation and allocation using Pocock's first column in his random numbers table. If the table's first number is even, the even number of first matched home is assigned the intervention. If the next table number is uneven, the uneven number of the next matched couple is assigned the intervention. |
| Allocation concealment (selection bias) | Low risk | Allocation was done for all clusters at once, so allocation concealment is unlikely to be source of bias. |
| Blinding of participants and personnel (performance bias) Outcomes reported in summary of findings table | High risk | Participants and personnel were not blinded, and at least some outcomes would likely be influenced by the lack of blinding (i.e. any hospital admissions, health‐related quality of life, resource use, residents' satisfaction). |
| Blinding of outcome assessment (detection bias) Outcomes reported in summary of findings table | Low risk | For the purpose of the evaluation, experienced, specially trained, blinded and supervised interviewers independently assessed the residents at baseline and six months later. The interviewers’ assessments were supplemented by systematic observations by staff and extraction of data from residents’ medical records (e.g. actual medication regimen). Health‐related quality of life was self‐reported by unblinded participants and thus could have been subject to bias. |
| Incomplete outcome data (attrition bias) All outcomes | Low risk | Reasons for attrition are clearly reported; no large imbalances between groups. |
| Selective reporting (reporting bias) | Low risk | The protocol was published ahead of the trial. The protocol says 'days until mortality' and 'days until placement in nursing home' would be analysed, but the paper only presents dichotomous analyses. However, this is unlikely to present strong bias. |
| Other bias | Low risk | Recruitment bias: LOW ‐ residential homes were recruited and then randomised and allocated to intervention or control; all residents of the homes were eligible for inclusion Baseline imbalance: LOW ‐ there were no significant differences in patient characteristics between groups at baseline; sensitivity analyses did not reveal any differences Protection against contamination: LOW ‐ unlikely to be biased due to contamination/‘herd effects’ as the delivery of the intervention occurred as per RACF policy/practice and was not subject to participant choice or compliance Incorrect analyses: LOW ‐ investigated the effect of clustering and adjusted data accordingly No other sources of bias detected. |
Boyd 2014.
| Study characteristics | ||
| Methods |
Aim of the study: The RACIP was developed to improve integration across healthcare services and to provide clinical outreach to RAC by secondary care GNS. The overall goal was to improve the quality of care in aged care facilities through proactive GNS outreach, which includes on‐site clinical support, education, clinical coaching and care co‐ordination. Study design: cRCT Unit of randomisation: RACF Mean cluster size: 47 beds (2553 beds per 54 RACFs) Unit of analyses: bed‐days Sample size calculation: not reported |
|
| Participants |
Participants: RACF residents Intervention group: number of participants not provided;n facilities = 29, n beds = 1425 Control group: number of participants not provided; n facilities = 25, n beds = 1128 Age: mean (SD) intervention/control 85.0 (6.8)/85.5 (6.9) Sex: not reported Comorbidities: not reported Setting: RACF Country: New Zealand |
|
| Interventions |
Intervention arm: Geriatric nurse specialist (GNS)‐led care including quality improvement, staff education and multidisciplinary care (The Residential Aged Care Integration Program (RACIP)) Intervention components:
Duration of the intervention: 12 months Details of the intervention: see TIDieR checklist for full details of intervention (Appendix 2) Control arm: comparison facilities did not receive GNS on‐site intervention EPOC category: co‐ordination of care (subcategory: Teams) Type of care: primary and secondary geriatric care |
|
| Outcomes |
Time points: 12 months after the intervention commenced (after the initial 7‐month programme set‐up phase) Primary outcomes: any hospitalisations, medical and surgical admissions Secondary outcomes: none Loss of clusters and individuals: no Adjusted for clustering for each outcome: no Method of cluster adjustment for each outcome: n/a, analyses not adjusted for clustering ICC reported for each outcome: n/a, analyses not adjusted for clustering |
|
| Notes |
Outcomes used in this review: any hospital admissions, measured at 12 months Unit of analysis error: yes, no report of analysis accounting for clustering Ethical approval and informed consent obtained: yes (waiver was obtained as it was considered a quality improvement intervention) Funding source: Waitemata District Health Board, Program Based Margin Analysis innovations funding Declarations of interest: none declared or detected Contact with author: yes Additional outcome data provided from author: no Trial registration: not reported |
|
| Risk of bias | ||
| Bias | Authors' judgement | Support for judgement |
| Random sequence generation (selection bias) | Unclear risk | Sequence generation was not reported. |
| Allocation concealment (selection bias) | Low risk | Allocation was conducted by a district health board administrator independent of the researchers. No information provided regarding how predictable or unpredictable the allocation was and whether concealed. Allocation was done for all clusters at once, so allocation concealment is unlikely to be source of bias. "All facilities were matched according to size (number of beds) and care level as risk adjustment before randomization to ensure that characteristics were relatively the same, and then facilities from each matched pair were randomly assigned to the comparison or intervention group" |
| Blinding of participants and personnel (performance bias) Outcomes reported in summary of findings table | High risk | Participants and personnel were not blinded, and some outcomes would likely be influenced by the lack of blinding (i.e. any hospital admissions). |
| Blinding of outcome assessment (detection bias) Outcomes reported in summary of findings table | Low risk | Information on hospitalisations was extracted from charts and thus assessment of this outcome was unlikely to be influenced by the lack of blinding. |
| Incomplete outcome data (attrition bias) All outcomes | Low risk | No dropout of the facilities is reported. Residents could not drop out of the intervention as intervention was part of the care provided in the facility. |
| Selective reporting (reporting bias) | Unclear risk | Protocol/trial registration are not available, so it is unclear whether all outcomes are reported. |
| Other bias | High risk | Recruitment bias: LOW ‐ all facilities in the district health board participated (except 3 for which non‐participation was justified) Baseline imbalance: LOW ‐ pairs of facilities were matched and then randomised to intervention and control. "There was no statistically significant difference in the hospital admission rate between intervention and comparison groups during the preintervention period (P = .07)." Protection against contamination: LOW ‐ unlikely to be biased due to contamination/‘herd effects’ as the delivery of the intervention occurred as per RACF policy/practice and was not subject to participant choice or compliance Incorrect analyses: HIGH ‐ analyses are not adjusted for clustering. Facilities were randomised at baseline (matching pairs, which is a justified choice) and no differences were observed at baseline (P = 0.07). However, at follow‐up comparison is done between pre‐ and post‐intervention outcome measurement and the difference in pre‐post change is interpreted, instead of comparing post‐intervention outcomes in 2 groups with each other (no difference is observed in this case) No other sources of bias detected. |
Brodaty 2003.
| Study characteristics | ||
| Methods |
Aim of the study: to compare the outcomes of 3 interventions for the management of dementia complicated by depression or psychosis: psychogeriatric case management, general practitioners with specialist psychogeriatric consultation, and standard care for nursing home residents Study design: RCT Unit of randomisation: individual resident Mean cluster size: n/a Unit of analyses: individual resident Sample size calculation: The sample sizes of 66 subjects with depression and 52 subjects with psychosis allowed 93% and 84% confidence, respectively, of detecting medium effect sizes with an alpha level of 0.05. |
|
| Participants |
Participants: residents of nursing homes with dementia complicated by depression or psychosis 102 residents were randomised, of which 16 did not complete the study and were excluded (3 withdrew consent, 13 died, no information on dropout per group) Intervention group (Case management): n = 28 (9 with depression alone, 7 with psychosis alone, 12 with depression and psychosis) Intervention group (Specialist psychogeriatric consultation): n = 27 (10 with depression alone, 4 with psychosis alone, 13 with depression and psychosis) Control group: n = 31 Age: mean (SD) for all residents 82.9 (8.89), not reported per treatment group Sex: proportion female among all residents 72%, not reported per treatment group Comorbidities: cumulative illness rating scale for all residents 15.8 (4.4), not reported per treatment group Setting: RACF Country: Australia |
|
| Interventions |
Intervention arm 1: Multidisciplinary psychogeriatric case management This intervention involved carefully defined psychological and social treatments and, where indicated, pharmacotherapy according to standard clinical procedure. The treatments were supervised by 2 geriatric psychiatrists and administered by a multidisciplinary team, including a senior registrar in psychogeriatrics, a psychologist experienced in aged care and a registered nurse experienced in nursing home care. Case managers (who had a clinical training (source: email correspondence with authors)) were allocated to individual residents, and treatment plans were sent to nursing homes and general practitioners at the commencement of treatment. Liaison with a resident’s general practitioner occurred when pathology investigations or further general medical assessment were required. Psychosocial interventions for depression (4 to 8 hours over 12 weeks) included the case manager providing individual supportive therapy to the resident and encouragement to participate more in pleasurable activities. Interventions for psychosis included nurse education on management of psychosis and, where possible, treatment of sensory impairments. In both groups, residents were encouraged to participate more in general activities, families were prompted to participate in the program, and behavioural management programmes were developed to address specific behavioural disturbances. The prescriptive guidelines for pharmacotherapy were formulated. Intervention arm 2: Multidisciplinary team assessment with resulting treatment plan provided to a GP with an on‐demand specialist psychogeriatric consultation The management plans devised at the multidisciplinary team (consisting of a junior psychiatrists doing advanced training in old age psychiatrist, 3 psychologists and 2 senior psychogeriatricians (source: email correspondence with authors)) meeting prior to randomisation were provided in writing to the RACF staff and to the resident’s general practitioner. The project team was available to provide further consultation on request from nursing staff or a general practitioner during the 12‐week treatment phase. This style of service provision represented current practice in RACFs with access to psychogeriatric services. Duration of the intervention: 12 weeks Details of the intervention: see TIDieR checklist for full details of intervention (Appendix 2) Control arm: usual care; immediate feedback was provided if psychopathology that was a danger to the resident, e.g. suicidality, was uncovered EPOC category: co‐ordination of care (subcategory: Teams) Type of care: primary and secondary care |
|
| Outcomes |
Time points: 12 weeks after the start of the intervention Primary outcomes: cognitive status using AMTS, the resident Classification Index (RCI), the functional Assessment Staging, the cumulative Illness Rating Scale; depression measures: Even Briefer Assessment Scale for Depression, Hamilton Rating scale for depression, Cornell Scale for Depression in Dementia, Geriatric Depression Scale, Neuropsychiatric Inventory and SAD faces; psychosis measures: behavioural pathology in Alzheimer's Disease Rating Scale, Neuropsychiatric Inventory, Scale for the Assessment of Positive symptoms and clinical interview, adherence to clinical guideline recommended care Secondary outcomes: mortality Loss of clusters and individuals: 3 residents withdrew consent, 13 residents died, not reported per treatment group Adjusted for clustering for each outcome: no Method of cluster adjustment for each outcome: n/a, analyses not adjusted for clustering ICC reported for each outcome: n/a, analyses not adjusted for clustering |
|
| Notes |
Outcomes used in this review:
Unit of analysis error: no Ethical approval and informed consent obtained: yes Funding source: an action research grant from the National Action Plan for Dementia Care, Commonwealth Department of Health and Family Services, Commonwealth Government of Australia and a special grant from the School of Psychiatry, University of New South Wales Declarations of interest: none declared or detected Contact with author: yes Additional outcome data provided from author: no. In email correspondence, the authors clarified that case managers had clinical training. For mortality data, authors reported that in total, 13 deaths occurred among the participants (no split per study group, however reported that there was no noticeable imbalance in mortality across groups). Trial registration: not reported |
|
| Risk of bias | ||
| Bias | Authors' judgement | Support for judgement |
| Random sequence generation (selection bias) | Low risk | "... subjects were randomly allocated (using computer‐generated numbers)." |
| Allocation concealment (selection bias) | Unclear risk | It is unclear whether allocation was concealed as it was not described in the study. |
| Blinding of participants and personnel (performance bias) Outcomes reported in summary of findings table | High risk | Participants and personnel were not blinded, and some outcomes would likely be influenced by the lack of blinding (i.e. adherence to clinical guideline‐recommended care). |
| Blinding of outcome assessment (detection bias) Outcomes reported in summary of findings table | Unclear risk | It is not reported whether the assessors of adherence to clinical guideline‐recommended care (i.e. medication adequacy) were blinded to the treatment allocation. |
| Incomplete outcome data (attrition bias) All outcomes | Unclear risk | Attrition, dropouts and exclusions are reported, but with insufficient detail to assess differences between groups. The flowchart does not report initial N randomised. |
| Selective reporting (reporting bias) | Unclear risk | Protocol/trial registration are not available, so it is unclear whether all outcomes are reported. |
| Other bias | Low risk | No other sources of bias detected. |
Cavalieri 1993.
| Study characteristics | ||
| Methods |
Aim of the study: to examine the effectiveness of geriatric assessment teams in the nursing home setting Study design: RCT Unit of randomisation: individual resident Mean cluster size: n/a Unit of analyses: individual resident Sample size calculation: not reported |
|
| Participants |
Participants: newly admitted patients (75% from acute care facilities and 25% directly from the community) without terminal illnesses Intervention group: n = 33 Control group: n = 36 Age: mean (SD) intervention/control 82 (10)/82 (8) Sex: not reported Comorbidities: not reported Setting: skilled nursing facility Country: USA |
|
| Interventions |
Intervention arm: Comprehensive Geriatric Assessment Team Care is provided to newly admitted patients by a group of geriatricians and geriatric nurse practitioners, all of whom have specialised training in providing care to older adults. Duration of the intervention: 12 months Details of the intervention: see TIDieR checklist for full details of intervention (Appendix 2) Control arm: care following traditional medical model, in which patients are managed entirely by individual physicians who have not had formal training in geriatrics EPOC category: co‐ordination of care (subcategory: Comprehensive geriatric assessment) Type of care: primary and secondary care |
|
| Outcomes |
Time points: 3, 6, 9 and 12 months post admission Primary outcomes: number of consultations, number of hospital admissions, number of emergency department visits, mortality Secondary outcomes: no other outcomes assessed Loss of clusters and individuals: not reported Adjusted for clustering for each outcome: n/a Method of cluster adjustment for each outcome: n/a ICC reported for each outcome: n/a |
|
| Notes |
Outcomes used in this review:
Unit of analysis error: no Ethical approval and informed consent obtained: not reported Funding source: not reported Declarations of interest: not reported Contact with author: no Additional outcome data provided from author: no Trial registration: not reported |
|
| Risk of bias | ||
| Bias | Authors' judgement | Support for judgement |
| Random sequence generation (selection bias) | Unclear risk | Sequence generation method is not described. |
| Allocation concealment (selection bias) | Unclear risk | It is not clear whether allocation was concealed. |
| Blinding of participants and personnel (performance bias) Outcomes reported in summary of findings table | High risk | Participants and personnel were not blinded, and some outcomes would likely be influenced by the lack of blinding (i.e. ED visits, any hospital admissions). |
| Blinding of outcome assessment (detection bias) Outcomes reported in summary of findings table | Low risk | It is not reported whether outcome assessors were blinded; however, it is unlikely that lack of blinding could influence the assessment of the outcomes (e.g. ED visits, any hospital admissions and mortality were extracted from patient charts by a medical student). |
| Incomplete outcome data (attrition bias) All outcomes | Unclear risk | Attrition and number of patients for which outcomes were measured are not clearly reported. Presumably, all 69 patients completed all measurements; however, this is unrealistic given some patients died during the 12‐month study duration. |
| Selective reporting (reporting bias) | Unclear risk | Protocol/trial registration are not available, so it is unclear whether all outcomes are reported. |
| Other bias | Low risk | No other sources of bias detected. |
Chapman 2007.
| Study characteristics | ||
| Methods |
Aim of the study: to evaluate the effectiveness of the advanced illness care teams (AICT) intervention on pain, depression and agitation compared with residents assigned to the usual care condition Study design: RCT Unit of randomisation: individual resident Mean cluster size: n/a Unit of analyses: individual resident Sample size calculation: not reported |
|
| Participants |
Participants: nursing home residents with advanced dementia Intervention group: n = 57 Control group: n = 61 Age: mean (SD) intervention/control 84.8 (6.8)/88.0 (6.7) Sex: proportion females intervention/control 95%/98% Comorbidities: all residents had dementia, other comorbidities not reported Setting: nursing home Country: USA |
|
| Interventions |
Intervention arm: Multidisciplinary team care (Advanced Illness Care Teams (AICT) intervention) Advanced illness care teams; holistic approach; 4 domains of care: (i) medical issues, (ii) meaningful activities, (iii) psychological problems and (iv) behavioural concerns. (i) Medical issues: A review was made of each resident’s medical conditions, level of physical pain and medications (including psychotropic medications). A care plan was developed and implemented with the assistance of the AICT team physician and the nursing staff. The intervention plans in the medical domain included a special focus on pain management and the reduction or elimination of antipsychotic medications that can exacerbate dementia symptoms. (ii) Meaningful activity issues. The AICTs reviewed the activity programme of each participating resident and identified new activities to maintain and enhance engagement. Activities were individualised by focusing on the pre‐dementia and current interests of residents and by talking with family members about residents’ hobbies, work‐related interests and any other preferences that may not have been known by staff. (iii) Psychological issues. Residents’ mental health problems and symptoms were reviewed, as well as any emotional and family dynamic issues. On the basis of this review, a care plan was developed and implemented. (iv) Behavioural concerns. A review was made of agitation and other behavioural problems such as apathy that often affect RACF residents with dementia. Residents’ behaviour was monitored in the first two AICT meetings. Care plans were developed and implemented in conjunction with input from nurse’s aides and other direct care staff. Duration of the intervention: 8 weeks Details of the intervention: see TIDieR checklist for full details of intervention (Appendix 2) Control arm: Residents received all the services typically provided by the facility, including medication management and monitoring, ongoing nursing care, social‐recreational activities, pastoral care as appropriate, occupational and physical therapies when medically indicated, and social work services such as educational and emotionally supportive contact with residents and their families. Care plans were required for all residents, were updated quarterly and residents’ families were invited to an annual care plan meeting. EPOC category: co‐ordination of care (subcategory: Teams) Type of care: primary and secondary care |
|
| Outcomes |
Time points: 2 weeks after the end of the 8‐week intervention Primary outcomes: Cohen‐Mansfield Agitation Inventory (CMAI),Faces Legs Activity Cry Consolability (FLACC) Behavioral Pain Scale, Cornell Scale for Depression in Dementia (CSDD), Pain in Advanced Dementia (PAINAD) Secondary outcomes: none Loss of clusters and individuals: no Adjusted for clustering for each outcome: n/a Method of cluster adjustment for each outcome: n/a ICC reported for each outcome: n/a |
|
| Notes |
Outcomes used in this review: none Unit of analysis error: no Ethical approval and informed consent obtained: not reported Funding source: a grant from the Dementia Grants Program, New York State Department of Health Declarations of interest: none declared or detected Contact with author: no Additional outcome data provided from author: no Trial registration: not reported |
|
| Risk of bias | ||
| Bias | Authors' judgement | Support for judgement |
| Random sequence generation (selection bias) | Unclear risk | Authors do not describe how the random sequence was generated ("random assignment was done in cohorts"). |
| Allocation concealment (selection bias) | Unclear risk | Authors do not describe who allocated participants into groups and precisely how this was done. Authors state: "To help the AICT teams on each nursing home unit manage their workload and enable them to give sufficient attention to each resident in the study, random assignment was done in cohorts. Once four residents in each of the three units in the first nursing home and six residents in each of the two units in the second had been identified and screened and we had consent, they were randomly assigned to AICT or to UC." |
| Blinding of participants and personnel (performance bias) Outcomes reported in summary of findings table | Unclear risk | Not applicable as study did not contribute any relevant outcome data. |
| Blinding of outcome assessment (detection bias) Outcomes reported in summary of findings table | Unclear risk | Not applicable as study did not contribute any relevant outcome data. |
| Incomplete outcome data (attrition bias) All outcomes | Low risk | Outcomes reported on all patients recruited for the study, implying that there was no dropout from the 8‐week study period. |
| Selective reporting (reporting bias) | Unclear risk | Protocol/trial registration are not available, so it is unclear whether all outcomes are reported. |
| Other bias | Unclear risk | Significant difference in baseline age between groups; statistical analyses did attempt to adjust for this. Potential contamination bias: "Although the AICT intervention was not available to UC residents during the initial phase, the training of staff in AICT intervention strategies may have made it difficult for staff not to use some of these strategies when working with residents in UC". |
Connolly 2015.
| Study characteristics | ||
| Methods |
Aim of the study: to assess the effect of a complex, multidisciplinary intervention aimed at reducing avoidable acute hospitalisation of residents of residential aged care (RAC) facilities Study design: cRCT Unit of randomisation: RACF Mean cluster size: 112 residents (2011/18), mean follow‐up years per facility in intervention/control group was 33.5/43.5 years. Unit of analyses: individual resident Sample size calculation: with 18 facilities per group, each with 14 months follow‐up, an average of 38 beds per facility, and 90% bed occupancy, the authors expected 1500 resident‐years of follow‐up. A sample size of 1400 resident‐years was originally anticipated to give 80% power (P = 0.05) to detect a 25% reduction in the rate of ASH hospitalisations in the intervention group versus the control group when an event rate of 60 events per 100 years was expected. However, the observed event rate in another cohort after trial commencement was lower, and power estimates were recalculated. Revised power was estimated at 53%, considering (1) inflated sample size as the design effect of 2.0 allowed for moderate intracluster correlation for hospitalisation rates of 0.02512; and (2) a rate of 35 ASH admissions per 100 resident years in control facilities versus 26 ASH admissions in intervention facilities, assuming a Poisson distribution where the mean equals the variance. Control event rate was estimated from reanalysis of other cohorts. However, improved power was anticipated because facilities were chosen (modelling ‐ Phase 1) for their higher event rates (e.g. an event rate of 0.40 would give power of 0.67); short‐stay residents (under‐represented in OPAL‐based rates) have a higher event rate; adjustment for covariates in authors' analysis was anticipated to reduce confidence intervals around effect size. |
|
| Participants |
Participants: residents of residential aged care facilities (any of the 4 levels recognised in New Zealand) Intervention group: n = 1131 Control group: n = 880 Age: intervention (females/males): < 65 (37/35); 65 to 74 (72/59); 75 to 84 (214/117); 85 to 94 (393/130); 95+ (59/7) Control (females/males): < 65 (34/32); 65 to 74 (61/37); 75 to 84 (176/79); 85 to 94 (294/85); 95+ (68/9) Sex: proportion females intervention/control 69%/72% Comorbidities: residents in dementia care intervention/control 11(1.0%)/22(2.5%) Setting: RACF Country: New Zealand |
|
| Interventions |
Intervention arm: GNS‐led care including quality improvement, staff education and multidisciplinary care (Aged Care Healthcare Utilization Study (ARCHUS)) Intervention components:
For specific residents, the intervention also included consultation with community physiotherapy, speech‐language therapy, and palliative care/hospice. The GNS’s time commitment was 20% across all intervention facilities in each of 3 District Health Boards (6 intervention facilities per GNS). Duration of the intervention: 9 months Details of the intervention: see TIDieR checklist for full details of intervention (Appendix 2) Control arm: residents in control facilities received usual District Health Board support, which did not include any of the elements listed in the intervention description EPOC category: co‐ordination of care (subcategory: Teams) Type of care: primary and secondary care |
|
| Outcomes |
Time points: 14 months from the start of the intervention Primary outcomes: ambulatory sensitive hospitalisations (ASH) Secondary outcomes: all acute admissions (unplanned hospital admissions), mortality, acute bed‐days Loss of clusters and individuals: individuals in intervention/control: 8/5, no loss of clusters Adjusted for clustering for each outcome: yes Method of cluster adjustment for each outcome: re‐randomisation to obtain 95% CIs ICC reported for each outcome: no |
|
| Notes |
Outcomes used in this review:
Unit of analysis error: no Ethical approval and informed consent obtained: yes Funding source: The ARCHUS study was funded by a Project Grant (10/373) from the Health Research Council of New Zealand. The funders of the ARCHUS study had no influence on study design data collection, analysis or interpretation, and no influence on manuscript preparation. Declarations of interest: none declared or detected Contact with author: no Additional outcome data provided from author: no Trial registration: ACTRN12611000187943 |
|
| Risk of bias | ||
| Bias | Authors' judgement | Support for judgement |
| Random sequence generation (selection bias) | Low risk | Facility randomisation was conducted (using random number generation via “Excel”), by a non‐clinical investigator with no facility contact, stratified by DHB and paired by care types (rest home only, or a mix of rest home (lower level of care/dependency) and “hospital” (high‐level of care/dependency) beds) and size where possible. Stratification by DHB was used, as these DHBs differ demographically and to balance workload across the DHB‐based GNSs. |
| Allocation concealment (selection bias) | Low risk | Phone call to manager to invite participation was followed by a visit to confirm written informed consent and to obtain baseline facility data, after which the facility was advised whether allocated to intervention or control. |
| Blinding of participants and personnel (performance bias) Outcomes reported in summary of findings table | High risk | Participants and personnel were not blinded, and some outcomes would likely be influenced by the lack of blinding (i.e. unplanned hospital admissions and length of stay). |
| Blinding of outcome assessment (detection bias) Outcomes reported in summary of findings table | Low risk | Data were retrieved from public hospital admission records held by the Ministry of Health using the NHI (unique national health identifier). It is not clear whether the researcher retrieving the data was blinded to treatment allocation: "care was taken to blind the main investigators to facility identification wherever possible". Even so, it is unlikely that lack of blinding would influence the outcomes included in our review. |
| Incomplete outcome data (attrition bias) All outcomes | Low risk | Attrition and withdrawals clearly reported and no major differences between the intervention and control arm were observed. |
| Selective reporting (reporting bias) | Unclear risk | All primary outcomes declared in the protocol (Foster 2012) are reported; however, not all secondary outcomes declared in the trial registration form are reported in the manuscript, namely: 1) number of emergency department presentations per bed per year, 2) number of medications prescribed per bed per year. |
| Other bias | Low risk | Recruitment bias: LOW ‐ all residents of RACF recruited to intervention received the intervention. Baseline imbalance: LOW ‐ fairly similar between intervention and control across 18 facilities. Protection against contamination: LOW ‐ unlikely to be biased due to contamination/‘herd effects’ as the delivery of the intervention occurred as per RACF policy/practice and was not subject to participant choice or compliance. Incorrect analyses: LOW ‐ analyses accounted for study design. No other sources of bias detected. |
Cordato 2018.
| Study characteristics | ||
| Methods |
Aim of the study: to evaluate the impact and cost‐effectiveness of the Regular Early Assessment Post‐Discharge (REAP) protocol of co‐ordinated specialist geriatrician and nurse practitioner visits on rates of rehospitalisation, hospital length of stay, and emergency department presentations for NH residents recently discharged from hospital Study design: RCT Unit of randomisation: individual resident Mean cluster size: n/a Unit of analyses: individual resident Sample size calculation: not reported |
|
| Participants |
Participants: permanent residents of ACFs discharged back to ACF after hospital admission Intervention group: n = 23 Control group: n = 22 Age: mean (SD) intervention/control 90.2(5.2)/86.5(7.0) Sex: proportion females intervention/control 59%/29% Comorbidities: reported graphically for COPD, atrial fibrillation/hypertension, acute myocardial infarction/congestive cardiac failure, diabetes mellitus, organ malignancy, chronic kidney injury, urological/urinary tract infections, Parkinson's disease, stroke, depression/anxiety. No important differences between study groups. Setting: RACF Country: Australia |
|
| Interventions |
Intervention arm: Regular Early Assessment Post‐Discharge (REAP) following acute hospitalisation protocol of co‐ordinated specialist geriatrician and nurse practitioner visits The REAP protocol of co‐ordinated care is a usual post‐discharge care (as for the control group) in addition to regular conjoint geriatrician and nurse practitioner evaluations in the participant’s usual place of residence, for a period of 6 months (first RACF visit within 1 week after discharge from screening hospital admission, and then monthly visits). Duration of the intervention: 6 months Details of the intervention: see TIDieR checklist for full details of intervention (Appendix 2) Control arm: usual post‐discharge care administered by their usual general practitioner (or primary care physician) and nursing staff at their RACF EPOC category: co‐ordination of care (subcategory: Discharge planning) Type of care: primary and secondary care |
|
| Outcomes |
Time points: 6 months after the start of the intervention Primary outcomes: rate of hospital readmissions Secondary outcomes: ED visits, GP visits, resource use/costs, inappropriate medication prescription, health‐related QoL, mortality Loss of clusters and individuals: individuals in intervention/control: 1/1 Adjusted for clustering for each outcome: n/a Method of cluster adjustment for each outcome: n/a ICC reported for each outcome: n/a |
|
| Notes |
Outcomes used in this review:
Unit of analysis error: no Ethical approval and informed consent obtained: yes Funding source: This work was funded through an Establishment Grant from the St George and Sutherland Medical Research Foundation. Sponsoring bodies played no role in any aspect of the study apart from provision of funding. Declarations of interest: none declared or detected Contact with author: yes Additional outcome data provided from author: Authors provided additional information or data about the following outcomes: ED visits, unplanned admissions and quality of life (details can be found in Additional Table 8). Authors clarified procedures concerning blinding and allocation concealment and availability of the study protocol. Trial registration: trial not registered |
|
| Risk of bias | ||
| Bias | Authors' judgement | Support for judgement |
| Random sequence generation (selection bias) | Low risk | Participants were randomly allocated by computer algorithm. Additional information provided by study authors: consenting patients received sequential project numbers and were randomly assigned using computer‐generated numbers into either the control or intervention group within 72 hours of study entry. |
| Allocation concealment (selection bias) | Unclear risk | Efforts for allocation concealment are not described. Two participants withdrew consent after randomisation (one from each study group), but prior to commencement of intervention/study visits or data collection. |
| Blinding of participants and personnel (performance bias) Outcomes reported in summary of findings table | High risk | Participants and personnel were not blinded, and some outcomes would likely be influenced by the lack of blinding (i.e. ED visits, resource use, length of stay). Additional information provided by study authors: Allocation concealment (blinding) was strictly applied to: 1) the independent blinded study rater who recorded standardised study measures of cognition, medication use and quality of life; 2) the patients’ usual treating medical teams in hospital, including during initial hospitalisation and re‐hospitalisations; 3) co‐investigators not administering the REAP intervention to study participants; 4) a designated blinded study geriatrician who had no other duties in this study outside of liaising with the study nurse practitioner during unexpected deteriorations of study participants; and 5) statisticians affiliated to the University of New South Wales assisting with analyses. Following randomisation, the chief investigator was unblinded to the randomisation status of each study participant, as he contributed to the administration of post‐hospital discharge treatment to the intervention group, and was also responsible for notifying study participants of their randomisation status. Due to the nature of the intervention and the responsibilities of REAP clinicians/associated staff, allocation concealment (blinding) did not apply to: 1) REAP study clinicians administering the REAP intervention; 2) nursing home staff and GPs who facilitated REAP visits and notifications of changes in participant status to REAP clinicians outside of scheduled study visits; 3) study patients/participants in receipt of the intervention; and 4) families of study patients/participants. Consistent with this, REAP geriatricians did not contribute to the inpatient hospital care of study participants for whom they conducted NH visits. |
| Blinding of outcome assessment (detection bias) Outcomes reported in summary of findings table | Low risk | Independent assessor was blinded to the randomisation status of the participants (see also additional information provided by study authors reported in 'Performance bias' domain. Additional information provided by study authors: the blinded study rater was not given access to participant nursing home or hospital records for the duration of the study intervention phase for the purposes of maintaining allocation concealment (additional data provided by study authors). |
| Incomplete outcome data (attrition bias) All outcomes | Low risk | Attrition and study exclusions are clearly reported. |
| Selective reporting (reporting bias) | Unclear risk | Protocol/trial registration are not available, so it is unclear whether all outcomes are reported. Additional information provided by study authors: "The project protocol was submitted to and approved by the Human Research Ethics Committee of the South Eastern Sydney Local Health District (Project Reference Number HREC/11/STG/229). A protocol or trial registration form for this study were not otherwise published." |
| Other bias | Low risk | Strong gender imbalances at baseline. Post hoc sensitivity analyses controlling for the potentially confounding effect of patient sex did not alter any of the results. |
Crotty 2004.
| Study characteristics | ||
| Methods |
Aim of the study: to evaluate the impact of multidisciplinary case conferences on the appropriateness of medications and on patient behaviours in high‐level residential aged care facilities Study design: cRCT Unit of randomisation: RACF Mean cluster size: 10 residents Unit of analyses: individual resident Sample size calculation: using published figures for patients aged 65 years or more with polypharmacy authors determined that an effect size of 0.9 in the Medication Appropriateness Index between the intervention and control groups (power 0.9, type I error of 0.05) would be detected with 28 residents in each group. Authors increased the sample size to 50 residents in each group to counter the loss of participants due to dropout and death. |
|
| Participants |
Participants: residents of RACFs with mental health conditions or behavioural problems Intervention group: n = 50 Control group: n = 54 (+ 50 within‐facility control) Age: mean (95% CI) intervention/control 85.3 (84.0 to 86.6)/83.6 (81.3 to 85.9) Sex: proportion females intervention/control 56%/57% Comorbidities: proportion of residents with dementia/depression in intervention group 67%/29% and in control group 74%/28% Setting: RACF Country: Australia |
|
| Interventions |
Intervention arm: Multidisciplinary case conferencing GPs were advised that facility staff had nominated their patient for the study intervention. GPs were invited to attend two multidisciplinary case conferences concerning their patients, 6 to 12 weeks apart. The timing of the case conference were determined by the GPs' availability. Case conferences were held at the facility and were attended by the resident’s GP, a geriatrician, a pharmacist, residential care staff and a representative of the Alzheimer’s Association of South Australia. Residential care staff expanded on any issues in the case notes that required discussion and the Alzheimer’s Association of South Australia representative discussed non‐pharmacological management of dementia‐related behaviour. Each case conference was chaired by the GP, who used their medical records in addition to case notes from the facility. A problem list was developed by the GP in conjunction with the care staff and a medication review was conducted prior to each case conference. Duration of the intervention: 3 months Details of the intervention: see TIDieR checklist for full details of intervention (Appendix 2) Control arm: not described EPOC category: co‐ordination of care (subcategory: Teams) Type of care: primary and secondary care |
|
| Outcomes |
Time points: 3 months after the start of the intervention Primary outcomes: Medication Appropriateness Index (MAI), The Nursing Home Behaviour Problem Scale (NHBPS) Secondary outcomes: monthly drug costs, mortality Loss of clusters and individuals: 109/154 (71%) remained at the time of the last data collection; 45 (15 (28%) control, 18 (36%) intervention, 12 (24%) within‐facility control) residents having died. There was no difference in the proportion of residents lost between the 3 groups (P = 0.304) Adjusted for clustering for each outcome: no Method of cluster adjustment for each outcome: n/a, analyses not adjusted for clustering ICC reported for each outcome: n/a, analyses not adjusted for clustering |
|
| Notes |
Outcomes used in this review:
Unit of analysis error: yes Ethical approval and informed consent obtained: yes Funding source: Quality Use of Medicines Evaluation Program 2000–2001, Health and Aged Care, General Practice National Innovations Funding Pool 1999–2000, Health and Aged Care Declarations of interest: none declared or detected Contact with author: no Additional outcome data provided from author: no Trial registration: not reported |
|
| Risk of bias | ||
| Bias | Authors' judgement | Support for judgement |
| Random sequence generation (selection bias) | Low risk | "Computer‐generated random numbers were used by a researcher independent of the investigators to assign five facilities to each of the intervention and control groups."..."Ten of the 20 residents nominated from the intervention facilities were randomly allocated by the pharmacy department using sequential sealed opaque envelopes to receive the case conferences (intervention group), while the remaining 10 selected residents served as a within‐facility control group (referred to as within‐facility control group)." |
| Allocation concealment (selection bias) | Low risk | "Ten of the 20 residents nominated from the intervention facilities were randomly allocated by the pharmacy department using sequential sealed opaque envelopes to receive the case conferences (intervention group), while the remaining 10 selected residents served as a within‐facility control group (referred to as within‐facility control group)." Procedure for concealment of allocation of facilities is not reported. |
| Blinding of participants and personnel (performance bias) Outcomes reported in summary of findings table | High risk | Participants and personnel were not blinded, and some outcomes would likely be influenced by the lack of blinding (i.e. adherence to clinical guideline‐recommended care, resource use). |
| Blinding of outcome assessment (detection bias) Outcomes reported in summary of findings table | Low risk | Medication appropriateness ('Adherence to clinical guideline‐recommended care') was assessed by an independent pharmacist. It is unclear whether assessors of 'Resource use' and 'Mortality' were blinded; however, lack of blinding is unlikely to influence assessment of these outcomes. |
| Incomplete outcome data (attrition bias) All outcomes | Low risk | 109/154 (71%) remained at the time of the last data collection; 45 (15 (28%) control, 18 (36%) intervention, 12 (24%) within‐facility control) residents having died. There was no difference in the proportion of residents lost between the three groups (P = 0.304). |
| Selective reporting (reporting bias) | Unclear risk | Protocol/trial registration are not available, so it is unclear whether all outcomes are reported. |
| Other bias | High risk | Recruitment bias: HIGH ‐ patients were recruited after allocation of facilities was done. Baseline imbalance: LOW ‐ demographic and baseline clinical characteristics of residents (age, gender, number of medications, dementia, depression or aggression/anxiety/agitation diagnoses) were similar between the groups. Protection against contamination: LOW ‐ unlikely to be biased due to contamination/‘herd effects’ as the delivery of the intervention occurred as per RACF policy/practice and was not subject to participant choice or compliance. Incorrect analysis: UNCLEAR ‐ main analyses compared mean change within each group instead of comparison between intervention and control at follow‐up (for which the study was powered). It is unclear how exactly the clustering was accounted for in the analyses. No other sources of bias detected. |
Crotty 2019.
| Study characteristics | ||
| Methods |
Aim of the study: to determine whether a 4‐week postoperative rehabilitation programme delivered in Nursing Care Facilities (NCFs) would improve quality of life and mobility compared with receiving usual care Study design: RCT Unit of randomisation: individual resident Mean cluster size: n/a Unit of analyses: individual resident Sample size calculation: To assess minimally important differences in the DEMQOL index score, authors needed 98 per group (intervention and control). After allowing for deaths and dropouts of 20%, the estimated sample size was 196*1.2 = 236 (118 per group). The detectable effect size between groups was conservatively selected as small to medium (0.10 to 0.25) as suggested by Cohen. Calculations were based on two‐tailed tests with power of at least 80% and a significance level of 0.05. |
|
| Participants |
Participants: people aged 70 years and older who were recovering from hip fracture surgery and were walking prior to hip fracture; participants were residing in NCFs prior to hospital admission and were discharged back to NCF Intervention group: n = 119 Control group: n = 121 Age: mean (SD) intervention/control 88.6 (5.4)/88.6 (5.7) Sex: proportion females intervention/control 73%/75% Comorbidities: in total group, 186 (78%) had pre‐existing diagnosis of dementia with 73 residents living in dementia care units Setting: nursing care facilities (NCFs) Country: Australia |
|
| Interventions |
Intervention arm: In‐reach multidisciplinary rehabilitation Intervention group received visits from a hospital outreach team who provided a Comprehensive Geriatrics Assessment, physiotherapy and nutritional assessment and care plan. Physiotherapy included mobility and task specific training, graduated muscle strengthening exercises and training of care staff and family. The geriatrician met families within a fortnight to discuss progress. The intervention was low intensity and involved 13 hours of input. Duration of the intervention: 4 weeks (13 hours in total) Details of the intervention: see TIDieR checklist for full details of intervention (Appendix 2) Control arm: participants allocated to usual care continued treatments (which may include sessions of physiotherapy) according to usual practice in the RACF. The control group on all sites received orthogeriatric care in hospital and medical care from a general practitioner after discharge. Research staff recorded therapy and other services offered to controls to allow description of differences in experiences of the groups as currently recommended in rehabilitation trials. EPOC category: co‐ordination of care (subcategory: Teams) Type of care: primary and secondary care |
|
| Outcomes |
Time points: 4 weeks and 12 months after the start of the intervention Primary outcomes: the Nursing Home Life‐Space Diameter (NHLSD), quality of life (DEMQOL, DEMQOL‐proxy and EQ‐5D‐5L) Secondary outcomes: Modified Barthel Index, Functional Recovery Score, Mini‐Mental State Examination (MMSE), depression (Cornell Scale for Depression in Dementia), pain (the Pain Assessment in Advanced Dementia scale: PAINAD), nutrition (The Mini‐Nutritional Assessment), adverse events, economic evaluation Loss of clusters and individuals: loss to follow‐up due to withdrawal in intervention/control: 2/5 Adjusted for clustering for each outcome: n/a Method of cluster adjustment for each outcome: n/a ICC reported for each outcome: n/a |
|
| Notes |
Outcomes used in this review:
Unit of analysis error: no Ethical approval and informed consent obtained: yes Funding source: funding provided by the National Health and Medical Research Council (NHMRC) Partnership Centre on Dealing with Cognitive and Related Functional Decline in Older People (grant no. GNT9100000) Declarations of interest: none declared or detected Contact with author: no Additional outcome data provided from author: no Trial registration: ACTRN12612000112864 |
|
| Risk of bias | ||
| Bias | Authors' judgement | Support for judgement |
| Random sequence generation (selection bias) | Low risk | "A computer generated random sequence with random block sizes was used by a pharmacist external to the project to allocate" participants. |
| Allocation concealment (selection bias) | Unclear risk | Allocation concealment is not clearly described. |
| Blinding of participants and personnel (performance bias) Outcomes reported in summary of findings table | High risk | Participants and personnel were not blinded, and some of the outcomes would likely be influenced by the lack of blinding (i.e health‐related quality of life and resource use). |
| Blinding of outcome assessment (detection bias) Outcomes reported in summary of findings table | Unclear risk | "A randomised controlled trial with masked outcome assessments was undertaken ...". Details of blinding not provided. At least one of the secondary outcomes included in this review, i.e. health‐related quality of life (which was presumably self‐reported by unblinded participants), could have been biased by lack of blinding. |
| Incomplete outcome data (attrition bias) All outcomes | Low risk | Attrition is clearly reported and is not expected to have introduced bias. |
| Selective reporting (reporting bias) | Low risk | Trial registration form is published; full protocol is not available. Published reports did not provide data on all pre‐specified outcomes (however, none of the omitted outcomes were a focus of this review). |
| Other bias | Low risk | No other sources of bias detected. |
De Luca 2016.
| Study characteristics | ||
| Methods |
Aim of the study: to demonstrate the effectiveness of a novel telehealth‐care model allowing a better management of elderly living in nursing homes Study design: RCT Unit of randomisation: individual resident Mean cluster size: n/a Unit of analyses: individual resident Sample size calculation: not reported |
|
| Participants |
Participants: elderly living in nursing homes Intervention group: n = 32 Control group: n = 27 Age: median (IQR) intervention/control 77.0 (71.0 to 80.0)/85.0 (79.0 to 89.0) Sex: proportion females intervention/control 66%/70% Comorbidities: not reported Setting: nursing home Country: Italy |
|
| Interventions |
Intervention arm: Telemonitoring for patient's vital signs The patients in the experimental group were monitored for vital signs 3 times per week, and received a weekly consultation either by a neurologist or a psychologist. Each node of the telemedicine system used for patient monitoring consisted of a box that was connected to the monitor of a personal computer. The telemedicine devices used for monitoring vital signs of the elderly consisted of a pulse oximeter, aneroid sphygmomanometer and electrocardiograph. The data obtained from the measurement of vital parameters were transmitted from the telemedicine devices to the box via Bluetooth or wireless technology. The system automatically transmitted the recorded data to the telemedicine centre by using the local internet connection, without interaction of the involved subjects. Once the server received the patient’s information, a technician of the telemedicine centre, who received an appropriate training on e‐Health and telemedicine systems, managed and stored the data within the local server. Consequently, the neurologist, the psychologist and other healthcare professionals were able to check the patient conditions at any time. The system allowed performing the telecounselling by a skilled neurologist or psychologist. The patients’ needs or problems were either managed directly by the counsellor, or by a local nursing after the counsellor gave him the recommendation of the case. When the clinical conditions were potentially severe, as to necessitate a prompt specialised intervention, the patient was sent to the hospital. Duration of the intervention: not reported Details of the intervention: see TIDieR checklist for full details of intervention (Appendix 2) Control arm: the control group received standard nursing care EPOC category: information and communication technology (subcategory: Telemedicine) Type of care: primary and secondary care |
|
| Outcomes |
Time points: referred to as T1 (specific timing not reported) Primary outcomes: the Mini Mental State Examination (MMSE), Activities of Daily Living (ADL), Instrumental Activities of Daily Living (IADL), Geriatric Depression Scale (GDS), Brief Psychiatric Rating Scale (BPRS), Bedford Alzheimer Nursing Severity (BANSS), health‐related quality of life measured by EUROQoL (EQ‐5D) Secondary outcomes: none Loss of clusters and individuals: not reported Adjusted for clustering for each outcome: n/a Method of cluster adjustment for each outcome: n/a ICC reported for each outcome: n/a |
|
| Notes |
Outcomes used in this review: health‐related quality of life, measured at T1 (specific timing not reported) Unit of analysis error: no Ethical approval and informed consent obtained: yes Funding source: not reported Declarations of interest: not reported Contact with author: no Additional outcome data provided from author: no Trial registration: not reported |
|
| Risk of bias | ||
| Bias | Authors' judgement | Support for judgement |
| Random sequence generation (selection bias) | Unclear risk | "The patients were randomly divided into two groups, in order of recruiting." Sequence for randomisation is not clear. |
| Allocation concealment (selection bias) | Unclear risk | Allocation concealment is not clearly described. |
| Blinding of participants and personnel (performance bias) Outcomes reported in summary of findings table | High risk | Participants and personnel were not blinded, and some of the outcomes would likely be influenced by the lack of blinding (i.e. health‐related quality of life). |
| Blinding of outcome assessment (detection bias) Outcomes reported in summary of findings table | High risk | Each participant was evaluated by a neuropsychologist, but it is not clear whether the neuropsychologist was blinded to the patient's treatment allocation. Health‐related quality of life was self‐reported by unblinded participants and thus could have been subject to bias. |
| Incomplete outcome data (attrition bias) All outcomes | Unclear risk | Presumably there was no dropout, however N is not clearly stated for each outcome. |
| Selective reporting (reporting bias) | Unclear risk | Protocol/trial registration are not available, so it is unclear whether all outcomes are reported. |
| Other bias | Unclear risk | Intervention group was younger than control group. This was not accounted for in the main or sensitivity analyses. |
Dy 2013.
| Study characteristics | ||
| Methods |
Aim of the study: to evaluate the feasibility and utility of using telemedicine to improve glycaemic control (reduce episodes of hypoglycaemia and severe hyperglycaemia) for residents with diabetes in a skilled nursing facility Study design: RCT Unit of randomisation: individual resident Mean cluster size: NA Unit of analyses: individual resident Sample size calculation: not reported (pilot study so most likely underpowered) |
|
| Participants |
Participants: residents were receiving pharmacological therapy for type 2 diabetes; ≥ 6‐month anticipated residency, were medically stable, and did not have stage 4 chronic renal disease Intervention group: n = 12 Control group: n = 11 Age: mean (range) of all participants 83 (65 to 93) years Sex: 70% female (all participants) Comorbidities: 91% (11 control, 10 intervention) of all participants insulin‐treated; 57% of all participants confused, 8% of all participants aphasic, 35% of all participants oriented. Other co‐morbidities not reported. Setting: urban skilled nursing facility Country: USA |
|
| Interventions |
Intervention arm: Telemedicine to improve glycaemic management Weekly or biweekly teleconsultations between endocrinologist (Joslin Diabetes Center at Upstate Medical University) and the resident’s nurse and dietitian. One‐Touch Ultra2 (LifeScan, Milpitas, CA) glucose monitoring devices were used, and individual downloads were transmitted prior to televisits. Residents and family members who were able and willing attended the televisits. At televisits, point‐of‐care glucose levels, diet, medications and changes in medical conditions were reviewed, and recommendations related to changes in glycaemic control medications and diet were delivered. Duration of the intervention: up to 6 months Details of the intervention: see TIDieR checklist for full details of intervention (Appendix 2) Control arm: usual care (not described) EPOC category: information and communication technology (subcategory: Telemedicine) Type of care: primary and secondary care (endocrinologist involved) |
|
| Outcomes |
Time points: baseline, 3, 6 months Primary outcomes: glucose data, haemoglobin A1c (A1c) (target < 8.0%) levels (baseline, 3 and 6 months), mortality, nursing staff satisfaction Secondary outcomes: none Loss of clusters and individuals: n/a Adjusted for clustering for each outcome: n/a Method of cluster adjustment for each outcome: n/a ICC reported for each outcome: n/a |
|
| Notes |
Outcomes used in this review:
Unit of analysis error: no Ethical approval and informed consent obtained: yes Funding source: not reported Declarations of interest: none declared or detected Contact with author: no Additional outcome data provided from author: no Trial registration: not provided Other: usual care is not described; included under assumption that usual care consists of face‐to‐face glycaemic management by GP |
|
| Risk of bias | ||
| Bias | Authors' judgement | Support for judgement |
| Random sequence generation (selection bias) | Unclear risk | Authors do not describe how the random sequence was generated. |
| Allocation concealment (selection bias) | Unclear risk | The allocation process was not described. |
| Blinding of participants and personnel (performance bias) Outcomes reported in summary of findings table | High risk | The authors do not describe blinding. Due to the nature of the intervention, it is unlikely that participants or personnel were blinded. |
| Blinding of outcome assessment (detection bias) Outcomes reported in summary of findings table | High risk | It is not reported whether outcome assessors were blinded. Death and clinical measurements (e.g. glucose levels) are unlikely to be biased due to lack of blinding. Nurse satisfaction self‐asssessment by unblinded nurses could be biased due to lack of blinding. |
| Incomplete outcome data (attrition bias) All outcomes | Low risk | One participant withdrew after randomisation (transfer to palliative care; not reported from which group); 3 and 2 patients from intervention/control died (2 deaths occurred < 12 weeks after the start of the study). |
| Selective reporting (reporting bias) | Unclear risk | Protocol/trial registration are not available, so it is unclear whether all outcomes are reported. |
| Other bias | Unclear risk | Comparison between the groups at baseline is not provided. |
Forbat 2020.
| Study characteristics | ||
| Methods |
Aim of the study: to determine whether a model of care providing specialist palliative care in care homes, called Specialist Palliative Care Needs Rounds, could reduce length of stay in hospital Study design: stepped‐wedge cRCT Unit of randomisation: RACF Mean cluster size: 1700 residents/12 clusters = 142 residents per cluster Unit of analyses: individual resident Sample size calculation: The sample size was estimated taking into consideration of the study design as a stepped‐wedge randomised trial, with the primary outcome as length of hospitalisation when participants are admitted to the hospital. Results obtained from the pilot study suggested that the intervention could achieve a moderate effect size of 0.6 with a mean difference in length of stay of 1.8 days (pooled SD = 2.9). The sample size was derived initially from a two‐arm randomised control design with 1:1 allocation ratio, whereby an unadjusted sample of about 41 residents in each arm would provide 80% power at a 2‐tail significance level of 5% with an intervention effect size of 0.6. The calculation was then adjusted for the stepped‐wedge design, with the design effect calculated as 4.55, and a minimum total of 410 hospitalised residents required, recognising that a larger sample would offer greater analytic power. |
|
| Participants |
Participants: residents of RACFs with short prognosis and high symptom burden Intervention group: n = 1700 Control group: n = 1152 Age: mean (SD) full sample 85.0 (8.8) Sex: proportion female full sample 64% Comorbidities: age‐adjusted Charlson comorbidity index in full sample: 5.4 (1.5) Setting: RACF Country: Australia |
|
| Interventions |
Intervention arm: Specialist Palliative Care Needs Rounds (triage meetings, case‐based education, case conferences)
Duration of the intervention: between 9 and 15 months Details of the intervention: see TIDieR checklist for full details of intervention (Appendix 2) Control arm: usual care involves access to the specialist palliative care team’s two nurses who work in residential aged care. Their role includes elements 3&4 of the intervention model. Critically, though there is no embedded ‘triage’ element in the form of the needs rounds and limited case‐based education for staff. Essentially, the usual care is reactive, whereas the trial intervention is proactive and anticipatory. EPOC category: co‐ordination of care (subcategory: Case management) Type of care: primary and secondary care |
|
| Outcomes |
Time points: monthly until cessation of data collection (15 months after the first 2 sites started the intervention) Primary outcomes: length of stay in the hospital (days) Secondary outcomes: number of hospitalisations, cost of admissions, quality of death, staff confidence, place of death, mortality Loss of clusters and individuals: 1 facility lost to follow‐up in Step 4 (124 residents) (reason: mismatch with their preferred reactive, rather than proactive, model of care) Adjusted for clustering for each outcome: yes Method of cluster adjustment for each outcome: mixed model ICC reported for each outcome: no |
|
| Notes |
Outcomes used in this review:
Unit of analysis error: no Ethical approval and informed consent obtained: yes Funding source: the Australian Capital Territory (ACT) Health Department Declarations of interest: none declared or detected Contact with author: yes Additional outcome data provided from author: authors provided details of statistical analyses, additional data about number of hospitalisations, lengths of hospital stay and number of deaths (details can be found in additional Table 9) Trial registration: ACTRN12617000080325 |
|
| Risk of bias | ||
| Bias | Authors' judgement | Support for judgement |
| Random sequence generation (selection bias) | Low risk | "Simple randomisation was used, with sites allocated a unique code at the outset of the project. Sequence generation was managed through an Internet‐based programme which randomly selected sites for each step." |
| Allocation concealment (selection bias) | Low risk | "Once randomisation was conducted, sites were informed of the timing of their facility’s migration from control to intervention condition by the study’s chief investigator." |
| Blinding of participants and personnel (performance bias) Outcomes reported in summary of findings table | High risk | Participants and personnel were not blinded, and some of the outcomes would likely be influenced by the lack of blinding (i.e. resource use, number of hospitalisations and length of stay). |
| Blinding of outcome assessment (detection bias) Outcomes reported in summary of findings table | Low risk | Blinding of outcome assessors was not clearly reported; however, the outcome data were extracted from residents' care home files and lack of blinding was unlikely to influence the assessment of the outcomes. |
| Incomplete outcome data (attrition bias) All outcomes | Low risk | Attrition is clearly described and is unlikely to have caused bias. Deaths and loss to follow‐up are outlined at each time point. One facility lost to follow‐up in Step 4. |
| Selective reporting (reporting bias) | Unclear risk | Not all outcomes from trial registration form are reported (e.g. family views on care). Additional outcomes not stated in trial registration form (e.g. number of hospitalisation) are reported. |
| Other bias | Low risk | Recruitment bias: LOW ‐ RACFs were randomised and all residents of the RACF received the treatment to which the RACF was allocated. Baseline imbalance: LOW ‐ characteristics at T0 were comparable to full sample (stepped‐wedge design). Protection against contamination: LOW ‐ unlikely to be biased due to contamination/‘herd effects’ as the delivery of the intervention occurred as per RACF policy/practice and was not subject to participant choice or compliance. Incorrect analysis: LOW ‐ analyses accounted for clustering and time‐trends (provided by authors per email: generalised linear and latent mixed model (GLLMM) utilised fixed effects on time (treated as a dummy variable at each time point). No other sources of bias detected. |
Grabowski 2014.
| Study characteristics | ||
| Methods |
Aim of the study: This study was designed to answer two questions. First, did the residents of nursing homes that were randomly chosen to receive off‐hours physician coverage by a telemedicine service experience a lower rate of hospitalisation, compared to residents of homes that received standard physician coverage? And second, if the nursing homes with telemedicine coverage did have lower rates of hospitalisation, did they realise substantial savings? Study design: cRCT Unit of randomisation: nursing home Mean cluster size: mean number of beds intervention/control 178/140 Unit of analyses: bed‐days Sample size calculation: not reported |
|
| Participants |
Participants: residents of the nursing homes Intervention group: n not reported, mean n beds = 178 Control group: n not reported, mean n beds = 140 Age: not reported Sex: not reported Comorbidities: not reported Setting: nursing home Country: USA |
|
| Interventions |
Intervention arm: Telemedicine consultation during off‐hours Telemedicine service to cover urgent or emergent calls on week nights (5:00 to 11:00 p.m.) and weekend days (10:00 a.m. to 7:00 p.m.). The intervention consisted of introducing into the RACF a cart with equipment for two‐way videoconferencing and a high‐resolution camera for use in wound care. When a RACF resident had an off‐hours medical problem, a staff member brought the cart into the resident’s room and contacted the telemedicine service. The service’s medical call centre was staffed by a medical secretary and 3 providers: a registered nurse, a nurse practitioner and a physician. Calls were triaged by the medical secretary to the appropriate provider at the call centre. Duration of the intervention: 11 months Details of the intervention: see TIDieR checklist for full details of intervention (Appendix 2) Control arm: evening or weekend calls were directed to the covering physician in the group practice, with off‐hours care typically provided by telephone from a remote location EPOC category: information and communication technology (subcategory: Telemedicine) Type of care: primary and secondary care |
|
| Outcomes |
Time points: 11 months after the start of the intervention Primary outcomes: number of residents hospitalised (stays including midnight), Medicare expenditure Secondary outcomes: none Loss of clusters and individuals: no Adjusted for clustering for each outcome: yes Method of cluster adjustment for each outcome: generalised estimating equations ICC reported for each outcome: no |
|
| Notes |
Outcomes used in this review: Resource use, measured at 11 months Any hospital admissions, measured at 11 months Unit of analysis error: no Ethical approval and informed consent obtained: not reported Funding source: the Commonwealth Fund Declarations of interest: none declared or detected Contact with author: no Additional outcome data provided from author: no Trial registration: not reported |
|
| Risk of bias | ||
| Bias | Authors' judgement | Support for judgement |
| Random sequence generation (selection bias) | Unclear risk | Sequence generation is not described. |
| Allocation concealment (selection bias) | Low risk | Allocation was done for all clusters at once, so allocation concealment is unlikely to be a source of bias. |
| Blinding of participants and personnel (performance bias) Outcomes reported in summary of findings table | High risk | Participants and personnel were not blinded, and some of the outcomes would likely be influenced by the lack of blinding (i.e. resource use, number of hospitalisations). |
| Blinding of outcome assessment (detection bias) Outcomes reported in summary of findings table | Low risk | Data on hospitalisations were extracted from electronic health record system. It is not clearly reported who extracted the data and whether this person was blinded; however, it is unlikely that any lack of blinding would influence assessment of the included outcomes. |
| Incomplete outcome data (attrition bias) All outcomes | Low risk | All patients in recruited nursing homes were participating in the intervention. There was no dropout of the intervention. |
| Selective reporting (reporting bias) | Unclear risk | Protocol/trial registration are not available, so it is unclear whether all outcomes are reported. |
| Other bias | Low risk | Recruitment bias: LOW ‐ all residents of RACF recruited to intervention received the intervention. Baseline imbalance: UNCLEAR ‐ baseline characteristics are not clearly reported in comparison to control (stepped‐wedge design). Protection against contamination: LOW ‐ not expected due to the nature of the intervention and stepped‐wedge design. Incorrect analysis: LOW ‐ analyses accounted for study design. No other sources of bias detected. |
Haines 2020.
| Study characteristics | ||
| Methods |
Aim of the study: to evaluate the impact of directly employing GPs and changing the model of care on resident health outcomes Study design: stepped‐wedge cRCT Unit of randomisation: RACF Mean cluster size: not reported Unit of analyses: 9‐week block per facility Sample size calculation: To achieve greater than 80% power for detecting a 27% reduction in unplanned hospital transfers per time block (from 12.4 to 9.05 transfers per facility per time block), 15 facilities distributed across 7 clusters, with 1 cluster transitioning from control to intervention per block of time, were adequate (α = 0.05 (two tailed); assumed intra‐class correlation coefficient, 0.71, based on data provide by Bupa Aged Care) (post‐hoc sample size calculation). |
|
| Participants |
Participants: residents and staff of RACF Intervention group: mean (SD) occupied bed‐days per 9‐week block 6255 (1800); number of participating staff members not reported, responses received from 1500 and 1409 staff members in 2 survey rounds Control group: mean (SD) occupied bed‐days per 9‐week block 6610 (2219); number of participating staff members not reported, responses received from 1500 and 1409 staff members in 2 survey rounds Age: not reported Sex: not reported Comorbidities: not reported Setting: RACF Country: Australia |
|
| Interventions |
Intervention arm: GP co‐located in RACF Intervention model of care:
Duration of the intervention: between 63 and 121 weeks, depending on the facility Details of the intervention: see TIDieR checklist for full details of intervention (Appendix 2) Control arm:
EPOC category: who provides care (subcategory: Staffing models) Type of care: primary care |
|
| Outcomes |
Time points: between 63 and 121 weeks after the start of the intervention Primary outcomes: number of falls, unplanned hospital transfers, polypharmacy Secondary outcomes: out‐of‐hours requests for GP (in‐house or external), new urinary tract, respiratory and gastrointestinal infections, new skin tears, new pressure injuries, fractures arising from falls, unplanned hospital admissions, complaints by residents and family members, reports of resident aggression, death of the residents, medication errors; costs (covering hospital transfers, admissions, ambulance usage, GP consultations, new infrastructure, recruiting and training new staff) Loss of clusters and individuals: 4 sites were unable to recruit a GP Adjusted for clustering for each outcome: yes Method of cluster adjustment for each outcome: random‐effects model ICC reported for each outcome: no |
|
| Notes |
Outcomes used in this review:
Unit of analysis error: no Ethical approval and informed consent obtained: yes Funding source: the Bupa Health Foundation Declarations of interest: none declared or detected Contact with author: yes Additional outcome data provided from author: no Trial registration: ACTRN12613000218796 Primary analysis was an intention‐to‐treat analysis of data from the stepped wedge component of the trial; secondary analysis also included the retrospective and follow‐up data periods. We used primary analysis data reported by the trial authors. |
|
| Risk of bias | ||
| Bias | Authors' judgement | Support for judgement |
| Random sequence generation (selection bias) | Low risk | "Clusters of sites were randomised to starting positions in the trial by one author (TPH) using a computer‐generated number command in Microsoft Excel based on codes for each participating facility." |
| Allocation concealment (selection bias) | Low risk | Person allocating facilities (the order to start intervention) was not aware of the code for each facility. |
| Blinding of participants and personnel (performance bias) Outcomes reported in summary of findings table | High risk | Participants and personnel were not blinded, and some outcomes would likely be influenced by the lack of blinding (i.e. ED visits, unplanned admissions, adverse events, work‐related satisfaction). |
| Blinding of outcome assessment (detection bias) Outcomes reported in summary of findings table | Low risk | Outcome assessors were not blinded, however, outcome data were obtained from third party providers, registries and electronic resident tracking system so it is unlikely that lack of blinding would influence assessment of the primary outcomes in this review. |
| Incomplete outcome data (attrition bias) All outcomes | Low risk | Data were obtained for all residents through registration systems. |
| Selective reporting (reporting bias) | Low risk | Two secondary measures planned during protocol were not collected (residents using enteral feeding, staff sick leave). Authors provide arguments for this in the appendix. All primary outcomes stipulated in the registered trial protocol were reported on in the published study. |
| Other bias | Unclear risk | Recruitment bias: LOW ‐ all residents of RACF recruited to intervention received the intervention. Baseline imbalance: UNCLEAR ‐ baseline characteristics are not clearly reported in comparison to control (stepped‐wedge design). Protection against contamination: LOW ‐ unlikely to be biased due to contamination/‘herd effects’ as the delivery of the intervention occurred as per RACF policy/practice and was not subject to participant choice or compliance. Incorrect analysis: UNCLEAR ‐ Facility level analyses only instead of analyses of individual level data (sample size calculation in the protocol was done for individual data). Analyses adjusted for study design (clustering by facility and time trends (information from authors)). Other bias: Intervention implementation issues: 4/15 facilities did not manage to employ GPs ‐ potential to bias interpretation of the outcome. |
Harvey 2014.
| Study characteristics | ||
| Methods |
Aim of the study: to evaluate (1) the feasibility and consumer satisfaction with a geriatrician‐led supported discharge service for older adults living in residential care facilities (RCFs) and (2) its impact on the uptake of Advanced Care Planning (ACP) and acute health care service utilisation Study design: RCT Unit of randomisation: individual resident Mean cluster size: n/a Unit of analyses: individual resident Sample size calculation: estimated that 550 subjects were needed to detect a 10% difference in acute care readmission rates at 80% power, and an alpha level of 0.05. An interim analysis of the study results was conducted at 18 months to review the feasibility of the service and the appropriateness of the evaluation strategy. Analyses reported are based on 123 patients. |
|
| Participants |
Participants: residents > 65 of ACFs discharged back to ACF after hospital admission Intervention group: n = 57 (61 randomised) Control group: n = 59 (62 randomised) Age: mean (SD) intervention/control 83.8 (7)/86.7 (7) Sex: proportion female intervention/control 67%/59% Comorbidities: proportionsevere dementia (AMTS < 4/10) intervention/control 47%/50%; proportion depression (> 70 Zung Depression Scale) intervention/control 7%/3% Setting: RACF Country: Australia |
|
| Interventions |
Intervention arm: Geriatrician‐led discharge from hospital to RACF (The Residential Care Intervention Program in the Elderly (RECIPE) The RECIPE team comprised 2 part‐time geriatricians and an aged care nurse consultant. All intervention group patients were reviewed in the RACF within 4 days of discharge. At the first visit, a comprehensive assessment and a tailored care plan was developed. Appropriate services were provided and patients were offered further visits for review of intercurrent illness if required. The service also provided education and support to RACF staff and the patients’ primary care physician. Duration of the intervention: 6 months Details of the intervention: see TIDieR checklist for full details of intervention (Appendix 2) Control arm: The usual care group was managed by the treating medical unit according to standard hospital protocols and received standard discharge planning, with follow‐up at the RACF by their primary care physician service. EPOC category: co‐ordination of care (subcategory: Discharge planning) Type of care: primary and secondary care |
|
| Outcomes |
Time points: 6 months after the start of the intervention Primary outcomes: the Abbreviated Mental Test Score (AMTS), Mini Mental State Examination (MMSE), Barthel Index, Short Zung Interviewer‐assisted Depression Scale, proportion of patients and their families who participated in advanced care planning discussions, proportion who chose to document an AD and their stated preferences for end of life care, outpatient and day procedure visits, number of meetings that took place, emergency department presentations, acute in‐patient admission, health‐related quality of life, mortality, inpatient admission (acute or sub‐acute), total bed‐days over follow‐up (excluding index admission), resident's satisfaction Secondary outcomes: none Loss of clusters and individuals: intervention/control 1 dropout/2 dropouts Adjusted for clustering for each outcome: n/a Method of cluster adjustment for each outcome: n/a ICC reported for each outcome: n/a |
|
| Notes |
Outcomes used in this review:
Unit of analysis error: no Ethical approval and informed consent obtained: yes Funding source: the Department of Health, Victoria, Australia, through the Northern Alliance Hospital Admission Risk Program Declarations of interest: none declared or detected Contact with author: yes Additional outcome data provided from author: yes, provided additional data about ED visits, quality of life measurement and definition of hospital admissions (see Table 8) Trial registration: trial not registered |
|
| Risk of bias | ||
| Bias | Authors' judgement | Support for judgement |
| Random sequence generation (selection bias) | Low risk | Computer‐generated random number sequence was used. |
| Allocation concealment (selection bias) | Low risk | "Study allocations were placed in pre‐numbered, sealed envelopes. The study team allocated each patient to the next consecutive number at discharge from acute care. They had no control over the timing of discharges, and the treating medical units were blinded to the study allocation." |
| Blinding of participants and personnel (performance bias) Outcomes reported in summary of findings table | High risk | Participants and personnel were not blinded, and some of the outcomes would likely be influenced by the lack of blinding (i.e. ED visits, unplanned and any admissions, length of stay and residents' satisfaction). |
| Blinding of outcome assessment (detection bias) Outcomes reported in summary of findings table | Low risk | It is not clear whether outcome assessors were blinded; however, data on primary outcomes (i.e. ED visits, unplanned hospitalisations) were obtained from administration data, so it is unlikely that the assessment of these outcomes would be influenced by lack of blinding. |
| Incomplete outcome data (attrition bias) All outcomes | Low risk | Attrition and exclusions are clearly stated, with no substantial differences between the groups. Data on some outcomes (e.g. questionnaire surveys) had quite a low response rate (< 60%). |
| Selective reporting (reporting bias) | Unclear risk | Trial not registered, protocol not published (MD thesis of the corresponding author), full copy not available. Email authors: "As the trial concluded in 2005, much of the original hard copy and electronic data has been archived". |
| Other bias | Unclear risk | Intervention and control patients were treated by the same staff so contamination bias may be present. |
Kim 2020.
| Study characteristics | ||
| Methods |
Aim of the study: to examine whether the SPEC model (the intervention program), a theory driven, technology‐enhanced, integrated care management model, is effective for improving the quality of care for older residents in comparison to usual care reflecting current practice patterns in nursing homes in Korea Study design: incomplete stepped‐wedge cRCT Unit of randomisation: nursing home Mean cluster size: 52 residents (525 residents/10 clusters) Unit of analyses: individual resident Sample size calculation: The sample size for a cluster (nursing home) was calculated using the formula of Hemming, Haines, et al (2015) for incomplete SW‐CRCT designs. The expected intervention effect on the primary outcome, the composite score of QIs, was set at δ = 0.067 (control: 0.182, intervention: 0.115) based on a similar intervention study (Boorsma et al, 2011). Authors took account of both within‐cluster and within‐resident correlations by adding cluster‐specific and resident‐specific random effects to the outcome models. The intracluster correlation coefficient (ICC) was assumed to be 0.01 based on Boorsma 2011. The correlation coefficient of repeated measurements was set at 0.25 based on the ratio between the ICC and the correlation coefficient used in the study of Muntinga et al (2012). Both the ICC and the correlation coefficient were assumed to be fixed across time. Finally, the authors took account of the fact that the 10 clusters were divided into 5 groups with 2 clusters each, and that the groups were randomised in a sequential manner. The calculation was conducted in R software, version 3.2.4. The minimum cluster size required to detect the expected intervention effect with 80% power at the 5% significance level was n = 45. Based on earlier national nursing home survey study (Kim et al, 2015) and also publicly available data on the characteristics of LTC residents (Korean National Health Insurance Service (KNHIS), 2016), the authors assumed and accounted for a 15% dropout rate among the recruited residents. New enrolments were allowed when an older adult was newly admitted to a participating nursing home and met the trial criteria. |
|
| Participants |
Participants: residents of nursing homes Intervention group: n = 431 Control group: n = 482 Age: mean (SD) intervention/control 83.1(7.5)/82.7(7.3) Sex: proportion females intervention/control 81%/80% Comorbidities: not reported Setting: nursing home Country: South Korea |
|
| Interventions |
Intervention arm: Systems for Person‐centered Elder Care (SPEC) (Integrated care model based on Wagner’s Chronic Care Model) SPEC intervention consisted of 5 components:
Duration of the intervention: 6 months Details of the intervention: see TIDieR checklist for full details of intervention (Appendix 2) Control arm: During the control period, older adults receive usual care from RACF staff, which is identical to usual practice. While “the usual practice” may not be identical across RACFs, no RACF provided standardised CGA or implemented evidence passed care planning in a systematic way. EPOC category: co‐ordination of care (subcategory: Continuity of care) Type of care: primary and secondary care |
|
| Outcomes |
Time points: 3 months and 6 months after the start of the intervention Primary outcomes: quality of care (interRAI LTCF) Secondary outcomes: quality of care (individual scores), care needs, functional health, quality of life (EuroQoL(EQ)‐5, interRAI (self‐reported) QoL (SQoL), patient satisfaction, health care utilisation (hospital admissions, ED visits), costs (direct and indirect costs), empowerment (staff), communication satisfaction (staff), organisational commitment (staff), job satisfaction, technology/innovation acceptance Loss of clusters and individuals: no loss to follow‐up of clusters. Individual loss to follow‐up intervention 3 months/intervention 6 months/control: 51/42/43 (not including transfers and deaths) Adjusted for clustering for each outcome: yes Method of cluster adjustment for each outcome: random‐effects model ICC reported for each outcome: no |
|
| Notes |
Outcomes used in this review:
Unit of analysis error: no Ethical approval and informed consent obtained: yes Funding source: a grant from the Korea Health Technology R&D Project through the Korea Health Industry Development Institute (KHIDI), funded by the Ministry of Health & Welfare, Republic of Korea [HI13C2250] and an AXA Research Fund 2016 AXA Award [900‐2017006 to H. Kim] Declarations of interest: none declared or detected Contact with author: yes Additional outcome data provided from author: no. Authors clarified details of statistical analyses. Trial registration: ISRCTN11972147 |
|
| Risk of bias | ||
| Bias | Authors' judgement | Support for judgement |
| Random sequence generation (selection bias) | Low risk | "Using computer‐generated random numbers, an allocation sequence for the recruited nursing homes (clusters) was generated that complies with the statistical power calculations and the requirements of participating nursing homes." |
| Allocation concealment (selection bias) | Low risk | "The random‐sequence document is available neither to the enrolled nursing homes nor the participating older adults. In order to conceal the sequence, each nursing home was simply informed just one month prior to each home starting to recruit residents and get consent forms. None of the participating homes know the allocation sequences of either itself or others. A data manager independently has allocated the sequence and passed the results to the SPEC consultant enrolling the participating nursing homes." |
| Blinding of participants and personnel (performance bias) Outcomes reported in summary of findings table | High risk | Participants and personnel were not blinded and some outcomes would likely be influenced by the lack of blinding (i.e. adverse outcomes). |
| Blinding of outcome assessment (detection bias) Outcomes reported in summary of findings table | Low risk | Outcome assessors and data analysts were blinded until the end of the study. "To keep the blinding, the identities of the participating institutions and individuals were registered anonymously in the research database by the data team director. The external assessors were blinded to the study design (e.g., the allocation sequence and the switch from control to intervention period), and the data analysts were blinded to the identifications and the randomization results until the data collection and analyses were done. Neither the identifications nor the randomization results were revealed to the funding agencies. The principal investigator and the SPEC consultant could not be blinded." |
| Incomplete outcome data (attrition bias) All outcomes | Low risk | Attrition and dropout are well described and tested in sensitivity analyses, and are unlikely to introduce bias. Note: During the control phase, the loss to follow‐up increased in the clusters randomised to start later (during C4 and C5). The loss to follow‐up was similar in most of the stages during the intervention phase though; however, in the NHs randomised to the C1 cluster the loss to follow‐up during the second phase of the intervention was almost 3 times more than the loss to follow‐up during this phase of the study in C2, C3, C4 and C5. Given that data are aggregated and comparisons are not done between the clusters, this is unlikely to bias the results. |
| Selective reporting (reporting bias) | Unclear risk | Most outcomes specified in the protocol are not reported. Authors have not provided unpublished data but informed that more publications are expected in the near future. |
| Other bias | High risk | Recruitment bias: HIGH ‐ NHs were informed of their allocation 1 month prior to each home starting to recruit residents and get consent forms; allocation occurred prior to recruitment of residents within each facility, which may have biased which residents were recruited for participation in the study. "In this incomplete SW‐CRCT study, participating homes were informed of the results of the randomization (the order of allocation) only 1 month before the start of their respective sequence, that is, when the study actually started with patient recruitment, according to the prestratified schedule." "The SPEC study was a facility‐level intervention, so eligible older residents in the homes were recruited by the research team with the help of the care teams in the homes through flyers and verbal explanations of the study shared with the residents or their families." Baseline imbalances: LOW ‐ no differences between control and intervention patients (averaged across clusters); Protection against contamination: LOW ‐ unlikely to be biased due to contamination/‘herd effects’ as the delivery of the intervention occurred as per RACF policy/practice and was not subject to participant choice or compliance Incorrect analyses: LOW ‐ analyses accounted for study design (clustering and time trends). Communication with authors: "In the stepped‐wedge trial that we implemented, nursing homes that were grouped in the same cluster started the trial together. To account for the effect of the different starting time between clusters, we imposed a cluster‐level random effect. In whole, three random effects were applied in the analysis: the first at the cluster level (to account for the time trend), the second at the nursing‐home level (to account for the difference among nursing homes), and the last one at the resident level (to account for repeated measurements for the same resident)." No other sources of bias detected. |
Kolcu 2020.
| Study characteristics | ||
| Methods |
Aim of the study: This study evaluated the effects of a nurse‐led hypertension management program on quality of life, medication adherence and hypertension management in older adults. Study design: RCT Unit of randomisation: individual resident Mean cluster size: n/a Unit of analyses: individual resident Sample size calculation: To determine sample size, power analysis was carried out based on systolic blood pressure values obtained from the sample group before the study (group 1 129.18 14.60 mmHg, group 2 119.18 15.16 mmHg, alpha error 5%, beta error 10%). For the study to have 90% power and a P value < 0.05, a sample size of 76 with at least 38 hypertensive older adults in each group was required. Therefore, the study included 76 hypertensive adults. |
|
| Participants |
Participants: hypertensive older adults residing in 2 different nursing homes Intervention group: n = 38 Control group: n = 38 Age: mean (SD): 75.63 (7.25) Sex: proportion females intervention/control: 48.6%/43.2% Comorbidities: not reported Setting: RACF Country: Turkey |
|
| Interventions |
Intervention arm: Nurse‐led HT management program (NLHMP) The program consisted of individual and group interventions together with actions taken at the institutional level. These interventions included 6 sessions of health education followed by 4 brief motivational meetings held at 1‐week intervals for each older adult in the intervention group. Those who did not want to participate in group education sessions were given individual education. An action plan was created together with the patients before the motivational meetings, the effectiveness of the practices specified in the action plan were discussed at these meetings and each new meeting was arranged individually in accordance with the participants’ needs. Blood pressure and anthropometric measurements were repeated at each motivational meeting. Institutional arrangements included removing saltshakers from tables, distributing medicine boxes and planning appropriate areas for doing regular exercise. The participants were encouraged to consume a DASH diet, which is rich in fruits and vegetables, low in fat, and rich in potassium, magnesium, calcium, fibre and protein. Immobile patients were exercised with active and passive movements 3 days a week. Duration of the intervention: 20 weeks Details of the intervention: see TIDieR checklist for full details of intervention (Appendix 2) Control arm: The participants in the control group received the routine care provided in their nursing home. Similar care practices for HT patients were used in both facilities. These included clinical evaluation every 6 months, procurement and administration of anti‐HT medications, and blood pressure measurement twice a day and when patients reported feeling unwell. The control group was educated about HT management by the researcher after post‐test assessments. EPOC category: who provides care (subcategory: Role expansion or task shifting) Type of care: primary care |
|
| Outcomes |
Time points: week 1, 2, 5 and 24 (post‐test) Primary outcomes: systolic and diastolic blood pressure values, HT knowledge score, SF‐36 quality of life total score and subscales, medication adherence Secondary outcomes: BMI and waist‐to‐hip ratios derived from anthropometric measurements, fasting blood sugar and fasting lipid profile (serum LDL cholesterol, serum HDL cholesterol, fasting serum triglyceride) values from biochemical measurements, mortality Loss of clusters and individuals: no loss to follow‐up Adjusted for clustering for each outcome: n/a Method of cluster adjustment for each outcome: n/a ICC reported for each outcome: n/a |
|
| Notes |
Outcomes used in this review:
Unit of analysis error: no Ethical approval and informed consent obtained: yes Funding source: not reported Declarations of interest: not reported Contact with author: no Additional outcome data provided from author: no Trial registration: not reported |
|
| Risk of bias | ||
| Bias | Authors' judgement | Support for judgement |
| Random sequence generation (selection bias) | Low risk | “The block randomization method was used to allocate an equal number of patients to each group (19 blocks of 4). A computer‐generated randomization list was made with half of the sample in group A and the other half in group B.” |
| Allocation concealment (selection bias) | Unclear risk | “Participants were assigned to the intervention or control group according to which letter list they were on (two in the intervention group, and two controls per block).” Further efforts to conceal allocation are not described. |
| Blinding of participants and personnel (performance bias) Outcomes reported in summary of findings table | High risk | Blinding is not described. Due to the nature of the intervention, it is unlikely that participants and personnel were blinded. This could bias at least one of the outcomes included in the review (i.e. quality of life). |
| Blinding of outcome assessment (detection bias) Outcomes reported in summary of findings table | Unclear risk | It is not described whether outcome assessors were blinded. Self‐reported quality of life by unblinded participants was likely subject to detection bias. |
| Incomplete outcome data (attrition bias) All outcomes | Low risk | No loss to follow‐up reported, presumably all patients completed the intervention. |
| Selective reporting (reporting bias) | Unclear risk | Protocol/trial registration are not available, so it is unclear whether all outcomes are reported. |
| Other bias | Low risk | No other sources of bias detected. |
Kotynia‐English 2005.
| Study characteristics | ||
| Methods |
Aim of the study: to assess the efficacy of an early psychiatric intervention on the 12‐month health outcomes of older adults admitted to residential care facilities Study design: RCT Unit of randomisation: individual resident Mean cluster size: n/a Unit of analyses: individual resident Sample size calculation: not reported |
|
| Participants |
Participants: adults aged 65 years and over admitted to one of the participating residential care facilities Intervention group: n = 53 Control group: n = 53 Age: mean (SD) intervention/control 82.9(6.3)/84.6(8.1) Sex: proportion females intervention/control: 69.8%/64.1% Comorbidities: not reported Setting: RACF Country: Australia |
|
| Interventions |
Intervention arm: Early psychiatric intervention All new admissions to the residential care facilities were screened systematically for the presence of psychiatric morbidity. This assessment was done by suitably trained research staff using the following instruments: Health of the Nation Outcome Scales for older adults (HoNOS 65+), Mini‐mental State Examination (MMSE), Geriatric Depression Scale (GDS) and Neuropsychiatric Inventory (NPI). For the purposes of this study, older adults were considered to have screened positive if they had a GDS‐15 score greater than 5 or an NPI score greater than zero in any of its 12 sections. Subjects in the intervention group who screened positive at the baseline assessment were reviewed within a 2‐week period by the Inner City Mental Health Service of Older Adults (ICMHSOA) and, if clinically appropriate, mental health services were introduced without the involvement of the research team. The ICMHSOA is a multidisciplinary psychogeriatric team that includes psychiatrists, psychologists, social workers and community nurses. As part of the clinical routine of the ICMHSOA, all referrals were initially assessed by a psychiatrist and a case manager. A preliminary management plan is then drawn up according to the needs of the patient, with other team members (e.g. psychologists) getting involved in the management of the patient if necessary. All patients referred to the unit were followed up systematically until the presenting complaint is resolved or adequately contained (normally within 3 months). Duration of the intervention: Subjects in the intervention group who screened positive at the baseline assessment were reviewed within a 2‐week period by the Inner City Mental Health Service of Older Adults (ICMHSOA) and, if clinically appropriate, mental health services were introduced without the involvement of the research team. All patients referred to the unit were followed up systematically until the presenting complaint is resolved or adequately contained (normally within 3 months). Details of the intervention: see TIDieR checklist for full details of intervention (Appendix 2) Control arm: subjects in the control group received standard care (i.e. positive screening did not automatically trigger a referral) EPOC category: co‐ordination of care (subcategory: Care pathways) Type of care: primary and secondary care |
|
| Outcomes |
Time points: 6 and 12 months after the start of the intervention Primary outcomes: Nation Outcome Scales for older adults (HoNOS 65+), Mini‐Mental State Examination (MMSE), Geriatric Depression Scale (GDS), Neuropsychiatric Inventory (NPI) Secondary outcomes: mortality Loss of clusters and individuals: withdrew consent intervention/control 7/7; deceased intervention/control 15/8 Adjusted for clustering for each outcome: n/a Method of cluster adjustment for each outcome: n/a ICC reported for each outcome: n/a |
|
| Notes |
Outcomes used in this review:
Unit of analysis error: no Ethical approval and informed consent obtained: not reported Funding source: not reported Declarations of interest: not reported Contact with author: yes Additional outcome data provided from author: no Trial registration: not reported |
|
| Risk of bias | ||
| Bias | Authors' judgement | Support for judgement |
| Random sequence generation (selection bias) | Low risk | “A random list of numbers was generated by computer and maintained centrally by an independent member of staff.” |
| Allocation concealment (selection bias) | Unclear risk | “Participants were allocated randomly to the intervention or usual care groups in random blocks of eight (four in each group). The researcher who carried out the assessment of all participants was blinded to group allocation.” Efforts for allocation concealment are not explicitly described. |
| Blinding of participants and personnel (performance bias) Outcomes reported in summary of findings table | Low risk | Participants and personnel were not blinded due to the nature of the intervention. This is unlikely to bias the outcome included in this review (i.e. mortality). |
| Blinding of outcome assessment (detection bias) Outcomes reported in summary of findings table | Low risk | “The researcher who carried out the assessment of all participants was blinded to group allocation.” While the outcome assessor was blinded, self‐reported measurements were provided by unblinded residents/caregivers. This is unlikely to bias the outcome included in this review (i.e. mortality). |
| Incomplete outcome data (attrition bias) All outcomes | Low risk | N for each outcome is clearly reported (Table 2). Data on mortality at 12 months (the only outcome included in this review) are provided for all participants who were started on the trial. |
| Selective reporting (reporting bias) | Unclear risk | Protocol/trial registration are not available, so it is unclear whether all outcomes are reported. Results reported at 12 months but not at 6 months. |
| Other bias | Low risk | No other sources of bias detected. |
Kovach 2006.
| Study characteristics | ||
| Methods |
Aim of the study: to assess the effectiveness of the Serial Trial Intervention (STI), an innovative clinical protocol (care pathway) for assessment and management of unmet needs in people with late‐stage dementia Study design: cRCT Unit of randomisation: long‐term care facility Mean cluster size: The facilities had an average of 115.2 beds licensed for skilled care (SD = 43.17; range, 60 to 187). On average, 8.1 residents per cluster (114 participants in 14 clusters). Unit of analyses: individual resident Sample size calculation: A sample of 100 (50 per group) was needed to obtain power of 0.8 with an effect size of 0.50 at a 0.05 α level. Oversampling was needed to account for death, transfer to the hospital and subjects who did not exhibit behavioural symptoms during the study period. |
|
| Participants |
Participants: nursing home residents with late‐stage dementia defined as having (1) Mini‐Mental State Examination (MMSE) score indicating moderate to severe cognitive impairment (0 to 4 years of schooling, 11 and below; 5 to 8 years of schooling, 15 and below; 9 to 12 years of schooling, 19 and below; college level and beyond, 23 and below); (2) advanced functional impairment (i.e. functional assessment staging (FAST) stage 6 or 7 or designated by nurse as unable to clearly and consistently verbalise needs); (3) no chronic psychiatric diagnosis other than dementia‐associated diagnosis, and (4) at least 4 weeks post‐admission to skilled nursing care at this nursing home Intervention group: n = 57 Control group: n = 57 Age: mean (SD) intervention/control 86.58 (7.05)/86.53 (6.83) Sex: proportion females intervention/control 74%/77% Comorbidities: not reported Setting: urban and suburban long‐term care facilities Country: USA |
|
| Interventions |
Intervention arm: Serial Trial Intervention (STI) is an innovative clinical protocol designed to address the problems of pain and other unmet needs in people with advanced dementia residing in nursing homes. The protocol includes both non‐pharmacological treatments and analgesics. The STI allows a standardised treatment to be customised to the individual’s specific need. Duration of the intervention: not explicitly reported, presumably 4 weeks. Post‐testing occurred in the second and fourth weeks following initiation of the daily log for each subject. Details of the intervention: see TIDieR checklist for full details of intervention (Appendix 2) Control arm: The control nurse‐training curricula (7 hours training by APN) was established following conversations with multiple in‐service educators and directors of nursing regarding standard approaches to educating nurses. Nurses in the control group were taught common misconceptions about ageing, the physical effects of ageing, reversible and irreversible causes of dementia, stages of Alzheimer’s disease and various approaches to treating behaviours and physical conditions associated with dementia. Videotapes were shown on the management of common behaviours associated with dementia. Nurses in both groups were trained to complete the daily logs in which they recorded behaviours, assessments and treatments for 1 month for each subject. EPOC category: co‐ordination of care (subcategory: Care pathways) Type of care: primary and secondary (dementia) care |
|
| Outcomes |
Time points: baseline, week 2, week 4 Primary outcomes: process variables (scope of physical assessment, scope of affective assessment, scope of non‐pharmacological and pharmacological treatment, and nurse persistence to intervene) – daily logs were cross‐checked with chart review; discomfort measured using Discomfort‐Dementia of the Alzheimer’s Type (Discomfort‐DAT; 9‐item visual analogue scale requiring 5 minutes of observation; scores range from 0 to 900, higher score = more discomfort) and BEHAVE‐Alzheimer’s Disease (AD) scales (14 items in the short form are rated by a caregiver on a 3‐point scale, with higher scores indicating more severe behavioural symptoms), mortality (not stated as an outcome, extracted from descriptive statistics) Secondary outcomes: none Loss of clusters and individuals: no clusters appeared to have been lost. "Of the 127 subjects who were actively enrolled in the treatment or control conditions, 13 did not complete the study (death = 9; transfers = 4), leaving a final sample of 114 (57 in each group)." Adjusted for clustering for each outcome: no Method of cluster adjustment for each outcome: n/a ICC reported for each outcome: n/a |
|
| Notes |
Outcomes used in this review:
Contact with author: no Unit of analysis error: yes Ethical approval and informed consent obtained: yes Funding source: This research was funded by the National Institute of Nursing Research (1RO1 NR07765‐01A1). Declarations of interest: none declared or detected Additional outcome data provided from author: no Trial registration: not registered Other: trial has strong focus on staff education (exclusion criteria). Considered eligible for this review as model of care included elements of care co‐ordination. |
|
| Risk of bias | ||
| Bias | Authors' judgement | Support for judgement |
| Random sequence generation (selection bias) | Low risk | “Facilities were stratified based on size, for‐profit/not‐for‐profit status, geographic location, and percentage of residents receiving Medicaid benefits and then randomly assigned using coin toss to treatment or control conditions.” |
| Allocation concealment (selection bias) | Low risk | Allocation was done for all clusters at once, so allocation concealment is unlikely to be a source of bias. |
| Blinding of participants and personnel (performance bias) Outcomes reported in summary of findings table | Low risk | Administrators, staff nurses, resident subjects and research assistant data collectors were not told their designation as a treatment or control site. Interviews conducted at the end of data collection at each site supported that blinding was maintained at all sites. |
| Blinding of outcome assessment (detection bias) Outcomes reported in summary of findings table | Low risk | Administrators, staff nurses, resident subjects and research assistant data collectors were not told their designation as a treatment or control site. Interviews conducted at the end of data collection at each site supported that blinding was maintained at all sites. |
| Incomplete outcome data (attrition bias) All outcomes | Unclear risk | Loss to follow‐up reported for the whole study, not per group. “Of the 127 subjects who were actively enrolled in the treatment or control conditions, 13 did not complete the study (death = 9; transfers = 4)”. Discussion: “Limitations of the study include convenience sampling and a potential differential dropout of subjects”. |
| Selective reporting (reporting bias) | Unclear risk | Protocol/trial registration are not available, so it is unclear whether all outcomes are reported. |
| Other bias | High risk | Recruitment bias: LOW ‐ participants were recruited after randomisation of facilities; however, administrators, staff nurses, resident subjects and research assistant data collectors were not told their designation as a treatment or control site. Interviews conducted at the end of data collection at each site supported that blinding was maintained at all sites. Baseline imbalance: LOW ‐ no differences between control and intervention patients. Protection against contamination: LOW ‐ unlikely to be biased due to contamination/‘herd effects’ as the delivery of the intervention occurred as per RACF policy/practice and was not subject to participant choice or compliance. Incorrect analysis: HIGH ‐ analyses not adjusted for clustered study design. |
Leontjevas 2013.
| Study characteristics | ||
| Methods |
Aim of the study: to establish the effectiveness of a structural approach to management of depression in nursing home residents Study design: stepped‐wedge cRCT Unit of randomisation: nursing home dementia and somatic units Mean cluster size: mean (SD) 27.6 (9.6) residents per unit Unit of analyses: nursing home units Sample size calculation: With an α of 0,05, a power of 0.8, and an intracluster correlation coefficient of 0.1, the authors calculated that they needed 16 clusters for each unit type in a stepped‐wedge trial to allow multilevel analyses of depression prevalence. The authors calculated the sample size with the method described by Hussey and Hughes. They assumed that there would be 25 residents per somatic unit and 20 residents per dementia unit; depression prevalence of 22% and 30%; remission in 40% and 35% of residents; and 20% and negligible attrition. |
|
| Participants |
Participants: residents of dementia and somatic units Intervention group: stepped‐wedge design, 793 residents enrolled in total Control group: stepped‐wedge design, 793 residents enrolled in total Age: 33 clusters entered the intervention in 5 groups. Mean (SD) group 1/2/3/4/5: 84.1 (1.4)/78.0 (8.6)/81.4 (2.5)/80.7 (3.8)/78.0 (10.7), total group 80.5 (6.5) (flowchart reports 32 units: "One dementia unit with 15 residents was enrolled in group 5 after baseline; data for these residents at time of unit inclusion is reported as at baseline") Sex: 33 clusters entered the intervention in 5 groups. Proportion of females group 1/2/3/4/5: 70.6%/67.0%/65.9%/64.8%/71.7%, total group (68.2%) Comorbidities: 597 (75%) residents had morbidity documented by nursing home physician at last follow‐up Setting: dementia and somatic units of nursing homes Country: the Netherlands |
|
| Interventions |
Intervention arm: Act in Case of Depression (AiD) Multidisciplinary care programme Involves nursing staff, activity therapists, psychologists and physicians. The programme has 3 components: structured assessment with 2‐step screening and a diagnostic procedure; multidisciplinary treatment; and monitoring of treatment effects. AiD prescribes pathways for collaborative treatment, for which several treatment protocols can be used. Nursing home staff could use other evidence‐based protocols when deemed necessary, but were requested to follow the pathways for collaborative treatment including psychosocial interventions. Depression assessment contains 3 elements:
For depression treatment, a collaborative approach is prescribed. Although the NH professionals can diverge from the AiD guidelines for a specific therapy, they should provide psychosocial interventions and consider a pharmacological treatment in accordance to the pathways. The AiD treatment pathways prescribe the use of three treatment modules by the multidisciplinary team:
Treatment is evaluated in multidisciplinary meetings of physician, psychologist and nursing staff. At baseline, the programme had not been implemented in any groups. The programme was subsequently implemented directly after measurements at the assigned time point for each group. Duration of the intervention: not explicitly stated. Presumably 4 to 20 months depending on the time of entry into the study (source: email communication from authors) Details of the intervention: see TIDieR checklist for full details of intervention (Appendix 2) Control arm: When the units were not receiving the intervention, no specific information about AiD was provided to nursing home staff and residents. No structural approach to depression management was used: depression was assessed after indications of possible depression were reported by nursing staff, a resident, or any other informant; teams did not use multidisciplinary pathways for depression treatment, which was provided ad hoc and was mainly in the form of drugs. EPOC category: co‐ordination of care (subcategory: Teams) Type of care: primary and secondary care |
|
| Outcomes |
Time points: 4, 8, 12, 16, 20 months Primary outcomes: depression prevalence in units (proportion of residents per unit with a score of more than 7 on the proxy‐based Cornell Scale for Depression in Dementia (CSDD)) Secondary outcomes: CSDD severe depression (CSDD score > 11), GDS8 depression (GDS8 score > 2), GDS8 severe depression (GDS8 score > 4), CSDD and GDS8 scores, Quality of life (visual analogue thermometer scale of the EuroQoL‐5 Dimensions where 0 = worst health state and 100 = best health state).Protocol states that economic evaluation will be carried out along the trial (incremental cost‐effectiveness ratios (ICERs) for prevalence of depression and quality of life). Loss of clusters and individuals: mean proportion (SD) of residents in somatic/dementia units: 42% (17%)/46% (11%) Adjusted for clustering for each outcome: yes Method of cluster adjustment for each outcome: random‐effects models (residents nested within the units) ICC reported for each outcome: for primary endpoint CSDD depression |
|
| Notes |
Outcomes used in this review: quality of life measured across all time points (reported as effect size of intervention vs control) Ethical approval and informed consent obtained: yes Unit of analysis error: no Funding source: The Netherlands Organisation for Health Research and Development Declarations of interest: none declared or detected Contact with author: yes Additional outcome data provided from author: no Authors clarified details of measurement of quality of life outcome and interpretation of the results. Authors reported that results of economic evaluation were provided to the sponsor but not published ("we did not find significant differences between the intervention and the control conditions when nursing home units were used as the unit of the cost evaluation. However, it is important to consider that we preplanned multilevel analyses accounting for clustering and repeated measures in residents. This was not possible in our study as we could not match different costs to specific residents. We also had many missing data and used several imputation algorithms. The results were not published but reported to the main sponsor"). Authors further provided details concerning allocation concealment Trial registration: This trial is registered with the Netherlands National Trial Register, number NTR1477. Other: Trial has a strong focus on staff education and use of standard protocols. Considered eligible for this review as model of care included elements of care co‐ordination. |
|
| Risk of bias | ||
| Bias | Authors' judgement | Support for judgement |
| Random sequence generation (selection bias) | Low risk | Researcher “(not involved in recruitment) randomly allocated units to one of five groups with computer‐generated random numbers.” |
| Allocation concealment (selection bias) | Low risk | Allocation was done for all clusters (NH units) at once, so allocation concealment is unlikely to be a source of bias (additional information provided by the authors). |
| Blinding of participants and personnel (performance bias) Outcomes reported in summary of findings table | High risk | “Residents did not know when the intervention was being implemented or what the programme elements were.” Staff were not blinded due to the nature of the intervention. This could have biased the outcome included in this review (i.e. health‐related quality of life). |
| Blinding of outcome assessment (detection bias) Outcomes reported in summary of findings table | Low risk | Both residents and interviewers who administered outcome questionnaires were blinded. |
| Incomplete outcome data (attrition bias) All outcomes | Low risk | Number enrolled per group (in total, 5 groups of 33 units in this stepped‐wedge trial) and dropouts are clearly reported. There were no substantial differences in dropout between the 5 groups. |
| Selective reporting (reporting bias) | Low risk | Results for economic evaluation not reported. Secondary outcome “Percentage accuracy of depression‐detection in usual care” not reported. Email correspondence with the author: "Economic evaluation: We did not find significant differences between the intervention and the control conditions when nursing home units were used as the unit of the cost evaluation. However, it is important to consider that we preplanned multilevel analyses accounting for clustering and repeated measures in residents. This was not possible in our study as we could not match different costs to specific residents. We also had many missing data and used several imputation algorithms. The results were not published but reported to the main sponsor." "Percentage accuracy of detection: We did not calculate the percentage accuracy as we did not get sufficient data in both conditions." |
| Other bias | Low risk | Recruitment bias: LOW – residents were not aware of treatment allocation. Baseline imbalance: LOW – no major imbalances at baseline (in total, 5 groups of 33 units in total in this stepped‐wedge trial). Protection against contamination: LOW – units in the same nursing home were allocated in the same group to avoid contamination. Delivery of the intervention occurred as per RACF policy/practice and was not subject to participant choice or compliance. Incorrect analysis: LOW – study design is accounted for in the analyses. No other sources of bias detected. |
Lichtwarck 2018.
| Study characteristics | ||
| Methods |
Aim of the study: to improve the assessment and treatment of agitation in persons with dementia by examining the effect and implementation of the targeted interdisciplinary model for evaluation and treatment of neuropsychiatric symptoms (TIME) intervention Study design: cRCT Unit of randomisation: nursing homes Mean cluster size: 6.9 (229 patients/33 nursing homes) Unit of analyses: individual resident Sample size calculation: A power calculation was performed based on the following assumptions. A previous noncontrolled pilot study of TIME showed that the intervention reduced the NPI‐NH agitation item score by an average of 2.8 (standard deviation (SD): 3.1). The authors assumed that the education‐only intervention would have some effect on the control group but less than that in the intervention group. They then assumed a mean difference between the groups would be 1.5, as measured by the NPI‐NH agitation item. They assumed the SD would be 3.1. Based on this, they estimated that 65 participants were needed in each group to observe a statistically significant difference with a power of 80% and a significance level of 5%. Because of the possible cluster effect within nursing homes, they assumed an intraclass correlation coefficient of 0.05. Adjusted power calculations suggested that at least 78 participants were needed in each of the intervention and control groups, totalling 156. According to the pilot study, approximately 12% of patients in nursing homes had dementia and the necessary NPI‐NH agitation item score, the main criterion for inclusion. Previous studies have shown that the authors could anticipate a 30% loss to follow‐up per year (resulting from, e.g., mortality, relocation or withdrawal from the study) or 7.5% in 3 months. With these two assumptions, they aimed to include a total of at least 168 patients, implying that approximately 1400 nursing home patients would be needed for screening against their inclusion criteria. |
|
| Participants |
Participants: residents of nursing homes with probable dementia (score on Clinical Dementia Rating scale ≥ 1), with a moderate or high degree of agitation (NPI‐NH ≥ 6), long‐term residents with who have been residing in NH for a minimum of 2 weeks Intervention group: n = 104 (17 clusters) Control group: n = 125 (16 clusters) Age: mean (SD) intervention/control 82.2 (9.8)/84.1 (9.0) Sex: proportion females intervention/control 61.5%/59.2% Comorbidities: not reported Setting: nursing homes Country: Norway |
|
| Interventions |
Intervention arm: Targeted Interdisciplinary Model for Evaluation and Treatment of Neuropsychiatric Symptoms (TIME) Intervention with TIME consists of three overlapping phases: a registration and assessment phase (duration 1 days to 4 weeks, depending on nature and burden of the symptoms); a guided reflection phase, including one or more case conferences, with the goal to create a mutual understanding of the actual NPS of the patient and to tailor a detailed treatment plan that will be tested in the next weeks (duration of case conference is 1.5 hours); and an action and evaluation phase. These phases were adapted from and based on problem‐solving methods used in CBT and coincide with reviews describing the “state of the art” for management of neuropsychiatric symptoms. The actual assessment and treatment programme for individual patients is described in TIME manual (step‐by‐step guide to implementing the model). The staff in the intervention nursing homes were offered an additional training programme that included a 3‐hour lecture and role play following the steps in the TIME manual. In each ward of each nursing home, 3 nurses who had the responsibility for implementing TIME were given 3 additional hours of lecture. One specialist registered nurse from the education and training team attended and supervised the TIME administrators’ first case conference on their first patient in their nursing home. Duration of the intervention: the time frame for the complete intervention with TIME varied from 1 to 2 weeks to up to 8 weeks depending on the severity and complexity of the NPS to be approached and the resources available in the NH. Details of the intervention: see TIDieR checklist for full details of intervention (Appendix 2) Control arm: brief education‐only intervention.The staff in both the intervention and control nursing homes were offered a 2‐hour lecture covering dementia and NPS. In addition, 3 nurses in each ward in both the control and intervention homes completed a 3‐hour lecture (before randomisation) about the trial and the clinical instruments used to assess patients during the trial. EPOC category: co‐ordination of care (subcategory: Case management) Type of care: primary and secondary (dementia) care |
|
| Outcomes |
Time points: 8 and 12 weeks Primary outcomes: difference in the change between the intervention and control groups in agitation/aggression at 8 weeks from baseline, as measured by the single item agitation/aggression of the NPI‐NH Secondary outcomes: difference in change between the two groups in agitation/aggression from baseline to 12 weeks, the changes from baseline to 8 and to 12 weeks in all other single NPI‐NH items, NPI‐10 sum, NPI‐subsyndromal agitation score, NPI‐subsyndromal psychosis score, NPI‐ subsyndromal affective symptoms and NPI‐Sum of caregiver disruptiveness. Cohen‐Mansfield Agitation Inventory (CMAI), the Cornell Scale for Depression in Dementia, the Quality of Life in Late‐stage Dementia Scale, use of psychotropic and analgesic medications given regularly (coded and grouped according to the Anatomical Therapeutic Chemical index) and mortality. Loss of clusters and individuals: individuals (clusters) intervention/control at 8 weeks: 12 (1)/4 (0) and at 12 weeks: 18 (1)/9 (0) Adjusted for clustering for each outcome: yes Method of cluster adjustment for each outcome: random‐effects regression models ICC reported for each outcome: yes |
|
| Notes |
Outcomes used in this review:
Unit of analysis error: no Ethical approval and informed consent obtained: yes Funding source: grant from the Innlandet Hospital Trust (study number 150 333) Declarations of interest: none declared or detected Contact with author: no Additional outcome data provided from author: no Trial registration: NCT02655003 |
|
| Risk of bias | ||
| Bias | Authors' judgement | Support for judgement |
| Random sequence generation (selection bias) | Unclear risk | Sequence generation method was not described. |
| Allocation concealment (selection bias) | Low risk | “A researcher performed the randomization procedure independently of the project management team and the nursing homes. The project management team then provided the nursing homes with the randomization and allocation results immediately after this procedure.” |
| Blinding of participants and personnel (performance bias) Outcomes reported in summary of findings table | High risk | Personnel were not blinded due to the nature of the intervention. It is not clearly reported whether participants were blinded (authors refer to the trial as a single‐blinded trial). Lack of blinding could lead to bias in at least one of the secondary outcomes (i.e. quality of life). |
| Blinding of outcome assessment (detection bias) Outcomes reported in summary of findings table | Low risk | "The patients’ … data on primary and secondary outcomes will be collected by project nurses not affiliatied with the nursing homes… The assessors will be blinded to the randomisation of the nursing homes.” |
| Incomplete outcome data (attrition bias) All outcomes | Low risk | Reasons for withdrawal are reported clearly and not dissimilar between arms. |
| Selective reporting (reporting bias) | Low risk | All outcomes stated in the protocol and trial registration form are reported. |
| Other bias | Unclear risk | Recruitment bias: UNCLEAR – patients were assessed and recruited after the randomisation of the clusters. Assuming patients were blinded to the intervention (not explicitly described), it is not clear whether results could be subject to recruitment bias. Baseline imbalance: LOW – no substantial differences between the intervention and control nursing home that could introduce bias into results. Protection against contamination: LOW ‐ unlikely to be biased due to contamination/‘herd effects’ as the delivery of the intervention occurred as per RACF policy/practice and was not subject to participant choice or compliance. Incorrect analysis: LOW ‐ analyses appropriated accounted for study design. Other bias: LOW |
Lin 2010.
| Study characteristics | ||
| Methods |
Aim of the study: to improve nutritional status in the elderly living in long‐term care facilities Study design: cRCT (authors described the study design as RCT using "randomized block design by number of facilities"; however, patients from 8 facilities were randomised with patients from 4 facilities randomised to intervention and patients from 4 facilities randomised to control, which according to review authors correspondes to a cluster‐RCT). Authors provided the following additional clarification: "In our study, the sampling unit was facility. All facilities were randomly allocated to treatment or control groups. Allocation sequences were determined using block randomization with a block size of 4. Therefore, we used randomized block design." Unit of randomisation: long‐term care facility Mean cluster size: 47 residents Unit of analyses: individual resident Sample size calculation: not reported |
|
| Participants |
Participants: residents 65 years of age and older living in 8 different long‐term care facilities in Taichung, Taiwan. All older residents who agreed to participate in the study were recruited, and 374 subjects were selected to join this study during 2002‐2003. Intervention group: N = 125 in 4 long‐term care facilities Control group: N = 249 in 4 long‐term care facilities Age: mean (SD) intervention/control 78.3 (7.2)/79.0 (7.2) Sex: proportion females intervention/control 58%/57% Comorbidities: not reported Setting: long‐term care facility Country: Taiwan |
|
| Interventions |
Intervention arm:hospital‐based multidisciplinary approach to improve nutritional status A case management model, with a hospital‐based, multidisciplinary care‐team, including a medical doctor, nurse, dietitian and pharmacist, was provided to each participant. Team members visited residents every 2 weeks in each group. In the intervention group, a dietitian gave each resident their dietary suggestions, with follow‐up every 2 weeks. Three‐day dietary records were used to evaluate dietary status and were sent to team members for further nutritional plans. Duration of the intervention: 6 months Details of the intervention: see TIDieR checklist for full details of intervention (Appendix 2) Control arm: usual care, including a medical doctor, nurse and pharmacist, provided to each participant. Team members visited residents every 2 weeks in each group. Three‐day dietary records were used to evaluate dietary status and were sent to team members for further nutritional plans. EPOC category: co‐ordination of care (subcategory: Teams) Type of care: primary care |
|
| Outcomes |
Time points: 6 months Primary outcomes:
Secondary outcomes:
Loss of clusters and individuals: 42/125 (33%) intervention group participants and 65/249 (26%) control group participants withdrew from the study, of which 12/14 (control/intervention) died during the study Adjusted for clustering for each outcome: n/a Method of cluster adjustment for each outcome: n/a ICC reported for each outcome: n/a |
|
| Notes |
Outcomes used in this review:
Unit of analysis error: no Ethical approval and informed consent obtained: yes Funding source: This study was financially supported by grants from the Department of Health, Executive Yuan, Taiwan (DOH92‐TD‐1024), National Science Council of Taiwan (NSC 93‐2314‐B‐039‐031), and China Medical University Hospital (DMR‐93‐021, DMR‐93‐078, and DMR96‐061). Declarations of interest: none declared or detected Contact with author: yes Additional outcome data provided from author: no Trial registration: not registered |
|
| Risk of bias | ||
| Bias | Authors' judgement | Support for judgement |
| Random sequence generation (selection bias) | Unclear risk | The subjects were divided into two groups (intervention and control) using a randomised block design. Random sequence generation method is not described. |
| Allocation concealment (selection bias) | Unclear risk | Allocation process was not described. |
| Blinding of participants and personnel (performance bias) Outcomes reported in summary of findings table | Low risk | Participants and nursing home staff could not be blinded to the intervention due to the nature of the intervention. However, lack of blinding may not have affected mortality, the only study outcome included in the review. |
| Blinding of outcome assessment (detection bias) Outcomes reported in summary of findings table | Unclear risk | It is unclear if the trained staff conducting the anthropometric measurements were blinded to the treatment allocation of the participants. |
| Incomplete outcome data (attrition bias) All outcomes | Low risk | Similarly, a large number of withdrawals from both groups (42/125 (33%) and 65/249 (26%)). Reasons for withdrawal were similar in both groups (death, transfer to other facility, patient request). |
| Selective reporting (reporting bias) | Unclear risk | Protocol/trial registration are not available, so it is unclear whether all outcomes are reported. |
| Other bias | Low risk | Recruitment bias: LOW Baseline imbalance: LOW ‐ table 1 reports no significant differences between the groups (except fasting glucose P = 0.049). Protection against contamination: LOW ‐ unlikely to be biased due to contamination/‘herd effects’ as the delivery of the intervention occurred as per RACF policy/practice and was not subject to participant choice or compliance. Incorrect analyses: HIGH ‐ analyses are not adjusted for clustering. The study authors define the design as a RCT, however from the description it appears that the study was a cluster‐RCT (see note in 'Characteristics of included studies' table). No other sources of bias detected. |
Lin 2014.
| Study characteristics | ||
| Methods |
Aim of the study: to evaluate the effect of a bidirectional and multi‐user telerehabilitation system on balance and satisfaction in patients with chronic stroke living in long‐term care facilities Study design: RCT Unit of randomisation: individual resident Mean cluster size: n/a Unit of analyses: individual resident Sample size calculation: "Given that this was a pilot study, the sample size was not calculated" (note: significance hypothesis testing performed and reported) |
|
| Participants |
Participants: patients with chronic stroke living in long‐term care facilities Intervention group: n = 12 Control group: n = 12 Age: mean (SD) intervention/control 74.6 (2.3)/75.6 (3.4) Sex: proportion females intervention/control 17%/42% Comorbidities: all participants had a history of cerebral vascular accident (including first and recurrent stroke) Setting: long‐term care facility Country: Taiwan |
|
| Interventions |
Intervention arm: Telerehabilitation The treatment programme for both groups included 3 sessions of training per week for 4 weeks, with the duration of approximately 50 min for each session. The therapist instructed standing balance training from easy to difficult, depending on the severity and recovery of the participants. The tele‐balance training focused on 10 min of standing exercise according to 3D animation exercise videos which were Maya/3D Max systems, and about 10 min of 3D interactive games with finger touching the touch screen in standing posture. The therapist could monitor the sequence and duration with light to moderate exercise intensity (Borg scale 12 to 14). The therapist could instruct both participants in a group to do similar programmes as much as possible and allow them to play ball together during the balance training. Duration of the intervention: 4 weeks Details of the intervention: see TIDieR checklist for full details of intervention (Appendix 2) Control arm: The therapist conducted conventional balance training programmes following a simple to complex principle. The small ball and peg bars are used for hand manipulation during sitting and standing balance training. EPOC category: information and communication technology (subcategory: Telemedicine) Type of care: rehabilitation care after stroke |
|
| Outcomes |
Time points: 4 weeks after the start of the intervention Primary outcomes: the Berg Balance Scale (BBS), Barthel Index (BI), satisfaction of the participants (system environment satisfaction, perceived satisfaction system, perceived usefulness, perceived ease of use, attitude toward using) Secondary outcomes: none Loss of clusters and individuals: 1 dropout in intervention group Adjusted for clustering for each outcome: n/a Method of cluster adjustment for each outcome: n/a ICC reported for each outcome: n/a |
|
| Notes |
Outcomes used in this review: residents’ satisfaction with the health care received, measured at 4 weeks Unit of analysis error: no Ethical approval and informed consent obtained: yes Funding source: the Ministry of Science and Technology, Taiwan (Grant No. 99‐2218‐E‐002‐004) Declarations of interest: none declared or detected Contact with author: no Additional outcome data provided from author: no Trial registration: not reported |
|
| Risk of bias | ||
| Bias | Authors' judgement | Support for judgement |
| Random sequence generation (selection bias) | Low risk | Blocked randomisation using random computer‐generated numbers. |
| Allocation concealment (selection bias) | Unclear risk | Allocation concealment is not described. |
| Blinding of participants and personnel (performance bias) Outcomes reported in summary of findings table | High risk | Participants and personnel were not blinded, and some outcomes would likely be influenced by the lack of blinding (i.e. residents' satisfaction). |
| Blinding of outcome assessment (detection bias) Outcomes reported in summary of findings table | High risk | Outcome assessors were not blinded and it is likely that lack of blinding would influence the assessment of the outcomes (i.e. residents' satisfaction). |
| Incomplete outcome data (attrition bias) All outcomes | Low risk | Dropout and attrition are clearly described and are not expected to introduce bias (one dropout in intervention group). |
| Selective reporting (reporting bias) | Unclear risk | Authors report that protocol was published on ClinicalTrials.gov; however, this could not be found (number of registration not provided by the authors; authors did not respond to request). |
| Other bias | Unclear risk | Other bias: multiple typos and unclear reporting. |
Loeb 2005.
| Study characteristics | ||
| Methods |
Aim of the study: to assess the effectiveness of a multifaceted intervention (education, written material, real‐time reminders and outreach visits), targeted at nurses and physicians, to introduce and increase the uptake of diagnostic and treatment algorithms for antimicrobial prescriptions for suspected urinary tract infections in nursing home residents Study design: cRCT Unit of randomisation: nursing home Mean cluster size: 12 nursing homes allocated to a multifaceted intervention (2156 residents); 12 allocated to usual care (2061 residents) Unit of analyses: nursing home Sample size calculation: Needed 142 prescriptions for antimicrobials for suspected urinary tract infection (71 in each arm) to have 80% power to detect a 20% reduction in prescriptions at an alpha of 0.05, assuming a 30% baseline rate of prescriptions. To adjust for the effect of within cluster dependency, authors calculated the intracluster correlation coefficient (variance for urinary antimicrobial prescriptions between homes divided by the sum of variance between and within the homes) and found this to be 0.04 using data from an Ontario long‐term care facility study. The variance inflation factor was 11, such that the authors required 1562 prescriptions for suspected urinary tract infection. Since these represent about 30% of all antimicrobial prescriptions, the sample size was increased to 5206 prescriptions to assess whether a reduction in prescriptions for antimicrobials for suspected urinary tract infection could also reduce overall use of antimicrobials. On the basis of prescribing rates from a large cohort study, authors estimated that they would need to follow 20 (10 pairs) nursing homes for 12 months. Since matching in the sample size calculation was not accounted for, which would improve efficiency, these figures were conservative. An additional 4 homes were recruited to maintain the target sample size in case of withdrawals from the study. |
|
| Participants |
Participants: All residents in study nursing homes were eligible. Free‐standing, community‐based nursing homes with 100 or more residents and no stated policy for diagnosis or treatment of urinary tract infections were eligible for participation. Eligible nursing homes had to agree to refrain from introducing new management strategies for antimicrobial use or clinical pathways for urinary tract infection during the 12 months of the study. Nursing homes directly associated with tertiary care centres were excluded. Intervention group: 12 nursing homes (2156 residents; occupied beds median 160, range 101 to 367; physicians median 7, range 1 to 17; registered nurses median 14, range 6 to 42; nursing assistants median 29, range 14 to 89) Control group: 12 nursing homes (2061 residents; occupied beds median 155, range 97 to 350; physicians median 8, range 1 to 36; registered nurses median 12, range 8 to 28; nursing assistants median 28, range 13 to 59) Age: not reported Sex: not reported Comorbidities: median (range) number of residents with indwelling urinary catheters intervention/control 4 (0 to 17)/2 (1 to 12) Setting: nursing home Country: Canada and USA |
|
| Interventions |
Intervention arm:Diagnostic and treatment algorithm for urinary tract infections using a multifaceted approach Nurses and physicians of nursing homes were introduced to the diagnostic (for ordering urine cultures) and therapeutic (for prescribing antimicrobials) algorithms using a multifaceted approach including interactive educational sessions, written material, real‐time reminders and outreach visits. Duration of the intervention: 12 months Details of the intervention: see TIDieR checklist for full details of intervention (Appendix 2) Control arm: Nurses and physicians in these nursing homes were notified about the study and were informed about how data were going to be collected. No other interventions were applied to these homes. EPOC category: co‐ordination of care (subcategory: Care pathways) Type of care: primary care |
|
| Outcomes |
Time points: 12 months Primary outcomes: number of prescriptions for antimicrobials Secondary outcomes: number of urine cultures ordered, admissions to hospital, mortality Loss of clusters and individuals: 2 nursing homes (1 from each arm) were lost to follow‐up; their corresponding pairs were withdrawn from the study Adjusted for clustering for each outcome: n/a, nursing home (total or per study month) was unit of analysis Method of cluster adjustment for each outcome: nursing home was unit of analyses, sample size was calculated to account for the effect of within cluster‐dependency ICC reported for each outcome: n/a |
|
| Notes |
Outcomes used in this review:
Unit of analysis error: no Ethical approval and informed consent obtained: yes Funding source: Agency for Healthcare Research and Quality as part of the Translating Research into Practise initiative Contact with author: no Additional outcome data provided from author: no Trial registration: not registered |
|
| Risk of bias | ||
| Bias | Authors' judgement | Support for judgement |
| Random sequence generation (selection bias) | Low risk | A statistician independent of the study team used a random numbers table to assign the intervention to nursing homes (odd or even) corresponding to the number selected. |
| Allocation concealment (selection bias) | Low risk | “allocation was concealed”. Further details not provided. |
| Blinding of participants and personnel (performance bias) Outcomes reported in summary of findings table | High risk | Nursing home staff could not be blinded to the intervention due to the nature of the intervention. It is unclear whether participants were blinded. Lack of blinding could have biased at least one of the outcomes included in this review (i.e. any hospital admissions). Pharmacies affiliated with the study (the source of confirmation of antimicrobial prescriptions) were blinded. |
| Blinding of outcome assessment (detection bias) Outcomes reported in summary of findings table | Unclear risk | Each facility’s infection control practitioner used standardised data collection forms to collect data on antimicrobials prescribed and urine cultures sent. It is unclear whether the infection control practitioner was blinded. To verify the accuracy of data recorded at the nursing home, the authors carried out on‐site audits of the chart records of the nursing home residents and obtained records from the pharmacies of antimicrobials prescribed (results not reported). |
| Incomplete outcome data (attrition bias) All outcomes | Low risk | One nursing home from each arm dropped out of the study for similar reason (insufficient nursing staff). Matching pair removed as well. One nursing home did not provide data from the second half of the study; analyses were based on the first 6 months of data collected from this home, using the same period in the matched control home. |
| Selective reporting (reporting bias) | Unclear risk | Protocol/trial registration are not available, so it is unclear whether all outcomes are reported. |
| Other bias | Low risk | Recruitment bias: LOW – nursing homes were allocated to intervention and all residents were eligible for inclusion. Baseline imbalance: LOW – baseline characteristics of nursing homes similar. Protection against contamination: LOW ‐ unlikely to be biased due to contamination/‘herd effects’ as the delivery of the intervention occurred as per RACF policy/practice and was not subject to participant choice or compliance. Incorrect analysis: LOW ‐ nursing home was the unit of analyses; analyses were weighted by the size of the nursing home. |
Loeb 2006.
| Study characteristics | ||
| Methods |
Aim of the study: to assess whether using a clinical pathway for on‐site treatment of pneumonia and other lower respiratory tract infections in nursing homes could reduce hospital admissions, related complications and costs Study design: cRCT Unit of randomisation: nursing home Mean cluster size: 33 residents (661 residents from 20 nursing homes) Unit of analyses: individual resident Sample size calculation: The method of Hsieh was used to estimate the number of clusters (nursing homes) needed. Based on a mean (SD) number of admission days of 4.5 (3.6) per resident enrolled, within‐cluster variance of 12.9 days and between‐cluster variance of 8.4 days (all derived from Ontario long‐term care facility data) to detect a relative reduction in mean hospital days per resident of 40% (1.8 days), assuming an annual average of 32 pneumonia episodes per nursing home, for a 1‐sided significance level of 0.05 and a power of 80%, 20 nursing homes would be required with an enrolment of 640 residents. Authors increased the sample size to 22 nursing homes to allow for possible dropouts. |
|
| Participants |
Participants: Residents aged 65 years or older were eligible if they met a standardised definition of lower respiratory tract infection, which consisted of having at least 2 of the following: new or increased cough, new or increased sputum production, temperature of more than 38 °C, pleuritic chest pain or new or increased findings on chest examination. Intervention group: n = 327 (314 included in the analysis) Control group: n = 353 (427 included in the analysis) Age: mean (SD) intervention/control 85.1 (7.7)/84.9 (7.5) Sex: proportion females intervention/control 70%/70% Comorbidities: proportion intervention/control cancer 21%/16%, liver disease 2%/2%, heart failure 20%/20%, cerebrovascular disease 26%/31%, renal disease 6%/8% Setting: nursing home Country: Canada |
|
| Interventions |
Intervention arm: Clinical Pathway to assess whether patient needs to be transferred to hospital Clinical Pathway. Residents were assessed clinically by study nurses according to the study protocol. Decision to treat in RACF or transfer to hospital was taken following the standardised procedures followed by study nurse. Duration of the intervention: 30 days Details of the intervention: see TIDieR checklist for full details of intervention (Appendix 2) Control arm: care for residents allocated to usual care treatment was left up to the resident’s physician (the physician and RACF staff made treatment decisions, including antimicrobial use and transfer to hospital) EPOC category: co‐ordination of care (subcategory: Care pathways) Type of care: primary care |
|
| Outcomes |
Time points: daily for the first 10 days, then twice‐weekly for up to 30 days Primary outcomes: hospital admission rates, length of hospital stay Secondary outcomes: the Minimum Data Set Health Status Index, modified Barthel Index, health‐related quality of life (the minimum Data Set Health Status Index, based on the components of the Minimum Data Set version 2), functional status (Barthel Index), days to normalisation of vital signs, skin and soft tissue infections, catheter‐related urinary tract infections, adverse reactions to antimicrobials, health care utilisation and costs (perspective of a third‐party payer was taken; assessment costs, additional diagnostics and treatment resources, hospital admissions and ED visits, intensive care and medical wards care, resident transport via ambulance, oxygen therapy, hydration therapy, diagnostic imaging, and professional fees were included) Loss of clusters and individuals: 2 nursing homes withdrew after randomisation but before resident enrolment (management decision), dropouts intervention/control: 9/5. One nursing home in the usual care group did not have any patients meeting the eligibility criteria. Adjusted for clustering for each outcome: yes Method of cluster adjustment for each outcome: t‐tests weighted by inverse variance ICC reported for each outcome: no |
|
| Notes |
Outcomes used in this review:
Unit of analysis error: no Ethical approval and informed consent obtained: yes Funding source: a Canadian Institutes of Health Research Interdisciplinary Health Research Team grant and by the Physicians’ Services Incorporated Foundation of Ontario. Dr Loeb was supported by a Canadian Institutes of Health Research New Investigator Award, a Premier’s Research Excellence Award (Ontario Ministry of Health and Long‐term Care), and an Arthur Bond Scholarship. Contact with author: no Additional outcome data provided from author: no Trial registration: NCT00157612 |
|
| Risk of bias | ||
| Bias | Authors' judgement | Support for judgement |
| Random sequence generation (selection bias) | Low risk | Nursing homes were randomised "using a random numbers table." |
| Allocation concealment (selection bias) | Low risk | "Nursing homes were paired by the number of occupied beds to help ensure similar rates of pneumonia and other lower respiratory tract infections between study groups. One member of each pair was randomized to a clinical pathway and the other member to usual care by a statistician independent of the study team." "Thirty‐six potentially eligible nursing homes were contacted and 22 were randomized. Two of the 22 nursing homes withdrew after randomization but before resident enrollment based on a decision by the nursing home management." |
| Blinding of participants and personnel (performance bias) Outcomes reported in summary of findings table | High risk | Participants and personnel were not blinded, and some outcomes would likely be influenced by the lack of blinding (i.e. ED visits, adverse effects, health‐related quality of life, resource use, any hospital admissions and length of stay). |
| Blinding of outcome assessment (detection bias) Outcomes reported in summary of findings table | Low risk | Outcome assessors were not blinded. Lack of blinding is unlikely to influence assessment of the outcomes extracted from administrative charts (including primary outcomes for this review); however, it could bias assessment of quality of life. |
| Incomplete outcome data (attrition bias) All outcomes | Low risk | Complete results for primary outcomes. Clearly outlined reasons for incomplete follow‐up in both groups. |
| Selective reporting (reporting bias) | Low risk | All outcomes from trial registration form are reported. Costs outcomes were not pre‐specified in the trial registration form. |
| Other bias | Low risk | Recruitment bias: LOW ‐ all residents of participating RACFs were included. Baseline imbalances: LOW ‐ no differences between the groups, no data on quality of life at baseline. Protection against contamination: LOW ‐ unlikely to be biased due to contamination/‘herd effects’ as the delivery of the intervention occurred as per RACF policy/practice and was not subject to participant choice or compliance. Incorrect analyses: LOW ‐ analyses accounted for study design. No other sources of bias detected. |
Man 2020.
| Study characteristics | ||
| Methods |
Aim of the study: to assess the clinical and patient‐centred effectiveness of a novel residential ocular care (ROC) model in Australian individuals residing in residential care Study design: cRCT Unit of randomisation: RACF Mean cluster size: 4.7 residents per cluster (178 individuals from 38 RACFs) Unit of analyses: individual resident Sample size calculation: Sample size calculation was based on achieving a 30% improvement in visual acuity (near and distance vision) at the 6‐month follow‐up visit in the intervention group compared with controls. The anticipated effect size was ~0.65 based on pilot work. A significance level of 0.05, with 38 participants in each arm (overall total of 76 participants), resulted in 80% power to detect a group difference. An intracluster correlation coefficient (ICC) within facility of 0.05 was assumed, which corresponded to levels found in similar work in nursing homes. The inflation factor (or design effect) was estimated using the following formula: inflation factor = 1+ (number of patients per facility (50)−1) × ICC = 3.5. To take the cluster design into account, a total sample size of 266 (76 × 3.5) was needed. However, to adjust for non‐compliance with the intervention (an estimated ~10% due to individuals seeking vision care on their own in the usual care arm, or people refusing the intervention in the Residential Ocular Care arm) and loss to follow‐up (approximately ~25% from deaths, etc.), the effective sample size was increased by a factor of 1.48 (1/0.90 × 1/0.75) resulting in an initial enrolment requirement of 395 individuals. |
|
| Participants |
Participants: visually impaired individuals living in residential care facilities Intervention group: n = 95 Control group: n = 83 Age: mean (SD) intervention/control 85.2 (7.4)/82.5 (9.7) Sex: proportion females intervention/control: 63.2%/68.7% Comorbidities: not reported Setting: RACF Country: Australia |
|
| Interventions |
Intervention arm: Residential Ocular Care (ROC) model The ROC model of eye care includes an on‐site eye examination by an optometrist with expertise in domiciliary and low vision care. Four intervention options were provided to help improve vision based on the individual participants’ eye history. These include:
For all pathways, transportation costs for initial consultations and for up to 2 follow‐up consultations (to either a public or private care provider) were funded by the study. Duration of the intervention: not explicitly defined. Initial screening was followed by one of the intervention options. Follow‐up planned at 2 and 6 months. Details of the intervention: see TIDieR checklist for full details of intervention (Appendix 2) Control arm: residents with visual impairment in the usual care group were referred for an evaluation to the eye care service associated with the facility or a practitioner of their choice EPOC category: where care is provided (subcategory: Site of service delivery) Type of care: primary (ocular) care |
|
| Outcomes |
Time points: 2 and 6 months Primary outcomes: distance presenting visual acuity (uniocular and binocular distance visual acuity (VA)) (LogMAR charts) assessed according to establish protocols. Uniocular and binocular presenting near VA will be assessed using LogMAR word reading cards, viewed at habitual working distances in the range of 25 to 40 cm. Secondary outcomes: quality of vision (QoV) scale, visual fields, colour vision, glare and contrast sensitivity, vision‐specific quality of life using the impact of vision impairment for residential care, mobility using the aged care funding instrument module 2, number of falls, depressive symptoms using the Cornell Scale for Depression in Dementia, health‐related quality of life measured using the 5‐dimension EuroQoL (EQ‐5D‐3L), direct intervention costs (payer perspective), total medical costs, mortality Loss of clusters and individuals: no loss of clusters; individuals lost to follow‐up intervention/control: 27 (28.4%)/41 (49.4%) Adjusted for clustering for each outcome: yes Method of cluster adjustment for each outcome: random‐effects regression models ICC reported for each outcome: no |
|
| Notes |
Outcomes used in this review:
Unit of analysis error: no Ethical approval and informed consent obtained: yes Funding source: the National Health and Medical Research Council grant (NHMRC #1046689) Declarations of interest: none declared or detected Contact with author: no Additional outcome data provided from author: no Trial registration: ACTRN12615000587505 Other notes: study underpowered (178 recruited, with 395 being the goal based on sample size calculations) |
|
| Risk of bias | ||
| Bias | Authors' judgement | Support for judgement |
| Random sequence generation (selection bias) | Low risk | "... an independent statistician will perform the randomization sequence generation using a computer‐generated list.’’ |
| Allocation concealment (selection bias) | Low risk | “the allocation sequence was concealed from the research study co‐ordinator enrolling and assessing participants.” Allocation was done for all clusters at once, so allocation concealment is unlikely to be source of bias. |
| Blinding of participants and personnel (performance bias) Outcomes reported in summary of findings table | High risk | Blinding not explicitly described; however, it is highly implausible that participants and personnel could be blinded due to the nature of the intervention. Lack of blinding could bias at least one of the outcomes included in the review (i.e. health‐related quality of life). Lack of blinding is unlikely to bias mortality. |
| Blinding of outcome assessment (detection bias) Outcomes reported in summary of findings table | Unclear risk | “Allocation sequence was concealed from the research study co‐ordinator enrolling and assessing participants.” It is unclear whether the study co‐ordinator remained blind throughout the study. Lack of blinding could have biased at least one of the outcomes included in the review (i.e. health‐related quality of life). Lack of blinding is unlikely to bias mortality or number of falls. |
| Incomplete outcome data (attrition bias) All outcomes | Low risk | Substantial (more than 30%) dropout. Reasons for dropout are clearly recorded and seem to be similar across groups. “a substantial proportion of individuals lost to follow‐up at 6 months (38.2%) that echoes that reported in the SEEING study, although the only difference in baseline characteristics between completers and non‐completers was older age in the latter group” |
| Selective reporting (reporting bias) | High risk | Protocol specifies a 2‐month measurement, which is not reported. Cost‐effectiveness outcomes are not reported (information provided by authors: "economic results were not published as we were missing too much cost data. We went through the patient case files, but there were still too many variables not recorded"). Trial registered retrospectively. |
| Other bias | Low risk | Recruitment bias: LOW – research assistant enrolling and assessing participants was not aware of the allocation of intervention and control groups. Baseline imbalance: LOW – no substantial imbalances at baseline; stratified cluster‐randomisation by size and region was performed to reduce possible baseline imbalances. Protection against contamination: LOW ‐ unlikely to be biased due to contamination/‘herd effects’ as the delivery of the intervention occurred as per RACF policy/practice and was not subject to participant choice or compliance. Incorrect analysis: LOW – analyses adjusted for study design. No other sources of bias detected. |
McSweeney 2012.
| Study characteristics | ||
| Methods |
Aim of the study: to determine whether multidisciplinary specialist mental health consultation was more effective than care as usual in treating the depression of aged care residents with dementia Study design: cRCT Unit of randomisation: RACF Mean cluster size: 2 residents (39 residents from 20 ACFs) Unit of analyses: individual resident Sample size calculation: not reported |
|
| Participants |
Participants: aged care residents diagnosed with depression and dementia Intervention group: n = 21 (17 included in the analysis) Control group: n = 23 (22 included in the analysis) Age: mean (SD) intervention/control 85.0 (7.1)/88.0 (6.7) Sex: proportion females intervention/control 76%/91% Comorbidities: mean (SD) diagnoses intervention/control 6.5 (2.2)/7.7 (3.4) Setting: RACF Country: Australia |
|
| Interventions |
Intervention arm: Multidisciplinary team care A psychiatrist and psychologist provided consultation regarding best‐practice management of depression to facility staff and GPs. Consultation consisted of:
Duration of the intervention: 15 weeks Details of the intervention: see TIDieR checklist for full details of intervention (Appendix 2) Control arm: Control RACFs participated in the assessment component of the study, but no advice was offered regarding the management of depression during the intervention phase. All control RACFs were offered educative seminars concerning assessment and management of depression and dementia at the conclusion of the study. EPOC category: co‐ordination of care (subcategory: Teams) Type of care: secondary care for depression |
|
| Outcomes |
Time points: outcomes were measured at 15 weeks following the start of intervention Primary outcomes: Cornell Scale for Depression in Dementia (CSDD), DSM‐IV Depression Diagnosis, facilitated by checklists of DSM‐IV criteria. Standard diagnostic tests could not be used, because the participants all had considerable cognitive impairment. The assessing clinician reviewed all potential cases with a senior team member in order to confirm the diagnosis. Secondary outcomes: Rating Anxiety in Dementia (RAID) Scale, Behavioral and Psychological Symptoms of Dementia as measured by the BEHAVE‐AD, mortality (reported in flowchart), hospitalisations (reported in flowchart) Loss of clusters and individuals: no clusters lost to follow‐up; 4 residents lost in intervention group (3 died, 1 hospitalised) and 1 resident lost in control group (died) Adjusted for clustering for each outcome: yes Method of cluster adjustment for each outcome: methods recommended by review by Ukoumunnen et al (1999). Further details not provided. ICC reported for each outcome: no |
|
| Notes |
Outcomes used in this review:
Unit of analysis error: no Ethical approval and informed consent obtained: yes Funding source: primary sponsor Monash University (Australia). Beyondblue, the national depression initiative, provided support of this research. Declarations of interest: none declared or detected Contact with author: no Additional outcome data provided from author: no Trial registration: ACTRN12610001037099, retrospectively registered |
|
| Risk of bias | ||
| Bias | Authors' judgement | Support for judgement |
| Random sequence generation (selection bias) | Low risk | "Aged care facilities were randomized by toss of coin to either the intervention or care‐as‐usual condition." |
| Allocation concealment (selection bias) | Low risk | Information from the trial registry entry states that "Allocation was not concealed". Allocation was done for all clusters at once, so allocation concealment is unlikely to be a source of bias. |
| Blinding of participants and personnel (performance bias) Outcomes reported in summary of findings table | High risk | Participants and personnel were not blinded, and some outcomes would likely be influenced by the lack of blinding (i.e. any hospital admissions). |
| Blinding of outcome assessment (detection bias) Outcomes reported in summary of findings table | Low risk | It is not described whether outcome assessors were blinded. However, it is unlikely that lack of blinding would influence assessment of the outcomes included in this review ( i.e. mortality and hospital admissions). |
| Incomplete outcome data (attrition bias) All outcomes | Low risk | Dropout and attrition are clearly described and are not expected to introduce bias. |
| Selective reporting (reporting bias) | Low risk | Study protocol retrospectively registered in ANZCTR. All outcomes in the protocol reported on in the published paper. |
| Other bias | Unclear risk | Recruitment bias: UNCLEAR ‐ it is not clear whether residents were recruited after the facilities were randomised. Baseline imbalance: UNCLEAR ‐ some differences at baseline (period of residency, with the control group residing in the aged care facility much longer than their intervention counterparts; significant differences between MMSE and RAID scores, which authors claim to be insignificant by arbitrary adjusting of P value to accommodate violation of assumption of normality for these scores); gender imbalance at baseline. Incorrect analyses: UNCLEAR ‐ analyses accounted for study design (details of method not provided); not clear how they dealt with violated assumptions of normality. Protection against contamination: LOW ‐ unlikely to be biased due to contamination/‘herd effects’ as the delivery of the intervention occurred as per RACF policy/practice and was not subject to participant choice or compliance. No other sources of bias detected. |
Neyens 2009.
| Study characteristics | ||
| Methods |
Aim of the study: to evaluate the effectiveness of a multifactorial intervention on the incidence of falls in psychogeriatric nursing home patients Study design: cRCT Unit of randomisation: nursing homes Mean cluster size: 43.2 residents (249 residents from 6 clusters in intervention group and 269 residents from 6 clusters in control group) Unit of analyses: individual resident Sample size calculation: For practical reasons, the authors included a maximum of 12 nursing homes with 1 ward (approx. 30 patients) per home. Based on earlier research among Dutch nursing home patients, the fall rate in the study population was estimated to be 3.3 per patient per year, with a standard deviation of 2.5. With a sample size of 180 patients per group, a reduction of the fall rate of 30% can be detected with a power of 0.80 at 5% significance. On the basis of this power analysis, the minimum sample size for the trial was set at 180 patients per group. |
|
| Participants |
Participants: psychogeriatric nursing home patients Intervention group: n = 249 Control group: n = 269 Age: mean (SD) intervention/control 82.1 (7.7)/83.3 (7.7) Sex: proportion females intervention/control: 65%/71% Comorbidities: not reported Setting: nursing home psychogeriatric wards Country: the Netherlands |
|
| Interventions |
Intervention arm: Multifactorial fall prevention programme applied by a multidisciplinary team The intervention programme consisted of a general medical assessment focusing on fall risks, and an additional specific fall risk evaluation tool assessing fall history, medication intake, mobility and the use of assistive and protective aids. The total fall risk assessment resulted in general fall prevention activities or individually tailored fall prevention interventions for each patient. Duration of the intervention: Not specified. Multidisciplinary teams discussed each patient at admission, after a fall, at the request of professionals on the ward and in any case at least twice a year, even if there had been no fall incident or request. Details of the intervention: see TIDieR checklist for full details of intervention (Appendix 2) Control arm: not described EPOC category: co‐ordination of care (subcategory: Teams) Type of care: primary (fall prevention) care |
|
| Outcomes |
Time points: 12 months Primary outcomes: number of falls Secondary outcomes: none Loss of clusters and individuals: no loss of clusters; loss to follow‐up total/intervention/control groups: 37%/36%/38% Adjusted for clustering for each outcome: yes Method of cluster adjustment for each outcome: random‐effects model (patients clustered within wards) ICC reported for each outcome: no |
|
| Notes |
Outcomes used in this review: number of falls measured at 12 months Unit of analysis error: no Ethical approval and informed consent obtained: yes Funding source: not reported Declarations of interest: none declared or detected Contact with author: no Additional outcome data provided from author: no Trial registration: not reported Other notes: considered eligible given multidisciplinary nature of the intervention. Description of control intervention is not provided; it is assumed that usual care does not involve multidisciplinary team. |
|
| Risk of bias | ||
| Bias | Authors' judgement | Support for judgement |
| Random sequence generation (selection bias) | Low risk | “At random, using computer techniques, two intervention homes and two control homes were selected from each group, resulting in a total of six intervention homes and six control homes.” |
| Allocation concealment (selection bias) | Low risk | “Ward allocation occurred after randomisation.” Efforts for allocation concealment are not described. Allocation was done for all clusters at once, so allocation concealment is unlikely to be a source of bias. |
| Blinding of participants and personnel (performance bias) Outcomes reported in summary of findings table | High risk | Not described, however it is highly improbable that participants and personnel were blinded due to the nature of the intervention. |
| Blinding of outcome assessment (detection bias) Outcomes reported in summary of findings table | Unclear risk | Not described. “Data on falls were collected prospectively by asking all participating wards to keep records of any fall incident on a structured report form.” |
| Incomplete outcome data (attrition bias) All outcomes | Low risk | “Thirty‐seven per cent of the patients that stayed on the study wards at the start of the trial period or were admitted during the trial period dropped out before the end of the trial period. In the intervention group this is 36%, and in the control group this is 38%.” Dropout rates were not different between the study groups. |
| Selective reporting (reporting bias) | Unclear risk | Protocol/trial registration are not available, so it is unclear whether all outcomes are reported. |
| Other bias | Unclear risk | Recruitment bias: LOW – "all patients residing on the study wards at the start of the inclusion period were automatically included in the study. Patients admitted in the course of the inclusion period were included on the day of admission." Baseline imbalance: UNCLEAR ‐ “With regard to ward characteristics at baseline, the intervention wards had fewer nursing staff man‐hours per bed and a higher number of falls per bed during the 12 months preceding the inclusion period. With regards to patient characteristics, minor differences were observed in the Barthel ADL, Index scores, the MMSE scores, standing and gait pattern, use of drugs and length of stay on the ward during the inclusion period”. Protection against contamination: LOW ‐ unlikely to be biased due to contamination/‘herd effects’ as the delivery of the intervention occurred as per RACF policy/practice and was not subject to participant choice or compliance. Incorrect analysis: LOW ‐ analyses accounted for study design. No other sources of bias detected. |
Pieper 2016.
| Study characteristics | ||
| Methods |
Aim of the study: to assess the effects of the stepped wise Dutch version of the STI (STA OP!) versus a non‐stepped wise approach to pain and behavioural symptoms Study design: cRCT Unit of randomisation: nursing home units Mean cluster size: 14 residents (288 residents from 21 units) Unit of analyses: individual resident Sample size calculation: In this study the design effect was estimated at 1.5; so, 1.5 × 56 = 84 residents (after 4 weeks) were needed in total to detect a 15% difference with an a = 0.05 and b = 0.80. However, the authors expected a 50% dropout due to nonresponse and loss to follow‐up, i.e. they needed 168 patients in total: 84 in the intervention and 84 in the control group. One of the primary outcome measures in this study is the Cohen‐Mansfield Agitation Inventory (CMAI), a behavioural observation scale with 29 behavioural items. Each item may be scored between 1 and 7, depending on the frequency of existing symptoms. The range on the CMAI is 29 to 203. In Dutch nursing homes, the median is 44; there is no normal distribution, but the distribution of the change is more or less normally distributed. The standard deviation of difference scores (difference of 4) is 13. The expected difference is, however, larger (at least 10 points). To detect a 15% difference between the intervention (STA OP!‐protocol) and control condition with an a = 0.05 and b = 0.80, 56 residents were required. However, in cluster‐randomisation, a design effect should be taken into account; clustering of items (consistency of CMAI items (ICC) among residents in a unit is 0.10) and also the effect of large differences in sample sizes per cluster enhances the design effect. |
|
| Participants |
Participants: nursing home residents with advanced dementia (residents with moderate to severe cognitive impairment (Reisberg Global Deterioration Scale (GDS) Stage 5, 6 or 7), no psychiatric diagnosis other than dementia, and clinically significant symptoms of challenging behaviour (a score of at least 44 on the Dutch version of the Cohen‐Mansfield Agitation Inventory (CMAI) or a score of at least 4 (frequency × severity) on items of the Neuropsychiatric Inventory ‐ Nursing Home Version (NPI‐NH) or an indication of clinically relevant pain (intensity × frequency ≥ 2) according to the Minimum Data Set of the Resident Assessment Instrument (MDS‐RAI)‐pain scale in measurement week 0 (baseline)) Intervention group: n = 148 Control group: n = 140 Age: mean (SD) in intervention/control 84.3 (7.4)/83.3 (6.9) Sex: % females in intervention control: 72%/71% Comorbidities: % circulatory system in intervention/control: 51%/54% % respiratory system in intervention/control: 12%/9% % locomotor system in intervention/control: 23 %/29% % nervous system in intervention/control: 22%/28% % endocrine, metabolic system in intervention/control: 24%/30% % sensory system in intervention/control: 14%/22% % infection in intervention/control: 6%/6% % other (allergies, cancer, anaemia, kidney insufficiency) in intervention/control: 15%/14% Setting: nursing home Country: the Netherlands |
|
| Interventions |
Intervention arm: Stepwise Multidisciplinary Intervention for Challenging Behaviour in Advanced Dementia (STA OP!) Intervention consists of introducing clinical protocol or care pathway for nursing home residents with dementia. The intervention condition involved implementation of the STA OP! protocol; all healthcare professionals (nursing staff, physicians, psychologists, physiotherapists) working on units of the intervention condition received a comprehensive stepwise multidisciplinary training of five meetings lasting 3 hours each to implement the STA OP! protocol. To promote use of the protocol in practice, the protocol was linked to structured daily or weekly team meetings, and focus groups were formed within the units of the institution to facilitate implementation. In addition to these efforts, the project co‐ordinator performed site visits once a week, conducted fidelity checks with nursing staff and elderly care physicians regarding their use of the STA OP! protocol, and answered their questions regarding pain or affective discomfort. Residents with moderate to severe dementia and challenging behaviour were assessed and treated using the protocol. Depending on the intervention chosen, a decision was made as to how and when to proceed to the subsequent step, but in general, when effects were lacking or were limited, the intervention did not take longer than 1 week. Duration of the intervention: not explicitly stated. Intervention effects were assessed at 3 months (end of the training period) and 6 months after the intervention was implemented. Details of the intervention: see TIDieR checklist for full details of intervention (Appendix 2) Control arm: Healthcare professionals working on units in the control condition also received training, but this training lacked the stepwise component and focused on general nursing skills, dementia management and pain. The project co‐ordinator visited all units in the control condition once a week to provide general information on challenging behaviour and dementia management and to answer staff’s questions pertaining to participation in the study. The nurses and nursing home physicians are informed which residents of their units have a CMAI, NPI‐NH or MDS‐RAI pain scale score higher than threshold at pre‐test (week 0), according to the assessments of the nurses and blinded research assistants. EPOC category: co‐ordination of care (subcategory: Care pathways) Type of care: primary and secondary (dementia) care |
|
| Outcomes |
Time points: 3 and 6 months Primary outcomes: symptoms of challenging behaviour measured with Cohen‐Mansfield Agitation Inventory (CMAI) and with the Dutch version of the Neuropsychiatric Inventory‐Nursing Home Version (NPI‐NH), symptoms of pain measured with the pain scale of the Dutch version of the Minimum Data set of the Resident Assessment Checklist for Seniors (PAC‐SLAC‐D) Secondary outcomes: depressive symptoms measured with the Cornell depression scale and the depression rating scale of the Minimum Data Set Depression Rating Scale (MDS‐DRS); quality of life measured with the QUALIDEM using 6 out of 9 domains (domains and questions within domain applicable to very severe dementia): care relationship, positive affect, negative affect, restless tense behaviour, social relations, social isolation). The QUALIDEM does not provide a validated calculated total score; psychotropic drug use classified using the anatomical therapeutic chemical (ATC) classification; mortality Loss of clusters and individuals: no loss of clusters, data on 118/148 and 111/140 (intervention/control) residents available at 6 months follow‐up Adjusted for clustering for each outcome: yes Method of cluster adjustment for each outcome: random‐effects model and generalised estimating equation analyses ICC reported for each outcome: no |
|
| Notes |
Outcomes used in this review:
Contact with author: no Unit of analysis error: no Ethical approval and informed consent obtained: yes Funding source: Innovatiefonds Zorgverzekeraars Declarations of interest: none declared or detected Additional outcome data provided from author: no Trial registration: Netherlands National Trial Register (NTR1967) Other: trial has strong focus on staff education and quality improvement (exclusion criteria). Considered eligible for this review as model of care included elements of care co‐ordination. |
|
| Risk of bias | ||
| Bias | Authors' judgement | Support for judgement |
| Random sequence generation (selection bias) | Low risk | An independent researcher (who was unaware of the identity of the units) performed the allocation using a computer‐generated sequence program (Random Allocation Software, EMGO+ Institute, Amsterdam, the Netherlands). |
| Allocation concealment (selection bias) | Low risk | Allocation was performed by a researcher who was unaware of the identity of the units. |
| Blinding of participants and personnel (performance bias) Outcomes reported in summary of findings table | High risk | Participants were probably not aware of their treatment allocation ("... the primary source of information was the behavior of the resident, who was unaware of being included in the intervention or control condition"). The nurses who provided the care and reported back on the treatment outcomes were aware of the treatment allocation ("... the outcome measurement was based on the observations of the nurses and could not be blinded"). This was likely to bias at least one of the outcomes included in the review (i.e. quality of life). |
| Blinding of outcome assessment (detection bias) Outcomes reported in summary of findings table | High risk | The research assistants performing the measurements were blinded. However, the research assistant assessed all measures based on a face‐to‐face interview with the nursing staff member (a certified nursing assistant or registered nurse) who was familiar with the resident and was aware of the treatment allocation. |
| Incomplete outcome data (attrition bias) All outcomes | Low risk | Similar high loss to follow‐up in both groups 30/148 (STA OP!) and 29/140 (control). Death was the reason for all but one dropout (one was due to transfer). |
| Selective reporting (reporting bias) | Low risk | Study protocol registered with The Netherlands Trial Registry and study protocol was published. Results for all outcomes have been reported. |
| Other bias | High risk | Recruitment bias: HIGH – patients were selected for participation after unit randomisation and allocation to treatment groups; newly admitted residents enrolled at later stages could choose the specific facility after randomisation. Baseline imbalance: LOW – no major imbalances at baseline. Protection against contamination: LOW ‐ unlikely to be biased due to contamination/‘herd effects’ as the delivery of the intervention occurred as per RACF policy/practice and was not subject to participant choice or compliance. Incorrect analysis: LOW ‐ analyses adjusted for study design. Other: the intervention was performed in only a small proportion of the residents (39%), despite the fact that all residents met the inclusion criteria and were eligible for treatment with STA OP! |
Rubenstein 1990.
| Study characteristics | ||
| Methods |
Aim of the study: to measure the effects of a specialised post‐fall assessment intended to detect causes and underlying risk factors for falls and to recommend preventative and therapeutic interventions Study design: RCT Unit of randomisation: individual resident Mean cluster size: n/a Unit of analyses: individual resident Sample size calculation: There were no published data on the effect of a fall intervention programme to aid the authors in calculating the initial sample size. On the basis of their knowledge of the incidence of falls and the prevalence of related risk factors, they felt that a 25% reduction in falls would be a reasonable estimate of a possible intervention outcome. If this had proved true, their sample size of 160 would have been sufficient to detect such a difference with a power of 0.90. With the much smaller observed difference of 9.3% in the number of falls, however, the calculated power is only between 0.20 and 0.25. If a fall intervention programme can only be expected to show a 10% reduction in falls, future studies will need to include much larger sample sizes to achieve a power of 0.90. |
|
| Participants |
Participants: ambulatory residents of the RACF who had fallen within the last 7 days. A fall was defined as an event, reported either by the faller or a witness, resulting in a person inadvertently coming to rest on the ground or another lower level, with or without loss of consciousness or injury. Intervention group: n = 79 Control group: n = 81 Age: mean (SE) intervention/control: 86.8 (0.58)/87.9 (0.65) Sex: proportion females intervention/control: 83.5%/86.4% Comorbidities: mean (SE) n medical problems intervention/control 4.7 (0.19)/4.2 (0.15) Setting: RACF Country: USA |
|
| Interventions |
Intervention arm: Comprehensive post‐fall assessment Immediately after randomisation, patients assigned to the intervention group received the post‐fall diagnostic assessment. This assessment was based on principles of geriatric assessment and was designed to uncover risk factors associated with falls as well as problems of a more general nature. Because the study team was attempting to identify the most useful components of the post‐fall assessment, they included those assessments and laboratory tests that are typically done by clinicians, as well as several others that have been recommended in the literature. The post‐fall assessment included a complete physical examination including a detailed quantitative neurologic and musculoskeletal assessment, visual acuity screening (Snellen chart), extended pulse and blood pressure assessment with attention to postural changes, assessment of footwear and foot problems, and a quantified balance and gait assessment using a 26‐point version of the Tinetti scale. Laboratory tests were then done, including a complete blood count, urinalysis, creatinine, electrolytes, calcium, hepatic enzymes, serologic test for syphilis and free thyroxine index. A standard 12‐lead electrocardiogram was obtained as well as 24‐hour ambulatory cardiac (Holter) monitoring. Finally, the nurse practitioner did a careful environmental assessment of the resident's room and other relevant areas to identify potential hazards (for example, lighting, bed height, obstacles, floor condition). The research team decided on the primary cause after carefully discussing all clinical information and gave a list of recommendations to the resident's primary care physician in a written report containing probable cause or causes for the fall, identified risk factors and therapeutic recommendations. Duration of the intervention: It took an average of 3 weeks from the incident fall for the primary care physician to review the research team's final recommendations. The intervention was a one‐time occurrence. Details of the intervention: see TIDieR checklist for full details of intervention (Appendix 2) Control arm: Residents in the control group did not receive the assessment and no recommendations were transmitted. EPOC category: co‐ordination of care (subcategory: Comprehensive geriatric assessment) Type of care: primary care |
|
| Outcomes |
Time points: 3, 6, 9, 12 months,2 years Primary outcomes: subsequent falls, number of hospitalisations and lengths of stay, level of care, fall‐related injuries, mobility status, medications, survival Secondary outcomes: none Loss of clusters and individuals: no loss to follow‐up reported Adjusted for clustering for each outcome: n/a Method of cluster adjustment for each outcome: n/a ICC reported for each outcome: n/a |
|
| Notes |
Outcomes used in this review:
Unit of analysis error: n/a Ethical approval and informed consent obtained: yes Funding source: the Health Services Research and Development Services of the Department of Veterans Affairs (project 84‐141) Declarations of interest: none declared or detected Contact with author: no Additional outcome data provided from author: no Trial registration: not reported |
|
| Risk of bias | ||
| Bias | Authors' judgement | Support for judgement |
| Random sequence generation (selection bias) | Low risk | “Eligible fallers were then randomly assigned to either the intervention or control group, using computer generated, randomly sequenced cards in sealed envelopes.” |
| Allocation concealment (selection bias) | Unclear risk | “Eligible fallers were then randomly assigned to either the intervention or control group, using computer generated, randomly sequenced cards in sealed envelopes.” Does not specify if these were opaque. |
| Blinding of participants and personnel (performance bias) Outcomes reported in summary of findings table | Unclear risk | “The JHA primary care physicians were aware that a “falls prevention study" was being done; however, these physicians knew few of the study details and played no direct role in the study itself other than to respond to the recommendations.” “The nurse practitioner [who conducted diagnostic assessment] did not become involved in the treatment of subjects nor did she provide any further recommendations to the primary care physicians during the course of the study”. Blinding of residents is not described. It is unclear whether results can be subject to performance bias. |
| Blinding of outcome assessment (detection bias) Outcomes reported in summary of findings table | Unclear risk | No details about blinding of the outcome assessors are provided. |
| Incomplete outcome data (attrition bias) All outcomes | Low risk | No loss to follow‐up reported other than due to mortality. |
| Selective reporting (reporting bias) | Unclear risk | Protocol/trial registration are not available, so it is unclear whether all outcomes are reported. |
| Other bias | Low risk | No other sources of bias detected. |
Rutten 2022.
| Study characteristics | ||
| Methods |
Aim of the study: to implement and assess the effect of an electronic health record (EHR)‐integrated decision tool (plus supportive interventions) on appropriate antibiotic prescribing in nursing home (NH) residents with suspected urinary tract infections (UTIs) Study design: cRCT Unit of randomisation: RACF Mean cluster size: 18 residents (295 residents in 16 ACFs) Unit of analyses: individual resident Sample size calculation: An increase of at least 20% appropriate antibiotic prescribing for suspected UTI was considered to be clinically relevant. To detect this difference with 80% power and a significance level of 5%, 72 cases of antibiotic prescribing for UTI would be required in each group. Based on previous study data, it was expected that antibiotics would be prescribed in 91% of cases of suspected UTI in the control group and that the intervention had the potential to reduce this to 62% of suspected UTI in the intervention group. Consequently, 79 cases of suspected UTI were required in the control group to include 72 antibiotic prescriptions, and up to 116 in the intervention group. Study authors decided to include NHs with 150 beds on average. Dutch surveillance studies reported an incidence rate of 87 UTIs per 150 beds per year. Based on prior, comparable research, it was estimated that 70% of the residents (or their representatives in case of legal incapacity) would provide informed consent to participate in the study, which converts to 61 recruited residents per 150 beds per year for the present study. Corrected for clustering within NHs, study needed (79 * 4.6 =) 363 cases in the control group and (116 * 4.6 =) 534 in the intervention group, using the following formula for design effect: 1 + [(cluster size ‐ 1) * intraclass correlation coefficient] = 1 + [(61 ‐ 1) * 0.06] = 4.6. The estimate of the intraclass correlation coefficient was based on Campbell 2005: Campbell MK, Fayers PM, Grimshaw JM. Determinants of the intracluster correlation coefficient in cluster randomized trials the case of implementation research. Clin Trials 2005;2:99e107) and prior study data. To include 363 cases over a period of 12 months, 6 NHs (i.e. 363/61) were required in the control group. To include 534 cases over a period of 12 months, 9 NHs (i.e. 534/61) were required in the intervention group. |
|
| Participants |
Participants: NH residents were included in the study if they were diagnosed with suspected UTI and provided informed consent (pre‐emptive consent). Residents who were already taking antibiotics or had taken antibiotics in the previous 7 days, and residents who do not wish to be treated with antibiotics in case of a UTI were excluded. Intervention group: n = 132 residents (189 suspected UTIs) Control group: n = 80 residents (106 suspected UTIs) Age: mean (SD) intervention/control 87 (7)/84 (7) Sex: proportion females intervention/control 85%/70% (proportion of suspected UTIs) Comorbidities: The proportion of suspected UTIs with (very) severe dementia in intervention/control 38%/58% The proportion of suspected UTIs with cardiovascular disease in intervention/control 55%/33% The proportion of suspected UTIs with pulmonary disease in intervention/control 25%/9% Setting: RACF Country: the Netherlands |
|
| Interventions |
Intervention arm: Decision tool for empiric treatment of urinary tract infections integrated into the electronic health record, including staff education Decision tool automatically generates treatment advice when a physician reports pre‐structured clinical information in the EHR of residents with a suspected UTI who provided pre‐emptive informed consent. The treatment advice generated by the decision tool corresponds to the advice stated in the UTI guideline of the Dutch Association of Elderly Care Physicians. The physician is free to deviate from the treatment advice and remains responsible for the treatment decision. All physicians receive a pocket card of the decision tool for situations without access to the EHR (and therefore to the decision tool). Physician education consisted of: 1) a 1‐hour interactive presentation about the content of the decision tool, provided by the research team, and 2) a role play to learn how to deal with pressure to prescribe antibiotics from residents, their family or nursing staff, and on how to train nursing staff on the content of the decision tool. The complete nursing staff was offered a 6‐min video about dealing with suspected UTI in NH residents (based on a training module developed by prof. Sloane and his research group, University of North Carolina at Chapel Hill). In this video, particular attention is paid to standardised assessment of residents with suspected UTI and to other common causes of non‐specific signs and symptoms. A part of the nursing staff (i.e. at least 1 nurse per 10 residents) additionally completes a 20‐min e‐learning to become ‘experts’ with sufficient knowledge for education of other nursing staff. In the e‐learning, the video topics are discussed in more detail. Furthermore, attention is paid to how to deal with pressure from residents or their family asking for urine analysis or an antibiotic prescription. After finishing the e‐learning, ‘experts’ receive a pocket card with a summary of the e‐learning content. Finally, information material on actively monitoring residents who are not prescribed antibiotics is provided to nursing staff for distribution to residents or their family members. Duration of the intervention: each participant was followed up for 21 days after inclusion Details of the intervention: see TIDieR checklist for full details of intervention (Appendix 2) Control arm: In the control group, care as usual is provided without any restrictions. EPOC category: co‐ordination of care (subcategory: Care pathways) Type of care: primary care |
|
| Outcomes |
Time points: baseline, 3, 7 and 21 days Primary outcomes: appropriate antibiotic prescribing for suspected urinary tract infections at the day of diagnosis (appropriate antibiotic prescriptions = in compliance with the treatment advice generated by the decision tool) Secondary outcomes: course of symptoms after the index consultation (i.e. recovery, unchanged or deterioration), alternative diagnoses after assessment, changes in treatment policy (e.g. start/stop antibiotics, adjustments in dose, type or duration) and motivation for these changes, complications (side effects of antibiotics, renal insufficiency and pyelonephritis/urosepsis), UTI‐related hospitalisation, mortality and total antibiotic prescribing on the NH level. Loss of clusters and individuals: no loss of clusters reported; loss of individuals: intervention 13; control 6 (total # missing in flow diagram) Adjusted for clustering for each outcome: yes Method of cluster adjustment for each outcome: multilevel regression model and generalised estimating equations ICC reported for each outcome: no |
|
| Notes |
Outcomes used in this review:
Unit of analysis error: no Ethical approval and informed consent obtained: yes Funding source: The Netherlands Organisation for Health Research and Development (ZonMw, grant number 839120008) Declarations of interest: none declared or detected Contact with author: yes Additional outcome data provided from author: no Trial registration: Netherlands Trial Register NTR NL7555 |
|
| Risk of bias | ||
| Bias | Authors' judgement | Support for judgement |
| Random sequence generation (selection bias) | Low risk | A block randomisation procedure was performed by an independent individual using randomisation software. |
| Allocation concealment (selection bias) | Unclear risk | Allocation concealment is not described |
| Blinding of participants and personnel (performance bias) Outcomes reported in summary of findings table | High risk | Since physicians in the intervention group use the decision tool, and the research team provides education to physicians and nursing staff, blinding of NH professionals and the research team was not feasible. Study authors did not inform patients about allocation of the nursing home in the intervention or control arm, but nursing home professionals may have provided this information. |
| Blinding of outcome assessment (detection bias) Outcomes reported in summary of findings table | Low risk | Both in the intervention and control group, data were collected through a research application integrated in the EHR (case report form). The application started automatically when a physician entered the diagnosis of suspected UTI in the EHR of a resident that provided informed consent. |
| Incomplete outcome data (attrition bias) All outcomes | Low risk | Attrition was low and not different between the groups. |
| Selective reporting (reporting bias) | Low risk | Published protocol available; results on all pre‐specified outcomes were reported. |
| Other bias | Unclear risk | Recruitment bias: UNCLEAR ‐ residents were included after randomisation of nursing homes. Study authors did not inform patients about allocation of the nursing home in the intervention or control arm, but nursing home professionals may have provided this information. Baseline imbalance: UNCLEAR ‐ several patient characteristics differed between groups as well as total antibiotic‐prescribing rates prior to study onset. Analyses enabled adjustment for the most influential (including total antibiotic prescribing rates), but not all baseline differences between intervention and control group. Protection against contamination: UNCLEAR ‐ authors report that they initially aimed to conduct this study prior to publication of the updated national guideline, in which the decision tool subject to the study would be introduced, ensuring that only intervention group NHs had access to it. The guideline, however, became available before study onset, thus providing control group NHs access to the decision tool (albeit not EHR‐integrated). Although the authors did not actively implement the guideline in these NHs, participating in the study may have increased awareness for appropriate antibiotic prescribing, especially since physicians of the control group also filled out case report forms. This may have motivated them to prescribe antibiotics more carefully and make efforts to familiarise themselves with this new guideline. Incorrect analysis: LOW ‐ analyses appropriately adjusted for clustering. No other sources of bias detected. |
Stern 2014.
| Study characteristics | ||
| Methods |
Aim of the study: to determine the clinical and cost‐effectiveness of enhanced multidisciplinary teams (EMDTs) vs ‘usual care’ for the treatment of pressure ulcers (PUs) in long‐term care (LTC) facilities Study design: stepped wedge cRCT Unit of randomisation: RACF (only facilities with at least 100 beds, within 100 km from the hospital, with PU prevalence greater than the provincial average and the facility administrator consent were eligible) Mean cluster size: mean (SD) number of beds 166 (37) Unit of analyses: individual resident Sample size calculation: Trial outcomes for a stepped wedge design were simulated. Simulation included 5 to 10 homes, with 170 patients per home, and a 20% dropout rate. Additional parameters of the simulation model included the measurement error of normalised wound surface areas (0.1 standard deviation (SD) units), the percentage of ulcers that were not likely to respond to the intervention (20%), the estimated prevalence of stage II to IV ulcers (4%) and the estimated annual incidence of stage II to IV pressure ulcers (2.5%). The minimum clinically important difference was a 40% improvement in the normal rate of healing (8.65% per week), which corresponded to an absolute healing rate of 12.11% per week. A treatment effect was estimated for each simulated data set based on a linear mixed model that included random slopes for ulcers, a time‐varying covariate for the treatment, and an interaction between the treatment and time. Each estimated treatment effect was evaluated for significance at the 5% level. The power was estimated as the proportion of significant treatment effects across the 1000 simulated data sets; 80% power was considered adequate. Under these scenarios, the power for 10 homes was adequate to detect treatment effects that were 40% or larger than the normal rate of healing. |
|
| Participants |
Participants: RACF residents with stage II or greater pressure ulcers Intervention group: n = 94 (included in primary analysis)* Control group: n = 67 (included in primary analysis)* Age: mean (SD) intervention/control 83.0 (12.0)/81.0 (12.0) Sex: proportion females intervention/control 69%/64% Comorbidities: mean (SD) diagnoses intervention/control 6.5 (2.2)/7.7 (3.4) Setting: RACF Country: Canada *42 participants crossed study phases, extending from control to intervention; i.e. double counted. |
|
| Interventions |
Intervention arm: Enhanced Multidisciplinary Team (EMDT) care The enhanced multidisciplinary team consisted of advanced practice nurses (APNs) who provided outreach to RACFs, and were linked to a hospital‐based expert wound care team. The APNs visited RACFs to educate staff on the prevention and treatment of pressure ulcers, consulting with a hospital‐based expert wound care team via email, telephone or video link following a referral rubric. The expert wound team was situated in a large teaching hospital and was led by a nurse practitioner and included a chiropodist, an occupational therapist and a plastic surgeon that had access to other specialists if needed. Duration of the intervention: 4 to 14 months Details of the intervention: see TIDieR checklist for full details of intervention (Appendix 2) Control arm: Wound care within RACFs was typically provided by RNs, RPNs, personal support workers and nutritionists, who may or may not have had expertise in wound care. Although facilities were to have wound care teams in place, only 3 of the 12 facilities had wound care teams, with the composition and function of these ‘teams’ being highly variable. Access to other disciplines (e.g. enterostomal therapists, physiotherapists, occupational therapists) was available, typically on a reactive basis. EPOC category: co‐ordination of care (subcategory: Teams) Type of care: primary and secondary wound care |
|
| Outcomes |
Time points: every 2 weeks for several outcomes and end of follow‐up at 4 to 14 months after the start of the intervention Primary outcomes: rate of reduction of pressure ulcer surface are (cm2/day) Secondary outcomes: time to complete healing, percentage of wounds healed, pressure ulcer incidence and prevalence, wound pain (VAS‐pain), hospitalisations, emergency department visits, utility (EQ5D), cost‐effectiveness Loss of clusters and individuals: 12 RACFs (137 residents; 259 pressure ulcers) randomised; although no clusters were lost to follow‐up some residents (wounds) were Residents (wounds) enrolled: Control period = 80 (117) Intervention period = 101 (193) Residents (wounds) included in primary analysis: Control period = 67 (91) Intervention period = 94 (159) Adjusted for clustering for each outcome: yes Method of cluster adjustment for each outcome: mixed model ICC reported for each outcome: no |
|
| Notes |
Outcomes used in this review:
Unit of analysis error: no Ethical approval and informed consent obtained: yes Funding source: the Canadian Patient Safety Institute, the Central Community Care Access Center, and the Ministry of Health and Long Term Care Declarations of interest: none declared or detected Contact with author: yes Additional outcome data provided from author: no Trial registration: NCT01232764 |
|
| Risk of bias | ||
| Bias | Authors' judgement | Support for judgement |
| Random sequence generation (selection bias) | Low risk | Long‐term care facilities were randomised to start date of the intervention by a researcher external to the study team using a computer‐ generated random number sequence. |
| Allocation concealment (selection bias) | Low risk | Although facilities were randomised to start date of the intervention by a researcher external to the study team, allocation concealment is not described. Allocation was done for all clusters at once, so allocation concealment is unlikely to be a source of bias. |
| Blinding of participants and personnel (performance bias) Outcomes reported in summary of findings table | High risk | Participants and personnel were not blinded, and some outcomes would likely be influenced by the lack of blinding (i.e. ED visits). |
| Blinding of outcome assessment (detection bias) Outcomes reported in summary of findings table | Low risk | It is unclear if the researchers who abstracted the data on primary outcomes (ED visits) were blinded; however, it is unlikely that lack of blinding would have influenced the assessment of these outcomes. |
| Incomplete outcome data (attrition bias) All outcomes | Low risk | A flowchart is provided and reasons for attrition reported. No substantial differences between the groups. |
| Selective reporting (reporting bias) | Low risk | Trial registration form available (NCT01232764). Primary and secondary outcomes correspond to trial registration. Additional outcomes are reported that were not specified a priori in the trial registration. |
| Other bias | High risk | Recruitment bias: HIGH ‐ facilities were recruited then randomised to starting date of intervention; residents were recruited after the facilities were randomised ("Individuals were approached to participate after facilities had been randomised"). Proportions of residents who declined participation or not provided consent are comparable in both groups. Baseline imbalance: LOW ‐ characteristics of patients in intervention and control group are comparable. Protection against contamination: LOW ‐ unlikely to be biased due to contamination/‘herd effects’ as the delivery of the intervention occurred as per RACF policy/practice and was not subject to participant choice or compliance. Incorrect analyses: UNCLEAR ‐ analyses accounted for clustering; however, it is not reported whether time trends were included in the analyses. No other sources of bias detected. |
Temkin‐Greener 2018.
| Study characteristics | ||
| Methods |
Aim of the study: to examine the feasibility of implementing facility‐based palliative care teams and their efficacy on residents’ outcomes at the end of life Study design: cRCT Unit of randomisation: nursing homes Mean cluster size: mean (SD) number of certified beds intervention/control 190.9 (106.8)/174.6 (111.0) Unit of analyses: individual resident Sample size calculation: The sample size was calculated to ensure power to detect an effect on end of life quality of care measured by resident risk‐adjusted outcomes. The power and sample size calculations were designed to detect an odds ratio of 0.50 between the intervention and the control NHs. Authors used CY2005–2007 MDS and Medicare claims data for decedent NH residents in NYS, to obtain facility‐level average rates for several outcomes and standard deviations of the distribution of these rates. Since the data mainly come from two levels, the NH and the resident, the authors used the formula from Hayes and Bennett to carry out the sample size calculation. Assuming participation by 30 NHs, the authors examined the coefficient of variation (COV) between NHs to determine the power for detecting an odds ratio of 0.50 for each outcome, comparing 15 intervention and 15 control groups, using a one‐sided test (study hypotheses are directional) with 0.05 significance level. From preliminary data, the COVs were estimated to be 0.35 for pain and 0.40 for in‐hospital death, resulting in powers of 88% and 82%, respectively. |
|
| Participants |
Participants: long‐stay nursing home residents (> 90 days) Intervention group: n = 2852 from 14 nursing homes, 466 responses from staff post‐intervention (2219 approached) in total Control group: n = 2978 from 11 nursing homes, 466 responses from staff post‐intervention (2219 approached) in total Age: mean (SD) intervention/control 86.0(8.9)/86.2(9.0) Sex: proportion females intervention/control 64%/65% Comorbidities: number of active diagnoses mean (SD) intervention/control 4.6(2.3)/4.2 (2.1) Setting: nursing home Country: USA |
|
| Interventions |
Intervention arm: Palliative care through teamwork (IMPACTT) IMPACTT was a facility‐level intervention involving a multicomponent strategy that included implementing facility‐based palliative care teams and providing staff with palliative and end of life geriatric training. Duration of the intervention: Team development and staff training were followed by a 2‐month long active intervention phase during which a gero‐palliative care nurse practitioner interventionist rounded with the teams as they saw or discussed residents’ care. A passive phase of 8 months immediately followed, during which the nurse interventionist was available to further coach the team on an as needed/requested basis. Details of the intervention: see TIDieR checklist for full details of intervention (Appendix 2) Control arm: not described in the published report. Additional information provided by authors via email: “Usual care meant no active palliative care teams operating on site. While palliative care may be provided in US nursing homes, largely via a contractual relationship with hospice, on site palliative care teams do not exist”. EPOC category: co‐ordination of care (subcategory: Teams) Type of care: palliative care |
|
| Outcomes |
Time points: during the last 90 days of life Primary outcomes: place of death, number of hospitalisations within the last 90 days of stay (excluding last hospital stay if death occurred in a hospital), self‐reported pain (binary measure, moderate‐to‐severe vs otherwise), depression (yes/no) Secondary outcomes: staff satisfaction (survey) at the start and at the end of the intervention Loss of clusters and individuals: 3 control and 2 intervention sites dropped out as a group as a result of the decision at corporate level Adjusted for clustering for each outcome: yes Method of cluster adjustment for each outcome: random‐effects model ICC reported for each outcome: no |
|
| Notes |
Outcomes used in this review:
Unit of analysis error: no Ethical approval and informed consent obtained: yes Funding source: This work was supported with funding (Award No. 641) from the Patient Centered Outcomes Research Institute (PCORI). Declarations of interest: none declared or detected Contact with author: yes Additional outcome data provided from author: no Trial registration: NCT01990742 Other: trial has strong focus on staff education and quality improvement (exclusion criteria). Considered eligible for this review as model of care included elements of care co‐ordination. |
|
| Risk of bias | ||
| Bias | Authors' judgement | Support for judgement |
| Random sequence generation (selection bias) | Low risk | Computer‐generated random number producing algorithm was used. |
| Allocation concealment (selection bias) | Low risk | It is not described how the NHs were allocated or who was responsible for allocating the NHs based on the random sequence generated. Allocation was done for all clusters at once, so allocation concealment is unlikely to be a source of bias. |
| Blinding of participants and personnel (performance bias) Outcomes reported in summary of findings table | High risk | Participants and personnel were not blinded, and some outcomes included in this review would likely be influenced by the lack of blinding (i.e. hospital admissions). |
| Blinding of outcome assessment (detection bias) Outcomes reported in summary of findings table | Low risk | It is not described whether outcome assessors were blinded. However, it is unlikely that lack of blinding would influence assessment of the outcome included in this review (i.e. hospital admissions). |
| Incomplete outcome data (attrition bias) All outcomes | Low risk | 407/3259 decedents (see clinical trial registration site; 2/16 NHs) and 1353/4331 decedents 4/15 NHs in the intervention and control, respectively, did not complete the study. Reasons for withdrawal were provided and were based on factors external to the study. |
| Selective reporting (reporting bias) | Low risk | Study is registered on clinicaltrials.gov (NCT01990742) and all of the outcomes stated in the protocol are reported on in the published papers. |
| Other bias | Low risk | Recruitment bias: LOW ‐ all recruitment activities were completed prior to randomisation Baseline imbalance: LOW ‐ the control homes had significantly fewer deficiency citations, compared with the treatment facilities. There were no other statistically significant differences at baseline between the treatment and the control NHs. Incorrect analyses: LOW ‐ analyses were appropriately adjusted for clustering. Protection against contamination: LOW ‐ unlikely to be biased due to contamination/‘herd effects’ as the delivery of the intervention occurred as per RACF policy/practice and was not subject to participant choice or compliance. No other sources of bias detected. |
Uy 2008.
| Study characteristics | ||
| Methods |
Aim of the study: to determine the effectiveness of interdisciplinary rehabilitation for women with hip fracture who were residents of nursing homes Study design: RCT Unit of randomisation: individual resident Mean cluster size: n/a Unit of analyses: individual resident Sample size calculation: not reported |
|
| Participants |
Participants: female RACF residents, ambulant prior to the hip fracture Intervention group: n = 3 Control group: n = 7 Age: median intervention/control 80/83 Sex: proportion females intervention/control 100%/100% Comorbidities: median Charlson index intervention/control 1/1 Setting: RACF Country: Australia |
|
| Interventions |
Intervention arm: Inpatient multidisciplinary rehabilitation program Intervention group provided with an inpatient multidisciplinary rehabilitation programme using the system of accelerated rehabilitation. When ambulating, or when it was clear that the patient would be unable to ambulate, the patient was discharged to the RACF with instructions for continuing mobilisation. Duration of the intervention: not reported in the paper; authors provided the following via email: "The duration of the intervention was the number of days in which the participant was in the inpatient rehabilitation ward." Details of the intervention: see TIDieR checklist for full details of intervention (Appendix 2) Control arm: residents in the control group were discharged back to the RACF soon after surgery for the hip fracture EPOC category: where care is provided (subcategory: Site of service delivery) Type of care: primary and secondary care |
|
| Outcomes |
Time points: outcomes measured at 1 and 4 months after the start of the intervention Primary outcomes: Barthel Index, gait velocity Secondary outcomes: mortality Loss of clusters and individuals: 1 participant in intervention group died; no loss to follow‐up in control group Adjusted for clustering for each outcome: n/a Method of cluster adjustment for each outcome: n/a ICC reported for each outcome: n/a |
|
| Notes |
Outcomes used in this review:
Unit of analysis error: no Ethical approval and informed consent obtained: yes Funding source: not reported Declarations of interest: not reported Contact with author: yes Additional outcome data provided from author: no Trial registration: trial not registered Other notes: The study was terminated prematurely after a change in Australian Government regulations created financial incentives to have only immobile residents in nursing homes. As a result of this, it was no longer possible to identify potentially eligible study participants. |
|
| Risk of bias | ||
| Bias | Authors' judgement | Support for judgement |
| Random sequence generation (selection bias) | Low risk | "Randomisation sequence generated from a random number table". |
| Allocation concealment (selection bias) | Low risk | "Concealed randomisation using numbered opaque envelopes". |
| Blinding of participants and personnel (performance bias) Outcomes reported in summary of findings table | Low risk | Participants and personnel were not blinded; however, it is unlikely that the lack of blinding would influence the outcome of interest (i.e. mortality). |
| Blinding of outcome assessment (detection bias) Outcomes reported in summary of findings table | Low risk | Follow‐up data were collected by a research nurse who was masked to the treatment allocation of the study participant. |
| Incomplete outcome data (attrition bias) All outcomes | Low risk | Attrition is clearly reported. One death reported in intervention group. All other participants completed. Trial stopped early due to external reasons. |
| Selective reporting (reporting bias) | Unclear risk | Protocol/trial registration are not available, so it is unclear whether all outcomes are reported. |
| Other bias | Unclear risk | Study was terminated prematurely and did not reach its recruitment goals (however, recruitment goals are not provided). |
Van den Block 2020.
| Study characteristics | ||
| Methods |
Aim of the study: to investigate the effect of the Palliative Care for Older People (PACE) Steps to Success Program on resident and staff outcomes Study design: cRCT Unit of randomisation: nursing home Mean cluster size: number of deceased residents post intervention: 425 from 37 intervention nursing homes and 558 from 36 control nursing homes (425 + 558)/73 nursing homes Unit of analyses: individual resident or staff member Sample size calculation: Authors estimated that a sample of 144 patients for each group (corresponding to 36 nursing homes with 4 deceased residents per nursing home) would achieve 90.6% power to detect a difference in mean EOLD‐CAD score of 3 points, assuming a standard deviation of 5.61 points for each group, an intracluster correlation coefficient (ICC) of 0.3 and a significance level of 5%. This was increased to 288 patients per group (total sample size of 576) to allow for a 20% nonresponse of staff and a 50% nonresponse on relative questionnaires. |
|
| Participants |
Participants: residents of eligible long‐term care facilities. Facilities were eligible if they: 1) provided on‐site nursing care and personal assistance with activities of daily living and off‐site family physicians/GPs responsible for the resident’s medical care; 2) had at least 30 beds; 3) 15 or more residents died in or outside the nursing home over the last year (as estimated by the facilities’ managers); 4) facilities where the Board of Directors expresses explicit motivation to participate in the study and agrees to free time for a head nurse or manager to act as PACE co‐ordinator for approximately 0.5 days per working week, depending on setting. The Board were asked to sign a letter of agreement to that effect to ensure that each LTCF remains motivated to participate, with a minimum dropout rate. Intervention group: deceased residentsn = 279 baseline; n = 425 post intervention from 37 nursing homes; nursing home staff N = 1710 Control group: deceased residents: n = 272 baseline; n = 558 post intervention from 36 nursing homes; nursing home staff N = 1800 Age (at time of death): mean (SD) intervention/control 85.58 (8.81)/85.91 (8.57) Sex: proportion females intervention/control 60.6%/70.6% (baseline); 64.0 %/64.7% (post‐intervention) Comorbidities: proportion with dementia intervention/control 70.3%/71.8% (baseline); 66.8%/71.8% (postintervention) Setting: nursing homes with at least 30 beds and 15 or more residents who were dying or had died in the past year Country: Belgium, England, Finland, Italy, the Netherlands, Poland and Switzerland |
|
| Interventions |
Intervention arm: Integrating palliative care in long‐term care facilities 'PACE Steps to Success' PACE 6 Steps to Success Program ‐ multicomponent integrating basic non‐specialist palliative care. Train‐the‐Trainer approach (external trainer) trains staff in home over 1 year (each home had between 1 and 6 staff as the PACE co‐ordinator(s)). The 6 steps are 1) advance care planning with residents and families; 2) assessment, care planning and review of resident needs and problems; 3) co‐ordination of care via monthly multidisciplinary palliative care review meetings; 4) high‐quality care with a focus on pain and depression; 5) care in last days of life; and 6) care after death. Duration of the intervention: 12 months: the programme has 3 phases, implemented over a 12‐month period (2 months preparation, 6 months implementation of 6 steps, and 4 months consolidation with ongoing support where needed) Details of the intervention: see TIDieR checklist for full details of intervention (Appendix 2) Control arm: European nursing homes lack dedicated palliative care functions, specialist palliative care teams and a contact person who maintains regular contact with the resident and relatives. This information was obtained by surveying 322 nursing homes from Belgium, England, Finland, Italy, the Netherlands and Poland that were initially recruited (response rate 95%, questionnaire completed by nursing home administrator). EPOC category: co‐ordination of care (subcategory: Case management) Type of care: primary (palliative) care |
|
| Outcomes |
Time points: 13 and 17 months Primary outcomes: Resident outcomes: comfort in the last week of life reported by staff using the End‐of‐Life in Dementia Scale Comfort Assessment while dying (EOLD‐CAD) Staff outcomes: knowledge of palliative care, measured using the Knowledge Construct of the Palliative Care Survey Secondary outcomes: Resident and family outcomes: quality of care in the last month of life reported by staff using the Quality of Dying in Long Term Care (QOD‐LTC), Relatives’ perception of the quality of end‐of‐life care, measured using End‐of‐Life in Dementia–Satisfaction with Care (EOLD‐SWC), Family Perception of Physician‐Family Communication reported by relatives (FPPFC), quality of life EuroQol‐5D‐5L, costs (hospital admissions, visits of health care professionals, received intensive treatments like CPR or surgery (yes or no), intervention costs) Staff outcomes: staff self‐efficacy in communicating with residents and their families at the end of life (Self‐Efficacy in End‐of‐Life Care Survey S‐EOLC33), staff self‐perceived educational needs regarding communication and cultural and ethical values (End‐of‐Life Professional Caregiver Survey EPCS34), opinions on palliative care (Rotterdam Move 2PC35) Loss of clusters and individuals: 3 clusters from control group; 2 clusters from intervention group Adjusted for clustering for each outcome: yes Method of cluster adjustment for each outcome: linear mixed models (LMMs) to analyse continuous outcomes. These models accounted for the clustered study design (residents or measurement points nested within staff, staff nested within nursing home, nursing homes nested within country). For continuous measurements where the respondents were staff, LMMs were fitted with staff, nursing home and country as random factors (only random intercepts), and with group (intervention vs usual care), time (post‐intervention combining data collected between month 9 and month 17 vs baseline), and their interaction group × time as fixed factors. For continuous measurements where the respondents were relatives, similar LMMs were fitted, but without a random intercept for staff. ICC reported for each outcome: yes |
|
| Notes |
Outcomes used in this review:
Unit of analysis error: no Ethical approval and informed consent obtained: yes Funding source: European Union’s Seventh Framework Program (FP7/ 2007e2013) under grant agreement 603111 (PACE project Palliative Care for Older People), co‐funding by Polish Ministry of Science and Higher Education in the years 2014 to 2019 based on the decision no 3202/7PR/2014/2 (25 November 2014) and by the Swiss Academy of Medical Sciences in the years 2015 to 2017 Declarations of interest: none declared or detected Contact with author: yes Additional outcome data provided from author: yes, authors provided additional data on economic outcomes, description of usual care, recruitment bias and allocation concealment Trial registration: ISRCTN Identifier: ISRCTN14741671 Other: trial has strong focus on staff education and quality improvement (exclusion criteria). Considered eligible for this review as model of care included elements of care co‐ordination. |
|
| Risk of bias | ||
| Bias | Authors' judgement | Support for judgement |
| Random sequence generation (selection bias) | Low risk | “Randomisation was stratified by country and median number of beds in a 1:1 ratio using a computer‐generated random sequence…” |
| Allocation concealment (selection bias) | Low risk | "Randomisation was blinded and performed by independent statisticians". Further efforts to conceal allocation are not described in the manuscript. Email communication from authors: “The nursing homes were informed about being in the intervention or the control group immediately after the randomization and baseline measurements”. |
| Blinding of participants and personnel (performance bias) Outcomes reported in summary of findings table | High risk | Due to the nature of treatment, blinding of personnel or participants was not possible. This could have biased at least one of the outcomes included in this review (i.e. quality of life, family satisfaction). |
| Blinding of outcome assessment (detection bias) Outcomes reported in summary of findings table | High risk | "... due to the nature of the study design and the intervention, blinding of treatment allocation is not possible. The nurses and care assistants who fill in the questionnaires are aware of and are trained in delivering the intervention, which might affect their responses on the outcome measures (i.e. detection or ascertainment bias). However, in view of the need for evaluations related to the end of life of the nursing home residents of key persons involved in care such as nurses and care assistants, we deem their assessments of the primary outcome at the resident level an appropriate choice for the study." |
| Incomplete outcome data (attrition bias) All outcomes | Low risk | Loss to follow‐up and dropouts are clearly reported; no major differences between the intervention groups. |
| Selective reporting (reporting bias) | Low risk | All primary and secondary outcomes from the protocol are reported. |
| Other bias | Low risk | Recruitment bias: LOW ‐ all residents of recruited nursing homes received intervention (email communication from authors: "There was no further selection after randomization of nursing homes"). Baseline imbalance: LOW ‐ no relevant imbalances at baseline. Protection against contamination: LOW ‐ unlikely to be biased due to contamination/‘herd effects’ as the delivery of the intervention occurred as per RACF policy/practice and was not subject to participant choice or compliance. Incorrect analysis: LOW ‐ analyses appropriated adjusted for study design (clustering). No other sources of bias detected. |
Wu 2010.
| Study characteristics | ||
| Methods |
Aim of the study: to evaluate the clinical effectiveness of integrated interdisciplinary team care for severely disabled residents of long‐term care facilities, so to promote better quality of care in this setting Study design: cRCT Unit of randomisation: long‐term care facility Mean cluster size: 77 residents in total/7 facilities = 11 residents per cluster Unit of analyses: individual resident Sample size calculation: not reported |
|
| Participants |
Participants: residents of ACFs who are highly disabled Intervention group: n = 45 Control group: n = 32 Age: mean (SD) intervention/control 82.8 (8.0)/81.7 (8.8) Sex: proportion females intervention/control 55%/44% Comorbidities: all residents severely disabled (mean Barthel Index = 0; 100% had Karnofsky scale = 4) Stroke intervention/control 60%/63% Dementia intervention/control 24%/22% Other intervention/control 17%/16% Setting: long‐term care facility Country: Taiwan |
|
| Interventions |
Intervention arm: Multidisciplinary team care Integrated care model featuring a well‐organised multidisciplinary team that actively participated in residents’ daily care with on‐site staff of the RACFs. The multidisciplinary team comprises a geriatrician, nurses, physical therapists, dietitians and social workers, and is supported by a municipal hospital. The multidisciplinary team members actively visited the RACF residents monthly and participate in the monthly multidisciplinary team meeting with the staff of the RACF. Duration of the intervention: 12 months Details of the intervention: see TIDieR checklist for full details of intervention (Appendix 2) Control arm: participants were provided usual nursing and personal care with some professional care (i.e. physician, physical therapist and dietitian visits) when necessary EPOC category: co‐ordination of care (subcategory: Teams) Type of care: primary and secondary care |
|
| Outcomes |
Time points: 12 months Primary outcomes: unplanned feed tube replacement, unplanned urinary catheter replacement, ED visits, hospitalisations, incidence of urinary infections, pneumonia, and pressure sores Secondary outcomes: none Loss of clusters and individuals: no Adjusted for clustering for each outcome: no Method of cluster adjustment for each outcome: n/a, analyses were not adjusted for clustering ICC reported for each outcome: n/a, analyses were not adjusted for clustering |
|
| Notes |
Outcomes used in this review:
Unit of analysis error: yes Ethical approval and informed consent obtained: not reported Funding source: not reported Declarations of interest: none declared or detected Contact with author: no Additional outcome data provided from author: no Trial registration: not reported |
|
| Risk of bias | ||
| Bias | Authors' judgement | Support for judgement |
| Random sequence generation (selection bias) | Unclear risk | "... the enrolled institues were randomly assigned ..." Not clear how sequence was generated. |
| Allocation concealment (selection bias) | Low risk | Allocation concealment is not described. Allocation was done for all clusters at once, so allocation concealment is unlikely to be a source of bias. |
| Blinding of participants and personnel (performance bias) Outcomes reported in summary of findings table | High risk | Participants and personnel were not blinded, and some outcomes would likely be influenced by the lack of blinding (i.e. ED visits, adverse effects, any hospital admissions). |
| Blinding of outcome assessment (detection bias) Outcomes reported in summary of findings table | Low risk | Outcome assessors were not blinded, however it is unlikely that lack of blinding would influence assessment of the primary outcomes included in this review. |
| Incomplete outcome data (attrition bias) All outcomes | Low risk | No attrition reported; data provided for all subjects randomised. |
| Selective reporting (reporting bias) | Unclear risk | Protocol/trial registration are not available, so it is unclear whether all outcomes are reported. |
| Other bias | High risk | Recruitment bias: UNCLEAR ‐ not clear whether patient recruitment took place before or after the randomisation. Baseline imbalance: LOW ‐ patient characteristics are not different between the groups. Protection against contamination: LOW ‐ unlikely to be biased due to contamination/‘herd effects’ as the delivery of the intervention occurred as per RACF policy/practice and was not subject to participant choice or compliance Incorrect analyses: HIGH ‐ analyses not adjusted for study design (clustering). Other bias: reporting mistakes in Table 1. |
Zwijsen 2014.
| Study characteristics | ||
| Methods |
Aim of the study: To evaluate the effectiveness and cost‐effectiveness of a multidisciplinary care programme for managing behaviour problems in nursing home residents with dementia. It was hypothesised that the use of the care programme would lead to a decrease in challenging behaviour and in the prescription of psychoactive drugs without an increase in the use of restraints. Study design: stepped‐wedge cRCT Unit of randomisation: Dementia Special Care Unit (DSCU) (one DSCU per RACF) Mean cluster size: 29 residents Unit of analyses: individual resident Sample size calculation: The following assumptions were used in calculating the sample size. Dementia special care unit (DSCUs) house 20 residents on average, the prevalence of challenging behaviour is 80%, and the mean Cohen‐Mansfield Agitation Inventory (CMAI) score is 47.7. It was expected that 5% of the residents’ (legal) representatives would not agree with the resident being enrolled in the research project. In the event a resident died or moved away from the unit, the new resident who was admitted instead was enrolled in the study, so no further attrition was expected. The CMAI, as the primary outcome, was used to calculate the sample size. Based on an earlier study of Chenoweth in which training and support on person‐centred care was compared with dementia care mapping and usual care, it was expected that the Grip on Challenging Behaviour care programme would lead to a 10‐point decrease on the CMAI. Based on a recent Dutch study in nursing home residents, a mean intraclass correlation coefficient of 0.1 was assumed for clustering of challenging behaviour within a DSCU. Based on these assumptions and a significance level (a) of 0.05 (2‐ sided) and a power (b) of 0.80, at least 14 dementia DSCUs with 6 time measurements were needed in a stepped‐wedge design. Recruiting more than 14 DSCUs was preferred as the time frame of the project (20 months) might have led to some DSCUs dropping out because of unforeseen circumstances, such as staffing problems or renovations. |
|
| Participants |
Participants: residents and staff of dementia special care units Intervention/control group: In total, 659 unique residents participated in this study; 178 residents participated in all assessments. In total, 1441 questionnaires to staff of which 645 (380 unique staff members returned), of which 327 from intervention group and 318 from control group. Age: mean (SD) in all participants 84.0 (7.3) Sex: proportion females in all participants 70% Comorbidities: all residents had dementia Setting: Dementia special Care Unit (DSCUs) at RACF Country: the Netherlands |
|
| Interventions |
Intervention arm: Multidisciplinary team care A care programme consisting of various assessment procedures and tools, ensured a multidisciplinary approach and provided structure for the process of managing challenging behaviour in dementia. Evidence‐based care programme consisted of 4 steps:
Duration of the intervention: not clearly reported in the paper; the authors provided the following information via email: "The total study time was 20 months. The first 4 months all clusters were without intervention, at 4, 8, 12 and 16 months the clusters started the intervention and the 4 months all cluster were in the intervention‐condition." Details of the intervention: see TIDieR checklist for full details of intervention (Appendix 2) Control arm: not described EPOC category: co‐ordination of care (subcategory: Teams) Type of care: secondary dementia care |
|
| Outcomes |
Time points: 4, 8, 12, 16 and 20 months Primary outcomes: prevalence of behavioural problems (CMAI), agitation‐related behaviours on the NPI‐NH (the Neuropsychiatric Inventory for Nursing Homes (NPINH) Secondary outcomes: quality of life (EQ‐5D and the Dutch QUALIDEM), use of psychoactive drugs, use of restraints in the unit, burnout measured using the Dutch version of the Maslach Burnout Inventory (MBI), Job Satisfaction and Work and Time pressure sub‐scales of the Leiden Quality of Work Questionnaire for nurses, an adaptation of Leiden Quality of Work Questionnaire, resource use (costs of psychoactive drug use, costs of involvement of physicians and psychologists, the initial implementation costs for GRIP), cost‐effectiveness (ICER for CMAI and for QALYs) Loss of clusters and individuals: loss to follow‐up of one cluster (unit): moved to another location after T3. 659 unique individuals participated in the study. 178 participants participated in all assessments. Adjusted for clustering for each outcome: yes Method of cluster adjustment for each outcome: mixed model ICC reported for each outcome: no |
|
| Notes |
Outcomes used in this review:
Unit of analysis error: no Ethical approval and informed consent obtained: yes Funding source: the Netherlands Organisation for Health Research and Development (ZonMw) Declarations of interest: none declared or detected Contact with author: yes Additional outcome data provided from author: authors clarified details of economic and quality of life outcomes Trial registration: The Netherlands National Trial register: NTR 2141 |
|
| Risk of bias | ||
| Bias | Authors' judgement | Support for judgement |
| Random sequence generation (selection bias) | Low risk | "The participating care units were randomly divided into 5 groups by using random allocation software." |
| Allocation concealment (selection bias) | Low risk | Precisely how the units were allocated to the groups and who was in charge of the allocation is not described in the published text. "Units were assigned by random allocation software to 1 of 5 groups with different starting points for the implementation of the care program". Allocation was done for all clusters at once, so allocation concealment is unlikely to be a source of bias. |
| Blinding of participants and personnel (performance bias) Outcomes reported in summary of findings table | High risk | Participants and staff were not blinded, and some outcomes would likely be influenced by the lack of blinding (i.e. job satisfaction and burnout). |
| Blinding of outcome assessment (detection bias) Outcomes reported in summary of findings table | High risk | Self‐reported outcomes of interest (i.e. job satisfaction and burnout) were assessed by unblinded staff via questionnaire and could likely be influenced by lack of blinding. |
| Incomplete outcome data (attrition bias) All outcomes | Low risk | Loss to follow‐up of one cluster (unit): moved to another location after T3. 659 unique individuals participated in the study. 178 participants participated in all assessments. There was a similar loss to follow‐up at each stage of the study and the reasons for these losses are described. |
| Selective reporting (reporting bias) | Low risk | Trial is registered (NTR 2141). All primary outcomes are reported. Incomplete information on burnout and job satisfaction (not all time points reported). |
| Other bias | Unclear risk | Recruitment bias: LOW ‐ all residents with dementia were included in the study. Baseline imbalance: UNCLEAR ‐ baseline characteristics between intervention and control are not clearly reported. Protection against contamination: LOW ‐ unlikely to be biased due to contamination/‘herd effects’ as the delivery of the intervention occurred as per RACF policy/practice and was not subject to participant choice or compliance. Incorrect analysis: LOW ‐ analyses appropriated accounted for study design. No other sources of bias detected. |
ACF: aged care facility; ADL: activities of daily living; ASH: ambulatory sensitive hospitalisations; BMI: body mass index; C: control; CBT: cognitive behavioural therapy; CGA: comprehensive geriatric assessment; CI: confidence interval; COPD: chronic obstructive pulmonary disease; CPR: cardiopulmonary resuscitation; cRCT: cluster‐randomised controlled trial; DSCU: Dementia Special Care Unit; ED: emergency department; EHR: electronic health record; EOL: end of life; EOLD: End of Life in Dementia scale; EPOC: Cochrane Effective Practice and Organisation of Care; FCC: facilitated case conferencing; GNS: geriatric nurse specialist; GP: general practitioner; HRQoL: health‐related quality of life; I: intervention; IADL: instrumental activities of daily living; ICC: intra‐cluster correlation coefficient; IQR: interquartile range; IRR: incidence rate ratio; MD: mean difference; MDT: multidisciplinary team; MMSE: Mini‐Mental State Examination; n/a: not applicable; NCF: nursing care facility; NH: nursing home; NP: nurse practitioner; NPI‐NH: Neuropsychiatric Inventory ‐ Nursing Home version; NPS: neuropsychiatric symptoms; QALY: quality‐adjusted life year; QoL: quality of life; RACF: residential aged care facility; RAID: Rating Anxiety in Dementia scale; RCT: randomised controlled trial; REAP: regular early assessment post‐discharge; RN: registered nurse; RR: risk ratio; SD: standard deviation; SE: standard error; SEE: summary estimate of effect; SMD: standardised mean difference; UTI: urinary tract infection; WHO: World Health Organization
Characteristics of excluded studies [ordered by study ID]
| Study | Reason for exclusion |
|---|---|
| Abernethy 2006 | Wrong patient population |
| Aiken 2006 | Wrong setting |
| Allen 1986 | Wrong setting |
| Allen 2011 | Wrong setting |
| Allen 2012a | Wrong setting |
| Anderson 2008 | Wrong intervention |
| Anderson 2012 | Wrong intervention |
| Bakker 2011 | Wrong intervention |
| Bavelaar 2022 | Wrong intervention |
| Beland 2006 | Wrong setting |
| Bergh 2016 | Wrong intervention |
| Bloomfield 2022 | Wrong setting (retirement villages are not considered residential aged care but rather community‐dwelling older adults) |
| Bond 1989 | Wrong patient population |
| Bond 1989a | Wrong intervention |
| Bond 1990 | Wrong intervention |
| Boockvar 2015 | Wrong study design |
| Boockvar 2018 | Wrong intervention |
| Borbasi 2011 | Wrong study design |
| Boumans 2005 | Wrong intervention |
| Boumans 2008 | Wrong intervention |
| Bower 2011 | Wrong setting |
| Bruhmann 2019 | Wrong study design |
| Callegari 2022 | Wrong intervention |
| Camacho 2018 | Wrong setting |
| Cameron 2020 | Wrong study design |
| Carpenter 2021 | Wrong study design |
| Carpenter 2021a | Wrong study design |
| Cassel 2016 | Wrong setting |
| Catic 2014 | Wrong study design |
| Challis 2004 | Wrong intervention |
| Challis 2014 | Wrong study design |
| Chenoweth 2009 | Wrong intervention: quality improvement intervention |
| Chi 2004 | Wrong patient population |
| Christian 2020 | Wrong study design |
| Clarkson 2011 | Wrong setting |
| Connolly 2018 | Wrong study design |
| Davidson 2022 | Wrong intervention |
| Dobke 2008 | Wrong intervention |
| Dozeman 2011 | Wrong intervention |
| Duffy 2010 | Wrong setting |
| Eckermann 2019 | Wrong study design |
| ElBestawi 2018 | Wrong study design |
| Fan 2018 | Wrong study design |
| Farin‐Glattacker 2017 | Wrong study design |
| Feng 2018 | Wrong intervention |
| Fick 2000 | Wrong setting |
| Finnema 2005 | Wrong intervention |
| Frisoni 1998 | Wrong study design |
| Fukahori 2016 | Wrong study design |
| Galik 2021 | Wrong intervention |
| Garland 2022 | Wrong intervention |
| Garrard 1990 | Wrong study design |
| Gotze 2022 | Wrong intervention |
| Hakkaart‐van 2013 | Wrong setting |
| Holmkjaer 2021 | Wrong intervention |
| Huizing 2009 | Wrong intervention |
| Jeon 2015 | Wrong intervention |
| Junius‐Walker 2021 | Wrong intervention |
| Kane 1989 | Wrong intervention |
| Kane 2017 | Wrong intervention: focus on quality improvement, education and implementation |
| Kennedy 2015 | Wrong intervention |
| Konno 2014 | Wrong study design |
| Kosari 2021 | Wrong intervention |
| Kovach 1996 | Wrong intervention |
| Krichbaum 2000 | Wrong study design |
| Kruse 2013 | Wrong intervention |
| Lanzeta 2016 | Wrong setting |
| Ling 2019 | Wrong study design |
| Llewellyn‐Jones 1999 | Wrong setting |
| Logan 2021 | Wrong intervention |
| Long 2002 | Wrong patient population |
| Mangin 2021 | Wrong intervention |
| Manietta 2022 | Wrong study design |
| Marino 2016 | Wrong intervention |
| McCabe 2018 | Wrong intervention |
| Meltzer 2017 | Wrong setting |
| Moyo 2022 | Wrong intervention |
| Mudge 2012 | Wrong setting |
| Muller 2015 | Wrong study design |
| Ng 2022 | Wrong study design |
| Nord‐Trøndelag 2005 | Wrong intervention |
| Orrell 2007 | Wrong intervention |
| Ouslander 2011 | Wrong study design |
| Ouslander 2014 | Wrong intervention |
| Pantel 2018 | Wrong intervention |
| Peri 2020 | Wrong setting (retirement village is not considered part of residential care) |
| Peters 1987 | Wrong intervention |
| Pivodic 2021 | Wrong intervention |
| Pope 2011 | Wrong intervention |
| Rantz 2012 | Wrong intervention |
| Remsburg 1999 | Wrong intervention |
| Resnick 2021 | Wrong intervention |
| Roets‐Merken 2018 | Wrong intervention |
| Rolland 2020 | Wrong intervention |
| Rovner 1996 | Wrong intervention: focus on activity games (not primary or secondary care) and staff education |
| Ryden 1999 | Wrong study design |
| Ryden 2000 | Wrong intervention |
| Ryuichi 2021 | Wrong study design |
| Sadeq 2022 | Wrong study design |
| Sampson 2019 | Wrong intervention: focus on quality improvement and staff education |
| Sampson 2020 | Wrong intervention: focus on quality improvement and staff education |
| Santaeugenia 2017 | Wrong setting |
| Selbaek 2017 | Wrong intervention |
| Shores 2004 | Wrong study design |
| Shrapnel 2019 | Wrong study design |
| Simon 2020 | Wrong study design |
| Smeets 2021 | Wrong intervention |
| Snyder 1998 | Wrong study design |
| Sor‐Ost 2012 | Wrong intervention |
| Tchalla 2022 | Wrong study design |
| Tsai 2010 | Wrong study design |
| Tse 2012 | Wrong study design |
| Tse 2014 | Wrong study design |
| Valk‐Draad 2022 | Wrong study design |
| van de Ven 2013 | Wrong intervention: quality improvement intervention |
| van de Ven 2014 | Wrong intervention: quality improvement intervention |
| Vowden 2013 | Wrong intervention |
| Wang 2022 | Wrong intervention |
| Waterreus 1994 | Wrong setting |
| Watson 2004 | Wrong study design |
| Wauters 2021 | Wrong intervention |
| Weiner 2001 | Wrong study design |
| Whitaker 2014 | Wrong intervention |
| Yong 2022 | Wrong setting |
| Zúñiga 2019 | Wrong study design |
Characteristics of studies awaiting classification [ordered by study ID]
Bagaragaza 2021.
| Methods | Study design: stepped‐wedge cRCT |
| Participants | Residents of a nursing home, 60 years of age or older, who have been identified by the proactive identification guidance |
| Interventions |
Intervention arm: early integrated palliative approach model Control arm: presumably usual care, no details provided |
| Outcomes |
Primary outcome:
Secondary outcomes:
|
| Notes |
Contact information: Dr. Nathalie Bouscaren: nbouscaren@adc.asso.fr; Dr. Célia Broussard: cbroussard@adc.asso.fr Trial registration: NCT04708002 |
Bath 2001.
| Methods | Study design: full text could not be obtained. Details of the study are not available. |
| Participants | Full text could not be obtained. Details of the study are not available. |
| Interventions | Full text could not be obtained. Details of the study are not available. |
| Outcomes | Full text could not be obtained. Details of the study are not available. |
| Notes | Full text could not be obtained. Details of the study are not available. |
Palmer 2020.
| Methods | Study design: stepped‐wedge cRCT |
| Participants | Residents (> 60 years of age), staff member or family member of a resident at one of the participating Assisted Living/Personal Care Facilities |
| Interventions |
Intervention arm: the Engage Model is a chronic care approach to supportive hearing loss self‐management of ARHL. Engage includes (a) hearing screening for all residents, (b) an individualised communication plan for those with an identified hearing loss (e.g. one‐to‐one, group, telephone, television plans, hearing aid troubleshooting, communication strategies, etc.), (c) provision of simple, non‐custom amplifiers, (d) referral to audiology if needed, and (e) ongoing support provided by trained personnel (Communication Facilitator) under the supervision of the audiologist. Control arm: the Consult Model (i.e. usual care) is an acute care strategy, relying on a monthly audiologist visit to the facility |
| Outcomes |
Primary outcomes: satisfaction with social participation assessed through surveys; hearing‐specific health‐related quality of life assessed through surveys Secondary outcomes: family burden; staff satisfaction |
| Notes |
Contact information: Dr. Catherine Palmer: cvp@pitt.edu; Erin Gilchrist: EGG6@pitt.edu Trial registration: NCT04575051 |
Sillies 2022.
| Methods | Study design: RCT |
| Participants | (High level of care dependency: German grade 3) OR (medium level of care dependency: German grade 2) AND ((multimorbidity: 3 or more chronic illnesses) OR (at least 1 unplanned emergency service use: out‐of‐hour, emergency transport, emergency room or hospitalisation in the previous 8 weeks)) |
| Interventions |
Intervention arm: the intervention consists of the implementation of a role profile for nurses with expanded competencies in person‐centred care in long‐term care. Intervention components will be resident‐related and organisation‐related, like a comprehensive planning and evaluation of health care, structured conversations with residents and family, case conferences, geriatric assessments, implementation of the ISBAR system to improve communication between nursing staff and with other professionals. Control arm: nursing homes in the control group will receive a short workshop on person‐centred care for selected nurses. On the level of residents, no specific activities are planned. (Optimised usual care). |
| Outcomes |
Primary outcomes: hospital stays of nursing home residents (number, kind of admissions (elective versus unplanned), length of stay in days, reason for admission, initiation by whom, discharge diagnosis) will be copied from the digital resident record of nursing homes retrospectively at 3 time points Secondary outcomes: out‐of‐hours physician contacts (kind of contact (e.g. visits, telephone calls), reasons for initiation and initiator); emergency service use (number and kinds of services used, initiator, reason for contact), as documented in the residents’ record; health related quality of life (EuroQol 5‐dimension 5‐level (EQ‐5D‐5L)), as self‐reported by resident or proxy assessment by nursing staff. Proximal outcomes will be: symptom burden (four‐dimensional symptom questionnaire (4DSQ), self‐care in chronic diseases (LTCQ‐8‐G), and Person‐Centred Climate Questionnaire Patients (German version, PCP‐P‐G) as reported by resident (no proxy assessment); falls and fall‐related injuries, pressure ulcer category 2 or higher, incontinence associated dermatitis, potentially inappropriate medication (using PRISCUS criteria), contacts with general practitioners (kind of contact, e.g. telephone, fax, visit; reason, initiator, planned versus unplanned), all extracted from residents’ digital record. Further outcomes (safety, harms) will be: all‐cause mortality (date, reasons, t1 and t2 only), current level of care based on nursing care insurance act, extracted from residents’ digital record. Further outcomes on resource use will be: other health care utilisation data (based on FIMA Questionnaire), extracted from residents’ digital record. A process evaluation will address implementation, change mechanisms and contextual factors of the intervention using predominantly qualitative methods (interviews, focus groups, observations) with nurses, residents and family if applicable. |
| Notes |
Contact information: Katharina Silies: katharina.silies@uksh.de Trial registration: DRKS00028708 |
Umpierrez 2021.
| Methods | Study design: RCT |
| Participants | Males and females admitted to subacute and long‐term skilled nursing care facilities. Known history of T2D treated with insulin (glargine, detemir, degludec, NPH, premixed insulin) or sliding scale regular insulin or insulin secretagogues (sulfonylureas, repaglinide, nateglinide) with or without additional oral antidiabetic agents (alpha‐glucosidase inhibitors, thiazolidinedione, SGLT2‐inhibitors, DPP4‐inhibitors), short‐ and long‐acting GLP1‐RA (exenatide, liraglutide, dulaglutide, semaglutide). Patients with an expected long‐term care length of stay > 1 week. |
| Interventions |
Intervention arm: patients in the intervention CGM group will have a single daily fasting point of care (POC) testing and will wear a real‐time Dexcom G6 with GTS, and providers will adjust oral or insulin therapy based on continuous glucose monitoring with glucose telemetry system (CGM‐GTS) profile information. CGM sensor will be placed after consent. Glucose values obtained from the CGM sensor will be sent to the CGM transmitter by Bluetooth technology and DEXCOM Share2 software application to a smartphone that serves as an intermediate‐transmitting (routing) device. Glucose values from the smartphone will be transmitted wirelessly to a table computer (I‐Pad) using the DEXCOM Follow application. Information on the CGM will activate an alarm in case of hypoglycaemia or hyperglycaemia events. Hypoglycaemia alarm will be set to < 85 mg/dL (for prevention for low blood glucose levels). Nursing staff will be instructed to provide 15 grams of carbohydrates in response to a hypoglycaemia alarm. The hyperglycaemia alarm will be set at 300 mg/dL. If this occurs, the nursing staff will assess clinical status and perform a POC glucose testing to confirm glucose values. If BG > 300 mg/dL, nursing staff will communicate the high glucose value to the primary care team. Control arm: patients in the standard of care group will wear a blinded CGM and receive POC testing before meals and bedtime, with providers adjusting oral agents or insulin dose based on POC results. POC testing before meals and bedtime (standard of care). For the control group, participants will also get a CGM sensor (blinded CGM). CGM alarms are turned off, however if the POC is found to be between < 80 mg/dL by POC, 15 grams of carbohydrates will be given as a preventive measurement for hypoglycaemia (standard of care). |
| Outcomes |
Primary outcomes: number of events of hypoglycaemia < 70 mg/dL, number of events of clinically significant hypoglycaemia < 54 mg/dL, time in range (TIR) between 80 and 180 mg/dL Secondary outcomes: number of events of nocturnal hypoglycaemia < 70 mg/dL and < 54 mg/dL between POC testing group and CGM‐GTS group, number of hypoglycaemia events, time in hypoglycaemia (< 70 mg/dL) in minutes, time in hyperglycaemia (> 240 mg/dL) in minutes, number of prolonged hypoglycaemia > 1 and 2 hours by CGM, number of hypoglycaemia events during the day and night, time in hypoglycaemia (minutes), number of events of hyperglycaemia > 240 mg/dL, time in hyperglycaemia > 240 mg/dL (minutes), percentage of blood glucose readings within target of 70 and 180 mg/dL, glycaemic variability calculated by mean amplitude of glycaemic excursions (MAGE), number of sensors removed |
| Notes |
Contact information: Dr. Guillermo Umpierrez: geumpie@emory.edu; Saumeth Cardona: scardon@emory.edu Trial registration: NCT04818242 |
cRCT: cluster‐randomised controlled trial; RCT: randomised controlled trial
Characteristics of ongoing studies [ordered by study ID]
Brucken 2022.
| Study name | Optimal@NRW ‐ Optimised acute care of geriatric patients using an intersectoral telemedical cooperation network ‐ around the clock |
| Methods | Study design: stepped‐wedge cRCT |
| Participants | Residents of participating nursing homes (n = 25), age > 18, with valid health insurance status. Eligibility criteria for the participating nursing homes include the usage of the project’s own central electronic health record for documentation purposes and the use of the technical equipment provided. The technical requirements for the use of this equipment must be met (e.g. a wireless network connection). Due to the deployment of non‐physician practice assistants, a maximum travel time of approx. 45 min is another criterion for the selection of the participating nursing homes. |
| Interventions |
Intervention arm: Optimal@NRW The German healthcare system consists of outpatient care provided by the Association of Statutory Health Insurance Physicians (ASHIPs), emergency services and inpatient care (hospitals). All three columns of medical care (sectors) are organised and financed differently so that in practice these three sectors work mainly separately. Until today, intersectoral care has not yet been established in Germany. Optimal@NRW strives for an intersectoral form of care by introducing three levels of intervention in parallel within each cluster: 1) Implementation of a new telemedicine approach into the medical supply network by offering a “virtual hub,” which includes:
2) Opportunity of informed patient‐to‐physician communication by telemedical consultation:
3) Implementation of an early warning system in order to avoid critical health‐related situations:
Control arm: usual care EPOC category: Information and communication technology |
| Outcomes |
Outcomes for this review
Other outcomes
|
| Starting date | March 2021 |
| Contact information | Jörg Christian Brokmann: jbrokmann@ukaachen.de |
| Notes |
Trial registration: NCT04879537 Expected completion date: March 2023 |
Choi 2020.
| Study name | Validation of an integrated service model, Health‐RESPECT, for older patients in long‐term care institution using information and communication technologies: protocol of a cluster randomised controlled trial |
| Methods | Study design: cRCT |
| Participants | Older patients who 1) are over 65 years old, 2) are expected to stay in the facilities for at least 2 weeks at the point of observation/intervention and 3) have at least one or more chronic disease (hypertension, diabetes, heart failure and so on) |
| Interventions |
Intervention arm: Integrated service model Health‐RESPECT The interventions are comprised of
Control arm: usual care EPOC category: Co‐ordination of care |
| Outcomes |
Outcomes for this review: Quality of life, acute care hospital utilisation (unplanned hospitalisations), patient experience, health professional experience, economic effectiveness and cost‐effectiveness Other outcomes: Chronic disease management, inappropriate medications, overall functional status with a composite indicator, functional rehabilitation management, functional status with individual indicators, clinical usability, technology acceptability |
| Starting date | September 2019 |
| Contact information | Dr Kwang‐il Kim: kikim907@snu.ac.kr |
| Notes |
Trial registration: KCT0004360 Expected completion date: not reported |
Dantoine 2019.
| Study name | Impact of telemedicine on avoiding emergency hospital admissions and hospitalization for nursing home residents |
| Methods | Study design: RCT |
| Participants | 428 participants; males and females aged 60 years and older; resident in nursing homes, with multiple chronic diseases with at least 2 comorbidities Exclusion criteria: resident unaffiliated or not beneficiary of social security; resident with a life‐threatening disease |
| Interventions |
Intervention arm: telemedicine After an initial assessment, each participant is monitored by teleconsultation on 6 occasions over 12 months Control arm: usual care; patients with usual care have an initial and a 12‐month assessment EPOC category: Information and communication technology (ICT) |
| Outcomes |
Outcomes for this review: Hospitalisation and emergency hospital admissions: proportion of patients who had an admission to the emergency or unscheduled hospitalisation in health service or surgery, cost‐effectiveness of telemedicine based on the MAST model (Model of Assessment of Telemedicine) Other outcomes: No other outcomes |
| Starting date | July 2016 |
| Contact information | Dr. Thierry Dantoine, University Hospital, Limoges France, no email provided |
| Notes |
Trial registration: NCT02816177 Expected completion date: June 2019 |
Kaasalainen 2019.
| Study name | Strengthening a Palliative Approach in Long Term Care (SPA‐LTC) Program |
| Methods | Study design: stepped‐wedge RCT |
| Participants | English‐speaking LTC residents with a score of 50% or less on the Palliative Performance Scale |
| Interventions |
Intervention arm: Strengthening a Palliative Approach in Long Term Care (SPA‐LTC) Interdisciplinary champion teams (to provide leadership and support implementation); palliative care education (including illness trajectory pamphlets); comfort care rounds with staff (for capacity building and reflection); prognostic tools to trigger end‐of‐life discussions; palliative care conferences with families and residents; bereavement pamphlets; and post‐bereavement follow‐up for families and staff. Control arm: details not provided EPOC category: Co‐ordination of care |
| Outcomes | Outcomes for this review: number of emergency department visits in the resident's last year of life, number of hospital transfers per resident, bereaved family satisfaction with end of life care, staff perceptions of and experiences with end of life care, resident satisfaction with end of life care Other outcomes: family perceptions of end‐of‐life care, family experiences with end‐of‐life care, staff knowledge about a palliative approach to care, number of hospital deaths during the trial, resident perceptions of end‐of‐life care, fidelity of the intervention |
| Starting date | January 2022 |
| Contact information | Dr. Sharon Kaasalainen: kaasal@mcmaster.ca |
| Notes |
Trial registration: NCT03935997 Expected completion date: June 2024 |
Kapp 2022.
| Study name | Remote expert wound nurse consultation for healing of pressure injuries among residential aged care patients |
| Methods | Study design: cRCT |
| Participants | Residents of participating nursing homes (> 18) expected to be living in the home for the 12‐week intervention period, with one or more pressure injury |
| Interventions |
Intervention arm: consultation with a remote expert wound nurse
The intervention is “consultation”, which involves the provision of expert clinical advice, education and support to patients (in the case of this trial, specifically aged care residents), nurses, personal care workers and family members.
The intervention includes the development, facilitation, implementation and evaluation of care plans for residents. The speciality associated with the consultation is wound management and specifically, as applies to the trial, with a focus on the clinical issue of pressure injury. The content and outcomes of the consultation are based on the evidence and recommendations in the International Guideline (prevention and treatment of pressure ulcers/injuries in clinical practice https://www.internationalguideline.com) and are tailored according to the individual needs of the resident, local processes and the resources, skills and abilities of the nurses in the aged care settings who provide the direct care (wound management) to residents.
Recommendations that will be made by the Wound Management Clinical Nurse Consultants include wound dressing selection, pressure redistributing strategies (repositioning schedules and equipment to facilitate), skin care, activity and nutrition advice and referrals to allied health. Tailoring could include, for example, education to residents who have the capacity to understand (this education is not provided to residents who do not have capacity), care planning for residents to reposition their body themselves if physically able (care planning for health care providers to reposition if the resident is unable to reposition their body themselves), support of family members if engaged in the consultations (not provided if not engaged), wound dressing selection in line with individual resident characteristics including for example consideration of skin allergies.
The expected time commitment required by the participant to follow recommendations in between consultations will vary in line with the complexity of the pressure injury and the characterises of the resident. Wound treatment (cleaning and redressing the pressure injury) can take between 20 and 60 minutes. This time is time that the resident would usually spend having the dressing attended and is therefore not in addition to usual care time.
The “expert wound nurse” is one or more Wound Management Clinical Nurse Consultants (CNCs). These nurses usually have relevant post‐graduate qualifications (or are working toward) or relevant experience working in the field of wound management. In Victoria, these nurses are typically employed in a Grade 4 position.
“Remote” refers to the location of the CNC. The CNCs provide consultation from outside the resident's aged care facility (referred to as their home) in the trial.
The consultations occur via videoconferencing supplemented by the provision of pressure injury images. Images are taken by the treating nurse with an iPad or digital camera (facility owned and operated) immediately prior to the consultation and uploaded to a secure folder for access by project staff and the CNC. These images are then uploaded by the CNCs to an application that automatically calculates wound size and quantifies the healing rate.
Participation in the consultations occurs over 12 weeks and in the study 24 weeks. The consultations occur at baseline, 4, 8 and 12 weeks. For residents who have complex wounds (more severe pressure injuries), an additional consultation is provided at week 1 to provide for additional monitoring and reinforcement of wound management policies and procedures and trial processes. After the 12‐week consultation, the consultations cease and the status of the resident's pressure injury is checked at 24 weeks.
Consultations take between 30 and 60 minutes.
Nurses are provided with a clinical intervention manual (pdf file) to guide the consultation process. This manual was purposely designed for the study.
The intervention is personalised to the individual needs of the participants of the consultation.
No adaptation of the intervention is planned as the intervention was evaluated and was refined in a feasibility study prior to the commencement of the trial.
Intervention adherence is monitored via fidelity checking of the CNC consultation process and outcomes (trial CNCs independently consulting and comparisons made by a different CNC) as well as checking of the similarity of intended care plans for the pressure injuries and the actual/applied care plan (via unannounced on‐site checking of the dressings in use by the research team) in the participating homes. Control arm: usual care. The participating homes do employ in‐house CNCs. Nurses engage with external CNCs (via consultancy) as they deem necessary for individual residents. EPOC category: Information and communication technology |
| Outcomes |
Outcomes for this review: Patient satisfaction with nursing care quality (PSNCQ) survey and purpose designed questionnaire, quality of life (EQ5D 5L), cost of treatment and care, hospitalisations, deaths Other outcomes: Number of wounds healed (complete wound closure), wound healing rate, wound infection, time to healing |
| Starting date | September 2022 |
| Contact information | Dr Suzanne Kapp: suzanne.kapp@unimelb.edu.au |
| Notes |
Trial registration: ACTRN12622001180707 Expected completion date: June 2023 (end of data collection) |
Moore 2022.
| Study name | The effect of using telehealth to train residential aged care facility staff in delivery of palliative care to residents on the rate of unplanned hospitalisation admissions and quality of end‐of‐life care (IMPART) |
| Methods | Study design: stepped‐wedge cRCT |
| Participants | All residents living permanently in the participating RACFs will be eligible to take part in this research. Family members or friends of eligible residents, including families of residents who die during the study and wish to take part in the post‐death survey. GPs, RACF senior nurses and clinical care coordinators liaising with or working within the participating RACFs will be eligible to participate. |
| Interventions |
Intervention arm: "The IMPART intervention is actively implemented over a 6‐month period. There are 10 residential aged care facilities (RACFs) completing the stepped‐wedge trial. At the start of the trial all facilities will be randomised to receive the intervention at one of 5 steps with two RACFs actively implementing the intervention during each step. Therefore the trial will occur over 2.5 years (5 X 6‐month steps). The 6‐month intervention involves five components described in a manual to support facility staff to implement the intervention. If the intervention is successful, the manual will be made publicly available on the NARI website so that other facilities can implement the intervention and access the templates required. After each RACF completes their active 6‐month part of the intervention, the RACF will be able to use the knowledge, strategies and specialist connections and apply them for the subsequent 6‐month steps of the trial and into the future. For each active 6 ‐month intervention period, the specialist in‐reach support will be funded 0.1 EFT to support engagement with the facility. We will aim to hold meetings and workshops in person at the facility, however, we also aim to enable video‐conferencing to facilitate external staff involvement. COMPONENT 1: ESTABLISH PLANNING AHEAD TEAMS (Month 1) The research team will work collaboratively with the RACF to establish the facility ‘Planning Ahead Team’. The RACF will identify staff to be involved, which could include nurses with a portfolio of palliative care, clinical care coordinators, or staff who have an interest in end‐of‐life care. We will engage senior nurses as care champions who will be able to support other staff in palliative care discussions and processes. The lead of the Planning Ahead Team will support RACF staff and work with GPs to promote end‐of‐life discussions with residents and families, and document decision‐making. We aim to involve at least two RACF staff to maintain continuity. We will engage a GP who has an existing visiting role at the RACF. All Planning Ahead Team members will be invited to a 1‐hour workshop (registered with Continuing Professional Development points) covering goals of care facilitated by a palliative care consultant. COMPONENT 2: END‐OF‐LIFE CARE NEEDS ANALYSIS (Month 1) The Planning Ahead Team will undertake a needs analysis to identify areas for improvement in end‐of‐life care discussions, documentation and care provision. They will review current documentation in resident files using templates designed specifically for this study. Template 1 recommends reviewing 5‐10 resident files to evaluate the quality of end‐of‐life care planning documentation (what is documented, whether resident wishes are incorporated and whether it has been recently reviewed). A second template prompts evaluating documentation from 5‐10 residents who have died in the last 6 months. Questions include place of death, services involved, recognition of dying, whether end‐of‐life care was consistent with residents’ wishes and end‐of‐life planning documentation. These templates will help inform completion of the Needs Analysis Checklist that assess the extent to which each facility’s existing processes, policies and procedures enable shared‐decision making, person‐centred care and are responsive to cultural, language and spiritual requirements and values. This Checklist, designed specifically for this study, summarises overall RACF processes, policies and procedures. The Needs Analysis Checklist will be completed jointly by the Planning Ahead Team with support from the research team and input from the external palliative care and aged care specialists. The research team will invite the Planning Ahead Team to complete a survey assessing confidence in providing, discussing and planning for end‐of‐life care. This survey is based on existing end‐of‐life confidence measures. The research team will assess the availability and confidence of RACF staff in using end‐of‐life related equipment such as syringe drivers, lifting machines, pressure relieving devices or catheter equipment and the availability of medication related to end of life including Imprest stock. Planning Ahead Teams will explore opportunities for obtaining resident and family input on end‐of‐life care planning undertaken in the facility. They will also review documented complaints and complements to the facility and see whether any relate to end‐of‐life care. COMPONENT 3: WORKSHOP WITH PLANNING AHEAD TEAMS (Month 2) AND ACTION PLANNING (Months 2‐6) The research team will facilitate an initial workshop with the Planning Ahead Team. During this 1‐2‐hour workshop, the research team will present findings from the needs analysis, highlighting strengths and challenges in current end‐of‐life care practices. For instance, the research teams will synthesise data from the Needs Analysis Checklist and the staff survey to reflect on practice. This will provide a comprehensive understanding of the end‐of‐life care needs in the facility, incorporating views of RACF staff, external palliative care specialists and GPs. We will discuss avenues for addressing needs and develop an action plan using the Action Plan Template developed for this study. This approach aims to engage facility staff with areas of practice change that they have identified and consider relevant to their practice. During the workshop, future meetings and steps for the Planning Ahead Team will be planned to monitor the action plan and outcomes. Over the remaining 4 months of the intervention, the Planning Ahead Team will meet approximately once a month for 1‐hour to implement and review progress of the action plan. The external geriatric or palliative care specialist will contact the RACF Planning Ahead Team through a 30 minute monthly telephone/video call to discuss progress, challenges and offer information and training as needed. While developing the action plan, we will identify ways of involving residents and families in implementing the action plan, e.g. by including them in future discussions about end‐of‐life care processes. At the end of the 6 month intervention and to evaluate the impact of the action plan on practice, we will repeat some data collection. For example, repeating the review of resident files to see whether documentation has improved, repeat the staff end‐of‐life care survey or review policies, complaints and complements. COMPONENT 4: IMPETUS‐D PLUS ONLINE TRAINING (Months 2‐6) RACF staff will receive access to the existing ‘Improving Palliative care Education and Training Using Simulation in Dementia (IMPETUS‐D) validated online training package (Tropea J, et al. ...BMC Pall Care, 2019. 18(1): 86). During the workshop described in Component 3, the Planning Ahead Team will review the modules available in the IMPETUS‐D training set to identify which modules may be useful for staff in their facility. Depending on the goals identified in the action plan, they may choose training for all RACF staff or target training to specific staff, such as those in the Planning Ahead Team. It may be useful to use a section of a module or run a workshop/meeting to discuss a module and the implications for practice at that RACF. The research team will send reminders to the Planning Ahead Team to complete training as planned in the action plan. There are 11 modules that can be completed online using a computer/laptop, tablet or smartphone. Each module takes 15‐30mins and contains video simulation. Topics: recognising end of life; Goals of Care planning and discussions; distinguishing dementia from delirium, managing symptoms including pain, breathlessness, not eating/drinking, and terminal restlessness; communicating with residents and families, and supporting staff when a resident dies. The training was developed for end‐of‐life care for people with dementia but encompasses skills required for end‐of‐life care for all residents. The research team will highlight other resources that may address information needs. COMPONENT 5: SPECIALIST TELEHEALTH IN‐REACH END‐OF‐LIFE SUPPORT (Months 2‐6) Local palliative care and aged care specialists will be engaged from the start of the IMPART program through their involvement in the Planning Ahead Teams in Components 1 and 3. The workshops with the Planning Ahead Teams will help RACF staff get to know the specialist team, establish communication channels and plan for specialists to provide training or shadowing/observations using online technology. An approach could involve the Planning Ahead Team and the GP completing IMPETUS‐D modules and discussing this with the specialist team. This could be followed by a collaborative end‐of life discussion between the resident or family member(s) with RACF staff, the GP and the specialist clinician using telehealth. This will involve immediate feedback after the case conference from the specialist clinician. While the IMPETUS‐D training provides videos of professionals having these conversations, there may be additional benefits of getting direct feedback from an expert. We will use video‐conferencing to foster rapid communication between RACFs and specialists. FIDELITY TESTING Access to and completion of IMPETUS‐D modules is digitally recorded and matched to individual RACFs. A member of each Planning Ahead Team and their connected specialist service will maintain an activity log documenting time spent (to the nearest 15min) on different components of the intervention. The research team will make monthly calls to the RACF Planning Ahead Team and their specialist service to monitor progress with the intervention. We will collect completed Action Plans to monitor extent to which plans were developed and implemented and also monitor this via telephone calls with the Planning Ahead Team." Control arm: the intervention will be compared with usual care (control/waiting), this would include routine practice provided in residential aged care which could include advance care planning, goals of care and specialist residential care in‐reach EPOC category: Information and communication technology |
| Outcomes |
Outcomes for this review: Rate of unplanned hospitalisations per 1000 bed‐days, rate of emergency department presentations per 1000 bed‐days, length of stay in days of unplanned hospital admissions per 1000 bed‐days, cost‐effectiveness, satisfaction with care at end of life survey with family members of residents who die during the trial period Other outcomes: ICECAP‐Supportive Care Measure completed by resident or proxy (family or staff), Comfort Assessment in Dying (CAD) survey with family members of residents who die during the trial period, ICECAP ‐ Close Person Measure with family members of residents who die during the trial period |
| Starting date | July 2022 |
| Contact information | Prof Kwang Lim: kwang.lim@mh.org.au A/Prof Kirsten Moore, k.moore@nari.edu.au |
| Notes |
Trial registration: ACTRN12622000760774 Expected completion date: December 2024 (end data collection) |
Muller 2020.
| Study name | Effects of strategies to improve general practitioner‐nurse collaboration and communication in regard to hospital admissions of nursing home residents (interprof ACT) |
| Methods | Study design: cRCT |
| Participants | 34 nursing homes in the cities and catchment areas of Hamburg. Authors aim to recruit 20 NH residents in each nursing home to form a cluster. A total of 680 NH residents will be enrolled in this trial. NH residents inclusion: at least one GP contact in recent 3 months or 2 GP contacts in recent 6 months or admission to the nursing home during the precedent 6 months independently of documented GP contacts; at least 18 years of age; written informed consent by the resident or her/his legal guardian NH residents NH residents exclusion: admission for short‐term care only |
| Interventions |
Intervention arm: the interprof ACT intervention The interprof ACT intervention package: use of name badges worn by GPs and nurses during the GPs’ visits; appointment of a contact person: nursing homes appoint one registered nurse for each unit and GPs one member of their practice staff; mandatory availability: for each of the appointed contact persons via phone and fax (use of a interprof ACT standardised fax sheet); standardised procedures for GPs’ home visits; support in assigning pro re nata medication: forms including details on symptoms or side effects, dosage and maximum daily dose; meetings for shared goal setting: therapy goals specific to each NHR will be approved and documented by all involved parties (e.g. GPs, NHRs, nurses and if desired relatives) in regular intervals (quarterly). Control arm: care of nursing home residents as usual EPOC category: Co‐ordination of care |
| Outcomes |
Outcomes for this review: Cumulative incidence of hospitalisation within 12 months, admissions to hospital, days admitted to hospital, use of other medical services, quality of life, health economic evaluation Other outcomes: Prevalence of potentially inappropriate medication |
| Starting date | February 2018 |
| Contact information | Christiane Mueller: christiane.mueller@med.uni‐goettingen.de |
| Notes |
Trial registration: NCT03426475 Expected completion date: May 2020 |
Papaioannou 2021.
| Study name | PREVENT (Person‐centered Routine Fracture PrEVENTion in LTC) |
| Methods | Study design: cRCT |
| Participants | Residents in both profit and non‐profit long‐term care homes in Ontario and Alberta. Homes must have a minimum of 70 residents to participate; there is no maximum home size for participation. |
| Interventions |
Intervention arm: PREVENT programme A standardised PREVENT educational programme will be offered to each intervention LTC home and healthcare staff. The curricula include video modules with fracture‐prevention care recommendations and an orientation to the Fracture Prevention Toolkit. Using the Fracture Risk Scale (i.e. a clinical decision support tool embedded in the RAI‐MDS 2.0), the LTC team will identify residents at high‐risk for fracture and will implement the fracture prevention recommendations into care plans on an individual resident basis. Control arm: residents in homes allocated to the control group will receive usual care as provided within their home EPOC category: Co‐ordination of care |
| Outcomes |
Outcomes for this review: Number of hospital transfers (emergency department and admissions), number of deaths, change in number of falls, change in health‐related quality of life Other outcomes: Number of hip‐fractures, number of non‐hip fractures (wrist, spine, pelvis, humerus), change in level of pain, change in mobility, change in responsive behaviours, change in medications and supplements |
| Starting date | January 2023 |
| Contact information | Alexandra Papaioannou: papaioannou@mcmaster.ca |
| Notes |
Trial registration: NCT04947722 Expected completion date: March 2024 |
Piau 2018.
| Study name | Telemedicine for the management of neuropsychiatric symptoms in long‐term care facilities: the DETECT study, methods of a cluster randomised controlled trial to assess feasibility. |
| Methods | Study design: cRCT |
| Participants | 200 participants; Inclusion criteria: male and female patients aged 65 or more, with dementia diagnosed by a specialist or the general practitioner; patient presenting with a disruptive NPS as defined in French Haute Autorité de Santé (HAS) recommendations (2009), that requires a specialist consultation based on the LTCF staff judgement; informed and written consent by the patient or the legal representative or the reliable person when appropriate; general practitioner agreement Exclusion criteria: patient's life expectancy less than 6 months; non‐agreement of study participation of patients or legal representative or the reliable person when appropriate |
| Interventions |
Intervention arm: Psycho‐behavioural care by telemedicine A TM consultation is planned in the following 72 hours after a patient presents disruptive neuropsychiatric symptoms. During this tele‐expertise consultation, both the LTC facility and Memory Clinic medical and nursing staff participate. The session is led by a geriatrician trained in NPS management along with the geriatric department nurses. Control arm: usual care EPOC category: Information and communication technology |
| Outcomes |
Outcomes for this review: Health costs, patient’s QoL Other outcomes: Acceptability of telemedicine among the LTC facility staff, rate of hospitalisations and consultations due to disruptive NPS, psychotropic drug use, as collected on the basis of the last medical prescription, estimation of the cluster effect ("design effect") in both groups |
| Starting date | June 2015 |
| Contact information | Dr Antoine Piau: piau.a@chu‐toulouse.fr |
| Notes |
Trial registration: NCT0247 2015 Expected completion date: November 2021 |
Sourdet 2018.
| Study name | The impact of telemedicine to support palliative care resident in nursing home |
| Methods | Study design: RCT |
| Participants | 1170 participants; male and females; age: 65 years and older Inclusion criteria: residents with palliative care needs: diagnosis of advanced or terminal disease (advanced cancer, advanced congestive heart failure, end‐stage pulmonary disease, end‐stage hepatic disease, end‐stage neurologic disease, other end‐stage medical diagnosis); ≥ 1 unplanned acute hospital episodes within the past 6 months; activity of daily life ≤ 1 or bed/chair‐ridden residents for at least 30 days; weight loss ≥ 10% of body weight in the last 6 months; the "surprise question" approach: "Would I be surprised if this patient died within the next 6‐12 months?" Informed and written consent by the patient or the legal representative or the reliable person when appropriate. General Practitioner agreement. Exclusion criteria: no agreement of study participation of patients or legal representative or a reliable person when appropriate |
| Interventions |
Intervention arm: Telemedicine to support palliative care Every patient identified as belonging to palliative care after the inclusion criteria will receive intervention with a follow‐up with telemedicine consultation: establishment of an initial multiprofessional telemedicine consultation involving a palliative care physician and/or geriatrician, and other physician co‐ordinator of nursing homes, health care team and if possible the patient's treating physician (patient and/or family may participate if they want to); the aim is to define and formalise: aid to collection and application of advanced directives according to Leonetti act if the resident is able to do so, or collection of confidence personal choices; definition of the objectives of care and patient's life and therapeutic adaptation with a focus on pain and uncomfortable symptoms; access to a mobile team of palliative care or geriatric hospitalisation at home, a hospice network, if the patient's situation requires. In case of medical worsening: possibility of access to consultations and use of emergency by tele‐expertise or decision support within a maximum period of 72 hours, with the same objectives as above. Control arm: usual palliative care (residents in the control group will receive usual palliative care usually delivered in their nursing homes, according to the habits of the healthcare team and their physician) EPOC category: Information and communication technology |
| Outcomes |
Outcomes for this review: Evaluation of tele‐expertise effectiveness on hospitalisation rates: proportion of subject hospitalised at least one time during follow‐up period, Evaluation of tele‐expertise effectiveness on emergency: emergency hospitalisation rates with proportion of subject hospitalised in emergency at least one time during follow‐up period; patient quality of life assessed by Palliative Care Outcome Scale (PCOS); caregivers satisfaction assessed through a satisfaction survey; economical evaluation: evaluation of taking care costs with french social security scheme data Other outcomes: Evaluation of tele‐expertise effectiveness on last 15 days of life hospitalisation rates: proportion of subject hospitalised in the last 15 days of life at least one time during follow‐up period |
| Starting date | April 2018 |
| Contact information | Dr. Sandrine Sourdet, MD University Hospital of Toulouse, Bordeaux, France, no email provided |
| Notes |
Trial registration: NCT02821143 Expected completion date: December 2018 |
Spichiger 2021.
| Study name | Improving caring quality for people with dementia in nursing homes using IPOS‐Dem |
| Methods | Study design: stepped‐wedge cRCT |
| Participants | People with dementia living in the nursing home and nursing home frontline staff |
| Interventions |
Intervention arm: During the intervention, IPOS‐Dem observations from frontline staff and family members will be discussed during case studies. Each case study will include a 15‐ to 30‐min group discussion about the symptoms and concerns rated with the IPOS‐Dem instrument. Systematic case studies in nursing homes led by an intervention nurse will be encouraged. The intervention aims to reinforce the IPOS‐Dem care process changes identified by Ellis‐Smith (2018): (a) facilitated communication and collaboration among staff and family, (b) facilitated internal communication, (c) facilitated communication with external healthcare professionals and (d) care planning and changes to care provision. Case studies will follow the completed IPOS‐Dem instrument structure. The IPOS‐Dem instrument structure enables a systematic approach to discuss and reflect on the concrete issues of caring for PWD, despite the nursing homes’ differing local conditions. The local clinical champion will implement on‐site activities (i.e. extending invitations to family members, preparing case studies and recording changes to care plans). An intervention nurse will lead moderation and deliberation during the case studies. The intervention nurse will be an advanced practice nurse with a PhD and expertise in chronic, palliative and dementia care. Frontline staff, the local clinical champion and family members will receive training (described later) to be sufficiently prepared for the case studies. On‐duty frontline staff and available family members will be present during these group case studies at the respective nursing home. The intervention nurse will lead the case studies monthly across rotating shift patterns for 12, 9 or 6 months, depending on randomisation. The presence of staff and family members, the environment, and notes and resources (e.g. separate room and flip‐chart) will be adjusted according to the local conditions and regulations in the participating nursing homes. Family members are invited to attend in groups if they wish to. But they attend only the case study for their relative living in the nursing home. The intervention fidelity and adherence will be assessed using memos recorded by the intervention nurse. Control arm: usual care EPOC category: Co‐ordination of care |
| Outcomes |
Outcomes for this review: quality of life (QUALIDEM) Other outcomes: symptoms and concerns measured with the IPOS‐Dem |
| Starting date | Not reported |
| Contact information | Frank Spichiger: frank.spichiger@hefr.ch |
| Notes |
Trial registration: DRKS00022339 Estimated completion date: not reported |
Sunner 2020.
| Study name | PACE‐IT: a stepped wedge cluster randomised controlled trial evaluating the implementation of telehealth visual assessment in emergency care for people living in residential aged care facilities |
| Methods | Study design: stepped‐wedge cRCT |
| Participants | Residents of RACFs and their family who have participated in a visual telehealth ACE call |
| Interventions |
Intervention arm: Telehealth visual assessment in emergency care Existing Aged Care Emergency (ACE)/Agedcare Services in Emergency Team (ASET) models will be strengthened and augmented with a novel Telehealth video linked interactive visual assessment and follow‐up phone call. This approach adds visual assessment capability and increases engagement and information exchange with residents, Residential Aged Care Facility (RACF) staff and families, if present. A video assessment and information sharing protocol will be initiated if a medical situation presents using the following steps: 1) Initial phone call or text from RACF to ACE/ASET nurse to log a request for consultation, 2) Log requires provision of demographic and other relevant clinical data, 3) ACE/ASET nurse responds with appointment for telehealth consultation, 4) Telehealth video call from ACE/ASET nurse to RACF staff involving interactive visual assessment of the resident and shared decision‐making, with involvement of resident, staff and family members if present, 5) If the resident is not transferred to ED or admitted to hospital a follow‐up phone call from the ACE/ASET nurse to RACF 24 hours post consultation will be attended to identify what alternative non hospital services were accessed and what treatment was delivered, and any adverse events, 6) An electronic GP communication will be generated to summarise the reason for and outcome of the consultation. Control arm: usual care EPOC category: Information and communication technology |
| Outcomes |
Outcomes for this review: ED presentations, adverse events, ACE/ASET and RACF staff acceptability and engagement 3 months post intervention, RACF staff perceptions of VTC usability survey within 48 h of participating in a VTCl, residents and family experiences, cost‐consequence analysis Other outcomes: No other outcomes |
| Starting date | February 2020 |
| Contact information | Ms. Carla Sunner: Carla.sunner@health.nsw.gov.au; Carla.sunner@uon.edu.au |
| Notes |
Trial registration: ACTR N12619001692123 Expected completion date: July 2021 |
Tchalla 2019.
| Study name | Evaluation of the impact of a telemedicine device (DTM) on the prevention of emergency department visits and hospitalisations of nursing home residents aged polypathological (GERONTACCESS) |
| Methods | Study design: RCT |
| Participants | 428 participants; male and females aged 60 years and older Inclusion criteria: resident in one of 9 nursing homes participating in the project; resident polypathology ‐ has at least 2 comorbidities; having made no request to change place of residence at the time of the inclusion visit; having given free consent, informed writing and signed by himself and/or his legal representative Exclusion criteria: unaffiliated resident or non‐receiving of social security; severe pathology(ies) involving life‐threatening in the short term; resident whose return home, transfer to another nursing home or to a long‐term care unit is programmed |
| Interventions |
Intervention arm: telemedicine to prevent ED visits and hospitalisations Initiation of tele‐medical consultation with the resident, a caregiver for the nursing home, the referring physician and geriatrician tele‐expert. After an overall geriatric assessment in nursing home, the first teleconsultation is organised within 10 days. Subsequent visits are scheduled every 3 months for 12 months. Spontaneous visits can be requested at the initiative of the referring physician. Control arm: routine care without telemedecine EPOC category: Information and communication technology |
| Outcomes |
Outcomes for this review: Evaluation of telemedicine on prevention in old and polypathological patients: proportion of patients with emergency admission or unscheduled hospitalisation in medical or surgical service over 12 months, medico‐economic impact: cost‐effectiveness of the telemedicine device impact on overall health: number of emergency admissions, number of readmissions, number of days of hospitalisation, number of medical consultations, impact on the quality of life (EQ5D questionnaire), impact on mortality: proportion of patients who died at 12 months Other outcomes: Impact on recurring hospitalisations: number of readmissions |
| Starting date | November 2015 |
| Contact information | Prof. Achille Tchalla, University Hospital, Limoges, France, no email provided |
| Notes |
Trial registration: NCT04008472 Expected completion date: May 2019 |
Tesky 2019.
| Study name | Depression in the nursing home: Using a stepped collaborative care model to improve treatment (DAVOS: Depression im Altenpflegeheim: Verbesserung der Behandlung durch ein gestuftes kollaboratives Versorgungsmodell). |
| Methods | Study design: stepped‐wedge cRCT |
| Participants | It is planned to initially approach 1250 nursing home residents older than 60 years and without obvious signs of dementia, addictive disorder or another severe mental illness. Of this initial group, it is expected to include 380 participants, of which approx. 125 have depressive symptoms. |
| Interventions |
Intervention arm: case management programme The intervention is initiated by a screening applied to the participating residents using a modified version of the Depression Monitoring List (DeMoL) with integrated Patient Health Questionnaire (PHQ‐D) assessment. The screening is performed by the depression case manager or by other members of the nursing staff under the supervision of the case manager. In case of positive screening, the participant is referred to a psychotherapeutic consultation hour (in German: Psychotherapeutische Sprechstunde) in accordance with §92, paragraph 6a, German Social Code (in German: Sozialgesetzbuch), during which a board‐licensed psychological psychotherapist will provide a diagnostic assessment (according to ICD 10 criteria). As part of DAVOS, the psychotherapeutic consultation hour will be implemented as an “in house” service in the nursing home; this is an innovative approach compared with the usual practice in the German healthcare system. The assessment in the psychotherapeutic consultation hour will conclude with recommendations for several interventions that are elaborated in accordance with the German S3 guideline and the National Disease Management Guideline on Uni‐polar Depression and are part of three interventional modules. Ranging from “watchful waiting”, participation in basic intervention (module 1), and a recommendation for psychotherapy (module 3) to the involvement of the general practitioner or a specialist physician (e.g. psychiatrist) (module 2), the measures will cover a wide spectrum of possible interventions:
The training for case managers will include the following 4 elements: 1) communication of basic medical psychological information on late‐life depression, 2) use of the screening instrument, 3) information on how to deal with residents with depression, and 4) the organisation of project‐related requirements. Case managers will be supervised throughout the study. Control arm: during the waiting control phases, patients receive “usual care”. Additional information from authors: care as usual means treatment of depressive symptoms like it is "normal" in the nursing home at the moment. Consultation of the family doctors, psychiatrists or neurologist in case of depressive symptoms. These doctors are doing regular home visits and could prescribe antidepressants if necessary. The patients can also take advantage of psychotherapy if they can leave the nursing home for their home. If they are immobile, it is not possible to get psychotherapy in the nursing home. EPOC category: Co‐ordination of care |
| Outcomes |
Outcomes for this review: type, frequency and duration of hospitalisations, quality of life measured by World Health Organization Quality of Life, short form (WHOQoL Old) Other outcomes: prevalence of depression, dysthymia and adjustment disorders measured with Structured Clinical Interview (SCID‐I), severity of depression symptoms measured with geriatric depression scale (GDS), functional status (instrumental activities of daily living using Late Life Function and Disability Instrument, short form (SF‐LLFDI)), social participation using Social and Emotional Loneliness Scale ‐ short form |
| Starting date | December 2018 |
| Contact information | Dr. Valentina Tesky: tesky@allgemeinmedizin.uni‐frankfurt.de Authors responded in May 2022; trial is delayed due to COVID pandemic. Authors provided unpublished data on quality of life measured with WHOQoL Old. |
| Notes |
Trial registration: DRKS00015686 Expected completion date: March 2021 |
cRCT: cluster‐randomised controlled trial; ECG: electrocardiogram; EPOC: Cochrane Effective Practice and Organisation of Care; GP: general practitioner; ICU: intensive care unit; IV: intravenous; LTC: long‐term care; NH: nursing home; NHR: nursing home resident; NPS: neuropsychiatric symptoms; QoL: quality of life; RACF: residential aged care facility; RCT: randomised controlled trial
Differences between protocol and review
We appraised health economics studies using the Consensus Health Economic Criteria (CHEC) list (Evers 2005) instead of the Consolidated Health Economic Evaluation Reporting Standards (CHEERS).
In our published protocol we pre‐specified our outcomes of interest. In our review we noted that study authors used different ways to present outcome data (e.g. number of residents with at least one ED visit and mean number of visits per resident), both within and across studies. While we presented the findings and the certainty of the evidence for all of the analyses, we selected one analysis per outcome as a primary analysis, based on the outcome with the most evidence (most number of studies).
In our published protocol we stated that we would conduct a sensitivity analysis based on the re‐analysis of cluster‐RCTs to appropriately account for within‐cluster correlation. In our review, we have either used the data adjusted for clustering as provided by the study authors or we have adjusted the coefficients provided by the study authors (using ICC 0.05 or ICC provided by the study authors for the specific outcome). Thus, the main analysis presented the data appropriately adjusted for clustering and there was no need for additional sensitivity analysis.
In our published protocol we stated that where cluster‐randomised trials were included in the meta‐analysis, we would use the generic inverse variance method in Review Manager to combine the data. As our analyses combined individual and cluster‐randomised studies, we have instead first adjusted the study data for clustering (where needed) and then included it in analysis using inverse variance.
In our published protocol, we did not specify the rate ratio as a measure of treatment effect. We have now added that for rate data (e.g. number of events in a period of time) we have used the rate ratio, which compares the rate of events in the two groups by dividing one by the other. The natural logarithms of the rate ratios were combined across studies using the generic inverse variance method.
We made an a posteriori decision on rules for judgement of imprecision (we have not specified a specific rule in the published protocol). In order to be consistent with our judgement, we used the following rules when deciding whether or not to downgrade for imprecision:
If the CI includes no effect AND appreciable harm/benefit, we conclude that there is serious imprecision. RR < 0.75 or RR > 1.25 are interpreted as appreciable harm or benefit.
If the CI does not include 'no effect', we calculate the sample size that would be needed for an adequately powered individual study. If the number of participants exceeds this number, precision is sufficient.
If the CI includes no effect and NO appreciable harm/benefit, we calculate the sample size that would be needed for an adequately powered individual study. If the number of participants exceeds this number, precision is sufficient.
Contributions of authors
Conceived the protocol and review: DOC, PP, RB
Designed the review: PP, LG, DOC, RB
Co‐ordinated the review: PP
Led the writing of the review: PP, LG
Screened titles for inclusion: PP, LG, HR, AL
Data extraction, risk of bias assessment: PP, LG, HR, AL
Provided advice on statistical analyses: AG
Provided advice on analyses of economic evidence: JK
Graded the evidence: PP, LG
Provided critical feedback on drafts of the protocol and review: DOC, RB, MM, DP, JK
Secured funding for the review: RB
Performed previous work that was the foundation of the current study: PP, DOC, RB
Sources of support
Internal sources
No sources of support provided
External sources
-
NHMRC Partnership Centre for Health System Sustainability (Grant ID: 9100002), Australia
Along with the NHMRC, the funding partners in this research collaboration are: BUPA Health Foundation; NSW Health; Department of Health, Western Australia; and The University of Notre Dame Australia.
Declarations of interest
Polina Putrik: none
Liesl Grobler: LG is an associate editor with Cochrane EPOC but was not involved in editorial decisions for this review.
Aislinn Lalor: none
Helen Ramsay: none
Alexandra Gorelik: none
Jonathan Karnon: none
Deborah Parker: none
Mark Morgan: none
Rachelle Buchbinder: none
Denise O'Connor: DOC is an editor with Cochrane EPOC but was not involved in editorial decisions for this review.
New
References
References to studies included in this review
Agar 2017 {published data only}
- Agar M, Beattie E, Luckett T, Phillips J, Luscombe G, Goodall S, Mitchell G, Pond D, Davidson PM, Chenoweth L. Pragmatic cluster randomised controlled trial of facilitated family case conferencing compared with usual care for improving end of life care and outcomes in nursing home residents with advanced dementia and their families: the IDEAL study protocol. BMC Palliat Care 2015;14:63. [DOI: 10.1186/s12904-015-0061-8] [DOI] [PMC free article] [PubMed] [Google Scholar]
- Agar M, Luckett T, Luscombe G, Phillips J, Beattie E, Pond D, et al. Effects of facilitated family case conferencing for advanced dementia: A cluster randomised clinical trial. PLOS One 2017;12(8):e0181020. [DOI: 10.1371/journal.pone.0181020] [DOI] [PMC free article] [PubMed] [Google Scholar]
Arendts 2018 {published data only}
- Arendts G, Deas P, O’Brien K, Etherton-Beer C, Howard K, Lewin G, et al. A clinical trial of nurse practitioner care in residential aged care facilities. Archives of Gerontology and Geriatrics 2018;77:129-32. [DOI: ] [DOI] [PubMed] [Google Scholar]
- Arendts G, Etherton-Beer C, Howard K, Lewin G, Sim M, Pickstock S, et al. Nurse led care coordination: trial protocol and development of a best practice resource guide for a cluster controlled clinical trial in Australian aged care facilities. Archives of Gerontology and Geriatrics 2014;58:15-9. [DOI: 10.1016/j.archger.2013.07.004] [DOI] [PubMed] [Google Scholar]
- Arendts G. Impact of nurse practitioner care in residential aged care facilities on ED transfers: a randomised trial. In: ACEM 2018 ASM “On the Edge” 35th Annual Scientific Meeting, Perth, Western Australia. 18–22 November 2018. [DOI: 10.1111/1742-6723.13239] [DOI]
Bellantonio 2008 {published data only}
- Bellantonio S, Kenny AM, Fortinsky RH, Kleppinger A, Robison J, Gruman C, et al. Efficacy of a geriatrics team intervention for residents in dementia-specific assisted living facilities: effect on unanticipated transitions. Journal of the American Geriatric Society 2008;56(3):523-8. [DOI: 10.1111/j.1532-5415.2007.01591.x] [DOI] [PubMed] [Google Scholar]
Boorsma 2011a {published data only}
- Boorsma M, Frijters DH, Knol DL, Ribbe ME, Nijpels G, Hout HPJ. Effects of multidisciplinary integrated care on quality of care in residential care facilities for elderly people: a cluster randomized trial. CMAJ 2011;183(11):E724-32. [DOI] [PMC free article] [PubMed] [Google Scholar]
- Boorsma M, Hout HPJ, Frijters DH, Ribbe MW, Nijpels G. The cost-effectiveness of a new disease management model for frail elderly living in homes for the elderly, design of a cluster randomized controlled clinical trial. BMC Health Services Research 2008;8:142. [DOI: 10.1186/1472-6963-8-143] [DOI] [PMC free article] [PubMed] [Google Scholar]
- MacNeil Vroomen JL, Boorsma M, Bosmans JE, Frijters DHM, Nijpels G, Hout HPJ. Is it time for a change? A cost-effectiveness analysis comparing a multidisciplinary integrated care model for residential homes to usual care. PLOS One 2012;7(5):e37444. [DOI: 10.1371/journal.pone.0037444] [DOI] [PMC free article] [PubMed] [Google Scholar]
Boyd 2014 {published data only}
- Boyd M, Armstrong D, Parker J, Pilcher C, Zhou L, McKenzie-Green B, et al. Do gerontology nurse specialists make a difference in hospitalization of long-term care residents? Results of a randomized comparison trial. Journal of the American Geriatrics Society 2014;62(10):1962-7. [DOI] [PubMed] [Google Scholar]
Brodaty 2003 {published data only}
- Brodaty H, Draper BM, Millar J, Low LF, Lie D, Sharah S, et al. Randomized controlled trial of different models of care for nursing home residents with dementia complicated by depression or psychosis. Journal of Clinical Psychiatry 2003;64:1. [DOI: 10.4088/jcp.v64n0113] [DOI] [PubMed] [Google Scholar]
Cavalieri 1993 {published data only}
- Cavalieri TA, Chopra A, Gray-Miceli D, Shreve S, Waxman H, Forman LJ. Geriatric assessment teams in nursing homes: do they work? Journal of the American Osteopathic Association 1993;93(12):1269-72. [PMID: ] [PubMed] [Google Scholar]
Chapman 2007 {published data only}
- Chapman D, Toseland RW. Effectiveness of advanced illness care teams for nursing home residents with dementia. Social Work 2007;52(4):321-9. [DOI: 10.1093/sw/52.4.321] [DOI] [PubMed] [Google Scholar]
Connolly 2015 {published data only}
- Connolly MJ, Boyd M, Broad JB, Kerse N, Lumley T, Whitehead N, et al. The Aged Residential Care Healthcare Utilization Study (ARCHUS): a multidisciplinary, cluster randomized controlled trial designed to reduce acute avoidable hospitalizations from long-term care facilities. Journal of the American Medical Directors Association 2015;16(1):49-55. [DOI] [PubMed] [Google Scholar]
Cordato 2018 {published data only}
- Cordato NJ, Kearns M, Smerdely P, Seeher KM, Gardiner MD, Brodaty H. Management of nursing home residents following acute hospitalization: efficacy of the “Regular Early Assessment Post-Discharge (REAP)” intervention. JAMDA 2018;19(3):276. [DOI: 10.1016/j.jamda.2017.12.008] [DOI] [PubMed] [Google Scholar]
Crotty 2004 {published data only}
- Crotty M, Halbert J, Rowett D, Giles L, Birks R, Williams H, Whitehead C. An outreach geriatric medication advisory service in residential aged care: a randomised controlled trial of case conferencing. Age & Ageing 2004;33(6):612-7. [DOI: 10.1093/ageing/afh213] [DOI] [PubMed] [Google Scholar]
Crotty 2019 {published data only}
- Crotty M, Killington M, Liu E, Cameron ID, Kurrle S, Kaambwa B, et al. Should we provide outreach rehabilitation to very old people living in nursing care facilities after a hip fracture? A randomised controlled trial. Age & Ageing 2019;48(3):373-80. [DOI: 10.1093/ageing/afz005] [DOI] [PMC free article] [PubMed] [Google Scholar]
- Killington M, Davies O, Crotty M, Crane R, Pratt N, Mills K, et al. People living in nursing care facilities who are ambulant and fracture their hips: description of usual care and an alternative rehabilitation pathway. BMC Geriatrics 2020;20(1):128. [DOI: 10.1186/s12877-019-1321-x] [DOI] [PMC free article] [PubMed] [Google Scholar]
De Luca 2016 {published data only}
- De Luca R, Bramanti A, De Cola MC, Trifiletti A, Tomasello P, Torrisi M, et al. Tele-health-care in the elderly living in nursing home: the first Sicilian multimodal approach. Aging-Clinical & Experimental Research 2016;28(4):753-9. [DOI: 10.1007/s40520-015-0463-8] [DOI] [PubMed] [Google Scholar]
Dy 2013 {published data only}
- Dy P, Morin PC, Weinstock RS. Use of telemedicine to improve glycemic management in a skilled nursing facility: a pilot study. Telemedicine Journal and e-Health 2013;19(8):643-5. [DOI: 10.1089/tmj.2012.0274] [DOI] [PubMed] [Google Scholar]
Forbat 2020 {published data only}
- Forbat L, Liu WM, Koerner J, Lam L, Samara J, Chapman M, et al. Reducing time in acute hospitals: a stepped-wedge randomised control trial of a specialist palliative care intervention in residential care homes. Palliative Medicine 2020;34(5):571-9. [DOI] [PubMed] [Google Scholar]
- Liu WM, Koerner J, Lam L, Johnston N, Samara J, Chapman M, et al. Improved quality of death and dying in care homes: a palliative care stepped wedge randomized control trial in Australia. Journal of the American Geriatrics Society 2020;68(2):305-12. [DOI: 10.1111/jgs.16192] [DOI] [PubMed] [Google Scholar]
Grabowski 2014 {published data only}
- Grabowski DC, O'Malley AJ. Use of telemedicine can reduce hospitalizations of nursing home residents and generate savings for medicare. Health Aff (Millwood) 2014;33(2):244-50. [DOI: 10.1377/hlthaff.2013.0922] [DOI] [PubMed] [Google Scholar]
Haines 2020 {published data only}
- Haines TP, Palmer AJ, Tierney P, Si L, Robinson AL. A new model of care and in-house general practitioners for residential aged care facilities: a stepped wedge, cluster randomised trial. Medical Journal of Australia 2020;212(9):409-15. [DOI: 10.5694/mja2.50565] [DOI] [PubMed] [Google Scholar]
- Si L, Robinson A, Haines TP, Tierney P, Palmer AJ. Cost analysis of employing general practitioners within residential aged care facilities based on a prospective, stepped-wedge, cluster randomised trial. BMC Health Services Research 2022;22:374. [DOI: 10.1186/s12913-022-07766-0] [DOI] [PMC free article] [PubMed] [Google Scholar]
Harvey 2014 {published data only}
- Harvey P, Storer M, Berlowitz DJ, Jackson B, Hutchinson A, Lim WK. Feasibility and impact of a post-discharge geriatric evaluation and management service for patients from residential care: the Residential Care Intervention Program in the Elderly (RECIPE). BMC Geriatrics Apr 2014;14:48. [DOI: 10.1186/1471-2318-14-48] [DOI] [PMC free article] [PubMed] [Google Scholar]
Kim 2020 {published data only}
- Kim H, Jung YI, Kim GS, Choi H, Park YH. Effectiveness of a technology-enhanced integrated care model for frail older people: a stepped-wedge cluster randomized trial in nursing homes. Gerontologist 2020;61(3):460-9. [DOI: 10.1093/geront/gnaa090] [DOI] [PMC free article] [PubMed] [Google Scholar]
- Kim H, Park YH, Jung YI, Choi H, Lee S, Kim GS, et al. Erratum to: Evaluation of a technology-enhanced integrated care model for frail older persons: protocol of the SPEC study, a stepped-wedge cluster randomized trial in nursing homes. BMC Geriatrics 2017;17(1):106. [DOI: 10.1186/s12877-017-0495-3] [DOI] [PMC free article] [PubMed] [Google Scholar]
- Kim H, Park YH, Jung YI, Choi H, Lee S, Kim GS, et al. Evaluation of a technology-enhanced integrated care model for frail older persons: protocol of the SPEC study, a stepped-wedge cluster randomized trial in nursing homes. BMC Geriatrics 2017;17(1):88. [DOI: 10.1186/s12877-017-0459-7] [DOI] [PMC free article] [PubMed] [Google Scholar]
Kolcu 2020 {published data only}
- Kolcu M, Ergun A. Effect of a nurse-led hypertension management program on quality of life, medication adherence and hypertension management in older adults: a randomized controlled trial. Geriatrics & Gerontology International 2020;20(12):1182-9. [DOI: 10.1111/ggi.14068] [DOI] [PubMed] [Google Scholar]
Kotynia‐English 2005 {published data only}
- Kotynia-English R, McGowan H, Almeida OP. A randomized trial of early psychiatric intervention in residential care: impact on health outcomes. International Psychogeriatrics 2005;17(3):475-85. [DOI: 10.1017/S1041610205001572] [DOI] [PubMed] [Google Scholar]
Kovach 2006 {published data only}
- Kovach CR, Logan BR, Noonan PE, Schlidt AM, Smerz J, Simpson M, et al. Effects of the Serial Trial Intervention on discomfort and behavior of nursing home residents with dementia. American Journal of Alzheimer's Disease and Other Dementias 2006;21(3):147-55. [DOI: 10.1177/1533317506288949] [DOI] [PMC free article] [PubMed] [Google Scholar]
Leontjevas 2013 {published data only}
- Gerritsen DL, Smalbrugge M, Teerenstra S, Leontjevas R, Adang EM, Vernooij-Dassen MJ, et al. Act in case of depression: the evaluation of a care program to improve the detection and treatment of depression in nursing homes. Study Protocol. BMC Psychiatry 2011;11:91. [DOI: 10.1186/1471-244X-11-91] [DOI] [PMC free article] [PubMed] [Google Scholar]
- Leontjevas R, Gerritsen DL, Koopmans RTCM, Smalbrugge M, Vernooij-Dassen MJFJ. Process evaluation to explore internal and external validity of the "Act in Case of Depression" care program in nursing homes. Journal of the American Medical Directors Association 2012;13(5):488.e1-e8. [DOI: 10.1016/j.jamda.2012.03.006] [DOI] [PubMed] [Google Scholar]
- Leontjevas R, Gerritsen DL, Smalbrugge M, Teerenstra S, Vernooij-Dassen MJ, Koopmans, RT. A structural multidisciplinary approach to depression management in nursing-home residents: a multicentre, stepped-wedge cluster-randomised trial. Lancet 2013;381(9885):2255-64. [DOI: 10.1016/S0140-6736(13)60590-5] [DOI] [PubMed] [Google Scholar]
- Leontjevas R, Hooijschuur L, Smalbrugge M, Koopmans RTCM, Gerritsen D. Specific components of a complex depression care program can affect staff outcomes differently: post-hoc analyses of a stepped-wedge cluster-randomized trial in nursing homes. International Psychogeriatrics 2020;32(3):371-80. [DOI: 10.1017/S1041610219002151] [DOI] [PubMed] [Google Scholar]
- Leontjevas R, Teerenstra S, Smalbrugge M, Vernooij-Dassen MJFJ, Bohlmeijer ET, Gerritsen DL, et al. More insight into the concept of apathy: a multidisciplinary depression management program has different effects on depressive symptoms and on apathy in nursing homes. International Psychogeriatrics 2013;25:S74. [DOI: 10.1017/S1041610213002159] [DOI] [PubMed] [Google Scholar]
Lichtwarck 2018 {published data only}
- Lichtwarck B, Myhre J, Goyal AR, Rokstad AMM, Selbaek G, Kirkevold O, et al. Experiences of nursing home staff using the targeted interdisciplinary model for evaluation and treatment of neuropsychiatric symptoms (TIME) - a qualitative study. Aging & Mental Health 2019;28(8):966-75. [DOI: 10.1080/13607863.2018.1464116] [DOI] [PubMed] [Google Scholar]
- Lichtwarck B, Selbaek G, Kirkevold O, Rokstad AM, Benth JS, Myhre J et al. TIME - Targeted interdisciplinary model for evaluation and treatment of neuropsychiatric symptoms: protocol for an effectiveness-implementation cluster randomized hybrid trial. BMC Psychiatry 2016;16:233. [DOI: 10.1186/s12888-016-0944-0] [DOI] [PMC free article] [PubMed] [Google Scholar]
- Lichtwarck B, Selbaek G, Kirkevold O, Rokstad AMM, Benth JS, Lindstrom JC et al. Targeted interdisciplinary model for evaluation and treatment of neuropsychiatric symptoms: a cluster randomized controlled trial. American Journal of Geriatric Psychiatry 2018;26(1):25-38. [DOI: 10.1016/j.jagp.2017.05.015] [DOI] [PubMed] [Google Scholar]
Lin 2010 {published data only}
- Lin WY, Huang HY, Liu CS, Li CI, Lee SD, Lin CC, et al. A hospital-based multidisciplinary approach improves nutritional status of the elderly living in long-term care facilities in middle Taiwan. Archives of Gerontology & Geriatrics 2010;Suppl 1:S22-6. [DOI: 10.1016/S0167-4943(10)70007-8] [DOI] [PubMed] [Google Scholar]
Lin 2014 {published data only}
- Lin KH, Chen CH, Chen YY, Huang WT, Lai JS, Yu SM, et al. Bidirectional and multi-user telerehabilitation system: clinical effect on balance, functional activity, and satisfaction in patients with chronic stroke living in long-term care facilities. Sensors 2014;14(7):12451-66. [DOI: 10.3390/s140712451] [DOI] [PMC free article] [PubMed] [Google Scholar]
Loeb 2005 {published data only}
- Loeb M, Brazil K, Lohfeld L, McGeer A, Simor A, Stevenson K, et al. Effect of a multifaceted intervention on number of antimicrobial prescriptions for suspected urinary tract infections in residents of nursing homes: cluster randomised controlled trial. BMJ 2005;331(7518):669. [DOI: 10.1136/bmj.38602.586343.55] [DOI] [PMC free article] [PubMed] [Google Scholar]
Loeb 2006 {published data only}
- Loeb M, Carusone SC, Goeree R, Walter SD, Brazil K, Krueger P, et al. Effect of a clinical pathway to reduce hospitalizations in nursing home residents with pneumonia: a randomized controlled trial. JAMA 2006;295(21):2503-10. [DOI: 10.1001/jama.295.21.2503] [DOI] [PubMed] [Google Scholar]
Man 2020 {published data only}
- Holloway EE, Constantinou M, Xie J, Fenwick EK, Finkelstein EA, Man REK, et al. Improving eye care in residential aged care facilities using the Residential Ocular Care (ROC) model: study protocol for a multicentered, prospective, customized, and cluster randomized controlled trial in Australia. Trials 2018;19(1):650. [DOI: 10.1186/s13063-018-3025-5] [DOI] [PMC free article] [PubMed] [Google Scholar]
- Man REK, Gan ATL, Constantinou M, Fenwick EK, Holloway E, Finkelstein EA, et al. Effectiveness of an innovative and comprehensive eye care model for individuals in residential care facilities: results of the residential ocular care (ROC) multicentred randomised controlled trial. British Journal of Ophthalmology 2020;104(11):1585-90. [DOI: 10.1136/bjophthalmol-2019-315620] [DOI] [PubMed] [Google Scholar]
McSweeney 2012 {published data only}
- McSweeney K, Jeffreys A, Griffith J, Plakiotis C, Kharsas R, O'Connor DW. Specialist mental health consultation for depression in Australian aged care residents with dementia: a cluster randomized trial. International Journal of Geriatric Psychiatry 2012;27(11):1163-71. [DOI: 10.1002/gps.3762] [DOI] [PubMed] [Google Scholar]
Neyens 2009 {published data only}
- Neyens JC, Dijcks BP, Twisk J, Schols JM, Haastregt JC, den Heuvel WJ, et al. A multifactorial intervention for the prevention of falls in psychogeriatric nursing home patients, a randomised controlled trial (RCT). Age & Ageing 2009;38(2):194-9. [DOI: 10.1093/ageing/afn297] [DOI] [PubMed] [Google Scholar]
Pieper 2016 {published data only}
- Klapwijk MS, Caljouw MAA, Pieper MJC, Putter H, Steen JT, Achterberg WP. Change in quality of life after a multidisciplinary intervention for people with dementia: a cluster randomized controlled trial. International Journal of Geriatric Psychiatry 2018;33(9):1213-19. [DOI: 10.1002/gps.4912] [DOI] [PubMed] [Google Scholar]
- Pieper MJ, Achterberg WP, Francke AL, Steen JT, Scherder EJ, Kovach CR. The implementation of the serial trial intervention for pain and challenging behaviour in advanced dementia patients (STA OP!): a clustered randomized controlled trial. BMC Geriatrics 2011;11:12. [DOI: 10.1186/1471-2318-11-12] [DOI] [PMC free article] [PubMed] [Google Scholar]
- Pieper MJ, Francke AL, Steen JT, Scherder EJ, Twisk JW, Kovach CR, et al. Effects of a stepwise multidisciplinary intervention for challenging behavior in advanced dementia: a cluster randomized controlled trial. Journal of the American Geriatrics Society 2016;64(2):261-9. [DOI: 10.1111/jgs.13868] [DOI] [PubMed] [Google Scholar]
- Pieper MJ, Francke AL, Steen JT, Scherder EJ, Twisk JW, Kovach CR, et al. [Effects of a stepwise approach to behavioural problems in dementia: a cluster randomised controlled trial] [Stapsgewijze aanpak van probleemgedrag bij dementie*: een clustergerandomiseerde gecontroleerde trial]. Nederlands Tijdschrift voor Geneeskunde 2016;160:D409. [https://www.ntvg.nl/artikelen/stapsgewijze-aanpak-van-probleemgedrag-bij-dementie] [PubMed] [Google Scholar]
- Pieper MJC, Achterberg WP, Steen JT, Francke AL. Implementation of a stepwise, multidisciplinary intervention for pain and challenging behaviour in dementia (STA OP!): a process evaluation. International Journal of Integrated Care 2018;18(3):15. [DOI: 10.5334/ijic.3973] [DOI] [PMC free article] [PubMed] [Google Scholar]
- Pieper MJC, Steen JT, Francke AL, Scherder EJA, Twisk JWR, Achterberg WP. Effects on pain of a stepwise multidisciplinary intervention (STA OP!) that targets pain and behavior in advanced dementia: a cluster randomized controlled trial. Palliative Medicine 2018;32(3):682-92. [DOI: 10.1177/0269216316689237] [DOI] [PubMed] [Google Scholar]
Rubenstein 1990 {published data only}
- Rubenstein LZ, Robbins AS, Josephson KR, Schulman BL, Osterweil D. The value of assessing falls in an elderly population. A randomized clinical trial. Annals of Internal Medicine 1990;113(4):308-16. [DOI: 10.7326/0003-4819-113-4-308] [DOI] [PubMed] [Google Scholar]
Rutten 2022 {published data only}
- Rutten J, Buul LW, Smalbrugge M, Geerlings SE, Gerritsen DL, Natsch S, et al. An electronic health record integrated decision tool and supportive interventions to improve antibiotic prescribing for urinary tract infections in nursing homes: a cluster randomized controlled trial. Journal of the American Medical Directors Association 2022;23(3):387-93. [DOI: 10.1016/j.jamda.2021.11.010] [DOI] [PubMed] [Google Scholar]
- Rutten JJS, Buul LW, Smalbrugge M, Geerlings SE, Gerritsen DL, Natsch S, et al. Antibiotic prescribing and non-prescribing in nursing home residents with signs and symptoms ascribed to urinary tract infection (ANNA): study protocol for a cluster randomized controlled trial. BMC Geriatrics 2020;20(1):341. [DOI: 10.1186/s12877-020-01662-0] [DOI] [PMC free article] [PubMed] [Google Scholar]
Stern 2014 {published data only}
- Stern A, Mitsakakis N, Paulden M, Alibhai S, Wong J, Tomlinson G, et al. Pressure ulcer multidisciplinary teams via telemedicine: a pragmatic cluster randomized stepped wedge trial in long term care. BMC Health Services Research 2014;14:83. [DOI: 10.1186/1472-6963-14-83] [DOI] [PMC free article] [PubMed] [Google Scholar]
Temkin‐Greener 2018 {published data only}
- Temkin-Greener H, Mukamel DB, Ladd H, Ladwig S, Caprio TV, Norton SA, et al. Impact of nursing home palliative care teams on end-of-life outcomes: a randomized controlled trial. Medical Care 2018;56(1):11-8. [DOI: 10.1097/MLR.0000000000000835] [DOI] [PubMed] [Google Scholar]
Uy 2008 {published data only}
- Uy C, Kurrle SE, Cameron ID. Inpatient multidisciplinary rehabilitation after hip fracture for residents of nursing homes: a randomised trial. Australasian Journal on Ageing 2008;27(1):43-4. [DOI: 10.1111/j.1741-6612.2007.00277.x] [DOI] [PubMed] [Google Scholar]
Van den Block 2020 {published data only}
- Honinx E, Smets T, Piers R, Pasman HRW, Payne SA, Szczerbinska K, et al. Lack of effect of a multicomponent palliative care program for nursing home residents on hospital use in the last month of life and on place of death: a secondary analysis of a multicountry cluster randomized control trial. Journal of the American Medical Directors Association 2020;21(12):1973-78.e2. [DOI: 10.1016/j.jamda.2020.05.003] [DOI] [PubMed] [Google Scholar]
- Oosterveld-Vlug M, Onwuteaka-Philipsen B, Ten Koppel M, Hout H, Smets T, Pivodic, et al. Evaluating the implementation of the PACE Steps to Success Programme in long-term care facilities in seven countries according to the RE-AIM framework. Implementation Science 2019;14(1):107. [DOI: 10.1186/s13012-019-0953-8] [DOI] [PMC free article] [PubMed] [Google Scholar]
- Smets T, Onwuteaka-Philipsen BBD, Miranda R, Pivodic L, Tanghe M, Hout H, et al. Integrating palliative care in long-term care facilities across Europe (PACE): protocol of a cluster randomized controlled trial of the 'PACE Steps to Success' intervention in seven countries. BMC Palliative Care 2018;17(1):47. [DOI: 10.1186/s12904-018-0297-1] [DOI] [PMC free article] [PubMed] [Google Scholar]
- Van den Block L, Honinx E, Pivodic L, Miranda R, Onwuteaka-Philipsen BD, Hout H, et al, Pace trial group. Evaluation of a palliative care program for nursing homes in 7 countries: the PACE cluster-randomized clinical trial. JAMA Internal Medicine 2020;180(2):233-42. [DOI: 10.1001/jamainternmed.2019.5349] [DOI] [PMC free article] [PubMed] [Google Scholar]
- Wichmann AB, Adang EMM, Vissers KCP, Szczerbinska K, Kylanen M, Payne S, et al. Decreased costs and retained QoL due to the 'PACE Steps to Success' intervention in LTCFs: cost-effectiveness analysis of a randomized controlled trial. BMC Medicine 2020;18(1):258. [DOI: 10.1186/s12916-020-01720-9] [DOI] [PMC free article] [PubMed] [Google Scholar]
Wu 2010 {published data only}
- Wu MP, Lin PF, Lin KJ, Sun RS, Yu WR, Peng LN, et al. Integrated care for severely disabled long-term care facility residents: is it better? Archives of Gerontology and Geriatrics 2010;50(3):315-8. [DOI: 10.1016/j.archger.2009.05.004] [DOI] [PubMed] [Google Scholar]
Zwijsen 2014 {published data only}
- Zwijsen S, Hertogh C, Smalbrugge M, Gerritsen D, Eefsting J, Margriet Pot A. Grip on challenging behaviour: effects of a structured multidisciplinary care program for management of challenging behaviour on dementia special care units. International Psychogeriatrics 2013;25:S65‐6. [DOI: 10.1017/S1041610213002147] [DOI] [Google Scholar]
- Zwijsen SA, Bosmans JE, Gerritsen DL, Pot AM, Hertogh CM, Smalbrugge M. The cost-effectiveness of grip on challenging behaviour: an economic evaluation of a care programme for managing challenging behaviour. International Journal of Geriatric Psychiatry 2016;31(6):567-74. [DOI: 10.1002/gps.4360] [DOI] [PubMed] [Google Scholar]
- Zwijsen SA, Gerritsen DL, Eefsting JA, Smalbrugge M, Hertogh CM, Pot AM. Coming to grips with challenging behaviour: a cluster randomised controlled trial on the effects of a new care programme for challenging behaviour on burnout, job satisfaction and job demands of care staff on dementia special care units. International Journal of Nursing Studies 2015;52(1):68-74. [DOI: 10.1016/j.ijnurstu.2014.10.003] [DOI] [PubMed] [Google Scholar]
- Zwijsen SA, Smalbrugge M, Eefsting JA, Gerritsen DL, Hertogh CM, Pot AM. Grip on challenging behavior: process evaluation of the implementation of a care program. Trials 2014;15:302. [DOI: 10.1186/1745-6215-15-302] [DOI] [PMC free article] [PubMed] [Google Scholar]
- Zwijsen SA, Smalbrugge M, Eefsting JA, Twisk JWR, Gerritsen DL, Pot AM, et al. Coming to grips with challenging behavior: a cluster randomized controlled trial on the effects of a multidisciplinary care program for challenging behavior in dementia. Journal of the American Medical Directors Association 2014;15(7):531.e1-e10. [DOI: 10.1016/j.jamda.2014.04.007] [DOI] [PubMed] [Google Scholar]
- Zwijsen SA, Smalbrugge M, Zuidema SU, Koopmans RT, Bosmans JE, Tulder MW, et al. Grip on challenging behaviour: a multidisciplinary care programme for managing behavioural problems in nursing home residents with dementia. Study protocol. BMC Health Services Research 2011;11:41. [DOI: 10.1186/1472-6963-11-41] [DOI] [PMC free article] [PubMed] [Google Scholar]
References to studies excluded from this review
Abernethy 2006 {published data only}
- Abernethy AP, Currow DC, Hunt R, Williams H, Roder-Allen G, Rowett D, et al. A pragmatic 2 x 2 x 2 factorial cluster randomized controlled trial of educational outreach visiting and case conferencing in palliative care-methodology of the Palliative Care Trial [ISRCTN 81117481]. Contemporary Clinical Trials 2006;27:83-100. [DOI] [PubMed] [Google Scholar]
Aiken 2006 {published data only}
- Aiken L S, Butner J, Lockhart C A, Volk-Craft B E, Hamilton G, Williams FG. Outcome evaluation of a randomized trial of the PhoenixCare intervention: program of case management and coordinated care for the seriously chronically ill. Journal of Palliative Medicine 2006;9:111-26. [DOI] [PubMed] [Google Scholar]
Allen 1986 {published data only}
- Allen C M, Becker PM, McVey LJ, Saltz C, Feussner JR, Cohen HJ. A randomized, controlled clinical trial of a geriatric consultation team. Compliance with recommendations. JAMA 1986;255:2617-21. [PubMed] [Google Scholar]
Allen 2011 {published data only}
- Allen KR, Hazelett SE, Jarjoura D, Wright K, Fosnight SM, Kropp DJ, et al. The after discharge care management of low income frail elderly (AD-LIFE) randomized trial: theoretical framework and study design. Population Health Management 2011;14:137-42. [DOI] [PMC free article] [PubMed] [Google Scholar]
Allen 2012a {published data only}
- Allen KR, Hazelett SE, Radwany S, Ertle D, Fosnight SM, Moore PS. The promoting effective advance care for elders (PEACE) randomized pilot study: theoretical framework and study design. Population Health Management 2012;15:71-7. [DOI] [PubMed] [Google Scholar]
Anderson 2008 {published data only}
- Anderson AA. CONNECT for quality: a study to reduce falls in nursing homes. https://clinicaltrials.gov/show/NCT00636675 2008.
Anderson 2012 {published data only}
- Anderson RA, Corazzini K, Porter K, Daily K, McDaniel RR Jr, Colon-Emeric C. CONNECT for quality: protocol of a cluster randomized controlled trial to improve fall prevention in nursing homes. Implementation Science 2012;7:11. [DOI] [PMC free article] [PubMed] [Google Scholar]
Bakker 2011 {published data only}
- Bakker TJ, Duivenvoorden HJ, Lee J, Olde Rikkert MG, Beekman AT, Ribbe MW. Integrative psychotherapeutic nursing home program to reduce multiple psychiatric symptoms of cognitively impaired patients and caregiver burden: randomized controlled trial. American Journal of Geriatric Psychiatry 2011;19:507-20. [DOI] [PubMed] [Google Scholar]
Bavelaar 2022 {published data only}
- Bavelaar L, Visser M, Schlicksupp P, Tilburgs B, Maaden T, Achterberg WP, et al. Change in advance care plans of nursing home residents with dementia and pneumonia: secondary analysis of randomized controlled trial data. Journal of the American Medical Directors Association 2022;23(10):1741.e19-26. [DOI] [PubMed] [Google Scholar]
Beland 2006 {published data only}
- Beland F, Bergman H, Lebel P, Dallaire L, Fletcher J, Contandriopoulos AP, et al. Integrated services for frail elders (SIPA): a trial of a model for Canada. Canadian Journal on Aging 2006;25:5-42. [PubMed] [Google Scholar]
Bergh 2016 {published data only}
- Bergh S. Targeted interdisciplinary model for evaluation and treatment of neuropscyhiatric symptoms. https://clinicaltrials.gov/show/NCT02655003 2016.
Bloomfield 2022 {published data only}
- Bloomfield K, Wu Z, Broad JB, Tatton A, Calvert C, Hikaka J, et al. Learning from a multidisciplinary randomized controlled intervention in retirement village residents. Journal of the American Geriatrics Society 2022;70:743–53. [DOI: 10.1111/jgs.17533] [DOI] [PubMed] [Google Scholar]
Bond 1989 {published data only}
- Bond J, Gregson B A, Atkinson A. Measurement of outcomes within a multicentred randomized controlled trial in the evaluation of the experimental NHS nursing homes. Age & Ageing 1989;18:292-302. [DOI] [PubMed] [Google Scholar]
Bond 1989a {published data only}
- Bond J, Gregson BA, Atkinson A, Newell DJ. The implementation of a multicentred randomized controlled trial in the evaluation of the experimental National Health Service nursing homes. Age & Ageing 1989;18:96-102. [DOI] [PubMed] [Google Scholar]
Bond 1990 {published data only}
- Bond S, Bond J. Outcomes of care within a multiple-case study in the evaluation of the experimental National Health Service nursing homes. Age & Ageing 1990;19:11-8. [DOI] [PubMed] [Google Scholar]
Boockvar 2015 {published data only}
- Boockvar KS, Guerrero V, Torres J, Beckford K, Smyth C, Wen L, et al. Characteristics of patients receiving a multicomponent delirium prevention intervention in the nursing home setting. Journal of the American Geriatrics Society 2015;63:S119. [Google Scholar]
Boockvar 2018 {published data only}
- Boockvar K. Nursing assistant intervention to prevent delirium in nursing homes. https://clinicaltrials.gov/ct2/show/NCT02994979 2018.
Borbasi 2011 {published data only}
- Borbasi S, Emmanuel E, Farrelly B, Ashcroft J. Report of an evaluation of a nurse-led dementia outreach service for people with the behavioural and psychological symptoms of dementia living in residential aged care facilities. Perspectives in Public Health 2011;131:124‐30. [DOI] [PubMed] [Google Scholar]
Boumans 2005 {published data only}
- Boumans N, Berkhout A, Landeweerd A. Effects of resident-oriented care on quality of care, wellbeing and satisfaction with care. Scandinavian Journal of Caring Sciences 2005;19:240-50. [DOI] [PubMed] [Google Scholar]
Boumans 2008 {published data only}
- Boumans NP, Berkhout AJ, Vijgen SM, Nijhuis FJ, Vasse RM. The effects of integrated care on quality of work in nursing homes: a quasi-experiment. International Journal of Nursing Studies 2008;45:1122-36. [DOI] [PubMed] [Google Scholar]
Bower 2011 {published data only}
- Bower P, Cartwright M, Hirani SP, Barlow J, Hendy J, Knapp M, et al. A comprehensive evaluation of the impact of telemonitoring in patients with long-term conditions and social care needs: protocol for the whole systems demonstrator cluster randomised trial. BMC Health Services Research 2011;11:184. [DOI] [PMC free article] [PubMed] [Google Scholar]
Bruhmann 2019 {published data only}
- Bruhmann BA, Reese C, Kaier K, Ott M, Maurer C, Kunert S, et al. A complex health services intervention to improve medical care in long-term care homes: study protocol of the controlled coordinated medical care (CoCare) study. BMC Health Services Research 2019;19:332. [DOI] [PMC free article] [PubMed] [Google Scholar]
Callegari 2022 {published data only}
- Callegari E, Benth J S, Selbaek G, Gronnerod C, Bergh S. The effect of the NorGeP-NH on quality of life and drug prescriptions in Norwegian nursing homes: a randomized controlled trial. Pharmacy 2022;10(1):32. [DOI] [PMC free article] [PubMed] [Google Scholar]
Camacho 2018 {published data only}
- Camacho EM, Davies LM, Hann M, Small N, Bower P, Chew-Graham C, et al. Long-term clinical and cost-effectiveness of collaborative care (versus usual care) for people with mental-physical multimorbidity: cluster-randomised trial. British Journal of Psychiatry 2018;213:456-63. [DOI] [PMC free article] [PubMed] [Google Scholar]
Cameron 2020 {published data only}
- Cameron ID, Dyer SM, Panagoda CE, Murray GR, Hill KD, Cumming RG, et al. Interventions for preventing falls in older people in care facilities and hospitals. Cochrane Database of Systematic Reviews 2020, Issue 1. [DOI] [PMC free article] [PubMed] [Google Scholar]
Carpenter 2021 {published data only}
- Carpenter JG, Hanson LC, Hodgson N, Murray A, Hippe DS, Polissar NL, et al. Implementing primary palliative care in post-acute nursing home care: protocol for an embedded pilot pragmatic trial. Contemporary Clinical Trials Communications 2021;23:100822. [DOI] [PMC free article] [PubMed] [Google Scholar]
Carpenter 2021a {published data only}
- Carpenter J. Implementation of a telehealth palliative care model for persons with dementia. ClinicalTrials.gov: https://clinicaltrials.gov/ct2/show/NCT05001620 2021.
Cassel 2016 {published data only}
- Cassel S. A comparison of traditional face-to-face and tele-dysphagia instructional methods in geriatric TBI and CVA populations. Archives of Physical Medicine and Rehabilitation 2016;97:e16‐7. [Google Scholar]
Catic 2014 {published data only}
- Catic AG, Mattison MLP, Bakaev I, Morgan M, Monti SM, Lipsitz L. ECHO-AGE: an innovative model of geriatric care for long-term care residents with dementia and behavioral issues. Journal of the American Medical Directors Association 2014;15:938‐42. [DOI] [PubMed] [Google Scholar]
Challis 2004 {published data only}
- Challis D, Clarkson P, Williamson J, Hughes J, Venables D, Burns A, et al. The value of specialist clinical assessment of older people prior to entry to care homes. Age and Ageing 2004;33:25-34. [DOI] [PubMed] [Google Scholar]
Challis 2014 {published data only}
- Challis D, Tucker S, Wilberforce M, Brand C, Abendstern M, Stewart K, et al. National trends and local delivery in old age mental health services: towards an evidence base. A mixed-methodology study of the balance of care approach, community mental health teams and specialist mental health outreach to care homes. NIHR Journals Library 2014;2:na. [PubMed] [Google Scholar]
Chenoweth 2009 {published data only}
- Chenoweth L, King MT, Jeon YH, Brodaty H, Stein-Parbury J, Norman R, et al. Caring for Aged Dementia Care Resident Study (CADRES) of person-centred care, dementia-care mapping, and usual care in dementia: a cluster-randomised trial. Lancet Neurology 2009;8:317-25. [DOI] [PubMed] [Google Scholar]
Chi 2004 {published data only}
- Chi YC, Chuang KY, Wu SC, Huang KC, Wu CL. The assessment of a hospital-based care management model for long-term care services. Journal of Nursing Research 2004;12:317-26. [DOI] [PubMed] [Google Scholar]
Christian 2020 {published data only}
- Christian N, King-Mallory R, Blackwelder R. Evaluating the effects on hospital encounters after implementing after-hours telemedicine visits in a senior living facility. In: Journal of the American Medical Directors Association. Vol. 21. 2020:B20.
Clarkson 2011 {published data only}
- Clarkson P, Brand C, Hughes J, Challis D. Integrating assessments of older people: examining evidence and impact from a randomised controlled trial. Age and Ageing 2011;40:388-91. [DOI] [PubMed] [Google Scholar]
Connolly 2018 {published data only}
- Connolly MJ, Broad JB, Bish T, Zhang X, Bramley D, Kerse N, et al. Reducing emergency presentations from long-term care: a before-and-after study of a multidisciplinary team intervention. Maturitas 2018;117:45-50. [DOI] [PubMed] [Google Scholar]
Davidson 2022 {published data only}
- Davidson G. Preventing medication-related problems in care transitions to skilled nursing facilities. https://ClinicalTrials.gov/show/NCT05241951 2022.
Dobke 2008 {published data only}
- Dobke MK, Bhavsar D, Gosman A, De Neve J, De Neve B. Pilot trial of telemedicine as a decision aid for patients with chronic wounds. Telemedicine Journal and e-Health 2008;14:245-9. [DOI] [PubMed] [Google Scholar]
Dozeman 2011 {published data only}
- Dozeman E, Schaik DJ, Marwijk HW, Stek ML, Beekman AT, Horst HE. Feasibility and effectiveness of activity-scheduling as a guided self-help intervention for the prevention of depression and anxiety in residents in homes for the elderly: a pragmatic randomized controlled trial. International Psychogeriatrics 2011;23:969-78. [DOI] [PubMed] [Google Scholar]
Duffy 2010 {published data only}
- Duffy JR, Hoskins LM, Dudley-Brown S. Improving outcomes for older adults with heart failure: a randomized trial using a theory-guided nursing intervention. Journal of Nursing Care Quality 2010;25:56-64. [DOI] [PubMed] [Google Scholar]
Eckermann 2019 {published data only}
- Eckermann S, Phillipson L, Fleming R. Re-design of aged care environments is key to improved care quality and cost effective reform of aged and health system care. Applied Health Economics & Health Policy 2019;17:127-30. [DOI] [PubMed] [Google Scholar]
ElBestawi 2018 {published data only}
- ElBestawi MR, Kohm C. Decreasing preventable emergency department transfers for long-term care residents using PREVIEW-ED©. Healthcare Management Forum 2018;31:137-41. [DOI] [PubMed] [Google Scholar]
Fan 2018 {published data only}
- Fan L, Lukin B, Zhao J, Sun J, Dingle K, Purtill R, et al. Cost analysis of improving emergency care for aged care residents under a Hospital in the Nursing Home program in Australia. PLOS One 2018;13:e0199879. [DOI] [PMC free article] [PubMed] [Google Scholar]
Farin‐Glattacker 2017 {published data only}
- Farin-Glattacker E. Extended coordinated medical care in long term care homes. https://trialsearch.who.int/Trial2.aspx?TrialID=DRKS00012703 2017.
Feng 2018 {published data only}
- Feng H, Li H, Xiao LD, Ullah S, Mao P, Yang Y, et al. Aged care clinical mentoring model of change in nursing homes in China: study protocol for a cluster randomized controlled trial. BMC Health Services Research 2018;18:816. [DOI] [PMC free article] [PubMed] [Google Scholar]
Fick 2000 {published data only}
- Fick DM, Clark WF, Riley P, Cunningham B, Malakoff F. Advanced practice nursing care management model for elders in a managed care environment. Journal of Care Management 2000;6(1):28-49. [Google Scholar]
Finnema 2005 {published data only}
- Finnema E, Droes RM, Ettema T, Ooms M, Ader H, Ribbe M, et al. The effect of integrated emotion-oriented care versus usual care on elderly persons with dementia in the nursing home and on nursing assistants: a randomized clinical trial. International Journal of Geriatric Psychiatry 2005;20:330-43. [DOI] [PubMed] [Google Scholar]
Frisoni 1998 {published data only}
- Frisoni GB, Gozzetti A, Bignamini V, Vellas BJ, Berger AK, Bianchetti A, et al. Special care units for dementia in nursing homes: a controlled study of effectiveness. Archives of Gerontology and Geriatrics 1998;27:215‐24. [Google Scholar]
Fukahori 2016 {published data only}
- Fukahori, C. Development of an integrated care pathway (ICP) for end-of-life care in long term care facilities in Japan. http://www.who.int/trialsearch/Trial2.aspx?TrialID=JPRN-UMIN000022579 (https://center6.umin.ac.jp/cgi-open-bin/ctr_e/ctr_view.cgi?recptno=R000026013) 2016.
Galik 2021 {published data only}
- Galik EM, Resnick B, Holmes SD, Vigne E, Lynch K, Ellis J, et al. A cluster randomized controlled trial testing the impact of function and behavior focused care for nursing home residents with dementia. Journal of the American Medical Directors Association 2021;22(7):1421. [DOI] [PMC free article] [PubMed] [Google Scholar]
Garland 2022 {published data only}
- Garland A, Keller H, Quail P, Boscart V, Heyer M, Ramsey C, et al. BABEL (Better tArgeting, Better outcomes for frail ELderly patients) advance care planning: a comprehensive approach to advance care planning in nursing homes: a cluster randomised trial. Age & Ageing 2022;51(3):1-10. [DOI] [PMC free article] [PubMed] [Google Scholar]
Garrard 1990 {published data only}
- Garrard J, Kane R L, Radosevich DM, Skay CL, Arnold S, Kepferle L, et al. Impact of geriatric nurse practitioners on nursing-home residents' functional status, satisfaction, and discharge outcomes. Medical Care 1990;28:271‐83. [DOI] [PubMed] [Google Scholar]
Gotze 2022 {published data only}
- Gotze K, Bausewein C, Feddersen B, Fuchs A, Hot A, Hummers E, et al. Effectiveness of a complex regional advance care planning intervention to improve care consistency with care preferences: study protocol for a multi-center, cluster-randomized controlled trial focusing on nursing home residents (BEVOR trial). Trials 2022;23(1):770. [DOI] [PMC free article] [PubMed] [Google Scholar]
Hakkaart‐van 2013 {published data only}
- Hakkaart-van Roijen L, Bakker TJ, Al M, Lee J, Duivenvoorden HJ, Ribbe MW, et al. Economic evaluation alongside a single RCT of an integrative psychotherapeutic nursing home programme. BMC Health Services Research 2013;13:370. [DOI] [PMC free article] [PubMed] [Google Scholar]
Holmkjaer 2021 {published data only}
- Holmkjaer P, Holm A, Overbeck G, Rozing MP. A cluster-randomized trial of a complex intervention to encourage deprescribing antidepressants in nursing home residents with dementia: a study protocol. Trials 2022;23(1):410. [DOI: 10.1186/s13063-022-06368-9] [DOI] [PMC free article] [PubMed] [Google Scholar]
Huizing 2009 {published data only}
- Huizing AR, Hamers JP, Gulpers MJ, Berger MP. A cluster-randomized trial of an educational intervention to reduce the use of physical restraints with psychogeriatric nursing home residents. Journal of the American Geriatrics Society 2009;57:1139-48. [DOI] [PubMed] [Google Scholar]
Jeon 2015 {published data only}
- Jeon YH, Simpson JM, Li Z, Cunich MM, Thomas TH, Chenoweth L, et al. Cluster randomized controlled trial of an aged care specific leadership and management program to improve work environment, staff turnover, and care quality. Journal of the American Medical Directors Association 2015;16:629.e19-28. [DOI] [PubMed] [Google Scholar]
Junius‐Walker 2021 {published data only}
- Junius-Walker U, Krause O, Thurmann P, Bernhard S, Fuchs A, Sparenberg L, et al. Drug safety for nursing-home residents-findings of a pragmatic, cluster-randomized, controlled intervention trial in 44 nursing homes. Deutsches Arzteblatt International 2021;118(42):705-12. [DOI] [PMC free article] [PubMed] [Google Scholar]
Kane 1989 {published data only}
- Kane RL, Garrard J, Skay CL, Radosevich DM, Buchanan JL, McDermott SM, et al. Effects of a geriatric nurse practitioner on process and outcome of nursing home care. American Journal of Public Health 1989;79:1271‐7. [DOI] [PMC free article] [PubMed] [Google Scholar]
Kane 2017 {published data only}
- Kane RL, Huckfeldt P, Tappen R, Engstrom G, Rojido C, Newman D, et al. Effects of an intervention to reduce hospitalizations from nursing homes: a randomized implementation trial of the INTERACT program. JAMA Internal Medicine 2017;177:1257-64. [DOI] [PMC free article] [PubMed] [Google Scholar]
Kennedy 2015 {published data only}
- Kennedy CC, Ioannidis G, Thabane L, Adachi JD, Marr S, Giangregorio LM, et al. Successful knowledge translation intervention in long-term care: final results from the vitamin D and osteoporosis study (ViDOS) pilot cluster randomized controlled trial. Trials 2015;16:214. [DOI] [PMC free article] [PubMed] [Google Scholar]
Konno 2014 {published data only}
- Konno R, Kang HS, Makimoto K. A best-evidence review of intervention studies for minimizing resistance-to-care behaviours for older adults with dementia in nursing homes. Journal of Advanced Nursing 2014;70:2167-80. [DOI] [PubMed] [Google Scholar]
Kosari 2021 {published data only}
- Kosari S, Koerner J, Naunton M, Peterson GM, Haider I, Lancsar E, et al. Integrating pharmacists into aged care facilities to improve the quality use of medicine (PiRACF Study): protocol for a cluster randomised controlled trial. Trials 2021;22(1):390. [DOI] [PMC free article] [PubMed] [Google Scholar]
Kovach 1996 {published data only}
- Kovach CR, Wilson SA, Noonan PE. Effects of hospice interventions on behaviors, discomfort, and physical complications of end stage dementia nursing home residents. American Journal of Alzheimer's Disease 1996;11:8. [Google Scholar]
Krichbaum 2000 {published data only}
- Krichbaum KE, Pearson V, Hanscom J. Better care in nursing homes: advanced practice nurses' strategies for improving staff use of protocols. Clinical Nurse Specialist 2000;14:40-6. [DOI] [PubMed] [Google Scholar]
Kruse 2013 {published data only}
- Kruse RL, Parker OD, Wittenberg-Lyles E, Demiris G. Conducting the ACTIVE randomized trial in hospice care: keys to success. Clinical Trials 2013;10:160-9. [DOI] [PMC free article] [PubMed] [Google Scholar]
Lanzeta 2016 {published data only}
- Lanzeta I, Mar J, Arrospide A. Cost-utility analysis of an integrated care model for multimorbid patients based on a clinical trial. Gaceta Sanitaria 2016;30:352-8. [DOI] [PubMed] [Google Scholar]
Ling 2019 {published data only}
- Ling R, Searles A, Hewitt J, Considine R, Turner C, Thomas S, et al. Cost analysis of an integrated aged care program for residential aged care facilities. Australian Health Review 2019;43:261-7. [DOI] [PubMed] [Google Scholar]
Llewellyn‐Jones 1999 {published data only}
- Llewellyn-Jones RH, Baikie KA, Smithers H, Cohen J, Snowdon J, Tennant CC. Multifaceted shared care intervention for late life depression in residential care: randomised controlled trial. BMJ 1999;319:676-82. [DOI] [PMC free article] [PubMed] [Google Scholar]
Logan 2021 {published data only}
- Logan PA, Horne JC, Gladman JRF, Gordon AL, Sach T, Clark A, et al. Multifactorial falls prevention programme compared with usual care in UK care homes for older people: multicentre cluster randomised controlled trial with economic evaluation. BMJ (Clinical research ed.) 2021;375:e066991. [DOI] [PMC free article] [PubMed] [Google Scholar]
Long 2002 {published data only}
- Long MJ. Case management model or case manager type? That is the question. Health Care Manager 2002;20:53-65. [DOI] [PubMed] [Google Scholar]
Mangin 2021 {published data only}
- Mangin D, Lamarche L, Agarwal G, Banh HL, Dore BN, Cassels A, et al. Team approach to polypharmacy evaluation and reduction: study protocol for a randomized controlled trial. Trials 2021;22(1):746. [DOI] [PMC free article] [PubMed] [Google Scholar]
Manietta 2022 {published data only}
- Manietta C, Labonté V, Thiesemann R, Sirsch EG, Möhler R. Algorithm-based pain management for people with dementia in nursing homes. Cochrane Database of Systematic Reviews 2022, Issue 4. Art. No: CD013339. [DOI: 10.1002/14651858.CD013339.pub2] [DOI] [PMC free article] [PubMed] [Google Scholar]
Marino 2016 {published data only}
- Marino R, Tonmukayakul U, Manton D, Stranieri A, Clarke K. Cost-analysis of teledentistry in residential aged care facilities. Journal of Telemedicine and Telecare 2016;22:326-32. [DOI] [PubMed] [Google Scholar]
McCabe 2018 {published data only}
- McCabe MP, Beattie E, Karantzas G, Mellor D, Sanders K, Busija L, et al. A randomized controlled trial to evaluate the effectiveness of a staff training program to implement consumer directed care on resident quality of life in residential aged care. BMC Geriatrics 2018;18:287. [DOI] [PMC free article] [PubMed] [Google Scholar]
Meltzer 2017 {published data only}
- Meltzer D. Comprehensive care physician: integrated inpatient and outpatient care for patients at high risk of hospitalization. https://clinicaltrials.gov/study/NCT01929005 2017.
Moyo 2022 {published data only}
- Moyo P, Loomer L, Teno JM, Gutman R, McCreedy EM, Bélanger E, et al. Effect of a video-assisted advance care planning intervention on end-of-life health care transitions among long-stay nursing home residents. Journal of the American Medical Directors Association 2022;23(3):394-8. [DOI] [PMC free article] [PubMed] [Google Scholar]
Mudge 2012 {published data only}
- Mudge AM, Denaro CP, O'Rourke P. Improving hospital outcomes in patients admitted from residential aged care: results from a controlled trial. Age and Ageing 2012;41:670-3. [DOI] [PubMed] [Google Scholar]
Muller 2015 {published data only}
- Muller D, Borsi L, Stracke C, Stock S, Stollenwerk B. Cost-effectiveness of a multifactorial fracture prevention program for elderly people admitted to nursing homes. European Journal of Health Economics 2015;16:517-27. [DOI] [PubMed] [Google Scholar]
Ng 2022 {published data only}
- Ng AYM, Takemura N, Xu X, Smith R, Kwok JY, Cheung DST, et al. The effects of advance care planning intervention on nursing home residents: a systematic review and meta-analysis of randomised controlled trials. International Journal of Nursing Studies 2022;132:104276. [DOI] [PubMed] [Google Scholar]
Nord‐Trøndelag 2005 {published data only}
- Helse Nord-Trøndelag HF. Randomized controlled trial of health care to elderly patients. https://clinicaltrials.gov/show/NCT00235404 2005.
Orrell 2007 {published data only}
- Orrell M, Hancock G, Hoe J, Woods B, Livingston G, Challis D. A cluster randomised controlled trial to reduce the unmet needs of people with dementia living in residential care. International Journal of Geriatric Psychiatry 2007;22:1127-34. [DOI] [PubMed] [Google Scholar]
Ouslander 2011 {published data only}
- Ouslander J G, Lamb G, Tappen R, Herndon L, Diaz S, Roos B A, et al. Interventions to reduce hospitalizations from nursing homes: evaluation of the INTERACT II collaborative quality improvement project. Journal of the American Geriatrics Society 2011;59:745-53. [DOI] [PubMed] [Google Scholar]
Ouslander 2014 {published data only}
- Ouslander JG. Reducing hospitalizations of nursing home residents. https://clinicaltrials.gov/show/NCT02177058 2014.
Pantel 2018 {published data only}
- Pantel J. Depression in the nursing home: using a stepped collaborative care model to improve treatment. https://trialsearch.who.int/Trial2.aspx?TrialID=DRKS00015686 2018.
Peri 2020 {published data only}
- Peri K, Broad JB, Hikaka J, Boyd M, Bloomfield K, Wu Z, et al. Study protocol: older people in retirement villages. A survey and randomised trial of a multi-disciplinary invention designed to avoid adverse outcomes. BMC Geriatrics 2020;20(1):247. [DOI: ] [DOI] [PMC free article] [PubMed] [Google Scholar]
Peters 1987 {published data only}
- Peters HJ, Duine TJ. The project 'Normalized Living' of the 'De Landrijt' nursing home in Eindhoven. Various results of an experiment in psychogeriatric care. Tijdschrift voor Gerontologie en Geriatrie 1987;18:187-91. [PubMed] [Google Scholar]
Pivodic 2021 {published data only}
- Pivodic L, Wendrich-van Dael A, Gilissen J, De Buyser S, Deliens L, Gastmans C, et al. Effects of a theory-based ACP intervention for nursing homes: a cluster randomized controlled trial. Palliative Medicine 2021;35(1 Suppl):189. [DOI] [PubMed] [Google Scholar]
Pope 2011 {published data only}
- Pope G, Wall N, Peters CM, O'Connor M, Saunders J, O'Sullivan C, et al. Specialist medication review does not benefit short-term outcomes and net costs in continuing-care patients. Age & Ageing 2011;40:307-12. [DOI] [PubMed] [Google Scholar]
Rantz 2012 {published data only}
- Rantz MJ, Zwygart-Stauffacher M, Hicks L, Mehr D, Flesner M, Petroski GF, et al. Randomized multilevel intervention to improve outcomes of residents in nursing homes in need of improvement. Journal of the American Medical Directors Association 2012;13:60-8. [DOI] [PMC free article] [PubMed] [Google Scholar]
Remsburg 1999 {published data only}
- Remsburg RE, Aracost KA, Radu C, Bennett RG. Two models of restorative nursing care in the nursing home: designated versus integrated restorative nursing assistants. Geriatric Nursing 1999;20:321‐6. [DOI] [PubMed] [Google Scholar]
Resnick 2021 {published data only}
- Resnick B, Boltz M, Galik E, Fix S, Holmes S, Zhu S, et al. Testing the implementation of function-focused care in assisted living settings. Journal of the American Medical Directors Association 2021;22(8):1706. [DOI] [PMC free article] [PubMed] [Google Scholar]
Roets‐Merken 2018 {published data only}
- Roets-Merken LM, Zuidema SU, Vernooij-Dassen Mjfj, Teerenstra S, Hermsen Pgjm, Kempen Gijm, et al. Effectiveness of a nurse-supported self-management programme for dual sensory impaired older adults in long-term care: a cluster randomised controlled trial. BMJ Open 2018;8:e016674. [DOI] [PMC free article] [PubMed] [Google Scholar]
Rolland 2020 {published data only}
- Rolland Y, Tavassoli N, Souto Barreto P, Perrin A, Laffon de Mazieres C, Rapp T, et al. Systematic dementia screening by multidisciplinary team meetings in nursing homes for reducing emergency department transfers: the IDEM cluster randomized clinical trial. JAMA Network Open 2020;3:e200049. [DOI] [PMC free article] [PubMed] [Google Scholar]
Rovner 1996 {published data only}
- Rovner BW, Steele CD, Shmuely Y, Folstein MF. A randomized trial of dementia care in nursing homes. Journal of the American Geriatrics Society 1996;44:7-13. [DOI] [PubMed] [Google Scholar]
Ryden 1999 {published data only}
- Ryden MB, Pearson V, Kaas MJ, Hanscom J, Lee H, Krichbaum K, et al. Nursing interventions for depression in newly admitted nursing home residents. Journal of Gerontological Nursing 1999;25:20-9. [DOI] [PubMed] [Google Scholar]
Ryden 2000 {published data only}
- Ryden MB, Snyder M, Gross CR, Savik K, Pearson V, Krichbaum K, et al. Value-added outcomes: the use of advanced practice nurses in long-term care facilities. Gerontologist 2000;40:654-62. [DOI] [PubMed] [Google Scholar]
Ryuichi 2021 {published data only}
- Ryuichi O, Yoshinori R. Improvement in palliative care quality in rural nursing homes through information and communication technology-driven interprofessional collaboration. Rural & Remote Health 2021;21(2):104-8. [DOI] [PubMed] [Google Scholar]
Sadeq 2022 {published data only}
- Sadeq A, Strugaru M, Almutairi M, Stewart D, Ryan C, Grimes T. Interprofessional interventions involving pharmacists and targeting the medicines management process provided to older people residing in nursing homes: a systematic review and meta-analysis of randomised controlled trials. Drugs & Aging 2022;39(10):773-94. [DOI] [PubMed] [Google Scholar]
Sampson 2019 {published data only}
- Sampson EL, Feast A, Blighe A, Froggatt K, Hunter R, Marston L, et al. Evidence-based intervention to reduce avoidable hospital admissions in care home residents (the Better Health in Residents in Care Homes (BHiRCH) study): protocol for a pilot cluster randomised trial. BMJ Open 2019;9:e026510. [DOI] [PMC free article] [PubMed] [Google Scholar]
Sampson 2020 {published data only}
- Sampson EL, Feast A, Blighe A, Froggatt K, Hunter R, Marston L, et al. Pilot cluster randomised trial of an evidence-based intervention to reduce avoidable hospital admissions in nursing home residents (Better Health in Residents of Care Homes with Nursing-BHiRCH-NH Study). BMJ Open 2020;10:e040732. [DOI] [PMC free article] [PubMed] [Google Scholar]
Santaeugenia 2017 {published data only}
- Santaeugenia SJ, Garcia-Lazaro M, Alventosa A M, Gutierrez-Benito A, Monterde A, Cunill J. New integrated care model for older people admitted to Intermediate Care Units in Catalonia: a quasi-experimental study protocol. Revista Espanola de Geriatria y Gerontologia 2017;52:201-8. [DOI] [PubMed] [Google Scholar]
Selbaek 2017 {published data only}
- Selbaek G. Treatment of severe agitation in nursing homes with the time model: results from a cluster randomized controlled trial. Alzheimer's & Dementia 2017;13:179‐80. [Google Scholar]
Shores 2004 {published data only}
- Shores MM, Ryan-Dykes P, Williams RM, Mamerto B, Sadak T, Pascualy M, et al. Identifying undiagnosed dementia in residential care veterans: comparing telemedicine to in-person clinical examination. International Journal of Geriatric Psychiatry 2004;19:101-8. [DOI] [PubMed] [Google Scholar]
Shrapnel 2019 {published data only}
- Shrapnel S, Dent E, Nicholson C. A nurse-led model of care within an emergency department reduces representation rates for frail aged care residents. Aging Clinical & Experimental Research 2019;31:1695-8. [DOI] [PubMed] [Google Scholar]
Simon 2020 {published data only}
- Simon M. Nurse-led care models in swiss nursing homes: improving interprofessional care for better resident outcomes (INTERCARE). https://clinicaltrials.gov/ct2/show/NCT03590470 2020.
Smeets 2021 {published data only}
- Smeets CHW, Smalbrugge M, Koopmans RTCM, Nelissen-Vrancken MHJMG, Van Der Spek K, Teerenstra S, et al. Can the PROPER intervention reduce psychotropic drug prescription in nursing home residents with dementia? Results of a cluster-randomized controlled trial. International Psychogeriatrics 2021;33(6):577-86. [DOI] [PubMed] [Google Scholar]
Snyder 1998 {published data only}
- Snyder M, Pearson V, Hanscom J, Hoyman K, Hagans E, Lee H, et al. Barriers to progress in urinary incontinence: achieving quality assessments. Geriatric Nursing 1998;19:77-80. [DOI] [PubMed] [Google Scholar]
Sor‐Ost 2012 {published data only}
- Sor-Ost H. Collaboration between department of old age psychiatry and nursing homes. https://www.clinicaltrials.gov/ct2/show/NCT01217541 2012.
Tchalla 2022 {published data only}
- Tchalla A. Acceptability assessment of an "Organization of Care Integrating Artificial Intelligence and a Solution of Telemedicine" on care of the nursing home residents located in a medical desert: Pilot Study INTEL@MED-POC. ClinicalTrials.gov 2022.
Tsai 2010 {published data only}
- Tsai HH, Tsai YF, Wang HH, Chang YC, Chu HH. Videoconference program enhances social support, loneliness, and depressive status of elderly nursing home residents. Aging & Mental health 2010;14:947‐54. [DOI] [PubMed] [Google Scholar]
Tse 2012 {published data only}
- Tse MM, Vong SK, Ho SS. The effectiveness of an integrated pain management program for older persons and staff in nursing homes. Archives of Gerontology & Geriatrics 2012;54:e203-12. [DOI] [PubMed] [Google Scholar]
Tse 2014 {published data only}
- Tse MM, Lee PH, Ng SM, Tsien-Wong BK, Yeung SS. Peer volunteers in an integrative pain management program for frail older adults with chronic pain: study protocol for a randomized controlled trial. Trials 2014;15:205. [DOI] [PMC free article] [PubMed] [Google Scholar]
Valk‐Draad 2022 {published data only}
- Valk-Draad MP, Bohnet-Joschko S. Nursing home-sensitive hospitalizations and the relevance of telemedicine: a scoping review. International journal of environmental research and public health 2022;19(19):12944. [DOI] [PMC free article] [PubMed] [Google Scholar]
van de Ven 2013 {published data only}
- de Ven G, Draskovic I, Adang EMM, Donders R, Zuidema SU, Koopmans RTCM, et al. Effects of dementia-care mapping on residents and staff of care homes: a pragmatic cluster-randomised controlled trial. PLOS One 2013;8(7):e67325. [DOI] [PMC free article] [PubMed] [Google Scholar]
van de Ven 2014 {published data only}
- de Ven G, Draskovic I, Herpen E, Koopmans RT, Donders R, Zuidema SU, et al. The economics of dementia-care mapping in nursing homes: a cluster-randomised controlled trial. PLOS One 2014;9:e86662. [DOI] [PMC free article] [PubMed] [Google Scholar]
Vowden 2013 {published data only}
- Vowden K, Vowden P. A pilot study on the potential of remote support to enhance wound care for nursing-home patients. Journal of Wound Care 2013;22:481-8. [DOI] [PubMed] [Google Scholar]
Wang 2022 {published data only}
- Wang X, Shen J, Chen Q. How PARO can help older people in elderly care facilities: a systematic review of RCT. International Journal of Nursing Knowledge 2022;33(1):29-39. [DOI] [PMC free article] [PubMed] [Google Scholar]
Waterreus 1994 {published data only}
- Waterreus A, Blanchard M, Mann A. Community psychiatric nurses for the elderly: well tolerated, few side-effects and effective in the treatment of depression. Journal of Clinical Nursing 1994;3:299-306. [DOI] [PubMed] [Google Scholar]
Watson 2004 {published data only}
- Watson NM. Advancing quality of urinary incontinence evaluation and treatment in nursing homes through translational research. Worldviews on Evidence-Based Nursing 2004;1 Suppl 1:S21-5. [DOI] [PubMed] [Google Scholar]
Wauters 2021 {published data only}
- Wauters M, Elseviers M, Vander SR, Dilles T, Thienpont G, Christiaens T. Efficacy, feasibility and acceptability of the OptiMEDs tool for multidisciplinary medication review in nursing homes. Archives of Gerontology and Geriatrics 2021;95:104391. [DOI] [PubMed] [Google Scholar]
Weiner 2001 {published data only}
- Weiner M, Schadow G, Lindbergh D, Warvel J, Abernathy G, Dexter P, et al. Secure internet video conferencing for assessing acute medical problems in a nursing facility. In: Proceedings/AMIA Annual Symposium. 2001:751-5. [PMC free article] [PubMed]
Whitaker 2014 {published data only}
- Whitaker R, Fossey J, Ballard C, Orrell M, Moniz-Cook E, Woods RT, et al. Improving well-being and health for people with dementia (WHELD): study protocol for a randomised controlled trial. Trials 2014;15:284. [DOI] [PMC free article] [PubMed] [Google Scholar]
Yong 2022 {published data only}
- Yong L, Yin S, Qinghua P, Huasheng H, Houwen Z, Zuochao H, et al. Application of interdisciplinary collaborative hospice care for terminal geriatric cancer patients: a prospective randomized controlled study. Supportive Care in Cancer 2022;30(4):3553-61. [DOI] [PubMed] [Google Scholar]
Zúñiga 2019 {published data only}
- Zúñiga F, De Geest S, Guerbaai RA, Basinska K, Nicca D, Kressig RW, et al. Strengthening geriatric expertise in swiss nursing homes: INTERCARE implementation study protocol. Journal of the American Geriatrics Society 2019;67:2145-50. [DOI] [PubMed] [Google Scholar]
References to studies awaiting assessment
Bagaragaza 2021 {published data only}
- NCT04708002. Interventional research with mixed methods on an early integrated palliative approach in nursing home. https://clinicaltrials.gov/ct2/show/NCT04708002.
Bath 2001 {published data only}
- Bath P. Multidisciplinary team discharge planning for severe stroke patients entering nursing home care. National Research Register 2001;1:no pagination.
Palmer 2020 {published data only}
- Palmer C. Hearing for communication and resident engagement (HearCARE). https://clinicaltrials.gov/ct2/show/NCT04575051. [DOI] [PMC free article] [PubMed]
Sillies 2022 {published data only}
- Sillies K. Expanded nursing competencies to improve person-centred care for nursing home residents with complex health needs (Expand-Care): exploratory cluster-randomized trial - Expand-Care. https://trialsearch.who.int/Trial2.aspx?TrialID=DRKS00028708. [DOI] [PMC free article] [PubMed]
Umpierrez 2021 {published data only}
- Umpierrez G. Dexcom CGM in long-term care. https://clinicaltrials.gov/ct2/show/NCT04818242.
References to ongoing studies
Brucken 2022 {published data only}
- Brücken D, Unterkofer J, Pauge S, Bienzeisler J, Hübel C, Zechbauer S, et al. Optimal@NRW: optimized acute care of nursing home residents using an intersectoral telemedical cooperation network - study protocol for a stepped-wedge trial. Trials 2022;23:814. [DOI: 10.1186/s13063-022-06613-1] [DOI] [PMC free article] [PubMed] [Google Scholar]
Choi 2020 {published data only}
- Choi JY, Kim KI, Kim H, Jung YI, Oh IH, Chun S, et al. Validation of an integrated service model, Health-RESPECT, for older patients in long-term care institution using information and communication technologies: protocol of a cluster randomised controlled trial. BMJ Open 2020;10:e038598. [DOI: 10.1136/bmjopen-2020-038598] [DOI] [PMC free article] [PubMed] [Google Scholar]
Dantoine 2019 {published data only}
- Impact of telemedicine on avoiding emergency hospital admissions and hospitalization for nursing home residents. Ongoing study. July 2016. Contact author for more information.
Kaasalainen 2019 {published data only}
- Kaasalainen S. Implementing, evaluating, and scaling up of the strengthening a palliative approach in long term care (SPA-LTC) program. https://clinicaltrials.gov/ct2/show/NCT03935997. [DOI] [PMC free article] [PubMed]
Kapp 2022 {published data only}
- Kapp S. The clinical and cost effectiveness of remote expert wound nurse consultation for healing of pressure injuries among residential aged care patients: a protocol for a prospective pilot parallel cluster randomised controlled trial. ACTRN12622001180707. [DOI] [PMC free article] [PubMed]
Moore 2022 {published data only}
- ACTRN12622000760774. The effect of using telehealth to train residential aged care facility staff in delivery of palliative care to residents on the rate of unplanned hospitalisation admissions and quality of end-of-life care. https://www.anzctr.org.au/Trial/Registration/TrialReview.aspx?id=383744&isReview=true (first received 27 May 2022).
Muller 2020 {published data only}
- Muller C, Hesjedal-Streller B, Fleischmann N, Tetzlaff B, Mallon T, Scherer M, et al. Effects of strategies to improve general practitioner-nurse collaboration and communication in regard to hospital admissions of nursing home residents (interprof ACT): study protocol for a cluster randomised controlled trial. Trials 2020;21(1):913. [DOI: 10.1186/s13063-020-04736-x] [DOI] [PMC free article] [PubMed] [Google Scholar]
Papaioannou 2021 {published data only}
- Papaioannou 2021. The PREVENT Trial: a pragmatic cluster randomized controlled trial of a multifaceted fracture prevention model for long-term care. https://clinicaltrials.gov/ct2/show/NCT04947722.
Piau 2018 {published data only}
- Piau A, Nourhashemi F, De Mauleon A, Tchalla A, Vautier C, Vellas B, et al. Telemedicine for the management of neuropsychiatric symptoms in long-term care facilities: the DETECT study, methods of a cluster randomised controlled trial to assess feasibility. BMJ Open 2018;8(6):e020982. [DOI: 10.1136/bmjopen-2017-020982] [DOI] [PMC free article] [PubMed] [Google Scholar]
Sourdet 2018 {published data only}
- The impact of telemedicine to support palliative care resident in nursing home. Ongoing study. April 2018. Contact author for more information.
Spichiger 2021 {published data only}
- Spichiger F, Koppitz AL, De Wolf-Linder S, Murtagh FEM, Volken T, Larkin P. Improving caring quality for people with dementia in nursing homes using IPOS-Dem: a stepped-wedge cluster randomized controlled trial protocol. JAN Leading Global Nursing Research 2021;77(10):4234-45. [DOI: ] [DOI] [PMC free article] [PubMed] [Google Scholar]
Sunner 2020 {published data only}
- Sunner C, Giles MT, Parker V, Dilworth S, Bantawa K, Kable A, et al. PACE-IT study protocol: a stepped wedge cluster randomised controlled trial evaluating the implementation of telehealth visual assessment in emergency care for people living in residential aged-care facilities. BMC Health Service Research 2020;20:672. [DOI: 10.1186/s12913-020-05539-1] [DOI] [PMC free article] [PubMed] [Google Scholar]
Tchalla 2019 {published data only}
- Evaluation of the impact of a telemedicine device (DTM) on the prevention of emergency department visits and hospitalisations of nursing home residents aged polypathological (GERONTACCESS). Ongoing study. November 2015. Contact author for more information.
Tesky 2019 {published data only}
- Tesky V, Schall A, Schulze U, Stangier U, Oswald F, Knopf M, et al. Depression in the nursing home: a cluster-randomized stepped-wedge study to probe the effectiveness of a novel case management approach to improve treatment (the DAVOS project). Trials 2019;20:424. [DOI: 10.1186/s13063-019-3534-x] [DOI] [PMC free article] [PubMed] [Google Scholar]
Additional references
Alldred 2016
- Alldred DP, Kennedy M, Hughes C, Chen TF, Miller P. Interventions to optimise prescribing for older people in care homes. Cochrane Database of Systematic Reviews 2016, Issue 2. Art. No: CD009095. [DOI: 10.1002/14651858.CD009095.pub3] [DOI] [PMC free article] [PubMed] [Google Scholar]
Aluko 2020
- Aluko P, Graybill E, Craig D, Henderson C, Drummond M, Wilson ECF, et al, on behalf of the Campbell and Cochrane Economics Methods Group. Chapter 20: Economic evidence. In: Higgins JP, Thomas J, Chandler J, Cumpston M, Li T, Page MJ, Welch VA, editor(s). Cochrane Handbook for Systematic Reviews of Interventions Version 6.1 (updated September 2020). Cochrane, 2020. Available from training.cochrane.org/handbook.
Barker 2018
- Barker RO, Craig D, Spiers G, Kunonga P, Hanratty B. Who should deliver primary care in long-term care facilities to optimize resident outcomes? A systematic review. Journal of the American Medical Directors Association 2018;19(12):1069-79. [DOI: 10.1016/j.jamda.2018.07.006] [DOI] [PubMed] [Google Scholar]
Bowman 2001
- Bowman C, Elford J, Dovey J, Campbell S, Barrowclough H. Acute hospital admissions from nursing homes: some may be avoidable. Postgraduate Medical Journal 2001;77(903):40-2. [DOI] [PMC free article] [PubMed] [Google Scholar]
Cochrane Norway 2019
- Cochrane Norway. How to write a plain language summary of a Cochrane intervention review. http://www.cochrane.no/sites/cochrane.no/files/public/uploads/how_to_write_a_cochrane_pls_12th_february_2019.pdf accessed 25 April 2020.
Connolly 2013
- Li H, Powers BA, Melnyk BM, McCann R, Koulouglioti C, Anson E, et al. Randomised controlled trial of packaged "evidenced" interventions for reducing hospitalisations from residential aged care (RAC): first results from the ARCHUS study. European Geriatric Medicine 2013;4:S171. [Google Scholar]
Crocker 2013
- Crocker T, Forster A, Young J, Brown L, Ozer S, Smith J, et al. Physical rehabilitation for older people in long‐term care. Cochrane Database of Systematic Reviews 2013, Issue 2. Art. No: CD004294. [DOI: 10.1002/14651858.CD004294.pub3] [DOI] [PMC free article] [PubMed] [Google Scholar]
Davies 2011
- Davies SL, Goodman C, Bunn F, Victor C, Dickinson A, Iliffe S, et al. A systematic review of integrated working between care homes and health care services. BMC Health Services Research 2011;11:320. [DOI] [PMC free article] [PubMed] [Google Scholar]
Deeks 2020
- Deeks J, Higgins J, Altman D, on behalf of the Cochrane Statistical Methods Group. Chapter 10: Analysing data and undertaking meta-analyses. In: Higgins JP, Thomas J, Chandler J, Cumpston M, Li T, Page MJ, Welch VA, editor(s). Cochrane Handbook for Systematic Reviews of Interventions Version 6.1 (updated September 2020). Cochrane, 2020. Available from www.training.cochrane.org/handbook 2020.
Dobke 2008
- Dobke MK, Bhavsar D, Gosman A, De Neve J, De Neve B, et al. Pilot trial of telemedicine as a decision aid for patients with chronic wounds. Telemedicine Journal and e-Health 2008;14(3):245-9. [DOI] [PubMed] [Google Scholar]
Dwyer 2017
- Dwyer T, Craswell A, Rossi D, Holzberger D. Evaluation of an aged care nurse practitioner service: quality of care within a residential aged care facility hospital avoidance service. BMC Health Services Research 2017;17(1):33. [DOI] [PMC free article] [PubMed] [Google Scholar]
EPOC 2015
- EPOC. The EPOC taxonomy of health systems interventions. epoc.cochrane.org/epoc-taxonomy (accessed 1 August 2019).
EPOC 2017
- Cochrane Effective Practice and Organisation of Care (EPOC). EPOC resources for review authors. epoc.cochrane.org/resources/epoc-resources-review-authors (accessed 1 August 2019).
Evers 2005
- Evers S, Goossens M, Vet H, Tulder M, Ament A. Criteria list for assessment of methodological quality of economic evaluations: consensus on health economic criteria. International Journal of Technology Assessment in Health Care 2005;21(2):240-5. [PMID: PMID: 15921065] [PubMed] [Google Scholar]
Fan 2015
- Fan L, Hou XY, Zhao J, Sun J, Dingle K, Purtill R, et al. Hospital in the Nursing Home program reduces emergency department presentations and hospital admissions from residential aged care facilities in Queensland, Australia: a quasi-experimental study. BMC Health Services Research 2015;16:46. [DOI] [PMC free article] [PubMed] [Google Scholar]
GRADEpro GDT [Computer program]
- GRADEpro GDT. Hamilton (ON): GRADE Working Group, McMaster University, 2022.
Guyatt 2008
- Guyatt GH, Oxman AD, Vist G, Kunz R, Falck-Ytter Y, Alonso-Coello P, et al, GRADE Working Group. GRADE: an emerging consensus on rating quality of evidence and strength of recommendations. BMJ 2008;336(7650):924-6. [DOI] [PMC free article] [PubMed] [Google Scholar]
Higgins 2011
- Higgins JP, Green S, editor(s). Cochrane Handbook for Systematic Reviews of Interventions Version 5.1.0 (updated March 2011). The Cochrane Collaboration, 2011. Available from training.cochrane.org/handbook/archive/v5.1/ 2011.
Higgins 2019
- Higgins JP, Thomas J, Chandler J, Cumpston M, Li T, Page MJ, Welch VA, editor(s). Cochrane Handbook for Systematic Reviews of Interventions Version 6.1 (updated September 2020). Cochrane, 2020. Available from www.training.cochrane.org/handbook. [DOI] [PMC free article] [PubMed]
Hodgkinson 2011
- Hodgkinson B, Haesler EJ, Nay R, O'Donnell MH, McAuliffe LP. Effectiveness of staffing models in residential, subacute, extended aged care settings on patient and staff outcomes. Cochrane Database of Systematic Reviews 2011, Issue 6. Art. No: CD006563. [DOI: 10.1002/14651858.CD006563.pub2] [DOI] [PMC free article] [PubMed] [Google Scholar]
Hoffmann 2014
- Hoffmann TC, Glasziou PP, Boutron I, Milne R, Perera R, Moher D, et al. Better reporting of interventions: template for intervention description and replication (TIDieR) checklist and guide. BMJ 2014;348:1687. [DOI] [PubMed] [Google Scholar]
King 2013
- King BJ, Gilmore-Bykovskyi AL, Roiland RA, Polnaszek BE, Bowers BJ, Kind AJ. The consequences of poor communication during transitions from hospital to skilled nursing facility: a qualitative study. Journal of the American Geriatrics Society 2013;61(7):1095-102. [DOI] [PMC free article] [PubMed] [Google Scholar]
Konetzka 2008
- Konetzka RT, Spector W, Limcangco MR. Reducing hospitalizations from long-term care settings. Medical Care Research and Review 2008;65(1):40-66. [DOI] [PubMed] [Google Scholar]
LaMantia 2010
- LaMantia MA, Scheunemann LP, Viera AJ, Busby-Whitehead J, Hanson LC. Interventions to improve transitional care between nursing homes and hospitals: a systematic review. Journal of the American Geriatrics Society 2010;58(4):777-82. [DOI] [PMC free article] [PubMed] [Google Scholar]
Lefebvre 2021
- Lefebvre C, Glanville J, Briscoe S, Littlewood A, Marshall C, Metzendorf M-I, et al. Technical Supplement to Chapter 4: Searching for and selecting studies. In: Higgins JPT, Thomas J, Chandler J, Cumpston MS, Li T, Page MJ, Welch VA (eds). Cochrane Handbook for Systematic Reviews of Interventions Version 6.2 (updated February 2021). Cochrane, 2021. Available from: www.training.cochrane.org/handbook. Technical supplement: https://training.cochrane.org/handbook/current/chapter-04-technical-supplement-searching-and-selecting-studies#section-3-6-2. Cochrane, 2021. [Google Scholar]
Lemoyne 2019
- Lemoyne SE, Herbots HH, De Blick D, Remmen R, Monsieurs KG, Van Bogaert P. Appropriateness of transferring nursing home residents to emergency departments: a systematic review. BMC Geriatrics 2019;19(1):17. [DOI] [PMC free article] [PubMed] [Google Scholar]
Liberati 2009
- Liberati A, Altman DG, Tetzlaff J, Mulrow C, Gotzsche PC, Ioannidis JP, et al. The PRISMA statement for reporting systematic reviews and meta-analyses of studies that evaluate health care interventions: explanation and elaboration. PLOS Medicine 2009;339:b2700. [DOI] [PMC free article] [PubMed] [Google Scholar]
NSW Division of General Practice (MNCDGP)
- Toolkit: creating a multi-disciplinary team approach to care planning in residential aged care facilities. MNCDGP: Rural Palliative Care Project, Aged Care GP Panels Initiative and Integrated Network Palliative Care Project, 2nd Ed, Coffs Harbour 2007.
OECD 2011
- OECD. Chapter 2. Sizing up the challenge ahead: future demographic trends and long-term care costs. In Colombo F, Llena-Nozal A, Mercier J, Tjadens F. Help Wanted? Providing and Paying for Long-Term Care. Available from https://www.oecd-ilibrary.org/social-issues-migration-health/help-wanted_9789264097759-en 2011.
OECD 2019
- OECD. Health at a glance 2019. OECD indicators. https://www.oecd-ilibrary.org/social-issues-migration-health/health-at-a-glance-2019_4dd50c09-en 2019.
OECD 2023
- OECD. Topics: Health. Primary Care. https://www.oecd.org/health/primary-care.htm.
Purgato 2023
- Purgato M, Prina E, Ceccarelli C, Cadorin C, Abdulmalik JO, Amaddeo F, et al. Primary‐level and community worker interventions for the prevention of mental disorders and the promotion of well‐being in low‐ and middle‐income countries. Cochrane Database of Systematic Reviews 2023, Issue 10. Art. No: CD014722. [DOI: 10.1002/14651858.CD014722.pub2] [DOI] [PMC free article] [PubMed] [Google Scholar]
Rankin 2018
- Rankin A, Cadogan CA, Patterson SM, Kerse N, Cardwell CR, Bradley MC, et al. Interventions to improve the appropriate use of polypharmacy for older people. Cochrane Database of Systematic Reviews 2018, Issue 9. Art. No: CD008165. [DOI: 10.1002/14651858.CD008165.pub4] [DOI] [PMC free article] [PubMed] [Google Scholar]
Reed 2015
- Reed RL. Models of general practitioner services in residential aged care facilities. Australian Family Physician 2015;44(4):176-9. [PubMed] [Google Scholar]
Review Manager 2020 [Computer program]
- Review Manager (RevMan). Version 5.4. Copenhagen: Nordic Cochrane Centre, The Cochrane Collaboration, 2020.
Santosaputri 2019
- Santosaputri E, Laver K, To T. Efficacy of interventions led by staff with geriatrics expertise in reducing hospitalisation in nursing home residents: a systematic review. Australasian Journal on Ageing 2019;38(1):5-14. [DOI] [PubMed] [Google Scholar]
Schünemann 2022
- Schünemann HJ, Higgins JPT, Vist GE, Glasziou P, Akl EA, Skoetz N, Guyatt GH. Chapter 14: Completing ‘Summary of findings’ tables and grading the certainty of the evidence. In: Higgins JPT, Thomas J, Chandler J, Cumpston M, Li T, Page MJ, Welch VA (editors). Cochrane Handbook for Systematic Reviews of Interventions version 6.3 (updated February 2022). Cochrane, 2022. Available from www.training.cochrane.org/handbook.
Sterne 2011
- Sterne JA, Sutton AJ, Ioannidis JP, Terrin N, Jones DR, Lau J, et al. Recommendations for examining and interpreting funnel plot asymmetry in meta-analyses of randomised controlled trials. BMJ 2011;343:d4002. [DOI] [PubMed] [Google Scholar]
UN 2019
- United Nations. World population prospects: the 2019 revision. Department of Economic and Social Affairs 2019.
Ward 2008
- Ward D, Drahota A, Gal D, Severs M, Dean T. Care home versus hospital and own home environments for rehabilitation of older people. Cochrane Database of Systematic Reviews 2008, Issue 4. Art. No: CD003164. [DOI: 10.1002/14651858.CD003164.pub2] [DOI] [PMC free article] [PubMed] [Google Scholar]
WHO 2017
- WHO. Global strategy and action plan on ageing and health. https://www.who.int/ageing/global-strategy/en/ 2017.
WHO 2023
- The global health observatory (GHO). Explore a world of health data. https://www.who.int/data/gho.
Wong 2010
- Wong RY. Transferring nursing home residents to acute care hospital--to do or not to do, that is the question. Journal of the American Medical Directors Association 2010;11(5):304-5. [DOI] [PubMed] [Google Scholar]
References to other published versions of this review
Putrik 2021
- Putrik P, Grobler L, Lalor A, Karnon J, Parker D, Morgan M, et al. Models for delivery and co‐ordination of primary or secondary health care (or both) to older adults living in aged care facilities. Cochrane Database of Systematic Reviews 2021, Issue 3. Art. No: CD013880. [DOI: 10.1002/14651858.CD013880] [DOI] [PMC free article] [PubMed] [Google Scholar]