

Abstract
Objective
To assess whether an online interactive report designed to facilitate interpretation of patients' narrative feedback produces change in ambulatory staff learning, behavior at the individual staff and practice level, and patient experience survey scores.
Data Sources and Setting
We studied 22 ambulatory practice sites within an academic medical center using three primary data sources: 333 staff surveys; 20 in‐depth interviews with practice leaders and staff; and 9551 modified CG‐CAHPS patient experience surveys augmented by open‐ended narrative elicitation questions.
Study Design
We conducted a cluster quasi‐experimental study, comparing 12 intervention and 10 control sites. At control sites, narratives were delivered free‐form to site administrators via email; at intervention sites, narratives were delivered online with interactive tools for interpretation, accompanied by user training. We assessed control‐versus‐intervention site differences in learning, behavior, and patient experience scores.
Data Collection
Staff surveys and interviews were completed at intervention and control sites, 9 months after intervention launch. Patient surveys were collected beginning 4 months pre‐launch through 9 months post‐launch. We used control‐versus‐intervention and difference‐in‐difference analyses for survey data and thematic analysis for interview data.
Principal Findings
Interviews suggested that the interface facilitated narrative interpretation and use for improvement. Staff survey analyses indicated enhanced learning from narratives at intervention sites (29% over control sites' mean of 3.19 out of 5 across eight domains, p < 0.001) and greater behavior change at staff and practice levels (31% and 21% over control sites' means of 3.35 and 3.39, p < 0.001, respectively). Patient experience scores for interactions with office staff and wait time information increased significantly at intervention sites, compared to control sites (3.7% and 8.2%, respectively); however, provider listening scores declined 3.3%.
Conclusions
Patient narratives presented through structured feedback reporting methods can catalyze positive changes in staff learning, promote behavior change, and increase patient experience scores in domains of non‐clinical interaction.
Keywords: feedback reporting, intervention, patient experience, patient narratives, quality improvement
What is known on this topic
Patient narratives—feedback from patients collected through structured open‐ended survey questions—can provide useful insights for supporting efforts to improve the quality of care and patient experience.
Collection of patient narratives is insufficient to ensure their use because medical practice staff and clinicians often face challenges in learning from and using patient narratives to induce change.
What this study adds
Reporting interventions designed to facilitate interpretation of patients' narrative feedback can motivate staff learning and behavior changes and lead to improvements in aspects of patient experience targeted for improvement.
Learning and behavior changes motivated by enhanced narrative feedback reporting appear to be greater among non‐clinical staff.
Promoting awareness and use of narratives among clinicians may require different strategies than those employed for non‐clinical staff.
1. INTRODUCTION
Healthcare organizations are increasingly exploring the use of patient narratives—feedback from patients in their own words—to assess and inform their efforts to improve patient experience and quality of care. 1 These explorations parallel growing evidence that narratives significantly enhance the knowledge gained from responses to closed‐ended questions in patient experience surveys, 2 , 3 and that frequently sharing patients' narratives with staff is associated with higher patient experience scores at the organizational level. 4 Research suggests that narratives may have these effects for several reasons: they offer insights into why patients selected a particular response to a closed‐ended question; they illuminate aspects of patient experience not captured by existing surveys; and they suggest actions that organizations can take to improve care. 2 , 3 , 5 , 6 , 7 , 8 Narratives highlight not just problems but also best practices and creative ideas for improvement. 9
To translate this potential into practice improvement, patient narratives must not only be available, but their content must also be interpretable in ways that key actors find actionable. This translation is neither simple nor guaranteed. Most clinicians and administrators are trained to evaluate quantitative metrics, not to draw inferences from narrative content. 10 , 11 The challenges of interpretation and application are magnified when patient narratives are fragmented, use unfamiliar language, or reflect an incomplete understanding of clinical protocols or the delivery system context. 12 , 13 , 14 Under these circumstances, actors who have the most to learn from narrative feedback may not glean the full benefits that narratives have to offer. 14 , 15 , 16
Prior research, however, suggests that learning can be facilitated by structured supports to help interpret narrative content, which in turn promotes perceived user functionality and fosters use within the delivery system. 17 Key features of effective design for feedback reporting in medical settings that have been identified in previous studies include involving end‐users as partners in the design process, use of timely and frequently updated data, benchmarks, or target goals to assess performance, formats and displays that highlight important patterns of performance, and routine delivery modes tailored to the intended audience. 18
This study sought to assess the effects of a reporting intervention for patient narratives founded on these design features and that also included active user training and support. Our research team, with input and collaboration from staff and leadership at our research site, New York‐Presbyterian (NYP), designed and implemented the intervention to facilitate the interpretation of patients' narrative feedback regarding ambulatory care. The intervention involved an online interactive report to be used by NYP leadership, practice administrators, clinicians, and staff. It categorized patient narrative content manually coded by trained researchers based on themes and valence, that is, the extent to which emotional content is positive or negative. It also allowed users to group content using searchable filters (e.g., month and day of visit, type of visit, theme, and patient characteristics such as age and gender) and matched narratives to practice‐level scores on patient experience. Implementation was actively supported by the NYP patient experience staff through training sessions and regular updates.
To assess the intervention's impact, ambulatory care practices were sorted into comparable intervention and control groups. Changes associated with the intervention were measured through staff survey results and patient experience survey scores, with additional insights generated by 20 in‐depth interviews with staff and practice administrators. Our findings suggest that innovative strategies for reporting narrative feedback enable the use of patient narratives to enhance learning, foster behavior changes, and address key aspects of patient experience targeted for improvement.
2. METHODS
2.1. Study setting
We conducted our field experiment in the NYP Ambulatory Care Network (ACN) located in Manhattan, New York. The ACN includes 22 primary care and specialty practices affiliated with one of two academic medical centers (Weill Cornell and Columbia), typically referred to as the two “campuses” within their system. The practices collectively serve a diverse population with variations in unionized staff across the two campuses.
2.1.1. Administration of patient experience surveys
The ACN practices collected data on patient experiences using a modified version of the Consumer Assessment of Healthcare Providers and Systems Clinician & Group (CG‐CAHPS) Survey that included closed‐ended questions for four composite measures (access to care, care coordination, provider communication, and office staff quality) and two overall ratings. The survey also included a structured series of six open‐ended questions presented in Appendix S1. The first five questions comprise the Narrative Item Set (NIS) for the CG‐CAHPS Survey, 19 designed to elicit patient feedback in the form of a narrative conveying a clear and detailed account of experiences, not simply brief comments. 5 , 20 A sixth “improvement” question asked patients what they would change about their care or their interactions within the ACN. 9 All patients with an in‐person ACN visit were invited to complete a survey in English or Spanish by email immediately following their visit and then 5 days later by mail if an email response had not already been submitted.
2.1.2. Reporting conventions for patient feedback
The Patient Experience Lead for each campus emailed practice administrators aggregated survey scores each week. This “scorecard” indicated whether performance at that practice was above or below specific goals set for three “target indicators” selected annually by NYP leadership for improvement across the ACN. See Appendix S2 for all target indicators (2018–2022).
Separately, the Patient Experience Lead emailed each practice administrator a weekly “comment report” containing verbatim responses to the narrative questions. These verbatims were simply listed in the order received from respondents. The Patient Experience Lead also met monthly with practice administrators, supervisors, and staff designated as “care champions” at each site to review comments and scores.
2.2. Development and implementation of the narrative reporting intervention
2.2.1. Intervention development
We constructed the intervention to fit and foster change in a care delivery context. The centerpiece was an online interactive report (called the “interface”) designed to facilitate the interpretation of narrative content and make it easier to identify actionable patterns across a body of narratives. Its design was informed by four sources: (a) our review of several thousand patient narratives collected using the NIS, which the ACN trialed for 2 years prior to our study, (b) literature on participatory co‐design in clinical settings, 21 , 22 , 23 , 24 , 25 , 26 (c) three focus groups held with ACN staff (clinical and non‐clinical) to gather insights specific to the ACN setting, and (d) the literature on diffusion and implementation of innovations in clinical and other settings. 27 , 28 , 29
The lessons derived from these sources led to the development of an online interface enabling easy access to the full range of narratives at each practice site, complemented by the capacity to sort through the narratives in various ways. In order to provide the narrative content displayed on the interface, a team of trained qualitative researchers manually coded all patient feedback collected with the NIS using a coding scheme developed and validated in previous research. 5 , 20
The interface “dashboard” page provides an overview of narrative valence over time and the linkage between the valence of narrative content for particular domains of experience and quantitative performance on each domain's closed‐ended survey composites. Another page allows the user to filter narratives based on time frame, experiential themes, and patient attributes, along with the capacity to place those thematic assessments in the context of the complete narrative response. The last page allows the user to include a subset of narratives selected from the previous pages to include in downloadable action reports that can be shared more broadly within the practice.
We pilot‐tested a beta version of the interface in late 2019. The onset of the COVID‐19 pandemic massively disrupted healthcare within New York City, 30 however, and the ACN suspended patient survey operations until July 2020. Prior to the launch of the intervention experiment in August 2021, we revised the interface to capture telehealth experiences and ACN practice changes in response to COVID conditions.
Figure 1 shows screenshots of the interface's dashboard page and the page containing patient comments in their entirety with filter options. Appendix S3 provides more information on the development of the interface with additional screenshots and explanatory notes.
FIGURE 1.
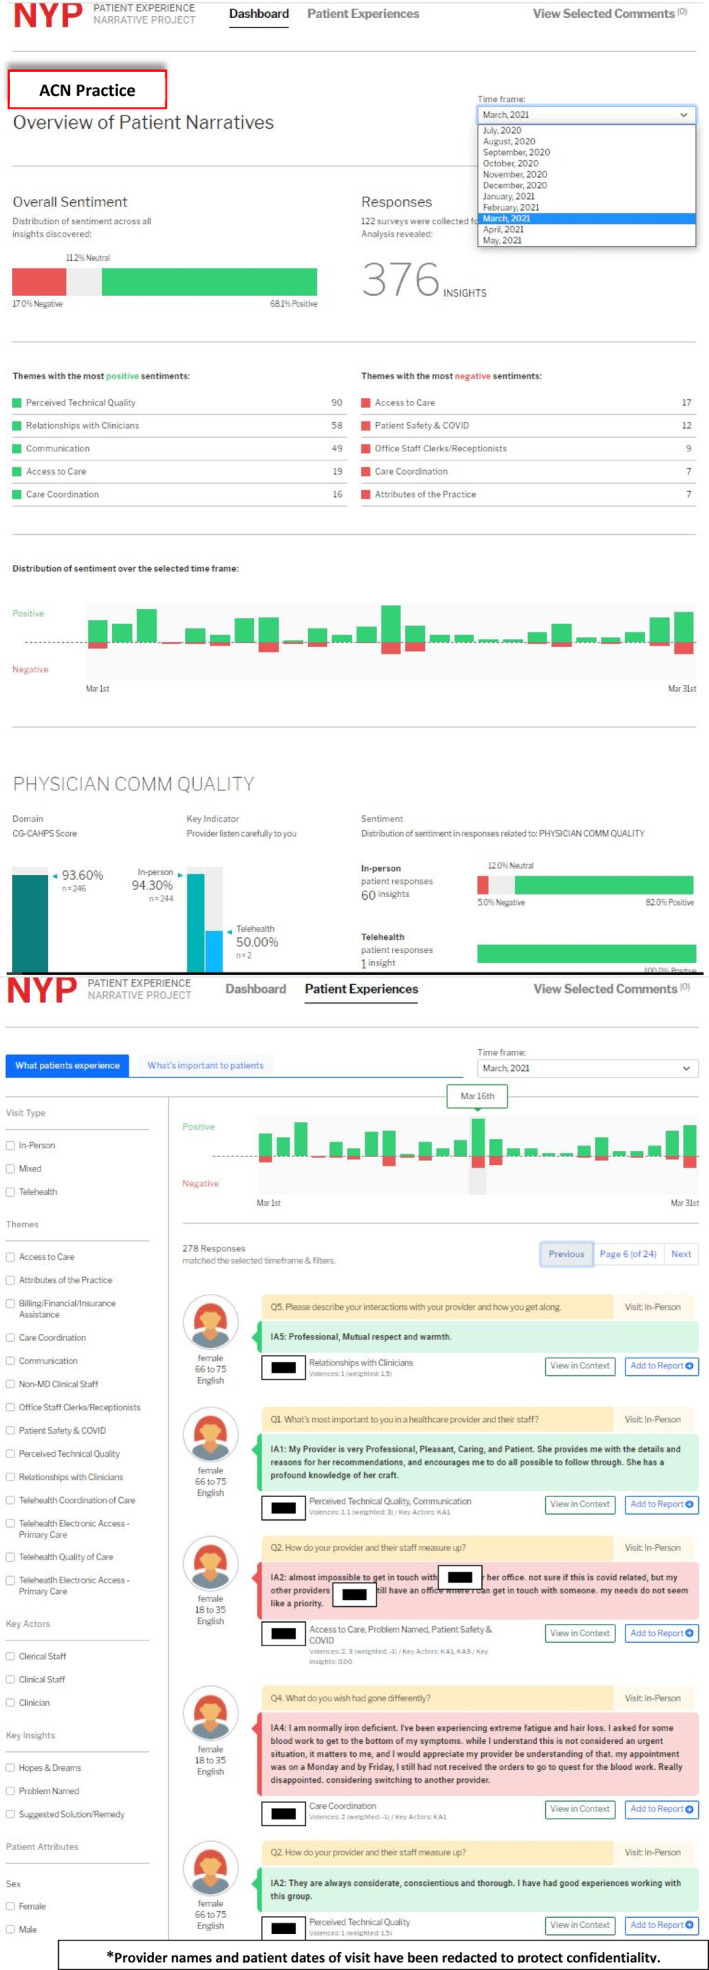
NYP patient narrative report interface: Dashboard page. The Dashboard page presents summary information on the comments received and coded for the selected practice (The term “comments” used in the interface refers to codable content from a portion of the full narrative response). The dashboard allows users to select a specific month. For the selected month, the dashboard shows the number of comments by valence, selected themes, and by specific dates of the month selected. The distribution of positive and negative comments is also shown by CG‐CAHPS composite measure, with a comparison to the CG‐CAHPS scores for in‐person visits as well as key indicator scores for both in‐person and telehealth visits. NYP patient narrative report interface: Patient Experiences detail page. The Patient Experiences detail page allows the user to view all patient comments for the selected month with the ability to sort them by key themes, key insights, key actors, patient attributes, and date of visit. *Provider names and patient dates of visit have been redacted to protect confidentiality.
2.2.2. Intervention implementation
To promote the use of the interface, the ACN Patient Experience Lead met with each administrator and supervisor to demonstrate how to use the interface and to discuss its contents. Approximately every 2–4 weeks thereafter for 6 months, the Patient Experience Lead sent an email to all intervention practices announcing the update of the interface with the latest set of narratives and including a direct link to the interface and description of its features. As part of the on‐site monthly meetings mentioned earlier, the Patient Experience Lead further encouraged interface use, answered questions, and provided hands‐on demonstrations. Toward the end of the study period, the update emails also included short, reminder video demonstrations of how to use the interface. This active support is consistent with best practices from implementation science for promoting practice change. 31 , 32
2.3. Study design
The impact of the intervention was assessed through a cluster quasi‐experimental analysis. Twelve practices (clusters) implemented the interface and were designated the “intervention group/sites”. Their outcomes were compared with those from 10 practices receiving patient narratives elicited through the same survey methods, but which continued to receive their comments via weekly scorecard spreadsheets. Practices were assigned to intervention or control groups to balance specialty mix, campus affiliation, and other known characteristics (Table 1). Likewise, Appendix S4 shows balance across groups in the distribution of characteristics of staff participating in our study at baseline.
TABLE 1.
Comparison of intervention and control sites by selected characteristics at baseline (2021).
| Characteristic | Intervention sites | Control sites |
|---|---|---|
| N sites | 12 | 10 |
| N of primary care sites: Weill Cornell campus | 3 | 4 |
| N of primary care sites: Columbia campus | 4 | 2 |
| N of specialty care sites: Weill Cornell campus | 2 | 2 |
| N of specialty care sites: Columbia campus | 3 | 2 |
| Average annual FTE | 29.7 | 24.7 |
| Average FTE of attending MDs | 4.5 | 2.6 |
| Average FTE of resident MDs | 3.9 | 3.3 |
| Average FTE of nurses | 6.2 | 5.5 |
| Resident training program present | 75% | 80% |
| Low‐level of resident training (<1 FTE resident MD) | 42% | 40% |
| Average annual patient volume | 22,601 | 15,344 |
| Average patient age | 51 | 41 |
| Percent Medicaid patients | 53% | 66% |
| Percent Medicare patients | 33% | 21% |
| Percent white patients | 28% | 21% |
| Percent non‐English patients | 38% | 30% |
We defined the baseline period as the 4 months from April to July 2021 between the completion of the post‐COVID interface revisions and before the launch of the intervention in August 2021. We limited to these 4 months because they were considered by ACN leaders as the first instance when somewhat stable operations resumed since COVID‐19. We defined the follow‐up period as the 9‐month period after the launch (August 2021–April 2022) to have sufficient time to observe the effects. Our study was exempted by the Yale University Institutional Review Board.
2.4. Data sources and analysis
Our assessment relied on three data sources for both control and intervention sites.
2.4.1. Staff surveys
We designed a survey for administration to all staff, including those at the front desk, clinicians of various disciplines, and practice administrators. Questions assessed mechanisms through which the intervention might induce changes. We developed them using literature about quality improvement and narratives, 5 , 9 , 33 , 34 , 35 , 36 consultations with patient experience experts, and the three aforementioned focus groups. Questions used in our analysis focused on: (1) changes in learning associated with increasing access to useful information via patient feedback, and (2) changes in behavior in response to narrative feedback. This first category was measured in terms of eight areas of learning, the latter category in terms of two forms of behavior change (individual staff‐level and practice‐level). Table 2 shows the survey items in each category, which aggregated into composites with discriminant validity (with eigenvalues >1 in exploratory factor analyses) and high levels of internal validity (Cronbach's alphas >0.85). The survey also asked about attributes that might affect response to narratives, including professional roles, tenure at the practice, and perceptions of the prevailing valence among observed narratives.
TABLE 2.
Staff survey measures used in analysis.
| Measure | Response scale | Cronbach's alpha for composite |
|---|---|---|
|
||
|
0.89 | |
| In the last 6 months, how often have written comments from patients about their care been useful for: Identifying | 5‐point scale: 1 = never; 5 = very frequently | |
| ||
| ||
| ||
| ||
| ||
| ||
| ||
| ||
|
0.92 | |
|
5‐point scale: 1 = strongly agree; 5 = strongly disagree | |
| ||
|
0.86 | |
|
5‐point scale: 1 = strongly agree; 5 = strongly disagree | |
| ||
|
||
| Professional role: What is your primary role at this practice |
Coded as: Clinical staff (1–4) = 1 Nonclinical staff (5–8) = 0 |
Not applicable |
| ||
| ||
| ||
| ||
| ||
| ||
| ||
| ||
| Clinic tenure: How long have you worked at this practice? | Dummy variables | Not applicable |
|
||
|
1‐2 years | |
|
3‐5 years | |
|
More than 5 years | |
| Frequency of exposure to patient comments: |
5‐point scale: 1 = Never 5 = Very frequently |
Not applicable |
| In the last 6 months, how often have you seen comments from patients (in their own words) about the care they received in this practice? | ||
| Percentage of observed comments with positive valence: |
Coded as: 1 = 0%–40% positive 2 = 41%–70% positive 3 = 70%–100% positive |
Not applicable |
| In the last 6 months, please indicate the mix of positive and negative comments that you have seen from patients: using slider scale: All Negative = 0 All Positive = 100% |
Note: Composites' discriminant validity was assessed using exploratory factor analysis, applying principal axis factoring with a promax rotation to account for likely correlation among factors. The analysis indicated the three intended composites in Section A, with eigenvalues of 5.35, 2.15, and 1.00, and items loading above 0.45 on their respective composites.
The survey was fielded at the end of the intervention period in April–May 2022 across all 22 ACN practices to assess the differential effects of the interface on learning and behavior in intervention versus control sites. Of the 409 staff invited to participate, 333 (81%) returned a survey with at least some usable responses. We limited the analysis presented here to the 226 respondents who reported seeing at least some narratives in the previous 6 months. Appendix S4 provides detailed information on the characteristics of survey respondents for both intervention and control sites. We analyzed their data using ordinary least squares (OLS) with clustering at the practice level, and adjusting for individual's professional role, tenure at the site, reported exposure to patient comments in the prior 6 months, practice site, and campus. Results were consistent with population‐averaged models using generalized estimating equations (GEE) with practice‐level clustering (in Stata 15). For ease of interpretation, we report OLS estimates.
2.4.2. Staff interviews
To gain additional insights about the impact of the intervention, we conducted 20 in‐depth interviews with practice administrators, supervisors, and “care champions” drawn from a subset of eight practices representing a mix of intervention and control sites, as noted in Appendix S5. Interviews were conducted virtually from March to early May 2022 by three members of the research team using a semi‐structured interview guide focused on exploring staff experiences with patient‐generated feedback. Interviews with intervention sites also included questions related to the use and perceived value of the reporting interface. All interviews were recorded, transcribed, and coded in the MAXQDA qualitative analysis software program using thematic analysis, with overall codes derived both deductively (based on questions in the interview guide) and inductively (based on data generated through the semi‐structured interviews) by three researchers, independently and then together. The analysis presented here focuses on interview data specific to the interface collected from the intervention sites only, and uses the “factist” approach characteristic of thematic analyses which assumes narrative testimony to be “more or less accurate and truthful indexes of reality”. 37 , 38
2.4.3. Patient experience surveys
We used difference‐in‐difference (DnD) models to assess the impact of the intervention on each patient experience question in the modified CG‐CAHPS survey, four composite measures, and one additional question used by NYP. We excluded the rating questions because they do not capture patient‐reported experiences and they are not included in the ACN performance goals. Appendix S6 presents each survey question and indicates whether it was denoted as a target indicator from 2018 to 2022. Even though the interface launched in 2021, we examined changes in target indicators prioritized as early as 2018 because our interviews and analysis of patient comments revealed these remained important areas of focus for improvement. We employed the “top‐box” approach for reporting CAHPS responses 7 to create outcome variables, first creating binary variables to indicate whether a patient reported having had the best experience for each item and then averaging the related items to compute a composite score for each outcome measure.
The DnD models were estimated using completed survey data from 9551 respondents drawn from the 9596 surveys returned from a total of 342,362 patients during the baseline and intervention periods, producing completion and response rates of 99.5% and 2.80%, respectively. The range of response rates was reasonably similar in the intervention and control sites (1.82%–2.97% and 1.50%–8.43%, respectively), minimizing concern that our model results reflect response bias. Each model adjusted for patient age, gender, level of education, race and ethnicity, self‐reported health and mental health, as well as 2021 practice characteristics (patient volume, proportion of patients on Medicaid, and average patient age). Models adjusted for month and year of the patient visit, practice, and campus to account for unmeasured attributes that could confound our results. Robust standard errors were clustered at the practice level. 39 , 40 Appendix S7 presents pre‐intervention summary statistics for the outcome variables.
3. RESULTS
3.1. Staff survey results
As Table 3 shows, staff reported significantly greater responses to narrative feedback in intervention versus control sites, controlling for attributes of the respondents as well as the extent and nature of narrative exposure during the previous 6 months. These results suggest that the intervention was associated with enhanced learning (more frequent receipt of useful information) and behavior change, relative to control sites. While the learning effects were all statistically significant (29% over control sites' mean of 3.19 out of 5 across eight domains, p < 0.001), the magnitude of the coefficients varied by the type of narrative feedback. The most pronounced differences between intervention and control sites, indicated by the size of the coefficients, were evident for narratives that conveyed positive experiences (e.g., identifying best practices). Coefficients associated with narratives calling out exceptional experiences were the smallest, while narratives identifying weaknesses were associated with intermediate differences. It is noteworthy that these findings emerged despite limited differences in narrative exposure: 24% of respondents at intervention sites reported never seeing narratives, compared to 23% at control sites.
TABLE 3.
Staff survey results related to learning from patient narratives and behavior change (N = 180).
| Dependent variables: Potential mechanisms of influence | ||||||||||
|---|---|---|---|---|---|---|---|---|---|---|
| Receipt of useful information for identifying | Behavior change | |||||||||
| 1 | 2 | 3 | 4 | 5 | 6 | 7 | 8 | 9 | 10 | |
| Best practices by clinicians or staff | Operations that work well | Patients' hopes for how care could be | Problems with operations | Problems between patients and clinicians or staff | Creative ideas for improving care | Exceptional people | Exceptional ways of doing things | Individual changes | Clinic changes | |
| Control site mean = 2.98, SE = 0.11 | Control site mean = 3.24, SE = 0.10 | Control site mean = 3.19, SE = 0.09 | Control site mean = 3.17, SE = 0.10 | Control site mean = 3.12, SE = 0.09 | Control site mean = 2.91, SE = 0.11 | Control site mean = 3.53, SE = 0.09 | Control site mean = 3.14, SE = 0.11 | Control site mean = 3.35, SE = 0.12 | Control site mean = 3.39, SE = 0.09 | |
| Independent variables | Coef. (RSE) | Coef. (RSE) | Coef. (RSE) | Coef. (RSE) | Coef. (RSE) | Coef. (RSE) | Coef. (RSE) | Coef. (RSE) | Coef. (RSE) | Coef. (RSE) |
| Intervention site member (1 = Yes) | 1.51 (0.13)*** | 1.46 (0.17)*** | 1.33 (0.11)*** | 0.66 (0.15)*** | 0.62 (0.16)*** | 0.88 (0.18)*** | 0.51 (0.12)*** | 0.37 (0.18)*** | 1.04 (0.16)*** | 0.73 (0.11)*** |
| Professional role (1 = Clinical staff) | −0.28 (0.22) | −0.34 (0.18) † | −0.33 (0.18) † | −0.21 (0.19) | −0.26 (0.15) | −0.28 (0.18) | −0.22 (0.16) | −0.28 (0.18) | −0.56 (0.19)** | −0.43 (0.18)* |
| Clinic tenure (reference = less than 1 year) | ||||||||||
| 1–2 years | −0.58 (0.29) | 0.14 (0.33) | −0.24 (0.29) | 0.57 (0.27)* | 0.35 (0.34) | 0.10 (0.29) | 0.04 (0.19) | 0.10 (0.32) | −0.05 (0.37) | −0.23 (0.22) |
| 3–5 years | 0.02 (0.29) | 0.04 (0.35) | −0.08 (0.36) | 0.26 (0.33) | 0.15 (0.34) | −0.02 (0.38) | −0.10 (0.31) | −0.24 (0.36) | −0.15 (0.37) | −0.15 (0.30) |
| 5+ years | −0.52 (0.18)** | −0.08 (0.26) | −0.37 (0.22) | 0.31 (0.27) | −0.15 (0.28) | −0.29 (0.18) | −0.21 (0.11) † | −0.26 (0.21) | −0.02 (0.31) | −0.22 (0.21) † |
| Frequency of comment exposure | 0.11 (0.08) | 0.09 (0.06) | 0.18 (0.05)** | 0.10 (0.09) | 0.11 (0.09) | 0.10 (0.80) | 0.13 (0.06)* | 0.08 (0.09) | 0.02 (0.08) | 0.12 (0.09) |
| Mix of positive and negative comments seen (reference = 0–40% positive) | ||||||||||
| 41%–70% positive | −0.03 (0.17) | 0.26 (0.21) | 0.41 (0.16)* | 0.05 (0.25) | 0.40 (0.24) | 0.39 (0.18)* | 0.46 (0.21)* | 0.45 (0.18)* | 0.15 (0.23) | 0.04 (0.19) |
| 70%–100% positive | 0.28 (0.29) | 0.38 (0.25) | 0.36 (0.29) | 0.01 (0.19) | 0.16 (0.21) | 0.71 (0.30)* | 0.52 (0.23)* | 0.60 (0.28)* | −0.05 (0.28) | 0.24 (0.16) |
| Campus | 1.48 (0.11)*** | 1.07 (0.18)*** | 0.37 (0.12)** | 0.56 (0.17)* | 1.05 (0.17)*** | 0.28 (0.15) † | 0.12 (0.089) | 0.14 (0.15) | −0.31 (0.14)* | 0.07 (0.08) † |
| Constant | 0.84 (0.31)* | 0.94 (0.47) † | 1.36 (0.29)*** | 1.87 (0.047)*** | 1.13 (0.49)* | 1.57 (0.52)** | 2.04 (0.35)*** | 2.07 (0.47)*** | 2.88 (0.43)*** | 2.80 (0.50)*** |
| Site fixed effects | Yes | Yes | Yes | Yes | Yes | Yes | Yes | Yes | Yes | Yes |
| R 2 | 0.26 | 0.19 | 0.26 | 0.13 | 0.22 | 0.28 | 0.19 | 0.23 | 0.18 | 0.24 |
Note: Response scales were 1–5.
Abbreviations: Coef., coefficient; RSE, robust standard error.
p < 0.05;
p < 0.01;
p < 0.001;
p < 0.10.
The results in Table 3 reveal several additional patterns. Staff more frequently exposed to narratives, all else equal, report more learning from narratives—with statistically significant differences for two of 10 outcomes. Those with the longest tenure report less learning and change, significant or marginally significant for three of 10 outcomes.
Two other patterns may be particularly insightful for understanding the pathways through which the intervention was associated with change in ACN practices. Survey respondents who were clinicians were consistently less likely to report learning or behavior change, significant for the two behavior outcomes. However, the magnitude of these coefficients is far smaller than those assessing the main effects of the intervention—suggesting that the intervention affects learning and behaviors for clinicians as well as other staff, but less substantially for the former. Respondents who reported having been exposed primarily to positive narratives were significantly more likely to report learning from feedback related to exemplary practices—making these learning effects similar to or higher than those from best practices.
3.2. Staff interview results
Interviews with practice administrators and supervisors at intervention sites provided insight regarding how the interface was received and used thereby enabling learning and behavior change. Most respondents found the interface to be user‐friendly, visually pleasing, and a good tool for facilitating the active use of narratives. Comments are “now more visible,” said one person; “easy to read and easy to interpret,” offered another. A number of interviewees noted how simple it was to assemble reports combining clusters of narratives.
Many people mentioned the interface's dashboard structure, which allowed them to see complex data clearly and have the ability to drill down or query the data—for example, by substantive themes or by combining or separating negative and positive comments—so it could be used in ways specific to their needs. As one user put it, “what I like about the narrative piece is it's right there… you have the red. You have the green. And so that way it can be addressed… You don't have to do digging anywhere for anything, so I like that.” Others spoke about how useful it is to “filter based on categories…[and] themes;” the advantage of being able to analyze by respondent attributes to see any differences “between what an older person will say versus someone who is younger, especially when it comes to using self‐check in, things like that;” and the benefits of visualizing “a trend over here, or… an issue over there.”
Respondents valued the ability to explore data longitudinally, making it easier to take and assess action. “It tells us that what we're doing… or things that we try to fix, if it's actually working,” noted one person. “Like say 2 months ago, a patient said ‘oh, I didn't like that the tablets were dead’ so we put an initiative to make sure the tablets in the front have chargers. Now I can look and see if…we did our due diligence and it worked.” Another pointed out how useful it is to select the narratives to focus on with staff and have them all in one place. “I also like the fact that you could pick from something that happened last month and something that happened from like a couple months ago to be all in one page as well.”
A few respondents described in detail how the interface made it easier to present narrative content to front‐line staff to plan improvements linked to the current target indicators. “So, using the narrative,” said one practice administrator, “you can look at the dashboard and see that that score didn't meet it… cause clearly, you have the number and then you have what your goal is supposed to be on there. And then you can click to the next screen and go directly to what patients are saying. You can scroll down go to those red areas and take a look to see, oh, okay, patient is saying, I was in for an appointment on this particular day, and no one looked up from the desk. There was no acknowledgement that I was in this space. That's something I can drill‐down on with the team and say, you know what? This is what the patients are saying … We need to take a look at this.”
Interviewees also offered a few critiques of the interface. Most common was the criticism that there was too much lag time between when the narratives were offered by patients and when they became available on the interface. A few people noted that adapting to using a new tool in a busy clinic is difficult, and they had not yet been able to form a habit of using it.
3.3. Patient experience survey results
Table 4 shows the results of our DnD analyses of the effect of the intervention on patient‐reported experiences. One of the four patient experience composites, office staff quality, significantly improved (3.7% increase over the pre‐intervention mean). This improvement was driven by patients reporting that office staff were more helpful (5.1% increase over the pre‐intervention mean) following the intervention. None of the items within the access to care composite significantly changed. However, whether patients were kept informed if their wait time exceeded 15 minutes, a target indicator that NYP used to measure access, significantly improved (8.2% increase relative to the pre‐intervention mean). Among the provider communication items, patients reported that providers were less likely to listen carefully following the intervention (3.3% decrease relative to the pre‐intervention mean). No items within the care coordination composite, none of which were target indicators, significantly changed following the intervention.
TABLE 4.
Results of difference‐in‐difference (DnD) analyses of intervention effect on patient experience composites and individual items.
| Survey measure composite/question item | DnD estimate (SE) | Pre‐intervention means | N | |
|---|---|---|---|---|
| Control | Intervention | |||
| Access to care | 0.019 (0.013) | 0.775 | 0.804 | 9186 |
|
−0.022 (0.020) | 0.827 | 0.888 | 3286 |
|
0.003 (0.015) | 0.875 | 0.892 | 7568 |
|
0.088* (0.044) | 0.496 | 0.451 | 2832 |
|
0.029 (0.044) | 0.459 | 0.517 | 1082 |
|
0.044* (0.022) | 0.789 | 0.804 | 9086 |
|
0.055** (0.021) | 0.674 | 0.667 | 5885 |
| Office staff quality | 0.032** (0.010) | 0.859 | 0.871 | 8973 |
|
0.043*** (0.012) | 0.835 | 0.841 | 8933 |
|
0.019 (0.011) | 0.882 | 0.900 | 8911 |
| Provider communication | −0.008 (0.011) | 0.898 | 0.927 | 9177 |
|
−0.014 (0.013) | 0.895 | 0.934 | 9083 |
|
−0.031** (0.014) | 0.899 | 0.941 | 9085 |
|
−0.004 (0.013) | 0.935 | 0.960 | 9077 |
|
0.014 (0.009) | 0.888 | 0.912 | 9073 |
|
−0.004 (0.017) | 0.908 | 0.929 | 8574 |
|
0.016 (0.016) | 0.855 | 0.890 | 9076 |
|
−0.022* (0.012) | 0.929 | 0.950 | 9091 |
| Care coordination | 0.023 (0.022) | 0.740 | 0.706 | 9163 |
|
0.052 (0.034) | 0.613 | 0.602 | 5137 |
|
0.006 (0.012) | 0.936 | 0.958 | 9003 |
|
0.047 (0.033) | 0.505 | 0.452 | 7282 |
Note: Target indicators shown in italics. Robust standard errors in parentheses. The table reports the difference‐in‐difference estimate which captures the adjusted difference between the post‐ and pre‐intervention means of the intervention group relative to the control group. All models adjust for patient characteristics (age, sex, level of education, race, self‐reported health, self‐reported mental health, practice characteristics (patient volume, proportion of patients on Medicaid, average patient age), practice, campus, and month and year of care visit. Robust standard errors are clustered at the practice level. Changes relative to the baseline can be computed by dividing the DnD estimate by the pre‐intervention intervention group mean.
This item is included on the ACN survey but is not included in the calculation of the access to care composite score.
p < 0.10;
p < 0.05;
p < 0.01.
4. DISCUSSION
Our assessment of the impact of a narrative feedback interface with active user support demonstrates a positive and significant effect on staff learning, as well as behavior changes for both individual staff and at the practice‐level. Our interview data suggest that the interface served to simplify the complex task of accessing and interpreting narrative feedback. This allowed key actors to assess performance over time, understand what was and was not working well, and extract examples that demonstrate themes and illustrate actionable responses.
These benefits were accompanied by both positive and negative changes in patient experience scores. Our finding of significant differences between intervention and control sites after a short intervention period (9 months) is noteworthy in light of research demonstrating the challenges of changing patient experience scores. 41 This is especially noteworthy since the ACN was still “recovering” from COVID‐19‐related disruptions.
The negative effects detected on the provider communication measures align with our observations and interview data indicating that while provider “listening” and “explaining” were target indicators for several years, they were not the focus of improvement efforts undertaken by ACN practices during the study period. Practices instead focused on non‐clinical interactions that were prioritized by administrators as most directly within their control. Declines in communication scores may thus have resulted from limited attention to communication while pursuing improvement of non‐clinical experiences. Tackling areas more directly within the locus of control first is a logical approach supported by management research. 42 , 43
Our findings identify how self‐reported staff learning and narrative valence intersect. The organizational behavior literature suggests that organizational learning is catalyzed through both positive and negative feedback, with little clarity regarding comparative impact. 46 , 47 We found that the largest coefficients associated with learning from the narrative intervention were linked to feedback regarding positive aspects of performance (i.e., best practices used by clinicians and staff, and operations that worked well). Irrespective of sites' intervention status, when the mix of patient comments was predominantly positive, individuals were more likely to see opportunities for learning from exceptional experiences and creative ideas than from problems or less exceptional experiences. These findings suggest that research on organizational learning in healthcare may need to account for the valence mix in content.
The findings reported here may contribute in several other ways to our broader understanding of how learning and innovation occur in healthcare systems. As noted above, the analyses of both staff and patient experience surveys suggest that clinical staff were learning less from narrative feedback than nonclinical staff. Yet organizational research suggests that the potential for learning would be greatest among high‐status staff, thought to have the highest motivation and opportunity for learning and the most discretion in adapting their practices. 44 , 45 Our findings to the contrary may be a byproduct of the ACN's tendency to deploy narrative feedback in ways orchestrated by practice administrators rather than medical directors. They may also reflect clinicians' role‐specific challenges with respect to learning from patient narratives: because they are already focused on listening to narratives, which inform their assessment of clinical trajectories, clinicians may struggle to absorb and respond to additional kinds of narrative feedback. Future research focused on how clinicians, administrators, and overall sites respond to communication feedback in interfaces like ours should be pursued to understand why negative effects occur, how long they last, and how they can be mitigated.
For organizations, less clinician learning from narratives and negative communication effects with the interface implies a need to aid sites' response to provider‐related feedback. Sites may need new resources (e.g., longer appointment/communication time). They may also need to present narrative feedback differently to clinicians: with different dashboard formats, greater frequency, different timing, or other supportive tools. For non‐clinicians however, the existing intervention seemingly fostered a new understanding of how “little” things like informing patients of extended wait times make a difference to patients, and thus survey responses. Simply providing comments in control sites did not spark such learning and behavior change.
This study has some notable limitations. First, although our statistical models adjust for individual attributes and include practice‐site and campus‐level fixed effects, it is possible that unmeasured operational differences across sites account for some of the observed intervention‐related differences. Other factors such as ongoing staffing changes, repurposing of practice sites during the pandemic, and uneven effects of external environmental influences (e.g., COVID‐related policies) might also be affecting outcomes in ways not fully accounted for here. That said, we would expect external factors to be reflected relatively evenly across outcome variables; instead, what we found was considerable variation associated with the intervention—across both learning domains and patient‐reported experiences. This variation makes external factors less likely to be the main driver of outcome differences.
One potential concern about generalizing our findings involves the substantial impact of the COVID‐19 pandemic on healthcare in New York City. 30 To assess the potential impact on perceptions of patient narratives, we incorporated three COVID‐specific questions in the staff survey that were worded identically to earlier questions regarding learning from patient comments about day‐to‐day operations, what worked well, and what problems were emerging. Assessments of the usefulness of narratives between general and COVID‐specific learning were correlated 0.63–0.65, with mean scores slightly lower for COVID‐specific learning: 3.16 versus 3.12 for day‐to‐day operations, 3.07–3.00 for learning about problems, and 3.24–3.11 for learning about what worked well. We thus conclude that the pandemic had little impact on narrative learning; if anything, it perhaps slightly reduced the perceived usefulness of narrative feedback.
Given the low response rates for the patient experience survey, the improvements documented here may not extend to the entire ACN patient population. Due to limited resources, insights we gathered through qualitative interviews were drawn primarily from intervention sites, making it harder to reliably assess ongoing influences in control sites.
Last, because our intervention combined implementation of the narrative interface with support services from NYP's patient experience staff, our analyses do not allow us to distinguish the relative importance of each. Future studies should assess how much user support was critical for results and whether that support might be more effectively implemented to benefit targeted users. Future studies should also assess how much our findings generalize to other clinical settings.
5. CONCLUSION
This study has demonstrated that patient narratives presented in a user‐friendly format, accompanied by concerted implementation efforts, can catalyze changes in learning and behavior in busy ambulatory care settings. That these effects occurred in a delivery system that had been severely stressed by the COVID‐19 pandemic testifies to the capacity of narrative feedback to adapt to changing circumstances and provide a range of actionable feedback, in response to both positive and negative experiences reported by patients.
The effectiveness of the narrative interface demonstrates the importance of report designs that allow users to quickly identify and deploy actionable insights. Our study also reveals the value of organizational support to foster the interpretation of narrative feedback. Having demonstrated that improvements can be achieved when access to patient narratives is facilitated primarily through practice administrators and supervisory staff, future studies should explore the potential for even more transformative impact by operationalizing direct access to and use of narratives by both clinical and frontline staff.
Supporting information
Appendix S1. CAHPS Narrative Item Set (NIS) questions.
Appendix S2. NYP Ambulatory Care Network (ACN) target indicators, 2018–2022.
Appendix S3. Development and detailed description of the patient narrative report interface.
Appendix S4. Characteristics of staff survey respondents.
Appendix S5. Interviews by role and study group.
Appendix S6. Modified CG‐CAHPS patient experience measures* and composites.
Appendix S7. Pre‐intervention summary statistics for patient experience measures.
ACKNOWLEDGMENTS
We thank the patients, leaders, and staff of New York‐Presbyterian Hospital for their generous contributions to this research. This research was supported in part by grants from the Agency for Healthcare Research and Quality (AHRQ; Grant# U18 HS016978, CAHPS V) and the William and Phyllis Mack Institute for Innovation Management at The Wharton School at the University of Pennsylvania.
Shaller D, Nembhard I, Matta S, et al. Assessing an innovative method to promote learning from patient narratives: Findings from a field experiment in ambulatory care. Health Serv Res. 2024;59(2):e14245. doi: 10.1111/1475-6773.14245
REFERENCES
- 1. Schlesinger M, Grob R, Shaller D. Using patient‐reported information to improve clinical practice. Health Serv Res. 2015;50:2116‐2154. [DOI] [PMC free article] [PubMed] [Google Scholar]
- 2. Gallan AS, Niraj R, Singh A. Beyond hcahps: analysis of patients' comments provides an expanded view of their hospital experiences. Patient Exp J. 2022;9(1):159‐168. [Google Scholar]
- 3. Guney S, Gandhi TK. Leveraging AI to understand care experiences: insights into physician communication across racial and ethnic groups. NEJM Catal Innov Care Deliv. 2022;3(2). [Google Scholar]
- 4. Nembhard IM, Matta S, Shaller D, Lee YSH, Grob R, Schlesinger MJ. Learning from patients: the impact of using patient narratives on patient experience scores. Health Care Manage Rev, forthcoming. 2023. [DOI] [PMC free article] [PubMed] [Google Scholar]
- 5. Grob R, Schlesinger M, Barre LR, et al. What words convey: the potential for patient narratives to inform quality improvement. Milbank Q. 2019;97(1):176‐227. [DOI] [PMC free article] [PubMed] [Google Scholar]
- 6. Kilaru AS, Meisel ZF, Paciotti B, et al. What do patients say about emergency departments in online reviews? A qualitative study. BMJ Qual Saf. 2016;25(1):14‐24. [DOI] [PubMed] [Google Scholar]
- 7. Schlesinger M, Grob R, Shaller D, et al. Taking patients' narratives about clinicians from anecdote to science. N Engl J Med. 2015;373(7):675‐679. [DOI] [PubMed] [Google Scholar]
- 8. Dohan D, Garrett SB, Rendle KA, Halley M, Abramson C. The importance of integrating narrative into health care decision making. Health Aff. 2016;35(4):720‐725. [DOI] [PMC free article] [PubMed] [Google Scholar]
- 9. Lee YSH, Grob R, Nembhard IM, Shaller D, Schlesinger MJ. The new frontier: patients as sources of creative ideas for health care improvement. Acad Manage Conf Proc. 2022;2022:10863. [Google Scholar]
- 10. Charon R. Narrative medicine. JAMA. 2001;286(15):1897. [DOI] [PubMed] [Google Scholar]
- 11. Merchant RM, Volpp KG, Asch DA. Learning by listening—improving health care in the era of yelp. JAMA. 2016;316(23):2483‐2484. [DOI] [PubMed] [Google Scholar]
- 12. de Vos MS, Hamming JF, Marang‐van de Mheen PJ. The problem with using patient complaints for improvement. BMJ Qual & Saf. 2018;27(9):758‐762. [DOI] [PubMed] [Google Scholar]
- 13. Birkeland S. Health care complaints and adverse events as a means of user involvement for quality and safety improvement. Milbank Q. 2019;97(1):346‐349. [DOI] [PMC free article] [PubMed] [Google Scholar]
- 14. Sheard L, Marsh C, O'Hara J, Armitage G, Wright J, Lawton R. The patient feedback response framework – understanding why UK hospital staff find it difficult to make improvements based on patient feedback: a qualitative study. Social Sci Med. 2017;178:19‐27. [DOI] [PMC free article] [PubMed] [Google Scholar]
- 15. Flott KM, Graham C, Darzi A, Mayer E. Can we use patient‐reported feedback to drive change? The challenges of using patient‐reported feedback and how they might be addressed. BMJ Qual Safe. 2017;26(6):502‐507. [DOI] [PubMed] [Google Scholar]
- 16. Sheard L, Peacock R, Marsh C, Lawton R. What's the problem with patient experience feedback? A macro and micro understanding, based on findings from a three‐site UK qualitative study. Health Expect. 2019;22(1):46‐53. [DOI] [PMC free article] [PubMed] [Google Scholar]
- 17. McNamara P, McNellis RJ. Making physician feedback reports more effective. NEJM Catal. 2018;4(1). [Google Scholar]
- 18. McNamara P, Shaller D, De La Mare D, Ivers N. Confidential Physician Feedback Reports: Designing for Optimal Impact on Performance. Agency for Healthcare Research and Quality; 2016. [Google Scholar]
- 19. Agency for Healthcare Research and Quality . CAHPS Patient Narrative Item Sets. Content last reviewed October 2021. Agency for Healthcare Research and Quality. https://www.ahrq.gov/cahps/surveys-guidance/item-sets/elicitation/index.html
- 20. Grob R, Schlesinger M, Parker AM, et al. Breaking narrative ground: innovative methods for rigorously eliciting and assessing patient narratives. Health Serv Res. 2016;51(S2):1248‐1272. [DOI] [PMC free article] [PubMed] [Google Scholar]
- 21. Bate P, Robert G. Experience‐based design: from redesigning the system around the patient to co‐designing services with the patient. Qual Saf Health Care. 2006;15(5):307‐310. [DOI] [PMC free article] [PubMed] [Google Scholar]
- 22. Williams SJ, Caley L. Improving Healthcare Services: Coproduction, Codesign and Operations. Springer Nature; 2020. [Google Scholar]
- 23. Bird M, McGillion M, Chambers EM, et al. A generative co‐design framework for healthcare innovation: development and application of an end‐user engagement framework. Res Involve Engage. 2021;7(1):12. [DOI] [PMC free article] [PubMed] [Google Scholar]
- 24. Batalden M, Batalden P, Margolis P, et al. Coproduction of healthcare service. BMJ Qual Saf. 2016;25(7):509‐517. [DOI] [PMC free article] [PubMed] [Google Scholar]
- 25. Schweiger S, Stouten H, Bleijenbergh IL. A system dynamics model of resistance to organizational change: the role of participatory strategies. Syst Res Behav Sci. 2018;35(6):658‐674. [Google Scholar]
- 26. Grindell C, Sanders T, Bec R, Mary Tod A, Wolstenholme D. Improving knowledge mobilisation in healthcare: a qualitative exploration of creative co‐design methods. Evid Policy. 2022;18(2):265‐290. [Google Scholar]
- 27. Greenhalgh T, Robert G, Macfarlane F, Bate P, Kyriakidou O. Diffusion of innovations in service organizations: systematic review and recommendations. Milbank Q. 2004;82(4):581‐629. [DOI] [PMC free article] [PubMed] [Google Scholar]
- 28. Birken S, Clary A, Tabriz AA, et al. Middle managers' role in implementing evidence‐based practices in healthcare: a systematic review. Implement Sci. 2018;13(1):149. [DOI] [PMC free article] [PubMed] [Google Scholar]
- 29. Naumovska I, Gaba V, Greve HR. The diffusion of differences: a review and reorientation of 20 years of diffusion research. Acad Manage Annals. 2021;15(2):377‐405. [Google Scholar]
- 30. Evans R. New York‐presbyterian cxo rick Evans: we are in a patient experience crisis. Becker's Hospital Review. 2021. https://www.beckershospitalreview.com/patient‐experience/newyork‐presbyterian‐cxo‐rick‐evans‐we‐are‐in‐a‐patient‐experience‐crisis.html
- 31. Damschroder LJ, Aron DC, Keith RE, Kirsh SR, Alexander JA, Lowery JC. Fostering implementation of health services research findings into practice: a consolidated framework for advancing implementation science. Implement Sci. 2009;4(1):1‐15. [DOI] [PMC free article] [PubMed] [Google Scholar]
- 32. Huybrechts I, Declercq A, Verté E, Raeymaeckers P, Anthierens S. The building blocks of implementation frameworks and models in primary care: a narrative review. Front Public Health. 2021;9:675171. [DOI] [PMC free article] [PubMed] [Google Scholar]
- 33. Nembhard IM, Cherian P, Bradley EH. Deliberate learning in health care: the effect of importing best practices and creative problem solving on hospital performance improvement. Med Care Res Rev. 2014;71(5):450‐471. [DOI] [PMC free article] [PubMed] [Google Scholar]
- 34. Aranda C, Arellano J, Davila A. Organizational learning in target setting. Acad Manage J. 2017;60(3):1189‐1211. [Google Scholar]
- 35. Kim J‐Y, Kim J‐Y, Miner AS. Organizational learning from extreme performance experience: the impact of success and recovery experience. Organization Sci. 2009;20(6):958‐978. [Google Scholar]
- 36. Desai VM, Maslach D, Madsen P. Organizational learning from failure: present theory and future inquiries. In: Argote L, Levine JM, eds. The Oxford Handbook of Group and Organizational Learning. Oxford University Press; 2020. [Google Scholar]
- 37. Sandelowski M. What's in a name? Qualitative description revisited. Res Nurs Health. 2010;33(1):77‐84. [DOI] [PubMed] [Google Scholar]
- 38. Peterson BL. Thematic analysis/interpretive thematic analysis. In: Matthes J, Davis CS, Potter RF, eds. The International Encyclopedia of Communication Research Methods. Wiley; 2017;1‐9. [Google Scholar]
- 39. Huber PJ. Under Nonstandard Conditions. University of California Press; 1967:221. [Google Scholar]
- 40. White H. A heteroskedasticity‐consistent covariance matrix estimator and a direct test for heteroskedasticity. Econometrica. 1980;48(4):817‐838. [Google Scholar]
- 41. Davies E, Shaller D, Edgman‐Levitan S, et al. Evaluating the use of a modified CAHPS® survey to support improvements in patient‐centred care: lessons from a quality improvement collaborative. Health Expect. 2008;11(2):160‐176. [DOI] [PMC free article] [PubMed] [Google Scholar]
- 42. Spector PE. Behavior in organizations as a function of employee's locus of control. Psychol Bull. 1982;91(3):482‐497. [Google Scholar]
- 43. Manisaligil A, Gölgeci İ, Bakker AB, Aysan AF, Babacan M, Gür N. Understanding change in disruptive contexts: the role of the time paradox and locus of control. J Business Res. 2023;156:113491. [Google Scholar]
- 44. Bunderson JS, Reagans RE. Power, status, and learning in organizations. Organization Sci. 2011;22(5):1182‐1194. [Google Scholar]
- 45. Singh J, Hansen MT, Podolny JM. The world is not small for everyone: inequity in searching for knowledge in organizations. Manage Sci. 2010;56(9):1415‐1438. [Google Scholar]
- 46. Argote L, Lee S, Park J. Organizational learning processes and outcomes: major findings and future research directions. Manage Sci. 2021;67(9):5399‐5429. [Google Scholar]
- 47. Lapré MA, Nembhard IM. Inside the organizational learning curve: understanding the organizational learning process. Found Trends Technol Inform Oper Manage. 2010;4(1):1‐106. [Google Scholar]
Associated Data
This section collects any data citations, data availability statements, or supplementary materials included in this article.
Supplementary Materials
Appendix S1. CAHPS Narrative Item Set (NIS) questions.
Appendix S2. NYP Ambulatory Care Network (ACN) target indicators, 2018–2022.
Appendix S3. Development and detailed description of the patient narrative report interface.
Appendix S4. Characteristics of staff survey respondents.
Appendix S5. Interviews by role and study group.
Appendix S6. Modified CG‐CAHPS patient experience measures* and composites.
Appendix S7. Pre‐intervention summary statistics for patient experience measures.