

Abstract
The DNA-dependent protein kinase (DNA-PK), which comprises the KU heterodimer and a catalytic subunit (DNA-PKcs), is a classical non-homologous end-joining (cNHEJ) factor1. KU binds to DNA ends, initiates cNHEJ, and recruits and activates DNA-PKcs. KU also binds to RNA, but the relevance of this interaction in mammals is unclear. Here we use mouse models to show that DNA-PK has an unexpected role in the biogenesis of ribosomal RNA (rRNA) and in haematopoiesis. The expression of kinase-dead DNA-PKcs abrogates cNHEJ2. However, most mice that both expressed kinase-dead DNA-PKcs and lacked the tumour suppressor TP53 developed myeloid disease, whereas all other previously characterized mice deficient in both cNHEJ and TP53 expression succumbed to pro-B cell lymphoma3. DNA-PK autophosphorylates DNA-PKcs, which is its best characterized substrate. Blocking the phosphorylation of DNA-PKcs at the T2609 cluster, but not the S2056 cluster, led to KU-dependent defects in 18S rRNA processing, compromised global protein synthesis in haematopoietic cells and caused bone marrow failure in mice. KU drives the assembly of DNA-PKcs on a wide range of cellular RNAs, including the U3 small nucleolar RNA, which is essential for processing of 18S rRNA4. U3 activates purified DNA-PK and triggers phosphorylation of DNA-PKcs at T2609. DNA-PK, but not other cNHEJ factors, resides in nucleoli in an rRNA-dependent manner and is co-purified with the small subunit processome. Together our data show that DNA-PK has RNA-dependent, cNHEJ-independent functions during ribosome biogenesis that require the kinase activity of DNA-PKcs and its phosphorylation at the T2609 cluster.
The cNHEJ pathway directly ligates DNA double-strand breaks (DSBs) and is required for V(D)J recombination in developing lymphocytes5. The KU70–KU86 (Ku80 in mice) heterodimer (KU) binds to DNA ends, promotes ligation by the DNA LIG4–XRCC4–XLF complex1, and recruits and activates DNA-PKcs, which activates the Artemis endonuclease for end-processing1. DNA-PKcs is required for end-processing, but not blunt-end ligation6–8. Productive V(D)J recombination requires both end-processing and end-ligation5. Correspondingly, DNA-PKcs-null mice lack mature lymphocytes, but are otherwise normal6–8.
To understand how DNA-PK activity regulates DNA-PKcs, the best characterized substrate of DNA-PK, we generated DNA-PKcsKD/KD mice2 (also known as PrkdcKD/KD). DNA-PKcsKD/KD mice died embryonically with TP53-dependent neuronal apoptosis2, similar to end-ligation-deficient Xrcc4−/− or Lig4−/− mice9,10, indicating that, once recruited to DNA ends, DNA-PKcs requires its kinase activity to license end-ligation. In a TP53-deficient background, cNHEJ-deficient mice (such as Xrcc4−/− mice) succumb to pro-B cell lymphomas by the age of 100 days3,9,11 (Fig. 1a–c). Unexpectedly, most DNA-PKcsKD/KDTp53−/− mice (Tp53 is also known as Trp53) died by 40 days without lymphomas (fewer than 25% survived for more than 80 days and developed pro-B cell lymphomas; Fig. 1a–c, Extended Data Fig. 1a). Pro-B cell lymphomas from Xrcc4−/−Tp53−/− mice carry an alternative end-joining (alt-EJ)-mediated immunoglobulin Igh/Myc translocation and co-amplification3, leading to overexpression of MYC. Alt-EJ is not affected in DNA-PKcsKD/KDTp53−/− B cells12, so lack of translocation cannot explain the low incidence of lymphomas in DNA-PKcsKD/KDTp53−/− mice. Moreover, the early death of DNA-PKcsKD/KDTp53−/− mice is not due to incomplete rescue of the lethal DNA-PKcsKD/KD phenotype by lack of TP53, as most DNA-PKcsKD/KDTp53+/− mice survived to adulthood before succumbing to thymic lymphomas and/or sarcomas due to Tp53 deficiency13 (Fig. 1a–c). Bone marrow and spleen samples from young DNA-PKcsKD/KDTp53−/− mice revealed a myeloid expansion, accumulation of hypolobated and hyperchromatic megakaryocytes, and occasionally c-KIT-positive myeloid blasts (Fig. 1d, Extended Data Fig. 1b, c), characteristic of myelodysplastic syndrome (MDS). MDS does not manifest in other cNHEJ- and TP53-deficient mice, suggesting that kinase-dead DNA-PKcs might have a role in haematopoiesis beyond cNHEJ.
Fig. 1 |. Kinase dead or phosphorylation deficient DNA-PKcs causes haematopoietic defects independent of cNHEJ.
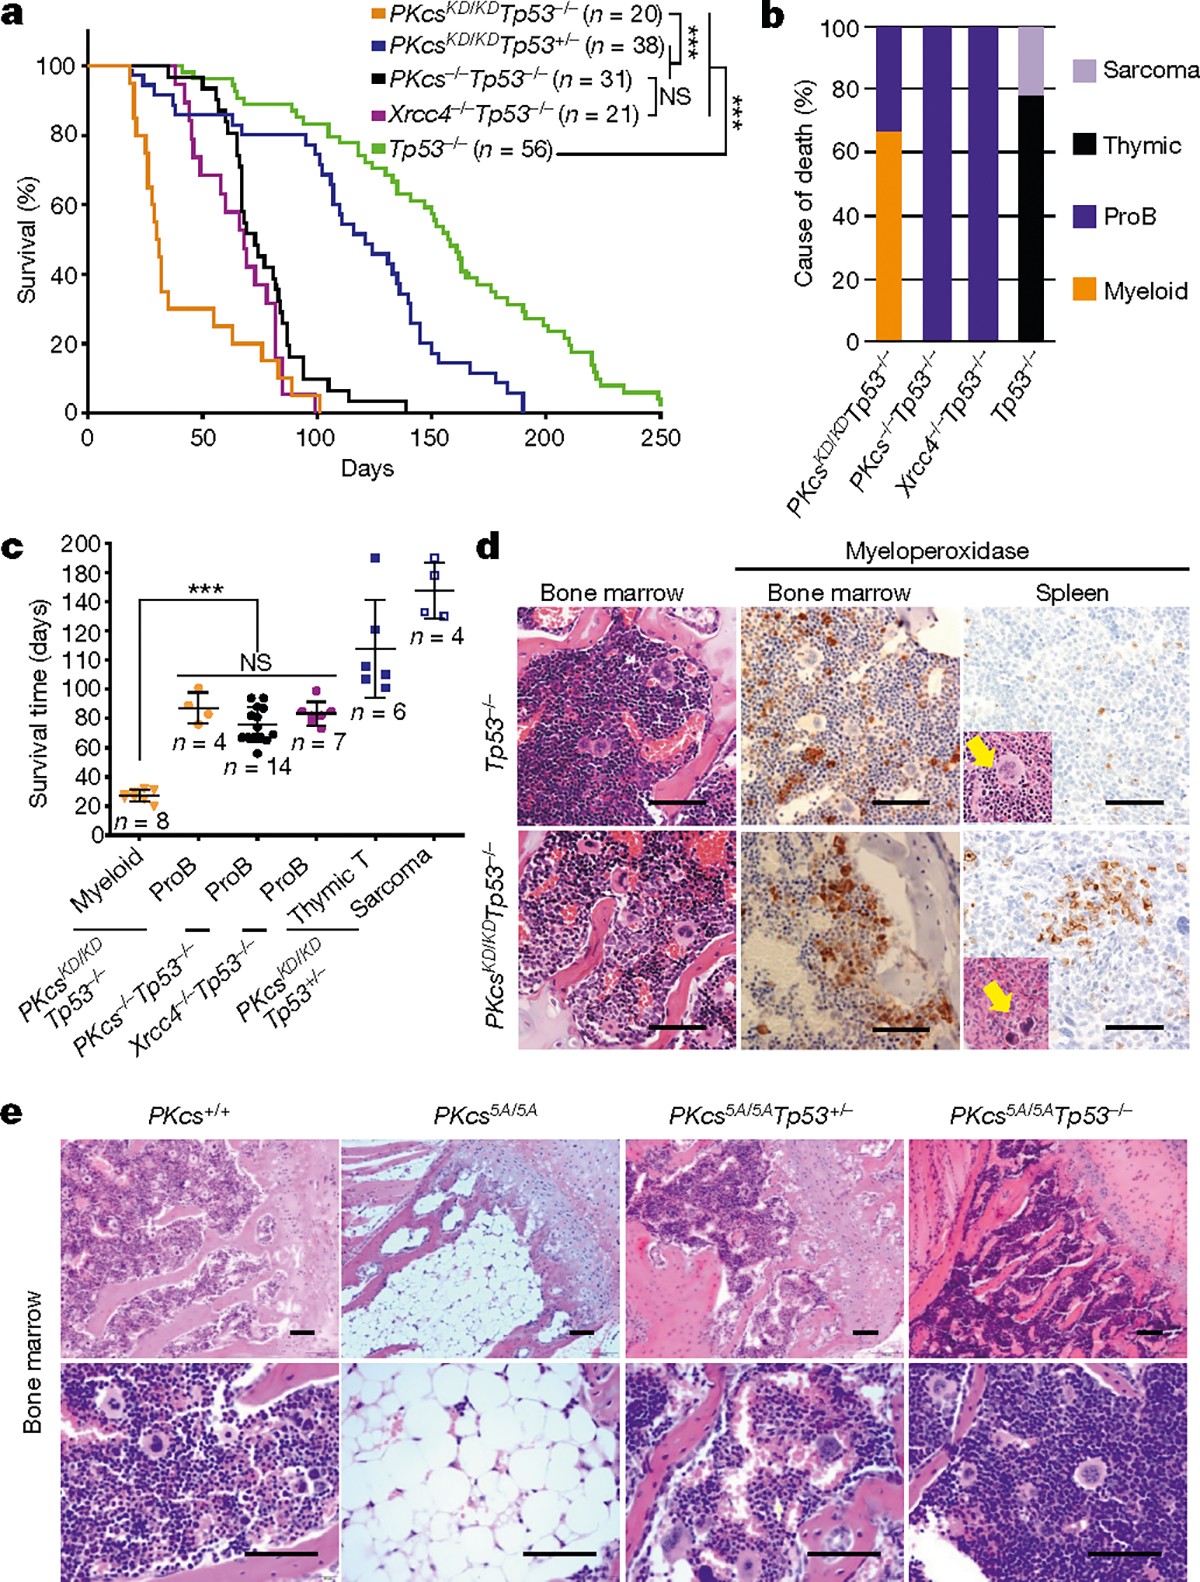
a, Kaplan–Meier survival curve of DNA-PKcsKD/KDTp53−/− and control (DNA-PKcsKD/KDTp53+/−, DNA-PKcs−/−Tp53−/−, Xrcc4−/−Tp53−/− and Tp53−/−) mice. Log-rank (Mantel–Cox) test; ***P < 0.001, NS (not significant) P > 0.05. b, Cause of death for tumour cohorts by genotype. c, The life expectancy for mice of different genotypes plotted by tumour type. Pro-B cell lymphomas in DNA-PKcsKD/KDTp53−/− mice have similiar latency as in DNA-PKcs−/−Tp53−/− and Xrcc4−/−Tp53−/− mice (two-sided unpaired Student’s t-test; ***P < 0.001, NS P > 0.05). Data shown as mean ± s.e.m. d, Representative histological analyses of bone marrow and spleen from 3-week-old DNA-PKcsKD/KDTp53−/− mice. The samples were stained for the myeloid marker myeloperoxidase before being counterstained with haematoxylin (for nuclei). Arrows indicate megakaryocytes. Scale bars, 100 μm. e, Representative histology analyses of bone marrow from 2-week-old DNA-PKcs+/+ and DNA-PKcs5A/5A mice with or without Tp53 deficiency. Scale bars, 100 μm. Exact P values and defined sample sizes (n) are provided in Supplementary Data 1.
DNA-PKcs mutations affect haematopoiesis
To investigate whether loss of autophosphorylation of DNA-PKcs explains the haematopoietic defects, we generated mice with alanine substitutions to either of the two autophosphorylation clusters14,15—the T2609 cluster (DNA-PKcs5A) or the S2056 cluster (DNA-PKcsPQR)16 (Extended Data Fig. 2a–d). DNA-PKcsPQR/PQR mice were healthy16 with normal red blood cell (RBC) and platelet counts (Extended Data Fig. 2e, f). By contrast, alanine substitutions at all five (DNA-PKcs5A/5A) or three out of five (DNA-PKcs3A/3A)17 threonines in the T2609 cluster caused TP53-dependent bone marrow failure (Fig. 1e) and death by 4 weeks of age (Fig. 2a) with severe anaemia, pale organs and thrombocytopaenia (Fig. 2b, Extended Data Fig. 2g–i). Moreover, haematopoietic stem and progenitor cells (HSPCs; Lin−SCA1+c-KIT+) and their downstream progenitors (Lin−SCA1−c-KIT+) decreased by around 1,000-fold in DNA-PKcs5A/5A mice (Fig. 2c, d, Extended Data Fig. 3a, b). Fetal liver HSPC counts from DNA-PKcs5A/5A and DNA-PKcsKD/KD mice also decreased by half (Extended Data Fig. 3c, d), suggesting that these mice had an early haematopoietic defect. Thus, both the kinase activity of DNA-PKcs and autophosphorylation at the T2609 cluster are necessary for haematopoiesis in mice expressing DNA-PKcs.
Fig. 2 |. Mutations in DNA-PKcs cause KU-dependent haematopoietic failure and translation defects.
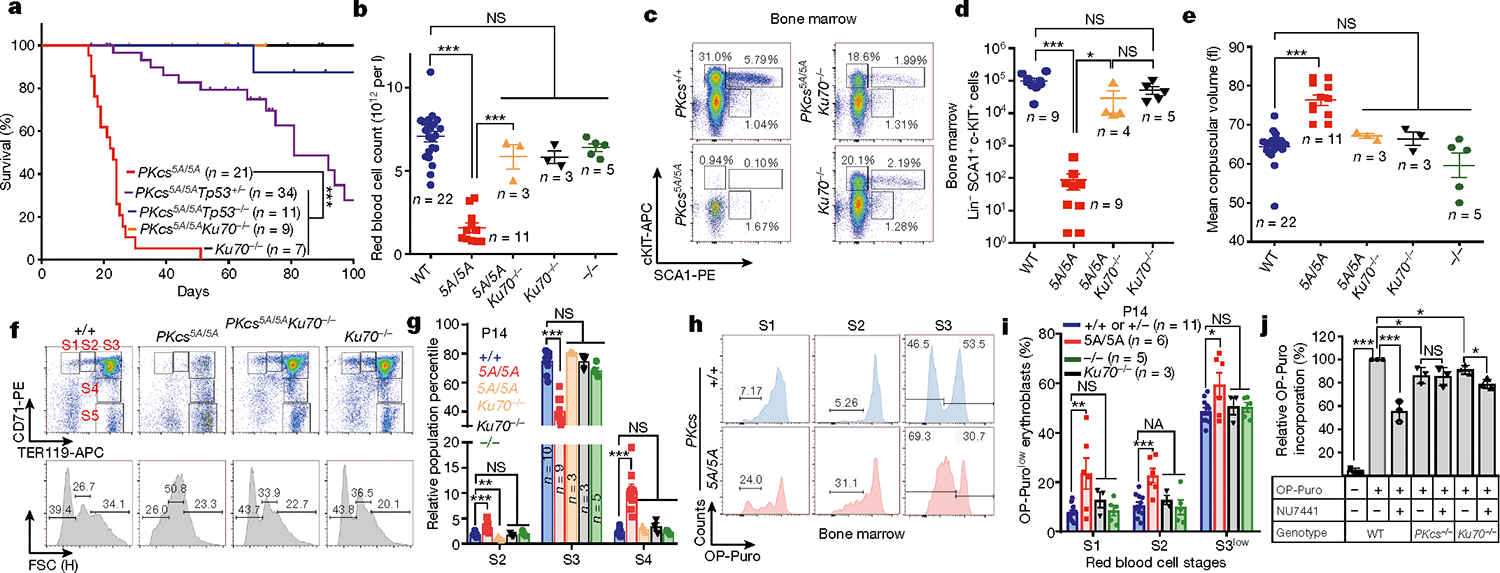
a, Kaplan–Meier survival curve of DNA-PKcs5A/5A, DNA-PKcs5A/5ATp53+/−, DNA-PKcs5A/5ATp53−/−, DNA-PKcs5A/5AKu70−/− and Ku70−/− mice. b, Ku70 deficiency rescued the peripheral RBC counts of 2-week-old DNAPKcs5A/5AKu70−/− mice. c, d, Representative flow cytometry analyses (c) and the absolute number of haematopoietic stem and progenitor cells (Lin−SCA1+c-KIT+) (d) from 2-week-old DNA-PKcs5A/5A and DNA-PKcs5A/5AKu70−/− mice. e, MCV of RBCs from 2-week-old DNA-PKcs5A/5A and DNA-PKcs5A/5AKu70−/− mice. f, Representative flow cytometry analyses of bone marrow RBCs from 2-week-old DNA-PKcs5A/5A and DNA-PKcs5A/5AKu70−/− mice. CD71 and TER119 staining determines the stage of RBC differentiation. S1, CD71+TER119low; S2, CD71+TER119mid; S3, CD71+TER119high; S4, CD71midTER119high; S5, CD71−TER119high. Forward scatter of TER119+ RBCs is shown (bottom). g, Relative frequencies of S2, S3 and S4 among all immature erythroblasts (S1–S4). The S5 percentage is much higher in DNA-PKcs5A/5A mice (Extended Data Fig. 7c). h, Measurements of translation in S1, S2 and S3 erythroblasts from P14 DNA-PKcs+/+ and DNA-PKcs5A/5A mice bone marrow. i, Quantification of the frequency of OP-Purolow among S1, S2 and S3 erythroblasts by OP-Puro labeling of bone marrow cells for 1 h. j, Inhibition of DNA-PKcs with NU7441 leads to a DNA-PKcs- and Ku-dependent reduction in global translation. Graphs show fold change in OP-Puro fluorescence (mean ± s.d.) normalized to DNA-PKcs+/+ cells (set to 100%). Wild-type with or without NU7441 (44% reduction with NU7441); DNA-PKcs−/− with or without NU7441 (~1% reduction with NU7441), and Ku70−/− with or without NU7441 (~10% reduction with NU7441). b, d, e, g, i, Mean ± s.e.m. a, Two-sided log-rank (Mantel–Cox) test, ***P < 0.001. j, Two-sided paired Student’s t-test; all other panels, two-sided unpaired Student’s t-test, ***P < 0.001; **P < 0.01; *P < 0.05; NS, P > 0.05. Exact P values and defined sample sizes (n) are provided in Supplementary Data 1.
Effect of DNA-PK mutations on DNA repair
Next, we investigated whether the anaemia in DNA-PKcs5A/5A mice was triggered by defects in known functions of DNA-PKcs. DNA-PKcs5A/5ATp53−/− mice were viable17 (Fig. 2a) and had wild-type levels of myeloid cells, neutrophils, erythrocytes and platelets, and notably had a substantial number of mature B and T lymphocytes (Extended Data Fig. 4a–e). By contrast, DNA-PKcs−/−Tp53−/− and DNA-PKcsKD/KDTp53−/− mice2 lacked mature B and T lymphocytes (Extended Data Figs. 1a, 4a, b), suggesting that DNA-PKcs5A supports lymphocyte development. Accordingly, V(D)J recombination occurred efficiently in DNA-PKcs5A/5A (Extended Data Fig. 4f–h) and DNA-PKcs3A/3A B cells18. T cell development was also unaffected in DNA-PKcs5A/5ATp53+/− mice (Extended Data Fig. 4i). Moreover, deletion of KU, which abrogates DNA-PK assembly and cNHEJ, rescued lethality (Fig. 2a) and restored HSPCs, RBCs and neutrophils, but not lymphocytes, in DNA-PKcs5A/5A mice (Fig. 2b–d, Extended Data Fig. 4d, e), suggesting that DNA-PKcs has cNHEJ-independent functions during haematopoiesis that require phosphorylation of the T2609 cluster. Accordingly, DNA-PKcs5A/5A mouse embryonic stem cells (ES cells) and fibroblasts (MEFs) were not markedly hypersensitive to DNA-damaging agents such as mitomycin C (MMC) or ionizing radiation (IR)6,19 (Extended Data Fig. 5a–e). DNA-PKcs5A/5A MEFs were more resistant to MMC than MEFs from mice deficient in the Fanconi anaemia (FA) pathway (Fancd2−/−; Extended Data Fig. 5b). Unlike humans with FANCD2 deficiency, Fancd2−/− mice do not develop spontaneous lethal anaemia19. These findings suggest that defects in the FA pathway cannot explain the lethal bone marrow failure of DNA-PKcs5A/5A mice. DNA-PKcs5A/5A MEFs proliferated well, with normal S-phase frequency (Extended Data Fig. 5f, g), in contrast to the marked proliferation defects of cNHEJ-deficient MEFs6,10. On the other hand, DNA-PKcs5A/5A ES cells had reduced S-phase and formed smaller colonies (Extended Data Fig. 6a–c), whereas cNHEJ-deficient ES cells proliferate well6,10. CRISPR-mediated deletion of Ku80 rescued the colony-formation defects of DNA-PKcs5A/5A ES cells (Extended Data Fig. 6a, b). Telomere stability20,21 was comparable between DNA-PKcs5A/5A and DNA-PKcs−/− cells (Extended Data Fig. 6d–f). These findings and the fact that haematopoiesis is unaffected in age-matched DNA-PKcs−/− mice (Fig. 2b, Extended Data Fig. 2g), suggest that neither telomere dysfunction nor cNHEJ deficiency alone can explain the lethal anaemia in DNA-PKcs5A/5A mice.
DNA-PK mutations compromise translation
In addition to DNA, purified KU also binds to RNA22. Yeast Ku binds to the telomerase RNA component (TERC)23,24, but the RNA partners of mammalian KU and the relevance of KU–RNA interactions in mammalian cells remain unclear. Without DNA damage, KU and DNA-PKcs, but not other cNHEJ factors, reside in the nucleolus in a detergent-resistant and Pol I transcription-sensitive manner25 (Extended Data Fig. 8a–c), suggesting that DNA-PK has an RNA-dependent role in the nucleolus. Defects in ribosome biogenesis can trigger TP53-dependent haematopoietic failure26, and protein synthesis is tightly regulated in HSPCs27. Defects in protein synthesis, as exemplified in Diamond–Blackfan anaemia (DBA)28, cause TP53-dependent macrocytic anaemia with increased mean corpuscular volume (MCV, RBC size). DNA-PKcs5A/5A mice but not DNA-PKcs−/− mice displayed TP53-depedent macrocytic anaemia (30% increase in MCV; Fig. 2b, e, Extended Data Figs. 4c, 6g, 7a). In DNA-PKcs5A/5A mice the percentage of CD71+Ter119high (S3) erythroblasts was lower in fetal liver at embryonic day 14.5 (E14.5) and in bone marrow at postnatal day 14 (P14) than in wild-type mice (Fig. 2f, g, Extended Data Fig. 7b, c). Notably, CD71+ erythroblasts (S1–S3) have the highest translation levels among all the haematopoietic cell-types examined (Fig 3f, Extended Data Figs. 3e, 7d), as measured by the incorporation of O-propargyl-puromycin (OP-Puro) into nascent proteins27. An OP-Purolow population accumulated throughout erythroblast development in the P14 bone marrow (Fig. 2h, i) and fetal liver (Extended Data Fig. 7e, f) of DNA-PKcs5A/5A mice, suggesting that there were global translation defects. DNA-PKcs5A/5ATp53+/− erythroblasts also displayed consistent translation defects (Extended Data Fig. 7g), suggesting that DNA-PKcs has a TP53-independent role in protein synthesis. Likewise, TP53-deficient, v-ABL kinase-transformed pro-B cell lines29 derived from DNA-PKcsKD/KD or DNA-PKcs3A/3A mice showed reduced translation (Extended Data Fig. 7h). Chemical inhibition of DNA-PKcs (with NU7441), but not of the related ataxia telangiectasia-mutated (ATM) kinase (with KU55933), reduced global translation (Fig. 2j, Extended Data Fig. 7i). DNA-PKcs−/− and Ku70−/− (also known as Xrcc6) B cells had moderate but consistent translation defects that were insensitive to inhibition of DNA-PK (Fig. 2j). Erythrocyte counts and translation of S3 erythroblasts in young DNA-PKcs−/− or Ku70−/− mice were comparable to those in wild-type mice, and significantly (P < 0.05) higher than in DNA-PKcs5A/5A mice (Fig. 2b, f–i, Extended Data Fig. 6g, h). These results reveal a critical role for DNA-PK kinase and phosphorylation of the T2609 cluster during translation in HSPCs in the presence of KU and DNA-PKcs.
Fig. 3 |. DNA-PK, but not other cNHEJ factors, co-purifies with the U3 snoRNA and regulates rRNA processing.
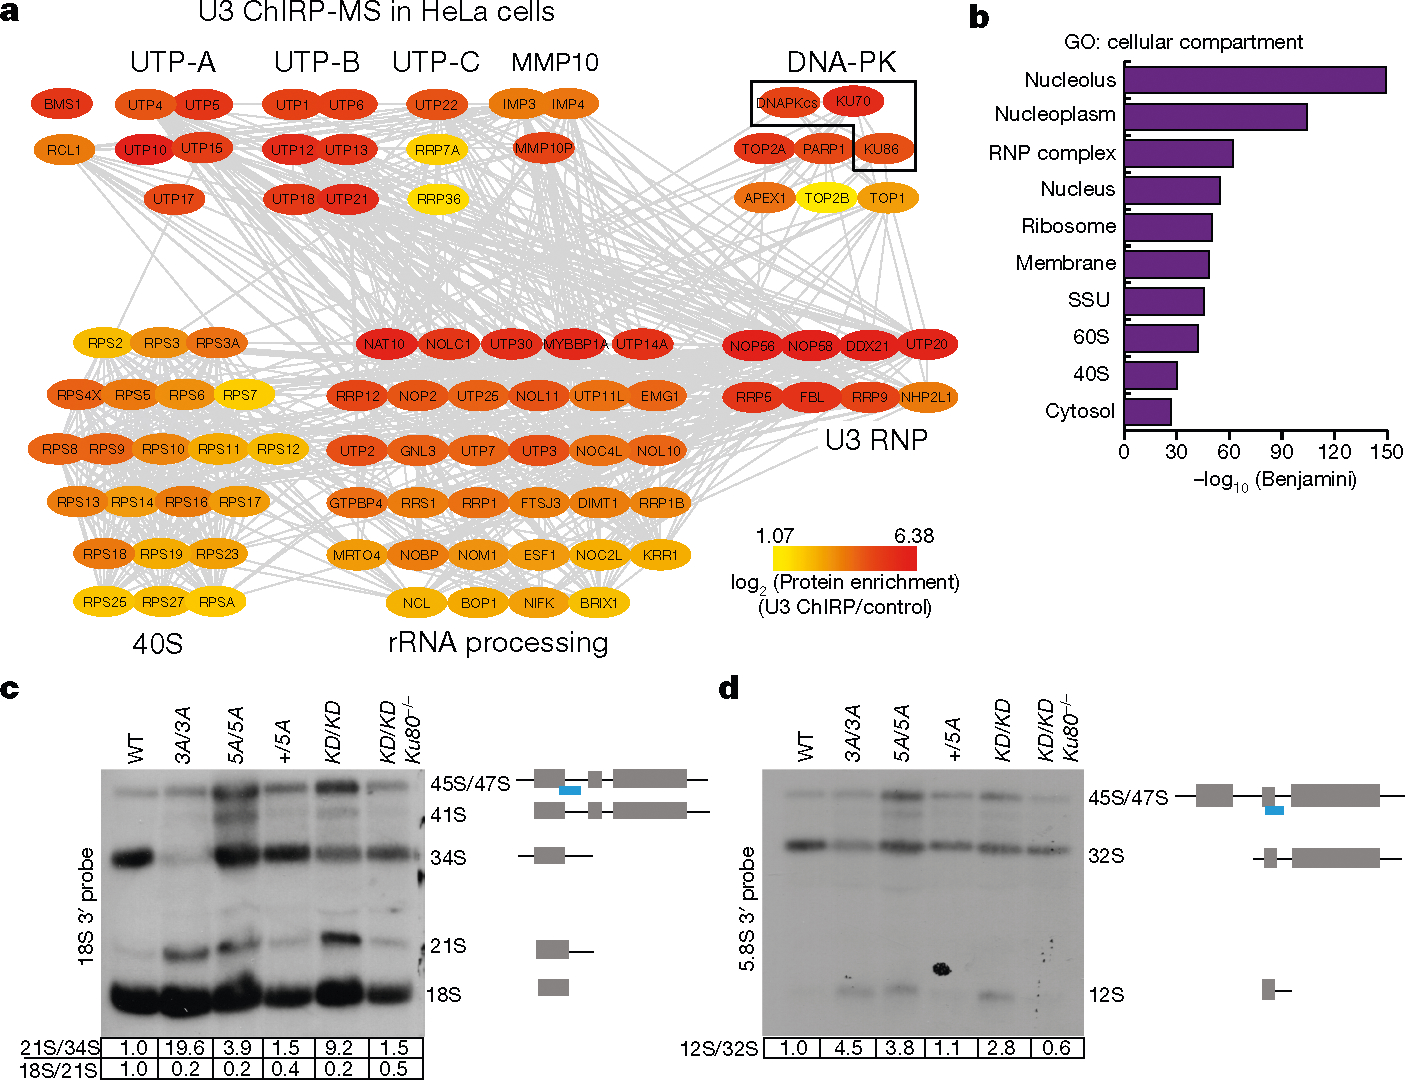
a, A protein–protein interaction (grey lines) network of U3 ChIRP-MS from HeLa cells of nucleolar and ribosomal biogenesis factors. Colours map to the enrichment log2[ChIRP/control] value of each protein. Known complexes are physically grouped and labelled. Complete hit list detailed in Supplementary Table 1. b, Cellular compartment term analysis of the U3 ChIRP-MS from HeLa cells using the DAVID tool. False discovery rate (FDR) was estimated (Benjamini corrected P) by comparing the 483 enriched proteins to the human proteome; the top ten most enriched terms are shown. c, d, Northern blot analyses of 18S and 5.8S rRNA maturation in v-ABL kinase transformed B cells from noted genotypes. The probe covers the 3′ edge of 18S rRNA and 5.8S rRNA, respectively (blue line). The normalized relative intensities of 21S/34S, 18S/21S and 12S/32S are marked below the gels. n = 4 (c), n = 3 (d) biologically independent experiments.
DNA-PK binds to RNA
The biological importance of KU in the nucleolus is unknown. We hypothesized that defects in ribosome biogenesis might underlie the translation defects in DNA-PKcsKD/KD and DNA-PKcs5A/5A HSPCs. Indeed, blocking the activity of RNA polymerase I (Pol I) with actinomycin D (ActD) depleted KU and DNA-PKcs from the nucleolus in human and mouse cells (Extended Data Fig. 8a–c), suggesting that DNA-PKcs and KU reside in the nucleolus in an rRNA-dependent manner, potentially as part of pre-rRNA ribonucleoprotein complexes. Thus, we isolated the small subunit (SSU) processome via the U3 small nucleolar RNA (snoRNA; herein U3). U3 coordinates splicing of the 5′-external transcribed spacer (5′-ETS) and thus maturation of the 40S ribosomal subunit30. We identified U3 binding proteins using comprehensive identification of RNA-binding proteins by mass spectrometry (ChIRP-MS)31 in two different cell types (Fig. 3a, b, Extended Data Fig. 8d, e). ChIRP-MS recovered all known and conserved components of the eukaryotic SSU processome4,32 and the DNA-PK holoenzyme, but not other cNHEJ factors (Fig. 3a, b, Supplementary Table 1). Comparative analyses of the U3 ChIRP-MS and KU86 immunoprecipitation (IP)-MS33 confirmed that KU86 associates with SSU components (Extended Data Fig. 9a). If the assembly of DNA-PKKD or DNA-PK5A affects rRNA processing, unprocessed rRNA intermediates might accumulate in DNA-PK mutant cells. Northern blots from DNA-PKcsKD/KD, DNA-PKcs3A/3A and DNA-PKcs5A/5A cells revealed partial accumulation of the 21S and 12S pre-rRNA precursors of the 18S and 5.8S rRNAs, respectively (Fig. 3c, d, Extended Data Fig. 9b). Given that DNA-PKcs mutant cells were viable, we expected the rRNA processing defects to be less severe than and/or different from those resulting from SSU ablation. Notably, deletion of Ku70 along with mutations in DNA-PKcs rescued the rRNA processing defects (Fig. 3c, d, Extended Data Fig. 9b). The 21S pre-rRNA intermediate also accumulated in CD34− bone marrow cells from patients with DBA34. Thus, the KU-mediated assembly of a catalytically inactive or T2609 phosphorylation-defective DNA-PK leads to rRNA processing defects.
To identify the spectrum of cellular RNAs that are bound by KU and DNA-PKcs, we performed infrared crosslinking and immunoprecipitation35 (irCLIP) of KU86 and DNA-PKcs (Extended Data Fig. 10a, b). Annotation of the reverse transcriptase (RT) stops across the transcriptome revealed the interaction profile of KU86 and DNA-PKcs (Extended Data Fig. 10c, e). Although most KU86 and DNA-PKcs RT stops mapped to introns of mRNA or non-coding RNAs (Extended Data Fig. 10c–f), they showed little overlap in this category (Extended Data Fig. 10e, f). The RT stops shared by KU86 and DNA-PK-cs included known DNA-PKinteracting RNAs, such as Terc and Neat136 (Extended Data Fig. 10g, h). We also observed binding to non-coding RNAs with essential roles in ribosome biogenesis, including the 5′-ETS and U3 (Fig. 4a, b). Binding of DNA-PK to the 5′-ETS was sensitive to ActD (Extended Data Fig. 10i, j), which might contribute to the Pol I-dependent localization of DNA-PKcs and KU in the nucleolus (Extended Data Fig. 8a–c).
Fig. 4 |. U3 snoRNA drives assembly, activation, and auto-phosphorylation of DNA-PK at the T2609 cluster.
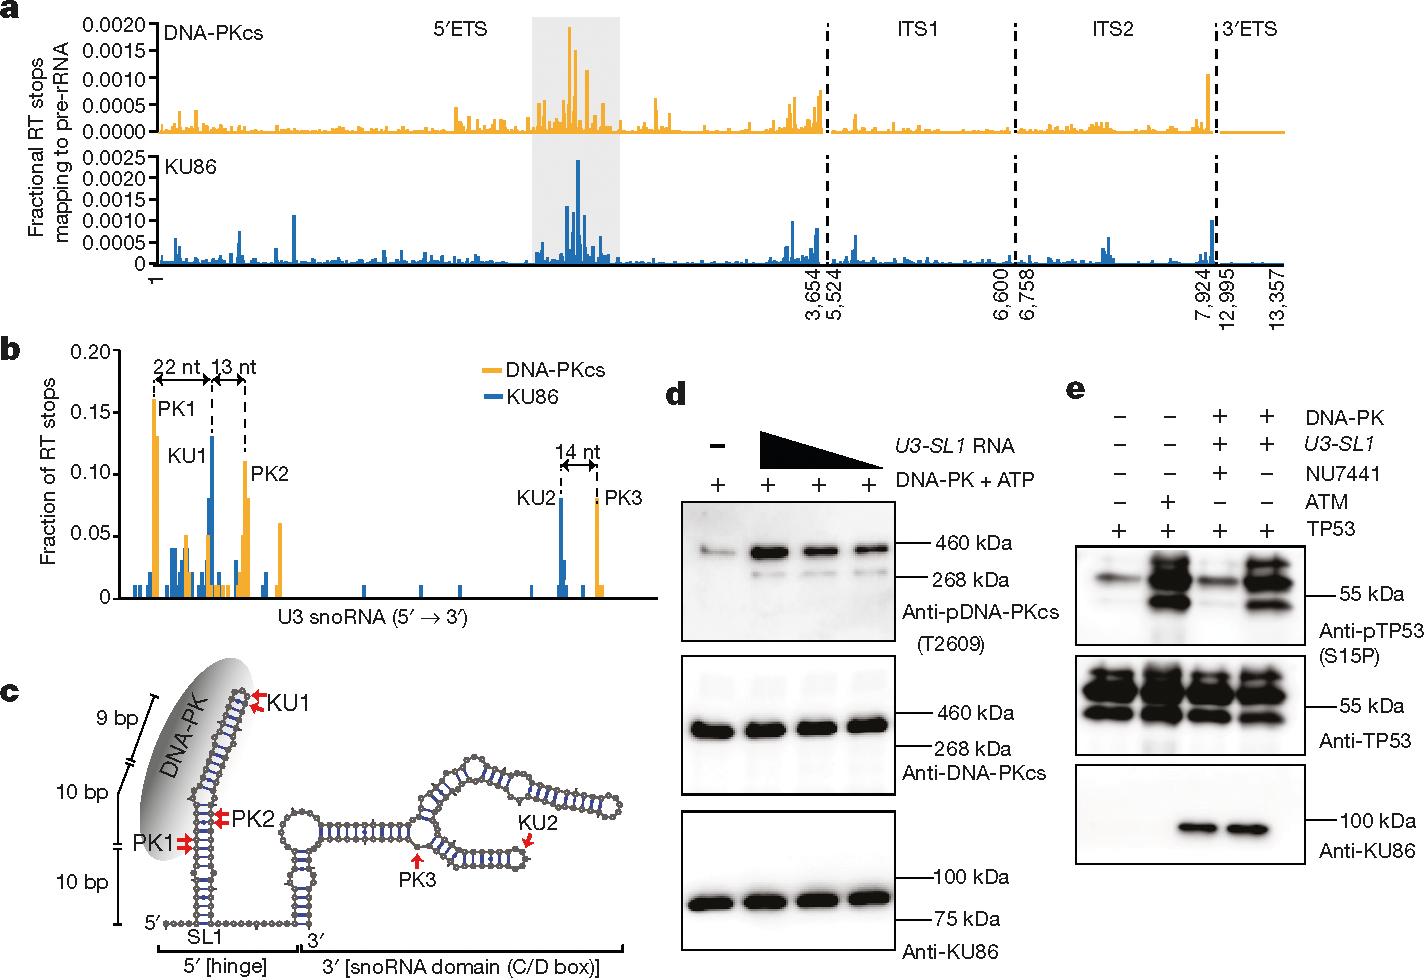
a, DNA-PKcs and KU86 RT stops that map to the four pre-rRNA introns; 5′ETS, ITS1, ITS2, and 3′ETS. irCLIP was performed in biological duplicate. b, Transcript normalized histogram of DNA-PKcs (orange) and KU86 (blue) irCLIP RT stops from DMSO-treated HeLa cells mapping to U3. c, In silico (mFold)-predicted secondary structure of U3. The top three and two peaks of DNA-PKcs and KU86, respectively, are annotated on the secondary structure. The length of the 5′end stem-loop is shown. d, Baculovirus-purified human DNA-PK in vitro kinase phosphorylation assay in the presence of increasing amounts of U3-SL1. Western blots were performed with antibodies against DNA-PKcs phosphorylated at the T2609 cluster (top), total DNA-PK (middle), and KU86 (bottom). e, Baculovirus-purified human DNA-PK in vitro kinase phosphorylation assay against purified human TP53. Activated DNA-PK phosphorylates TP53 on serine 15. An in vitro ATM kinase assay was used as a control. Western blots were performed with antibodies against TP53 phosphorylated on serine 15 (top), total TP53 (middle) and KU86 (bottom). d, e, n = 3 biologically independent experiments.
The U3 snoRNA can activate DNA-PK
DNA-PKcs and KU86 RT stops were biased towards the 5′ end of U3, near the conserved hinge region (Fig. 4b) that is essential for 18S rRNA maturation4,32. By contrast, DNA-PKcs and KU86 showed little preference towards the snoRNP domain of U3 (Fig. 4b). Correspondingly, DNA-PKcs and KU86 bound few and dissimilar snoRNAs, when compared to the snoRNA-binding protein DDX21 37 (Extended Data Fig. 11a, b). To understand whether KU86 drives the assembly of DNA-PK at U3, we mapped the DNA-PKcs and KU86 peaks to an in silico secondary structure (Fig. 4c) of U338. The DNA-PKcs and KU86 crosslinking sites are adjacent to one another in the same predicted stem-loop of U3 (U3-SL1; Fig. 4c), and within the DNase I footprint of DNA-PK39. KU86 crosslinked mainly to the terminal hairpins (Fig. 4c). KU can assemble DNA-PK at DNA fragments with hairpin ends. Incubation of U3-SL1 with the native DNA-PK complex, purified from human cells, showed that KU bound to a substantial fraction of U3-SL1 (Extended Data Fig. 11c). Anti-KU86 antibodies supershifted the KU–U3-SL1 complex (Extended Data Fig. 11d). A mutated U3-SL1 hairpin failed to compete with wild-type U3-SL1 for KU86 binding (Extended Data Fig. 11e), suggesting that RNA structure is important for binding of KU. At higher concentrations of DNA-PK, KU was able to drive assembly of DNA-PK on U3-SL1 in the absence of ATP (Extended Data Fig. 11c). Moreover, U3-SL1 drove auto-phosphorylation of DNA-PK at the T2609 cluster (Extended Data Fig. 11f), but no efficient phosphorylation was detected at the T2056 cluster (Extended Data Fig. 11g). This RNA-based activity depended on DNA-PKcs kinase, as NU7441 or non-hydrolysable ATP blocked T2609 phosphorylation (Extended Data Fig. 11h–j). Similarly, U3-SL1 promoted baculovirus-purified human DNA-PK to undergo auto-phosphorylation at T2609, but not S2056 (Fig. 4d, Extended Data Fig. 11k). U3-SL1 activated DNA-PK to phosphorylate serine 15 on TP53 peptides, with efficiency comparable to the basal activity of isolated ATM (Fig. 4e). Notably, DNA-PK assembly and auto-phosphorylation at U3-SL1 is less efficient than with dsDNA (Extended Data Fig. 11f). We speculated that additional factors might be available to facilitate efficient DNA-PK assembly and activation by RNA.
RNA-dependent function of DNA-PK
Despite the accumulation of KU and DNA-PKcs in the nucleolus, young Ku−/− or DNA-PKcs−/− mice do not have deleterious translation defects. Using DNA-PKcsKD/KD and DNA-PKcs5A/5A mouse models, we have identified an unexpected role for DNA-PK during ribosome biogenesis and demonstrated how an endogenous RNA in mammalian cells drives the assembly and activation of DNA-PK. The different effects of DNA-PKcs−/− and DNA-PKcsKD/KD on ribosome biogenesis mirror their effects on cNHEJ, where end-ligation is abrogated in DNA-PKcsKD/KD cells but not in DNA-PKcs−/− cells; this suggests that, once recruited to DNA or RNA, the kinase activity of DNA-PKcs might allosterically regulate the accessibility of DNA-PK-bound DNA or RNA to regulate repair or processing. Moreover, U3 triggers DNA-PKcs phosphorylation at T2609, which is critical for rRNA processing, but relatively dispensable for cNHEJ, implying that RNA- versus DNA-bound DNA-PK might undergo different conformational changes and are subject to different regulation. In this context, we propose that the inability of DNA-PK to regulate itself when assembled at U3 and/or other structured RNAs blocks SSU assembly and pre-rRNA processing, leading to translation defects that preferentially affect cell types and tissues with high demand for protein synthesis (for example, haematopoietic cells and ES cells). Although we focused on U3, our irCLIP analysis uncovered a myriad of other RNAs that could assemble DNA-PK, which will significantly expand the functional domain of DNA-PK. Finally, we noticed that in a Tp53-deficient background, DNA-PKcsKD/KD and DNA-PKcs5A/5A mice have different overall survival, which might be due to the differing effects of these mutations on specific RNAs or the added cNHEJ defects in DNA-PKcsKD/KD mice. Further investigation will establish the relevance of DNA-PK assembly at RNA and how it differs from DNA, and whether they could both collaborate to promote DNA repair and RNA processing at highly transcribed regions40.
Online content
Any methods, additional references, Nature Research reporting summaries, source data, extended data, supplementary information, acknowledgements, peer review information; details of author contributions and competing interests; and statements of data and code availability are available at https://doi.org/10.1038/s41586-020-2041-2.
Methods
Mouse models
DNA-PKcs−/−, Xrcc4+/−, DNA-PKcs+/KD, DNA-PKcs+/PQR, Ku70+/−, and Tp53+/− alleles and mice have been described2,6,16,41–43. The DNA-PKcs PQR allele substitutes five serine residues within the S2056 cluster (S2053 in mouse) with alanine (Extended Data Fig. 2a). The DNA-PKcs-5A mutation converts all five threonines in the T2609 cluster of exon 58 of DNA-PKcs to alanine (Extended Data Fig. 2b–d). The targeting arms (5′ and 3′ arms) were generated via PCR, cloned into pGEMT and sequence verified, before being subcloned into the pEMC-neo targeting vector. The ~500-bp fragment containing all the mutations was synthesized (Genewiz) and integrated into the 3′ arm (4.4 kb) to generate the targeting vector (Extended Data Fig. 2b, c) with inverted neo-resistance (NeoR) cassettes flanked by a pair of FRT sites. An SmaI-linearized targeting plasmid was electroporated into mouse ES cells (129/Sv background) and NeoR-resistant clones were isolated and screened via Southern blotting with SpeI digestion and a 5′ probe (amplified via primers 5′-TCATTAAGGCCTCGCAATC-3′ and 5′-TGTTGGAGA AGGATGGGAAA-3′; germline, 14.7 kb; targeted, 5.8 kb). The successfully targeted clones were validated via Southern blotting with a NeoR probe for single integration and sequenced to verify the desired mutation, before being injected for germline transmission. The resultant DNA-PKcs+/5AN chimeras (N for neo positive) were crossed with constitutively FLIPase-expressing Rosa26aFLIP/FLIP mice (Jax stock number: 003946, also in 129/Sv background) to remove the NeoR cassette and allow the expression of DNA-PKcs-5A. Genotyping was performed with primers (5′-GCAGATCTCTGTGAATTTATGACC-3′ and 5′-CCAAGAAAAA CTAACGAAAAATGC-3′). The product corresponding to the wild-type allele is 172 bp and the product corresponding to the 5A allele is 244 bp (including an FRT site). Complete blood counts were measured by the Institute of Comparative Medicine at Columbia University using Genesis (Oxford Science Inc.) and histological analyses were performed by the histopathological core of Herbert Irving Comprehensive Cancer Center (HICCC) at Columbia University. All animal work was conducted in an on-site, pathogen-free facility in Columbia University and following procedures pre-approved by the Institutional Animal Care and Use Committee (IACUC) at Columbia University Medical Center. No statistical methods were used to predetermine sample size. The experiments were not randomized and the investigators were not blinded to allocation during experiments and outcome assessment.
Flow cytometry analyses of haematopoietic cells and lymphocytes
Flow cytometry analyses of haematopoietic cells and lymphocytes were performed using previously published methods2,44,45 with minimal colour modifications. In brief, single-cell suspensions of bone marrow or fetal liver cells were filtered through a 70-μm nylon cell strainer (Falcon, 352350). Splenocytes were treated with red blood cell lysis buffer before staining. For HSPC analysis, bone marrow or fetal liver cells were first stained with a cocktail of biotin labelled primary antibodies containing mouse specific lineage markers: anti-CD4 (Biolegend, 100404), anti-CD8a (Biolegend, 100704), anti-CD3e (Biolegend, 100304), anti-CD5 (BD Bioscience, 553018), anti-B220 (Biolegend, 103204), anti-Ly6G/Ly6C (Gr-1) (Biolegend, 108404) and anti-TER119 (Biolegend, 116204) at 4 °C for 1 h, before being washed and stained with a cocktail of directly conjugated antibodies including FITC anti-mouse CD34 (eBioscience, 11–0341-82), PE anti-mouse Ly-6A/E (Sca-1) (Biolegend, 108108), PE/Cy7 anti-mouse CD16/32 (Biolegend, 101318), APC anti-mouse CD117 (c-Kit) (135108), APC/Cy7 Streptavidin (Biolegend, 405208) and Brilliant Violet 510 anti-mouse CD41 (Biolegend, 133923) at 4 °C for 1.5 h. For lymphocyte and peripheral haematopoietic cells analyses, cells from the bone marrow, spleen, or thymus were stained with B cell cocktail (FITC anti-mouse CD43, Biolegend, 553270; PE goat anti-mouse IgM, Southern Biotech, 1020–09; PE-cyanine5 anti-Hu/Mo CD45R (B220), eBioScience 15–0452-83; and APC anti-mouse TER119, Biolegend 116212); T cell cocktail (PE rat anti-mouse CD4, Biolegend 557308; FITC anti-mouse CD8a, Biolegend 100706; PE/Cy5 anti-mouse CD3e, eBioscience 15–0031-83; and APC anti-mouse TCRβ, BD Pharmingen 553174); myeloid cocktail (FITC anti-mouse CD11b, BD Pharmingen 553310; PE rat anti-mouse CD19, BD Pharmingen 557399; PE/Cy5 anti-mouse CD3e, eBioscience 15–0031-83; and APC anti-mouse Ly6G/Ly6C(Gr-1), Biolegend 108412) and/or erythroid cocktail (PE-cyanines5 anti-Hu/Mo CD45R(B220) (as above); PE/Cy7 anti-mouse TER119, Biolegend, 116222; APC anti-mouse Ly6G/Ly6C (Gr-1) (as above); Pacific Blue anti-mouse Thy1.2, Biolegend 140306; and Brilliant Violet 510 anti-mouse CD71, Biolegend 113823), according to specific cell type containing. To analyse the double-negative T cells in the thymus, total thymocytes were stained for FITC-anti CD25 (BD Pharmaingen, 1595–02S), and APC anti-mouse CD44 (eBioscience, 17–0441-82) together with a collection of PE-conjugated antibodies to remove all other cell lineages (including anti-mouse CD4, CD8a (BD Pharmingen, 553032), CD19, TCRγδ (eBioscience, 12–5711-82)) and PE/Cy7 anti-mouse TER119. The flow cytometry data were collected on either LSR II (BD) with BD FACSDiva software, or on a FACSCalibur (BD) with BD CellQuest Pro. All flow cytometry data were analyzed using FlowJo V10.
Cell culture and cell line derivation
The DNA-PKcs+/+ and DNA-PKcs-5A/5A MEFs were derived from E13.5–E14.5 embryos obtained from crosses between DNA-PKcs+/5A parents using standard procedures2,46. The DNA-PKcs+/+ and DNA-PKcs5A/5A ES cells were derived by super-ovulating 3–4-week-old DNA-PKcs+/5A female mice mated with adult male DNA-PKcs+/5A mice. The inner cell masses from E3.5 blastocytes were then isolated and expanded for genotyping. The newly derived ES cells and controls were cultured on irradiated (30 Gy) fibroblast feeders using standard ES cell medium (DMEM, Gibco 12430–062; 15% fetal bovine serum, Hyclone, SH30071.03; 1 × MEM non-essential amino acids, Gibco11140–050; 1 mM sodium pyruvate, Gibco 11360–070, 2 mM l-glutamine, Gibco 25030–081; 120 μM 2-mercaptoethanol, Fisher 03446I-100; penicillin/streptomycin, Gibco 15070–63 and leukaemia inhibition factor (LIF, provided by C.-S. (Victor) Lin)). The v-ABL kinase-transformed B cell lines were derived from EμBCL2+ transgenic mice with the indicated genotype as previously described47. In brief, single-cell suspension from total bone marrow (from 2–5-week-old mice) or fetal liver was infected with retrovirus encoding p120 minimal v-ABL kinase47. Clonal outgrowth was isolated and expanded for the next 6–8 weeks. CRISPR–Cas9-mediated deletion of Ku80 was performed as previously described2.
The Fancd2−/− MEFs7 were generously provided by A. Smogorzewska (Rockefeller University). The v-ABL kinase-transformed DNA-PKcs3A/3A B cell lines17,18 were generously provided by B. Sleckman (Cornell University).
Measurement of protein synthesis using OPP
For in vitro analyses of cell lines, 5 × 10⁶ v-ABL kinase-transformed B cells were plated in each well of a 24-well plate. ATM or DNA-PK kinase inhibitors were added 17 h before the cells were treated with 5 μM OPP (ThermoFisher) for 30 min. To prevent protein syntheses (establishing a negative control), 100 μg/ml cycloheximide (CHX; Sigma) was added at the same time as OPP in a subset of samples. For all the translation experiments, the azide-alkyne cycloaddition was performed using the OPP Protein Synthesis Assay Kit (ThermoFisher Scientific). In brief, the cells were washed with ice-cold PBS, fixed with 3.7% formaldehyde in PBS for 15 min at 25 °C, permeabilized with 0.5% Triton X-100/PBS for 15 min at 25 °C, and then subjected to azide-alkyne cycloaddition and detection with azide-conjugated Alexa Fluor 488. The data were collected using FACSCaliber (BD Biosciences for cell lines) or BD FACSDiva (for haematopoietic cells) and analysed using FlowJo V10.
Translation analyses of haematopoietic cells from mice were conducted as previously described with minor modifications27. In brief, fresh isolated marrow and splenocytes were cultured for 1 h in RPMI 1640 complete medium (Gibco 11875) with 15% FBS containing 5 μM OPP before staining of live haematopoietic stem cells (see above with minor modification of the colour to accommodate FITC-OPP). Specifically, Alexa Fluor 700 rat anti-mouse CD34 (eBioscience, 560518) and Ly-6A/E (Sca-1) and Pacific Blue anti-mouse Ly-6A/E (Sca-1) (Bioleged, 108120) were used for HSPC staining. The relative levels of protein synthesis between different haematopoietic populations obtained from transient in vitro incubation of bone marrow from 2-week-old DNA-PKcs+/+ mice (Extended Data Fig. 7d) agreed with prior data obtained with in vitro and in vivo injection of OPP in adult mice27. Specifically, among the HSPC and lineage specific progenitors, the highest protein translation was found in megakaryocytes and erythroid progenitors (MEPs), followed by common myeloid progenitors (CMPs). HSPCs (Lin−SCA1+c-KIT+; LSK) have relatively low protein synthesis27 (Extended Data Fig. 7d). To offset the prohibitory cost of in vivo OPP injection, we measured global translation with transient (1 h) in vitro incubation.
Northern blot analysis of rRNA processing
Total RNA was extracted using TRIzol (Life Technology) and about 5 μg total RNA was analysed for each sample. Oligo probes measuring 18S and 5.8S rRNA processing situated at the 3′ boundary of the mature 18S or 5.8S species were designed on the basis of previous publications48,49 (Supplementary Table 1).
Immunofluorescence
U2OS cells or mouse ES cells were seeded on gelatin-treated coverslips 48 h before staining and stained as previously described25. In brief, the cells were washed with 1 × PBS, when indicated, incubated with CSK buffer25 (10 mM Pipes with pH 7.0, 100 mM NaCl, 300 mM sucrose, 3 mM MgCl2 and 0.7% Triton X-100) for 3 min at room temperature for pre-extraction, then washed and fixed with 4% paraformaldehyde (PFA) in PBS for 25 min at 25 °C. Before staining, the cells were permeabilized with 0.1% Triton X-100/PBS for 10 min and blocked with 3% BSA for 1 h at 25 °C. Fixed cells were then incubated with primary antibodies in 3% BSA for 1 h at 25 °C, including mouse anti-human KU86 (ThermoFisher, MA5–12933, 1:100), rabbit anti-human DDX21 (Novus, NB100–1718, 1:500) or anti-DNA-PKcs (ThermoFisher, Ab-4(cocktail)), followed by fluorophore-conjugated secondary antibodies (Alexa Fluor 488-conjugated anti-rabbit, Alexa Fluor 594-conjugated anti-rabbit, and cyanine3-conjugated anti-mouse, Invitrogen, 1:500) for 1 h at room temperature. All images were captured on a Nikon A1RMP confocal microscope with a 63× objective.
Cell cultures
HeLa and U2OS cells were cultured in DMEM (plus 10% FBS) and maintained under standard tissue-culture conditions unless otherwise specified. For actinomycin D (Sigma) treatments, 1 μg/ml was added to the culture medium for 1 h before harvesting for downstream assays. For immunofluorescence studies, cells were fixed with 4% paraformaldehyde, unless otherwise specified, and stained with the indicated antibodies. All cell lines used in this study were mycoplasma-free.
Infrared crosslinking and immunoprecipitation
irCLIP was performed as described35. HeLa cells were grown as described above and UV crosslinked with a total of 0.35 J/cm2. Whole-cell lysates were generated in CLIP lysis buffer (50 mM HEPES, 200 mM NaCl, 1 mM EDTA, 10% glycerol, 0.1% NP-40, 0.2% Triton X-100, 0.5% N-lauroylsarcosine) and briefly sonicated using a probe-tip Branson sonicator to solubilize chromatin. Each experiment was normalized to total protein amount, typically 1 mg, and partially digested with RNase A (ThermoFisher Scientific, EN0531) for 10 min at 37 °C and quenched on ice. DNA-PKcs (Bethyl, A303–967A), KU80 (Bethyl, A302–627A) and IgG (ThermoFisher Scientific, 02–6102) IPs were performed with 15 μg antibody and 50 μl Protein G Dynabeads (ThermoFisher Scientific) for 8 h at 4 °C on rotation. Samples were washed for 1 min at 25 °C each time in 1 ml of the following buffers sequentially: 1 × high stringency buffer (15 mM Tris-HCl, pH 7.5, 5 mM EDTA, 2.5 mM EGTA, 1% Triton X-100, 1% sodium deoxycholate, 120 mM NaCl, 25 mM KCl), 1 × high salt buffer (15 mM Tris-HCl pH 7.5, 5 mM EDTA, 2.5 mM EGTA, 1% Triton X-100, 1% sodium deoxycholate, 1 M NaCl), 2 × NT2 buffer (50 mM Tris-HCl, pH 7.5, 150 mM NaCl, 1 mM MgCl2, 0.05% NP-40). After the NT2 wash, RNA–protein complexes were dephosphorylated with T4 PNK (NEB) for 45 min in an Eppendorf Thermomixer at 37 °C with repeated cycle of 15 s at 1,400 rpm followed by 90 s of rest in a 30-μl reaction system of pH 6.5 containing 10 units T4 PNK, 0.1 μl SUPERase-IN (ThermoFisher Scientific), and 6 μl PEG-400 (16.7% final). Dephosphorylated RNA–protein complexes were then rinsed once with NT2 buffer and 3′-end ligated with T4 RNA Ligase 1 (NEB) overnight in an Eppendorf Thermomixer at 16 °C with a repeated cycle of 15 s at 1,400 rpm followed by 90 s of rest in a 60-μl reaction containing 10 units T4 RNA Ligase, 1.5 pmol preadenylated-IR800–3′biotin DNA-adaptor, 0.1 μl SUPERase-IN, and 6 μl PEG400 (16.7% final). The following day, samples were rinsed once again with 500 μl NT2 buffer and resuspended in 30 μl NT2 buffer containing 20 mM DTT and 1 × LDS (ThermoFisher Scientific). Samples were then heated to 75 °C for 10 min, and released RNA–protein complexes were separated on 4–12% Bis-Tris SDS–PAGE gel (1.0 mm × 12 well) at 200 V for 45 min. Resolved RNP complexes were wet-transferred to nitrocellulose at 550 mA for 45 min at 4 °C.
Nitrocellulose membranes were imaged using an Odyssey CLx scanner (LiCor), RBP–RNA complexes were excised using scalpels, and RNA was recovered by adding 0.1 ml proteinase K reaction buffer (100 mM Tris, pH 7.5, 50 mM NaCl, 1 mM EDTA, 0.2% SDS and 5 μl of 20 mg/ml proteinase K (ThermoFisher Scientific)). Proteins were digested for 60 min at 50 °C in an Eppendorf Thermomixer. Next, 200 μl saturated phenol-chloroform pH 6.7 was added to each tube and incubated for 10 min at 37 °C in an Eppendorf Thermomixer at 1,400 rpm. Tubes were briefly centrifuged, and the entire contents were transferred to a 2-ml Heavy Phase Lock Gel tube (5Prime, 2302830). Samples were centrifuged for 2 min at >13,000 rpm. The aqueous layer was re-extracted with 1 ml chloroform (inverting 10 times to mix; no vortexing) in the same 2-ml Phase Lock Gel tube and centrifuged for 2 min at >13,000 rpm. The aqueous layer was then transferred to a new 2-ml Heavy Phase Lock Gel tube and extracted again with an additional 1 ml chloroform. After 2 min centrifugation at >13,000 rpm, the aqueous layer was transferred to a siliconized 1.5-ml tube and precipitated overnight at −20 °C by addition of 10 μl 5 M NaCl, 3 μl linear polyacrylamide (ThermoFisher Scientific) and 0.8 ml 100% ethanol. RNA fragments were pelleted at >13,000 rpm for 45 min at 4 °C, washed once with 1 ml ice-cold 75% ethanol and air dried.
RNA pellets were resuspended in 12 μl water by adding 1 μl of 3 μM cDNA and 1 μl of 10 mM dNTPs, and heated to 70 °C for 5 min before being rapidly cooled to 4 °C. cDNA Master Mix (4 μl 5× Super Script IV (SSIV) buffer, 1 μl 100 mM DTT, 1 μl SSIV, 6 μl total) was added to the annealed RNA and incubated for 30 min at 55 °C. cDNA–RNA hybrids were captured by addition of 5 μl of MyOne Streptavidin C1 Dynabeads (ThermoFisher Scientific) that had been rinsed and suspended in 50 μl biotin-IP buffer (100 mM Tris, pH 7.5, 1 M NaCl, 1 mM EDTA, 0.1% Tween), and subjected to end-over-end rotation for 45 min at room temperature. Beads were placed on a 96-well magnet and washed twice with 100 μl biotin-IP buffer and 100 μl ice-cold 1 × PBS sequentially. Beads were resuspended in 10 μl cDNA elution buffer (8.25 μl water adding 1 μl of 1 μM P3 short oligo and 0.75 μl of 50 mM MnCl2) and heated to 95 °C for 10 min, ramped at 0.1° s−1 to 60 °C until the end of the experiment. cDNA was circularized for 2 h at 60 °C in 5 μl circularization reaction buffer (3.3 μl water, 1.5 μl 10× Circligase-II buffer, and 0.5 μl Circligase-II (Epicentre)), and then purified with 30 μl AMPure XP beads (Beckman Coulter) and 75 μl isopropanol. Samples were incubated for 20 min at 25 °C, washed twice with 100 μl 80% ethanol, air dried for 5 min, and eluted in 14 μl water. Elution took place at 95 °C for 3 min and samples were then immediately transferred to a 96-well magnet. Eluted cDNA was transferred to a new PCR tube containing 15 μl 2× Phusion HF-PCR Master Mix (NEB), 0.5 μl of 30 μM P3/P6 PCR1 oligo mix and 0.5 μl of 15× SYBR Green I (ThermoFisher Scientific). Real-time quantitative PCR was performed as: 98 °C for 2 min, 15 cycles of 98 °C for 15 s followed by 65 °C for 30 s, and 72 °C for 30 s, and eventually with data acquisition set to the 72 °C extension. PCR1 reactions were purified by adding 4.5 μl isopropanol and 54 μl AMPure XP beads before incubation for 10 min. Beads were washed once with 80% ethanol, dried for 5 min, and eluted in 15 μl water. Illumina flow cell adaptors were added by adding 15 μl 2× Phusion HF-PCR Master Mix and 0.4 μl P3solexa/P6solexa oligo mix and amplified as: 98 °C for 2 min, 3 cycles of 98 °C for 15 s followed by 65 °C for 30 s, and 72 °C for 30 s seconds. Final libraries were purified by addition of 48 μl AMPure XP beads and incubation for 5 min. Beads were washed twice with 70% ethanol, dried for 5 min, and eluted in 20 μl water. Libraries (1–2 μl) were quantified using an HS-DNA Bioanalyzer. Samples were deep sequenced on the Illumina NextSeq machine with 75-bp cycle run of single-end and no index high-output sequencing.
Analysis of irCLIP data
The irCLIP data were processed using the FAST-iCLIP pipeline (https://github.com/ChangLab/FAST-iCLIP/tree/lite). PCR duplicates were removed using unique molecular identifiers (UMIs) in the RT primer region. Adaptor and barcode sequences were trimmed, and reads were mapped step-wise to repetitive and then non-repetitive (GRCh38) genomes. Specific parameters used for the FAST-iCLIP pipeline are as follows: -f 18 (trims 17 nt from the 5′ end of the read), -l 16 (includes all reads longer than 16 nt), –bm 29 (minimum MAPQ score from bowtie2 of 29 is required for mapping; unique mapping only), and –tr 2,3 (repetitive genome) and –tn 2,3 (non-repetitive genome) RT stop intersection (n,m; where n = replicate number and m = number of unique RT stops required per n replicates). Using the –tr/tn 2,3 parameters, a minimum of six RT stops is required to support any single nucleotide identified as crosslinking site. For gene ontology analysis, the DAVID50 tool was employed (https://david.ncifcrf.gov/tools.jsp). Peaks of RT stops were called on the biological replicated intersection of RT stop positions using iCount peaks (http://icount.readthedocs.io/en/latest/). The command line was as follows: iCount peaks gencode.v21.annotation. segment.gtf RTstop_input.bed Out_iCpeaks.bed–scores Out_iCpeaksScores.tsv. Regions from ‘Out_iCpeaks.bed’ were then annotated using HOMER (http://homer.ucsd.edu/homer/) using the following command: annotatePeaks.pl Out_iCpeaks.bed hg38> Out_iCpeaks_hg38_HOMERanno.txt -annStats Out_iCpeaks_hg38_HOMERanno_stats.txt.
Comprehensive identification of RNA binding proteins by mass spectrometry
U3 snoRNA targeting probes were designed using online tools available at https://www.biosearchtech.com/stellaris, with a repeat masking setting of 3 and even coverage of the whole transcript. Full probe sequences are available in Supplementary Table 2. Oligos were synthesized with 3′ biotin-TEG modification at Stanford Protein and Nucleic Acid Facility (panoligo@stanford.edu).
ChIRP-MS was performed largely as described31. Five 15-cm dishes of cells (~200 million cells) were used per ChIRP-MS experiment. Cell culture and ActD treatments were performed as described above. Medium was aspirated and cells were rinsed once with 5 ml of 1 × PBS. PBS was then aspirated, and 10 ml of 3% formaldehyde in 1× PBS was added to each dish. Cells were scraped off the 15-cm dishes during chemical crosslinking, which took place for a total of 30 min at 25 °C and was stopped by the addition of glycine to a final concentration of 125 mM for 5 min at 25 °C. Crosslinked cells were pelleted at 2,000 rpm for 5 min, supernatant was discarded, and cells frozen at −80 °C for storage. Lysate was generated by resuspending cell pellets in 1 ml lysis buffer (50 mM Tris-HCl pH 7.0, 10 mM EDTA, 1% SDS) per 100 mg of cell pellet weight (~100 μl pellet volume). Lysates were sonicated using a focused ultrasonicator (Covaris, E220) until the average RNA length was 500 nucleotides as determined by agarose gel analysis and stored at −80 °C. Stored lysates were thawed on ice and prepared for pre-clearing and RNase A treatment (control sample). The experimental samples were precleared by adding 30 μl washed MyOne C1 beads per ml of lysate at 37 °C for 30 min on rotation. To control sample preclearing, RNA digestion was achieved by adding 30 μl washed MyOne C1 beads per ml lysate and 1/1,000 the volume of 10 mg/ml RNase A (Sigma) and incubating at 37 °C for 30 min on rotation. Preclearing beads were collected twice from lysate using a magnetic stand; for this and all subsequent magnetic stand steps we allowed >1 min of separation before removing any supernatant. Next, 2 ml of ChIRP hybridization buffer (750 mM NaCl, 1% SDS, 50 mM Tris-HCl pH 7.0, 1 mM EDTA, 15% formamide; made fresh) and 2.5 μl of 100 μM ChIRP Probe Pools were added per ml of lysate. ChIRP Probe Pools (Supplementary Table 1) were comprised of seven antisense oligos (final concentration of 16 μM of each probe). Hybridization took place on rotation for 16 h at 37 °C. Subsequently, 250 μl of washed MyOne C1 beads per ml of lysate were added to each sample and incubated on rotation for 45 min at 37 °C. Enriched material was collected on the beads with a magnetic stand, and beads were washed 5 × 2 min in 1 ml ChIRP Wash Buffer (2 × NaCl-sodium citrate (SSC, ThermoFisher Scientific), 0.5% SDS) at 37 °C. To elute enriched proteins, beads were collected on a magnetic stand, resuspended in ChIRP biotin elution buffer (12.5 mM biotin, 7.5 mM HEPES, pH 7.9, 75 mM NaCl, 1.5 mM EDTA, 0.15% SDS, 0.075% sarkosyl, and 0.02% Na-deoxycholate), and mixed at 25 °C for 20 min on rotation and at 65 °C for 15 min shaking. Eluent was transferred to a fresh tube, and beads were eluted again. The two eluents were pooled (~1,200 μl), and residual beads were removed again using the magnetic stand. Twenty-five per cent total volume (300 μl) of trichloroacetic acid was added to the clean eluent and vortexed, and then samples were placed at 4 °C overnight for precipitation. The next day, proteins were pelleted at 21,000 relative centrifugal force (rcf) at 4 °C for 45 min. Supernatant was carefully removed, and protein pellets were washed once with ice-cold acetone. Samples were spun at 21,000 rcf at 4 °C for 5 min. Acetone supernatant was removed and tubes were briefly centrifuged again and, after removal of residual acetone, were left to air-dry on a bench-top. Proteins were then solubilized in 1× LDS buffer in NT2 with 20 mM DTT and boiled at 95 °C for 30 min with occasional mixing for reverse-crosslinking.
Protein samples were size-separated on bis-tris SDS–PAGE gels (BioRad), and the gel was fixed and stained with the Colloidal Blue Staining Kit (ThermoFisher Scientific) as per the manufacturer’s instructions. Each ChIRP-MS experiment was cut into seven slices from the SDS–PAGE and prepared independently. Gel slices were prepared for mass spectrometry by rinsing sequentially in 200 μl HPLC-grade water, 100% acetonitrile (ACN, ThermoFisher Scientific) and 50 mM ammonium bicarbonate (AmBic). Samples were reduced by adding 200 μl of 5 mM DTT in 50 mM AmBic and incubating at 65 °C for 35 min. The reduction buffer was discarded, and samples were cooled to room temperature. Alkylation was achieved by adding 200 μl of 25 mM iodoacetaminde in 50 mM AmBic for 20 min at 25 °C in the dark. The alkylation buffer was discarded, samples were rinsed once in 200 μl 50 mM AmBic, and then they were washed twice for 10 min each in 200 μl of freshly prepared 50% ACN in 50 mM AmBic. After each wash, the supernatant was discarded, and after all washes, samples were dried for 3 h using a SpeedVac. Once dry, the proteins were digested by adding 100 ng trypsin in 200 μl of 50 mM AmBic for 16 h at 37 °C. Samples were subsequently acidified by adding formic acid to a final concentration of 2.5% and incubating at 37 °C for 45 min. Finally, samples were desalted using HyperSep Filter Plates with a 5–7-μl bed volume (ThermoFisher Scientific) following the manufacturer’s instructions. Samples were eluted three times in 100 μl 80% ACN in 2.5% formic acid, dried on a SpeedVac, and resuspended in 10 μl 0.1% formic acid for mass spectrometry analysis. Desalted peptides were analysed by online capillary nanoliquid chromatography with tandem MS (nanoLC–MS/MS). Samples were separated using a 20-cm reversed phase column fabricated in-house (100 μm inner diameter, packed with ReproSil-Pur C18-AQ 3.0 μm resin (Dr. Maisch GmbH)) that was equipped with a laser-pulled nanoelectrospray emitter tip. Peptides were eluted at a flow rate of 400 nl/min using a two-step linear gradient of 2–25% buffer B in 70 min and 25–40% B in 20 min (buffer A: 0.2% formic acid and 5% DMSO in water; buffer B: 0.2% formic acid and 5% DMSO in acetonitrile) in an Eksigent ekspert nanoLC-425 system (AB Sciex). Peptides were ionized with electrospray ionization into an Orbitrap Elite Hybrid Ion Trap-Orbitrap Mass Spectrometer (ThermoFisher Scientific). Instrument method parameters were as follows: MS1 resolution, 60,000 at 400 m/z; scan range, 340–1,600 m/z. The top 20 most abundant ions were subjected to collision-induced dissociation with a normalized collision energy of 35%, activation q 0.25, and precursor isolation width 2 m/z. Dynamic exclusion was enabled with a repeat count of 1, a repeat duration of 30 s, and an exclusion duration of 20 s.
FASTA sequences of the human proteome (Uniprot: UP000005640) were downloaded and used to search the data files (.raw) using Byonic (Protein Metrics) with the following parameters: semi-specific cleavage specificity at the C-terminal site of R and K allowing for 2 missed cleavages. Mass tolerance was set at 12 ppm for MS1s, 0.4 for MS2s. Methionine oxidation, asparagine deamidation, and N-term acetylation were set as variable modifications. Cysteine carbaminomethylation was set as a fixed modification. Peptide hits were filtered using a 1% FDR. To visualize ChIRP-MS protein hits, paired Uniprot ID and ChIRP-MS enrichment values were imported into Cytoscape using the GeneMANIA extension51. Connections between hits visualized were selected to display only direct protein–protein interactions. Each protein hit was coloured by the enrichment value (log2ChIRP/log2RNase).
ChIRP-qRT–PCR
Cells were grown, crosslinked, and sonicated as described above. After sonication, 1% of the lysate was removed and saved as an ‘input’ sample. Lysates were again processed as above for preclearing, hybridization, MyOneC1 capture, and bead washing. After washing, 1% of each sample was removed as an ‘enriched’ fraction. Enriched fractions were collected while the MyOneC1 beads were fully resuspended in ChIRP wash buffer. The input and enriched samples were brought to 95 μl in ChIRP PK buffer (10 mM Tris-HCl pH 7.0, 100 mM NaCl, 1 mM EDTA, 0.2% SDS) and to this was added 5 μl of 20 mg/ml proteinase K. Protein was digested while shaking at 55 °C for 45 min. RNA was extracted by adding 500 μl TRIzol (ThermoFisher Scientific), incubating at 55 °C for 5 min, and then adding 100 μl chloroform. After mixing samples by vortexing for 7 s each, samples were incubated at 25 °C for 5 min and then spun at 12,000 rpm at 4 °C for 15 min. The aqueous layer was carefully removed from each sample, mixed with two volumes of 100% ethanol, and purified using an RNA Clean & Concentrator-25 (Zymo Research) per the manufacturer’s instructions. All RNA samples were DNase-treated with the Turbo DNA-Free kit (ThermoFisher Scientific). The cDNA was generated using SuperScript VILO (ThermoFisher Scientific) according to the manufacturer’s instructions. The qPCR analyses were performed on the CFX96 Touch Real-Time PCR Detection System (Bio-Rad). All primers used are shown in Supplementary Table 2.
Secondary structure folding of U3 snoRNA
The human U3 snoRNA sequence was obtained (NR_006880.1) and secondary structure folded using the mFold web server52 using default settings. A Vienna file (.b) was exported for the folded structure and visualized in VARNA53.
Electrophoretic mobility shift assay
The stem-loop 1 region of U3 was synthesized with a T7 polymerase promoter and subsequently in vitro transcribed (IVT) using the MEGAscript T7 Transcription Kit (Thermo Fischer Scientific) per the manufacturer’s protocol to produce IVT-U3-SL1. To fluorescently label IVT-U3-SL1, periodate labelling of RNA 3′ends was performed using Cy7-amine (Lumiprobe) as the dye. To perform the electrophoretic mobility shift assay (EMSA) reaction, IVT RNA was first denatured at 75 °C for 5 min, cooled rapidly on ice for 3 min, and then added to 1× EMSA buffer (10 mM HEPES pH 7.5, 20 mM KCl, 1 mM MgCl2, and 1 mM DTT) for 5 min at 37 °C to allow the RNA to refold. For reactions that contained non-labelled competitor RNA or DNA, these were added at the refolding step. Non-labelled IVT-U3-SL1 and PCR DNA of U3-SL1 was added at 1:1 or 5:1 as unlabelled:labelled nucleic acids. For the DNA competitor, each end of the dsDNA was considered independently in the molar calculations. Finally, to each reaction we added 1 μl of 50% glycerol and recombinant DNA-PK holoenzyme (Promega), and water to 10 μl. EMSA reactions were incubated at 25 °C for 30 min and then run directly in a 4% native PAGE at 100 V. After electrophoresis, gels were directly scanned on a LiCor Odyssey in the 800 channel.
In vitro DNA-PK kinase reactions
IVT RNA, dsDNA, and DNA-PK holoenzyme were prepared as described above for EMSA analysis. Kinase reactions were assembled with 1 μl recombinant DNA-PK holoenzyme (Promega) and titrated amounts of nucleic acids (RNA, DNA, or none). To test for the dependence on ATP hydrolysis, 200 μM ATP, no ATP, or 200 μM adenosine-5′-[(β,γ)-methyleno]triphosphate (AppCp) was added. When indicated, the DNA-PKcs inhibitor NU7441 was added to a final concentration of 1 μM. All reactions occurred for 60 min at 25 °C and were subsequently assayed by western blotting. The baculovirus-purified human DNA-PK (Thermo PV5866), TP53 (Millipore 23–034) and active human ATM (Millipore 14–933) were used in the assays. The kinase reactions were performed in 1× kinase buffer (Thermo PV3189) with 100 μM ATP and 1.5 μl recombinant DNA-PK holoenzyme or 1.0 μl ATM in the presence of TP53. All reactions occurred for 60 min at 25 °C and were subsequently assayed by western blotting.
Extended Data
Extended Data Fig. 1 |. Myeloid proliferative disease with MDS features in DNA-PKcsKD/KDTp53−/− mice.
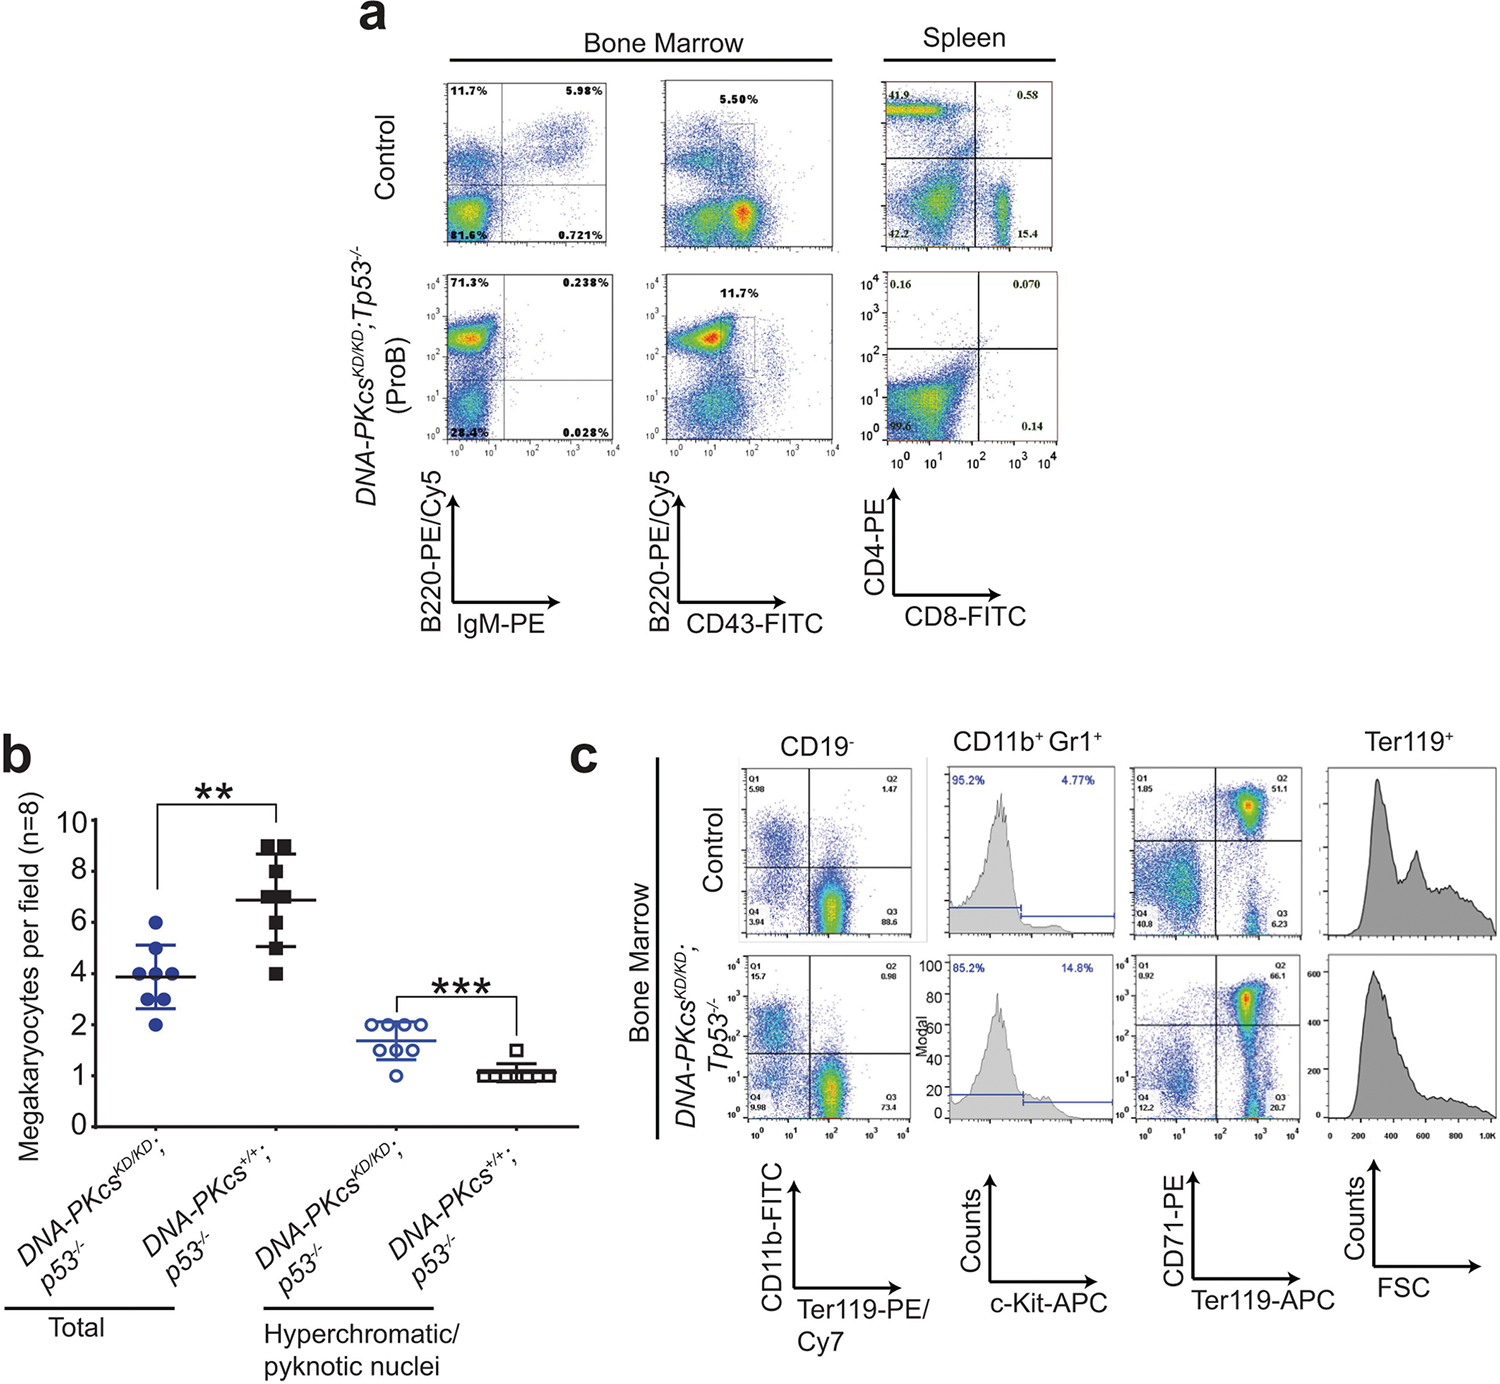
a, Representative fluorescence-activated cell sorting (FACS) analyses of pro-B cell lymphomas from DNA-PKcsKD/KDTp53−/− mice. b, The frequency of megakaryocytes with hyperchromatic or pyknotic nuclei and total megakaryocytes per 400× field in the spleen. Eight fields from three independent DNA-PKcsKD/KDTp53−/− mice were quantified and are presented here. Mean ± s.e.m.; two-sided unpaired student’s t-test, **P < 0.01, ***P < 0.001. c, Representative FACS analyses of myeloid proliferative disease in DNA-PKcsKD/KDTp53−/− mice. The CD19-negative bone marrow from DNA-PKcsKD/KDTp53−/− mice shows a higher percentage of myeloid cells (CD11b+) at the expense of RBCs (TER119+). CD19+ B cells were excluded from the wildtype bone marrow, as DNA-PKcsKD/KDTp53−/− mice have no pre-B and mature B cells (CD19+) owing to cNHEJ defects. There is also an increase in the percentage of c-KIT+ cells among the myeloid cells (CD11b+GR1+) from DNA-PKcsKD/KDTp53−/− mice. Mid-sized reticulocytes and RBC progenitors are reduced in the DNA-PKcsKD/KDTp53−/− bone marrow. Exact P values and defined sample sizes (n) are provided in Supplementary Data 1.
Extended Data Fig. 2 |. Generation and characterization of the DNA-PKcsPQR/PQR and DNA-PKcs5A/5A mouse models.
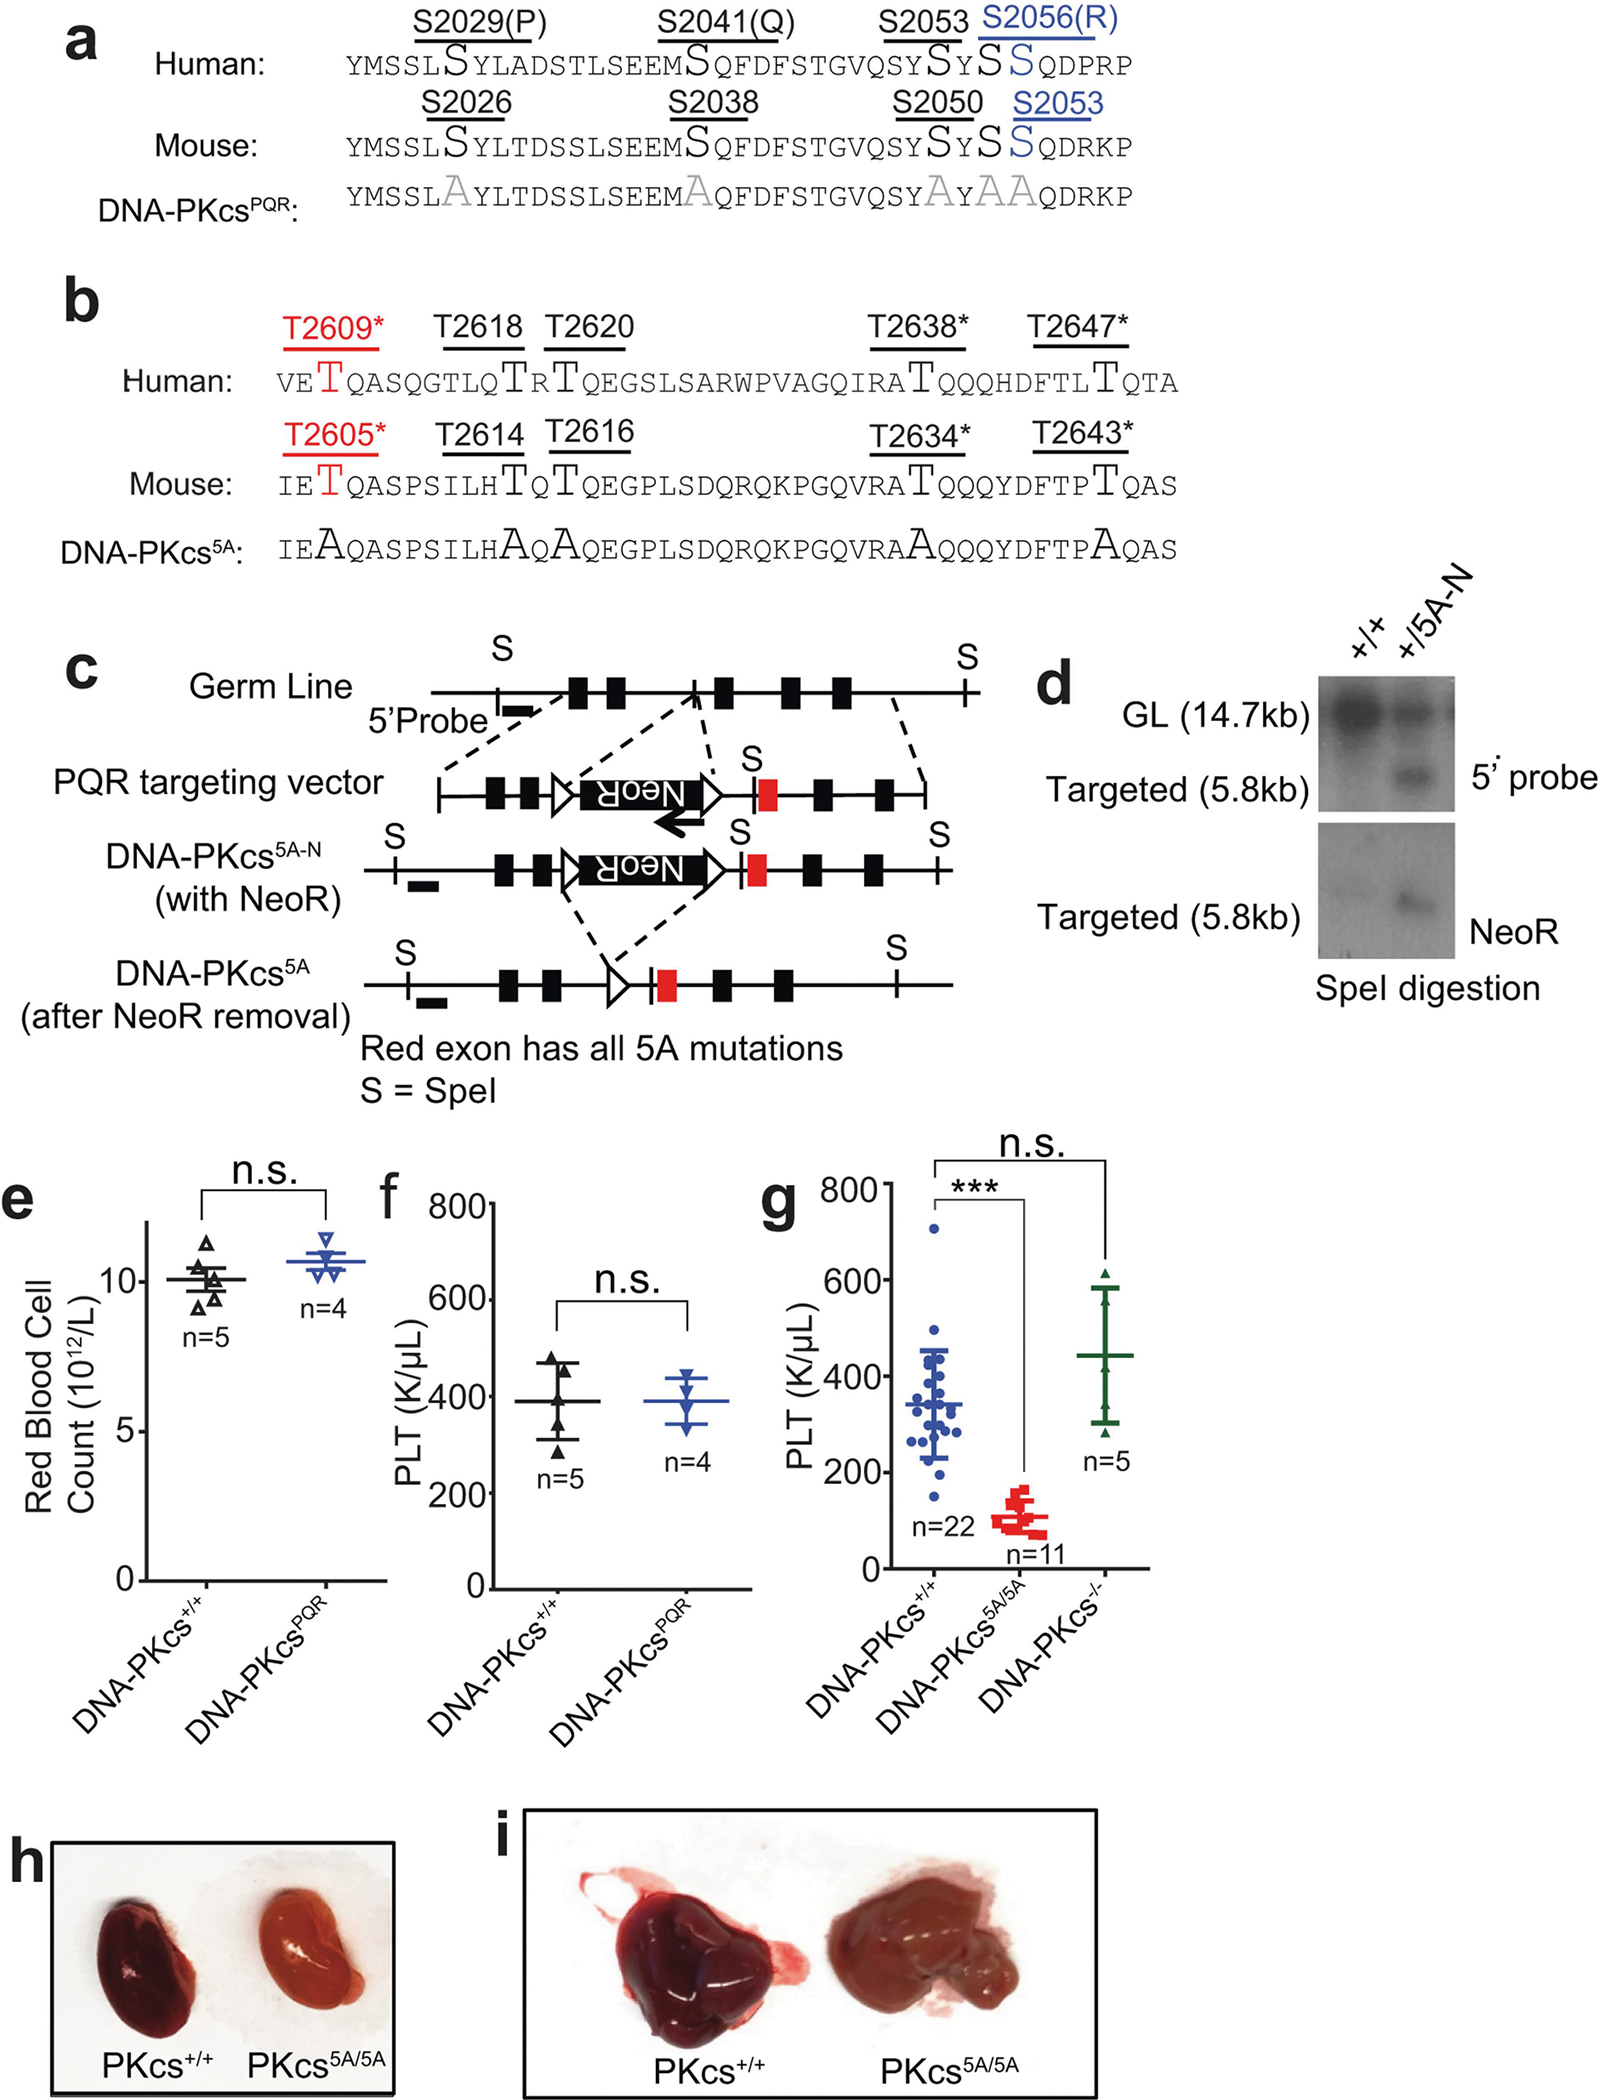
a, Diagram of the protein sequence changes in the DNA-PKcsPQR allele16. b, c, Diagram of the protein sequence changes in the DNA-PKcs5A allele and the targeting scheme. The TQ sites are shown in upper case for ease of identification. Asterisks denote sites mutated in the previously published DNA-PKcs3A allele17. The schematic diagram (not to scale) represents the mouse Prkdc (DNA-PKcs) locus (top), targeting vector (second row), targeted allele (DNA-PKcs5AN, third row), and the neo-deleted mutant allele (DNA-PKcs5A, bottom). The red exon contains the mutations. Boxes, exons; triangles, FRT sites. d, Southern blot analyses of SpeI-digested DNA from DNA-PKcs+/+ and DNA-PKcs+/5AN (with NeoR) ES cells. e, f, The concentration of RBCs and platelets (PLT) in the peripheral blood of 5-month-old DNA-PKcsPQR/PQR mice and DNA-PKcs+/+ controls. g, The platelet concentration in the peripheral blood of 2-week-old DNA-PKcs+/+, DNA-PKcs5A/5A and DNA-PKcs−/− mice. h, i, Representative images show pale kidney (h) and liver (i) from 2-week-old DNA-PKcs5A/5A mice, indicating extreme anaemia. e–g, Mean ± s.e.m.; two-sided unpaired Student’s t-test, ***P < 0.001; n.s., not significant, P > 0.05). Exact P values and defined sample sizes (n) are provided in Supplementary Data 1.
Extended Data Fig. 3 |. Haematopoiesis and translation defects in DNA-PKcs5A/5A mice.
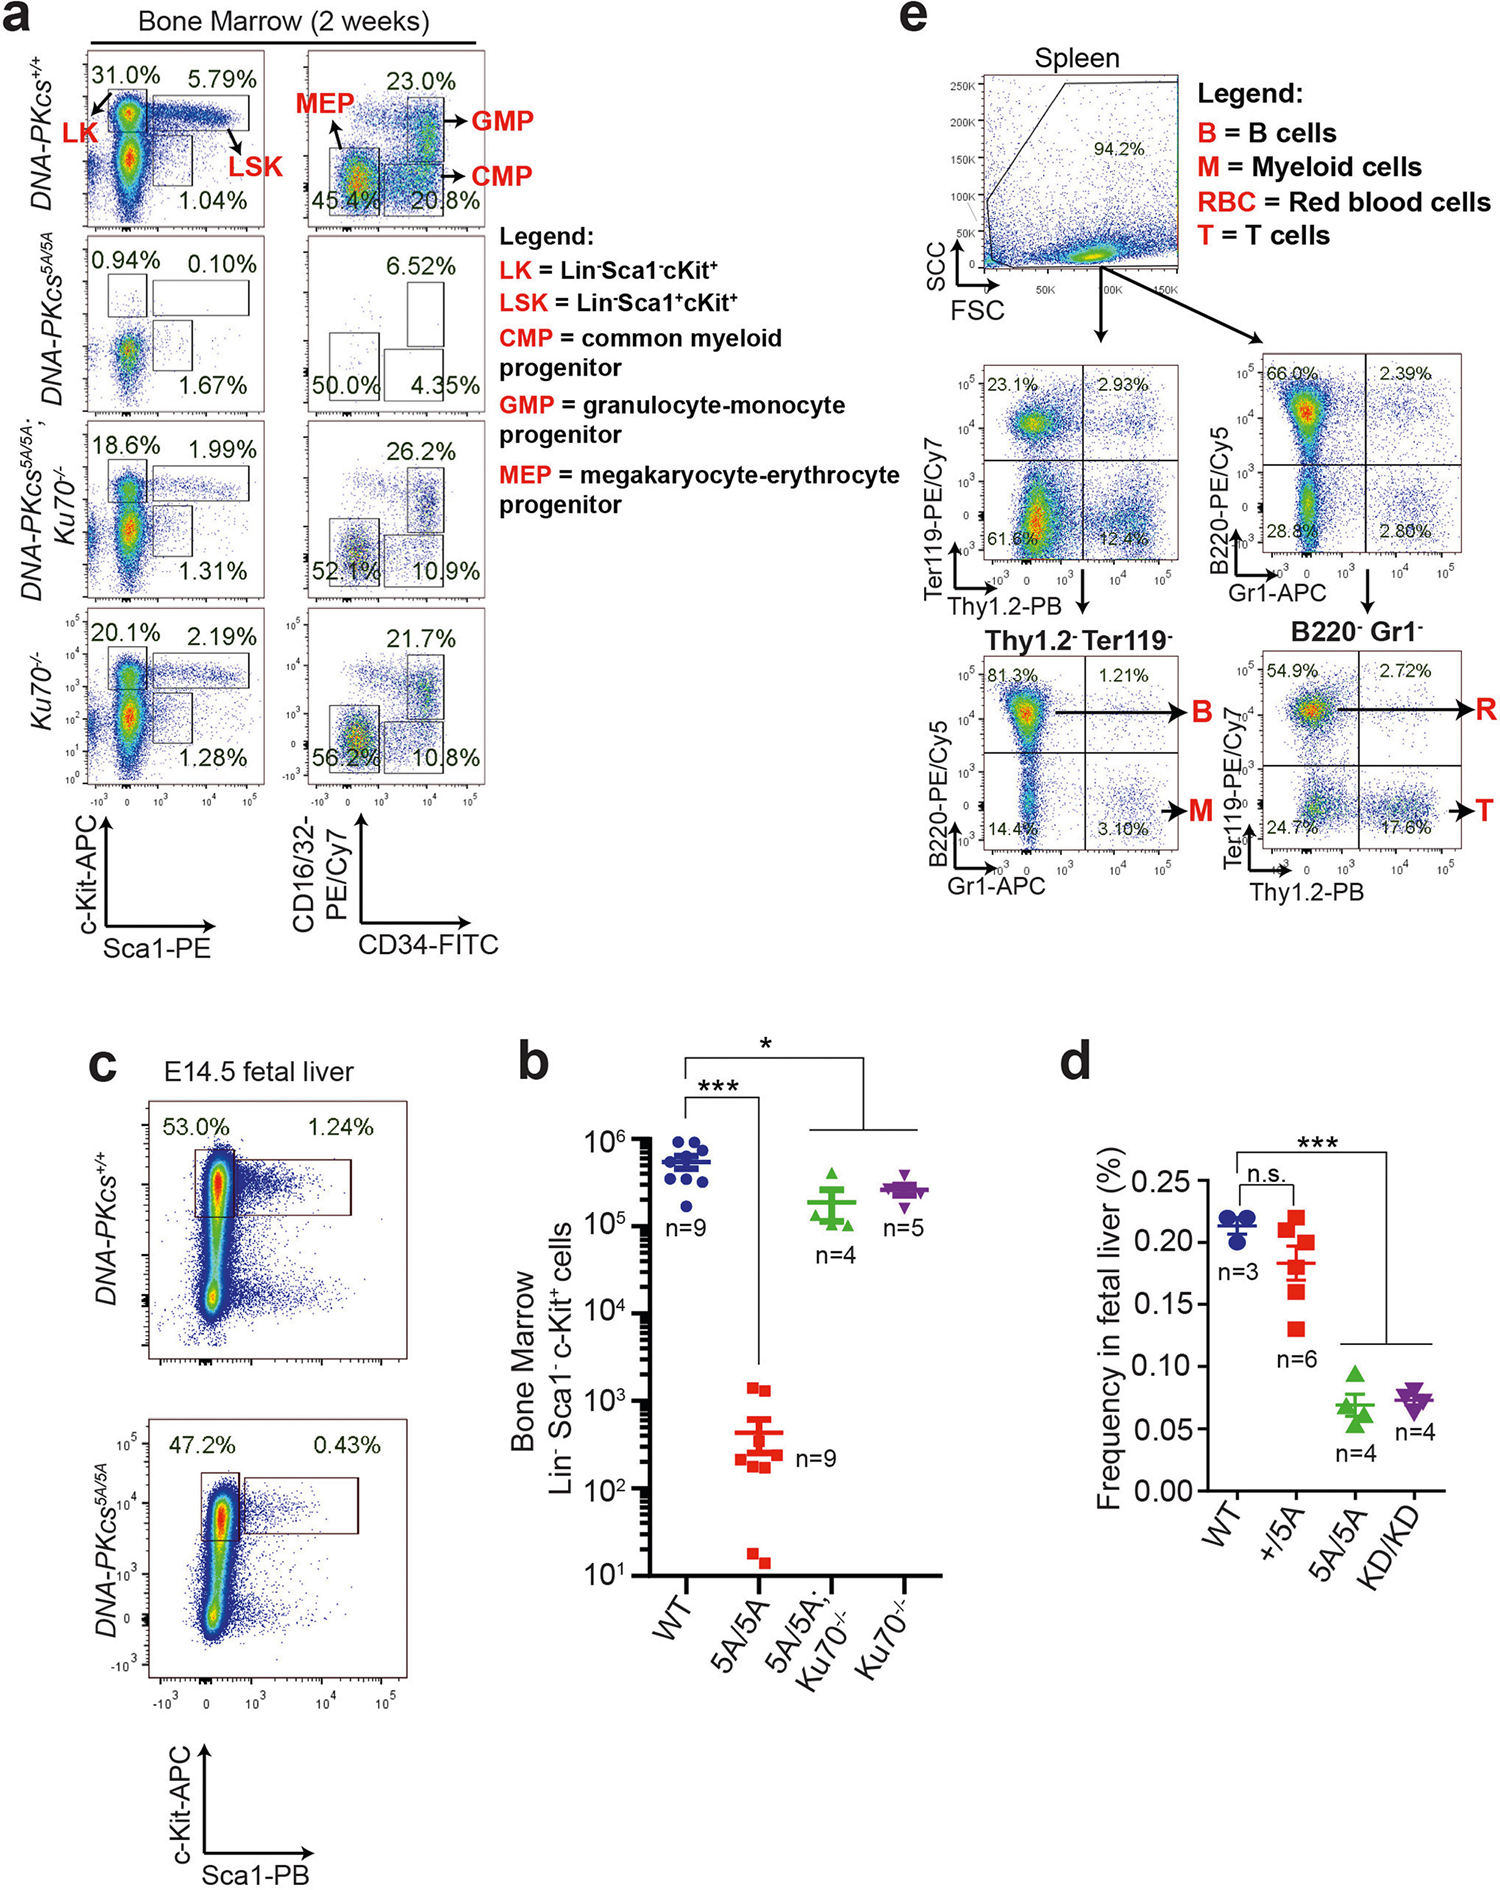
a, b, Flow cytometry analyses (a) and quantification (b) of 2-week bone marrow progenitor cell populations. The same gating strategy was used throughout to define progenitor populations. Lin−SCA1+c-KIT+ haematopoietic stem and progenitor cells (LSK, HSPC) and LK cells (Lin−SCA1−c-KIT+) were further divided into CMPs, granulocyte-monocyte progenitors (GMPs) and MEPs27. c, d, Flow cytometry analyses (c) and quantification (d) of E14.5 fetal liver HSPC (Lin−SCA1+c-KIT+) frequency from DNA-PKcsKD/KD and DNA-PKcs5A/5A embryos. e, Flow cytometry gating strategy for analysing protein translation in Lin+ cells. The gating strategy for progenitors is shown in a. This strategy (a, e) was used to determine global translation for each population in Extended Data Fig. 7d. Mean ± s.e.m.; two-sided unpaired Student’s t-test; ***P < 0.001, *P < 0.05, n.s. P > 0.05. Exact P values and defined sample sizes (n) are provided in Supplementary Data 1.
Extended Data Fig. 4 |. Normal V(D)J recombination in DNA-PKcs5A/5A mice and cells.
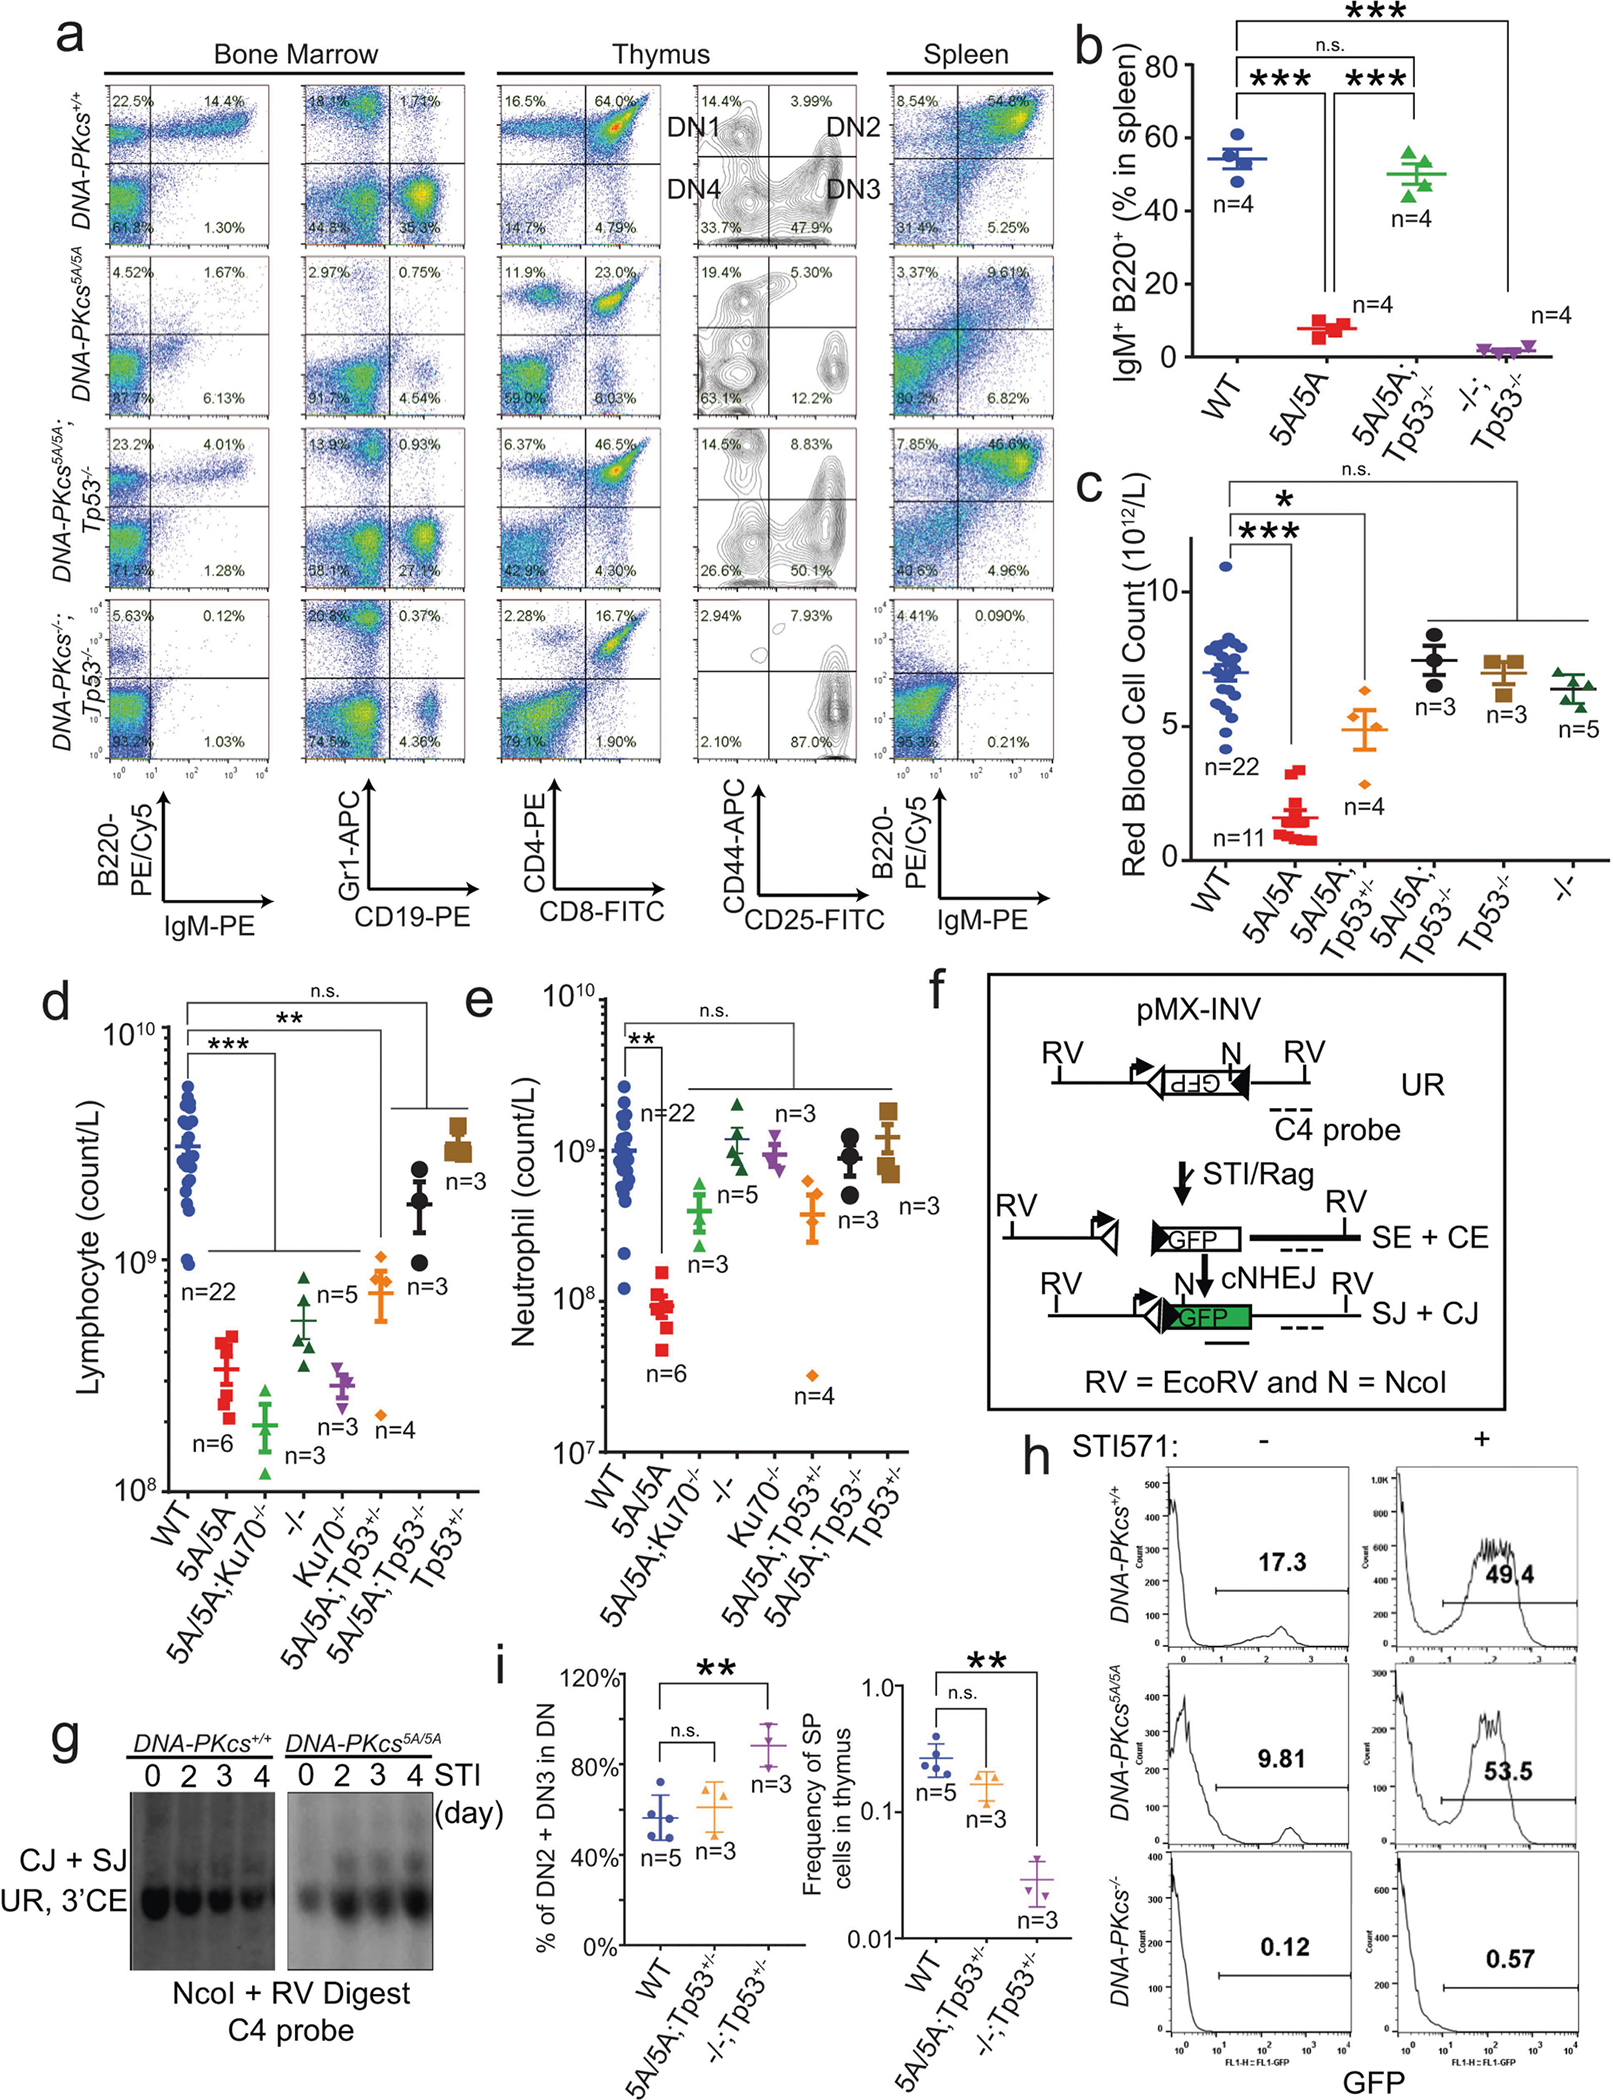
a, Flow cytometry analyses of lymphocyte development in DNAPKcs5A/5ATp53−/− and control mice. b, Frequency of B220+IgM+ naive mature B cells from spleen. c, Quantification of peripheral RBCs in DNA-PKcs5A/5A mice with and without TP53 deficiency. Note that wild-type, DNA-PKcs5A/5A and DNA-PKcs−/− data from Fig. 2b are included here for comparison. d, e, Absolute counts of peripheral lymphocytes (d) and neutrophils (e) in DNA-PKcs5A/5A mice with or without Tp53 or Ku70 deficiency. TP53-deficiency rescued both the lymphocytopaenia and the neutropaenia in DNA-PKcs5A/5A mice. Notably, KU70 deficiency caused severe lymphocytopaenia by itself or with the DNA-PKcs5A/5A mutation, but rescued the neutropaenia in DNA-PKcs5A/5A mice. f–h, Chromosomal V(D)J recombination measured in v-ABL kinase-transformed B cells. f, Diagram of pMX-INV chromosomal V(D)J recombination substrate2. Empty and filled triangles represent recombination signal sequences. RV, EcoRV, N, NcoI. Dashed line marks the C4 probe used for Southern blotting. g, Southern blotting reveals the accumulation of normal coding joins (CJ) and signal joins (SJ) and suggests successful V(D)J recombination in DNA-PKcs5A/5A B cells. h, Successful V(D)J recombination places Gfp in the same orientation as the promoter and leads to GFP expression2. Plots show the frequency of GFP+ cells after 4 days of STI571 (3 μM) treatment. i, Quantification of DN2 and DN3 cells out of all double-negative cells (left, reflecting TCRβ V(D)J recombination) and percentage of CD4+ or CD8+ single-positive (SP) cells (right, reflecting TCRα V(D)J recombination). b–e, i, Mean ± s.e.m.; two-sided unpaired Student’s t-test. ***P < 0.001, **P < 0.01, *P < 0.05, n.s. P > 0.05. Exact P values and defined sample sizes (n) are provided in Supplementary Data 1.
Extended Data Fig. 5 |. DNA-PKcs5A/5A MEFs and ES cells are not hypersensitive to DNA-damaging agents.
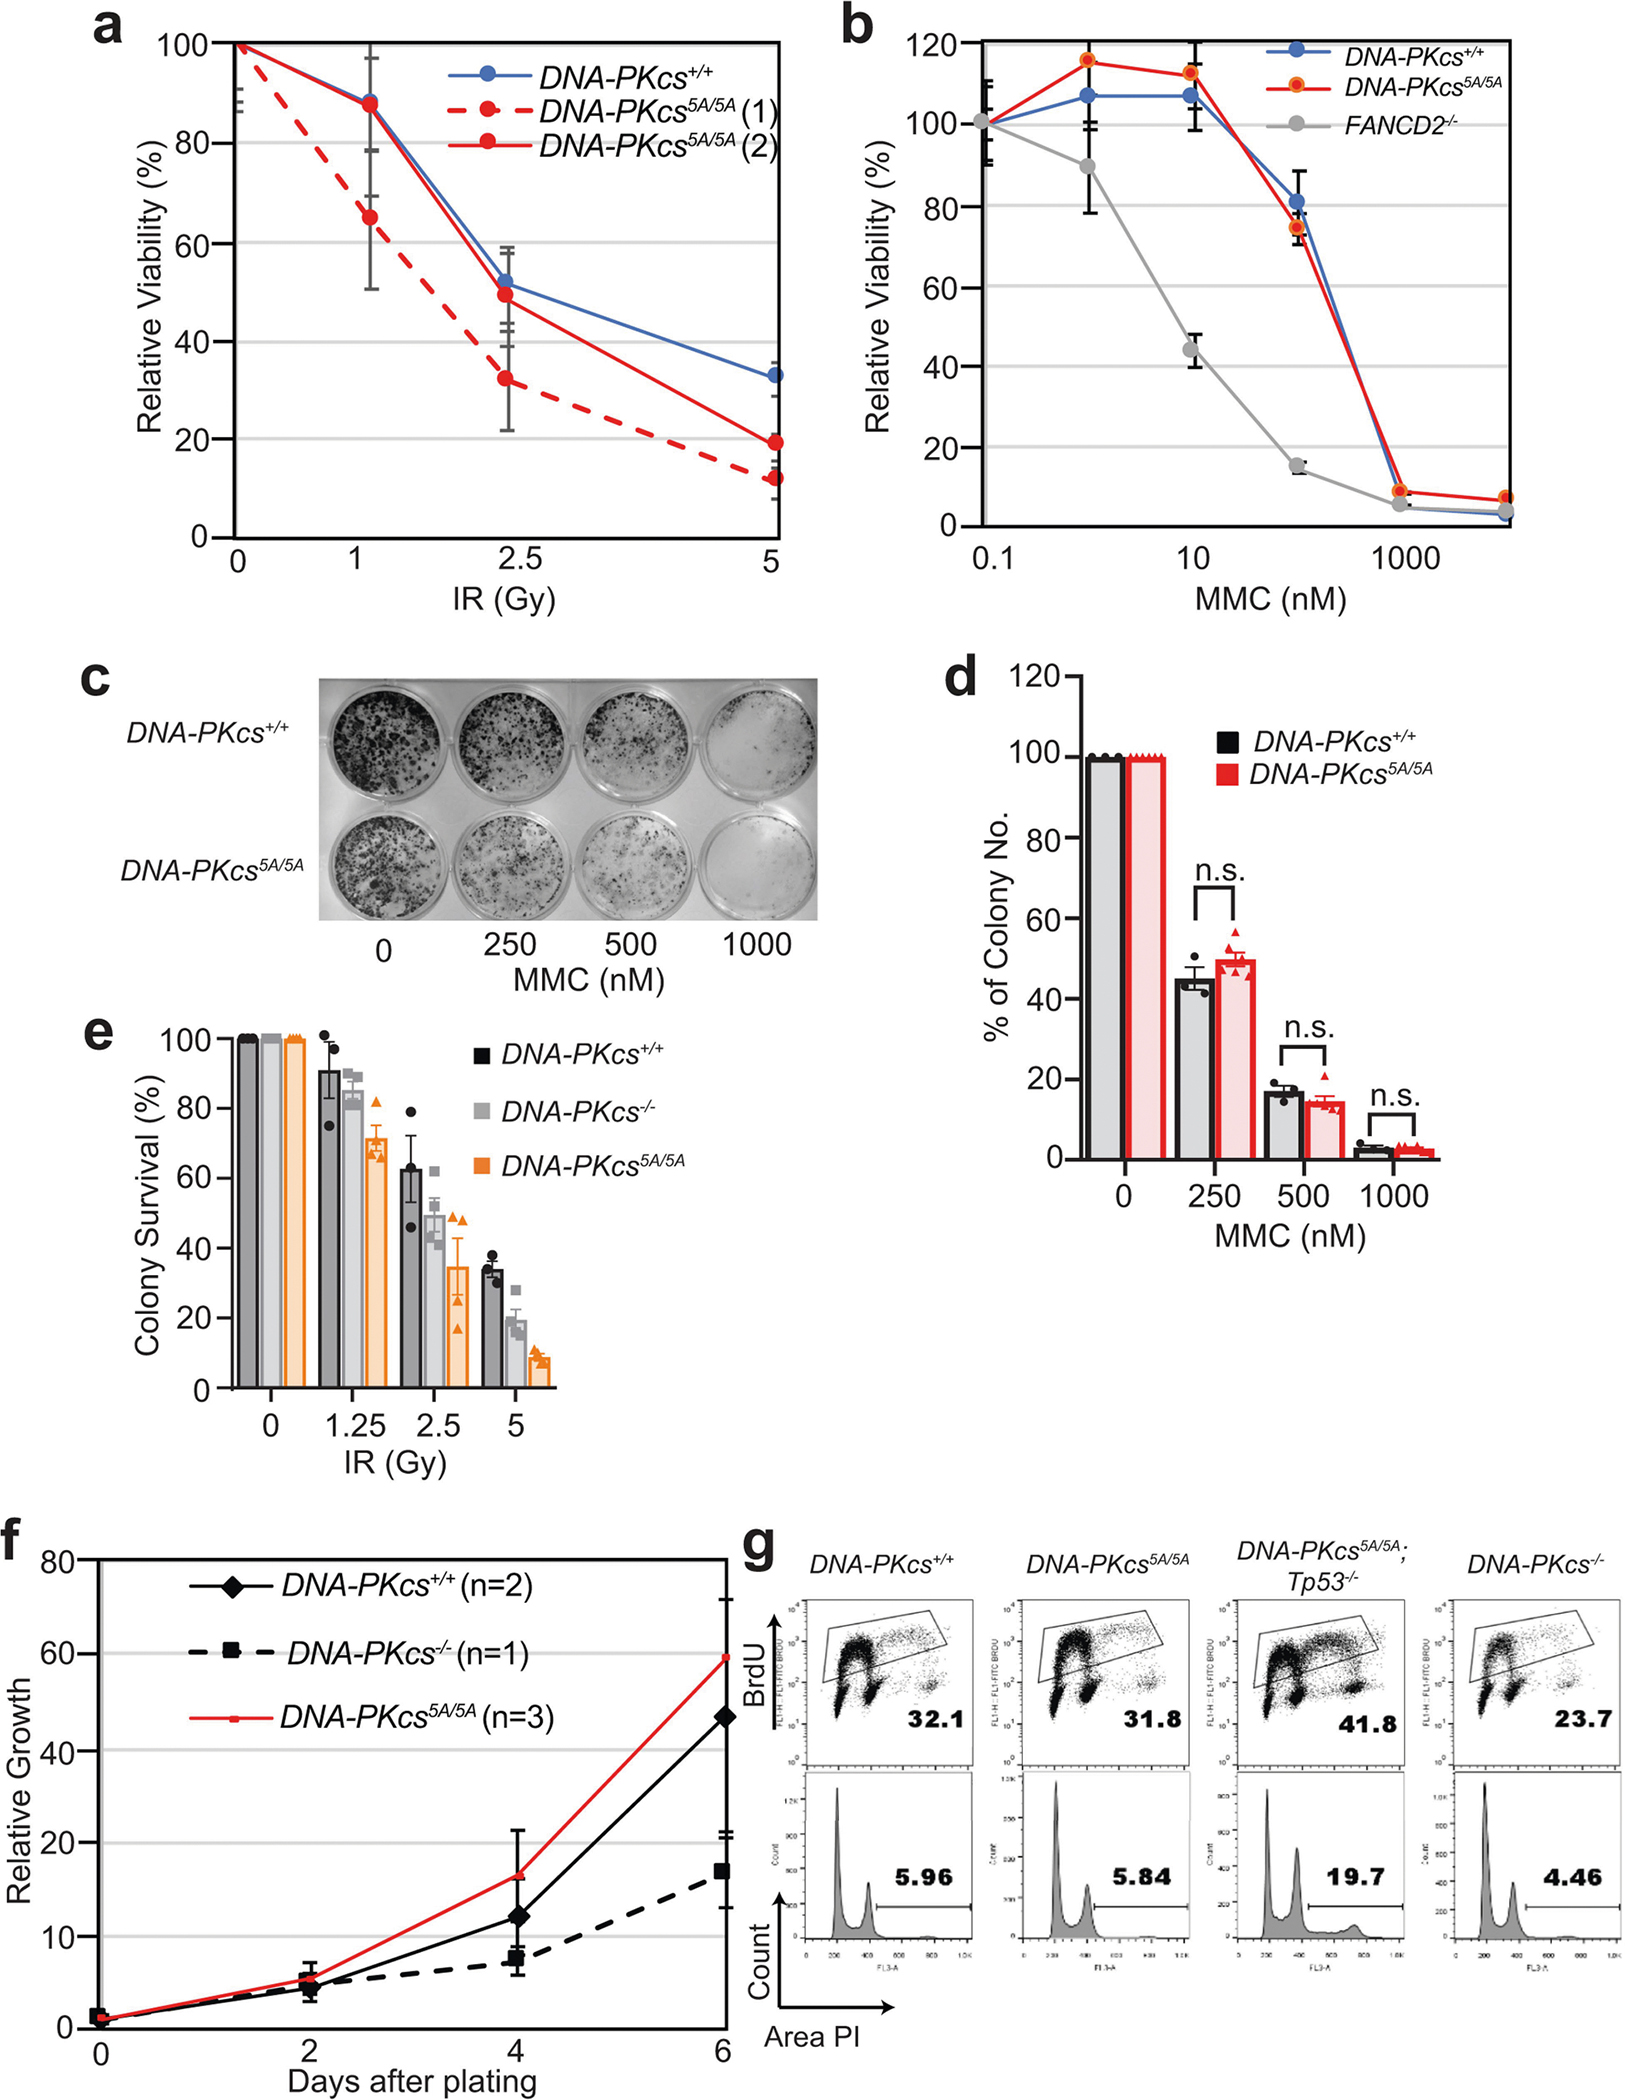
a, b, DNA-PKcs5A/5A MEFs are not hypersensitive to ionizing radiation (IR) or mitomycin C (MMC). Fancd2−/− cells19 are included as positive controls. c–e, Representative colony formation assays (c) and quantification of sensitivity to MMC (d) and IR (e) in DNA-PKcs5A/5A and control ES cells. Mean ± s.e.m. of a representative experiment in triplicate. Two-sided unpaired Student’s t-test; P > 0.05 (n.s). f, Normal proliferation curve of DNA-PKcs5A/5A MEFs. g, DNA-PKcs5A/5A MEFs have normal S phase frequency. The accumulation of aneuploid cells is unique to Tp53−/− cells. a, d–f, Mean ± s.e.m. Exact P values and defined sample sizes (n) are provided in Supplementary Data 1.
Extended Data Fig. 6 |. DNA-PKcs5A/5A ES cells have KU-dependent proliferation defects that cannot be fully explained by cNHEJ or telomere defects.
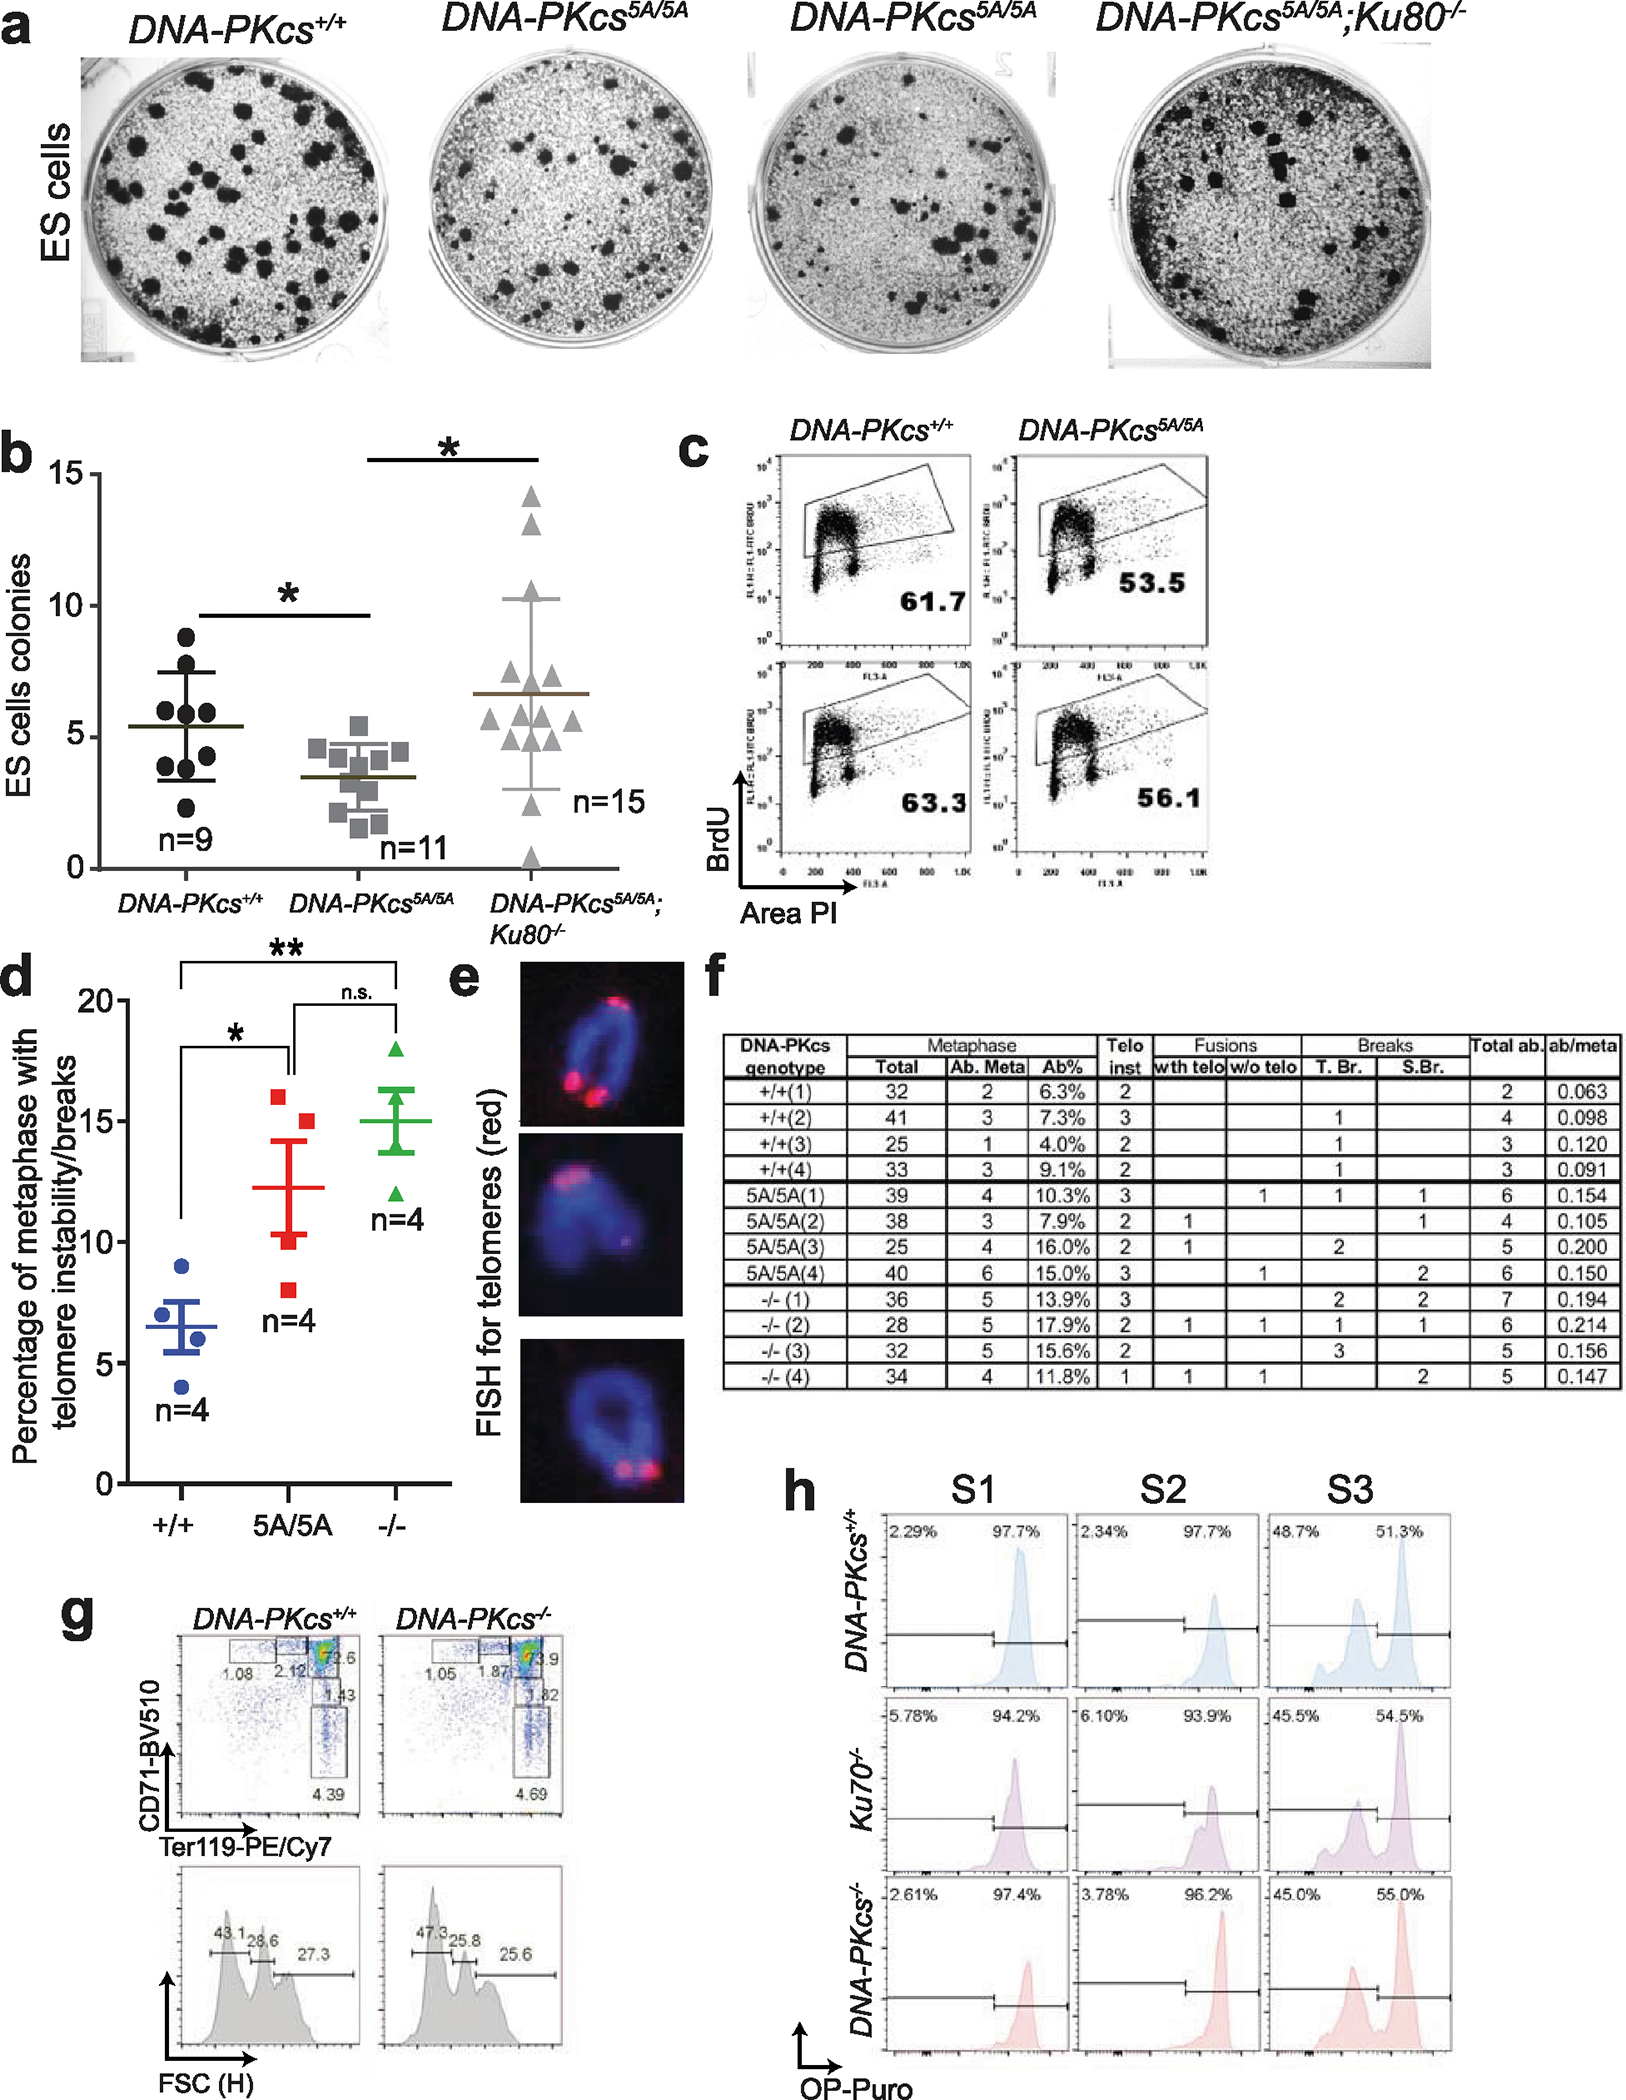
a, Representative colony formation assay for DNA-PKcs5A/5A ES cells. Note the frequent accumulation of small colonies in DNA-PKcs5A/5A cells, which is rescued by deletion of KU80. b, Quantification of colony size (A.U., arbitrary units) from DNA-PKcs5A/5A and control ES cells. Two independently derived ES cells were assayed. c, Cell cycle analyses of two independently derived DNA-PKcs5A/5A and control ES cell lines. The percentage of BrdU+ cells is shown. d, Frequency of metaphase with telomere abnormalities (see below for definition). e, Representative telomere fluorescence in situ hybridization (FISH) images of a normal mouse chromosome (top, with four telomere dots), a chromosome with a chromatid break (middle, showing loss of one telomere signal among the two sister chromatids), or a chromatid fusion without telomere signal (bottom). f, Quantitative analyses of telomere instability and chromosomal breaks in metaphase. Telomere FISH analyses of MEFs were performed with the telomere-specific PNA probe as previously described2. Normal mouse chromosomes have four discrete telomere signals (e, top). Telomere instability or breaks considered include: i) telomere instability (indicated by more than one telomere signal per chromatid), ii) telomere/chromosome fusion (e, bottom; with telomere at the fusion junction (telomere fusion) or without telomere signal at the fusion junction (non-telomere fusion)), iii) chromosome breaks (S.B.; loss of both telomere signals on the paired sister chromatids) and iv) chromatid breaks (T.B.; loss of one of the two chromatids (e, middle)). The number of metaphases with at least one telomere instability, break or fusion is shown in d as a percentage of metaphases with abnormalities. Data derived from four independent MEF lines of each genotype. g, Representative flow cytometry analyses of erythroblasts from age-matched (2 weeks) DNA-PKcs+/+ and DNA-PKcs−/− mice. h, Representative protein translation analyses of S1 (CD71+Ter119−), S2 (CD71+Ter119mid) and S3 erythroblasts (CD71+Ter119high) from 2-week-old DNA-PKcs+/+, DNA-PKcs−/− and Ku70−/− mice. Quantification is shown in Fig. 2i. b, d, Mean ± s.e.m.; two-sided unpaired Student’s t t-test, **P < 0.01, *P < 0.05, n.s. P > 0.05. Exact P values and defined sample sizes (n) are provided in Supplementary Data 1.
Extended Data Fig. 7 |. Global translation defects in DNA-PKcs5A/5A haematopoietic cells.
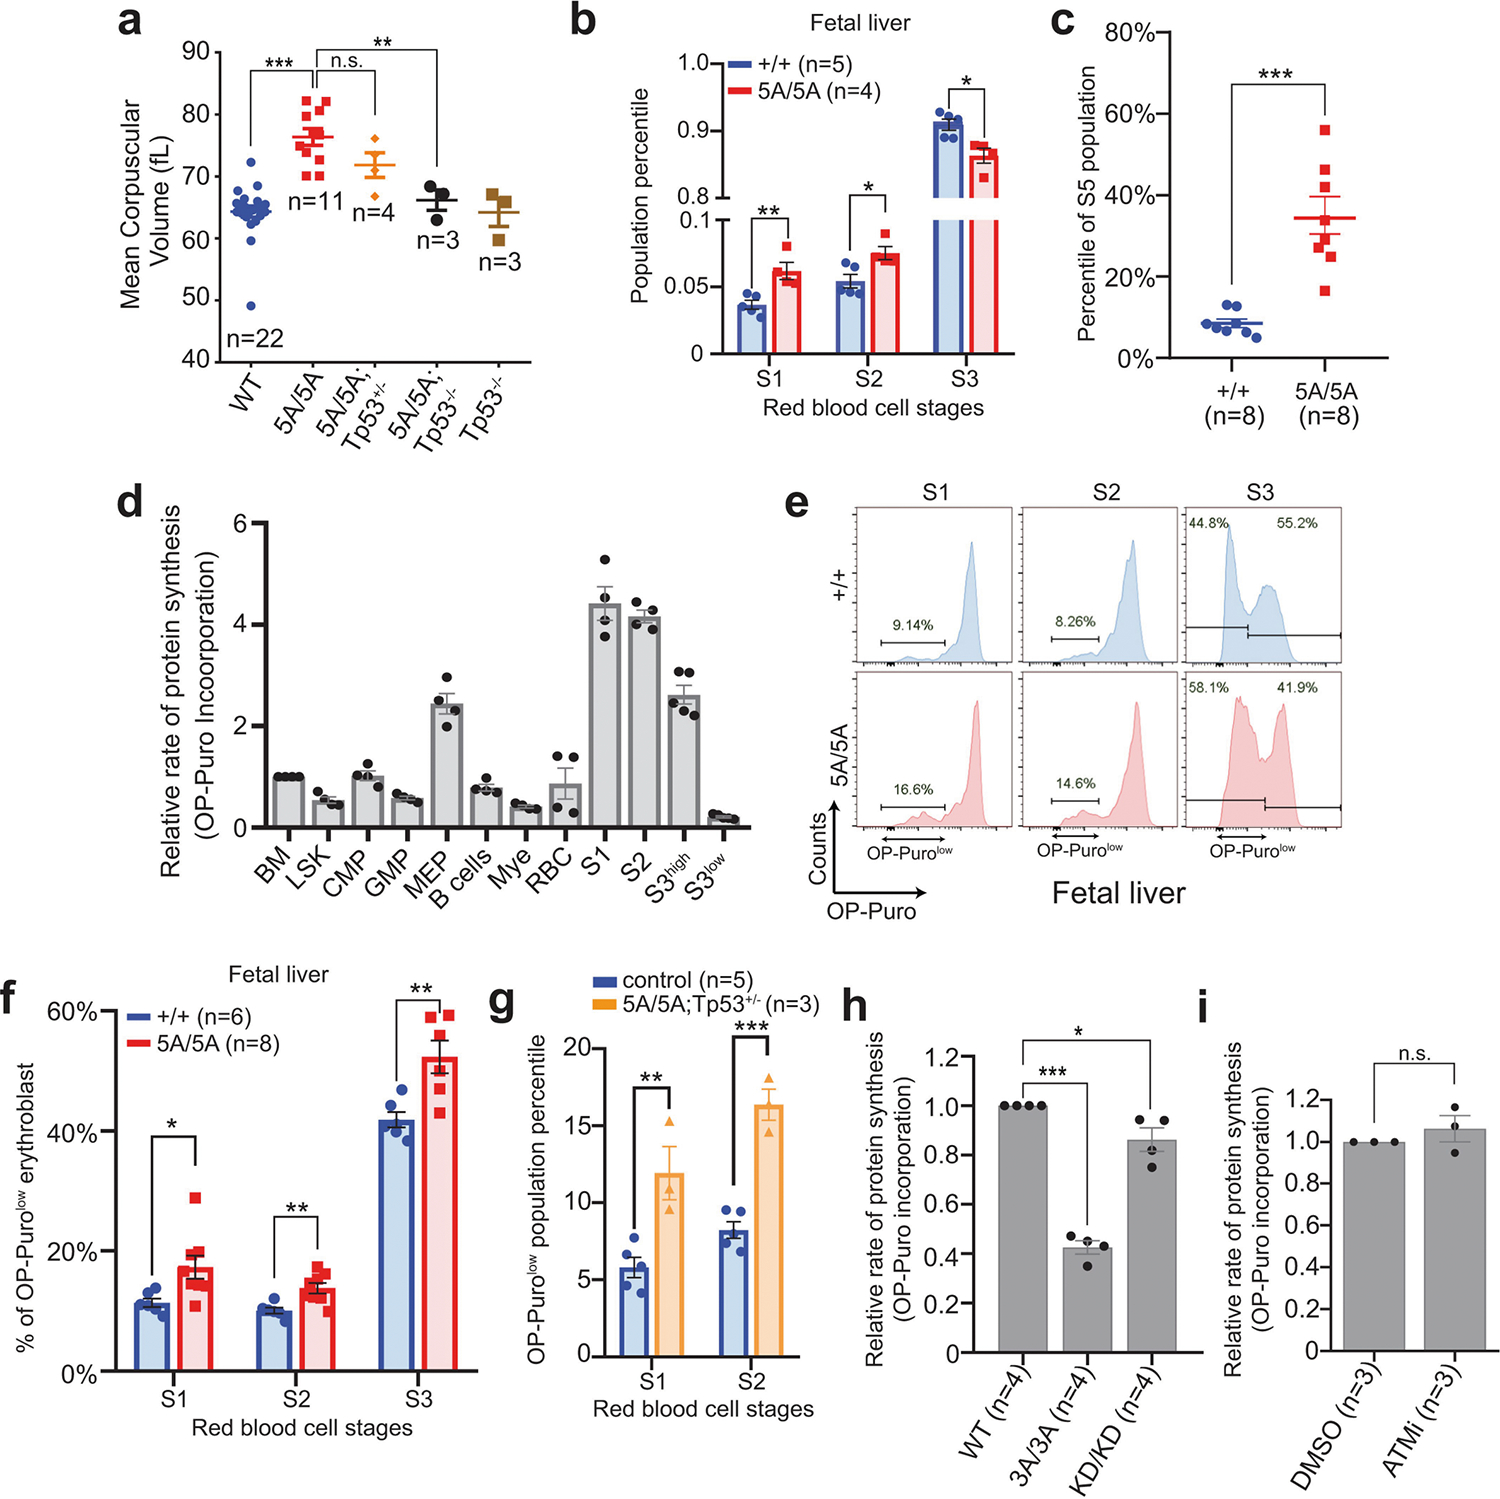
a, MCV of RBCs from 2-week-old DNA-PKcs5A/5A mice with or without TP53 deficiency. Wild-type and 5A/5A data from Fig. 2e included for comparison. b, Relative percentage of S1, S2 and S3 cells among all erythroblasts in fetal liver from DNA-PKcs5A/5A or DNA-PKcs+/+ E14.5 embryos. S4 and S5 populations have not yet evolved significantly in the E14.5 fetal liver. c, The relative frequencies of S5, the most mature erythroblast, in P14 bone marrow from DNA-PKcs5A/5A or DNA-PKcs+/+ mice. d, Relative OP-puro levels in P14 wild-type bone marrow haematopoietic cells. The average of total bone marrow was set to 1. The erythroblasts (S1, S2 and S3high) clearly have the highest OP-Puro levels. As shown in Fig. 2h, S3 erythroblasts have an OP-purohigh and an OP-purolow population. The mean OP-puro levels of both populations are included. e, Representative global protein translation in S1, S2 and S3 erythroblasts from E14.5 DNA-PKcs+/+ and DNA-PKcs5A/5A fetal liver. f, Frequency of OP-Purolow among S1, S2, and S3 erythroblasts in E14.5 fetal liver. OP-Puro labelling of fetal liver cells was performed for 30 min. g, Quantification of the frequency of OP-Purolow among S1and S2 erythroblasts from 2-week-old DNA-PKcs5A/5ATp53+/− mice. h, Relative OP-puro levels (normalized to the levels in untreated DNA-PKcs+/+ B cells) of DNA-PKcsKD/KD and DNA-PKcs3A/3A B cells. Unpaired Student’s t-test, ***P < 0.001, *P < 0.05. i, Relative OP-puro levels of DNA-PKcs+/+ B cells treated with ATM kinase inhibitor (KU55933, 15 μM for 17 h). Data represent three independent biological experiments (P = 0.38 for unpaired Student’s t-test). a–d, f–i, Two-sided unpaired Student’s t-test, ***P < 0.001, **P < 0.01, *P < 0.05, n.s. P > 0.05. All graphs show mean ± s.e.m. Exact P values and defined sample sizes (n) are provided in Supplementary Data 1.
Extended Data Fig. 8 |. rRNA synthesis-dependent localization of DNA-PK in nucleoli of human and mouse cells, and U3 ChIRP-MS of SSU processome.
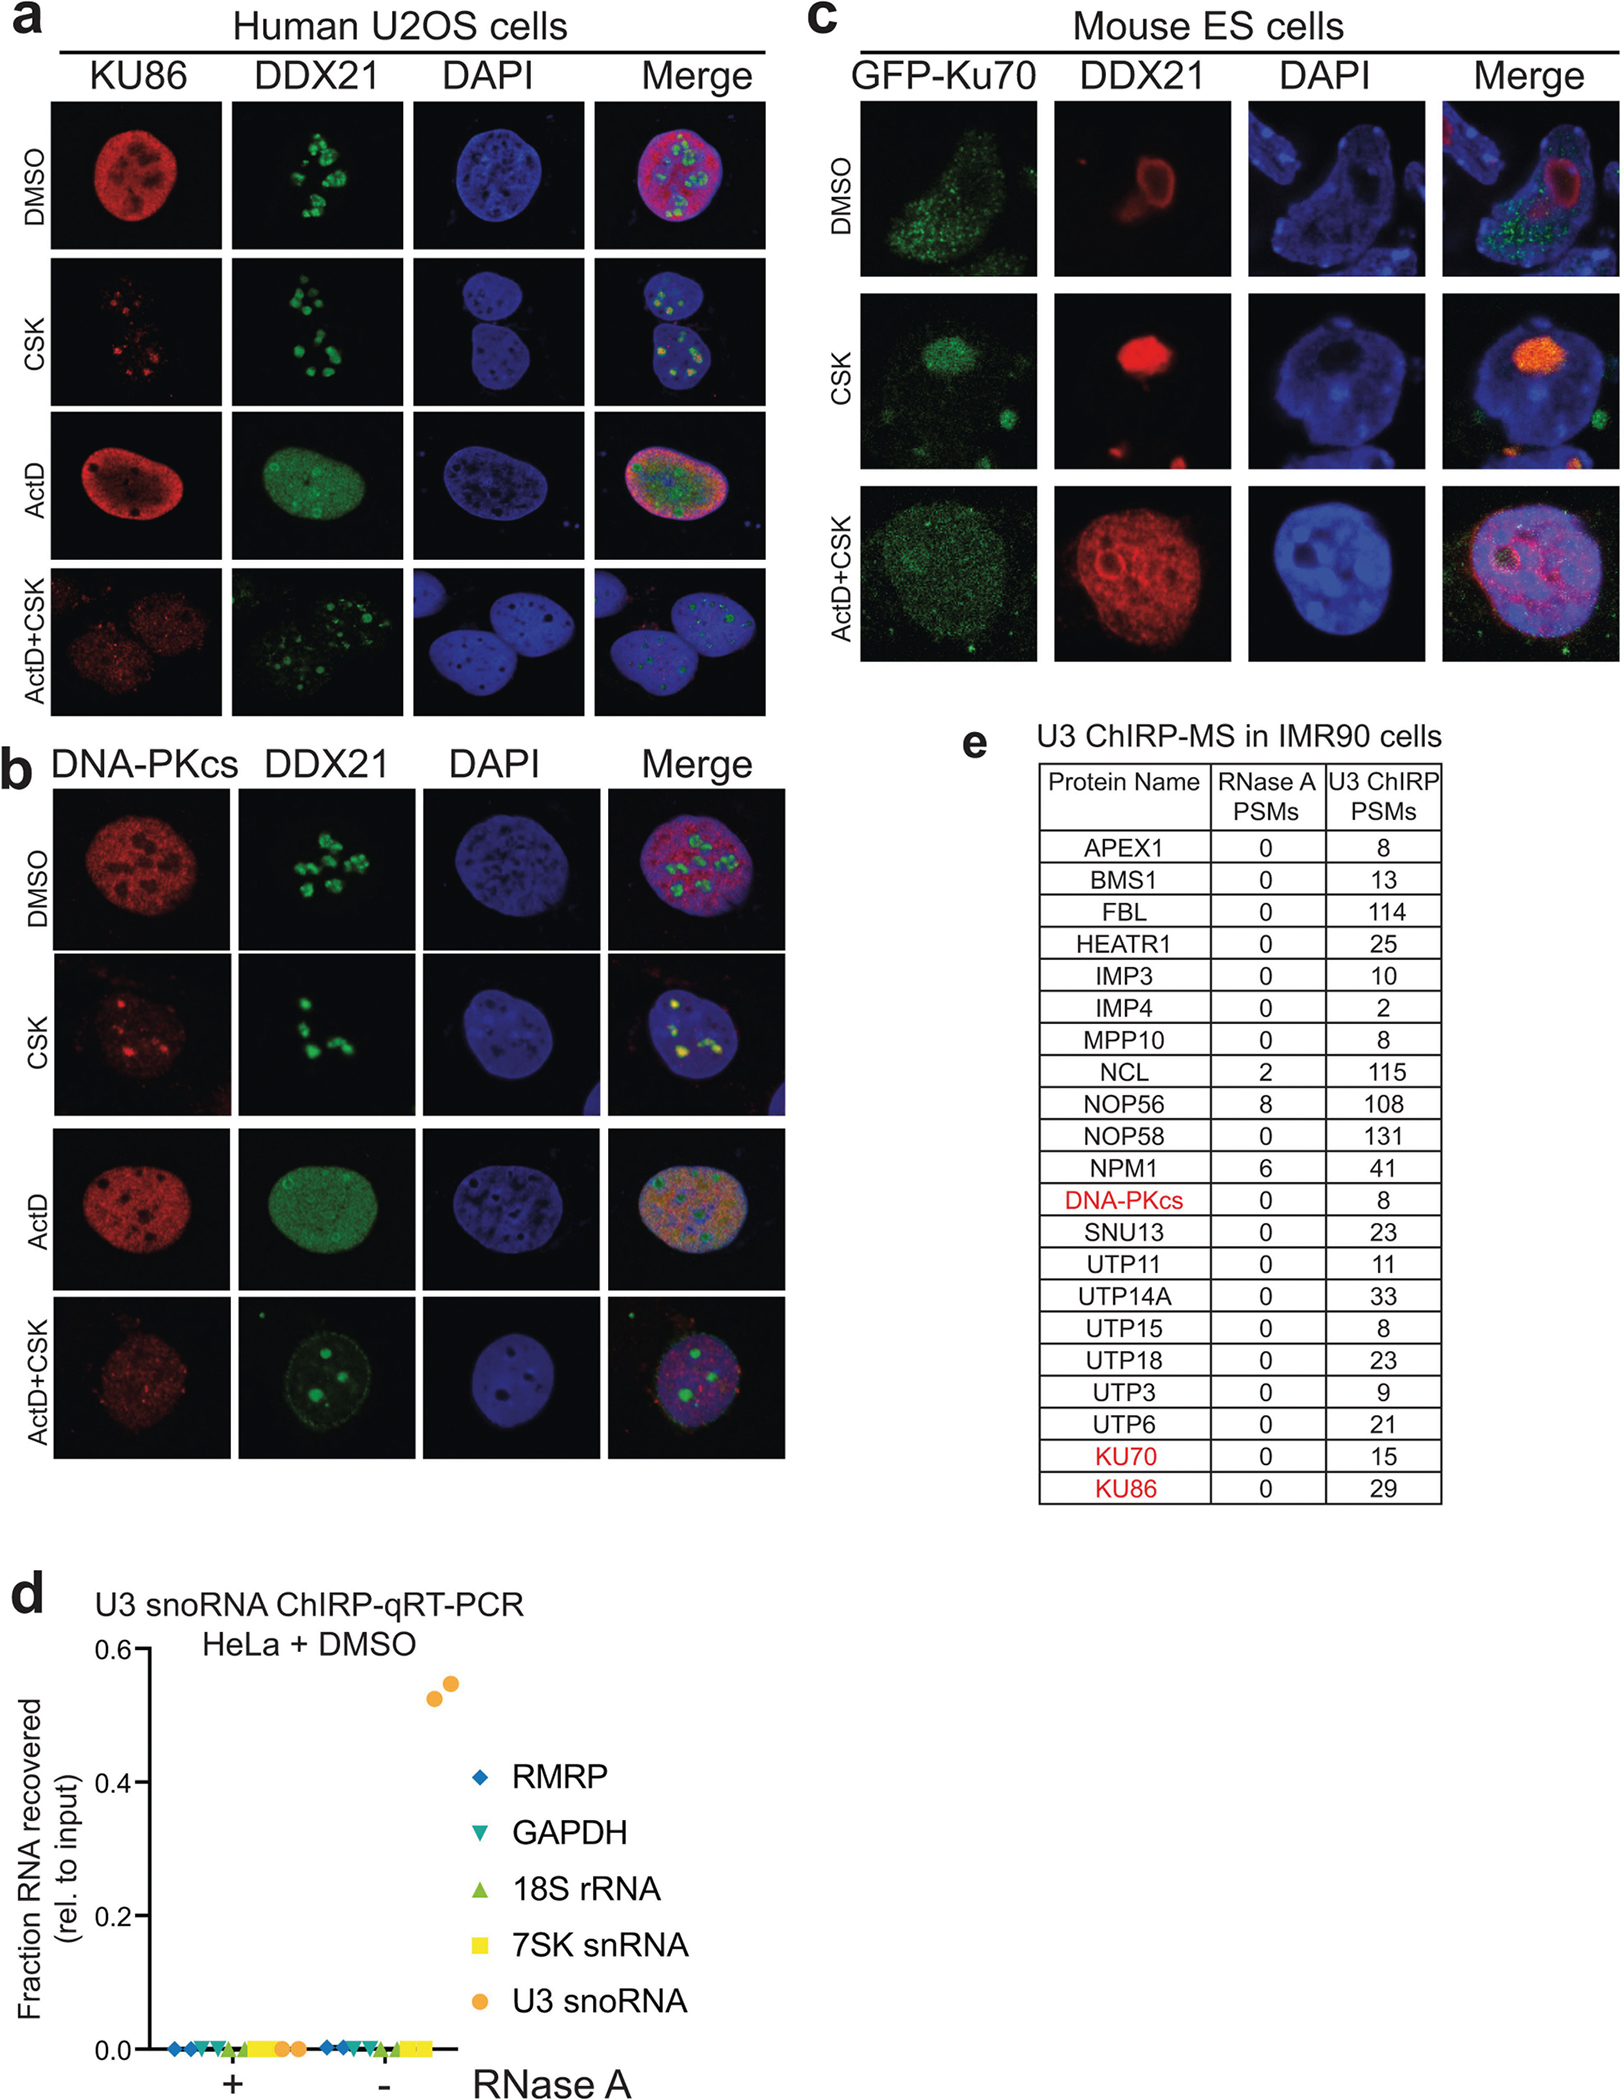
a, b, Immunofluorescence staining of endogenous KU86 (a) and DNA-PKcs (b) in U2OS cells. DDX21 RNA helicase is used as a positive control for nucleoli. The CSK buffer contains Triton X-100 for pre-extraction before fixation (see Methods). When indicated, the cells were treated with 50 nM ActD for 1 h before pre-extraction, fixation and staining. c, Localization of ectopically expressed GFP-tagged KU70 in mouse ES cells. a–c, n = 3 biologically independent experiments. d, U3 ChIRP-qRT–PCR analysis from HeLa cells. Enrichment levels, relative to input samples, of the U3, 7SK, 18S, and RMRP RNAs were assessed from experimental (−RNase A) or control (+RNase A) ChIRP samples. Data are from two independent biological replicates. e, DNA-PK was also recovered from U3 ChIRP-MS in IMR90 cells. Peptide spectral match (PSM) counts for control (RNase A) and experimental (U3) samples are shown. n = 2 biological replicates.
Extended Data Fig. 9 |. KU associates with SSU processome components.
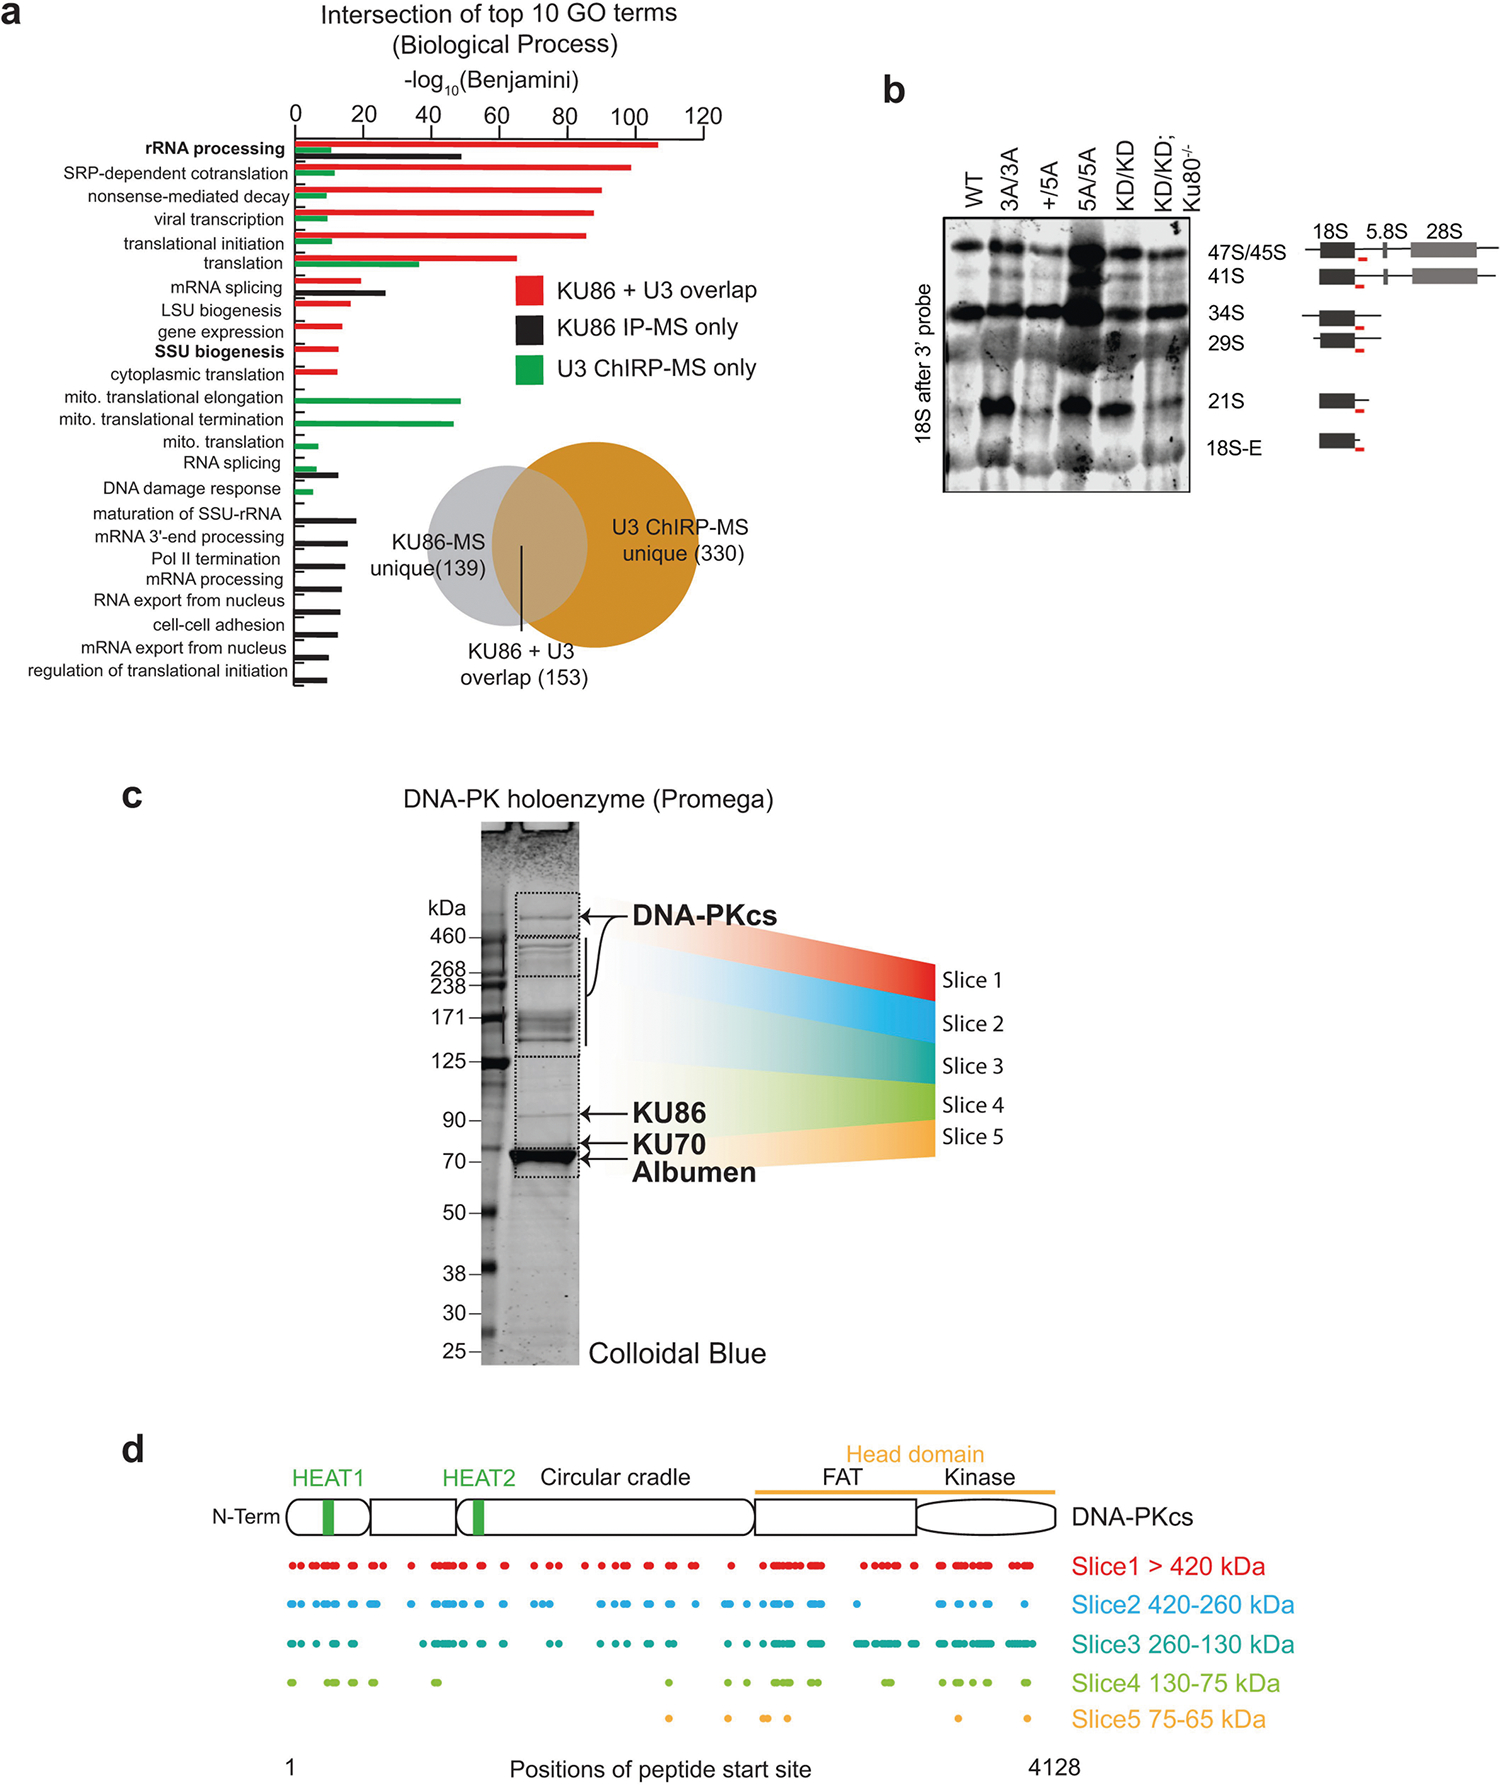
a, KU86 IP-MS and U3 ChIRP-MS overlap. Zhou et al.33 (n = 2 independent MS assays; for each assay, n = 2 technical replicates) identified 292 proteins enriched with KU86 protein. U3 ChIRP-MS identified 483 proteins enriched more than twofold with the U3 snoRNA (Supplementary Table 1). These identified factors were intersected, resulting in 153 proteins in common between the two affinity purification strategies, which is highly significant (hypergeometric P < 6.650 × 10−166). To understand what types of protein were enriched only with KU86, only with U3, or together with both factors, we isolated the enrichment values (−log10(Benjamini)) for GO biological process terms for each of these sets and compared them. Factors commonly bound were biased for rRNA processing, ribosomal terms and SSU biogenesis. U3-specific factors had additional enrichment in these categories and KU86 had a set of unique terms that were not well represented in U3. b, Independent repeat of northern blot analyses of 18S rRNA maturation in v-ABL kinase-transformed B cells from noted genotypes. The probe covers the sequence just after the 18S rRNA (red line). This experiment was repeated independently four times. Another repeat is shown in Fig. 3c. c, d, MS characterization of commercial DNA-PK holoenzyme (Promega) used in EMSA and kinase reactions. A detailed description of proteins and their quality in this mixture has not been published. We subjected the DNA-PK enzyme mix as provided to SDS–PAGE separation followed by LC–MS identification of proteins from mass ranges between 65 and 600 kDa. KU70 and KU86 were clearly present in the gel and via MS. For masses above 130 kDa, DNA-PKcs was the major protein identified. For each of the five slices analysed (coloured regions) we tabulated the starting positions of peptides matching the DNA-PKcs polypeptide and mapped them to the position within DNA-PKcs. As expected, in the highest-molecular-weight slices, we identified peptides across the majority of the length of DNA-PKcs. DNA-PKcs peptides were present in lower slices, but poorer overall coverage was evident, suggesting that these are degradation products. As this was a confirmatory experiment of a validated and commercially available product (see Methods), it was conducted only once.
Extended Data Fig. 10 |. DNA-PKcs and KU86 bind nuclear and nucleolar RNAs in living cells.
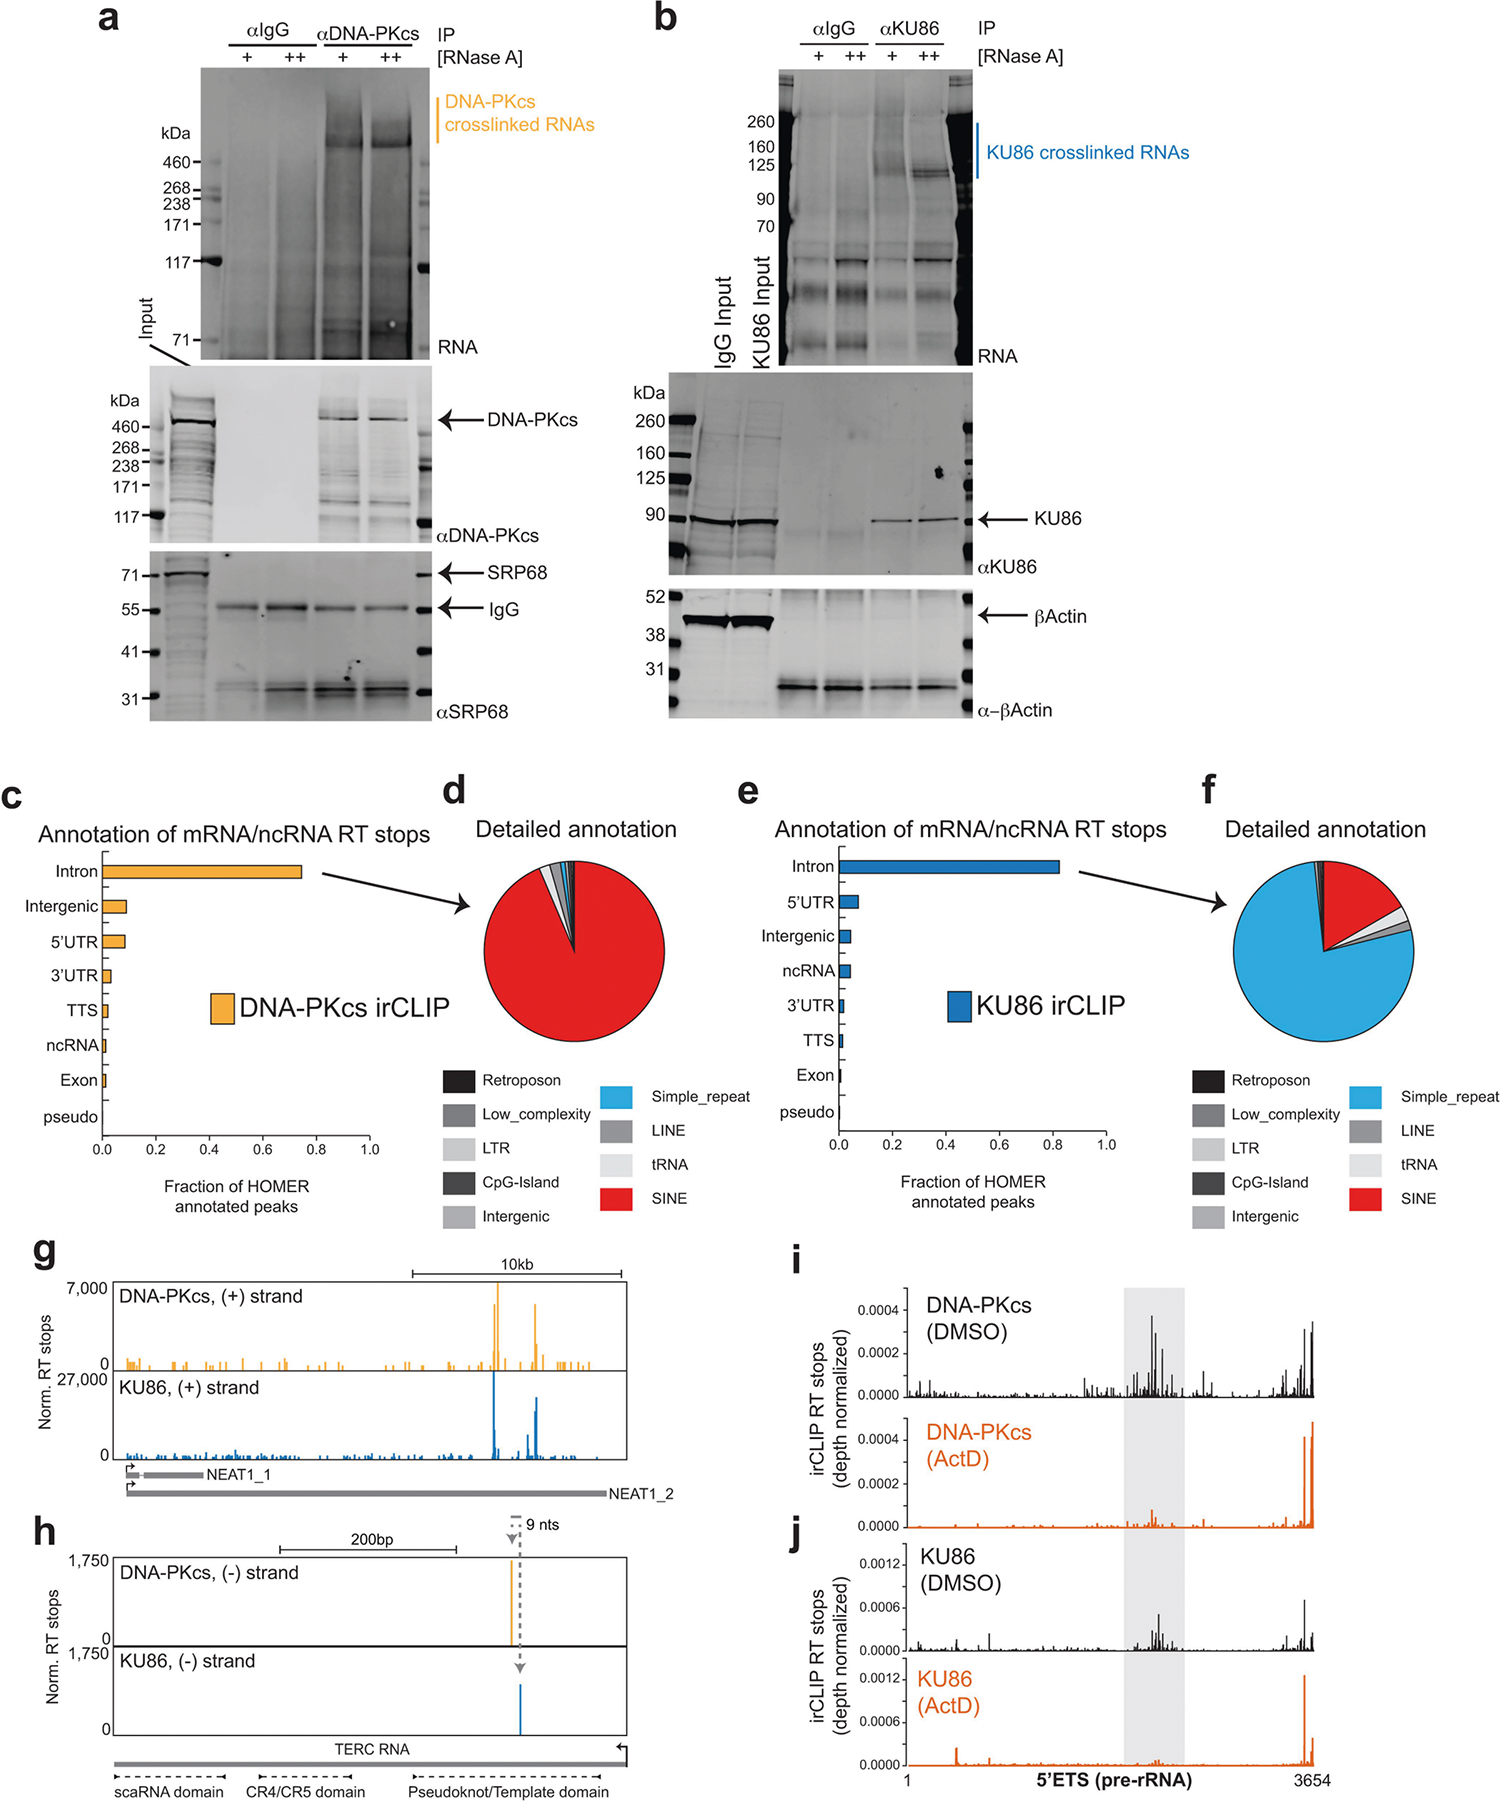
a, b, irCLIP of DNA-PKcs (a) and KU86 (b) in HeLa cells. RNA (IR800) and protein blots show specific enrichment of RNA UV-crosslinked to DNA-PKcs and KU86. The increased signal in the RNaseA-treated samples corresponds to the accumulation of RNaseA-protected fragments that are directly associated with either KU86 or DNA-PKcs. Results shown are representative of three biologically independent experiments. Vertical line marks the RNA extracted for sequencing. c, e, Fractional distribution of DNA-PKcs (c) and KU86 (e) irCLIP RT stops on major genomic features annotated with HOMER. d, f, Detailed HOMER annotation of DNA-PKcs (d) and KU86 (f) RT stops categorized as intronic and intergenic from c and e. g, h, Genome browser tracks of DNA-PKcs and KU86 irCLIP on the Neat1 (g) and Terc (h) RNA. RT stop values are normalized to 107 mapped reads. i, j, Histograms of DNA-PKcs (i) and KU86 (j) irCLIP RT stops mapping to the 5′ETS, normalized for total reads mapped per experiment. Data from DMSO- (top) or ActD-treated (bottom) HeLa cells are shown. Grey highlighted region is as in Fig. 4a.
Extended Data Fig. 11 |. DNA-PK interacts with structured RNAs that can activate its kinase.
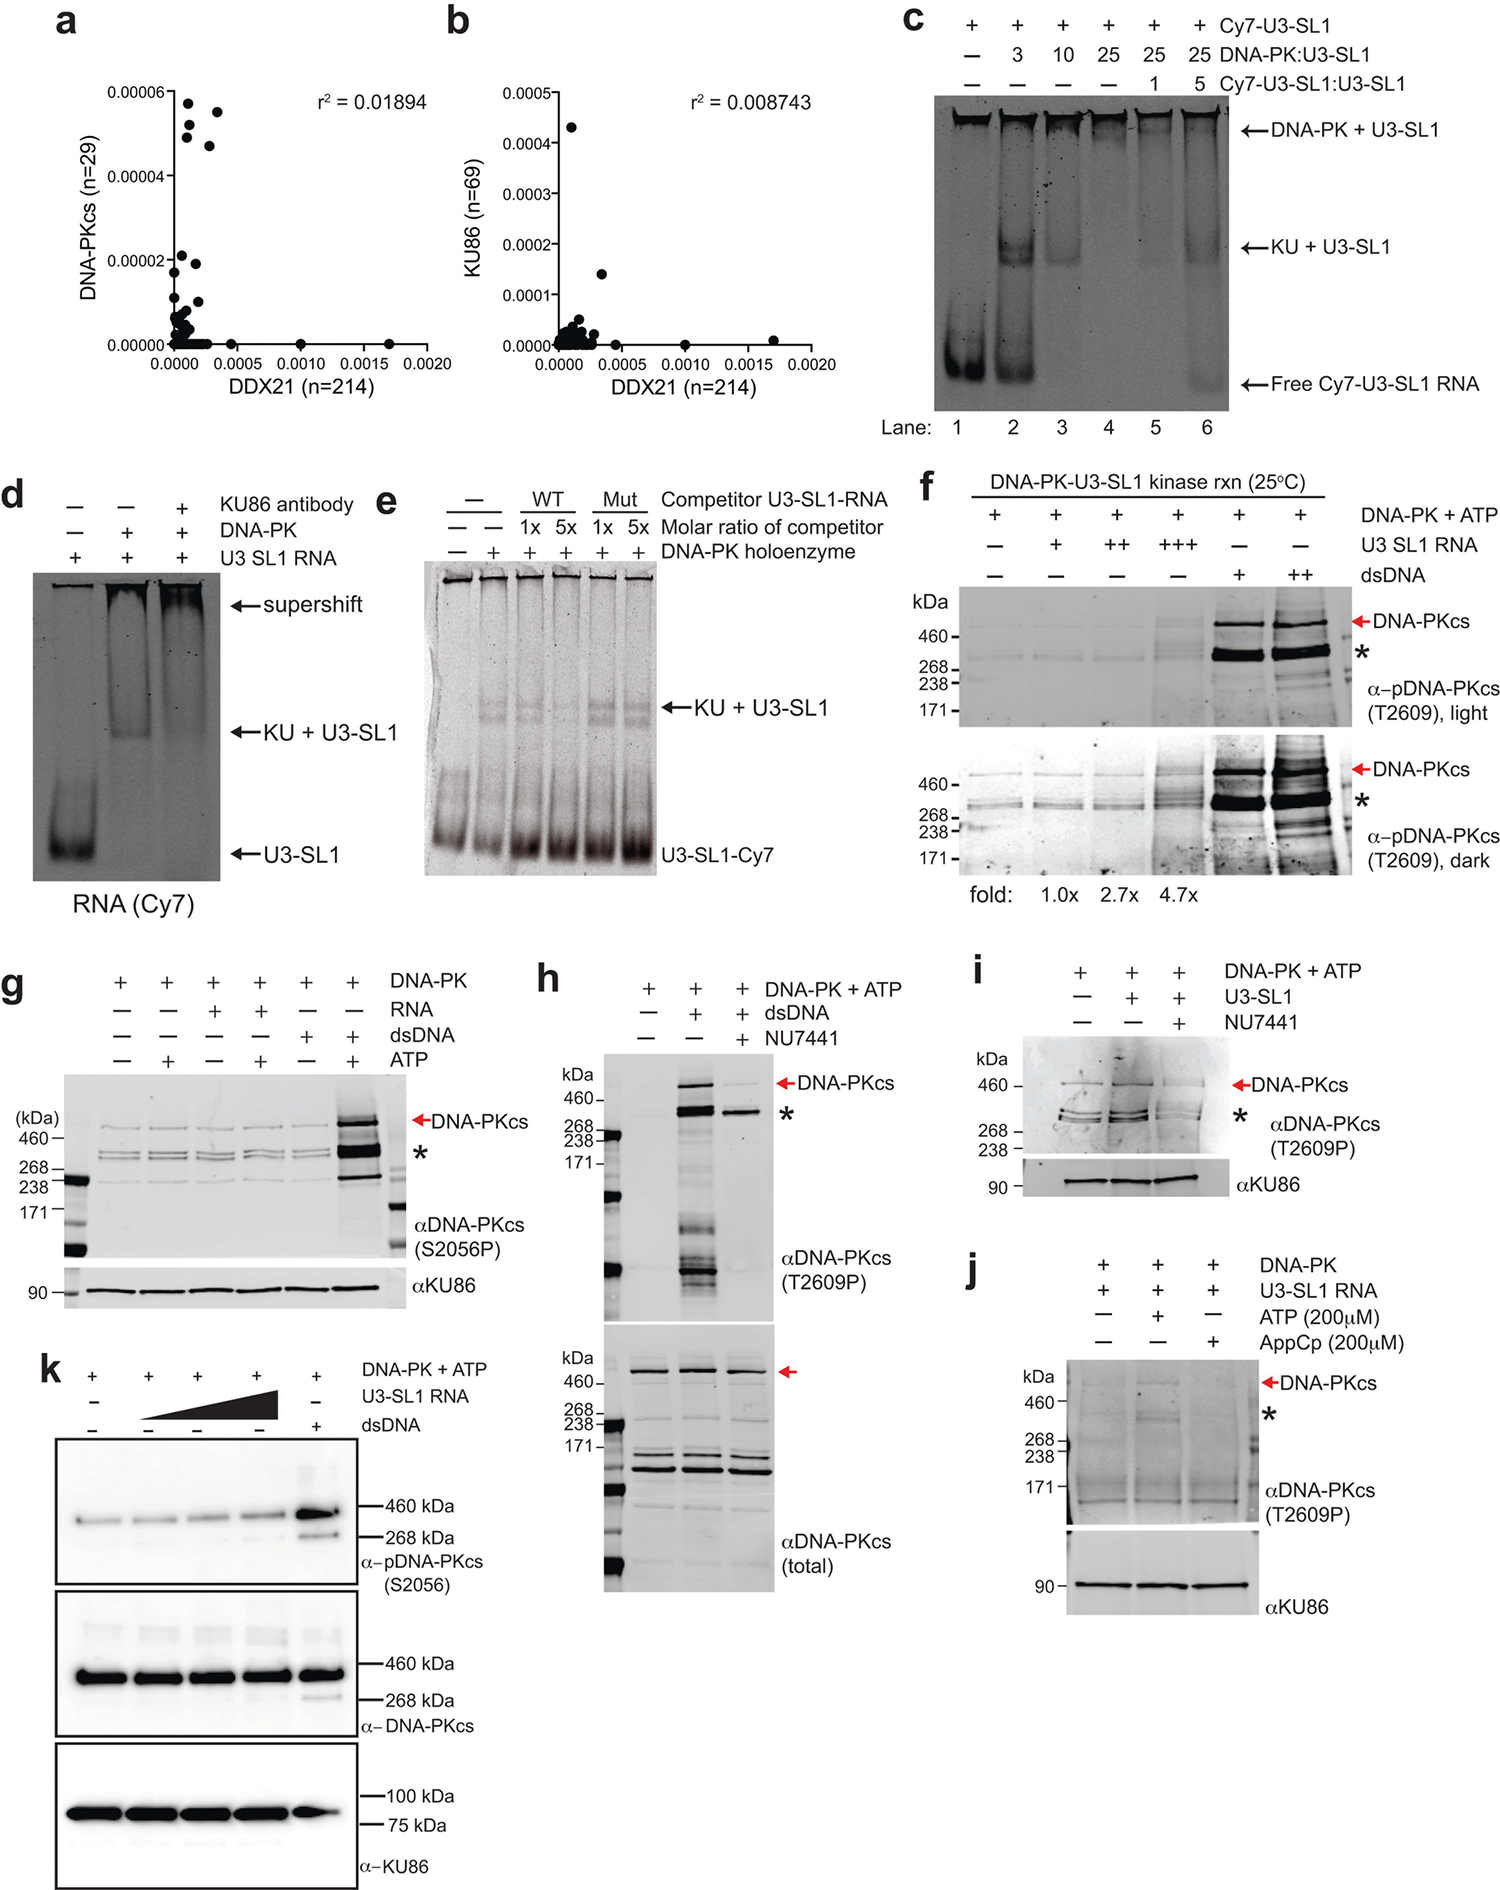
a, b, Correlation analysis of total RT stops mapping to non-repeat snoRNA transcripts from DDX2135 compared to DNA-PKcs (a) or KU86 (b) irCLIP experiments from DMSO-treated HeLa cells. Correlation analysis was performed using Pearson’s correlation coefficient. n denotes number of snoRNA transcripts bound by each protein. c, EMSA of purified human DNA-PK and in vitro transcribed U3-SL1. Lane 1 contains only Cy7-labelled U3-SL1. Lanes 2–4 show that KU assembles with U3-SL1 at a 1:3 molar ratio, while DNA-PK holoenzyme assembly occurs at a 1:25 molar ratio. Lanes 5 and 6 show that unlabelled U3-SL1 RNA competes away bound labelled U3-SL1 in a dose-dependent manner. d, Supershift EMSA of DNA-PK and U3-SL1 RNA with KU86 antibody. The addition of anti-KU86 confirms the identity of the KU–U3-SL1 band and also shifts up the complex to higher molecular weights. e, A structural mutant of U3-SL1 was generated by introducing point mutations predicted to disrupt the stem-loop structure. This mutant was unable to compete away wildtype U3-SL1 for binding to the KU complex, while unlabelled wild-type U3-SL1 competed efficiently. f, DNA-PK in vitro kinase phosphorylation assay in the presence of increasing amounts of U3-SL1 or DNA. Western blot was performed with an antibody recognizing DNA-PKcs phosphorylated at the T2609 cluster. Asterisks denote cross-reactive fragments that probably include phosphorylated DNA-PKcs fragments, on the basis of MS analyses of the DNA-PK complex (Extended Data Fig. 9c, d). g, As in f, but using an antibody recognizing DNA-PKcs phosphorylated at the S2056 cluster. h–j, As in f with the following changes. h, dsDNA was used to activate DNA-PK, NU7441 was included to inhibit specific DNA-PK activity, and western blot analysis monitored the total DNA-PK (total DNA-PKcs) or phosphorylated DNA-PK (DNA-PKcs phoT2609). i, U3-SL1 RNA was used to activate DNA-PK in the absence or presence of the DNA-PK inhibitor NU7441. j, U3-SL1 RNA was used to activate DNA-PK, hydrolysable (ATP) or non-hydrolysable (AppCp) ATP was provided, and western blot analysis monitored KU86 (loading control) or phosphorylated DNA-PK (phoT2609). k, Baculovirus-purified human DNA-PK in vitro kinase phosphorylation assay in the presence of increasing amounts of U3-SL1 or DNA. Western blot was performed with antibodies recognizing DNA-PKcs phosphorylated at the S2056 cluster (top), total DNA-PK (middle) and KU86 (bottom). All EMSA and western blots presented here are representative of three biologically independent experiments.
Supplementary Material
Acknowledgements
We thank B. Sleckman and A. Smogorzewska for providing the control cell lines; W. Gu and T. Li for helping with Tp53 analyses in DNA-PKcs mouse models; R. Baer for commenting on the manuscript; L. Ding for discussion on hematopoietic stem cell analyses; T. Xiang and L. Berchowitz for assistance with the ribosomal and nucleoli analyses; C. S. Lin for germline injection and ES cell derivation; E. Zhang and S. Kaplan for help with telomere analyses; L. Zhang and the Elias laboratory for assistance running samples for MS analysis; J. Coller, D. Wagh, and the Stanford Functional Genomics Facility for assistance running samples for deep sequencing; and the Swanson Biotechnology Center at the Koch Institute for Integrative Cancer Research, especially the MIT BioMicro Center. Owing to space constraints, we often cited reviews rather than original publications. We apologize to the colleagues whose original works were not cited here. R.A.F is supported by the Damon Runyon Cancer Research Foundation. C.R.B is supported by the Howard Hughes Medical Institute. E.C. is supported by the Pew Charitable Trusts, Charles H. Hood and March of Dime Foundations, Charles E. Reed Faculty Initiative and Irwin and Helen Sizer Career Development Professorship. The project is in part supported by R01CA184187, R01CA158073 and CA215067 to S.Z. S.Z. was a Leukemia Lymphomas Society Scholar. J.L.C. was supported by 1F31CA183504. This research was funded in part through the NIH/NCI Cancer Center Support Grant P30CA013696 to Herbert Irving Comprehensive Cancer Center (HICCC) of Columbia University.
Footnotes
Competing interests The authors declare no competing interests.
Supplementary information is available for this paper at https://doi.org/10.1038/s41586-020-2041-2.
Peer review information Nature thanks Alan Warren and the other, anonymous, reviewer(s) for their contribution to the peer review of this work.
Reprints and permissions information is available at http://www.nature.com/reprints.
Reporting summary
Further information on research design is available in the Nature Research Reporting Summary linked to this paper.
Code availability
The FAST-iCLIP software is freely available at https://github.com/ChangLab/FAST-iCLIP/tree/lite.
Data availability
irCLIP data are available via the Gene Expression Omnibus (GEO) under the accession number GSE109026. All uncropped blots are provided in Supplementary Fig. 1. Data underlying the graphical representations used in the figures, including all experiments presenting data from animal models, are provided as Source Data. Exact P values and defined sample sizes (n) are provided in Supplementary Data 1.
References
- 1.Lieber MR The mechanism of double-strand DNA break repair by the nonhomologous DNA end-joining pathway. Annu. Rev. Biochem. 79, 181–211 (2010). [DOI] [PMC free article] [PubMed] [Google Scholar]
- 2.Jiang W et al. Differential phosphorylation of DNA-PKcs regulates the interplay between end-processing and end-ligation during nonhomologous end-joining. Mol. Cell 58, 172–185 (2015). [DOI] [PMC free article] [PubMed] [Google Scholar]
- 3.Zhu C et al. Unrepaired DNA breaks in p53-deficient cells lead to oncogenic gene amplification subsequent to translocations. Cell 109, 811–821 (2002). [DOI] [PubMed] [Google Scholar]
- 4.Dragon F et al. A large nucleolar U3 ribonucleoprotein required for 18S ribosomal RNA biogenesis. Nature 417, 967–970 (2002). [DOI] [PMC free article] [PubMed] [Google Scholar]
- 5.Alt FW, Zhang Y, Meng FL, Guo C & Schwer B Mechanisms of programmed DNA lesions and genomic instability in the immune system. Cell 152, 417–429 (2013). [DOI] [PMC free article] [PubMed] [Google Scholar]
- 6.Gao Y et al. A targeted DNA-PKcs-null mutation reveals DNA-PK-independent functions for KU in V(D)J recombination. Immunity 9, 367–376 (1998). [DOI] [PubMed] [Google Scholar]
- 7.Kirchgessner CU et al. DNA-dependent kinase (p350) as a candidate gene for the murine SCID defect. Science 267, 1178–1183 (1995). [DOI] [PubMed] [Google Scholar]
- 8.Taccioli GE et al. Targeted disruption of the catalytic subunit of the DNA-PK gene in mice confers severe combined immunodeficiency and radiosensitivity. Immunity 9, 355–366 (1998). [DOI] [PubMed] [Google Scholar]
- 9.Frank KM et al. DNA ligase IV deficiency in mice leads to defective neurogenesis and embryonic lethality via the p53 pathway. Mol. Cell 5, 993–1002 (2000). [DOI] [PubMed] [Google Scholar]
- 10.Gao Y et al. Interplay of p53 and DNA-repair protein XRCC4 in tumorigenesis, genomic stability and development. Nature 404, 897–900 (2000). [DOI] [PubMed] [Google Scholar]
- 11.Nacht M et al. Mutations in the p53 and SCID genes cooperate in tumorigenesis. Genes Dev. 10, 2055–2066 (1996). [DOI] [PubMed] [Google Scholar]
- 12.Crowe JL et al. Kinase-dependent structural role of DNA-PKcs during immunoglobulin class switch recombination. Proc. Natl Acad. Sci. USA 115, 8615–8620 (2018). [DOI] [PMC free article] [PubMed] [Google Scholar]
- 13.Jacks T et al. Tumor spectrum analysis in p53-mutant mice. Curr. Biol. 4, 1–7 (1994). [DOI] [PubMed] [Google Scholar]
- 14.Meek K, Dang V & Lees-Miller SP DNA-PK: the means to justify the ends? Adv. Immunol. 99, 33–58 (2008). [DOI] [PubMed] [Google Scholar]
- 15.Davis AJ, Chen BP & Chen DJ DNA-PK: a dynamic enzyme in a versatile DSB repair pathway. DNA Repair (Amst.) 17, 21–29 (2014). [DOI] [PMC free article] [PubMed] [Google Scholar]
- 16.Jiang W et al. Phosphorylation at S2053 in murine (S2056 in human) DNA-PKcs is dispensable for lymphocyte development and class switch recombination. J. Immunol. 203, 178–187 (2019). [DOI] [PMC free article] [PubMed] [Google Scholar]
- 17.Zhang S et al. Congenital bone marrow failure in DNA-PKcs mutant mice associated with deficiencies in DNA repair. J. Cell Biol. 193, 295–305 (2011). [DOI] [PMC free article] [PubMed] [Google Scholar]
- 18.Lee BS et al. Functional intersection of ATM and DNA-PKcs in coding end joining during V(D)J recombination. Mol. Cell Biol. 33, 3568–3579 (2013). [DOI] [PMC free article] [PubMed] [Google Scholar]
- 19.Houghtaling S et al. Epithelial cancer in Fanconi anemia complementation group D2 (Fancd2) knockout mice. Genes Dev. 17, 2021–2035 (2003). [DOI] [PMC free article] [PubMed] [Google Scholar]
- 20.Williams ES et al. Telomere dysfunction and DNA-PKcs deficiency: characterization and consequence. Cancer Res. 69, 2100–2107 (2009). [DOI] [PMC free article] [PubMed] [Google Scholar]
- 21.Zhang S et al. Spontaneous tumor development in bone marrow-rescued DNA-PKcs(3A/3A) mice due to dysfunction of telomere leading strand deprotection. Oncogene 35, 3909–3918 (2016). [DOI] [PMC free article] [PubMed] [Google Scholar]
- 22.Yoo S & Dynan WS Characterization of the RNA binding properties of Ku protein. Biochemistry 37, 1336–1343 (1998). [DOI] [PubMed] [Google Scholar]
- 23.Chen H et al. Structural insights into yeast telomerase recruitment to telomeres. Cell 172, 331–343.e313 (2018). [DOI] [PMC free article] [PubMed] [Google Scholar]
- 24.Pfingsten JS et al. Mutually exclusive binding of telomerase RNA and DNA by Ku alters telomerase recruitment model. Cell 148, 922–932 (2012). [DOI] [PMC free article] [PubMed] [Google Scholar]
- 25.Britton S, Coates J & Jackson SP A new method for high-resolution imaging of Ku foci to decipher mechanisms of DNA double-strand break repair. J. Cell Biol. 202, 579–595 (2013). [DOI] [PMC free article] [PubMed] [Google Scholar]
- 26.Narla A & Ebert BL Ribosomopathies: human disorders of ribosome dysfunction. Blood 115, 3196–3205 (2010). [DOI] [PMC free article] [PubMed] [Google Scholar]
- 27.Signer RA, Magee JA, Salic A & Morrison SJ Haematopoietic stem cells require a highly regulated protein synthesis rate. Nature 509, 49–54 (2014). [DOI] [PMC free article] [PubMed] [Google Scholar]
- 28.Khajuria RK et al. Ribosome levels selectively regulate translation and lineage commitment in human hematopoiesis. Cell 173, 90–103.e119 (2018). [DOI] [PMC free article] [PubMed] [Google Scholar]
- 29.Unnikrishnan I, Radfar A, Jenab-Wolcott J & Rosenberg N p53 mediates apoptotic crisis in primary Abelson virus-transformed pre-B cells. Mol. Cell. Biol. 19, 4825–4831 (1999). [DOI] [PMC free article] [PubMed] [Google Scholar]
- 30.Strauss ME & Brandt J Attempt at preclinical identification of Huntington’s disease using the WAIS. J. Clin. Exp. Neuropsychol. 8, 210–218 (1986). [DOI] [PubMed] [Google Scholar]
- 31.Chu C et al. Systematic discovery of Xist RNA binding proteins. Cell 161, 404–416 (2015). [DOI] [PMC free article] [PubMed] [Google Scholar]
- 32.Barandun J, Hunziker M & Klinge S Assembly and structure of the SSU processome—a nucleolar precursor of the small ribosomal subunit. Curr. Opin. Struct. Biol. 49, 85–93 (2018). [DOI] [PMC free article] [PubMed] [Google Scholar]
- 33.Zhou F et al. Online nanoflow RP-RP-MS reveals dynamics of multicomponent Ku complex in response to DNA damage. J. Proteome Res. 9, 6242–6255 (2010). [DOI] [PMC free article] [PubMed] [Google Scholar]
- 34.Flygare J et al. Human RPS19, the gene mutated in Diamond-Blackfan anemia, encodes a ribosomal protein required for the maturation of 40S ribosomal subunits. Blood 109, 980–986 (2007). [DOI] [PMC free article] [PubMed] [Google Scholar]
- 35.Zarnegar BJ et al. irCLIP platform for efficient characterization of protein-RNA interactions. Nat. Methods 13, 489–492 (2016). [DOI] [PMC free article] [PubMed] [Google Scholar]
- 36.Morchikh M et al. HEXIM1 and NEAT1 long non-coding RNA form a multi-subunit complex that regulates DNA-mediated innate immune response. Mol. Cell 67, 387–399. e385 (2017). [DOI] [PubMed] [Google Scholar]
- 37.Calo E et al. RNA helicase DDX21 coordinates transcription and ribosomal RNA processing. Nature 518, 249–253 (2015). [DOI] [PMC free article] [PubMed] [Google Scholar]
- 38.Parker KA & Steitz JA Structural analysis of the human U3 ribonucleoprotein particle reveal a conserved sequence available for base pairing with pre-rRNA. Mol. Cell. Biol. 7, 2899–2913 (1987). [DOI] [PMC free article] [PubMed] [Google Scholar]
- 39.Weterings E, Verkaik NS, Brüggenwirth HT, Hoeijmakers JH & van Gent DC The role of DNA dependent protein kinase in synapsis of DNA ends. Nucleic Acids Res. 31, 7238–7246 (2003). [DOI] [PMC free article] [PubMed] [Google Scholar]
- 40.van Sluis M & McStay B A localized nucleolar DNA damage response facilitates recruitment of the homology-directed repair machinery independent of cell cycle stage. Genes Dev. 29, 1151–1163 (2015). [DOI] [PMC free article] [PubMed] [Google Scholar]
- 41.Gao Y et al. A critical role for DNA end-joining proteins in both lymphogenesis and neurogenesis. Cell 95, 891–902 (1998). [DOI] [PubMed] [Google Scholar]
- 42.Gu Y, Jin S, Gao Y, Weaver DT & Alt FW Ku70-deficient embryonic stem cells have increased ionizing radiosensitivity, defective DNA end-binding activity, and inability to support V(D)J recombination. Proc. Natl Acad. Sci. USA 94, 8076–8081 (1997). [DOI] [PMC free article] [PubMed] [Google Scholar]
- 43.Symonds H et al. p53-dependent apoptosis suppresses tumor growth and progression in vivo. Cell 78, 703–711 (1994). [DOI] [PubMed] [Google Scholar]
- 44.Avagyan S et al. Hematopoietic stem cell dysfunction underlies the progressive lymphocytopenia in XLF/Cernunnos deficiency. Blood 124, 1622–1625 (2014). [DOI] [PMC free article] [PubMed] [Google Scholar]
- 45.Liu X, Shao Z, Jiang W, Lee BJ & Zha S PAXX promotes KU accumulation at DNA breaks and is essential for end-joining in XLF-deficient mice. Nat. Commun. 8, 13816 (2017). [DOI] [PMC free article] [PubMed] [Google Scholar]
- 46.Li G et al. Lymphocyte-specific compensation for XLF/cernunnos end-joining functions in V(D)J recombination. Mol. Cell 31, 631–640 (2008). [DOI] [PMC free article] [PubMed] [Google Scholar]
- 47.Bredemeyer AL et al. ATM stabilizes DNA double-strand-break complexes during V(D)J recombination. Nature 442, 466–470 (2006). [DOI] [PubMed] [Google Scholar]
- 48.Wang M, Parshin AV, Shcherbik N & Pestov DG Reduced expression of the mouse ribosomal protein Rpl17 alters the diversity of mature ribosomes by enhancing production of shortened 5.8S rRNA. RNA 21, 1240–1248 (2015). [DOI] [PMC free article] [PubMed] [Google Scholar]
- 49.Wang M & Pestov DG 5′-end surveillance by Xrn2 acts as a shared mechanism for mammalian pre-rRNA maturation and decay. Nucleic Acids Res. 39, 1811–1822 (2011). [DOI] [PMC free article] [PubMed] [Google Scholar]
- 50.Huang W, Sherman BT & Lempicki RA Systematic and integrative analysis of large gene lists using DAVID bioinformatics resources. Nat. Protocols 4, 44–57 (2009). [DOI] [PubMed] [Google Scholar]
- 51.Shannon P et al. Cytoscape: a software environment for integrated models of biomolecular interaction networks. Genome Res. 13, 2498–2504 (2003). [DOI] [PMC free article] [PubMed] [Google Scholar]
- 52.Zuker M Mfold web server for nucleic acid folding and hybridization prediction. Nucleic Acids Res. 31, 3406–3415 (2003). [DOI] [PMC free article] [PubMed] [Google Scholar]
- 53.Darty K, Denise A & Ponty Y VARNA: interactive drawing and editing of the RNA secondary structure. Bioinformatics 25, 1974–1975 (2009). [DOI] [PMC free article] [PubMed] [Google Scholar]
Associated Data
This section collects any data citations, data availability statements, or supplementary materials included in this article.
Supplementary Materials
Data Availability Statement
irCLIP data are available via the Gene Expression Omnibus (GEO) under the accession number GSE109026. All uncropped blots are provided in Supplementary Fig. 1. Data underlying the graphical representations used in the figures, including all experiments presenting data from animal models, are provided as Source Data. Exact P values and defined sample sizes (n) are provided in Supplementary Data 1.