

Abstract
Endometrial cancer (EC) is the most prevalent gynecological cancer in high‐income countries. Its incidence is skyrocketing due to the increase in risk factors such as obesity, which represents a true pandemic. This study aimed to evaluate microRNA (miRNA) expression in obesity‐related EC to identify potential associations between this specific cancer type and obesity. miRNA levels were analyzed in 84 EC patients stratified based on body mass index (BMI; ≥30 or <30) and nine noncancer women with obesity. The data were further tested in The Cancer Genome Atlas (TCGA) cohort, including 384 EC patients, 235 with BMI ≥30 and 149 with BMI <30. Prediction of miRNA targets and analysis of their expression were also performed to identify the potential epigenetic networks involved in obesity modulation. In the EC cohort, BMI ≥30 was significantly associated with 11 deregulated miRNAs. The topmost deregulated miRNAs were first analyzed in 84 EC samples by single miRNA assay and then tested in the TCGA dataset. This independent validation provided further confirmation about the significant difference of three miRNAs (miR‐199a‐5p, miR‐449a, miR‐449b‐5p) in normal‐weight EC patients versus EC patients with obesity, resulting significantly higher expressed in the latter. Moreover, the three miRNAs were significantly correlated with grade, histological type, and overall survival. Analysis of their target genes revealed that these miRNAs may regulate obesity‐related pathways. In conclusion, we identified specific miRNAs associated with BMI that are potentially involved in modulating obesity‐related pathways and that may provide novel implications for the clinical management of obese EC patients.
Keywords: BMI, endometrial cancer, miRNA, obesity, personalized medicine
Obesity is the most important risk factor for endometrial cancer (EC). This study demonstrated that specific microRNAs (miRNAs), significantly deregulated in obese EC patients, may modulate expression of genes involved in obesity‐related pathways. By restoring the physiological levels of these miRNAs, it would be possible to develop a complementary strategy for treating EC in obese patients, in addition to anti‐estrogenic, anti‐diabetic, and weight‐loss strategies.

1. INTRODUCTION
Endometrial cancer (EC) is the most prevalent gynecological cancer in high‐income countries. A woman has a 3% chance of developing EC throughout her lifetime, and the incidence has skyrocketed by over 100% in the last three decades, attributed to the increase in risk factors such as obesity and the aging population. 1 Obesity is a medical condition characterized by excessive body fat accumulation that can have negative impacts on health. Body mass index (BMI) is a commonly used tool to assess obesity, which is defined as BMI ≥ 30. The World Health Organization (WHO) defines four classes of obesity: class I, BMI between 30 and 34.9; class II, BMI between 35 and 39.9; class III BMI ≥ 40; and class IV BMI ≥ 50. 2 Obesity is a growing worldwide concern, with rates increasing in both developed and developing countries. It is the most important risk factor for EC, where body fatness is deemed to have a “convincing causal relationship” with its development. 3 , 4
Obesity‐related ECs are usually represented by type I EC—considering the dualistic model of the Bokhman's classification 5 —while according to the molecular classification they mainly fall into the intermediate‐risk groups, including the mismatch repair deficiency and nonspecific molecular profile groups. 6 Obesity and hyperestrogenism related to adipose tissue promote a pro‐inflammatory state that pushes endometrial proliferation, with accumulation of somatic genetic alterations, predisposing to the malignant transformation. Moreover, obesity (especially the visceral phenotype) is frequently complicated by insulin‐resistance and type 2 diabetes, known as potential contributors to EC onset. 7 This makes obesity a significant risk factor for women's health, as it increases the likelihood of developing EC in addition to other types of cancer. EC development related to hyperstrogenism is a multistep process, starting from precancerous lesions (atypical hyperplasia) and progressing to invasive tumors. 8 Clinical studies have shown that weight reduction and improvement of insulin resistance as well as progesterone/progestin supplementation counteract hyperestrogenism and can reverse the carcinogenesis process. 9 , 10 , 11 , 12 , 13 This suggests that gaining weight may activate specific genes that lead to the development of metabolic syndrome, of which EC is a part. 14
Epigenetics has recently attracted the interest of researchers due to its involvement in many physiological and pathological processes, and its role in obesity, as well as in cancer, is becoming progressively clearer. 15 , 16 , 17
MicroRNAs (miRNAs) are small noncoding RNAs spanning between 18 and 25 nucleotides in length that can regulate specific target genes at the post‐transcriptional level by inhibiting their expression. 18 , 19 Consequently, deregulation of miRNAs can have an extensive impact on key cellular processes, which in turn could drive carcinogenesis or promote cancer progression. In recent years, many studies investigating miRNA levels in EC have been published, shedding light on this heterogenous disease. However, the data on miRNAs and obesity in EC are limited.
The aim of this study was to investigate the expression of miRNAs in relation to BMI in different groups of women, including EC patients who were and were not obese, and noncancer women who were obese. The study first evaluated the miRNA profile in the endometrial tissues of women who were obese to identify any potential association between miRNAs, EC, and obesity. The miRNA levels were then analyzed in EC patients only, stratifying them based on BMI. Finally, the findings were validated using The Cancer Genome Atlas—Uterine Corpus Endometrial Carcinoma (TCGA‐UCEC) dataset and the target genes were predicted and tested in the same cohort of EC patients to confirm our results. Overall, the study aimed to investigate the role of miRNA in EC in the context of obesity.
2. MATERIALS AND METHODS
2.1. Study population
The study was approved by the Institutional Review Board 189/2021/Oss/AOUBo, ClinicalTrials.gov Identifier NCT04845425, and was conducted in accordance with good clinical practice and the Helsinki declaration 2004.
We obtained endometrial tumor tissues from a study population consisting of consecutive obese patients (BMI ≥ 30) with early‐stage EC who underwent robotic surgery for staging purposes. Endometrial tissue controls were obtained from a population of consecutive non‐obese patients (BMI < 30) with early‐stage EC who underwent laparoscopy for staging purposes, and from endometrial biopsies (EBs) from a population of consecutive noncancer women with obesity during surgery for weight control (sleeve gastrectomy or Roux‐en‐Y gastric bypass).
To participate in the study, all the patients were required to be at least 18 years old and they expressed desire to participate by signing an informed consent form. Exclusion criteria included a previous history of oncological pathologies, radiotherapy, or chemotherapy.
For the two groups of EC patients (study population and control group), clinical, surgical, and pathological data were retrieved from the database of the Division of Gynecologic Oncology, Istituto di ricovero e cura a carattere scientifico (IRCCS) Azienda Ospedaliero‐Universitaria di Bologna, which was daily updated by the unit's data manager. Cancer was staged according to the International Federation of Gynecology and Obstetrics classification and graded according to WHO guidelines. 20 Endometrial surgical staging was performed according to the European Society of Gynecological Oncology guidelines. 21 Endometrial biopsies and clinical information for noncancer patients with obesity were obtained from the Division of Bariatric Surgery and the Division of Endocrinology and Diabetes Prevention and Care of the same hospital. The EB samples were analyzed by pathologists; all were proliferative functionally active or weakly active/inactive.
2.2. Tumor specimen collection
Formalin‐fixed, paraffin‐embedded (FFPE) primary tumors from 84 EC patients, of whom 55 had BMI < 30 (Ob−) and 29 had BMI ≥ 30 (Ob+), were included in the study. In addition, we analyzed nine noncancer patients with obesity.
FFPE specimens were retrieved from the archives of the Department of Pathology of the IRCCS Azienda Ospedaliero, Universitaria of Bologna between 2014 and 2023. Figure S1 summarizes the general workflow of the study.
2.3. Tissue processing
All FFPE specimens were conserved in the institution pathology archives and two expert pathologists examined tissue slides to confirm EC diagnosis and to ensure the inclusion of more than 70% of cancer cells. When this percentage was not achieved, tissue slides were macro‐dissected to eliminate contamination of nontumoral components and guarantee that at least 70% of the samples for the analysis were tumor cells, as indicated by the pathologist. RNA was isolated as previously described following the manufacturer's instructions. 22
2.4. miRNA analysis
miRNA expression was first evaluated in a discovery step comprising 40 ECs, then the results were validated in 84 ECs. Nine noncancer patients, all with BMI ≥ 30, were also analyzed to compare the miRNA profile.
2.4.1. Discovery step: miRNA expression profiling
Simultaneous expression profiles of 384 miRNAs were analyzed in 40 primary tumors, of which 15 patients had BMI ≥ 30 and 25 had BMI < 30, and in nine noncancer patients who were obese (EC−/Ob+).
Briefly, 1 ng of total RNA was reverse transcribed to cDNA using a TaqMan Advanced miRNA cDNA synthesis kit (ThermoScientific). The cDNA was then amplified using Universal miR‐Amp Primers and Master Mix to uniformly increase the amount of cDNA for each target, maintaining the relative differential expression levels. The cDNA was loaded into the TaqMan Low density array Advanced miRNA array pool A and run in a 7900HT Fast PCR system (Applied Biosystems).
2.4.2. Validation of the profiling results by qRT‐PCR
Validation was performed in 84 EC patients. Expression levels of miR‐2210 (assay ID # 477971_mir), miR‐449a (assay ID # 478561_mir), and miR‐199a‐5p (assay ID # 478231_mir) were evaluated by quantitative real‐time PCR (qRT‐PCR) through TaqMan Advanced miRNA assays (ThermoFisher Scientific). miR‐16‐5p (assay ID # 477860_mir) was used as internal reference 23 after literature review and assessment of its stability in our study cohort. The analysis was conducted in all 84 EC patients. miRNA expression was evaluated according to standard TaqMan Advanced miRNAs assay protocol and run in a 7900HT Fast PCR system (Applied Biosystems). Each sample was run in triplicate.
2.5. Statistical analysis
miRNA data were analyzed with SDS RQ Software version 2.4 and with the ThermoFisher Cloud app (ThermoFisher Scientific); miRNAs with C t values ≥35 were considered as not expressed and excluded from further analysis. The relative expression levels were quantified using the method using miR‐16‐5p as reference. Statistical significance was estimated using the nonparametric Mann–Whitney‐Wilcoxon test. A P value <0.05 was considered statistically significant.
2.6. Validation of the results in the TCGA cohort and target prediction
The molecular subtypes of UCEC 24 were retrieved through TCGAbiolinks, 25 while sample‐level log2 miRSeq, mRNASeq expression data, and clinical data were retrieved using the FireBrowseR R package (Data S1). 26 , 27 For each miRNA analyzed, the cohort of UCEC patients was divided into two groups based on the BMI value, as done for the Bologna's cohort.
For the miRNA target prediction analysis, a list of experimentally validated mRNA targets was downloaded from Targetscan Human 8.0 for the relevant miRNAs. Next, the expression levels data of the mRNA targets from the TCGA‐UCEC tumoral samples was used to compare the group of EC patients who were obese with those who were not. Toppgene was used to investigate the molecular function of predicted target genes. Statistical analysis was carried out using GraphPad Prism 8 and SPSS v20 software. P < 0.05 was considered statistically significant. Median expression of each miRNA was used as a threshold. Progression‐free survival and overall survival (OS) were graphed using Kaplan–Meier curves while the log‐rank test was used to test for significance.
3. RESULTS
A total of 84 specimens were analyzed, 55 with BMI < 30 (EC+/Ob−) and 29 with BMI ≥ 30 (EC+/Ob+); nine EC−/Ob+ cases were also included. The clinical characteristics of all groups of patients are presented in Tables S1 and S2. With regard to the patients who were obese, the two groups were similar in terms of BMI (36.3 and 38.2, respectively in EC and noncancer patients), hypertension, and type 2 diabetes. With regard to EC, the two sets of patients were statistically different for hypertension and type 2 diabetes; all the other clinical parameters were similar.
3.1. Discovery step: miRNA expression profiling
3.1.1. Comparison between obese EC and obese noncancer patients
The miRNA expression profile was first evaluated between the cohort of EC patients (n = 15) and noncancer patients (n = 9), all with BMI ≥ 30.
Figure 1 shows the principal component analysis (PCA) and the volcano plot. The results show a significant deregulation of 91 miRNAs (P < 0.05), of which 62 maintained statistical significance after adjustment for multiple comparisons (P‐adj < 0.05). Of these 62 miRNAs, 51 were upregulated and 11 were downregulated in EC compared with noncancer tissue samples. Figure 1C shows the unsupervised heatmap.
FIGURE 1.

Global microRNA (miRNA) expression analysis. (A) Global views of miRNA expression using principal component analysis of the 24 samples analyzed via the TaqMan Low density array. Each triangle or circle represents the collective expression of all miRNAs in each sample. Each color is indicative of a different group (EC−/Ob+, samples from noncancer patients who were obese; EC+/Ob+, samples from endometrial cancer (EC) patients who were obese). (B) Volcano plot showing the relationship between fold change and statistical significance. Green and red dots represent differentially expressed mRNAs with statistical significance. (C) Heatmap showing differential miRNA expression in the EC group (EC+/Ob+) versus the control group (EC−/Ob+). Each row represents an miRNA and each column represents a sample.
Table S3 summarizes the significantly deregulated miRNAs.
3.1.2. Comparison between EC patients with and without obesity
We analyzed miRNA expression profiles within the EC group (n = 40) comparing the patients with BMI ≥30 (n = 15) and BMI < 30 (n = 25). The PCA showed that the two groups partially overlapped, indicating a high similarity between their miRNA profiles (Figure 2A).
FIGURE 2.

Global microRNA (miRNA) expression analysis. (A) Principal component analysis of 40 samples analyzed via the TaqMan Low density array. Each triangle represents the collective expression of all miRNAs in one sample. Each color is indicative of a different group (EC+/Ob−, endometrial cancer [EC] samples with BMI < 30; EC+/Ob+, EC samples with BMI ≥ 30). (B) Heatmap showing differential miRNA expression in EC patients who were (EC+/Ob+) or were not (EC+/Ob−) obese. Blue indicates lower expression and red represents higher expression. Each row represents an miRNA and each column represents a sample. (C) Expression levels of the four topmost significant miRNAs in EC patients stratified by BMI.
The results highlighted a significant upregulation of 20 miRNAs in obese EC patients compared with non‐obese patients, with P < 0.05. However, considering the Ampscore >1 (Ampscore is a value released by the ThermoFisher Cloud app which evaluates the goodness of the qRT‐PCR amplification) in at least 20 samples out of 40, only 11 miRNAs were considered. Neither of the miRNAs identified had P‐adj < 0.05, so we based our analysis on the P value (Table 1). Figure 2B shows the expression of the 11 miRNAs and Figure 2C summarizes in detail the expression of the four topmost significant miRNAs. The miRNet tool was used to perform pathway‐enriched analysis and the results are shown in Table S4.
TABLE 1.
Differentially expressed microRNA (miRNA) endometrial cancer (EC) patients who were and were not obese (Ob+ or Ob‐).
| miRNA ID | P value | Fold change (EC+/Ob+ vs. EC+/Ob−) |
|---|---|---|
| hsa‐miR‐2110 | 0.0022 | 1.2 |
| hsa‐miR‐449a | 0.0045 | 4.5 |
| hsa‐miR‐449b‐5p | 0.009 | 3.0 |
| hsa‐miR‐199a‐5p | 0.016 | 2.2 |
| hsa‐miR‐455‐5p | 0.025 | 0.9 |
| hsa‐miR‐548d‐5p | 0.026 | 0.9 |
| hsa‐miR‐885‐5p | 0.031 | 2.1 |
| hsa‐miR‐425‐5p | 0.033 | 0.8 |
| hsa‐miR‐155‐5p | 0.041 | 0.9 |
| hsa‐miR‐451a | 0.043 | 1.3 |
| hsa‐miR‐448 | 0.045 | 1.0 |
3.2. Validation of the profiling results by qRT‐PCR
Three of the top deregulated miRNAs (miR‐199a‐5p, miR‐449a, and miR‐2110) in EC were validated in a larger cohort of 84 EC patients. We did not validate miR‐449b because, as previously reported, we assumed that miR‐449b expression followed the level of miR449a since the two miRNAs form a cluster and are transcribed simultaneously. 28 The results are shown in Figure S2. In the validation cohort, only miR‐449a maintained statistical significance (P = 0.012) while miR‐2110 and miR‐199a‐5p did not.
3.3. Validation of the results in the TCGA EC cohort
To corroborate our results, we investigated the four topmost deregulated miRNAs in a larger, independent cohort of ECs. To do this, we analyzed miRNA levels in the TCGA cohort of EC patients, including 384 patients, 235 of whom had BMI ≥30 and 149 had BMI < 30. Of the four miRNAs selected for validation from the Bologna cohort profiling, three miRNAs (miR‐199a‐5p, miR‐449a, and miR‐449b‐5p) resulted differentially expressed between the two groups. In particular, in agreement with our results, all the miRNAs showed a higher expression in EC patients who were obese (miR‐199a‐5p, P = 0.018; miR‐449a, P = 0.004; miR‐449b‐5p, P = 0.0008); the difference in miR‐2110 expression between the two groups was marginally significant (P = 0.059). Moreover, we also subgrouped the normal‐weight patients (BMI < 25, n = 83), non‐obese patients (BMI < 30, n = 67), and overweight patients (30 > BMI ≥ 25, n = 234), and observed a statistically significant increase in the miRNA expression across the three groups. These results are shown in Figure 3.
FIGURE 3.
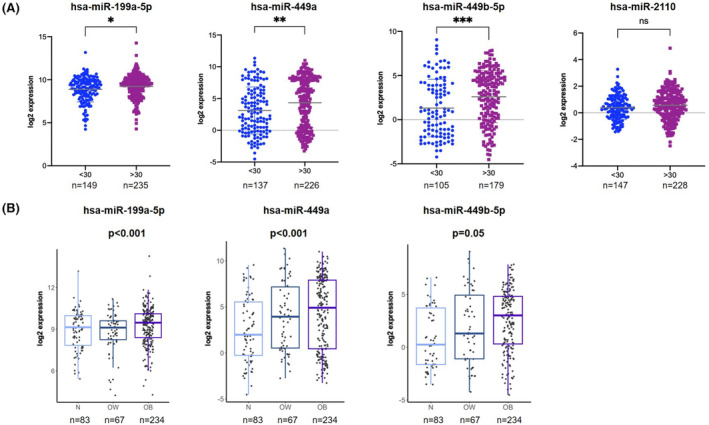
(A) Analysis of miR‐199a‐5p, miR‐449a, miR‐449b‐5p, and miR‐2110 in TCGA endometrial cancer cohort stratified based on BMI ≥ or <30. miRNA levels are expressed as log2 expression: *P < 0.05, **P < 0.01, ***P < 0.001. (B) Expression levels of miR‐199a, miR‐449a, and miR‐449b‐5p in the TCGA cohort, stratifying the patients as normal weight (N; BMI < 25, n = 83), overweight (OW; 30 > BMI ≥ 25, n = 67), and obese (OB; BMI ≥ 30, n = 234). miRNA levels are expressed as log2 expression.
Interestingly, when we stratified the TCGA cohort based on the molecular classification, miR‐449b‐5p maintained the statistical significance within the patients classified as low copy number. Indeed, it is known that obesity is a prominent feature of EC patients with intermediate prognosis. Given this finding, we focused our attention on patients classified as low copy number; within this group miR‐449b‐5p was more expressed in obese EC patients compared with the non‐obese ones (P = 0.02) while miR‐199a levels were only slightly higher in obese patients (Figure S3).
3.4. Prediction and analysis of miR‐449a and 449b gene targets in the TCGA EC cohort
We analyzed the potential targets of miR‐449a and miR‐449b‐5p, which showed the highest statistical significance, and of miR‐199a‐5p. Targetscan Human 8.0 was used to retrieve the experimentally validated targets: 247 genes, of which 65 mRNA targets for miR‐449a and 182 for miR‐449b and 478 genes for miR‐199a‐5p were returned. We searched for the expression levels of all the targets in 514 EC patients who were or were not obese (n = 305 with BMI ≥ 30 and n = 209 with BMI < 30), identifying 24 and 61 genes, respectively for miR‐449a/449b and miR‐199a‐5p, significantly deregulated between the two subgroups (Table S5). We then considered the inverse correlation in terms of expression of miRNAs and mRNAs (i.e., highly expressed miRNAs led to downregulation of their targets and vice versa). Considering that the three miRNAs showed higher levels in EC patients who were obese, we identified a total of 60 genes with lower expression in this group of patients, of which 14 were potentially regulated by miR‐449a/449b and 46 by miR‐199a‐5p (Figures S4 and 4). ToppGene and EnrichR were used for functional enrichment analysis with Benjamini and Hochberg false discovery rate (FDR) <0.05. Table 2 shows the gene ontology (GO) related to the 499a/499b targets. Of note, the majority of the highlighted molecular functions play a role in modulating obesity. With regard to miR‐199a‐5p, no statistically significant FDR‐corrected GOs were identified. Figure 4 shows the potential miRNA‐mRNA networks in obese EC patients.
FIGURE 4.

Potential miRNA–mRNA networks. miR‐449a and miR‐449b‐5p, belonging to the same miRNA family, were upregulated in EC+/Ob+ patients while their mRNA targets were downregulated. Each arrow indicates an upregulated target gene, while the dashed line represents a protein–protein association according to the String database.
TABLE 2.
Gene ontology of the miR‐499a/499b targets with lower expression in endometrial cancer patients who were and who were not obese.
| Category | ID | Name | P value | q value FDR B&H |
|---|---|---|---|---|
| GO:MF | GO:0005516 | Calmodulin binding | 0.0005 | 0.031 |
| GO:MF | GO:0070856 | Myosin VI light chain binding | 0.0007 | 0.031 |
| GO:MF | GO:0086038 | Calcium: sodium antiporter activity involved in regulation of cardiac muscle cell membrane potential | 0.0014 | 0.031 |
| GO:MF | GO:0099580 | Ion antiporter activity involved in regulation of postsynaptic membrane potential | 0.0014 | 0.031 |
| GO:MF | GO:0055100 | Adiponectin binding | 0.0021 | 0.031 |
| GO:MF | GO:0008453 | Alanine‐glyoxylate transaminase activity | 0.0021 | 0.031 |
| GO:MF | GO:0070853 | Myosin VI binding | 0.0021 | 0.031 |
| GO:MF | GO:1905060 | Calcium: cation antiporter activity involved in regulation of postsynaptic cytosolic calcium ion concentration | 0.0021 | 0.031 |
| GO:MF | GO:0097003 | Adipokinetic hormone receptor activity | 0.0028 | 0.031 |
| GO:MF | GO:0008454 | Alpha‐1,3‐mannosylglycoprotein 4‐beta‐N‐acetylglucosaminyltransferase activity | 0.0028 | 0.031 |
| GO:MF | GO:0008597 | Calcium‐dependent protein serine/threonine phosphatase regulator activity | 0.0035 | 0.031 |
| GO:MF | GO:0008294 | Calcium‐ and calmodulin‐responsive adenylate cyclase activity | 0.0035 | 0.031 |
| GO:MF | GO:0004614 | Phosphoglucomutase activity | 0.0035 | 0.031 |
| GO:MF | GO:0032027 | Myosin light chain binding | 0.0055 | 0.047 |
| GO:CC | GO:0042383 | Sarcolemma | 0.0002 | 0.028 |
Abbreviations: CC, cellular component; FDR B&H, False discovery rate Benjamini and Hochberg; GO, gene ontology; MF, molecular function.
3.5. Association of the identified miRNAs with prognostic factors in the TCGA EC cohort
We tested any potential association between EC prognostic factors and the identified miRNAs (miR‐199a‐5p, miR‐449a, and miR‐449b‐5p).
All the miRNAs were significantly associated with grade and histological type, showing that higher miRNA levels were detectable in low‐grade tumors (miR‐199a, P = 0.032; miR‐499a, P = 3.9 × 10⁻⁶; miR‐499b‐5p, P = 0.0009) and in endometrioid endometrial adenocarcinoma tumors (miR‐199a, P = 0.016; miR‐499a, P = 2.5 × 10⁻⁸; miR‐499b‐5p, P = 4.2 × 10⁻⁶) (Figure S5); with regard to lymph nodes status, tumors with no positive lymph nodes displayed higher levels of miR‐499b‐5p (P = 0.049; Figure S5C). With regard to clinical outcomes, we evaluated recurrence probability and OS. MiR‐499a was significantly correlated with OS, highlighting that patients with high expression had longer survival. No other associations were observed (Figure S5D).
4. DISCUSSION
To the best of our knowledge, this is the first study to evaluate the correlation between miRNA expression in EC and body fatness through miRNA profiling, showing that specific miRNAs may have potential implications for the clinical management of obese EC patients.
In the last decade, several miRNAs have been described as potential biomarkers of EC prognosis or diagnosis 29 , 30 and the literature is constantly showing the key role of miRNAs in the development and progression of obesity‐related tumors. Obesity is considered the strongest risk factor for EC, but there is limited public awareness of this relationship. Several papers have provided compelling evidence for a causal relationship between obesity and endometrial neoplasia, 31 but without clear explanation of the exact biological mechanisms.
In this context, our study aimed to shed light on this complex relationship. In the attempt to identify miRNAs potentially associated with body fatness, we first assessed the miRNA levels in endometrium samples of obese women with and without EC. As expected, this comparison clearly showed distinct miRNA profiles with 62 differential expressed miRNAs, of which 51 miRNAs were upregulated and 11 were downregulated in EC versus noncancer patients. The high difference was also highlighted by principal component analysis which identified two clusters of samples. This is not surprising, considering that it is well known that cancer tissue is characterized by deep changes at the molecular level, including miRNA deregulation.
Subsequently, we focused on the analysis of EC patients only, stratifying them in with and without obesity. We evaluated the global miRNA levels in 40 EC patients considering the influence that BMI has on this specific tumor type. The results indicated a significant upregulation of 11 miRNAs in obese versus nonobese patients. In the validation phase, miR‐199a‐5p, miR‐449a, and miR‐2110 were further analyzed in an extended cohort of 84 EC samples. Among these, miR‐449a maintained statistical significance between the two groups; we suppose that miR‐449b‐5p maintains statistical significance as well, since, as literature shows, it forms a cluster with miR‐449a, and their expression levels are usually similar. 28 To further confirm our results, we tested them within the TCGA‐UCEC cohort, which represents an independent and larger group of cases. This independent validation of 384 cases showed that miR‐199a‐5p, miR‐449a, and miR‐449b‐5p had significantly higher levels in EC patients (BMI > 30), confirming the results observed in our cohort. Moreover, the three miRNAs were associated with important prognostic factors, such as grade and histological type, showing that higher miRNA levels are typically detected in low‐grade tumors (G1/G2) and in endometrioid endometrial adenocarcinomas. This is in agreement with the evidence that ECs associated with obesity are usually tumors with low grade and endometrioid endometrial adenocarcinoma. 32 These miRNAs have not been previously reported in obesity‐related EC, but they have been described in previous works focused on other cancer types. 33 , 34 , 35 miR‐199a has been already associated with obesity, showing that it is highly expressed in preadipocytes, 33 and other studies have demonstrated that it is involved in the regulation of adipogenesis, 34 , 35 suggesting an important regulatory role in obesity. Our results are in line with this evidence, as increased levels of miR‐199a‐5p were detected in EC patients with obesity in the TCGA dataset. In the cohort from our institution, we were not able to observe a statistically significant difference, but this could be due to the limited sample size. With regard to miR‐449a and miR‐449b‐5p, these miRNAs belong to the miR‐34/449 family, which includes six homologous miRNAs (miR‐34a, miR‐34b, miR‐34c, miR‐449a, miR449b, and miR‐449c); the miR‐449 cluster is located in the second intron of the Cdc20b gene, while the miR‐34 cluster is located on a different chromosome. Members of the miR‐34/449 family have been already associated with obesity. 36 , 37 , 38 , 39 Overexpression of miR‐34a and miR‐34c has been described in obese patients and mice, and as key players in modulating adiposity, adipocyte differentiation, and metabolism. To the best of our knowledge, this is the first work to recognize the involvement of the miR‐449 cluster in obesity‐related EC. Finally, we predicted the potential target genes of these miRNAs, investigating their expression in the TCGA cohort. This further analysis showed potential regulatory networks (i.e., miRNA‐mRNA) of 14 genes. Functional enrichment analysis predicted several GO molecular functions involved in obesity. For instance, calmodulin and calcium are involved in obesity, 40 , 41 insulin resistance, adipocytes differentiation, and metabolism 42 , 43 ; adiponectin, another predicted GO molecular functions, is a hormone and an adipokine protein that affects several metabolic functions, including insulin‐sensitizing and anti‐inflammatory effects. 44 All these data together highlight a potential link between these miRNAs and obesity, particularly in the case of miR‐449a/449b targets, emphasizing the relationship between EC‐body fatness. Indeed, it is reasonable to think that some of the predicted genes are under the regulation of one—or a few—of the above‐mentioned miRNAs, which through pairing with seed sequence can modulate their expression. The exact mechanism and definitive conclusions could be drawn only through functional studies in cell models, which, however, can poorly mimic the physiological environment and complexity of obesity landscape. Our work has several strengths: (1) the sample size of the Italian cohort was numerically significant considering the incidence of this tumor; (2) to further corroborate the results we enlarged the study cohort by including EC patients from the TCGA cohort; (3) the miRNA analysis in the TCGA cohort were carried out through the Illumina platform, whereas we used an RT‐PCR‐based array and assays, thus two different techniques validated the findings; and (4) all the patients from the Italian cohort were homogeneously treated according to European Society of Medical Oncology risk classifications. However, we also recognize some limits, including the retrospective design of the study. This aspect, in particular, was indispensable to achieve the present results and we aim to prospectively validate them in larger and independent cohorts and, very importantly, on blood samples to assess the validity of the circulating miRNAs as liquid biomarkers. In the near future, we aim to carry out a meticulous validation of our results on blood samples to strengthen the reliability and applicability of our results through a noninvasive approach.
Since gain of weight is a recognized risk factor for EC and considering the complex landscape of pathways involved in obesity‐associated EC, several reasonable interventions for the prevention of EC can be considered, including potential lifestyle interventions and surgical procedures that decrease visceral adiposity, or pharmacological approaches aiming to break or reverse the hormonal and metabolic dysregulation related to obesity. 31 In particular, effective nonsurgical treatments for EC, especially among younger women, are highly desired from a clinical point of view. 45 It is reasonable to hypothesize that certain deregulated genes associated with obesity‐related pathways could trigger activation of specific oncogenes or inhibition of tumor suppressor genes, which, in turn, will promote tumor growth. In this context, reverting levels of these miRNAs to physiological patterns may represent a complimentary strategy to couple to administration of anti‐estrogenic, antidiabetic, and weight‐loss drugs to regress the tumor. The synergistic action of these approaches could protect women with obesity by greatly reducing the risk of such tumors.
In conclusion, dysregulation of miR‐449a and miR‐449b‐5p affects important genes involved in obesity‐related pathways and regulation of adipogenesis. These miRNAs may represent potential new targets to reduce the risk of developing EC. Indeed, understanding of which genes are modulated by those miRNAs in EC patients with obesity could be an important weapon in fighting EC development. Our study contributes to the growing body of knowledge at the intersection of miRNA regulation, EC, and obesity. By shedding light on specific miRNA signatures and their implications, we hope we are paving the way for future research avenues that could improve diagnostics, prognosis, and therapeutic strategies tailored to EC patients, particularly those with obesity.
AUTHOR CONTRIBUTIONS
Gloria Ravegnini: Conceptualization; data curation; formal analysis; investigation; visualization; writing—original draft. Francesca Gorini: Data curation; formal analysis; Camelia Coada: Data curation; formal analysis; writing—review and editing. Antonio De Leo: Data curation. Dario de Biase: Data curation. Stella di Costanzo: Data curation. Eugenia De Crescenzo: Data curation. Emma Coschina: Data curation. Sarah Monesmith: Data curation. Paolo Bernante: Data curation. Silvia Garelli: Data curation. Francesca Balsamo: Data curation. Patrizia Hrelia: Supervision. Pierandrea Deiaco: Supervision; funding acquisition. Sabrina Angelini: Methodology; supervision; validation; writing—review and editing. Anna Myriam Perrone: Conceptualization; funding acquisition; methodology; writing—review and editing. The work reported in the article has been performed by the authors, unless clearly specified in the text. All authors read and approved the final article.
FUNDING INFORMATION
The work reported in this publication was funded by the Italian Ministry of Health, RC22000684; ALMA IDEA22 line A D.M. 737/2021 from the European Union “NextGenerationEU” CUP J45F21002000001 to AMP.
CONFLICT OF INTEREST STATEMENT
The authors declare no conflict of interest.
ETHICS STATEMENT
Approval of the research protocol by an Institutional Reviewer Board: NCT04845425, 189/2021/Oss/AOUBo.
Informed Consent: Yes.
Registry and the Registration No. of the study/trial: Yes, ClinicalTrials.gov Identifier NCT04845425.
Animal Studies: N/A.
Supporting information
DATA S1
ACKNOWLEDGMENTS
We would like to thank Stefano Friso for the collection of clinical data.
Ravegnini G, Gorini F, Coada CA, et al. miRNA levels are associated with body mass index in endometrial cancer and may have implications for therapy. Cancer Sci. 2024;115:883‐893. doi: 10.1111/cas.15977
Sabrina Angelini and Anna Myriam Perrone contributed equally to this work.
Contributor Information
Gloria Ravegnini, Email: gloria.ravegnini2@unibo.it.
Patrizia Hrelia, Email: patrizia.hrelia@unibo.it.
DATA AVAILABILITY STATEMENT
Raw data are available upon request to the corresponding author.
REFERENCES
- 1. Crosbie EJ, Kitson SJ, McAlpine JN, Mukhopadhyay A, Powell ME, Singh N. Endometrial cancer. Lancet. 2022;399(10333):1412‐1428. [DOI] [PubMed] [Google Scholar]
- 2. James PT. Obesity: the worldwide epidemic. Clin Dermatol. 2004;22(4):276‐280. [DOI] [PubMed] [Google Scholar]
- 3. Raglan O, Kalliala I, Markozannes G, et al. Risk factors for endometrial cancer: an umbrella review of the literature. Int J Cancer. 2019;145(7):1719‐1730. [DOI] [PubMed] [Google Scholar]
- 4. Gong TT, Wu QJ, Wang YL, Ma XX. Circulating adiponectin, leptin and adiponectin–leptin ratio and endometrial cancer risk: evidence from a meta‐analysis of epidemiologic studies. Int J Cancer. 2015;137(8):1967‐1978. [DOI] [PubMed] [Google Scholar]
- 5. Bokhman JV. Two pathogenetic types of endometrial carcinoma. Gynecol Oncol. 1983;15(1):10‐17. [DOI] [PubMed] [Google Scholar]
- 6. Talhouk A, McAlpine JN. New classification of endometrial cancers: the development and potential applications of genomic‐based classification in research and clinical care. Gynecol Oncol Res Pract. 2016;3(1):1‐12. [DOI] [PMC free article] [PubMed] [Google Scholar]
- 7. Wang Y, Zeng X, Tan J, Xu Y, Yi C. Diabetes mellitus and endometrial carcinoma: risk factors and etiological links. Medicine. 2022;101(34):E30299. [DOI] [PMC free article] [PubMed] [Google Scholar]
- 8. Wise MR, Jordan V, Lagas A, et al. Obesity and endometrial hyperplasia and cancer in premenopausal women: a systematic review. Am J Obstet Gynecol. 2016;214(6):689.e1‐689.e17. [DOI] [PubMed] [Google Scholar]
- 9. Renehan AG. Bariatric surgery, weight reduction, and cancer prevention. Lancet Oncol. 2009;10(7):640‐641. [DOI] [PubMed] [Google Scholar]
- 10. Luo J, Chlebowski RT, Hendryx M, et al. Intentional weight loss and endometrial cancer risk. J Clin Oncol. 2017;35(11):1189‐1193. [DOI] [PMC free article] [PubMed] [Google Scholar]
- 11. Gallos ID, Ganesan R, Gupta JK. Prediction of regression and relapse of endometrial hyperplasia with conservative therapy. Obstet Gynecol. 2013;121(6):1165‐1171. [DOI] [PubMed] [Google Scholar]
- 12. Shaw E, Farris M, McNeil J, Friedenreich C. Obesity and endometrial cancer. Recent Results Cancer Res. 2016;208:107‐136. [DOI] [PubMed] [Google Scholar]
- 13. Papatla K, Huang M, Slomovitz B. The obese endometrial cancer patient: how do we effectively improve morbidity and mortality in this patient population? Ann Oncol. 2016;27(11):1988‐1994. [DOI] [PubMed] [Google Scholar]
- 14. Zhan Y, Wang J, Ma Y, et al. Serum insulin‐like, growth factor binding protein‐related protein 1 (IGFBP‐rP1) and endometrial cancer risk in Chinese women. Int J Cancer. 2013;132(2):411‐416. [DOI] [PubMed] [Google Scholar]
- 15. McGregor RA, Choi MS. microRNAs in the regulation of adipogenesis and obesity. Curr Mol Med. 2011;11(4):304‐316. [DOI] [PMC free article] [PubMed] [Google Scholar]
- 16. Arner P, Kulyté A. MicroRNA regulatory networks in human adipose tissue and obesity. Nat Rev Endocrinal. 2015;11:276‐288. [DOI] [PubMed] [Google Scholar]
- 17. Mori MA, Thomou T, Boucher J, et al. Altered miRNA processing disrupts brown/white adipocyte determination and associates with lipodystrophy. J Clin Invest. 2014;124(8):3339‐3351. [DOI] [PMC free article] [PubMed] [Google Scholar]
- 18. Di Leva G, Garofalo M, Croce CM. MicroRNAs in cancer. Annu Rev Pathol Mech Dis. 2014;9(1):287‐314. [DOI] [PMC free article] [PubMed] [Google Scholar]
- 19. Peng Y, Croce CM. The role of MicroRNAs in human cancer. Signal Transduct Target Ther. 2016;1(1):15004. [DOI] [PMC free article] [PubMed] [Google Scholar]
- 20. Benedet JL, Bender H, Jones H, Ngan HY, Pecorelli S. FIGO staging classifications and clinical practice guidelines in the management of gynecologic cancers. FIGO committee on gynecologic oncology. Int J Gynaecol Obstet. 2000;70(2):209‐262. [PubMed] [Google Scholar]
- 21. Concin N, Planchamp F, Abu‐Rustum NR, et al. European Society of Gynaecological Oncology quality indicators for the surgical treatment of endometrial carcinoma. Int J Gynecol Cancer. 2021;31(12):1508‐1529. [DOI] [PubMed] [Google Scholar]
- 22. Ravegnini G, De Leo A, Coada C, et al. Identification of miR‐499a‐5p as a potential novel biomarker for risk stratification in endometrial cancer. Front Oncol. 2021;11:757678. [DOI] [PMC free article] [PubMed] [Google Scholar]
- 23. Schwarzenbach H, Da Silva AM, Calin G, Pantel K. Data normalization strategies for MicroRNA quantification. Clin Chem. 2015;61(11):1333‐1342. [DOI] [PMC free article] [PubMed] [Google Scholar]
- 24. Getz G, Gabriel SB, Cibulskis K, et al. Integrated genomic characterization of endometrial carcinoma. Nature. 2013;497(7447):67‐73. [DOI] [PMC free article] [PubMed] [Google Scholar]
- 25. Colaprico A, Silva TC, Olsen C, et al. TCGAbiolinks: an R/Bioconductor package for integrative analysis of TCGA data. Nucleic Acids Res. 2016;44(8):e71. [DOI] [PMC free article] [PubMed] [Google Scholar]
- 26. Giorgi FM, Ceraolo C, Mercatelli D. The R language: an engine for bioinformatics and data science. Life (Basel). 2022;12(5):648. [DOI] [PMC free article] [PubMed] [Google Scholar]
- 27. Deng M, Brägelmann J, Kryukov I, Saraiva‐Agostinho N, Perner S. FirebrowseR: an R client to the Broad Institute's firehose pipeline. Database (Oxford). 2017;2017:baw160. [DOI] [PMC free article] [PubMed] [Google Scholar]
- 28. Bao J, Li D, Wang L, et al. MicroRNA‐449 and MicroRNA‐34b/c function redundantly in murine testes by targeting E2F transcription factor‐retinoblastoma protein (E2F‐pRb) pathway. J Biol Chem. 2012;287(26):21686‐21698. [DOI] [PMC free article] [PubMed] [Google Scholar]
- 29. Ravegnini G, Gorini F, De Crescenzo E, et al. Can miRNAs be useful biomarkers in improving prognostic stratification in endometrial cancer patients? An Update Review. Int J Cancer. 2022;150(7):1077‐1090. [DOI] [PMC free article] [PubMed] [Google Scholar]
- 30. Delangle R, De Foucher T, Larsen AK, et al. The use of microRNAs in the management of endometrial cancer: a meta‐analysis. Cancers (Basel). 2019;11(6):832. [DOI] [PMC free article] [PubMed] [Google Scholar]
- 31. Onstad MA, Schmandt RE, Lu KH. Addressing the role of obesity in endometrial cancer risk. Prev Treat. 2016;34(35):4225‐4230. [DOI] [PMC free article] [PubMed] [Google Scholar]
- 32. Anderson B, Connor JP, Andrews JI, et al. Obesity and prognosis in endometrial cancer. Am J Obstet Gynecol. 1996;174(4):1171‐1179. [DOI] [PubMed] [Google Scholar]
- 33. Kajimoto K, Naraba H, Iwai N. MicroRNA and 3T3‐L1 pre‐adipocyte differentiation. RNA. 2006;12(9):1626‐1632. [DOI] [PMC free article] [PubMed] [Google Scholar]
- 34. Gu N, You L, Shi C, et al. Expression of miR‐199a‐3p in human adipocytes is regulated by free fatty acids and adipokines. Mol Med Rep. 2016;14(2):1180‐1186. [DOI] [PMC free article] [PubMed] [Google Scholar]
- 35. Song J, Gao L, Yang G, et al. MiR‐199a regulates cell proliferation and survival by targeting FZD7. PLoS One. 2014;9(10):e110074. [DOI] [PMC free article] [PubMed] [Google Scholar]
- 36. Ahmadpour F, Nourbakhsh M, Razzaghy‐Azar M, et al. The association of plasma levels of miR‐34a and miR‐149 with obesity and insulin resistance in obese children and adolescents. Acta Endocrinol (Buchar). 2018;14(2):149‐154. [DOI] [PMC free article] [PubMed] [Google Scholar]
- 37. Fu T, Seok S, Choi S, et al. MicroRNA 34a inhibits beige and brown fat formation in obesity in part by suppressing adipocyte fibroblast growth factor 21 signaling and SIRT1 function. Mol Cell Biol. 2014;34(22):4130‐4142. [DOI] [PMC free article] [PubMed] [Google Scholar]
- 38. Fu T, Choi S‐E, Kim D‐H, et al. Aberrantly elevated microRNA‐34a in obesity attenuates hepatic responses to FGF19 by targeting a membrane coreceptor β‐Klotho. Proc Natl Acad Sci USA. 2012;109(40):16137‐16142. [DOI] [PMC free article] [PubMed] [Google Scholar]
- 39. Jones PH, Deng B, Winkler J, et al. Over‐expression of miR‐34c leads to early‐life visceral fat accumulation and insulin resistance. Sci Report. 2019;9(1):13844. [DOI] [PMC free article] [PubMed] [Google Scholar]
- 40. Ozcan L, Cristina De Souza J, Harari AA, Backs J, Olson EN, Tabas I. Activation of calcium/calmodulin‐dependent protein kinase II in obesity mediates suppression of hepatic insulin signaling. Cell Metab. 2013;18(6):803‐815. [DOI] [PMC free article] [PubMed] [Google Scholar]
- 41. Hardie DG. AMPK: a key regulator of energy balance in the single cell and the whole organism. Int J Obes. 2008;32(Suppl 4):S7‐S12. [DOI] [PubMed] [Google Scholar]
- 42. Song Z, Wang Y, Zhang F, Yao F, Sun C. Calcium signaling pathways: key pathways in the regulation of obesity. Int J Mol Sci. 2019;20(11):2768. [DOI] [PMC free article] [PubMed] [Google Scholar]
- 43. Pagano C, di Zazzo E, Avilia G, et al. Advances in “adiponcosis”: insights in the inner mechanisms at the base of adipose and tumour tissues interplay. Int J Cancer. 2023;152(12):2464‐2473. [DOI] [PubMed] [Google Scholar]
- 44. Wang ZV, Scherer PE. Adiponectin, the past two decades. J Mol Cell Biol. 2016;8(2):93‐100. [DOI] [PMC free article] [PubMed] [Google Scholar]
- 45. Barr CE, Ryan NAJ, Derbyshire AE, et al. Weight loss during intrauterine progestin treatment for obesity‐associated atypical hyperplasia and early‐stage cancer of the endometrium. Cancer Prev Res (Phila). 2021;14(11):1041‐1050. [DOI] [PMC free article] [PubMed] [Google Scholar]
Associated Data
This section collects any data citations, data availability statements, or supplementary materials included in this article.
Supplementary Materials
DATA S1
Data Availability Statement
Raw data are available upon request to the corresponding author.