

Abstract
Context
MicroRNAs (miRNAs) are short noncoding RNAs involved in posttranscriptional regulation of gene expression that influence various cellular functions including glucose and lipid metabolism and adipocyte differentiation.
Objective
The aim of this study was to evaluate the levels of miR-34a and miR-149 and their relationship with metabolic parameters in obese children and adolescents.
Design
Seventy children and adolescents were enrolled in the study. Plasma levels of microRNAs were evaluated by real-time PCR using SYBR green and analyzed by ΔCt method. Plasma concentrations of visfatin and insulin were measured by ELISA method. Glucose and lipid profile were determined colorimetrically. HOMA-IR was calculated and used as an index of insulin resistance (IR).
Results
miR-34a was significantly lower in subjects with insulin resistance compared to obese children with normal insulin sensitivity. There was an inverse relationship between miR-34a levels and both insulin and HOMA-IR. On the other hand, miR-149 was significantly correlated with visfatin. There was no significant difference in miR-34a and miR-149 between obese and normal weight subjects.
Conclusions
miR-34a is associated with insulin and HOMA-IR and thus seems to be involved in IR. miR-149 is inversely associated with visfatin levels which could be indicative of anti-inflammatory effect of this miRNA.
Keywords: obesity, miR-34a, miR-149, insulin resistance
INTRODUCTION
The World Health Organization (WHO) has reported obesity as the global pandemic of the 21st century (1). Childhood obesity participates in metabolic abnormalities which lead to disorders such as insulin resistance, type 2 diabetes, metabolic syndrome (MetS) and cardiovascular disease (2). Obesity is accompanied by increased adipose tissue mass. Adipose tissue is not only a storage tissue for lipids but also it functions as an endocrine organ and releases various adipokines such as visfatin that influence other tissues and cause changes in gene expression patterns and metabolic homeostasis throughout the body (3). Visfatin, also known as pre-B-cell colony-enhancing factor (PBEF) or nicotinamide phosphoribosyl transferase (NAMPT), has been shown to be implicated in obesity and its long-term consequences including insulin resistance. Altered visfatin levels have been reported in obesity, diabetes mellitus, cardiovascular disorders, kidney diseases and bone disorders and different types of cancers (4, 5).
MicroRNAs (miRNAs) are endogenous ~23-nt RNA molecules that regulate gene expression by pairing to the 3’- untranslated region (UTR) of target mRNAs of protein-coding genes to direct their post transcriptional suppression (6). MicroRNAs play key roles in controlling metabolic homeostasis and regulation of insulin signaling and therefore are involved in inflammation, dyslipidemia and insulin resistance. Hundreds of miRNAs are actively or passively released into the circulation and can be used to assess health condition and disease development (7). The expression of miRNAs is influenced by obesity and may be effective in promoting obesity-associated metabolic abnormalities such as insulin resistance and type 2 diabetes.
MicroRNA-34a (miR-34a) is a part of the p53 tumor suppressor network (8). The mature miR-34a is one of the major miRNAs involved in insulin production, pancreatic development and glucose homeostasis (9). A number of studies have shown that elevated miR-34a decreases NAD+ levels by directly targeting nicotinamide phosphoribosyltransferase (NAMPT) (4, 5). NAMPT, which is secreted from adipose tissue as an adipokine called visfatin, has been shown to be elevated in obesity (10). MiR-34a levels are highly elevated in the fatty livers of both diet-induced obese mice and the leptin-deficient ob/ob mice (11, 12). Circulating levels of miR-34a correlate with hepatic disease severity in patients with chronic hepatitis C infection (CHC) or non-alcoholic fatty-liver disease (NAFLD) and diabetes mellitus (13, 14).
The aim of this study was to investigate the association of plasma levels of miR-34a and miR-149 with obesity and its associated parameters in children and adolescents.
MATERIALS AND METHODS
Subjects
Seventy children between the ages of 8-16 years old (35 obese and 35 normal subjects) were enrolled in this cross-sectional study. After a routine medical history acquisition and health examination, the subsequent factors were assessed: waist circumference (WC), hip circumference (HC), waist to hip ratio (WHR), weight, height, systolic (SBP) and diastolic (DBP) blood pressure. Body mass index (BMI) was calculated using the formula weight [kg]/ (height)2 [m2] and BMI z-score and percentiles were determined according to sex and age of each subject. WC-SD (standard deviation), SBP-SD and DBP-SD values were calculated by the Anthropometric Calculator for normal children 0-20 years of age developed by the Canadian Pediatric Endocrine Group based on NHLBI 2004 guidelines (15) and US Centers for Disease Control and Prevention (CDC) 2000 growth charts, according to the age and gender of each subject (16). BMI percentiles were also determined according to the sex-specific 2000 growth charts of CDC (17). Those with BMI ≥ 95th percentile were considered to be obese and those with BMI between 5th and 85th percentile were enrolled as the control group. None of the subjects had current illness and any history of disease. Those who were taking medications were excluded from the study.
The homeostatic model assessment of insulin resistance HOMA-IR was used to evaluate IR and was determined with the formula (fasting insulin [μIU/mL] × fasting glucose [mg/dL])/405 (18). Those with HOMA-IR-values greater than 3.16 were classified as having IR (19).
MetS was diagnosed based on the presence of abdominal obesity (WC above 90th percentile for age and sex) (20), and two or more other clinical features including elevated glucose, TG, SBP or DBP, or low HDL-C, according to the IDF consensus definition of MetS in children and adolescents (21).
Written informed consent was obtained from subjects and/or their parents. This study was approved by the Ethics Committee of Iran University of Medical Sciences.
Sample collection and biochemical measurements
Venous blood samples were drawn after an overnight fast. Plasma samples were prepared in RNase-free tubes at 4oC and kept frozen at -80oC for microRNA extraction. Serum samples were used for other biochemical measurements.
Fasting plasma glucose (FPG), triglyceride (TG), total cholesterol (TC), high density lipoprotein cholesterol (HDL-C) and low density lipoprotein cholesterol (LDL-C) were measured by enzymatic methods using calorimetric kits (Parsazmoon, Iran). Insulin was measured using Enzyme-Linked Immunosorbent Assay (ELISA) kit (Monobind, USA). In order to measure visfatin, plasma samples were separated immediately at 4oC. Visfatin was measured by an ELISA kit (AdipoGen, Switzerland).
MicroRNA Isolation and cDNA synthesis
The RNA fraction isolated from plasma contains small RNA species less than 100 nucleotides. The total RNA was extracted from 200 μL of plasma sample using the miRNeasy serum/plasma Kit (QIAGEN GmbH, Hilden, Germany) that uses phenol/guanidine-based lysis of samples and silica membrane–based purification of total RNA. QIAzol Lysis Reagent was used to inhibit RNase and also to eliminate most of the cellular DNA and proteins from the lysate by organic extraction. Similar amounts of miRNeasy Serum/Plasma Spike-In Control (1.6 x10⁸ copies/μL) were added to each sample prior to extraction to monitor the extraction efficiency.
Poly(A) Polymerase was used to add a poly (A) tail and elongate miRNAs. Reverse transcriptase from RevertAid first strand cDNA synthesis kit (Thermo Scientific, USA) was used for the synthesis of cDNA with a primer containing complementary sequence for the poly (A) tail and an adapter sequence (Table 1).
Table 1.
Sequences of primers
| Primers | Sequence |
| 34a | 5’- GTGGCAGTGTCTTAGCTGGTT-3’ |
| 149 | 5’- CTGGCTCCGTGTCTTCACTC-3’ |
| 16 | 5’- GGGTAGCAGCACGTAAATATTGG-3’ |
| Universal | 5’- GCGAGCACAGAATTAATACGACTC-3’ |
| Adaptor | 5’- GCGAGCACAGAATTAATACGACTCACTATAGGTTTTTTTTTTTTAG -3’ |
Real-time PCR
Real-time qPCR was performed for the measurement of miRNA levels using SYBR green (TaKaRa, Shiga, Japan) using both miRNA-specific and universal primers. PCR program contained an initial denaturation at 95°C for 15 s, followed by 40 cycles of 95°C for 3 s and 60°C for 30 s with the Rotor-Gene 6000™ (Corbett Research). The sequences of primers are shown in Table 1.
Normalization of the miRNA levels was carried out by assessing miR-16 expression. A primer for Cel-miR-39-1 (miScript Primer Assay, Qiagen, USA) was used for measuring the previously added Spike-In control to ensure reproducibility. A standard curve containing 103 - 106 copies of Cel-miR-39 cDNA was generated independent of a serum/plasma sample and RNA purification procedure, allowing estimation of the recovery of miRNeasy Serum/Plasma Spike-In Control.
A melt curve was also generated after each reaction. Relative expressions of miRNA levels were determined by ΔCt using the equation Ct normalizer - Ct specific miRNA.
Statistical analysis
Analysis of the results was performed by Mann-Whitney test for non-parametric variables and independent samples t-test for parametric variables and the chi-square (for gender distribution) using SPSS software version 16.0 (SPSS, Inc., Chicago, IL, USA). Normal distribution of data was evaluated by Kolmogorov–Smirnov test. Association between different parameters was analyzed by Pearson’s and Spearman’s correlation analysis for parametric and non-parametric variables, respectively. P values below 0.05 were considered to be significant.
RESULTS
The baseline experimental features and demographic variables of the study groups are presented in Table 2. There were no statistically significant differences in age and gender distribution of the case and control groups. Both HC and WC and their ratio as well as WC-SD were significantly higher in obese subjects compared to normal subjects. SBP and DBP were also significantly higher in obese subjects. However, no significant difference was observed for SBP-SD and DBP-SD between obese and normal subjects.
Table 2.
The baseline experimental characteristics and demographic variables
| Characteristics | Control group | Obese group | P value |
| Female/male | 20 /15 | 22/13 | n.s. |
| Age (years) | 11.42 ± 2.18 | 10.95 ± 2.73 | n.s. |
| BMI (kg/m2) | 18.41 ± 2.64 | 28.12 ± 5.7 | < 0.001 |
| BMI z-score | 0.683 ± 0.91 | 2.09 ± 0.45 | < 0.001 |
| WC (cm) | 61.65 ± 6.57 | 84.80 ± 13.45 | < 0.001 |
| WC-SD | -0.44 ± 0.8 | 1.55 ± 0.4 | < 0.001 |
| HC (cm) | 78.37 ± 8.1 | 97.62 ± 13.62 | < 0.001 |
| WHR | 0.78 ± 0.47 | 0.87 ± 0.89 | < 0.001 |
| SBP (mmHg) | 95.43 ± 11.96 | 101.14 ± 14.50 | < 0.001 |
| SPB-SD | -0.69 ± 1.1 | -0.33 ± 1.3 | n.s. |
| DBP (mmHg) | 68.57 ± 8.7 | 72.57 ± 12.21 | < 0.001 |
| DBP-SD | 0.73 ± 0.7 | 0.71 ± 1.3 | n.s. |
| FPG (mg/dL) | 90.0 ± 4.92 | 92.05 ± 6.54 | < 0.001 |
| TG (mg/dL) | 73.94 ± 31.93 | 126.6 ± 69.0 | 0.001 |
| TC (mg/dL) | 148.65 ± 19.06 | 171.54 ± 24.97 | 0.001 |
| LDL-C (mg/dL) | 75.80 ± 13.14 | 92.48 ± 16.81 | 0.024 |
| HDL-C (mg/dL) | 54.60 ± 7.50 | 47.65 ± 9.5 | 0.036 |
| Insulin (μIU/dL) | 7.74 ± 10.13 | 19.77 ± 9.64 | < 0.001 |
| HOMA-IR | 1.75 ± 2.40 | 4.50 ± 2.22 | < 0.001 |
| Visfatin (ng/mL) | 1.49 ± 0.87 | 2.08 ± 1.033 | < 0.001 |
Values are expressed as mean ± SD. BMI: body mass index; WC, waist circumference; WC-SD, waist circumference standard deviation; WHR, waist-to-hip ratio; SBP, systolic blood pressure; DBP, diastolic blood pressure; FPG, fasting plasma glucose; TG, triglycerides; TC, total cholesterol; LDL-C, low-density lipoprotein cholesterol; HDL-C, high-density lipoprotein cholesterol; HOMA-IR, homeostatic model assessment of insulin resistance.
Significant differences were observed in lipid profile between cases and controls. All of the indices of glycemic control including FPG, insulin and HOMA-IR were higher in obese subjects. Visfatin levels were also significantly elevated in the obese group compared with the control group.
Among obese subjects 31% were diagnosed as having MetS and 74% were found to be insulin resistant.
Semi-quantitative real-time PCR was used for the evaluation of plasma miR-34a and miR-149 expressions in both groups. Analysis by Δct method showed that there were no significant differences in the levels of miR-34a and miR-149 in control and obese groups.
There was also no statistically significant differences in the levels of these microRNAs in obese subjects with or without MetS. Plasma levels of miR-34a were found to be significantly reduced (P=0.001) in subjects with IR compared to the control group (Fig. 1). However, there was no statistically significant difference in the level of miR-149 in these two groups.
Figure 1.
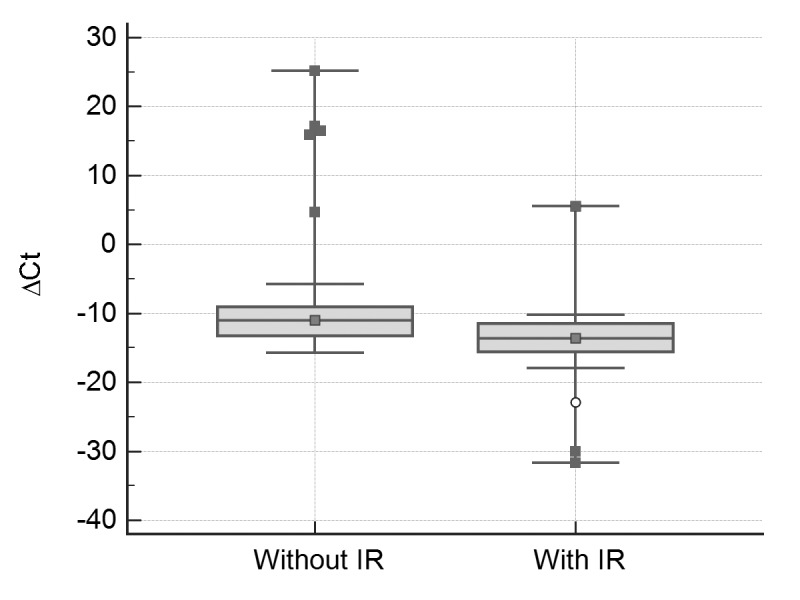
Real-time quantitative RT-PCR analysis of plasma miR-34a in groups with and without insulin resistance. miR-34a levels were calculated after normalizing with miR-16. P<0.001 compared to subjects without insulin resistance.
The correlation analysis showed that the plasma miR-149 level was negatively correlated with the serum visfatin level (r = -0.302, p = 0.001).
On the other hand, serum miR-34a level was negatively correlated with insulin (r=-0.285, p=0.022) and HOMA-IR (r=-0.281, p=0.023) (Figures 2A and 2B). No association was found between miR-149 and the other variables.
Figure 2.

(A) The negative correlation between miR-34a levels and insulin (r=-0.450, p=0.001). (B) The negative correlation between miR-34a levels and HOMA-IR (r=-0.447, p=0.002).
DISCUSSION
Childhood obesity causes a wide range of severe problems and augments the risk of premature disease. In obesity, elevation of inflammatory factors such as visfatin may lead to IR, impaired glucose tolerance and consequently type 2 diabetes (22).
Some miRNAs are related to adipocytokines and insulin function. Recently, researchers have focused on the link between miRNAs and disorders such as obesity and diabetes. In the present study, we showed that the plasma miR-34a had significant negative correlations with insulin and HOMA-IR. No association was found between miR-34a, miR-149 and the other related variables. Also, there was no significant difference in the levels of miR-34a and miR-149 in obese and control groups, but miR-34a expression was significantly lower in those with IR compared to the obese subjects with normal insulin sensitivity.
MicroRNA-34a has various roles in insulin secretion, p53-dependent apoptosis, regulation of sirtuins 1 expression, hepatic lipid homeostasis, cancer and cardiovascular disease (23). Previous studies have shown that miR-34a is overexpressed in non-alcoholic steatohepatitis (NASH) in mice (13). Some studies have also reported significantly increased miR-34a in patients with non-alcoholic fatty liver disease (NAFLD)(24) which may be related to the tissue damage induced by lipid disorders, because there is a link between liver cell apoptosis, miR-34a and NAFLD severity (25).
The most prominent finding of the current study is the association of miR-34a with insulin resistance in obese children. MicroRNA-34a has been previously found to be associated with diabetes. The expression of miR-34a is augmented in the islets of non-obese diabetic mice during development of pre-diabetic IR (26). On the other hand, increased miR-34a expression leads to sensitization of β cells to apoptosis and destruction in nutrient-induced insulin secretion (27). MicroRNA-34a decreases the expression of VAMP2, a sensitive factor attachment protein receptor (SNARE) that is essential for insulin exocytosis (28). Therefore, decreased miR-34a levels may lead to increased insulin secretion which is consistent with our findings.
Although visfatin is a direct target of miR-34a and reduction of visfatin activity by miR-34a has been reported (29), we did not find a significant correlation between these two parameters which may be the result of interaction of several other factors and shows that in vitro relationships between miRNAs and their targets are not necessarily reflected in the blood circulation. On the other hand, miR-149 showed a significant negative correlation with visfatin. MicroRNA-149 inhibits poly (ADP-ribose) polymerase-2 (PARP-2) and subsequently increases cellular NAD+ levels and SIRT-1 activity (30) suggesting a relationship between miR-149 and visfatin. It has also been reported that miR-149 inhibits inflammatory cytokines, tumor necrosis factor-α (TNF-α) and IL-6 (31) which increase the production of visfatin (32). Thus miR-149 may indirectly reduce visfatin, exerting an anti-inflammatory function.
Other miRNAs, such as miR-494 are also involved in reducing insulin secretion which may be attributable to resistin, and contribute to pathogenesis of diabetes (33).
In conclusion, according to the results of the present study, the plasma miR-34a is correlated with insulin and HOMA-IR, suggesting a role for miR-34a in the pathogenesis of diabetes and its potential as an early biomarker for identification of insulin resistance. Further studies are needed to clarify the link of miR-149, miR-34a and obesity-associated metabolic abnormalities.
Conflict of interest
The authors declare that they have no conflict of interest.
Acknowledgment
This research was financially supported by Iran University of Medical Sciences, grant number: 93-02-30-24755.
References
- 1.Ng M, Fleming T, Robinson M, Thomson B, Graetz N, Margono C, Mullany EC, Biryukov S, Abbafati C, Abera SF, Abraham JP, Abu-Rmeileh NM, Achoki T, AlBuhairan FS, Alemu ZA, Alfonso R, Ali MK, Ali R, Guzman NA, Ammar W, Anwari P, Banerjee A, Barquera S, Basu S, Bennett DA, Bhutta Z, Blore J, Cabral N, Nonato IC, Chang JC, Chowdhury R, Courville KJ, Criqui MH, Cundiff DK, Dabhadkar KC, Dandona L, Davis A, Dayama A, Dharmaratne SD, Ding EL, Durrani AM, Esteghamati A, Farzadfar F, Fay DF, Feigin VL, Flaxman A, Forouzanfar MH, Goto A, Green MA, Gupta R, Hafezi-Nejad N, Hankey GJ, Harewood HC, Havmoeller R, Hay S, Hernandez L, Husseini A, Idrisov BT, Ikeda N, Islami F, Jahangir E, Jassal SK, Jee SH, Jeffreys M, Jonas JB, Kabagambe EK, Khalifa SE, Kengne AP, Khader YS, Khang YH, Kim D, Kimokoti RW, Kinge JM, Kokubo Y, Kosen S, Kwan G, Lai T, Leinsalu M, Li Y, Liang X, Liu S, Logroscino G, Lotufo PA, Lu Y, Ma J, Mainoo NK, Mensah GA, Merriman TR, Mokdad AH, Moschandreas J, Naghavi M, Naheed A, Nand D, Narayan KM, Nelson EL, Neuhouser ML, Nisar MI, Ohkubo T, Oti SO, Pedroza A, Prabhakaran D, Roy N, Sampson U, Seo H, Sepanlou SG, Shibuya K, Shiri R, Shiue I, Singh GM, Singh JA, Skirbekk V, Stapelberg NJ, Sturua L, Sykes BL, Tobias M, Tran BX, Trasande L, Toyoshima H, van de Vijver S, Vasankari TJ, Veerman JL, Velasquez-Melendez G, Vlassov VV, Vollset SE, Vos T, Wang C, Wang X, Weiderpass E, Werdecker A, Wright JL, Yang YC, Yatsuya H, Yoon J, Yoon SJ, Zhao Y, Zhou M, Zhu S, Lopez AD, Murray CJ, Gakidou E. Global, regional and national prevalence of overweight and obesity in children and adults 1980-2013: A systematic analysis. Lancet (London, England) 2014;384(9945):766–781. doi: 10.1016/S0140-6736(14)60460-8. [DOI] [PMC free article] [PubMed] [Google Scholar]
- 2.Shi C, Zhu L, Chen X, Gu N, Chen L, Zhu L, Yang L, Pang L, Guo X, Ji C, Zhang C. IL-6 and TNF-α induced obesity-related inflammatory response through transcriptional regulation of miR-146b. J Interferon & Cytokine Res. 2014;34(5):342–348. doi: 10.1089/jir.2013.0078. [DOI] [PMC free article] [PubMed] [Google Scholar]
- 3.Sikaris KA. The Clinical Biochemistry of Obesity. The Clinical Biochemist Reviews. 2004;25(3):165–181. [PMC free article] [PubMed] [Google Scholar]
- 4.Sonoli S, Shivprasad S, Prasad C, Patil A, Desai P, Somannavar M. Visfatin-a review. Eur Rev Med Pharmacol Sci. 2011;15(1):9–14. [PubMed] [Google Scholar]
- 5.Revollo JR, Grimm AA, Imai S-i. The regulation of nicotinamide adenine dinucleotide biosynthesis by Nampt/PBEF/visfatin in mammals. Current opinion in gastroenterology. 2007;23(2):164–70. doi: 10.1097/MOG.0b013e32801b3c8f. [DOI] [PubMed] [Google Scholar]
- 6.Bartel DP. MicroRNAs: target recognition and regulatory functions. cell. 2009;136(2):215–233. doi: 10.1016/j.cell.2009.01.002. [DOI] [PMC free article] [PubMed] [Google Scholar]
- 7.Guay C, Regazzi R. Circulating microRNAs as novel biomarkers for diabetes mellitus. Nature Reviews Endocrinology. 2013;9(9):513–521. doi: 10.1038/nrendo.2013.86. [DOI] [PubMed] [Google Scholar]
- 8.He L, He X, Lim LP, de Stanchina E, Xuan Z, Liang Y, Xue W, Zender L, Magnus J, Ridzon D, Jackson AL, Linsley PS, Chen C, Lowe SW, Cleary MA, Hannon GJ. A microRNA component of the p53 tumour suppressor network. Nature. 2007;447(7148):1130–1134. doi: 10.1038/nature05939. [DOI] [PMC free article] [PubMed] [Google Scholar]
- 9.Chakraborty C, Doss C, Bandyopadhyay S, Agoramoorthy G. Influence of miRNA in insulin signaling pathway and insulin resistance: micro-molecules with a major role in type-2 diabetes. Wiley Interdisciplinary Reviews: RNA. 2014;5(5):697–712. doi: 10.1002/wrna.1240. [DOI] [PubMed] [Google Scholar]
- 10.Nourbakhsh M, Nourbakhsh M, Gholinejad Z, Razzaghy-Azar M. Visfatin in obese children and adolescents and its association with insulin resistance and metabolic syndrome. Scandinavian J Clin Lab Invest. 2015;75(2):183–188. doi: 10.3109/00365513.2014.1003594. [DOI] [PubMed] [Google Scholar]
- 11.Lee J, Kemper JK. Controlling SIRT1 expression by microRNAs in health and metabolic disease. Aging (Albany NY) 2010;2(8):527–534. doi: 10.18632/aging.100184. [DOI] [PMC free article] [PubMed] [Google Scholar]
- 12.Lee J, Padhye A, Sharma A, Song G, Miao J, Mo YY, Wang L, Kemper JK. A pathway involving farnesoid X receptor and small heterodimer partner positively regulates hepatic sirtuin 1 levels via microRNA-34a inhibition. Journal of Biological Chemistry. 2010;285(17):12604–12611. doi: 10.1074/jbc.M109.094524. [DOI] [PMC free article] [PubMed] [Google Scholar]
- 13.Cheung O, Puri P, Eicken C, Contos MJ, Mirshahi F, Maher JW, Kellum JM, Min H, Luketic VA, Sanyal AJ. Nonalcoholic steatohepatitis is associated with altered hepatic MicroRNA expression. Hepatology. 2008;48(6):1810–1820. doi: 10.1002/hep.22569. [DOI] [PMC free article] [PubMed] [Google Scholar]
- 14.Kong L, Zhu J, Han W, Jiang X, Xu M, Zhao Y, Dong Q, Pang Z, Guan Q, Gao L, Zhao J, Zhao L. Significance of serum microRNAs in pre-diabetes and newly diagnosed type 2 diabetes: a clinical study. Acta diabetologica. 2011;48(1):61–69. doi: 10.1007/s00592-010-0226-0. [DOI] [PubMed] [Google Scholar]
- 15.The fourth report on the diagnosis evaluation, and treatment of high blood pressure in children and adolescents. Pediatrics. 2004;114(2 Suppl 4th Report):555–576. [PubMed] [Google Scholar]
- 16.Group CPE BC Children’s Hospital. Available from: http://www.bcchildrens.ca/health-professionals/clinical-resources/endocrinology-diabetes/tools-calculators#Anthro--calculators.
- 17.Centers for Disease Control and Prevention National Center for Health Statistics. Available from: https://www.cdc.gov/growthcharts/cdc_charts.htm.
- 18.Bergman RN, Finegood DT, Ader M. Assessment of insulin sensitivity in vivo. Endocr Rev. 1985;6(1):45–86. doi: 10.1210/edrv-6-1-45. [DOI] [PubMed] [Google Scholar]
- 19.Keskin M, Kurtoglu S, Kendirci M, Atabek ME, Yazici C. Homeostasis Model Assessment Is More Reliable Than the Fasting Glucose/Insulin Ratio and Quantitative Insulin Sensitivity Check Index for Assessing Insulin Resistance Among Obese Children and Adolescents. Pediatrics. 2005;115(4):e500–e3. doi: 10.1542/peds.2004-1921. [DOI] [PubMed] [Google Scholar]
- 20.Cook S, Auinger P, Huang TT-K. Growth curves for cardio-metabolic risk factors in children and adolescents. The Journal of pediatrics. 2009;155(3):S6. e15–S6. e26. doi: 10.1016/j.jpeds.2009.04.051. [DOI] [PMC free article] [PubMed] [Google Scholar]
- 21.Zimmet P, Alberti G, Kaufman F, Tajima N, Silink M, Arslanian S, Wong G, Bennett P, Shaw J, Caprio S. International Diabetes Federation Task Force on Epidemiology and Prevention of Diabetes. Lancet. 2007;369(9579):2059–61. doi: 10.1016/S0140-6736(07)60958-1. The metabolic syndrome in children and adolescents. [DOI] [PubMed] [Google Scholar]
- 22.Bastard JP, Maachi M, Lagathu C, Kim MJ, Caron M, Vidal H, Capeau J, Feve B. Recent advances in the relationship between obesity, inflammation, and insulin resistance. European cytokine network. 2006;17(1):4–12. [PubMed] [Google Scholar]
- 23.Chakraborty C, Priya D, Bandyopadhyay S. miRNAs in insulin resistance and diabetes-associated pancreatic cancer: the ‘minute and miracle’molecule moving as a monitor in the ‘genomic galaxy’. Current drug targets. 2013;14(10):1110–1117. doi: 10.2174/13894501113149990182. [DOI] [PubMed] [Google Scholar]
- 24.Cermelli S, Ruggieri A, Marrero JA, Ioannou GN, Beretta L. Circulating microRNAs in patients with chronic hepatitis C and non-alcoholic fatty liver disease. PLoS One. 2011;6(8):e23937. doi: 10.1371/journal.pone.0023937. [DOI] [PMC free article] [PubMed] [Google Scholar]
- 25.Castro RE, Ferreira DM, Afonso MB, Borralho PM, Machado MV, Cortez-Pinto H, Rodrigues CM. miR-34a/SIRT1/p53 is suppressed by ursodeoxycholic acid in the rat liver and activated by disease severity in human non-alcoholic fatty liver disease. Journal of hepatology. 2013;58(1):119–125. doi: 10.1016/j.jhep.2012.08.008. [DOI] [PubMed] [Google Scholar]
- 26.Dehwah MAS, Xu A, Huang Q. MicroRNAs and type 2 diabetes/obesity. Journal of Genetics and Genomics. 2012;39(1):11–18. doi: 10.1016/j.jgg.2011.11.007. [DOI] [PubMed] [Google Scholar]
- 27.Guay C, Roggli E, Nesca V, Jacovetti C, Regazzi R. Diabetes mellitus a microRNA-related disease? Translational Research. 2011;157(4):253–264. doi: 10.1016/j.trsl.2011.01.009. [DOI] [PubMed] [Google Scholar]
- 28.Roggli E, Britan A, Gattesco S, Lin-Marq N, Abderrahmani A, Meda P, Regazzi R. Involvement of microRNAs in the cytotoxic effects exerted by proinflammatory cytokines on pancreatic β-cells. Diabetes. 2010;59(4):978–986. doi: 10.2337/db09-0881. [DOI] [PMC free article] [PubMed] [Google Scholar]
- 29.Choi SE, Fu T, Seok S, Kim DH, Yu E, Lee KW, Kang Y, Li X, Kemper B, Kemper JK. Elevated microRNA-34a in obesity reduces NAD+ levels and SIRT1 activity by directly targeting NAMPT. Aging cell. 2013;12(6):1062–1072. doi: 10.1111/acel.12135. [DOI] [PMC free article] [PubMed] [Google Scholar]
- 30.Mohamed JS, Hajira A, Pardo PS, Boriek AM. MicroRNA-149 inhibits PARP-2 and promotes mitochondrial biogenesis via SIRT-1/PGC-1α network in skeletal muscle. Diabetes. 2014;63(5):1546–1559. doi: 10.2337/db13-1364. [DOI] [PubMed] [Google Scholar]
- 31.Xu G, Zhang Z, Xing Y, Wei J, Ge Z, Liu X, Zhang Y, Huang X. MicroRNA-149 Negatively Regulates TLR-Triggered Inflammatory Response in Macrophages by Targeting MyD88. Journal of cellular biochemistry. 2014;115(5):919–927. doi: 10.1002/jcb.24734. [DOI] [PubMed] [Google Scholar]
- 32.Sun Z, Lei H, Zhang Z. Pre-B Cell Colony Enhancing Factor (PBEF), a Cytokine with Multiple Physiological Functions. Cytokine & growth factor reviews. 2013;24(5):433–442. doi: 10.1016/j.cytogfr.2013.05.006. [DOI] [PMC free article] [PubMed] [Google Scholar]
- 33.Wen F, Yang Y, Sun C, Fang H, Nie L, Li L, Liu Y, Yang Z. Resistin Inhibits Glucose-Stimulated Insulin Secretion Through Mir-494 by Target on Stxbp5. Acta Endocrinologica-Bucharest. 2017;13(1):32–39. doi: 10.4183/aeb.2017.32. [DOI] [PMC free article] [PubMed] [Google Scholar]