

Abstract
Achaete‐scute family bHLH transcription factor 2 (ASCL2) is highly expressed in hepatoblastoma (HB) tissues, but its role remains unclear. Thus, biological changes in the HB cell line HepG2 in response to induced ASCL2 expression were assessed. ASCL2 expression was induced in HepG2 cells using the Tet‐On 3G system, which includes doxycycline. Cell viability, proliferation activity, mobility, and stemness were evaluated using 3‐(4,5‐dimethylthiazol‐2‐yl)‐2,5‐diphenyltetrazolium bromide, colony‐formation, migration, invasion, and sphere‐formation assays. Quantitative reverse‐transcription polymerase chain reaction was used to assess the expression of markers for proliferation (CCND1 and MYC), epithelial‐mesenchymal transition (EMT; SNAI1, TWIST1, and ZEB1), mesenchymal‐epithelial transition (CDH1), and stemness (KLF4, POU5F1, and SOX9). Compared with the non‐induced HepG2 cells, cells with induced ASCL2 expression showed significant increases in viability, colony number, migration area (%), and sphere number on days 7, 14, 8, and 7, respectively, and invasion area (%) after 90 h. Furthermore, induction of ASCL2 expression significantly upregulated CCND1, MYC, POU5F1, SOX9, and KLF4 expression on days 2, 2, 3, 3, and 5, respectively, and increased the ratios of SNAI1, TWIST1, and ZEB1 to CDH1 on day 5. ASCL2 promoted the formation of malignant phenotypes in HepG2 cells, which may be correlated with the upregulation of the Wnt signaling pathway‐, EMT‐, and stemness‐related genes. ASCL2 activation may therefore be involved in the progression of HB.
Keywords: basic helix–loop–helix transcription factor, growth, hepatoblastoma, phenotype, Wnt signaling pathway
Achaete‐scute family bHLH transcription factor 2 (ASCL2) is highly expressed in hepatoblastoma (HB). This increase in ASCL2 expression promotes malignant features, such as growth, mobility, and stemness, in HepG2 cells. ASCL2 activation may thus be a factor in HB progression.

1. INTRODUCTION
Hepatoblastoma (HB) is the most common malignant childhood liver tumor. Although HB is thought to be derived from hepatoblasts, which are hepatic precursor cells, its pathogenesis remains unclear.
There is a high incidence of HB in patients diagnosed with Beckwith–Wiedemann syndrome, especially in those with uniparental disomy at 11p15.5. 1 This has led to speculation that alterations in DNA methylation or genomic imprinting at 11p15.5 may be involved in HB development and progression. In our previous study, DNA methylation profiling of 163 pediatric liver tumors revealed aberrant methylation at 11p15.5, which included achaete‐scute family bHLH transcription factor 2 (ASCL2) demethylation. 2 Furthermore, our previous study 2 showed that the transcription factor ASCL2, which is known to be expressed in intestinal epithelium stem cells, 3 is also highly expressed in HB. 2 Profiling has shown that the specific hypomethylation of hepatocyte enhancers is sustained in HB, and this hypomethylation then enables these sites to bind ASCL2. 2 Upregulated ASCL2 expression in premature hepatoblasts may therefore be associated with the development of HB. 2
While ASCL2 is known to be important in several different cancers, 4 , 5 , 6 , 7 , 8 , 9 , 10 its biological functions in HB have not yet been clarified. In this study, we aimed to investigate the biological changes with induced ASCL2 expression in the HB cell line HepG2, with the knockdown of ASCL2 expression in the HB cell lines HepG2 and HUH‐6, and with a demethylating agent in HepG2 cell lines with and without induced ASCL2 expression, to elucidate the function of ASCL2 in HB.
2. MATERIALS AND METHODS
2.1. Cell culture
The human hepatoblastoma cell lines HepG2 (Japanese Collection of Research Bioresources Cell Bank) and HUH‐6 (Japanese Collection of Research Bioresources Cell Bank) were cultured in RPMI (Roswell Park Memorial Institute) 1640 with L‐glutamine liquid (Nacalai Tesque) supplemented with 10% fetal bovine serum (FBS; Nacalai USA) and 100 μg/mL kanamycin (Nacalai Tesque) at 37°C in an atmosphere containing 5% CO2. For the induced expression experiments (Tet‐On 3G Systems) tetracycline‐free FBS (BioWest) was used.
2.2. Plasmids
For the induced expression experiments, complementary DNA (cDNA) encoding ASCL2 (NCBI, CDS CCDS7732.1) was amplified by PCR using PrimeSTAR® Max DNA polymerase (Takara Bio Inc.). The amplified cDNA was cloned into a pTRE3G vector (Clontech Laboratories) using an In‐Fusion Cloning Kit (Clontech), according to the manufacturer's instructions, and was subsequently referred to as pTRE ASCL2 (Table S1). The construct was confirmed by sequencing analysis and transiently co‐transfected with the pCMV‐Tet3G vector (Clontech) into HepG2 cells using TransIT‐LT1 Transfection Reagent (Mirus Bio LLC), and ASCL2 induction was tested using doxycycline (Dox; Clontech) by quantitative reverse‐transcription polymerase chain reaction (qRT‐PCR; Figure S1A).
2.3. Generation of HepG2 Tet‐On ASCL2 capable of expressing ASCL2 at high levels
To generate a Tet3G‐expressing stable cell line, HepG2 cells were transfected with the pCMV‐Tet3G vector using TransIT‐LT1 Transfection Reagent, and stable cells were then selected with 400 μg/mL G418 (Clontech). The cells were transiently transfected with pTRE3G‐Luc Control Vector (Clontech) and tested for high induction and low basal expression using luciferase activity as a reporter and the Renilla‐luciferase vector (pRL‐SV40; Promega K.K.) as the control. Clones that demonstrated ideal induction characteristics were identified, and clones expressing Tet3G were referred to as HepG2 Tet‐On 3G (Figure S1B).
To generate a double‐stable clone capable of high ASCL2 induction levels, the pTRE ASCL2 was co‐transfected into HepG2 Tet‐On 3G along with a linear hygromycin marker (Hygr; Clontech), and colonies were selected with 600 μg/mL hygromycin. The clones were tested for ASCL2 expression in the presence and absence of Dox by qRT‐PCR, and the clone that generated the highest maximal and lowest basal expression levels was chosen and referred to as HepG2 Tet‐On ASCL2 (Figure S1C). For cellular function analyses, we refer to the group treated with Dox as the Dox (+) treatment group and the untreated group as the Dox (−) treatment group.
2.4. Minimal concentration of Dox required to induce high ASCL2 expression in HepG2 Tet‐On ASCL2 cells
The concentration of Dox required to induce high levels of ASCL2 expression was determined using qRT‐PCR. Initially, 2 × 10⁵ HepG2 Tet‐On ASCL2 cells were seeded in five wells of a well plate (Thermo Fisher Scientific) and cultured in the presence or absence of Dox for 2 days at concentrations of 0, 62.5, 125, 250, and 500 ng/mL. The expression levels of ASCL2 and ACTB were assayed across these cells by qRT‐PCR, as described in the subsection on qRT‐PCR.
2.5. Small interfering RNA transfections
The small interfering RNA (siRNA) used for ASCL2 (Bex Co., Ltd.) was siASCL2, and its sequence was as follows: sense 5′‐GCAAGAAGCUGAGCAAGGUtt‐3′ and antisense 5′‐ACCUUGCUCAGCUUCUUGCTT‐3′. 11 The siASCL2 and AllStars Negative Control siRNA (siNC; Qiagen NV) were transfected into cells using TransIT‐X2® (Mirus) and Opti‐MEM (Thermo Fisher Scientific). After siRNA transfections, the final concentrations (FCs) of siRNAs in the media were 50 and 100 nM, for experiments with the HepG2 and HUH‐6 cell lines, respectively. For qRT‐PCR and cellular function analyses, we refer to the groups transfected with siNC and siASCL2 as the siNC and siASCL2 groups, respectively.
2.6. Demethylating agent
The demethylating agent 5‐aza‐2′‐deoxycytidine (5‐aza‐dC; Sigma‐Aldrich) was dissolved in PBS and added to an FC of 2 μM, as previously described. 12 , 13 , 14 For the colony‐formation assay with HepG2, we refer to the groups with added PBS and 5‐aza‐dC as the PBS and 5‐aza‐dC groups, respectively. For the colony‐formation assay with HepG2 Tet‐On ASCL2, we refer to the Dox (−) and Dox (+) treatment groups with added PBS or 5‐aza‐dC as the Dox (−) & PBS, Dox (−) & 5‐aza‐dC, Dox (+) & PBS, and Dox (+) & 5‐aza‐dC groups, respectively.
2.7. Sampling
For the induced expression experiments, 5 × 10⁵ HepG2 Tet‐On ASCL2 cells were seeded into 100‐mm dishes (Thermo Fisher Scientific) and treated with Dox, and the remaining untreated cells were used as the sample on day 0 (before the Dox treatment). The cells were cultured for 1–5 days and sampled daily (Figure S2A). Half of each sample was then used for western blot analysis of ASCL2 and the other half for qRT‐PCR analysis of ASCL2 and other genes of interest.
For the knockdown experiment, 2 × 10⁵ HepG2 and HUH‐6 cells, each were seeded into 2 mL of RPMI medium, as previously described in the Cell culture subsection, in 35‐mm dishes (Corning Inc.) and cultured for 1 day. The siRNA complexes were then distributed to the cells (HepG2 and HUH‐6; TransIT‐X2® 7.5 μL; siRNA [20 μM stock concentration] 5.65 and 11.3 μL; Opti‐MEM 250 μL; FC 50 and 100 nM), and the cells were cultured for 1 day, then sampled (Figure S2B,C).
2.8. Quantitative reverse‐transcription polymerase chain reaction
Total RNA was isolated from the cells using NucleoSpin® RNA (MACHEREY‐NAGEL GmbH & Co. KG) or NucleoSpin® miRNA (MACHEREY‐NAGEL GmbH & Co. KG) kits, according to the manufacturer's instructions. The isolated RNA was quantified using a NanoDrop 1000 spectrophotometer (Thermo Fisher Scientific). Total RNA extracted from each sample was diluted to 1000 ng/10 μL (FC of 100 ng/μL), and cDNA was synthesized using a High‐Capacity cDNA Reverse Transcription Kit (Applied Biosystems), according to the manufacturer's instructions. cDNA was diluted by five‐ or 20‐fold (five‐fold for ASCL2, 20‐fold for genes of interest), and 2 μL of diluted cDNA was used as a template. Quantitative reverse‐transcription polymerase chain reaction was performed with a FastStart Universal Probe Master (Rox; Hoffmann‐La Roche Ltd), primers, and Universal ProbeLibrary Set (Roche) using a 7900HT Fast Real‐Time PCR System (Applied Biosystems), 7500 Real‐Time PCR System (Applied Biosystems), or CFX Opus 96 Real‐Time PCR system (Bio‐Rad Laboratories, Inc.). The ASCL2, CCND1, MYC, SNAI1, TWIST1, ZEB1, CDH1, KLF4, POU5F1, SOX9, and DLK1 primer and probe sets are listed in Table S2. TaqMan™ Gene Expression Assays (Applied Biosystems) were conducted using the MEG3 and RTL1 primer and probe sets, respectively. ACTB (Applied Biosystems) was used as the internal control. Gene expression levels were calculated using standard curves generated from serial dilutions of pooled cDNA from various cell lines, as previously described. 15 Overall, there were four biological replicates for each sample (four different plates for each condition) and each of these was used for three technical replicates in a 96‐well plate (three different wells), resulting in 12 data points per sample. For the induced expression experiments, the ratios of ASCL2, CCND1, MYC, SNAI1, TWIST1, ZEB1, CDH1, KLF4, POU5F1, SOX9, DLK1, MEG3, and RTL1 to ACTB and SNAI1, TWIST1, and ZEB1 to CDH1 were calculated, and the results for each time point were compared with those for all other time points. As the SNAI1, TWIST1, ZEB1 (epithelial‐mesenchymal transition [EMT] markers), and CDH1 (mesenchymal‐epithelial transition [MET] marker) combination may be used to distinguish the mesenchymal cell phenotype from the epithelial cell phenotype, 16 the expression ratios of these EMT markers to CDH1 were calculated. For the knockdown experiments, the ratios of ASCL2, POU5F1, SOX9, ZEB1, and MYC to ACTB were calculated, and the HepG2 and HUH‐6 cells transfected with siNC were compared to their respective counterparts transfected with siASCL2.
2.9. Western blotting
Cells were washed with ice‐cold PBS, harvested, and frozen at −80°C. Whole‐cell extracts were prepared from frozen cells and their concentrations were measured as previously described. 17 Each protein sample (40 μg) was separated using 5%–10% gradient sodium dodecyl sulfate‐polyacrylamide gel electrophoresis (Atto Corporation) and blotted onto polyvinylidene fluoride membranes (Millipore Corporation). To block nonspecific antibody binding, membranes were incubated with 2% bovine serum albumin in Tris‐buffered saline for 1 h at room temperature (20°C). The membranes were incubated with primary antibodies diluted in CanGet Signal primary buffer (Toyobo Co., Ltd.) overnight at 4°C. The primary antibodies and their dilutions were as follows: anti‐ASCL2 (Sigma‐Aldrich), 1:500, and anti‐β‐actin (Sigma‐Aldrich), 1:5000. After washing with Tris‐buffered saline (pH 7.6) containing 0.05% Tween 20, membranes were incubated with horseradish peroxidase‐linked anti‐rabbit IgG (Cell Signaling Technology, Inc.) or anti‐mouse IgG (Cell Signaling Technology) diluted in CanGet Signal secondary antibody buffer at 37°C. After washing with Tris‐buffered saline (pH 7.6) containing 0.05% Tween 20, the membranes were incubated with SuperSignal™ West Femto Maximum Sensitivity Substrate (Thermo Fisher Scientific), and the immune complexes were detected using Fujifilm Super RX X‐ray film (Fujifilm) and autoradiography. Experiments were independently performed at least three times.
2.10. 3‐(4,5‐dimethylthiazol‐2‐yl)‐2,5‐diphenyltetrazolium bromide assay
Cell viability was evaluated using the 3‐(4,5‐dimethylthiazol‐2‐yl)‐2,5‐diphenyltetrazolium bromide (MTT) assay. For the induced expression experiment, HepG2 Tet‐On ASCL2 cells were cultured for 5 days with or without Dox. Cells were re‐treated with or without Dox and seeded in 96‐well plates (5 × 10³ cells/well, eight wells × four plates; Thermo Fisher Scientific). For the knockdown experiments, HepG2 and HUH‐6 cells were seeded in 96‐well plates (5 × 10³ and 8 × 10³ cells/well, four wells × four plates). The cells were cultured for 1 day and then transfected with siRNA. At each time point (HepG2 Tet‐On ASCL2, and cells transfected with siRNA, days 1, 3, 5, and 7, and days 1, 2, 3, and 4 [culture period after seeding in the 96‐well plate]), 10 μL of 0.4% MTT reagent and 0.1 M sodium succinate were added to each well. After 2 h of incubation, the formazan precipitates were dissolved in 150 μL of dimethyl sulfoxide and the absorbance at 570 and 650 nm was measured using an EMax® Endopoint ELISA Microplate Reader (Molecular Devices LLC; Figure S3A–C). The relative cell viabilities were calculated using the absorbances at 570 and 650 nm at the time points mentioned, and the fold change was calculated relative to the viabilities on day 1 (i.e., on day 1 the relative cell viability showed a 1‐fold increase).
2.11. Colony‐formation assay
Colony‐formation ability was evaluated as follows. For the induced expression experiment, 1 × 10⁴ HepG2 Tet‐On ASCL2 cells/well were seeded in six‐well plates with or without Dox and cultured for 14 days. For the knockdown experiment, HepG2 and HUH‐6 cells were seeded in 96‐well plates (1 × 10³ and 8 × 10³ cells/well). The cells were cultured for 1 day and then transfected with siRNA. The cells were then cultured for 2 days, after which cells from each of the 96 wells were seeded into a well in a six‐well plate and cultured for 10 days. For the experiments using 5‐aza‐dC, HepG2 and HepG2 Tet‐On ASCL2 cells were seeded in six‐well plates (2.5 × 10⁴ and 3.75 × 10⁴ cells/well), and HepG2 Tet‐On ASCL2 cells were treated with or without Dox. The cells were cultured for 1 day and then PBS or 5‐aza‐dC was added. Then, 2 and 4 days after first adding the PBS or 5‐aza‐dC, the media were changed and PBS or 5‐aza‐dC was added. The cells were then cultured for 7 days after seeding. Cells were fixed with ice‐cold 100% methanol, stained with 0.5% crystal violet, and examined using a scanner (DS‐7500; Seiko Epson Corporation; Figure S4A–E). Visible colonies in the culture were counted using Katikati counter software (https://www.vector.co.jp/soft/win95/art/se347447.html; Figure S4F), and the Dox (−) treatment, siNC, and PBS groups were compared with the Dox (+) treatment, siASCL2, and 5‐aza‐dC groups on days 14, 10, and 7 of the culture period after seeding in a six‐well plate (Figure S4A–D). For the experiments using HepG2 Tet‐On ASCL2 and 5‐aza‐dC, one particular group was compared with all other groups on day 7 of the culture period (Figure S4E).
2.12. Migration assay
Standardized wounds for the migration assay were created using Culture‐Insert 2 Wells (ibidi GmbH). Briefly, for the induced expression experiment, HepG2 Tet‐On ASCL2 cells were cultured for 5 days with or without Dox before seeding into the wells (migration‐day [M‐day: culture period after removing the Culture‐Insert 2 Well] − 1 = day [culture period after the Dox (−) and (+) treatment] 5). The cells were seeded into each well (14 × 104 cells/70 μL medium with or without Dox, M‐day − 1 = day 5) and cultured for 1 day. The Culture‐Insert 2 Wells were then gently removed, and the medium with or without Dox was added (M‐day 0 [migration assay start] = day 6; Figure S5A). For the knockdown experiment, HepG2 and HUH‐6 cells were seeded into each well (15 × 103 cells/60 μL medium, respectively) and cultured for 1 day. The cells were then transfected with siRNA and cultured for 2 days. The Culture‐Insert 2 Wells were then gently removed, and RPMI medium, as previously described in the Cell culture subsection, was added (Figure S5B,C). Cells were cultured and photographed at the indicated time points (HepG2 Tet‐On ASCL2 and HepG2 transfected with siRNA: days 2 and 4; HUH‐6 transfected with siRNA: 24, 36, and 48 h of the culture period after removing the Culture‐Insert 2 Wells) using a Leica DMi1 (Leica Microsystems CMS GmbH; Figure S5A–C). The migration abilities were compared at the time points mentioned by calculating the migration areas using ImageJ software (public domain open‐source software, imagej.nih.gov), as previously described 18 (Figure S5D).
2.13. Invasion assay
The invasion assay was performed according to a previously described method with slight modifications. 19 For the induced expression experiment, HepG2 Tet‐On ASCL2 cells were cultured for 3 days with or without Dox before being used in a hanging‐drop culture. To form spheroids, the cells were cultured using the hanging‐drop method for 2 days (2.0 × 10⁴ cells/20 μL medium with or without Dox). For the knockdown experiment, HepG2 cells were cultured using the hanging‐drop method, and after 1 day, the drops were transfected with siRNA. The drops were then cultured for 2 days after the siRNA transfections. The spheroids formed were embedded in 500 μL of collagen I solution (350 μL of Cellmatrix Type I‐A [FUJIFILM Wako Pure Chemical Corporation], 100 μL of medium, and 50 μL of Reconstitution Buffer [FUJIFILM Wako Pure Chemical Corporation], mixed on ice) in each well of a 24‐well plate and incubated for 10 min at 37°C. Serum‐free medium (500 μL) was added on top of the solidified collagen I, and the spheroids were photographed after being embedded in collagen I and incubated for 0, 5, 10, 30, 50, and 90 h (HepG2 Tet‐On ASCL2) or 2, 4, and 6 days (HepG2 transfected with siRNA), with an All‐in‐One Fluorescence Microscope BZ‐X800 (KEYENCE Corporation; Figure S6A,B). The same coordinates (x, y, and z axes) were used for each well, and the invasion abilities were compared at the time points mentioned by calculating the invasion areas using ImageJ software (Figure S6C).
2.14. Sphere‐formation assay
For the induced expression experiment, HepG2 Tet‐On ASCL2 cells (5 × 10⁴) were cultured with or without Dox after seeding on φ90 × 20 mm Asnol Petri dishes (AS ONE Corporation) for 7 days (Figure S7A). For the knockdown experiment, 2 × 10³ HepG2 cells/well were seeded in a 96‐well plate. The cells were cultured for 1 day and then transfected with siRNA. The cells were cultured for 2 days after the siRNA transfections, then cells from each of the 96 wells were seeded on an Asnol Petri dish and cultured for 10 days (Figure S7B). Spheres were scanned with a scanner (DS‐7500) and photographed with a Leica DMi1, and visible spheres were counted using the Katikati counter software. The Dox (−) treatment and the siNC groups were compared with the Dox (+) treatment and siASCL2 groups on day 7 or 10 of the culture period after seeding in an Asnol Petri dish (Figure S7C).
2.15. Statistical analyses
Statistical analyses were performed using SPSS Statistics version 17.0 (IBM). For comparisons involving more than three groups, one‐way ANOVA was used, and the Games–Howell and Tukey tests were used to compare the expression of each gene at a particular time point with that at all other measured time points in the qRT‐PCR analysis for HepG2 Tet‐on ASCL2 and to compare the colony number of a particular group with that of all other groups in the colony‐formation assay using HepG2 Tet‐On ASCL2 and 5‐aza‐dC. For cellular function analyses, the Dox (−) and Dox (+) groups and the siNC and siASCL2 groups were compared using Student's t‐test. Statistical significance was set at P < 0.05.
3. RESULTS
3.1. Minimal concentration of Dox required to induce high ASCL2 expression in HepG2 Tet‐On ASCL2 cells
A stable clone in which high ASCL2 induction could be achieved using Dox, HepG2 Tet‐On ASCL2, was created using the Tet‐On 3G system. The HepG2 Tet‐On ASCL2 cells were cultured with 0, 62.5, 125, 250, and 500 ng/mL Dox, and the expression levels of ASCL2/ACTB were 0.07 (0.01), 14.32 (0.75), 14.30 (0.64), 21.02 (2.30), and 20.25 (1.28), respectively (mean [SD], n = 3). In the cells treated with lowest concentration of Dox (62.5 ng/mL), the ASCL2/ACTB expression level was found to be sufficiently high to enable investigations into the associated biological effects, when compared with the Dox (−) treatment group. Thus, the minimal concentration of Dox required to induce high expression was determined to be 62.5 ng/mL (Figure S8).
3.2. ASCL2 expression induced by Dox
In HepG2 Tet‐On ASCL2 cells cultured in the presence of Dox, the expression levels of ASCL2/ACTB on days 1, 2, 3, 4, and 5 (culture period after the Dox treatment) were found to be 384.8 (76.3), 529.9 (104.7), 635.5 (202.2), 860.7 (248.1), and 2765.2 (609.6), respectively (mean [SD], n = 4); these levels were remarkably higher than those on day 0, before the Dox treatment (1.0 [0.7], mean [SD], n = 4; Figure S9A).
Western blotting showed that the ASCL2 protein levels gradually increased from day 0 to day 4 (culture period after the Dox treatment) and then markedly increased on day 5, similar to the ASCL2 messenger RNA expression on day 5 (Figure S9B).
3.3. ASCL2 knockdown by siRNA
In HepG2 and HUH‐6 transfected with siRNAs, the expression levels of ASCL2/ACTB were significantly lower in the siASCL2 group than in the siNC group (mean [SD] 0.60 [0.42] vs. 1.68 [0.68] and 0.62 [0.23] vs. 1.51 [0.50], P = 0.036 and 0.017, n = 4; Figure S10A,B).
3.4. MTT and colony‐formation assays
In the MTT assay with HepG2 Tet‐On ASCL2, on day 7, relative cell viability when compared with that on day 1 was significantly higher with the Dox (+) treatment than with the Dox (−) treatment (mean [SD] 18.29 [0.94]‐fold vs. 13.25 [1.29]‐fold, P < 0.001, n = 4; Figure 1A). In HepG2 transfected with siRNAs, on day 4, the cell viability was significantly lower with siASCL2 transfection than with siNC transfection (mean [SD] 6.74 [0.50]‐fold vs. 8.49 [0.92]‐fold, P = 0.016, n = 4; Figure S11A). In HUH‐6, cell viabilities with siASCL2 transfection were also significantly lower from days 2 to 4 (mean [SD] 1.12 [0.08]‐fold vs. 1.66 [0.15]‐fold, 0.93 [0.16]‐fold vs. 1.99 [0.10]‐fold, and 1.10 [0.17]‐fold vs. 2.55 [0.10]‐fold, P = 0.002, <0.001, and <0.001, respectively, n = 4; Figure S11B).
FIGURE 1.
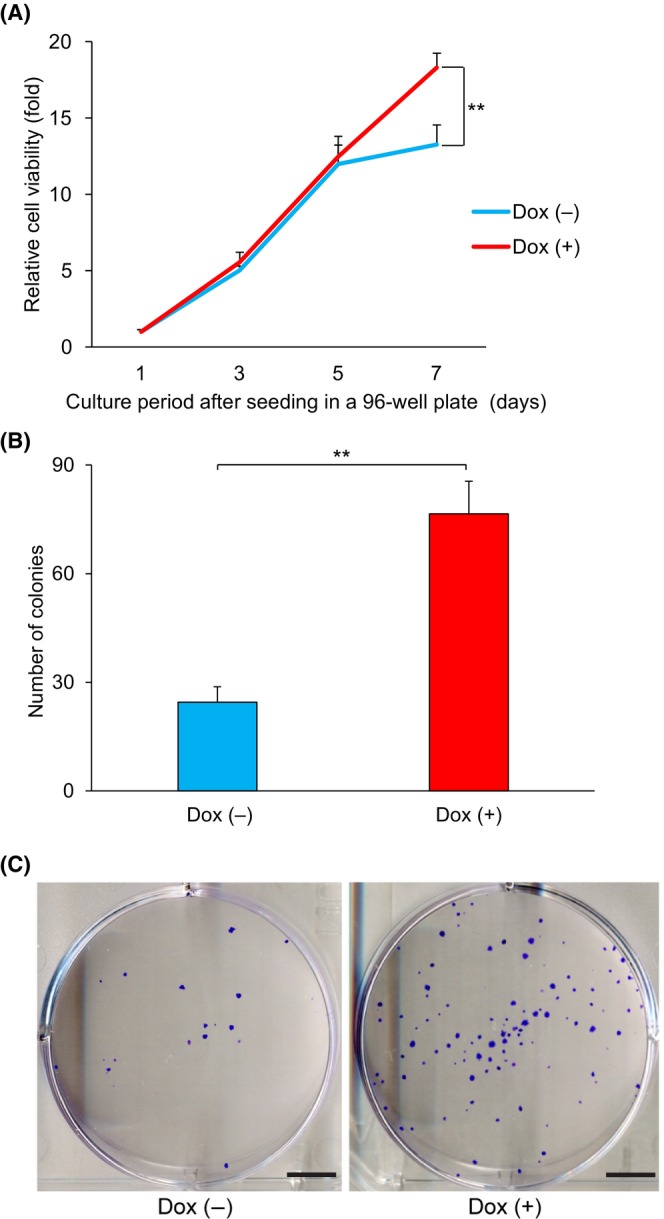
MTT and colony‐formation assays in the induced expression experiment using HepG2 Tet‐On ASCL2. (A) HepG2 Tet‐On ASCL2 cell viability was evaluated using an MTT assay. The relative cell viabilities were calculated using the absorbances at 570 and 650 nm at the indicated time points (days 3, 5, and 7), and the fold change was calculated relative to the viabilities on day 1. On day 7, cell viability was significantly higher with the Dox (+) treatment than with the Dox (−) treatment (relative cell viability [fold], mean [SD] 18.29 [0.94]‐fold vs. 13.25 [1.29]‐fold, P < 0.001, n = 4). Days 1, 3, 5, and 7 refer to the culture period after seeding in the 96‐well plate. Values shown are the means ± SD. **P < 0.01. Cells were seeded in eight wells of a 96‐well plate in four plates for each group. (B) Colony‐forming abilities were evaluated using a colony‐formation assay with the HepG2 Tet‐On ASCL2 cells. The number of colonies was greater with the Dox (+) treatment than with the Dox (−) treatment (on day 14, mean [SD] 76.5 [9.0] colonies vs. 24.5 [4.3] colonies, P < 0.001, n = 6). Seeding in a six‐well plate was also carried out on day 0 of the culture period after the Dox treatment. Values shown are the means ± SD. **P < 0.01. (C) Representative images of the Dox (−) and (+) treatments groups on day 14. Colony sizes were larger with the Dox (+) treatment than with the Dox (−) treatment. Scale bar = 5 mm. Dox, doxycycline; MTT, 3‐(4,5‐dimethylthiazol‐2‐yl)‐2,5‐diphenyltetrazolium bromide.
For the HepG2 Tet‐On ASCL2, the results of the colony‐formation assay showed that both colony number (Figure 1B) and size (Figure 1C) were greater in the Dox (+) treatment group than in the Dox (−) treatment group (on day 14, mean [SD] 76.5 [9.0] colonies vs. 24.5 [4.3] colonies, P < 0.001, n = 6). In HepG2 and HUH‐6, the results of the colony‐formation assay showed that both colony number (Figure S11C,E) and size (Figure S11D,F) were smaller in the siASCL2 group than in the siNC group (on day 10, mean [SD] 14.3 [8.6] colonies vs. 105.5 [13.0] colonies and 194.8 [38.4] colonies vs. 331.0 [92.1] colonies, P < 0.001 and P = 0.034, n = 4). For the assay using HepG2 and 5‐aza‐dC, the colony number was 65.7% smaller in the 5‐aza‐dC group than in the PBS group (on day 7, mean [SD] 878.5 [24.1] colonies vs. 2558.8 [334.6] colonies, P < 0.001, n = 4, Figure S12A), and the size (Figure S12B) and number of cells forming clusters (Figure S12C) were also smaller. For the assay using HepG2 Tet‐On ASCL2 and 5‐aza‐dC, the colony number was greater in the Dox (+) & 5‐aza‐dC group than in the Dox (−) & 5‐aza‐dC group (on day 7, mean [SD] 400.5 [36.6] colonies vs. 227.5 [76.1] colonies, P = 0.020, n = 4). Compared with the respective PBS groups, the colony number was 32.8% smaller in the Dox (+) & 5‐aza‐dC group, while it was 52.7% smaller in the Dox (−) & 5‐aza‐dC group (Figure S13A). Colony size (Figure S13B) and the number of clustering and stratifying cells (Figure S13C) were greater in the Dox (+) & 5‐aza‐dC group than in the Dox (−) & 5‐aza‐dC group.
3.5. Migration and invasion assays
For the HepG2 Tet‐On ASCL2, the migration areas (%) on M‐day 2 (day 8) were significantly larger in the Dox (+) group than in the Dox (−) group (mean [SD] 33.2 [7.4]% vs. 14.1 [1.6]%, P = 0.012, n = 4; Figure 2B). Furthermore, cell shape changes, such as invadopodia, were observed in the Dox (+) group when compared with the Dox (−) group on M‐day 2 (day 8; Figure 2A). In HepG2, the migration areas (%) on days 2 and 4 were significantly smaller in the siASCL2 group than in the siNC group (mean [SD] 23.9 [2.1]% vs. 35.8 [3.7]% and 57.6 [5.3]% vs. 68.3 [6.8]%, P = 0.001 and 0.049, n = 4; Figure S14A,B). In HUH‐6, the migration areas (%) at 24, 36, and 48 h were significantly smaller in the siASCL2 group than in the siNC group (mean [SD] 10.9 [5.1]% vs. 27.2 [5.1]%, 20.7 [8.5]% vs. 41.3 [9.3]%, and 32.0 [10.0]% vs. 58.4 [4.5]%, P = 0.004, 0.017, and 0.003, respectively, n = 4; Figure S14C,D).
FIGURE 2.
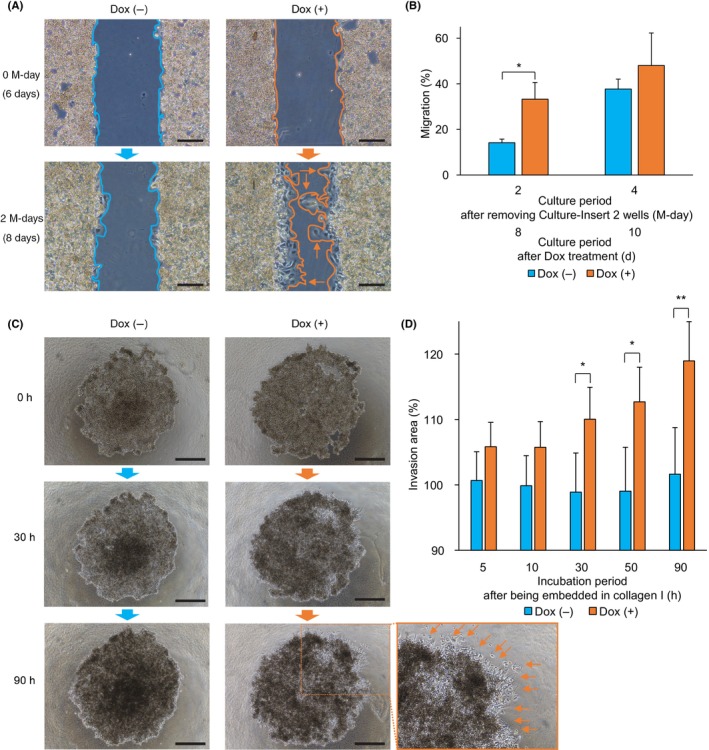
Migration and invasion assays in the induced expression experiment with HepG2 Tet‐On ASCL2. (A) Representative images of the HepG2 Tet‐On ASCL2 cells from the Dox (−) and (+) treatment groups that were analyzed using a migration assay. Image of the Dox (+) treatment group on M‐day 2 (day 8) shows invadopodia (identified using arrows). Scale bar = 200 μm. (B) Migration areas (%) on M‐days 2 and 4 (days 8 and 10). The migration areas (%) on M‐day 2 (day 8) were significantly larger with the Dox (+) treatment than with the Dox (−) treatment (mean [SD] 33.2 [7.4]% vs. 14.1 [1.6]%, respectively, P = 0.012, n = 4). M‐days 2 and 4 refer to the culture period after removing the Culture‐Insert 2 Well; days 8 and 10 refer to the culture period after the Dox (−) and (+) treatment. Values shown are the means ± SD. *P < 0.05. (C) Representative images of the HepG2 Tet‐On ASCL2 cells from the Dox (−) and (+) treatment groups that were analyzed using an invasion assay. The image of the Dox (+) treatment group at 90 h shows invadopodia, identified using arrows. Scale bar = 500 μm. (D) Invasion areas (%) at 5, 10, 30, 50, and 90 h. The invasion areas (%) at 30, 50, and 90 h were significantly larger with the Dox (+) treatment than with the Dox (−) treatment (mean [SD] 110.0 [4.9]% vs. 98.9 [6.0]%, 112.7 [5.3]% vs. 99.0 [6.71]%, and 119.0 [6.0]% vs. 101.6 [7.2]%, P = 0.028, 0.019, and 0.009, respectively). 5, 10, 30, 50, and 90 h refer to the incubation period after being embedded in collagen I. Values shown are the means ± SD (n = 4). *P < 0.05, **P < 0.01. Dox, doxycycline; M‐day, migration‐day.
For the HepG2 Tet‐On ASCL2, invasion in the Dox (+) group was detected at 5 h, and the invasion areas (%) were significantly larger in the Dox (+) group than in the Dox (−) group at 30, 50, and 90 h (mean [SD] 110.0 [4.9]% vs. 98.9 [6.0]%, 112.7 [5.3]% vs. 99.0 [6.71]%, and 119.0 [6.0]% vs. 101.6 [7.2]%, P = 0.028, 0.019, and 0.009, respectively, n = 4; Figure 2D). Morphological changes, such as invadopodia, were observed in the Dox (+) group when compared with the Dox (−) group after 30 h (Figure 2C). In HepG2, the invasion areas (%) were significantly smaller in the siASCL2 group than in the siNC group on days 4 and 6 (mean [SD] 98.1 [1.7]% vs. 103.8 [3.9]% and 100.3 [1.3]% vs. 109.5 [6.8]%, P = 0.036 and 0.036, n = 4; Figure S14E,F).
3.6. Sphere‐formation assay
For the HepG2 Tet‐On ASCL2, the number of spheres was higher in the Dox (+) group than in the Dox (−) group (on day 7, mean [SD] 515.0 [63.1] spheres vs. 412.8 [44.4] spheres, P = 0.038, n = 4; Figure 3B). Furthermore, the sphere sizes in the Dox (+) group were larger than those in the Dox (−) group on day 7 (Figure 3A). In HepG2, the number of spheres was smaller in the siASCL2 group than in the siNC group (on day 10, mean [SD] 147.5 [31.0] spheres vs. 274.0 [97.1] spheres, P = 0.048, n = 4; Figure S15B). Furthermore, the sphere sizes in the siASCL2 group were smaller than those in the siNC group on day 10 (Figure S15A).
FIGURE 3.
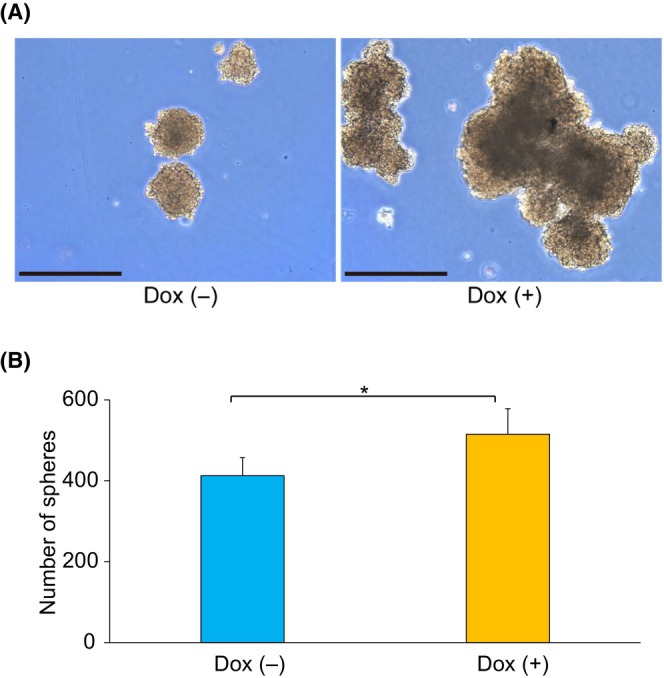
Sphere‐formation assay in the induced expression experiment with HepG2 Tet‐On ASCL2. (A) Representative images from the sphere‐formation assay using the HepG2 Tet‐On ASCL2 cells from the Dox (−) and Dox (+) treatment groups on day 7. Sphere sizes were larger with the Dox (+) treatment than with the Dox (−) treatment. Scale bar = 0.5 mm. (B) Sphere‐formation abilities of the HepG2 Tet‐On ASCL2 cells were evaluated on day 7 using the sphere‐formation assay. There were more spheres with the Dox (+) treatment than with the Dox (−) treatment (mean [SD] 515.0 [63.1] spheres vs. 412.8 [44.4] spheres, P = 0.038, n = 4). Day 7: culture period after seeding in an Asnol Petri dish. Values shown are the means ± SD. *P < 0.05. Dox, doxycycline.
3.7. Gene expression before and after ASCL2 induction and during ASCL2 knockdown
The expression of CCND1 and MYC significantly increased on days 2–3 and 2–4 in the HepG2 Tet‐On ASCL2 cells cultured in the presence of Dox when compared with the expression on day 0 (CCND1/ACTB, on days 2 and 3, mean [SD] 6.95 [1.69] and 6.85 [2.42], P = 0.016 and 0.020, respectively, n = 4; MYC/ACTB, on days 2, 3, and 4, mean [SD] 9.14 [2.73], 8.84 [3.16], and 8.28 [2.19], P = 0.006, 0.009, and 0.019, respectively, n = 4). From day 4, these levels decreased, but they were not statistically significant when compared to the levels on day 3 (CCND1/ACTB, MYC/ACTB, on days 4 and 5, mean [SD] 5.55 [1.54] and 3.74 [0.34], 8.28 [2.19] and 6.09 [0.75], P = 0.82 and 0.080, 1.00 and 0.46, respectively, n = 4; Figure 4A).
FIGURE 4.
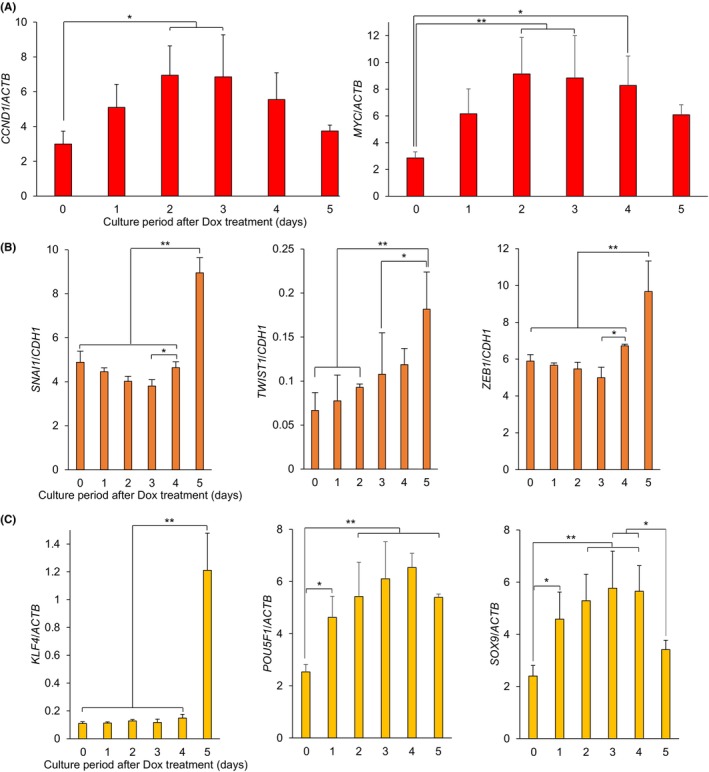
Expression of proliferation‐, EMT‐, and stemness‐related genes before and after the induction of ASCL2. (A) CCND1 and MYC (proliferation markers)/ACTB expression levels. The levels of CCND1 and MYC significantly increased on days 2–3 and 2–4 when compared with those on day 0. Their levels decreased from day 4, although the decreases were not statistically significant when compared with those on day 3. (B) SNAI1, TWIST1, and ZEB1 (EMT markers)/CDH1 (a MET marker) expression ratios. Compared with day 0, the ratios of SNAI1, TWIST1, and ZEB1 to CDH1 were not significantly different until day 4 and significantly increased on day 5. SNAI1, TWIST1, ZEB1 (EMT markers), and CDH1 (MET marker)/ACTB were also evaluated using qRT‐PCR (Figure S14). (C) KLF4, POU5F1, and SOX9 (stemness markers)/ACTB expression levels. Compared with their levels on day 0, POU5F1 and SOX9 expression levels significantly increased on days 1–5 and days 1–4, while KLF4 expression only significantly increased on day 5. For qRT‐PCR analysis of the genes of interest, the same samples as those used for ASCL2/ACTB were used (Figures S2A and S9). Day 0 before the Dox treatment and days 1, 2, 3, 4, and 5 of the culture period after the Dox treatment. Values shown are the means ± SD (n = 4). *P < 0.05, **P < 0.01. Dox, doxycycline; EMT, epithelial‐mesenchymal transition; MET, mesenchymal‐epithelial transition; qRT‐PCR, quantitative reverse‐transcription polymerase chain reaction.
Compared with day 0, the expression ratios of SNAI1, TWIST1, and ZEB1 (EMT markers) to CDH1 (MET marker) were not significantly different until day 4 and were significantly increased on day 5 in HepG2 Tet‐On ASCL2 cells cultured in the presence of Dox (SNAI1/CDH1, TWIST1/CDH1, and ZEB1/CDH1, mean [SD] 8.95 [0.69], 0.18 [0.04], and 9.67 [1.66], P < 0.001, <0.001, and <0.001, respectively, n = 4; Figures 4B and S16).
Compared with those on day 0, the expression levels of POU5F1 and SOX9 were significantly increased in the HepG2 Tet‐On ASCL2 cells cultured in the presence of Dox on days 1–5 and 1–4 (POU5F1/ACTB, on days 1, 2, 3, 4, and 5, mean [SD] 4.62 [0.81], 5.42 [1.32], 6.10 [1.43], 6.54 [0.55], and 5.39 [0.13], P = 0.039, 0.003, <0.001, <0.001, and 0.003, n = 4, respectively, and SOX9/ACTB, on days 1, 2, 3, and 4, mean [SD] 4.58 [1.04], 5.28 [1.02], 5.77 [1.42], and 5.65 [0.98], P = 0.044, 0.005, 0.001, and 0.002, n = 4, respectively), while the levels of KLF4 significantly increased only on day 5 (KLF4/ACTB, mean [SD] 1.21 [0.27], P ≤ 0.001, n = 4; Figure 4C).
The expression of MEG3 was significantly increased on day 5 in HepG2 Tet‐On ASCL2 cells cultured in the presence of Dox when compared with that on day 0 (MEG3/ACTB, mean [SD] 0.023 [0.005], P = 0.004, n = 4; Figure S17B), while the expression of DLK1 and RTL1 was not significantly different (Figure S17A,C).
In HepG2, the expression of POU5F1/ACTB was significantly lower in the siASCL2 group than in the siNC group (mean [SD] 1.04 [0.08] vs. 1.24 [0.07], P = 0.011, n = 4; Figure S18A). The expression of SOX9/ACTB was also lower in the siASCL2 group than in the siNC group (mean [SD] 1.76 [0.15] vs. 1.94 [0.14], P = 0.13, n = 4; Figure S18B), although the difference was not statistically significant. There was no significant difference between the siASCL2 and siNC groups in terms of ZEB1 and MYC expression (ZEB1/ACTB and MYC/ACTB, mean [SD] 1.81 [0.17] vs. 1.86 [0.15] and 1.69 [0.08] vs. 1.65 [0.03], P = 0.70 and 0.49, n = 4; Figure S18C,D). In HUH‐6, the expression of POU5F1/ACTB was also lower in the siASCL2 group than in the siNC group (mean [SD] 12.2 [3.7] vs. 14.2 [4.9], P = 0.55, n = 4; Figure S18E), although the difference was not statistically significant. There was no significant difference between the siASCL2 and siNC groups in terms of SOX9, ZEB1, and MYC expression (SOX9/ACTB, ZEB1/ACTB, and MYC/ACTB, mean [SD] 0.94 [0.04] vs. 0.96 [0.04], 0.085 [0.041] vs. 0.081 [0.032], and 1.56 [0.07] vs. 1.43 [0.09]; P = 0.59, 0.90, and 0.054, respectively, n = 4; Figure S18F–H).
4. DISCUSSION
In HepG2 cells, increased ASCL2 expression was found to promote malignant phenotypes, including growth, mobility, and stemness (Figure S19). MTT and colony‐formation assays were conducted to evaluate cell growth, and they showed that ASCL2 expression increased the growth of HepG2 cells while the knockdown decreased the growth of HepG2 and HUH‐6 cells. Indeed, the expression of CCND1 and MYC, Wnt signaling pathway target genes 3 , 20 increased in HepG2 cells after ASCL2 induction and prior to the upregulation of cell growth and viability, suggesting that ASCL2 promotes growth by upregulating CCND1 and MYC through Wnt signal amplification in HB. Consistent with our results, previous reports on colon cancer (CC) have suggested that ASCL2 increases cell viability and colony‐formation ability. 4 , 5 One possible explanation for the decrease in CCND1 and MYC expression from day 4 is that ASCL2 is also involved in negative feedback for the Wnt signaling pathway. 3 , 21 , 22
In the migration and invasion assays, ASCL2 expression increased the mobility of HepG2 cells while the knockdown decreased the mobility of HepG2 and HUH‐6 cells. The increased ratio of SNAI1, TWIST1, and ZEB1 (EMT markers) in comparison to CDH1 (MET marker) 16 in HepG2 cells after ASCL2 induction may increase cell migration and invasion by promoting EMT. The results of this study are consistent with those of previous studies on CC and gastric cancer, which suggest that ASCL2 increases cell mobility. 5 , 6 , 7 Furthermore, previous studies have reported that the expression of the EMT‐related genes SNAI1, TWIST1, and ZEB1 fluctuates with the expression of ASCL2. 5 , 7 Similarly, with HB, ASCL2 is highly expressed, indicating that EMT‐related genes may also be highly expressed, which may subsequently promote EMT and the progression of HB. 2
The sphere‐formation assays showed that ASCL2 expression increased the stemness of HepG2 cells while the knockdown decreased stemness. These results are consistent with those of previous studies, which suggest that ASCL2 increases the sphere‐forming abilities of CC and esophageal cancer cells. 8 , 9 , 10 Indeed, the expression of the stemness‐related genes KLF4, POU5F1, and SOX9 increased in HepG2 cells after ASCL2 induction, suggesting that ASCL2 may be an upstream regulator of stemness‐related genes and play a role in increasing the stemness of HB. Consistent with our results for stemness‐related gene expression, previous studies have reported that ASCL2 regulates stemness‐related genes. 3 , 9 , 10 Interestingly, in our study, POU5F1 and SOX9 expression increased from day 1 and KLF4 expression increased only on day 5, which suggests the existence of different regulation mechanisms for ASCL2 target genes.
In the colony‐formation assays using 5‐aza‐dC, ASCL2 expression inhibited the decrease in colony number, suggesting that a combination of DNA demethylation and ASCL2 expression is involved in the aggressive malignant phenotypes of HB. The influence of epigenomic status and ASCL2 expression differs with cancer type. Methylation profiling of 100 and 114 gastric cancers showed that the demethylation of ASCL2 resulted in its upregulation; however, whether the specific hypomethylation was maintained and allowed the sites to bind ASCL2 was not investigated. 23 , 24 Methylation profiling of 90 CCs showed that promoter methylation of the Wnt target genes including ASCL2 was a predictor for recurrence. 25
Our previous study hypothesized that the “cell of origin in HB” is derived from ASCL2‐positive premature hepatoblasts. 2 The results from this study show that cell growth and stemness are increased when ASCL2 induces the expression of proliferation‐ and stemness‐related genes, and ASCL2‐positive premature hepatoblasts may have high proliferative potential and stemness, similar to intestinal epithelial cells (Figure S19). 2 , 3 Hepatoblasts and intestinal epithelial cells are similarly derived from the endoderm. The results of this study further support the hypothesis from our previous study. Additionally, gene expression and array‐based comparative genomic hybridization analysis of HB in 85 patients identified two subclasses, one of which was as a highly proliferating immature subclass typified by upregulated MYC and stemness‐related genes (C2 type). 26 ASCL2 regulation of these genes 3 , 9 , 10 indicates that it may be involved in this subclass 26 and in the “cell of origin in HB”. In addition, comprehensive transcriptomic characterization of HB in 113 patients using high‐throughput technologies identified a new hallmark of HB, the overexpression of 14q32 genes. 27 Previous studies have shown that the 14q32 region has a key role in human development and cancer, 28 , 29 and a study of fetal liver samples indicated elevated gene expression, 26 reinforcing the idea that HB recapitulates the pathological and molecular features of the developing liver. 26 , 30 The expression of MEG3 in the region was increased in HepG2 cells after ASCL2 induction, and ASCL2 may thus be involved in the expression of the long non‐coding RNA MEG3 (a 14q32 gene), an epigenetic regulation via the RNA, and in the “cell of origin in HB” that may recapitulate the features of developing livers.
When compared with cell lines other than the endoderm‐derived cells, ASCL2 reportedly influences the malignant potential of breast cancer and Merkel cell carcinoma cell lines, which are ectoderm‐derived cells. 31 , 32 Consistent with our results, these reports suggest that the upregulation of ASCL2 promotes the proliferation, migration, and invasion of breast cancer cells, 31 while its downregulation reduces the growth of Merkel cell carcinoma cells. 32
In conclusion, the results of this study suggest that ASCL2 induces the malignant phenotypes of HB, such as growth, mobility, and stemness. To the best of our knowledge, this is the first study to elucidate the relationship between ASCL2 expression and the malignant potential in HB. Our results indicate that ASCL2 is a key factor in the induction of aggressive malignant phenotypes in patients with HB. However, our experiments were limited to in vitro studies. In the future, both in vitro and in vivo studies will be required to confirm our results. Furthermore, although we observed changes in both colony and sphere size as well as cell shape, such as with invadopodia, we did not perform a morphological analysis of the changes. Further investigations will therefore be required to confirm these results. Taken together, this study presents an improved understanding of the detailed role of ASCL2, and this may lead to the discovery of new therapeutic targets for HB.
AUTHOR CONTRIBUTIONS
Yutaka Kato: Conceptualization; data curation; formal analysis; investigation; methodology; project administration; resources; software; validation; visualization; writing – original draft; writing – review and editing. Takahiro Fukazawa: Conceptualization; data curation; formal analysis; funding acquisition; investigation; methodology; project administration; resources; software; validation; writing – review and editing. Keiji Tanimoto: Funding acquisition; methodology; resources; software; supervision. Masami Kanawa: Resources; supervision. Masato Kojima: Resources; writing – review and editing. Isamu Saeki: Resources; writing – review and editing. Sho Kurihara: Resources; writing – review and editing. Ryo Touge: Resources; writing – review and editing. Nobuyuki Hirohashi: Resources; software; supervision. Satoshi Okada: Resources; supervision; writing – review and editing. Eiso Hiyama: Funding acquisition; project administration; resources; software; supervision; writing – review and editing.
FUNDING INFORMATION
This research was partially supported by JSPS KAKENHI (grant numbers JP20K08927, JP22H031315, and JP22KK0133) and by the Japan Agency for Medical Research and Development (AMED; grant numbers JP22ck0106609 and JP22am221403).
CONFLICT OF INTEREST STATEMENT
The authors have no conflicts of interest to declare.
ETHICS STATEMENT
Approval of the research protocol by an Institutional Reviewer Board: N/A.
Informed Consent: N/A.
Registry and the Registration No. of the study/trial: N/A.
Animal Studies: N/A.
Supporting information
Figures S1–S19.
Table S1.
Table S2.
ACKNOWLEDGMENTS
We thank Mrs. Yoko Hayashi, Mrs. Shoko Hirano, Dr. Takanori Harada, Dr. Masataka Tsuge, Ms. Chiyo Oda, and Mr. Kengo Mekata at Hiroshima University for their technical support. Part of this study was conducted at the Analysis Center of Life Science, Natural Science Center for Basic Research and Development, Hiroshima University.
Kato Y, Fukazawa T, Tanimoto K, et al. Achaete‐scute family bHLH transcription factor 2 activation promotes hepatoblastoma progression. Cancer Sci. 2024;115:847‐858. doi: 10.1111/cas.16051
DATA AVAILABILITY STATEMENT
All materials used in this study, as well as the data sets and analyses, are available from the Natural Science Center for Basic Research and Development, Hiroshima University, and can be provided upon reasonable request to the corresponding author.
REFERENCES
- 1. Little MH, Thomson DB, Hayward NK, Smith PJ. Loss of alleles on the short arm of chromosome 11 in a hepatoblastoma from a child with Beckwith‐Wiedemann syndrome. Hum Genet. 1988;79(2):186‐189. doi: 10.1007/BF00280564 [DOI] [PubMed] [Google Scholar]
- 2. Nagae G, Yamamoto S, Fujita M, et al. Genetic and epigenetic basis of hepatoblastoma diversity. Nat Commun. 2021;12(1):5423. doi: 10.1038/s41467-021-25430-9 [DOI] [PMC free article] [PubMed] [Google Scholar]
- 3. Schuijers J, Junker JP, Mokry M, et al. Ascl2 acts as an R‐spondin/Wnt‐responsive switch to control stemness in intestinal crypts. Cell Stem Cell. 2015;16(2):158‐170. doi: 10.1016/j.stem.2014.12.006 [DOI] [PubMed] [Google Scholar]
- 4. Giakountis A, Moulos P, Zarkou V, et al. A positive regulatory loop between a wnt‐regulated non‐coding RNA and ASCL2 controls intestinal stem cell fate. Cell Rep. 2016;15(12):2588‐2596. doi: 10.1016/j.celrep.2016.05.038 [DOI] [PubMed] [Google Scholar]
- 5. Tian Y, Pan Q, Shang Y, et al. MicroRNA‐200 (miR‐200) cluster regulation by achaete scute‐like 2 (Ascl2): impact on the epithelial‐mesenchymal transition in colon cancer cells. J Biol Chem. 2014;289(52):36101‐36115. doi: 10.1074/jbc.M114.598383 [DOI] [PMC free article] [PubMed] [Google Scholar]
- 6. Shang Y, Chen H, Ye J, Wei X, Liu S, Wang R. HIF‐1α/Ascl2/miR‐200b regulatory feedback circuit modulated the epithelial‐mesenchymal transition (EMT) in colorectal cancer cells. Exp Cell Res. 2017;360(2):243‐256. doi: 10.1016/j.yexcr.2017.09.014 [DOI] [PubMed] [Google Scholar]
- 7. Zuo Q, Wang J, Chen C, et al. ASCL2 expression contributes to gastric tumor migration and invasion by downregulating miR223 and inducing EMT. Mol Med Rep. 2018;18(4):3751‐3759. doi: 10.3892/mmr.2018.9363 [DOI] [PMC free article] [PubMed] [Google Scholar]
- 8. Zhao R, Quaroni L, Casson AG. Identification and characterization of stemlike cells in human esophageal adenocarcinoma and normal epithelial cell lines. J Thorac Cardiovasc Surg. 2012;144(5):1192‐1199. doi: 10.1016/j.jtcvs.2012.08.008 [DOI] [PubMed] [Google Scholar]
- 9. Wei X, Ye J, Shang Y, et al. Ascl2 activation by YAP1/KLF5 ensures the self‐renewability of colon cancer progenitor cells. Oncotarget. 2017;8(65):109301‐109318. doi: 10.18632/oncotarget.22673 [DOI] [PMC free article] [PubMed] [Google Scholar]
- 10. Ye J, Liu S, Shang Y, Chen H, Wang R. R‐spondin1/Wnt‐enhanced Ascl2 autoregulation controls the self‐renewal of colorectal cancer progenitor cells. Cell Cycle. 2018;17(8):1014‐1025. doi: 10.1080/15384101.2018.1469874 [DOI] [PMC free article] [PubMed] [Google Scholar]
- 11. Jubb AM, Chalasani S, Frantz GD, et al. Achaete‐scute like 2 (ascl2) is a target of Wnt signalling and is upregulated in intestinal neoplasia. Oncogene. 2006;25:3445‐3457. doi: 10.1038/sj.onc.1209382 [DOI] [PubMed] [Google Scholar]
- 12. Yuan YF, Wang JP, Li JQ, et al. Frequent epigenetic inactivation of spleen tyrosine kinase gene in human hepatocellular carcinoma. Clin Cancer Res. 2006;12(22):6687‐6695. doi: 10.1158/1078-0432.CCR-06-0921 [DOI] [PMC free article] [PubMed] [Google Scholar]
- 13. Tao SF, Zhang CS, Guo XL, et al. Anti‐tumor effect of 5‐aza‐2'‐deoxycytidine by inhibiting telomerase activity in hepatocellular carcinoma cells. World J Gastroenterol. 2012;18(19):2334‐2343. doi: 10.3748/wjg.v18.i19.2334 [DOI] [PMC free article] [PubMed] [Google Scholar]
- 14. Kanda T, Tada M, Imazeki F, Yokosuka O, Nagao K, Saisho H. 5‐aza‐2′‐deoxycytidine sensitizes hepatoma and pancreatic cancer cell lines. Oncol Rep. 2005;14(4):975‐979. doi: 10.3892/or.14.4.975 [DOI] [PubMed] [Google Scholar]
- 15. Fukazawa T, Tanimoto K, Shrestha L, et al. Simulated microgravity enhances CDDP‐induced apoptosis signal via p53‐independent mechanisms in cancer cells. PLOS ONE. 2019;14(7):e0219363. doi: 10.1371/journal.pone.0219363 [DOI] [PMC free article] [PubMed] [Google Scholar]
- 16. Tanabe S, Aoyagi K, Yokozaki H, Sasaki H. Gene expression signatures for identifying diffuse‐type gastric cancer associated with epithelial‐mesenchymal transition. Int J Oncol. 2014;44(6):1955‐1970. doi: 10.3892/ijo.2014.2387 [DOI] [PubMed] [Google Scholar]
- 17. Kallio PJ, Pongratz I, Gradin K, McGuire J, Poellinger L. Activation of hypoxia‐inducible factor 1α: posttranscriptional regulation and conformational change by recruitment of the Arnt transcription factor. Proc Natl Acad Sci USA. 1997;94(11):5667‐5672. doi: 10.1073/pnas.94.11.5667 [DOI] [PMC free article] [PubMed] [Google Scholar]
- 18. Buachan P, Chularojmontri L, Wattanapitayakul SK. Selected activities of Citrus maxima Merr. Fruits on human endothelial cells: enhancing cell migration and delaying cellular aging. Nutrients. 2014;6(4):1618‐1634. doi: 10.3390/nu6041618 [DOI] [PMC free article] [PubMed] [Google Scholar]
- 19. Nafie E, Lolarga J, Lam B, et al. Harmine inhibits breast cancer cell migration and invasion by inducing the degradation of Twist1. PLOS ONE. 2021;16(2):e0247652. doi: 10.1371/journal.pone.0247652 [DOI] [PMC free article] [PubMed] [Google Scholar]
- 20. Gödeke J, Maier S, Eichenmüller M, Müller‐Höcker J, von Schweinitz D, Kappler R. Epigallocatechin‐3‐gallate inhibits hepatoblastoma growth by reactivating the Wnt inhibitor SFRP1. Nutr Cancer. 2013;65(8):1200‐1207. doi: 10.1080/01635581.2013.828085 [DOI] [PubMed] [Google Scholar]
- 21. Barker N, Tan S, Clevers H. Lgr proteins in epithelial stem cell biology. Development. 2013;140(12):2484‐2494. doi: 10.1242/dev.083113 [DOI] [PubMed] [Google Scholar]
- 22. Wieck MM, Schlieve CR, Thornton ME, et al. Prolonged absence of mechanoluminal stimulation in human intestine alters the transcriptome and intestinal stem cell niche. Cell Mol Gastroenterol Hepatol. 2017;3(3):367‐388.e1. doi: 10.1016/j.jcmgh.2016.12.008 [DOI] [PMC free article] [PubMed] [Google Scholar]
- 23. Wang K, Yuen ST, Xu J, et al. Whole‐genome sequencing and comprehensive molecular profiling identify new driver mutations in gastric cancer. Nat Genet. 2014;46(6):573‐582. doi: 10.1038/ng.2983 [DOI] [PubMed] [Google Scholar]
- 24. Kwon OH, Park JL, Baek SJ, et al. Aberrant upregulation of ASCL2 by promoter demethylation promotes the growth and resistance to 5‐fluorouracil of gastric cancer cells. Cancer Sci. 2013;104:391‐397. doi: 10.1111/cas.12076 [DOI] [PMC free article] [PubMed] [Google Scholar]
- 25. de Sousa EMF, Colak S, Buikhuisen J, et al. Methylation of cancer‐stem‐cell‐associated Wnt target genes predicts poor prognosis in colorectal cancer patients. Cell Stem Cell. 2011;9:476‐485. doi: 10.1016/j.stem.2011.10.008 [DOI] [PubMed] [Google Scholar]
- 26. Cairo S, Armengol C, De Reyniès A, et al. Hepatic stem‐like phenotype and interplay of Wnt/beta‐catenin and Myc signaling in aggressive childhood liver cancer. Cancer Cell. 2008;14(6):471‐484. doi: 10.1016/j.ccr.2008.11.002 [DOI] [PubMed] [Google Scholar]
- 27. Carrillo‐Reixach J, Torrens L, Simon‐Coma M, et al. Epigenetic footprint enables molecular risk stratification of hepatoblastoma with clinical implications. J Hepatol. 2020;73(2):328‐341. doi: 10.1016/j.jhep.2020.03.025 [DOI] [PMC free article] [PubMed] [Google Scholar]
- 28. Da Rocha ST, Edwards CA, Ito M, Ogata T, Ferguson‐Smith AC. Genomic imprinting at the mammalian Dlk1‐Dio3 domain. Trends Genet. 2008;24(6):306‐316. doi: 10.1016/j.tig.2008.03.011 [DOI] [PubMed] [Google Scholar]
- 29. Benetatos L, Hatzimichael E, Londin E, et al. The microRNAs within the DLK1‐DIO3 genomic region: involvement in disease pathogenesis. Cell Mol Life Sci. 2013;70(5):795‐814. doi: 10.1007/s00018-012-1080-8 [DOI] [PMC free article] [PubMed] [Google Scholar]
- 30. Zimmermann A. The emerging family of hepatoblastoma tumours: from ontogenesis to oncogenesis. Eur J Cancer. 2005;41(11):1503‐1514. doi: 10.1016/j.ejca.2005.02.035 [DOI] [PubMed] [Google Scholar]
- 31. Han S, Jin X, Hu T, Chi F. ARHGAP25 suppresses the development of breast cancer by an ARHGAP25/Wnt/ASCL2 feedback loop. Carcinogenesis. 2023;44(5):369‐382. doi: 10.1093/carcin/bgad042 [DOI] [PubMed] [Google Scholar]
- 32. Park DE, Cheng J, McGrath JP, et al. Merkel cell polyomavirus activates LSD1‐mediated blockade of non‐canonical BAF to regulate transformation and tumorigenesis. Nat Cell Biol. 2020;22(5):603‐615. doi: 10.1038/s41556-020-0503-2 [DOI] [PMC free article] [PubMed] [Google Scholar]
Associated Data
This section collects any data citations, data availability statements, or supplementary materials included in this article.
Supplementary Materials
Figures S1–S19.
Table S1.
Table S2.
Data Availability Statement
All materials used in this study, as well as the data sets and analyses, are available from the Natural Science Center for Basic Research and Development, Hiroshima University, and can be provided upon reasonable request to the corresponding author.