

Summary
Protein translational control is critical for ensuring that the fetus develops correctly and that necessary organs and tissues are formed and functional. We developed an in utero method to quantify tissue-specific protein dynamics by monitoring amino acid incorporation into the proteome after pulse injection. Fetuses of pregnant mice were injected with isotopically labeled lysine and arginine via the vitelline vein at various embyonic days, and organs and tissues were harvested. By analyzing the nascent proteome, unique signatures of each tissue were identified by hierarchical clustering. In addition, the quantified proteome-wide turnover rates were calculated between 3.81E−5 and 0.424 h−1. We observed similar protein turnover profiles for analyzed organs (e.g., liver vs. brain); however, their distributions of turnover rates vary significantly. The translational kinetic profiles of developing organs displayed differentially expressed protein pathways and synthesis rates, which correlated with known physiological changes during mouse development.
Keywords: fetal development, in utero injection, proteomics, protein turnover, pulse labeling
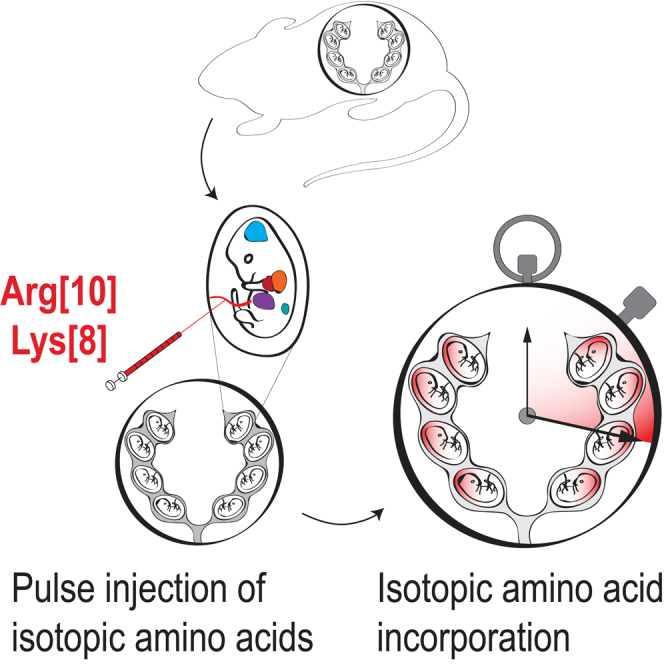
Graphical abstract
Highlights
-
•
We report an in utero amino acid pulse injection method
-
•
This method can be used to study protein turnover in fetal development
-
•
Tissue-specific protein dynamics can be studied for the nascent proteome
-
•
Protein turnover can be monitored at various gestational stages
Motivation
Protein translational control is a highly regulated step in the gene expression program during mammalian development; however, quantitative techniques to monitor protein synthesis rates in a developing fetus (in utero) are limited. Here, we developed an in utero stable isotope labeling approach to quantify tissue-specific protein dynamics of the nascent proteome during mouse fetal development.
Baeza et al. report an in utero method to monitor amino acid incorporation into the proteome after pulse injection. This method enables quantification of the nascent proteome during various gestational stages in a tissue-specific manner and provides insights into fetal proteome turnover.
Introduction
During development before birth, multicellular, complex organisms differentiate into many different cell types from a single zygote in a highly ordered and reproducible manner. Precise spatial and temporal regulation of the gene expression program is critical for normal development.1 Protein biosynthesis, the translation of mRNA into protein, is an essential step in gene expression and has the highest energy demand in the cell.2,3
The translational machinery, originally considered a “housekeeping” function, has emerged as a highly regulated and dynamic process in gene expression. Translational regulation allows for more rapid changes in the proteome, allowing cells to respond to external stimuli,4,5 differentiate,6,7 and maintain homeostasis.6,7,8 Recently, translational regulation, for global and specific mRNA transcripts, has been described as a regulatory mechanism in itself.9 For example, stem cells maintain a low basal translational output including hematopoietic stem cells,10 neural stem cells,11 muscle stem cells,12 epidermal stem cells,13 and Drosophila germline stem cells.14 Consequently, dysregulation of translational control, through pharmacological or genetic means, leads to impaired stem cell function. Therefore, understanding the mechanisms of translational control regulating cell function and animal development requires quantification of protein turnover in vivo.
Proteins are in a dynamic state of equilibrium, continuously being synthesized and degraded.15 Protein turnover is the combined action of protein synthesis and degradation and is responsible for establishing and modulating protein abundance levels in cells.5 Protein half-lives are linked to protein function and display a wide range: from minutes (∼20 min for p53 in humans)16 to an organism’s entire lifetime (>70 years for the eye lens crystallin in humans).17 Despite its importance in cell function and differentiation,6 protein turnover has not been systematically investigated in the context of fetal development.
Quantification of in vivo mammalian protein turnover requires the introduction of stable-isotope-labeled amino acids, usually through the diet.18,19 The time needed to quantify protein turnover rates requires weeks of isotope labeling, which is outside the scope needed to capture changes in protein synthesis during murine development as well as in other animals with short gestation periods. Additionally, isotopic labeling via the diet is somewhat expensive due to having to label the animal for long periods (e.g., weeks). In this study, we developed a pulse injection method to label proteins in the developing fetus at defined gestational periods. Unique protein turnover rates were determined at various days of gestation, providing a high temporal resolution of turnover rates in the developing mouse. Our approach utilizes a direct injection of stable isotope-labeled amino acids into the fetal circulation, which are taken up by tissues and utilized for protein synthesis. Nano-liquid chromatography tandem mass spectrometry (nLC-MS/MS) analysis of the liver, heart, and lungs from pulse-injected fetuses quantifies the nascent and pre-existing proteome of the developing organs. The small size of the fetus allows the injectate to be maximized for proteome incorporation. By sampling organs at defined time intervals after the injection, we showed that protein turnover rates could be quantified and that changes in the synthesized proteins correlate with known physiologic changes in the fetal liver during mouse development.
Results
Pulse injection for in utero labeling
We sought to evaluate the nascent proteome in the fetus and changes to the proteome, including protein turnover rates, in the context of normal ontologic changes during fetal development. As such, we developed a method, in the murine model, of direct fetal intravascular injection of labeled amino acids to exclude the requirement of maternal-fetal transfer of maternally fed or injected labeled amino acids and to precisely time the exposure of the fetus to the labeled amino acids with subsequent downstream analyses. To label the nascent proteome in utero, fetal mice are pulse injected via the vitelline vein with a bolus of isotopic amino acids (Lys8: 13C615N2, Arg10: 13C615N4).20,21 The vitelline vein, which runs along the uterine wall, drains directly into hepatic portal circulation, resulting in a first-pass effect on the fetal liver. The injected labeled amino acids are taken up by the developing organs and used by the translational machinery for protein synthesis. The incorporation of heavy-isotope-labeled amino acids into the proteome can then be quantified by high-resolution mass spectrometry (Figure 1).
Figure 1.

Pulse injection method for in utero protein labeling
Time-dated pregnant mouse undergoes laparotomy under isoflurane anesthesia to expose the uterine horns. 10 μmol stable-isotope-labeled L-lysine and L-arginine in sterile PBS was injected into each fetus through the uterine wall via the vitelline vein. After injection, the fetuses were returned to the peritoneal cavity, and the surgical incision was sutured. Pregnant dams recover after 15–20 min under a heat lamp. Labeled amino acids circulate throughout the fetus and are transported to developing organs to be used for protein synthesis. At specific time points after amino acid injection, fetal tissue is harvested and analyzed by high-resolution mass spectrometry (MS).
To determine the extent of incorporation of the exogenous amino acids into the proteome, embryonic day (E) 14.5 fetal mice (normal gestation is 20 days) were pulse injected with isotopic amino acids, and organs were harvested (liver, heart, and lung) 16 h post-injection and analyzed by high-resolution mass spectrometry-based proteomics (Figures 2A and 2B; Data S1). The mean incorporation rate (heavy fractional abundance) into all organs analyzed was 17.50% ± 0.6% (median incorporation 8.6% ± 1.2%; Figure 2C). We observed very high reproducibility across different organs and pulse injection replicates (Figure 2D). Light (non-isotopic, endogenous) and heavy labeled peptides showed the highest correlations when comparing pulse injection replicates of the same organ (Pearson correlation coefficient > 0.95). Measurement variability of light and heavy peptide abundances was low, with the median coefficients of variation values at 13.80% and 21.97%, respectively (Figure S1A). Principal-component analysis (PCA) performed on the peptide features identified distinct groups for the light and heavy proteomes, which were also grouped by tissue. The first principal component represents the pre-existing (light) and nascent (heavy) proteomes, while the second principal component represents different tissues (Figure 2E). The nascent proteome was approximately an order of magnitude lower than the pre-existing proteome (Figure 2B). We compared the abundance distribution of the nascent proteome and found it to be a subset of the most abundant peptides present in the total proteome sample (Figure 2F). From these data, we determined that a 16 h labeling period is sufficient to label the distinct tissue proteomes and a subset of proteins being actively synthesized in different organs of a developing mouse fetus.
Figure 2.

Method development of pulse injection for fetal labeling
(A) Experimental design for in utero labeling. Fetuses from E14.5 pregnant mice are pulse injected. Heart, liver, and lung tissues are harvested 16 h later and analyzed by mass spectrometry.
(B) Representative MS1 spectra showing heavy amino acid incorporation. The percentage of incorporation is calculated as the fraction of heavy precursor over the total precursor pool (heavy + light).
(C) Incorporation of heavy labeled amino acids into the proteome of heart, liver, and lung tissues using four biological replicates. The median and mean incorporation are 8.6% ± 1.2% and 17.5% ± 0.6%, respectively.
(D) Heatmap showing the Pearson correlation of the light and heavy precursors across the tissues analyzed. Inset: scatterplots of light and heavy peptides show high reproducibility between biological samples.
(E) Principal-component analysis (PCA) of the light and heavy precursors.
(F) Distribution of peptide abundances in log2 showing the subset of nascent peptides (heavy-isotope labeled).
We next examined whether pulse injection of heavy amino acids followed by different labeling periods would result in the quantification of the nascent proteome. For this, E14.5 fetuses were pulse injected with labeled amino acids, and the heart and liver were harvested for proteomic analysis at 8, 24, and 48 h post-injection (Figure S2A). Hierarchical clustering of the nascent proteome identified a unique signature for each tissue (Figure S2B). Gene Ontology (GO) analysis of the enriched clusters shows enrichment of terms associated with “development” for the heart, while the liver shows GO term enrichment associated with “translation.” These results are in line with the function of these organs at this stage of development. At gestational age E14.5–E16, the liver is the major site of hematopoiesis and, among other functions, supports hematopoietic stem cell development and differentiation including cells responsible for hemoglobin synthesis,22 while the heart completes the development of the atrial septation.23
The incorporation of heavy amino acids into the proteome at 8, 24, and 48 h showed similar distribution profiles as the 16 h labeling period (Figures 2C and S2). However, the similar incorporation profiles may not reflect differences in individual proteins’ heavy abundances across different labeling periods. To test this hypothesis, we performed a statistical analysis on the nascent proteome to compare the abundances across the different labeling periods (Figure S2D). An enrichment of GO terms associated with protein localization to telomere, protein localization to chromosome, sperm-egg interactions, and cell-cell recognition was observed in the liver, while the heart showed enrichment in GO terms associated with sperm-egg interaction, cell-cell recognition, generation precursor metabolites, and translation (Figure S2E). Most of these GO terms are associated with development. The results demonstrate that the proteome of fetal organs can be labeled in utero with isotopic amino acids to distinguish between the nascent and pre-existing proteome and that this approach can quantify changes in the nascent proteome using varying labeling periods. However, using these labeling periods, the quantification of the nascent proteome (heavy) represents the cumulative effects of multiple cellular processes such as translation, degradation, secretion, and even cell division. Disruption of any of these processes (e.g., proteasome inhibition) would affect the observed labeling efficiency. To quantify protein turnover rates, shorter labeling periods would be required.
Quantifying protein turnover rates in utero
To understand how changes in protein turnover regulate normal tissue development and homeostasis, it is important to quantify proteome-wide protein turnover rates in utero.9 To demonstrate the ability to quantify turnover rates, we utilized short labeling periods (1, 2, 4, and 6 h) and analyzed two representative tissues, the liver as the first receptor organ of injected amino acids and the brain as an organ at the downstream of blood circulation (Figure 3A). In this experimental design, injection of the labeled amino acids corresponds to a quick pulse followed by the chase with endogenous amino acids, which are sourced by the maternal diet. The distribution of heavy (isotopically labeled) fractional abundance (H/(H + L)) increases with the labeling period (Figures S3A and S3B). The PCA also revealed a natural progression of the heavy-isotope-labeled proteome during the time course for each tissue (Figure 3B). Turnover rates were determined by fitting the heavy fractional abundance of each peptide to an exponential decay model,24,25,26,27,28,29 which quantified turnover rates (kobs). As an example, we show the turnover rates of the 40S ribosomal protein S12 (RPS12) to be 0.0804 and 0.227 h−1 in the liver and brain, respectively (Figures 3C and 3D). The quantified proteome-wide turnover rates (kobs) ranged between 3.81E−5 and 0.424 h−1, which equates to half-lives ranging between 1.6 h and >500 days. Proteins displaying extremely long half-lives include histones, which are known to be long-lived proteins.30
Figure 3.

Quantifying in utero protein turnover by pulse injection
(A) Experimental design for quantifying protein turnover. Fetuses from E14.5 pregnant mice are pulse injected with labeled amino acids. Fetal liver and brain are harvested from different pregnant mice at 1, 2, 4, and 6 h after injection and analyzed by mass spectrometry.
(B) PCA for the heavy peptides from brain and liver tissues at 4 time points are shown.
(C) Modeling the heavy peptide fraction as a function of time using a non-linear pulse-chase turnover model. The data are from the 40S ribosomal protein S12 (RPS12), and the p values of the model fits are shown.
(D) Turnover rate profile across the proteome of brain and liver tissues.
(E) Spearman correlation of turnover rates between brain and liver tissues. Peptides corresponding to ribosome, histone, and hemoglobin proteins are colored.
(F) Distribution of log10-transformed turnover rates grouped by cellular compartment. Cellular localization was performed in Proteome Discoverer 2.2, and each data point corresponds to a single peptide turnover rate. Analysis of variance (ANOVA) followed by Benjamini-Hochberg correction was used to compare turnover rate distribution between cellular compartments and all rates (vs. All Rates), cytosol (vs. Cytosol), and mitochondria (vs. Mito).
We also quantified the labeling kinetics of the precursor amino acid pool. For this, we measured the fractional abundance of the heavy amino acid pool and fit the data to an exponential decay model as a function of labeling time. To monitor the amino acid precursors, we used peptides with two lysines or two arginines and performed mass isotopomer distribution analysis (MIDA) to determine the distribution of the heavy amino acid pool18,31,32,33 (Figure S3C). The median fractional abundance of each sample was used to fit the exponential decay model (Figure S3D). Based on this analysis, the half-lives of the amino acid pools in the brain and liver are 6.1 and 5.5 h, respectively, which are within the labeling period of the experiment.
Next, we compared protein turnover rates for the liver and brain and observed similar profiles for these tissues (Figure 3D). In this analysis, each line represents a single model fit, which represents all of the time points and replicates. We then compared the distribution of turnover rates between the liver and brain and found a significant difference between the two profiles. This difference is mediated by a different distribution of proteins with low turnover rates (Figure S3E). Synthesis rates between the brain and liver displayed a moderate correlation (p = 0.6258) (Figure 3E; Data S2 and S3), however, distinct protein families showed higher rates in different tissues. For example, hemoglobin and histone proteins had a higher turnover rate in the liver, highlighting the differences in tissue function at the E14.5 stage of development. Specifically, the fetal liver is the predominant site of hematopoiesis at E14.5, at which time hematopoietic cells are undergoing rapid expansion.34,35 To identify proteins with significant changes in turnover rate between the liver and brain, we performed a Mann-Whitney test followed by correction for multiple hypothesis testing. Proteins with a higher turnover rate in the liver included alpha-fetoprotein, lamin-B1, pyruvate kinase PKM, and hemoglobin β1. Proteins with a higher turnover rate in the brain included leucine-tRNA synthetase, ribosome binding protein 1, adenosylhomocysteinase, and the E3 ubiquitin ligase NEDD4 (Figure S3F). We also identified protein abundance to be negatively correlated with the turnover rate (Figure S3G). This observation has been reported previously18 and suggests that the cell is balancing energetic costs and protein turnover.
Differences in subcellular turnover rates were also observed. For this analysis, we categorized proteins based on known subcellular location and compared turnover rates between the various subcellular regions (Figure 3F). Ribosomal proteins had significantly lower turnover rates in the liver and brain. Proteins residing in the Golgi and cell surface also displayed significant differences when compared to other cellular regions. Proteins that are annotated as “nucleus,” “membrane,” and “cytoplasm” displayed a uniform distribution. Taken together, this method can be used to quantify in utero turnover rates using labeling periods as short as 1 to 6 h. This labeling period is within the period of cell division; therefore, cell growth is not a major confounder of the turnover rate measurement.
Quantifying turnover rates across fetal development
We next sought to understand how protein turnover rates change across fetal development stages by investigating two different organs, the liver as an early-developing organ and the lung as a late-stage-developing organ. To do this, we pulse injected fetal or neonatal mice via the vitelline vein or facial vein,36 respectively, with heavy labeled amino acids (Lys8 and Arg10) at E13.5, E14.5, E16.5, and postnatal day 0 (P0). Livers and lungs from injected mice were harvested at 2, 4, and 6 h post-injection to provide respective labeling time points for analysis (Figures 4A and S4A). To compare between the different organs, labeling time points, and developmental stages at the time of injection, we included a pooled liver reference sample as a standard to run with each sample batch. We also included a pooled lung reference sample, which was only analyzed with the lung samples. The pooled liver-std reference sample was used to harmonize the datasets between liver and lung samples using a single-point calibration method (Figure 4B).37 To validate the data harmonization, we used a uniform manifold approximation and projection (UMAP) for dimensionality reduction and visualization. The samples show a clear separation between the two tissues as well as by developmental stages (Figure 4C; Data S4). Additionally, the pooled reference samples cluster with their respective tissue. Another layer of validation is to identify proteins with known biological functions at defined gestational periods in development. The liver is the predominant site of hematopoiesis at E14.5, producing cells that constitute the lymphohematopoietic system including the erythroid lineage.34 Therefore, we quantified the turnover rates of hemoglobin proteins in the liver and noted that hemoglobin α and β subunits displayed peak turnover rates at E14.5, with the rate decreasing at later gestational ages (Figures 4D and S4C; Data S3).
Figure 4.

Quantifying in utero protein turnover across mouse fetal development
(A) Experimental design for quantifying protein turnover. Fetuses from E13.5, E14.5, and E16.5 are pulse injected with labeled amino acids. P0 mice are pulse injected through the retro-orbital vein.36 Fetal liver and lung tissues are harvested from different pregnant mice at 2, 4, and 6 h post-injection and analyzed by mass spectrometry.
(B) Distribution of batch-corrected and normalized log2-transformed peptide abundances. MS runs were batch corrected using a common standard protein sample that was processed with every batch.
(C) UMAP dimensionality reduction of the liver and lung proteomes from all time points.
(D) Turnover rates of hemoglobin proteins in the liver at different gestational ages.
(E and F) Quantified peptide turnover rates for different proteins at defined gestational stages from the liver and lung, respectively.
Gene expression requires many regulatory layers to convert the genetic information found in DNA to phenotype. Emerging evidence has linked ribosome heterogeneity to gene regulation.38 We sought to determine if ribosome heterogeneity and translational control might be observed with protein turnover of developing liver and lung tissues. Ribosomal proteins with quantified turnover rates were grouped based on tissue profiling (Figure 4E). We quantified translation rates for 30 ribosomal proteins during development that were common to both liver and lung tissues. Additionally, we quantified turnover rates for ribosomal proteins that were unique to each tissue with varying trends (Figures 4E and 4F). 40S RPS25 and 60S RPL10A were quantified in the liver during all developmental stages analyzed. RPS25 displayed peak levels in the liver at E14.5, while RPL10A displayed a constant rate during development. Interestingly, RPS25 and RPL10 are involved in IRES-dependent translation,39,40 suggesting that these proteins might be involved in translating distinct mRNA pools. We also quantified turnover rates for the 40S RPS24 in the lung. The turnover rate of RPS24 increased from E13.5 to E16.5 with a sudden decrease at P0. Mutations in RPS24 have been linked to Diamond-Blackfan anemia (DBA)41 (see discussion). Further studies will be needed to understand how specialized ribosomes and their turnover rates are involved in fetal development.
Discussion
In this study, we developed an approach utilizing in utero pulse injection of isotope-labeled amino acids to quantify protein turnover rates in a developing mouse fetus. Turnover rates for individual proteins represented a wide range across tissues and developmental stages. Changes in turnover rates also coincided with known physiologic functions of tissues at defined developmental stages. There are many benefits of using the in utero pulse injection method for determining turnover rates, including the following: first, stable-isotope-labeled amino acids are introduced directly into the fetal circulation, avoiding the long labeling periods required for providing labeled amino acids via the diet.18 The time required to label a mouse via the diet is usually at least a few days,26,42 which is a significant portion of time during the normal gestational development of a mouse, highlighting the inability of using this method to study fetal protein turnover rates during gestation. Secondly, the mode of injection via the vitelline vein results in the first-pass effect of the labeled amino acids in the fetal liver, with the subsequent systemic distribution of the amino acids to the rest of the fetus. This allows the dose injected into each fetus to be efficiently incorporated into the proteome. Thirdly, the amount of isotopic amino acids is minimized, therefore reducing the costs associated with each experiment. The amount of isotopic amino acids used for a 0.1 g fetal mouse43 was 10 μmol, compared to the required 3.5 g of heavy-isotope-labeled chow needed for a 20 g adult female mouse.19 Finally, the labeling period can be performed with minimal incubation time (1–6 h) to provide a high temporal resolution of protein turnover during mouse development. In the present study, we quantified turnover rates at four gestational time points of mouse fetal development.
Amino acid analogs containing an azide moiety, such as azidohomoalanine (AHA), can be incorporated into nascent proteins during translation and subsequently analyzed by mass spectrometry.44 To check whether AHA labeling is compatible with our in utero approach, we have injected AHA instead of heavy amino acids. Using our treatment method, AHA was not used for protein synthesis, and we did not observe significant proteome differences between AHA and control (no injection) in three major organs (Figure S1B). This is reasonable since natural amino acids, whenever available, will be preferably utilized for protein synthesis compared to their non-natural counterparts (e.g., AHA). AHA treatment is an attractive enrichment strategy to profile the nascent proteome and allow the quantification of low-abundant proteins. This strategy, combined with stable isotope labeling, has enabled the study of the nascent proteome.45,46 However, careful consideration must be taken when using AHA to profile the embryonic proteome because, if incorporated, the non-natural amino acid at this early stage of development has the potential to impact the proteome.47,48
Comparing the proteomes of three organs from mice that received saline treatment and control (no injection), we show that the injections themselves did not cause major expression changes during the fetal development (Figure S1C). The dose administered was the same (10 μmol) for all fetal injections, regardless of embryological age. As a result, there may be some variation in the ratio of isotopic amino acids to fetal weight. However, we observed no significant difference in the incorporation rate of the isotopic amino acids as a function of gestational age. If desired, the in utero pulse injection technique could be adapted to administer a dose that is proportional to the size of the fetus for each gestational age.
With new tools to quantify turnover dynamics of the nascent proteome in utero, fundamental questions about how changes in protein turnover regulate cell function and fetal development or cause clinical disorders can be addressed,9 which would have a broad effect on embryology and developmental biology. For example, this method could be used to study the effects on the fetal translatome from a diverse array of exposures. such as mouse models of intrauterine growth restriction, chorioamnionitis, and twin-twin transfusion syndromes. Changes in fetal protein turnover or relative protein abundances could then be used to understand phenotypic outcomes.
Ribosomopathies are characterized as disorders caused by the reduced expression of, or mutations in, ribosomal proteins or ribosome biosynthesis factors, which manifest in human disease with diverse tissue specificity.49 Because of the translational machinery’s critical role during development, ribosomopathies are classified as developmental disorders. DBA manifests with bone marrow failure and is caused by mutations in the 40S RPS1950 and RPS24,41 as well as other ribosomal proteins. The mechanism of DBA pathogenesis remains unresolved.51 Our method of quantifying in utero protein turnover rates could be applied to potentially identify targets of RPS19 or RPS24 causing DBA. Understanding the mechanisms of DBA pathogenesis can lead to better treatment options for patients.
Limitations of the study
One of the limitations of this approach is the limited dynamic range of proteins profiled due to the narrow incorporation rate of isotopic amino acids into the proteome (∼10%). For this reason, highly abundant proteins were the majority of proteins with quantified turnover rates. However, various strategies can be employed to overcome this limitation. For example, multiplexing various time points and including a “booster” channel will allow high sensitivity and accurate quantification,5 especially when combined with offline fractionation. Alternatively, high-sensitivity methods such as data-independent acquisition (DIA) can be utilized to extend the dynamic range of the proteins profiled, as we have recently shown, to quantify cellular protein turnover.52
During embryonic development, non-dividing cells of a specific organ/tissue may utilize the injected amino acids at a lower rate than dividing cells, which require free amino acids for protein synthesis. The protein turnover reported in this study focused on the overall tissue/organ level and thus does not necessarily represent the protein synthesis of dividing cells from each tissue/organ. The incorporation of the heavy amino acid in this study represents the total effect of tissue growth and protein turnover. The heavy amino acid incorporation is largely driven by growth since embryo development requires amino acids to support growth. In contrast, the adult animal models only monitor the protein turnover. We have compared our turnover data with that in a previous study in adult mice.53 Since the liver is the tissue overlapping between the two studies, it is used for comparison (Figures S3H–S3J). The fetal turnover data show a unique subgroup of proteins involved in cellular component organization, locomotion, and biological adhesion, while the adult data showed unique proteins on stimulus response, multicellular organismal process, multiorganism process, and reproductive and behavioral events.
It is reported that Arg10 can be metabolically converted to [13C5,15N1]-proline, resulting in a Δmass of 6 Da with unlabeled proline.54,55 Peptides containing such resulting proline may be subject to metabolic bias in protein turnover. Since metabolic conversion happens systematically across all the tissues, for the simplicity of the method development, we did not take such conversion into consideration during the data analysis. The half-lives of the amino acid pools from MIDA (6.1 and 5.5 h) showed a similar trend with the labeling time and measured protein turnover rates, which could result in an under-estimation of kobs due to a delay in precursor availability.
Conclusion
In this study, an in utero approach has been established to monitor the amino acid usage during various mouse fetal developmental stages. The method enables quantification of the nascent proteome in a tissue-specific manner, thus allowing for the measurements of translational protein kinetics. To the best of our knowledge, this is an unique approach that an in utero method has been developed to evaluate the protein turnover during fetal development. The pulse injection strategy of isotopic amino acids has demonstrated success in differentiating the existing vs. the newly synthesized proteomes in different organs/tissues of a developing mouse fetus. In our efforts to quantifying protein turnover rates in utero, we have obtained data to understand how these rates change across fetal development stages (e.g., E13.5, E14.5, E16.5, and P0). Having precise temporal control of fetal labeling will allow one to investigate translational control and regulation throughout fetal development. The ability to study the fetal proteome at such a level will lend insight into developmental biology and the evolution of pathologic processes.
STAR★Methods
Key resources table
| REAGENT or RESOURCE | SOURCE | IDENTIFIER |
|---|---|---|
| Chemicals | ||
| L-Lysine (13C615N2) | Silantes GmBH | 211603902 |
| L-Arginine (13C615N4) | Silantes GmBH | 201604102 |
| Experimental models: Organisms/strains | ||
| Mouse: C57BL/6J (B6) | Jackson Laboratories | Cat. No. 000664 |
| Deposited data | ||
| Raw files and search results | This paper | MassIVE repository (identifier: MSV000087342) |
| Software and algorithms | ||
| R scripts | This paper |
https://github.com/baezaj/in-utero-turnover DOI: https://zenodo.org/doi/10.5281/zenodo.10521052 |
Resource availability
Lead contact
Further information and requests for resources and reagents should be directed to and will be fulfilled by the lead contact Benjamin A Garcia (bagarcia@wustl.edu).
Materials availability
This study did not generate new unique reagents.
Data and code availability
-
•
The data used in this study can be accessed at MassIVE repository (identifier: MSV000087342).
-
•
The source code can be accessed at https://github.com/baezaj/in-utero-turnover. DOIs are provided in the key resources table.
-
•
Any additional information required to reanalyze the data reported in this paper is available from the lead contact upon request.
Experimental model and study participant details
Animals
Female C57BL/6J (B6, Jackson Cat. No. 000664) were purchased from Jackson Laboratories and a colony to produce time-dated pregnancies was maintained at our facility. Experimental protocols were approved by the Institutional Animal Care and Use Committee and followed guidelines outlined in the National Institutes of Health Guide for the Care and Use of Laboratory Animals. In this study, we used 19 individual dams, 70 individual fetus, 4 different tissues, 137 unique tissue samples, and 10 different time points. A detailed description of samples used in this work is provided in Data S3. Fetus samples for E14.5 (16 h) were from a single pregnant dam. Time-dependent (1, 2, 4 and 6 h) samples were using embryos from different litters. Samples for the same time point were from the same pregnant dam. Samples between gestational stages, embryos, pregnant females, and litters may contribute to data variability.
Method details
In utero and neonatal pulse-injection of labeled amino acids
Fetuses of time-dated pregnant B6 mice were injected via the vitelline vein at embryonic day (E) 13.5, 14.5, or 16.5 (as indicated in the Results sections) with labeled amino acids as previously described.20,21 Briefly, under isoflurane anesthesia (1%–5%) and using a sterile technique, a midline laparotomy was performed and the uterine horns were exposed. Labeled amino acid solution (10 μL of L-Lysine Hydrochloride and L-Arginine Hydrochloride [Silantes GmBH, Product Number 211604102] reconstituted in sterilized phosphate buffer solution) was delivered to each fetus. All injections were performed with a programmable microinjector (IM-300 Microinjector; MicroData Instrument Inc, S. Plainfield, NJ) using a ∼100-μm beveled glass micropipette and a dissecting microscope to improve accuracy and verify the location of injection.20 The microinjector provides a high level of administrative control when introducing the heavy amino acid solution. Successful injections were confirmed by visualizing the clearance of blood in the vitelline vein by the injectate. After injection, the uterine horn with the fetuses was returned to the peritoneal cavity and 2-layer abdominal closure was performed with 4-0 Vicryl suture (Ethicon). Dams recovered for 15 to 20 min under a heat lamp until they were ambulatory. Scheduled postoperative analgesia (oral meloxicam 2.5 mg/kg) was delivered daily for 48 h when applicable. Isotopic amino acids circulate throughout the fetus and are transported to developing organs where they are used by the translational machinery for protein synthesis. At the designated time points after amino acid injection, fetal tissues including the brain, liver, lung, and heart were harvested. The tissues are then flash-frozen using liquid nitrogen and stored at −80 °C until further processing.
In a similar fashion to that described above, postnatal day 0 (P0) neonatal mice were injected with labeled amino acids via the facial vein using a ∼100-μm beveled glass micropipette, the programmable microinjector, and a dissecting microscope. For P0 injections, a total volume of 20 L was injected.
Standardized control over the pulse injection begins with the formation of the labeled amino acid solution. Isotopic amino acids are diluted in sterile buffered saline, created in a large batch, and aliquoted into single-use aliquots, which ensures that each fetus or neonate is delivered the same concentration of heavy-isotope label amino acids. This step reduces the injection-to-injection variability that may incur from unique sample creation with each experiment.
Sample processing
Tissue samples were resuspended in a denaturing buffer (6 M Guanidine-HCl, 100 mM TEAB pH = 8.5) and lysed by sonication. Protein estimation was performed using Bradford reagent using BSA for the standard curve. An equal amount of protein (10–30 μg) was resuspended to a final concentration of 1 μg/μL using 6 or 8 M Guanidine-HCl, 100 mM TEAB pH = 8.5, 15 mM DTT (Guanidine-HCl concentration ranged between 4.5 M and 6 M). Samples were denatured and reduced by incubating at 60 °C for 20 min while shaking at 1000 RPM. Cysteine alkylation was performed by adding 30 mM iodoacetamide and incubating for 20 min in the dark at ambient temperature while vortexing at 1000 RPM. Before proteolytic digestion, guanidine-HCl was diluted to 1 M using 25 mM TEAB pH = 8.5. Trypsin (Promega, Madison, WI) was added to a final ratio of 1:60 (trypsin: protein) and incubated at ambient temperature overnight. Following trypsin digestion, peptides were desalted using in-house desalting tips made from 3M Empore C18 extraction disks.
LCMS analysis
Peptides were analyzed with a Dionex UltiMate 3000 UHPLC system coupled to a high-resolution orbitrap mass spectrometer. A 25 cm fused silica capillary (75 μm ID, 360 μm OD) with an in-house pulled emitter tip was packed with ReproSil-Pur 3 μm diameter, 120 Å pore size C18 beads (Dr. Maisch GmbH). Solvent A was composed of LCMS-grade water and 0.1% formic acid. Solvent B was composed of 80% acetonitrile, 20% water (v/v), and 0.1% formic acid. Peptides were preloaded onto a μ-Precolumn cartridge (300 μm ID, 5 mm) packed with C18 PepMap 100, 5 μm diameter, 100 Å pore size C18 particles (Thermo Scientific). Peptides were loaded with a 5 μL/min flow rate using 2% acetonitrile, 98% water, and 0.05% trifluoroacetic acid and back-flushed with Solvent A onto the pre-equilibrated analytical column. Peptides were separated using a 182-min segmented gradient that consisted of an isocratic hold at 5% B for 2 min, a linear increase from 5% to 25% B for 144 min, and 25%–40% B for 36 min. The column was washed with 90% B for 10 min and re-equilibrated with 5% B for 7 min. The flow rate for the analytical column was set to 400 nL/min.
The eluted peptides were ionized by electrospray ionization and analyzed on an Orbitrap Q Exactive HF-X mass spectrometer (Thermo Scientific) in a data-dependent mode. The precursor scan range of 350–1500 m/z was acquired in profile mode at 60K resolution (at 200 m/z) with automatic gain control of 1E6 ions for a maximum of 50 ms. The top 30 precursors were selected for fragmentation with a 0.7 Th window, fragmented in the HCD cell using a stepped normalized collision energy (NCE) of 25.5, 27, and 30, analyzed in the orbitrap at 15K resolution, and acquired in centroid mode. Ion accumulation was set to a maximum of 1E5 or 40 ms. The dynamic exclusion was set to 45 s.
Data analysis
The raw data was processed using Thermo Proteome Discoverer (version 2.3.0.523, Thermo Scientific). The raw spectra were searched using a combination of spectral library and database search strategies. Spectral library search was performed using MSPepSearch with the NIST spectral libraries56: Orbitrap HCD 20160923 v.1 (1127970 spectra) and ProteomeTools synthetic HCD 20170530 v.1 (696692 spectra)57 and validated using Percolator with a 1% FDR. The combination database search was performed using MS Amanda 2.0 and Sequest HT. Tryptic peptides with up to two missed cleavages were searched against a Mus musculus database (SwissProt database; TaxID - 10090; version 2017-10-25; 25,097 entries) as well as a common contaminants database with a precursor tolerance of 20 ppm and a fragment mass tolerance of 0.05 Da. Carbamidomethylation of cysteines (+57.0215 Da) was set to a fixed modification; oxidation of methionines (+15.9949 Da) and N-terminal protein acetylation (+42.0106 Da) were set to dynamic modifications. For the isotopic amino acid injected samples, Lys8 (+8.0142 Da) and Arg10 (+10.0083 Da) were also set to dynamic modifications. A reverse decoy database was used to determine a 1% false discovery rate (FDR) using Percolator58,59 with peptide spectral match (PSM) validation based on q-value.
Mass isotopomer distribution analysis
We determined the fractional abundance of the isotopic amino acid pool using mass isotopomer distribution analysis.31,32 In this analysis, peptides that contain either two lysines or two arginines are used and we used different database search engines to identify a larger pool of peptides that fit these criteria (Proteome Discoverer 2.3, MaxQuant,60 and pyQms61). For each database search engine, we used the default parameters for a 2-plex SILAC experiment and included Lys8 and Arg10 as variable modifications. Peptides containing two lysines or arginines will be present in one of three states: all light or unlabeled (LL), all isotopic or heavy (HH), or a mix of light and heavy (HL). The equation used to determine the fractional abundance of the isotopic amino acids is:
Determination of turnover rate
Heavy fractional abundance (H/(H + L)) for each peptide was calculated from the light and heavy abundance values. Turnover rates were determined by fitting the peptide fractional abundance as a function of time using a nonlinear least squares exponential function (NLS in R v4.0.2) using the following equation:
with time being the duration of time (in hours) between the pulse injection and when tissues were harvested. A linear model was used to estimate the starting parameters of the turnover model which was then allowed to run for 100 maximum iterations. The resulting turnover rate (k) for each peptide was used for downstream analysis or converted to half-life using the:
Turnover model coefficients were extracted using the broom package (v 0.7.4) in R and were filtered for p value <0.05 and std. error <0.025.
Quantification and statistical analysis
All statistical analyses were carried out in R Statistical software (v 4.0.2). p-values were adjusted for multiple hypothesis correction using the Benjamini-Hochberg method to report q-values. Turnover model coefficients were extracted using the broom package (v 0.7.4) in R and were filtered for p value <0.05 and std. error <0.025.
Acknowledgments
We would like to thank Lindsay K. Pino for her helpful suggestions. B.E.C. was supported by a TL1 Award. Research reported in this publication was supported by the National Center for Advancing Translational Sciences of the National Institutes of Health under award number TL1TR001880. Z.L. thanks partial support from Washington University Seed Grant (PJ000027587). B.A.G. gratefully acknowledges support from NIH grants NS111997 and HD106051. The content is solely the responsibility of the authors and does not necessarily represent the official views of the National Institutes of Health.
Author contributions
J.B. and B.E.C. conceived the paper and designed the experiments. B.E.C. performed the fetal and neonatal injections. J.B., J.R., and M.M. performed mass spectrometry and downstream data analysis. W.H.P. and B.A.G. guided experimental design and parameters. J.B., B.E.C., and Z.L. drafted the manuscript. Z.L., W.H.P., and B.A.G. revised the manuscript and provided formative feedback.
Declaration of interests
The authors declare no competing interests.
Published: February 26, 2024
Footnotes
Supplemental information can be found online at https://doi.org/10.1016/j.crmeth.2024.100713.
Contributor Information
William H. Peranteau, Email: peranteauw@chop.edu.
Benjamin A. Garcia, Email: bagarcia@wustl.edu.
Supplemental information
References
- 1.Ben-Tabou de-Leon S., Davidson E.H. Gene regulation: gene control network in development. Annu. Rev. Biophys. Biomol. Struct. 2007;36:191. doi: 10.1146/annurev.biophys.35.040405.102002. [DOI] [PubMed] [Google Scholar]
- 2.Buttgereit F., Brand M.D. A hierarchy of ATP-consuming processes in mammalian cells. Biochem. J. 1995;312:163–167. doi: 10.1042/bj3120163. [DOI] [PMC free article] [PubMed] [Google Scholar]
- 3.Rolfe D.F., Brown G.C. Cellular energy utilization and molecular origin of standard metabolic rate in mammals. Physiol. Rev. 1997;77:731–758. doi: 10.1152/physrev.1997.77.3.731. [DOI] [PubMed] [Google Scholar]
- 4.Jovanovic M., Rooney M.S., Mertins P., Przybylski D., Chevrier N., Satija R., Rodriguez E.H., Fields A.P., Schwartz S., Raychowdhury R., et al. Immunogenetics. Dynamic profiling of the protein life cycle in response to pathogens. Science. 2015;347:1259038. doi: 10.1126/science.1259038. [DOI] [PMC free article] [PubMed] [Google Scholar]
- 5.Klann K., Tascher G., Munch C. Functional Translatome Proteomics Reveal Converging and Dose-Dependent Regulation by mTORC1 and eIF2alpha. Mol Cell. 2020;77:913–925.e914. doi: 10.1016/j.molcel.2019.11.010. [DOI] [PMC free article] [PubMed] [Google Scholar]
- 6.Ingolia N.T., Lareau L.F., Weissman J.S. Ribosome profiling of mouse embryonic stem cells reveals the complexity and dynamics of mammalian proteomes. Cell. 2011;147:789–802. doi: 10.1016/j.cell.2011.10.002. [DOI] [PMC free article] [PubMed] [Google Scholar]
- 7.Kristensen A.R., Gsponer J., Foster L.J. Protein synthesis rate is the predominant regulator of protein expression during differentiation. Mol. Syst. Biol. 2013;9:689. doi: 10.1038/msb.2013.47. [DOI] [PMC free article] [PubMed] [Google Scholar]
- 8.Schwanhäusser B., Wolf J., Selbach M., Busse D. Synthesis and degradation jointly determine the responsiveness of the cellular proteome. Bioessays. 2013;35:597–601. doi: 10.1002/bies.201300017. [DOI] [PubMed] [Google Scholar]
- 9.Buszczak M., Signer R.A.J., Morrison S.J. Cellular differences in protein synthesis regulate tissue homeostasis. Cell. 2014;159:242–251. doi: 10.1016/j.cell.2014.09.016. [DOI] [PMC free article] [PubMed] [Google Scholar]
- 10.Signer R.A.J., Magee J.A., Salic A., Morrison S.J. Haematopoietic stem cells require a highly regulated protein synthesis rate. Nature. 2014;509:49–54. doi: 10.1038/nature13035. [DOI] [PMC free article] [PubMed] [Google Scholar]
- 11.Llorens-Bobadilla E., Zhao S., Baser A., Saiz-Castro G., Zwadlo K., Martin-Villalba A. Single-Cell Transcriptomics Reveals a Population of Dormant Neural Stem Cells that Become Activated upon Brain Injury. Cell Stem Cell. 2015;17:329–340. doi: 10.1016/j.stem.2015.07.002. [DOI] [PubMed] [Google Scholar]
- 12.Zismanov V., Chichkov V., Colangelo V., Jamet S., Wang S., Syme A., Koromilas A.E., Crist C. Phosphorylation of eIF2alpha Is a Translational Control Mechanism Regulating Muscle Stem Cell Quiescence and Self-Renewal. Cell Stem Cell. 2016;18:79–90. doi: 10.1016/j.stem.2015.09.020. [DOI] [PubMed] [Google Scholar]
- 13.Blanco S., Bandiera R., Popis M., Hussain S., Lombard P., Aleksic J., Sajini A., Tanna H., Cortés-Garrido R., Gkatza N., et al. Stem cell function and stress response are controlled by protein synthesis. Nature. 2016;534:335–340. doi: 10.1038/nature18282. [DOI] [PMC free article] [PubMed] [Google Scholar]
- 14.Sanchez C.G., Teixeira F.K., Czech B., Preall J.B., Zamparini A.L., Seifert J.R.K., Malone C.D., Hannon G.J., Lehmann R. Regulation of Ribosome Biogenesis and Protein Synthesis Controls Germline Stem Cell Differentiation. Cell Stem Cell. 2016;18:276–290. doi: 10.1016/j.stem.2015.11.004. [DOI] [PMC free article] [PubMed] [Google Scholar]
- 15.Hinkson I.V., Elias J.E. The dynamic state of protein turnover: It's about time. Trends Cell Biol. 2011;21:293–303. doi: 10.1016/j.tcb.2011.02.002. [DOI] [PubMed] [Google Scholar]
- 16.Giaccia A.J., Kastan M.B. The complexity of p53 modulation: emerging patterns from divergent signals. Genes Dev. 1998;12:2973–2983. doi: 10.1101/gad.12.19.2973. [DOI] [PubMed] [Google Scholar]
- 17.Toyama B.H., Hetzer M.W. Protein homeostasis: live long, won't prosper. Nat. Rev. Mol. Cell Biol. 2013;14:55–61. doi: 10.1038/nrm3496. [DOI] [PMC free article] [PubMed] [Google Scholar]
- 18.Fornasiero E.F., Mandad S., Wildhagen H., Alevra M., Rammner B., Keihani S., Opazo F., Urban I., Ischebeck T., Sakib M.S., et al. Precisely measured protein lifetimes in the mouse brain reveal differences across tissues and subcellular fractions. Nat. Commun. 2018;9:4230. doi: 10.1038/s41467-018-06519-0. [DOI] [PMC free article] [PubMed] [Google Scholar]
- 19.Alevra M., Mandad S., Ischebeck T., Urlaub H., Rizzoli S.O., Fornasiero E.F. A mass spectrometry workflow for measuring protein turnover rates in vivo. Nat. Protoc. 2019;14:3333–3365. doi: 10.1038/s41596-019-0222-y. [DOI] [PubMed] [Google Scholar]
- 20.Ahn N.J., Stratigis J.D., Coons B.E., Flake A.W., Nah-Cederquist H.D., Peranteau W.H. Intravenous and Intra-amniotic In Utero Transplantation in the Murine Model. J. Vis. Exp. 2018 doi: 10.3791/58047. [DOI] [PMC free article] [PubMed] [Google Scholar]
- 21.Rossidis A.C., Stratigis J.D., Chadwick A.C., Hartman H.A., Ahn N.J., Li H., Singh K., Coons B.E., Li L., Lv W., et al. In utero CRISPR-mediated therapeutic editing of metabolic genes. Nat. Med. 2018;24:1513–1518. doi: 10.1038/s41591-018-0184-6. [DOI] [PMC free article] [PubMed] [Google Scholar]
- 22.Crawford L.W., Foley J.F., Elmore S.A. Histology atlas of the developing mouse hepatobiliary system with emphasis on embryonic days 9.5-18.5. Toxicol. Pathol. 2010;38:872–906. doi: 10.1177/0192623310374329. [DOI] [PMC free article] [PubMed] [Google Scholar]
- 23.Savolainen S.M., Foley J.F., Elmore S.A. Histology atlas of the developing mouse heart with emphasis on E11.5 to E18.5. Toxicol. Pathol. 2009;37:395–414. doi: 10.1177/0192623309335060. [DOI] [PMC free article] [PubMed] [Google Scholar]
- 24.Sadygov R.G. Using Heavy Mass Isotopomers for Protein Turnover in Heavy Water Metabolic Labeling. J. Proteome Res. 2021;20:2035–2041. doi: 10.1021/acs.jproteome.0c00873. [DOI] [PMC free article] [PubMed] [Google Scholar]
- 25.Deberneh H.M., Abdelrahman D.R., Verma S.K., Linares J.J., Murton A.J., Russell W.K., Kuyumcu-Martinez M.N., Miller B.F., Sadygov R.G. Quantifying label enrichment from two mass isotopomers increases proteome coverage for in vivo protein turnover using heavy water metabolic labeling. Commun. Chem. 2023;6:72. doi: 10.1038/s42004-023-00873-x. [DOI] [PMC free article] [PubMed] [Google Scholar]
- 26.Hammond D.E., Claydon A.J., Simpson D.M., Edward D., Stockley P., Hurst J.L., Beynon R.J. Proteome Dynamics: Tissue Variation in the Kinetics of Proteostasis in Intact Animals. Mol. Cell. Proteomics. 2016;15:1204–1219. doi: 10.1074/mcp.M115.053488. [DOI] [PMC free article] [PubMed] [Google Scholar]
- 27.McShane E., Sin C., Zauber H., Wells J.N., Donnelly N., Wang X., Hou J., Chen W., Storchova Z., Marsh J.A., et al. Kinetic Analysis of Protein Stability Reveals Age-Dependent Degradation. Cell. 2016;167:803–815.e21. doi: 10.1016/j.cell.2016.09.015. [DOI] [PubMed] [Google Scholar]
- 28.Schwanhäusser B., Busse D., Li N., Dittmar G., Schuchhardt J., Wolf J., Chen W., Selbach M. Global quantification of mammalian gene expression control. Nature. 2011;473:337–342. doi: 10.1038/nature10098. [DOI] [PubMed] [Google Scholar]
- 29.Welle K.A., Zhang T., Hryhorenko J.R., Shen S., Qu J., Ghaemmaghami S. Time-resolved Analysis of Proteome Dynamics by Tandem Mass Tags and Stable Isotope Labeling in Cell Culture (TMT-SILAC) Hyperplexing. Mol. Cell. Proteomics. 2016;15:3551–3563. doi: 10.1074/mcp.M116.063230. [DOI] [PMC free article] [PubMed] [Google Scholar]
- 30.Toyama B.H., Savas J.N., Park S.K., Harris M.S., Ingolia N.T., Yates J.R., 3rd, Hetzer M.W. Identification of long-lived proteins reveals exceptional stability of essential cellular structures. Cell. 2013;154:971–982. doi: 10.1016/j.cell.2013.07.037. [DOI] [PMC free article] [PubMed] [Google Scholar]
- 31.Hellerstein M.K., Neese R.A. Mass isotopomer distribution analysis: a technique for measuring biosynthesis and turnover of polymers. Am. J. Physiol. 1992;263:E988–E1001. doi: 10.1152/ajpendo.1992.263.5.E988. [DOI] [PubMed] [Google Scholar]
- 32.Hellerstein M.K., Neese R.A. Mass isotopomer distribution analysis at eight years: theoretical, analytic, and experimental considerations. Am. J. Physiol. 1999;276:E1146–E1170. doi: 10.1152/ajpendo.1999.276.6.E1146. [DOI] [PubMed] [Google Scholar]
- 33.Claydon A.J., Beynon R. Proteome dynamics: revisiting turnover with a global perspective. Mol. Cell. Proteomics. 2012;11:1551–1565. doi: 10.1074/mcp.O112.022186. [DOI] [PMC free article] [PubMed] [Google Scholar]
- 34.Christensen J.L., Wright D.E., Wagers A.J., Weissman I.L. Circulation and chemotaxis of fetal hematopoietic stem cells. PLoS Biol. 2004;2:E75. doi: 10.1371/journal.pbio.0020075. [DOI] [PMC free article] [PubMed] [Google Scholar]
- 35.Mikkola H.K.A., Orkin S.H. The journey of developing hematopoietic stem cells. Development. 2006;133:3733–3744. doi: 10.1242/dev.02568. [DOI] [PubMed] [Google Scholar]
- 36.Yardeni T., Eckhaus M., Morris H.D., Huizing M., Hoogstraten-Miller S. Retro-orbital injections in mice. Lab Anim. 2011;40:155–160. doi: 10.1038/laban0511-155. [DOI] [PMC free article] [PubMed] [Google Scholar]
- 37.Pino L.K., Searle B.C., Huang E.L., Noble W.S., Hoofnagle A.N., MacCoss M.J. Calibration Using a Single-Point External Reference Material Harmonizes Quantitative Mass Spectrometry Proteomics Data between Platforms and Laboratories. Anal. Chem. 2018;90:13112–13117. doi: 10.1021/acs.analchem.8b04581. [DOI] [PMC free article] [PubMed] [Google Scholar]
- 38.Genuth N.R., Barna M. The Discovery of Ribosome Heterogeneity and Its Implications for Gene Regulation and Organismal Life. Mol. Cell. 2018;71:364–374. doi: 10.1016/j.molcel.2018.07.018. [DOI] [PMC free article] [PubMed] [Google Scholar]
- 39.Hertz M.I., Landry D.M., Willis A.E., Luo G., Thompson S.R. Ribosomal protein S25 dependency reveals a common mechanism for diverse internal ribosome entry sites and ribosome shunting. Mol. Cell Biol. 2013;33:1016–1026. doi: 10.1128/MCB.00879-12. [DOI] [PMC free article] [PubMed] [Google Scholar]
- 40.Shi Z., Fujii K., Kovary K.M., Genuth N.R., Röst H.L., Teruel M.N., Barna M. Heterogeneous Ribosomes Preferentially Translate Distinct Subpools of mRNAs Genome-wide. Mol. Cell. 2017;67:71–83.e7. doi: 10.1016/j.molcel.2017.05.021. [DOI] [PMC free article] [PubMed] [Google Scholar]
- 41.Choesmel V., Fribourg S., Aguissa-Touré A.H., Pinaud N., Legrand P., Gazda H.T., Gleizes P.E. Mutation of ribosomal protein RPS24 in Diamond-Blackfan anemia results in a ribosome biogenesis disorder. Hum. Mol. Genet. 2008;17:1253–1263. doi: 10.1093/hmg/ddn015. [DOI] [PubMed] [Google Scholar]
- 42.Price J.C., Guan S., Burlingame A., Prusiner S.B., Ghaemmaghami S. Analysis of proteome dynamics in the mouse brain. Proc. Natl. Acad. Sci. USA. 2010;107:14508–14513. doi: 10.1073/pnas.1006551107. [DOI] [PMC free article] [PubMed] [Google Scholar]
- 43.Freitag N., Tirado-Gonzalez I., Barrientos G., Powell K.L., Boehm-Sturm P., Koch S.P., Hecher K., Staff A.C., Arck P.C., Diemert A., Blois S.M. Galectin-3 deficiency in pregnancy increases the risk of fetal growth restriction (FGR) via placental insufficiency. Cell Death Dis. 2020;11:560. doi: 10.1038/s41419-020-02791-5. [DOI] [PMC free article] [PubMed] [Google Scholar]
- 44.Dieterich D.C., Link A.J., Graumann J., Tirrell D.A., Schuman E.M. Selective identification of newly synthesized proteins in mammalian cells using bioorthogonal noncanonical amino acid tagging (BONCAT) Proc. Natl. Acad. Sci. USA. 2006;103:9482–9487. doi: 10.1073/pnas.0601637103. [DOI] [PMC free article] [PubMed] [Google Scholar]
- 45.Eichelbaum K., Winter M., Berriel Diaz M., Herzig S., Krijgsveld J. Selective enrichment of newly synthesized proteins for quantitative secretome analysis. Nat. Biotechnol. 2012;30:984–990. doi: 10.1038/nbt.2356. [DOI] [PubMed] [Google Scholar]
- 46.Howden A.J.M., Geoghegan V., Katsch K., Efstathiou G., Bhushan B., Boutureira O., Thomas B., Trudgian D.C., Kessler B.M., Dieterich D.C., et al. QuaNCAT: quantitating proteome dynamics in primary cells. Nat. Methods. 2013;10:343–346. doi: 10.1038/nmeth.2401. [DOI] [PMC free article] [PubMed] [Google Scholar]
- 47.Calve S., Witten A.J., Ocken A.R., Kinzer-Ursem T.L. Incorporation of non-canonical amino acids into the developing murine proteome. Sci. Rep. 2016;6:32377. doi: 10.1038/srep32377. [DOI] [PMC free article] [PubMed] [Google Scholar]
- 48.Bagert J.D., Xie Y.J., Sweredoski M.J., Qi Y., Hess S., Schuman E.M., Tirrell D.A. Quantitative, time-resolved proteomic analysis by combining bioorthogonal noncanonical amino acid tagging and pulsed stable isotope labeling by amino acids in cell culture. Mol. Cell. Proteomics. 2014;13:1352–1358. doi: 10.1074/mcp.M113.031914. [DOI] [PMC free article] [PubMed] [Google Scholar]
- 49.Farley-Barnes K.I., Ogawa L.M., Baserga S.J. Ribosomopathies: Old Concepts, New Controversies. Trends Genet. 2019;35:754–767. doi: 10.1016/j.tig.2019.07.004. [DOI] [PMC free article] [PubMed] [Google Scholar]
- 50.Draptchinskaia N., Gustavsson P., Andersson B., Pettersson M., Willig T.N., Dianzani I., Ball S., Tchernia G., Klar J., Matsson H., et al. The gene encoding ribosomal protein S19 is mutated in Diamond-Blackfan anaemia. Nat. Genet. 1999;21:169–175. doi: 10.1038/5951. [DOI] [PubMed] [Google Scholar]
- 51.Zhang Y., Ear J., Yang Z., Morimoto K., Zhang B., Lin S. Defects of protein production in erythroid cells revealed in a zebrafish Diamond-Blackfan anemia model for mutation in RPS19. Cell Death Dis. 2014;5:e1352. doi: 10.1038/cddis.2014.318. [DOI] [PMC free article] [PubMed] [Google Scholar]
- 52.Pino L.K., Baeza J., Lauman R., Schilling B., Garcia B.A. Improved SILAC Quantification with Data-Independent Acquisition to Investigate Bortezomib-Induced Protein Degradation. J. Proteome Res. 2021;20:1918–1927. doi: 10.1021/acs.jproteome.0c00938. [DOI] [PMC free article] [PubMed] [Google Scholar]
- 53.Hammond D.E., Simpson D.M., Franco C., Wright Muelas M., Waters J., Ludwig R.W., Prescott M.C., Hurst J.L., Beynon R.J., Lau E. Harmonizing Labeling and Analytical Strategies to Obtain Protein Turnover Rates in Intact Adult Animals. Mol. Cell. Proteomics. 2022;21:100252. doi: 10.1016/j.mcpro.2022.100252. [DOI] [PMC free article] [PubMed] [Google Scholar]
- 54.Bendall S.C., Hughes C., Stewart M.H., Doble B., Bhatia M., Lajoie G.A. Prevention of amino acid conversion in SILAC experiments with embryonic stem cells. Mol. Cell. Proteomics. 2008;7:1587–1597. doi: 10.1074/mcp.M800113-MCP200. [DOI] [PMC free article] [PubMed] [Google Scholar]
- 55.Van Hoof D., Pinkse M.W.H., Oostwaard D.W.V., Mummery C.L., Heck A.J.R., Krijgsveld J. An experimental correction for arginine-to-proline conversion artifacts in SILAC-based quantitative proteomics. Nat. Methods. 2007;4:677–678. doi: 10.1038/nmeth0907-677. [DOI] [PubMed] [Google Scholar]
- 56.Griss J. Spectral library searching in proteomics. Proteomics. 2016;16:729–740. doi: 10.1002/pmic.201500296. [DOI] [PubMed] [Google Scholar]
- 57.Zolg D.P., Wilhelm M., Schnatbaum K., Zerweck J., Knaute T., Delanghe B., Bailey D.J., Gessulat S., Ehrlich H.C., Weininger M., et al. Building ProteomeTools based on a complete synthetic human proteome. Nat. Methods. 2017;14:259–262. doi: 10.1038/nmeth.4153. [DOI] [PMC free article] [PubMed] [Google Scholar]
- 58.Käll L., Canterbury J.D., Weston J., Noble W.S., MacCoss M.J. Semi-supervised learning for peptide identification from shotgun proteomics datasets. Nat. Methods. 2007;4:923–925. doi: 10.1038/nmeth1113. [DOI] [PubMed] [Google Scholar]
- 59.The M., MacCoss M.J., Noble W.S., Käll L. Fast and Accurate Protein False Discovery Rates on Large-Scale Proteomics Data Sets with Percolator 3.0. J. Am. Soc. Mass Spectrom. 2016;27:1719–1727. doi: 10.1007/s13361-016-1460-7. [DOI] [PMC free article] [PubMed] [Google Scholar]
- 60.Cox J., Mann M. MaxQuant enables high peptide identification rates, individualized p.p.b.-range mass accuracies and proteome-wide protein quantification. Nat. Biotechnol. 2008;26:1367–1372. doi: 10.1038/nbt.1511. [DOI] [PubMed] [Google Scholar]
- 61.Leufken J., Niehues A., Sarin L.P., Wessel F., Hippler M., Leidel S.A., Fufezan C. pyQms enables universal and accurate quantification of mass spectrometry data. Mol. Cell. Proteomics. 2017;16:1736–1745. doi: 10.1074/mcp.M117.068007. [DOI] [PMC free article] [PubMed] [Google Scholar]
Associated Data
This section collects any data citations, data availability statements, or supplementary materials included in this article.
Supplementary Materials
Data Availability Statement
-
•
The data used in this study can be accessed at MassIVE repository (identifier: MSV000087342).
-
•
The source code can be accessed at https://github.com/baezaj/in-utero-turnover. DOIs are provided in the key resources table.
-
•
Any additional information required to reanalyze the data reported in this paper is available from the lead contact upon request.