

Abstract
Human and animal feces present persistent threats to global public health and also opportunities for recovery of resources. We present the first global-scale accounting of recoverable feces (livestock animal and human) —from 2003–2030—using country-specific human and animal population estimates and estimated species-specific feces production by human or animal body mass. We also examine global coverage of domestic livestock animals and sanitation facilities to describe the distribution of onsite vs. offsite hazards from animal and human feces. In 2014, the total mass of feces was 3.9 trillion kg/year, increasing by >52 billion kg/year since 2003 and anticipated to reach at least 4.6 trillion kg in 2030. Annual global production of feces from animals—primarily cattle, chickens, and sheep—was about four times that from humans, and ratios of animal:human feces continue to increase (geometric mean of 4.2:1 (2003) vs. 5.0:1 (2014) vs. a projected 6.0:1 (2030)). Low-income populations bear the greatest burden of onsite feces, mostly from animals in or near the domestic environment. This analysis highlights the challenges of resource recovery from concentrated and dispersed sources of feces, and the global public health policy need for safe management of animal feces.
Background
By 2050, the global population is expected to increase by a third, from 7.2 to 9.6 billion,1 with the proportion of urban residents increasing from 50% to 66%.2 Although supplying essential resources to support an expanding global population is critical, the waste generated from this growth also requires careful consideration. Fecal wastes from human and livestock animal populations present both potentially recoverable resources (nutrients, energy, and metals3) as well as public health hazards, with increases in population density raising the stakes for waste management.4–6
Opportunity costs associated with discarded, unmanaged feces can be high, given resource limitations.7,8 Yields from recovery of metals alone may reach $13 million/1 million person’s waste.9 Phosphorous, nitrogen, and potassium in human feces and urine could significantly contribute to future needs (e.g., up to 22% of global demand for phosphorous10), especially with improved recovery from newer sanitation systems.10,11 Animal feces and urine have similar recovery potential and are commonly applied to agricultural lands12,13.
Unsafe management and subsequent exposure to human feces is associated with high burdens of enteric infections, stunting, and poor cognitive development. 4,14–17 Recent evidence suggests similar outcomes from exposure to animal feces,5,18,19 shifting understanding of the potential impact of zoonoses on global public health. Safe management of human feces is a critical priority for the Sustainable Development Goals,20 though its realization may require decentralized sanitation solutions with fecal sludge management (FSM) for most– a paradigm with important differences from the model of sanitation development in many wealthy countries,21 though onsite systems are also prevalent (e.g. >20% of domestic waste managed onsite in the United States).22 Containment and safe use of animal fecal wastes have not been a priority in global sanitation policy to-date, and approaches that make productive use of animal feces while reducing unsafe exposures are highly variable in practice5, despite the critical role such wastes may play in enteric disease transmission. Integrated human-animal waste management is, however, recognized in the One Health paradigm, which seeks holistic integration of human, animal, and environmental systems underpinning current and emergent public health challenges.23,24
In this study, we estimate annual global recoverable—humans and livestock animal—feces production historically (2003–2014) and prospectively (2017–2030). We combine animal population data from the United Nations Food and Agricultural Organization (FAO), human population data from the World Bank, and mass-based estimates of human- and animal-specific fecal production from literature to produce global and region-specific estimates of fecal biomass. We also estimate national percentages of fecal biomass representing household-level hazards vs. percentages offsite, using data on household ownership of animals and sanitation facilities. This analysis provides a foundation for global estimates of resource recovery potential and risks associated with feces using systematically-derived estimates. Results can support global and regional public health and resource-recovery planning.
Results:
Fecal production from animal and human populations
The 2014 global population of humans (7.2 billion) and livestock animals (29.7 billion) produced an estimated 3.9 trillion kg of feces (Table 1). Human feces comprised only 810 billion kg (21%) of the total fecal biomass, and was highest in Southeast Asia (1.9 billion people, 201 billion kg of feces) and the Western Pacific (1.8 billion people, 216 billion kg of feces). The discrepancy in regional human fecal production vs. population was due to smaller average body mass in Southeast Asia (58 kg) than the Western Pacific (66 kg).25
Table 1:
2014 estimates of WHO regional animal population, animal fecal production, human population, and human fecal production
| Region | Animal population, 2014 | Animal feces (kg/yr) | Human population, 2014 | Human feces (kg/yr) | Total feces (kg/yr) |
|---|---|---|---|---|---|
| Africa | 2.34 × 10⁹ | 4.01 × 10¹¹ | 9.62 × 10⁸ | 1.06 × 10¹¹ | 5.07 × 10¹¹ |
| Americas | 6.74 × 10⁹ | 7.84 × 10¹¹ | 9.75 × 10⁸ | 1.27 × 10¹¹ | 9.11 × 10¹¹ |
| EastMed | 3.49 × 10⁹ | 2.98 × 10¹¹ | 6.39 × 10⁸ | 8.00 × 10¹⁰ | 3.78 × 10¹¹ |
| Europe | 4.00 × 10⁹ | 3.70 × 10¹¹ | 9.09 × 10⁸ | 1.14 × 10¹¹ | 4.84 × 10¹¹ |
| SEAsia | 4.26 × 10⁹ | 4.87 × 10¹¹ | 1.90 × 10⁹ | 2.01 × 10¹¹ | 6.88 × 10¹¹ |
| WPacific | 8.91 × 10⁹ | 7.79 × 10¹¹ | 1.83 × 10⁹ | 2.16 × 10¹¹ | 9.95 × 10¹¹ |
| World | 2.97 × 10¹⁰ | 3.12 × 10¹² | 7.22 × 10⁹ | 8.10 × 10¹¹ | 3.93 × 10¹² |
Animal populations were greatest in the Western Pacific (8.9 billion, 779 billion kg of feces), the Americas (6.7 billion, 784 billion kg of feces), and Southeast Asia (4.3 billion, 487 billion kg of feces). Globally, chickens (21.4 billion, 780 billion kg of feces), cattle (1.5 billion, 1.3 trillion kg of feces) and sheep (1.4 billion, 231 billion kg of feces) were the largest animal populations and feces producers (Supplementary Table 2). Despite having fewer animals, the Americas produced more feces, compared with other regions, due to its share of livestock animals with high body masses (e.g., cattle).
Countries with the largest human populations produced the greatest estimated fecal biomass in 2014 (Figure 1). China (19%) and India (11%) accounted for >25% of the world’s feces, followed by Brazil (7.2%), the United States (6.1%), Pakistan (3.3%), Indonesia (2.9%), and Mexico (2.0%). Argentina, Australia, Bangladesh, France, Iran, Nigeria, Russia, Sudan, and Turkey composed the remaining 9/16 countries that individually produced ≥1%, and in sum comprised >63%, of the world’s feces in 2014. Ratios of animal feces to human feces in 2014 (kg animal/kg human) varied from <1 to >20 by country (Figure 2). Regional geometric mean animal:human feces ratios were highest in the Western Pacific (26) and Americas (11), compared with other regions (3.2–4.2). From 2003–2014, annual animal:human feces ratios increased significantly by country and overall (Figure 3). The overall geometric mean increased from 4.2 (95% CI: 3.6–5.0) to 5.0 (95% CI: 4.2–6.0). Projecting current trends results in a geometric mean of 6.0 (95% CI: 4.8–7.6) by 2030. Full descriptions of human and animal populations and feces production are available in Figures 1–3, Table 1, Supplementary Table 2, and Supplementary Discussion.
Figure 1:
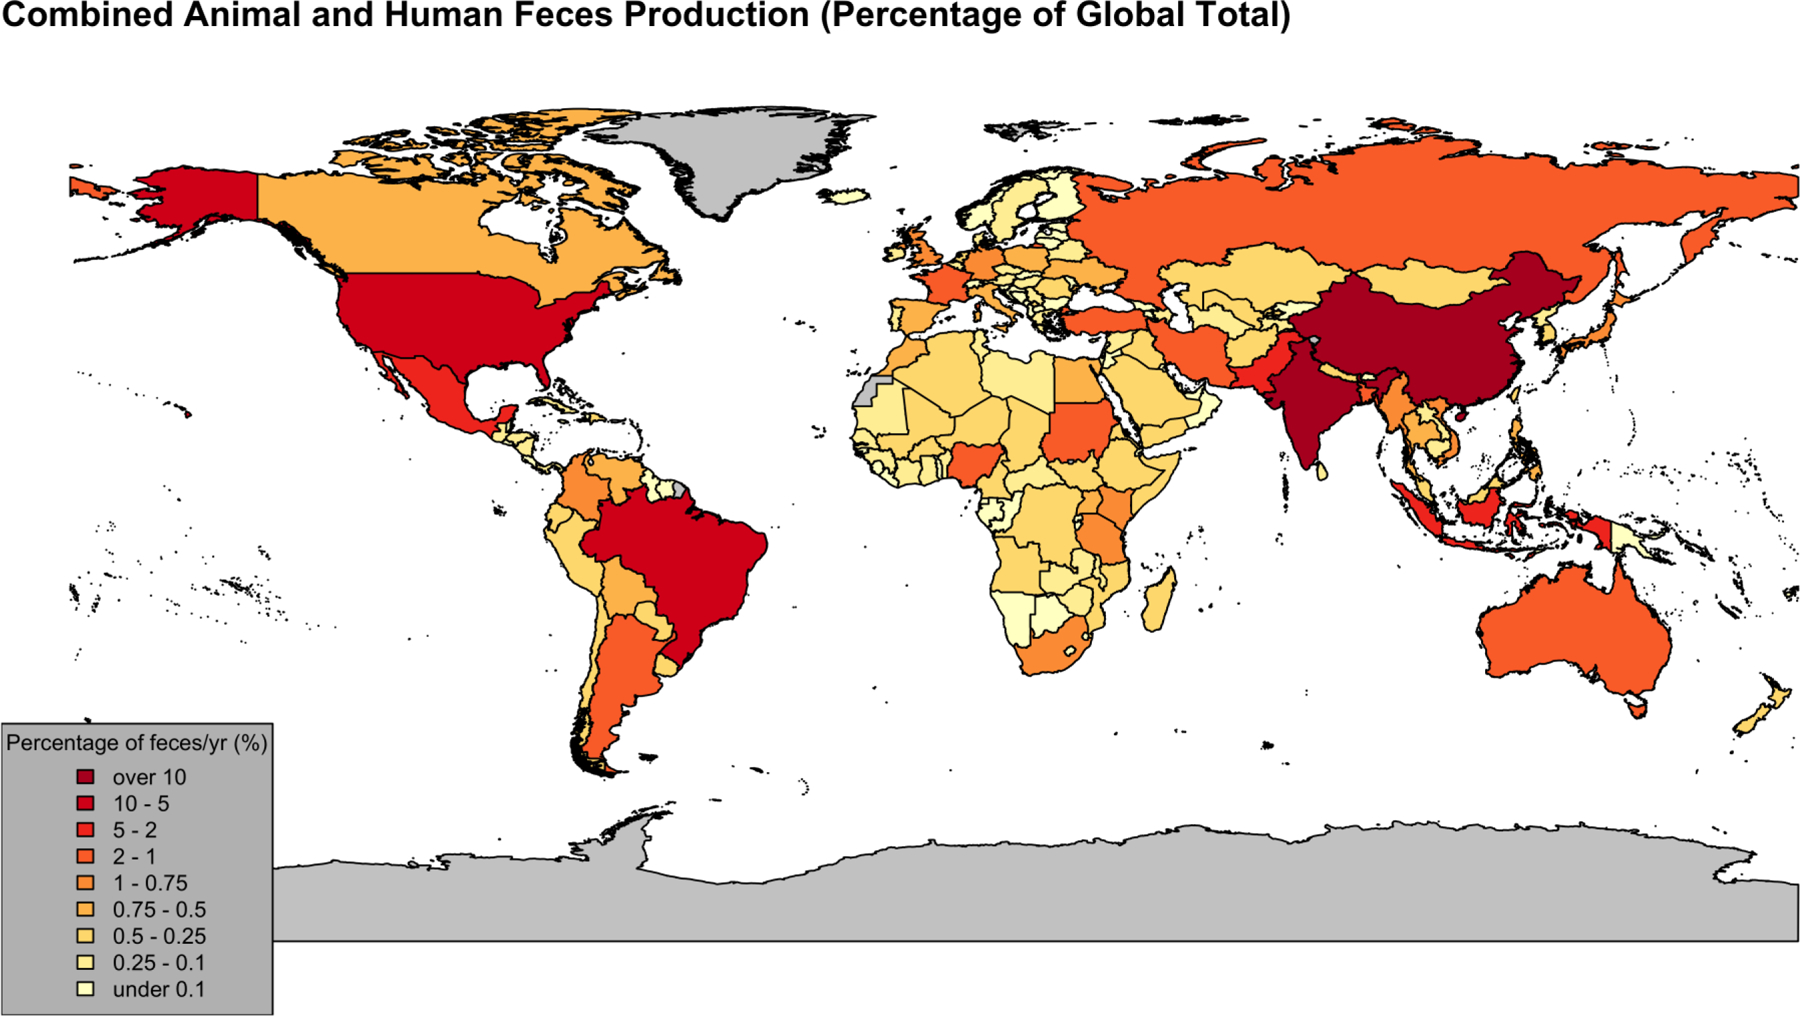
2014 country-level estimates for percentage of the world’s feces production. Darker red indicates larger production of feces annually. Country borders are in black, while countries/regions in gray have no data.
Figure 2:
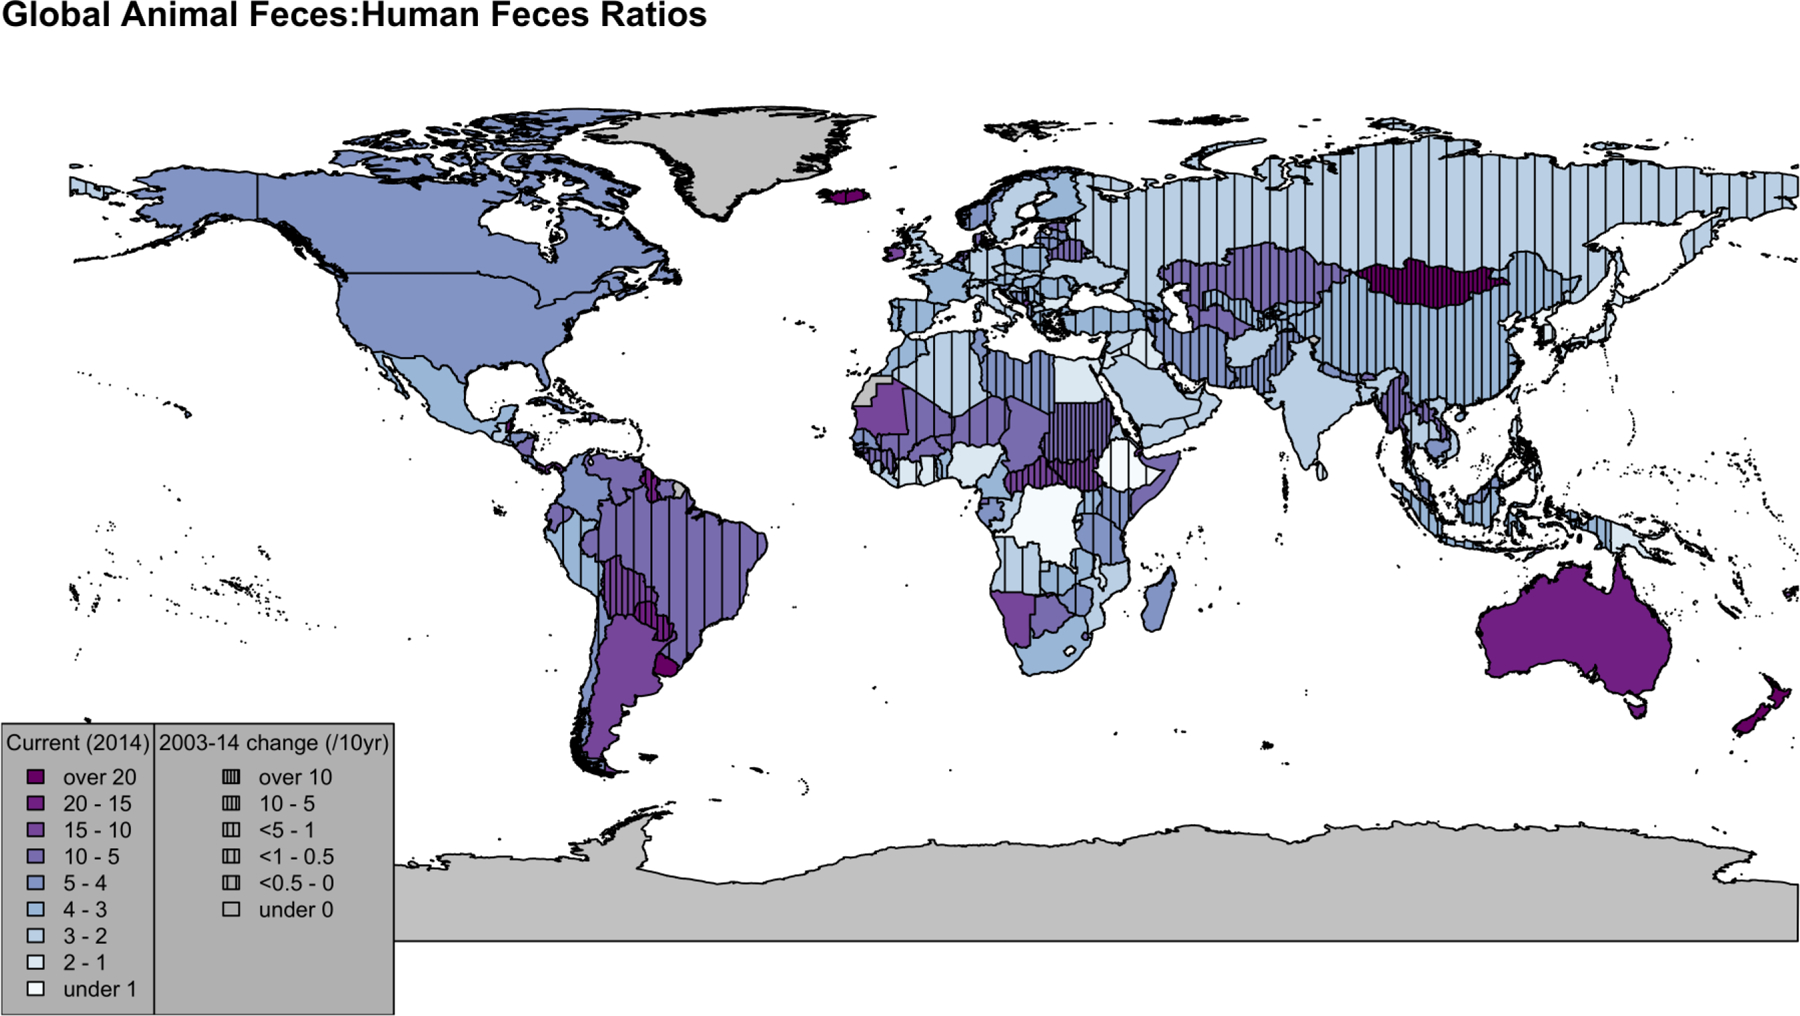
Country-level Animal Feces:Human Feces Ratios. Colors represent 2014 ratios (darker purple indicates countries with larger ratios, while countries in white have about ratios close to 1). Line density varies with the average change in ratios from 2003–2014 (presented per 10-years for ease of interpretation). Higher line density indicates larger, positive average changes in the ratio, while absence of lines indicates a negative change in ratio (with the exception of one country, all negative ratios were between −1 and 0). Countries in gray have no data available.
Figure 3:
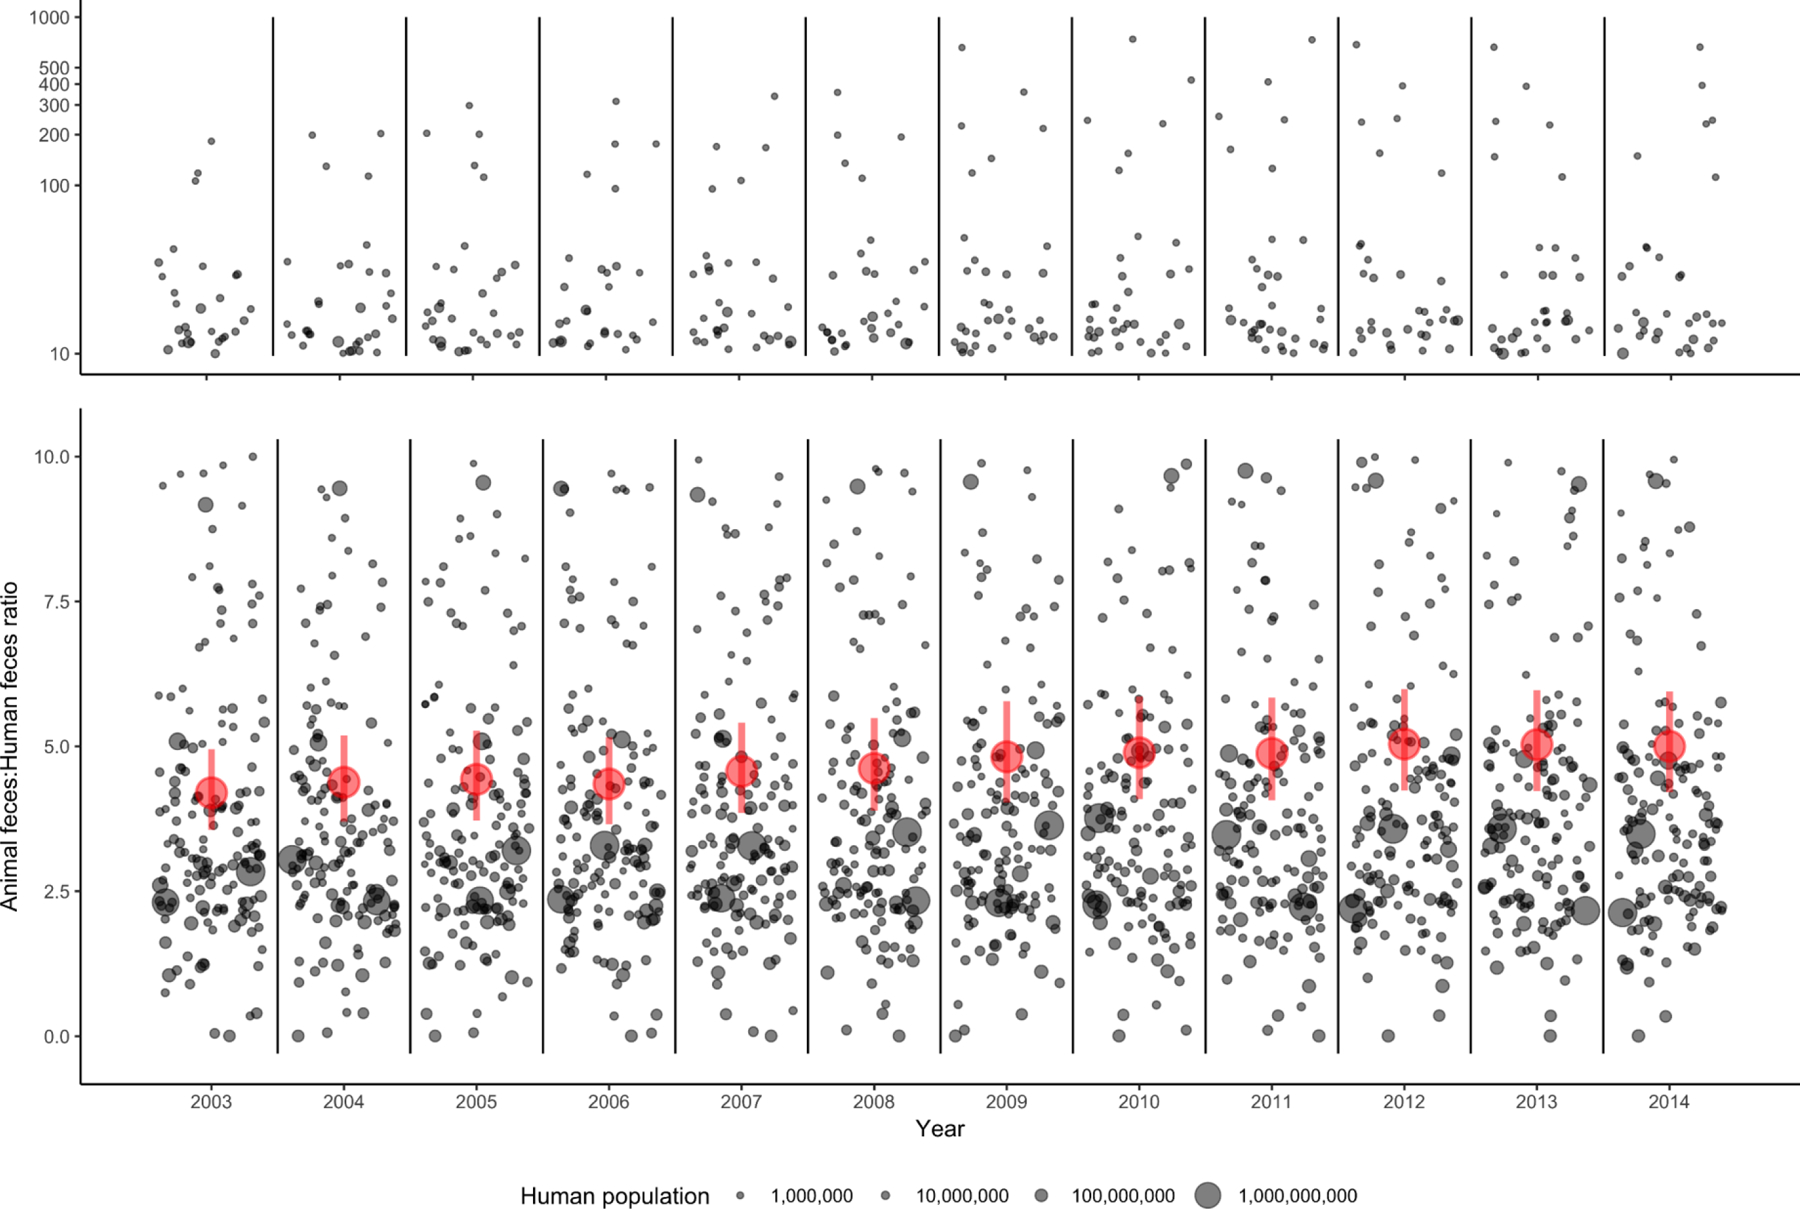
Country-level animal feces:human feces ratios, 2003–2014. Gray dots represent countries, with dot size varying by population. Dots are jittered for visualization only: all dots within the designated lines belong to the same year. Annual geometric means and 95% confidence intervals are indicated by red circles and lines, respectively. Graph is split into ratios between 0–10 (bottom, linear scale) and 10–1000 (top, logarithmic scale) for visualization. Linear mixed-effects models estimating ratios by year, with a random effect for each country, were significant at p < 0.001.
Onsite (household-level) hazards from human and animal feces
Worldwide, 56% of households had a sanitation facility with onsite containment (i.e., unsewered, representing 456 billion kg of feces), while 29% were connected to sewerage networks (235 billion kg of feces) and 12% had no facility (97 billion kg of feces) (Table 2). Onsite containment was most prevalent in the Western Pacific (70%, 152 billion kg of feces), Southeast Asia (69%, 140 billion kg of feces), and Africa (61%, 65 billion kg of feces). Conversely, sewerage was most prevalent in Europe (68%, 78 billion kg of feces), the Eastern Mediterranean (40%, 32 billion kg of feces), and the Americas (33%, 42 billion kg of feces). Further data are in Table 2 and Supplementary Discussion.
Table 2:
WHO region-level distribution of sanitation and amount of human feces (kg) served by types of sanitation, based on 2014 population estimates
| a) Percent of population with sanitation | b) Feces production (kg/yr) of population served by sanitation | |||||||||
|---|---|---|---|---|---|---|---|---|---|---|
| Region | EcoSan1 | FSM2 | Sewered | No Facility | Other | EcoSan1 | FSM2 | Sewered | No facility | Other |
| Africa | 0.4 | 61.4 | 9.3 | 27.7 | 1.3 | 3.82 × 10⁸ | 6.51 × 10¹⁰ | 9.82 × 10⁹ | 2.93 × 10¹⁰ | 1.37 × 10⁹ |
| Americas | 0.0 | 57.0 | 33.3 | 3.0 | 1.2 | 3.03 × 10⁷ | 7.24 × 10¹⁰ | 4.23 × 10¹⁰ | 3.78 × 10⁹ | 1.50 × 10⁹ |
| EastMed | 0.2 | 48.0 | 40.1 | 10.4 | 1.0 | 1.37 × 10⁸ | 3.84 × 10¹⁰ | 3.20 × 10¹⁰ | 8.35 × 10⁹ | 7.88 × 10⁸ |
| Europe | 0.1 | 31.4 | 68.3 | 0.1 | 0.1 | 1.09 × 10⁸ | 3.58 × 10¹⁰ | 7.78 × 10¹⁰ | 7.40 × 10⁷ | 9.22 × 10⁷ |
| SEAsia | 0.2 | 69.4 | 10.0 | 18.8 | 1.6 | 4.50 × 10⁸ | 1.40 × 10¹¹ | 2.00 × 10¹⁰ | 3.78 × 10¹⁰ | 3.13 × 10⁹ |
| WPacific | 0.3 | 70.3 | 13.5 | 12.0 | 4.1 | 7.14 × 10⁸ | 1.52 × 10¹¹ | 2.91 × 10¹⁰ | 2.59 × 10¹⁰ | 8.91 × 10⁹ |
| World | 0.2 | 56.3 | 29.1 | 12.0 | 1.5 | 1.63 × 10⁹ | 4.56 × 10¹¹ | 2.35 × 10¹¹ | 9.71 × 10¹⁰ | 1.24 × 10¹⁰ |
Ecological Sanitation: systems by which collect human fecal waste for the purpose of composting to generate fertilizer, either onsite/in-the-pit/toilet or offsite.
Fecal sludge management (FSM) indicates any form of onsite containment of feces that must be emptied, covered, or otherwise dealt with by the user (i.e. containment that is not sewered nor part of an Ecological Sanitation system). We note that not all feces processed via FSM may be potentially recovered or extracted for reuse, including for example rural areas where dug pits are covered once full and the latrine is moved elsewhere.
Globally, 30% of households had domestic livestock animals in 2014 (933 billion kg of feces: more than twice that of onsite human feces, Table 3), commonly chickens (44%), cattle (22%), and goats (18%). Southeast Asia (53%), Africa (48%), and the Western Pacific (33%) had the largest proportions of domestic livestock animals. Further global and regional estimates are in Table 3, Supplementary Table 3, and Supplementary Discussion.
Table 3:
Proportion of households, by WHO region, with animals onsite
| Region | Cattle | Chickens | Goats | Horses, donkeys, mules | Sheep | Any animal1 |
|---|---|---|---|---|---|---|
| Africa | 21.5 | 46.5 | 29.2 | 10.3 | 15.5 | 47.5 |
| Americas | 12.5 | 49.5 | 8.0 | 8.8 | 5.6 | 15.4 |
| EastMed | 19.3 | 36.0 | 22.6 | 16.7 | 27.8 | 16.8 |
| Europe | 16.8 | 25.0 | 5.1 | 6.5 | 7.4 | 14.3 |
| SEAsia | 45.2 | 62.2 | 28.0 | 9.6 | 7.9 | 52.7 |
| WPacific | 16.6 | 44.8 | 17.7 | 9.3 | 20.1 | 32.8 |
| World | 22.0 | 44.0 | 18.4 | 10.2 | 14.1 | 29.9 |
Percentage of households with at least one animal onsite, regardless of type
Past and projected animal and human feces production
From 2003–2014, total annual fecal biomass increased by 52.1 billion kg/year, on average: 9.5 billion kg/year from humans and 42.6 billion kg/year from animals (data not shown). Using projected human population increases with 2014 human:animal population ratios, the total annual fecal biomass would increase by 13% from 4.09 trillion kg (2017) to 4.63 trillion kg (2030), on average by 41.5 billion kg/year. This estimate is more conservative than a) projecting the 2003–2014 trend to 2030 (4.73 trillion kg) or b) applying projected animal:human feces ratios to country-level human fecal production estimates in 2030 (5.03 trillion kg). Regardless of estimate, humans would produce >1 trillion kg of feces/year by 2030.
Under the most conservative estimates, total fecal biomass in the Western Pacific and the Americas would be about equal in 2030 (1.04 vs. 1.02 trillion kg, Supplementary Figure 1b). By 2030, the human fecal biomass in Southeast Asia would approximate that of the Western Pacific (233 vs. 228 billion kg, Supplementary Figure 2b), while the animal fecal biomass in the Americas would still be the largest (879 billion kg, Supplementary Figure 3b). Through 2030, Africa has the largest average change in total (18 billion kg/year, Supplementary Figure 1b), human (4.1 billion kg/year, Supplementary Figure 2b) and animal (14 billion kg/year, Supplementary Figure 3b) fecal biomass. More information on past and projected feces production is in Supplementary Figures 1–3.
Discussion
A baseline accounting of the fecal biomass associated with the growing global human and livestock animal populations can motivate and inform the establishment of global policies to maximize resource recovery while effectively mitigating public health hazards from both sources. This analysis highlights the differences required for safe management of human and animal feces in high-income vs. LMICs, but also underscores the large, and generally under-appreciated burden of animal feces management, especially in and near the domestic environment in LMICs. Our analysis may be useful in integrating policies to address the Sustainable Development Goals (SDGs) around food production (SDG 2), public health (SDG 3), water and sanitation (SDG 6), and sustainable production (SDG 12).20
Although estimates of annual human feces produced in LMICs, animal and human populations, and human-specific population growth and biomass, have been generated previously,3,25–28 this analysis is the first to comprehensively estimate global and regional fecal biomass from human and animal sources. Our estimates of fecal biomass—that include animal feces—are 10–40 times larger than previous human-specific estimates limited to LMICs.3 Studies highlighting the need for onsite management of fecal wastes have not accounted for animal feces,21,29 whose contribution to health risk is only beginning to be examined critically.5
Interdisciplinary efforts to “close the loop” (understand fecal waste from both a resource and a public health perspective) have rarely been implemented at-scale, despite the need to safely maximize resource efficiency.30 This may be due to challenges in monitoring the impacts of resource recovery—and concomitant public health hazards—from human-animal fecal biomass, which must generally be assessed at global (and not local) scales, as is common in measuring sustainability.30,31 Although nutrient content and recoverability vary by source, scale, diet, and other factors related to management, almost 4 trillion kg of feces represent significant potential value for recovery, especially if accompanied by urine recovery (not included in our calculations, but often present in the same waste streams). Such biomasses could provide large, low-cost quantities of phosphorous (21–91 billion kg/year), potassium (7–28 billion kg/year), calcium (15–17 billion kg/year), magnesium (4–5 billion kg/year), and iron (786 billion kg/year).3,32 At the household level, the type of sanitation facility—and its associated ability to recover waste in efficient ways that limit microbial exposures—is also an important factor and area of recent research.13,33
However, translating the potential value of these resources into real benefits will require multi-scale solutions with sustained investment, including in approaches to limit exposure risks associated with fecal waste streams. Although technology and processes for both onsite (household-level) and offsite (e.g. concentrated animal feeding operations (CAFOs)) storage, treatment, and use of animal and human waste exist, the management options are variable and frequently challenging. In most high-income countries, sewerage enables rapid, centralized treatment of concentrated wastewater and sludge at wastewater treatment plants (WWTPs) for agricultural use,34,35 which supplement the small global percentage of EcoSan (0.2%). Similarly, CAFOs produce concentrated animal waste, facilitating treatment and subsequent use, but also potentially magnifying public health hazards. As ‘point sources’ of human and animal waste treatment, centralized paradigms present challenges in optimizing the geographic supply and demand for nutrients from feces, and to a larger extent urine, but also improve efficiency and regulation of treatment given high throughput.7,36
In contrast, managing human and animal waste in LMICs may present challenges not yet anticipated in high-income settings (sewerage/CAFO paradigm) because decentralized approaches may be required. Treatment of geographically diffuse animal and human waste requires methods appropriate for smaller volumes of higher-strength waste with greater solids and pathogen content, including onsite systems; these characteristics affect design, treatment efficiency, and regulatory control.37 Despite advances in regulatory capacity in LMICs, direct use or discharge of sewage or wastewater from animal and human sources remains common37,38 and national/local guidelines or regulations for reuse of fecal wastes are challenging to develop, implement, and enforce.37 The responsibility of management, including any treatment, may fall to households or small communities.
Increased user-borne costs are also associated with decentralized systems. Aggregation of small volumes of waste into large, usable quantities (as at WWTPs) may face significant, financial hurdles in the emptying and transport costs for fecal sludges, potentially threatening the economic viability of these services.39 In contrast to centralized treatment paradigms that may be supported with public funds, costs are predominantly passed on to the user (household), potentially limiting sustainability and affordability, and therefore scale.40 Growing urban LMIC populations require new management systems for onsite sanitation that economize space,41 minimize costs,21 and safely sequester fecal wastes from human contact. Although localized agriculture presents opportunities for immediate onsite use not generally present in high-income settings, such opportunities may be absent in urban and urbanizing areas, and LMIC waste management paradigms will likely shift with growing populations/population densities and wealth. Further, there is a need to ensure that existing onsite sanitation systems are properly designed, installed, and maintained to prevent contamination of local water resources throughout the world.42
From a public health perspective, the hazards associated with unsafe management of onsite human and animal feces accrue at localized scales, where humans and animals live in close proximity. Common livestock animals—also large producers of onsite feces (e.g. chickens, cattle, goats, and sheep)—present significant risks for pediatric enteric infections in LMICs.5,43 Poor treatment of applied wastes may also result in significant disease burdens from fecal contamination—and subsequent consumption—of raw, unwashed or undercooked produce beyond the household.44
In addition to the responsibility for onsite management of human excreta recognized in decentralized sanitation paradigms,21,45 households in LMICs also bear the greatest burden of managing onsite animal feces, and associated exposure risks.5 Despite decades of focus on preventing contact with human feces and associated enteric pathogens46 and substantial knowledge of zoonotic hosts of many of these same enteric pathogens, the water, sanitation, and hygiene (WASH) sector has yet to substantively focus on safe management of animal feces.5,43 This analysis shows animal feces are of immediate and growing concern, comprising 80% of the global fecal biomass and almost 1 trillion kg onsite (more than twice that of human feces) with increasing animal feces:human feces ratios over time.
We note limitations in the scope and precision of this analysis, which includes both direct and imputed national estimates for countries without available data. This approach provides a valuable first estimate of recoverable fecal biomass, but does not account for country- and sub-country-level uncertainty and relies on some assumptions of unknown validity. Variability in sub-national infrastructure coverage prevents generalization of national-scale estimates to sub-national scales.47,48
Estimates of mammalian feces production based on primary analyses of mammalian feces:body mass relationships 49 are more accurate than point estimates for single species. However, we were nonetheless obligated to use literature estimates for avian feces production, which generally comprised ‘excreta’ (urine + feces) and not feces alone. Given data limitations, we were unable to account for within-species variation in body mass by age and assumed estimates for adults. Although we assumed 2014 ratios of human:animal populations remained constant when projecting fecal biomass production, these ratios may increase following recent trends in feces ratios (Figure 3), and therefore likely underestimate the growth of livestock animal populations—and their feces—as demand for meat and dairy increases with wealth.50 Sparse estimates of sanitation coverage and animal ownership in high-income countries represent an area where expanded household-level data could improve accuracy and highlight locations without access to safely-managed sanitation systems (e.g. in countries like the United States).51
Current and projected estimates of fecal biomass suggest the world’s poorest regions have not only the largest onsite hazards from human feces, but also from animal feces, amplifying exposure risks associated with unsafe management and opportunities for productive use. This analysis highlights the ever-growing burden of animal feces in the recent past, present, and future. Given potential disease burdens, there is an urgent need to develop, test, and scale innovations that improve safe management of animal fecal wastes (in addition to human fecal wastes), especially among the world’s poorest people where the potential risks and benefits are greatest.
Methods:
Data sources:
We collected human and livestock animal population data from 2003–2030 World Bank estimates26,27 and from the FAO for 2003–201428 (when the most recent data was available), respectively. We analyzed data by country, WHO region, and globally. We describe the derivation of FAO estimates of country-level animal populations in Supplementary Methods and Supplementary Table 1.
We obtained data for 112 low- and middle-income countries (LMICs) on household ownership of animals and types of household sanitation facilities from the Demographic and Health Survey (DHS, phase 5 (2003–2008), 6 (2008–2013), and 7 (2013–2018: most recent survey from 2015)) and Multiple Indicator Cluster Survey (MICS, rounds 3 (2005–2009), 4 (2009–2013), and 5 (2013–2017, most recent survey from 2016)). For an LMIC without these data, we assigned it the average proportion of households with animals and/or average sanitation coverage of all countries in its WHO region and income level (low, low-middle, middle, middle-high, or high), with the exception of China, given the proportion of the global population it occupies. We collected data for China from the 2009 China Health and Nutrition Survey.52
We obtained data on sanitation coverage in middle-high and high income countries from the Integrated Public Use Microdata Series-International (IPUMS-I),53 which included seven countries. Therefore, we assigned all other middle-high and high-income countries to the average sanitation coverage by region and income level, as described for LMICs. Due to sparse country-level data on household livestock animal ownership, we generated estimates for these countries from the American Veterinary Medical Association,54 which was corroborated by previous American and European literature.55–61 We conducted all analyses and generated all figures in R version 3.4.0 (R Foundation for Statistical Computing, Vienna, Austria).62
Estimating annual per-animal and per-human fecal production:
We estimated annual mammalian (including human) feces production by type using an equation for daily mammalian feces production from Yang et al. (2017)49:
where average mammalian animal body mass was estimated, assuming all animals were adults, from the University of Michigan Museum of Zoology63 and peer-reviewed literature.64–72 We accounted for regional variation in diet and body mass by estimating human body masses by WHO regions from previous literature.25 The equation represents the study of daily production of feces by individual mammals at the Atlanta Zoo by mass and species, plotted together.49 In total, the equation explained 86% of the variance in daily feces production (R2 = 0.86), the most of any characteristic measured on mammals.49
For avians, we estimated feces production by animal type from literature,73–75 with the exception of guinea fowl, which were assumed to produce feces at the same rate as geese, but proportional to mass (the “geese/guinea fowl” FAO group was assumed to be composed of half of each species).
For all estimates, we constructed uncertainty bands by: 1) using high and low values from 95% confidence intervals for animal body mass (for animals with more than two body mass estimates and for humans using regional estimates25); or 2) inputting the two body masses (for animals with only two body mass estimates); or 3) using a 14% estimate of uncertainty, based on residual variability in the model from Yang et al.49 (for animals with only one body mass estimate available). More information about classification of animals by type can be found in the Supplementary Methods and Supplementary Table 1.
Estimating onsite (household-level) hazards from animal and human feces:
As a measure of the potential onsite (household-level) hazards of fecal biomass, we estimated the proportions of animal and human feces located at the household vs. “off-site” (at other locations) from previous data sources combined with surveys of household animal ownership and sanitation facilities (e.g. DHS, MICS, IPUMSI). For animal feces, we also combined FAO country-level estimates of animal populations with data on household animal ownership (both presence/absence and grouped estimates of animals per household (1 – <10, 10 – < 95, and 95+) to apportion numbers of animals, and thereby animal feces, by location. For human feces, we combined World Bank national estimates of human populations with data on household sanitation type—divided into sewered vs. onsite (non-sewered)—to apportion human feces by location. We include further information on estimation methods and assumptions for these data in the SI Materials and Methods.
Projected human and animal fecal production:
We projected human fecal production for 2017–2030 based on the World Bank Population Estimates and Projections Database27 (for human populations) and previously-described methods for human feces production. We projected animal fecal production for 2017–2030 from current (2014) estimated ratios of animals:humans by country and FAO animal type,28 which we then applied to those World Bank human population projections for 2017–2030. We calculated uncertainty bands as described previously for these estimates. Additionally, we calculated alternative feces production estimates by: a) estimating the average annual growth in fecal production from 2003–2014 and applying that estimate to 2017–2030 data; and b) projecting animal feces:human feces ratios for 2017–2030 and applying them to human feces production estimates from World Bank human population projections (described earlier).
Analyses of animal feces:human feces ratios:
We analyzed trends in animal feces:human feces ratios, at country-level, over time using mixed-effects linear regression with year as the predictor variable and a random intercept for country. We conducted analyses in R using the lme4 package.76
Supplementary Material
Footnotes
Disclaimer: The findings and conclusions in this report are those of the authors and do not necessarily represent the official position of the Centers for Disease Control and Prevention.
Data availability:
All data on animal sizes and population estimates were obtained from tables/figures in manuscripts listed and publicly available datasets (DHS data available from the DHS program: https://dhsprogram.com/data/; MICS data available from UNICEF: http://mics.unicef.org/). A final dataset of the feces estimates supporting this manuscript is available from the corresponding author upon request.
References:
- 1.Gerland P, Raftery AE, Ševcíková H, Li N, Gu D, Alkema L et al. World Population Stabilization Unlikely This Century. Science (80- ) 2014; 346: 234–237. [DOI] [PMC free article] [PubMed] [Google Scholar]
- 2.Nations United. World Urbanization Prospects: 2014 Revision New York, 2015. [Google Scholar]
- 3.Rose C, Parker A, Jefferson B, Cartmell E. The characterization of feces and urine: A review of the literature to inform advanced treatment technology. Crit Rev Environ Sci Technol 2015; 45: 1827–1879. [DOI] [PMC free article] [PubMed] [Google Scholar]
- 4.Clasen T, Bostoen K, Schmidt W, Boisson S, Fung I, Jenkins M et al. Interventions to improve disposal of human excreta for preventing diarrhoea (Review) 2010. www.thecochranelibrary.com. [DOI] [PMC free article] [PubMed]
- 5.Penakalapati G, Swarthout J, Delahoy MJ, McAliley L, Wodnik B, Levy K et al. Exposure to Animal Feces and Human Health: A Systematic Review and Proposed Research Priorities. Environ Sci Technol 2017; 51: 11537–11552. [DOI] [PMC free article] [PubMed] [Google Scholar]
- 6.Alirol E, Getaz L, Stoll B, Chappuis F, Loutan L. Urbanisation and infectious diseases in a globalised world. Lancet Infect Dis 2011; 11: 131–41. [DOI] [PMC free article] [PubMed] [Google Scholar]
- 7.Wielemaker RC, Weijma J, Zeeman G. Harvest to harvest: Recovering nutrients with New Sanitation systems for reuse in Urban Agriculture. Resour Conserv Recycl 2018; 128: 426–437. [Google Scholar]
- 8.Otoo M, Drechsel P, Hanjra MA. Business Models and Economic Approaches for Nutrient Recovery from Wastewater and Fecal Sludge. In: Wastewater Springer Netherlands: Dordrecht, 2015, pp 247–268. [Google Scholar]
- 9.Westerhoff P, Lee S, Yang Y, Gordon GW, Hristovski K, Halden RU et al. Characterization, Recovery Opportunities, and Valuation of Metals in Municipal Sludges from U.S. Wastewater Treatment Plants Nationwide. Environ Sci Technol 2015; 49: 9479–9488. [DOI] [PubMed] [Google Scholar]
- 10.Mihelcic JR, Fry LM, Shaw R. Global potential of phosphorus recovery from human urine and feces. Chemosphere 2011; 84: 832–839. [DOI] [PubMed] [Google Scholar]
- 11.Batstone DJ, Hülsen T, Mehta CM, Keller J. Platforms for energy and nutrient recovery from domestic wastewater: A review. Chemosphere 2015; 140: 2–11. [DOI] [PubMed] [Google Scholar]
- 12.Smith LW, Wheeler WE. Nutritional and Economic Value of Animal Excreta. J Anim Sci 1979; 48: 144–156. [Google Scholar]
- 13.Stenström TA, Seidu R, Nelson E, Christian Z. Microbial Exposure and Health Assessments in Sanitation Technologies and Systems 2011. www.ecosanres.org.
- 14.Prüss-Ustün A, Bartram J, Clasen T, Colford JM, Cumming O, Curtis V et al. Burden of disease from inadequate water, sanitation and hygiene in low- and middle-income settings: a retrospective analysis of data from 145 countries. Trop Med Int Health 2014; 0: 1–12. [DOI] [PMC free article] [PubMed] [Google Scholar]
- 15.Wolf J, Prüss-Ustün A, Cumming O, Bartram J, Bonjour S, Cairncross S et al. Systematic review: Assessing the impact of drinking water and sanitation on diarrhoeal disease in low- and middle-income settings: Systematic review and meta-regression. Trop Med Int Heal 2014; 19: 928–942. [DOI] [PubMed] [Google Scholar]
- 16.Berendes D, Leon J, Kirby A, Clennon J, Raj S, Yakubu H et al. Household sanitation is associated with lower risk of bacterial and protozoal enteric infections, but not viral infections and diarrhea, in a cohort study in a low-income urban neighborhood in Vellore, India. Trop Med Int Heal 2017; 0: 1–11. [DOI] [PMC free article] [PubMed] [Google Scholar]
- 17.Mbuya MNN, Humphrey JH. Preventing environmental enteric dysfunction through improved water, sanitation and hygiene: an opportunity for stunting reduction in developing countries. Matern Child Nutr 2015; : n/a-n/a. [DOI] [PMC free article] [PubMed] [Google Scholar]
- 18.Mosites EM, Rabinowitz PM, Thumbi SM, Montgomery JM, Palmer GH, May S et al. The relationship between livestock ownership and child stunting in three countries in eastern Africa using national survey data. PLoS One 2015; 10: 1–10. [DOI] [PMC free article] [PubMed] [Google Scholar]
- 19.Kaur M, Graham JP, Eisenberg JNS. Livestock Ownership among Rural Households and Child Morbidity and Mortality: An Analysis of Demographic Health Survey Data from 30 Sub-Saharan African Countries (2005–2015). Am J Trop Med Hyg 2017; 96: 16–0664. [DOI] [PMC free article] [PubMed] [Google Scholar]
- 20.Nations United. Transforming our world: The 2030 agenda for sustainable development 2015. doi: 10.1007/s13398-014-0173-7.2. [DOI] [Google Scholar]
- 21.Berendes DM, Sumner TA, Brown JM. Safely Managed Sanitation for All Means Fecal Sludge Management for At Least 1.8 Billion People in Low and Middle Income Countries. Environ Sci Technol 2017; 51: 3074–3083. [DOI] [PubMed] [Google Scholar]
- 22.United States Environmental Protection Agency. Septic Systems Overview USEPA. 2018.https://www.epa.gov/septic/septic-systems-overview (accessed 26 Sep 2018).
- 23.Gebreyes WA, Dupouy-Camet J, Newport MJ, Oliveira CJB, Schlesinger LS, Saif YM et al. The Global One Health Paradigm: Challenges and Opportunities for Tackling Infectious Diseases at the Human, Animal, and Environment Interface in Low-Resource Settings. PLoS Negl Trop Dis 2014; 8. doi: 10.1371/journal.pntd.0003257. [DOI] [PMC free article] [PubMed] [Google Scholar]
- 24.Atlas R, Rubin C, Maloy S, Daszak P, Colwell R, Hyde B. One Health—Attaining Optimal Health for People, Animals, and the Environment. Microbe 2010; 5: 383–389. [Google Scholar]
- 25.Walpole SC, Prieto-Merino D, Edwards P, Cleland J, Stevens G, Roberts I. The weight of nations: An estimation of adult human biomass. BMC Public Health 2012; 12: 1. [DOI] [PMC free article] [PubMed] [Google Scholar]
- 26.The World Bank. Population Data. World Bank Data 2017. [Google Scholar]
- 27.The World Bank. Population Estimates and Projections. World Bank Data 2017. [Google Scholar]
- 28.Food and Agriculture Organization of the United Nations. FAOSTAT. Live Anim 2017. [Google Scholar]
- 29.UNICEF, WHO. Progress on Drinking Water, Sanitation and Hygiene 2017. doi: 10.1111/tmi.12329. [DOI] [Google Scholar]
- 30.Seto KC, Golden JS, Alberti M, Turner BL. Sustainability in an urbanizing planet. Proc Natl Acad Sci 2017; 114: 201606037. [DOI] [PMC free article] [PubMed] [Google Scholar]
- 31.Seto KC, Guneralp B, Hutyra LR. Global forecasts of urban expansion to 2030 and direct impacts on biodiversity and carbon pools. Proc Natl Acad Sci 2012; 109: 16083–16088. [DOI] [PMC free article] [PubMed] [Google Scholar]
- 32.Barnett GM. Phosphorus forms in animal manure. Bioresour Technol 1994; 49: 139–147. [Google Scholar]
- 33.Orner KD, Mihelcic JR. A review of sanitation technologies to achieve multiple sustainable development goals that promote resource recovery. Environ Sci Water Res Technol 2018; 4: 16–32. [Google Scholar]
- 34.Van Loosdrecht MCM, Brdjanovic D. Anticipating the next century of wastewater treatment. Science (80- ) 2014; 344: 1452–1453. [DOI] [PubMed] [Google Scholar]
- 35.Fytili D, Zabaniotou A. Utilization of sewage sludge in EU application of old and new methods-A review. Renew Sustain Energy Rev 2008; 12: 116–140. [Google Scholar]
- 36.Cordell D, Rosemarin A, Schröder JJ, Smit AL. Towards global phosphorus security: A systems framework for phosphorus recovery and reuse options. Chemosphere 2011; 84: 747–758. [DOI] [PubMed] [Google Scholar]
- 37.Jiménez B, Drechsel P, Koné D, Bahri A, Raschid-Sally L, Qadir M. Wastewater, sludge and excreta use in developing countries: an overview. In: Bahri A, Drechsel P, Raschid-Sally L, Redwood M (eds). Wastewater Irrigation and Health: Assessing and Mitigating Risk in Low-income Countries Routledge, 2010, p 1. [Google Scholar]
- 38.Julian TR. Environmental transmission of diarrheal pathogens in low and middle income countries. Environ Sci Process Impacts 2016; 0: 1–12. [DOI] [PubMed] [Google Scholar]
- 39.Kennedy-Walker R, Holderness T, Alderson D, Evans B, Barr S. Network modelling for road-based faecal sludge management. Proc Inst Civ Eng Eng 2015; 167: 157–165. [Google Scholar]
- 40.Dodane P-H, Mbéguéré M, Sow O, Strande L. Capital and operating costs of full-scale fecal sludge management and wastewater treatment systems in Dakar, Senegal. Environ Sci Technol 2012; 46: 3705–11. [DOI] [PMC free article] [PubMed] [Google Scholar]
- 41.Chunga RM, Ensink JHJ, Jenkins MW, Brown J. Adopt or adapt: Sanitation technology choices in urbanizing Malawi. PLoS One 2016; 11: 1–16. [DOI] [PMC free article] [PubMed] [Google Scholar]
- 42.Wright J a, Cronin A, Okotto-Okotto J, Yang H, Pedley S, Gundry SW. A spatial analysis of pit latrine density and groundwater source contamination. Environ Monit Assess 2013; 185: 4261–72. [DOI] [PubMed] [Google Scholar]
- 43.Zambrano LD, Levy K, Menezes NP, Freeman MC. Human diarrhea infections associated with domestic animal husbandry: A systematic review and meta-analysis. Trans R Soc Trop Med Hyg 2014; 108: 313–325. [DOI] [PMC free article] [PubMed] [Google Scholar]
- 44.Grace D Food safety in low and middle income countries. Int J Environ Res Public Health 2015; 12: 10490–10507. [DOI] [PMC free article] [PubMed] [Google Scholar]
- 45.Koné D Making urban excreta and wastewater management contribute to cities ’ economic development : a paradigm shift. Water Policy 2010; 12: 602–610. [Google Scholar]
- 46.Wagner EG, Lanoix JN. Excreta Disposal for Rural Areas and Small Communities WHO: Geneva, 1958. [PubMed] [Google Scholar]
- 47.Pullan RL, Freeman MC, Gething PW, Brooker SJ. Geographical Inequalities in Use of Improved Drinking Water Supply and Sanitation across Sub-Saharan Africa: Mapping and Spatial Analysis of Cross-sectional Survey Data. PLoS Med 2014; 11. doi: 10.1371/journal.pmed.1001626. [DOI] [PMC free article] [PubMed] [Google Scholar]
- 48.Osgood-Zimmerman A, Millear AI, Stubbs RW, Shields C, Pickering BV., Earl L et al. Mapping child growth failure in Africa between 2000 and 2015. Nature 2018; 555: 41–47. [DOI] [PMC free article] [PubMed] [Google Scholar]
- 49.Yang PJ, LaMarca M, Kaminski C, Chu DI, Hu DL. Hydrodynamics of defecation. Soft Matter 2017; 13: 4960–4970. [DOI] [PubMed] [Google Scholar]
- 50.Godfray HCJ, Beddington JR, Crute IR, Haddad L, Lawrence D, Muir JF et al. The Challenge of Food Security. Science (80- ) 2010; 327: 812–818. [DOI] [PubMed] [Google Scholar]
- 51.Izenberg M, Johns-Yost O, Johnson PD, Brown J. Nocturnal Convenience 1 : The Problem of Securing Universal Sanitation Access in Alabama’s Black Belt. Environ Justice 2013; 6: 200–205. [Google Scholar]
- 52.UNC Carolina Population Center. CHNS: China Health and Nutrition Survey. China Heal. Nutr. Surv 2009.http://www.cpc.unc.edu/projects/china (accessed 1 Dec2018).
- 53.Minnesota Population Center. Integrated Public Use Microdata Series, International: Version 6.5 [dataset] Minneapolis, Minnesota, 2017. doi: 10.18128/D020.V6.5. [DOI] [Google Scholar]
- 54.American Veterinary Medical Association. U.S. Pet Ownership & Demographics Sourcebook Schaumberg, IL, 2012. https://www.avma.org/KB/Resources/Statistics/Pages/Market-research-statistics-US-Pet-Ownership-Demographics-Sourcebook.aspx. [Google Scholar]
- 55.GfK. Pet Ownership Internationally: Global GfK survey 2016. https://www.gfk.com/fileadmin/user_upload/country_one_pager/NL/documents/Global-GfK-survey_Pet-Ownership_2016.pdf.
- 56.FEDIAF: The European Pet Food Industry. Key Facts & Figures 2016 Bruxelles, 2016. www.fediaf.org. [Google Scholar]
- 57.Kifle YW, Goeyvaerts N, Van Kerckhove K, Willem L, Faes C, Leirs H et al. Animal ownership and touching enrich the context of social contacts relevant to the spread of human infectious diseases. PLoS One 2015; 10: 1–13. [DOI] [PMC free article] [PubMed] [Google Scholar]
- 58.Elkhoraibi C, Blatchford RA, Pitesky ME, Mench JA. Backyard chickens in the United States: A survey of flock owners. Poult Sci 2014; 93: 2920–2931. [DOI] [PubMed] [Google Scholar]
- 59.USDA. Urban Chicken Ownership in Four U.S. Cities 2013. https://www.aphis.usda.gov/animal_health/nahms/poultry/downloads/poultry10/Poultry10_dr_Urban_Chicken_Four.pdf.
- 60.Lowder SK, Skoet J, Raney T. The Number, Size, and Distribution of Farms, Smallholder Farms, and Family Farms Worldwide. World Dev 2016; 87: 16–29. [Google Scholar]
- 61.McClintock N, Pallana E, Wooten H. Urban livestock ownership, management, and regulation in the United States: An exploratory survey and research agenda. Land use policy 2014; 38: 426–440. [Google Scholar]
- 62.R Core Team. R: A language and environment for statistical computing 2015.https://www.r-project.org/.
- 63.University of Michigan Museum of Zoology. Animal Diversity Web. Anim. Divers. Web 2014.http://animaldiversity.org/ (accessed 1 Nov2018).
- 64.Salama MAM, Shalles RR. Growth of water buffalo, Bubalus annee. Trop Agric 1992.http://agris.fao.org/agris-search/search.do?recordID=XG19940090152 (accessed 11 Jan2018).
- 65.Fabbriciani C, Lucania L, Milano G, Schiavone Panni A, Evangelisti M. Meniscal allografts: cryopreservation vs deep-frozen technique. An experimental study in goats. Knee Surg Sport Traumatol Arthrosc Off J ESSKA 1997; 5: 124–134. [DOI] [PubMed] [Google Scholar]
- 66.Mishra S, Rai SN. Influence of varying RDP:UDP ratios in diets on digestion, nitrogen utilization and milk production efficiency in goats. Small Rumin Res 1996; 20: 39–45. [Google Scholar]
- 67.Snyman MA, Olivier JJ. Genetic parameters for body weight, fleece weight and fibre diameter in South African Angora goats. Livest Prod Sci 1996; 47: 1–6. [Google Scholar]
- 68.Kugler W, Grünenfelder H-P, Broxham E. Donkey Breeds in Europe. Inventory, Description, Need for Action:report 2007/2008 2008. [Google Scholar]
- 69.Ruusunen M, Puolanne E. Histochemical properties of fibre types in muscles of wild and domestic pigs and the effect of growth rate on muscle fibre properties. Meat Sci 2004; 67: 533–539. [DOI] [PubMed] [Google Scholar]
- 70.Kafi M, Safdarian M, Hashemi M. Seasonal variation in semen characteristics, scrotal circumference and libido of Persian Karakul rams. Small Rumin Res 2004; 53: 133–139. [Google Scholar]
- 71.Kubesh K, McNeil N, Bellotto K. HOCPP 1247, Project Pack, Rabbits Coloma, MI, 2008. [Google Scholar]
- 72.Keller DG, Lawson JE, Peters HF. Diameter of Muscle Fibers and Composition of Selected Retail Cuts from Cattalo and Hereford Carcasses. Can J Anim Sci 1977; 57: 509–517. [Google Scholar]
- 73.Johnston RF. Rock Dove (Columba livia). In: Poole A, Stettenheim P, Gill F (eds). The Birds of North America The Academy of Natural Sciences: Washington D.C., 1992. [Google Scholar]
- 74.Williams CM. Poultry waste management in developing countries. FAO Poult Dev Rev 2009; : 1–2. [Google Scholar]
- 75.New Hampshire Department of Environmental Services. Canada Geese Facts and Management Options. Environ. Fact Sheet 2012.https://www.des.nh.gov/organization/commissioner/pip/factsheets/bb/documents/bb-53.pdf (accessed 1 Dec2018).
- 76.Bates D, Maechler M, Bolker B, Walker S. Fitting Linear Mixed-Effects Models Using lme4. J Stat Softw 2014; 67: 1–48. [Google Scholar]
Associated Data
This section collects any data citations, data availability statements, or supplementary materials included in this article.
Supplementary Materials
Data Availability Statement
All data on animal sizes and population estimates were obtained from tables/figures in manuscripts listed and publicly available datasets (DHS data available from the DHS program: https://dhsprogram.com/data/; MICS data available from UNICEF: http://mics.unicef.org/). A final dataset of the feces estimates supporting this manuscript is available from the corresponding author upon request.