Abstract
This work is focused on designing an easy-to-use novel perfusion system for articular cartilage (AC) tissue engineering and using it to elucidate the mechanism by which interstitial shear upregulates matrix synthesis by articular chondrocytes (AChs). Porous chitosan-agarose (CHAG) scaffolds were synthesized and compared to bulk agarose (AG) scaffolds. Both scaffolds were seeded with osteoarthritic human AChs and cultured in a novel perfusion system with a medium flow velocity of 0.33 mm/s corresponding to 0.4 mPa surficial shear and 40 mPa CHAG interstitial shear. While there were no statistical differences in cell viability for perfusion vs. static cultures for either scaffold type, CHAG scaffolds exhibited a 3.3-fold higher (p<0.005) cell viability compared to AG scaffold cultures. Effects of combined superficial and interstitial perfusion for CHAG showed 150- and 45-fold (p<0.0001) increases in total collagen (COL) and 13- and 2.2-fold (p<0.001) increases in glycosaminoglycans (GAGs) over AG’s non-perfusion and perfusion cultures, respectively, and a 1.5-fold and 3.6-fold (p<0.005) increase over non-perfusion CHAG cultures. Contrasting CHAG perfusion and static cultures, chondrogenic gene comparisons showed a 3.5-fold increase in collagen type II/type I (COL2A1/COL1A1) mRNA ratio (p<0.05), and a 1.3-fold increase in aggrecan mRNA. Observed effects are linked to NF-κB signal transduction pathway inhibition as confirmed by 3.2-fold (p<0.05) reduction of NF-κB mRNA expression upon exposure to perfusion. Our results demonstrate that pores play a critical role in improving cell viability and that interstitial flow caused by medium perfusion through the porous scaffolds enhances the expression of chondrogenic genes and ECM through downregulating NF-κB1.
Keywords: Articular cartilage, extracellular matrix, flow bioreactor, interstitial shear, NF-κB
Graphical Abstract
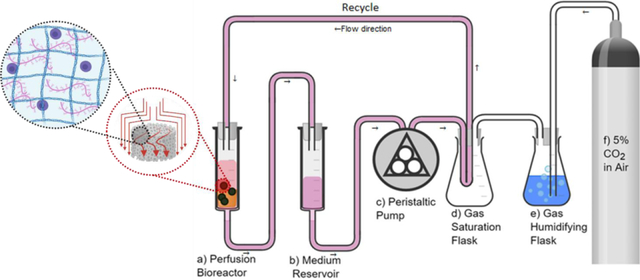
1. Introduction
Articular cartilage (AC) is a critical mechanotransducive tissue of the musculoskeletal system, with mechanical forces affecting the survival of its specialized cells (articulating chondrocytes (AChs)) and their abilities to produce appropriate extracellular matrix (ECM) components in vivo.1 Consequently, the application of mechanical loading including shear, intermittent compression,2–4 hydrostatic pressure,5,6 and cyclic tensile strain7–9 as a tool for enhancing ECM deposition in vitro has occupied significant interest in the scientific community. During body movement, the compressive load on AC leads to the displacement of 80% of the water contained within the ECM, which flows back into the ECM when the joint is unloaded by the action of osmotic pressure and the attraction of negatively charged glycosaminoglycan chains (GAGs), which make up nearly 30% of AC ECM dry weight.10–12 The flow of water within the ECM during loading and unloading, applies an interstitial shear stress on AChs affecting their homeostasis as evident by an ECM composition change upon exposure to interstitial shear in the work by Chen et al.13 Therefore, studying the positive effects of interstitial flow on ACh viability, expression of genes encoding for production of chondrogenic ECM components and others encoding for the inflammatory responses in AC, will enhance the understanding of potential mechanisms for mediating AC diseases, like osteoarthritis (OA) and rheumatoid arthritis (RA), and in exploring important regulator factors within the field of AC tissue engineering.
Previous work investigating the effects of interstitial flow is scarce, but the few published investigations show positive influences on some critical chondrogenic indices. Davisson et al.14 reported improved cell count by 1.8- fold and GAG deposition by 1.6- fold in comparison to static cultures, when ovine AChs were cultured in porous polyglycolic acid (PGA) scaffolds subject to medium flow at 11 μm/s. Their findings were consistent with the work of Freyria et al.15 where 1.6-fold increments were observed in GAG content when bovine AChs were exposed to interstitial flow within collagen sponges at rates of 0.1–0.3 mL/min. Raimondi et al. demonstrated the benefits of interstitial flow on AC growth within DegraPol® scaffolds over those cultured in static in three separate investigations. First, they showed 1.3- and 2.9-fold increases in bovine ACh metabolic activity as measured by the MTT assay and collagen type II expression,16 respectively. Second, they reported increased elasticity and a 2-fold increase in viability of human AChs17. Third, they concluded that GAG deposition is inversely proportional to applied shear when bovine AChs were exposed to interstitial shear ranging from 4.6–56 mPa,18 implying that while shear stresses are helpful, they need to be low in magnitude to attain their beneficial influence. In all these investigations, custom made, and/or small size perfusion/shear reactor vessels were used. None of the apparatuses used are easily replicable, and the set-ups cannot be used to grow constructs of meaningful size for clinical tissue engineering procedures. In addition, none of the studies investigated the effect of interstitial flow on enhancing the deposition of the major ECM component in AC, collagen (COL), and more importantly none of studies clarified the mechanism by which interstitial flow augments AC formation or if it plays a role in augmenting the expression of inflammatory pathways involved in diseases affecting AC.
Therefore, the objectives of this work were to: 1) design and develop a sterile perfusion bioreactor which applies mild external and internal shear forces that can be easily reproduced and exploited to grow engineered AC constructs of adequate size for clinical AC implantation; 2) synthesize porous scaffolds and compare AC TE on them versus on standard agarose (AG)5,19,20 and porous chitosan-agarose (CHAG) scaffolds; 3) quantify the applied shears in the in-house built perfusion system with the aid of COMSOL Multiphysics simulation, and demonstrate any enhanced chondrogenic potential aided by external shear, further enhanced by providing interstitial shear; 4) evaluate human ACh viability and ECM production by measuring COL and GAG deposition in the ECM; and 5) suggest mechanisms by which shear enhances chondrogenic activity by quantifying the expression of critical AC-specific anabolic components, collagen type II (COL2A1), and aggrecan ACAN, and correlating those to the reduction of the nuclear factor kappa-light-chain-enhancer of activated B cells (NF-κB) involved in the inflammatory and degradation process of AC, and further production of the inflammatory matrix metalloprotease-13 (MMP-13), gene.
1. Materials and Methods
2.1. Assembling the bioreactor
Two Luer Lock tip 60 mL sterile syringes (Monoject™) were used as the bioreactor chamber (Figure 1a) and the culture medium reservoir (Figure 1b), respectively. Autoclaved polypropylene Female Luer-to-Barb fittings for 1/8” ID tubing (Cole-Parmer) were connected to the syringe tips. The edges of a sterile 70 μm cell strainer (Biologics) were cut using sterile scissors and were flipped upside-down and pushed to the bottom of the bioreactor syringe (Figure 1a) using sterile tweezers. A wire test tube rack (Frey Scientific) was used to hold both syringes (Figure 1a&b). A 1/8” hole was drilled into the centers of two rubber stoppers size 6 (Fisher) using a 1/8” drill bit attached to a drill press, and water was used as a lubricant for drilling. The stoppers were used to seal the syringe tops. A 1/8” ID x 3/8” outside diameter (OD) sterile tubing was used to make all connections. The medium syringe was connected to a peristaltic pump (Gilson Minipuls3, Figure 1c) and the medium was transferred to a gas saturation chamber (Figure 1d). The gas saturation chamber was assembled by: First, drilling four holes into a size 6 stopper as described above; second, coiling 3 m of 1/8” ID x 1/4” OD silicone tubing (Masterflex®) inside a 1000 mL Erlenmeyer flask (Corning) and pulling each end through a hole in the stopper; third, adding humidified 5% CO2 line to one of the inlets (Figure 1f); and fourth, adding a purge line with a 0.22 μm 50 mm polytetrafluoroethylene (PTFE) sterile syringe gas filter (Cole-Parmer) on the last stopper inlet. As the gas saturation chamber gets filled with humidified 5% CO2, the medium passes through the silicone tubing coil and gets saturated with this gas making it suitable for cell culture. The medium is then fed to the top of the bioreactor syringe where the scaffolds are placed and is transferred to the medium reservoir for a recycle system at a rate of 11 mL/min. Medium inside the reservoir was changed every 2 days. Everything, except for the gas cylinder, was maintained inside the biosafety cabinet for the whole culture period. A temperature control system consisting of a 120 V finned strip heater (VULCAN), a proportional, integral, derivative (PID) thermostat (Shenzhen Inkbird Technology Co., Ltd.), and a muffin fan (AC Infinity Inc.) were used to maintain the culture at 37 °C.
Figure 1.
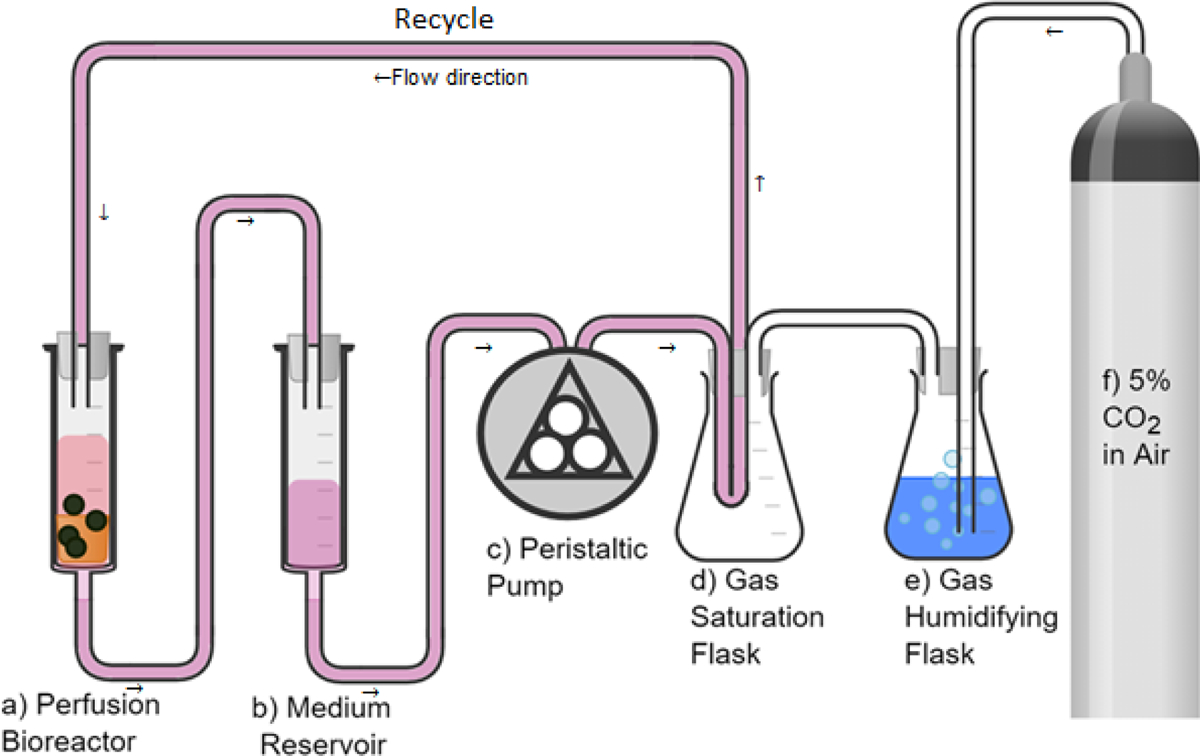
Process flow diagram for the experimental perfusion system
2.2. Isolation and expansion of human chondrocytes (hAChs)
Human knee AC was aseptically collected post total knee arthroplasty (TKA) from three consenting Caucasian study participants (61-, 62- and 67-year-old males) under the approval of the Institutional Review Board at Washington State University. All participants had International Cartilage Regeneration Society (ICRS) level 4 changes, but cartilage samples were typically harvested from locations with ICRS grade level 2 and 3 changes. The superficial cartilage layers were shaved off the bone specimen and were cut using No. 15 surgical scalpel blades (Cincinnati Surgical Co.). The pieces were then digested in 100 mg/mL collagenase type I (Worthington Biochemical Corporation) in high glucose-Dulbecco’s modified Eagle medium) HG-DMEM/F12 (Gibco®) for 16 hours in a shaker incubator at 125 rpm and 37 °C. The digest was then filtered through a 40 μm cell strainer (BIOLOGIX) and washed twice with HG-DMEM/F12. Samples were centrifuged at 1,500 rpm for 10 min between washes. The isolated hAChs were expanded in HG-DMEM/F12 (Gibco®), with 10% fetal bovine serum (FBS, Gibco®), 100 U/mL Penicillin-Streptomycin (Gibco®), 5 μg/mL gentamicin (Sigma-Aldrich), 1 ng/mL Transforming growth factor beta-3) TGF-β3), 5 ng/mL Fibroblast growth factor (FGF,Peprotech), and 10 ng/mL Platelet-derived growth factor - beta polypeptide PDGF-bb (Peprotech). Cells were maintained under standard culture conditions in a humidified incubator at 37 °C with 5% CO2. Medium was replaced every two days, and cells were passaged at 80% confluency using TrypLE™ Select. hAChs were expanded for two passages only to avoid chondrocytes de-differentiation.
2.3. Scaffold synthesis and cell culture
2.3.1. 2% Agarose scaffolds
4% agarose was prepared by dissolving type VII agarose (Sigma-Aldrich) in phosphate-buffered saline (PBS) with continuous mixing on a magnetic stirrer heated at 120 °C. The Agarose gel was allowed to cool down to 60 °C before adding the cells. To prepare the cell laden 2% agarose hydrogel, 5 mL of 4% agarose were thoroughly mixed with 5 mL of the expanded hAChs suspended at 3.2×10⁶ cell/mL in HG-DMEM/F12 (Gibco®). Then, the hACh laden hydrogel was aliquoted into 60 mm petri dishes and allowed to solidify at room temperature. A 4 mm biopsy punch was used to obtain the hACh-agarose constructs. All constructs were measured using the vernier caliber to ensure all used constructs had a height of 5 ± 0.1 mm. The steps are illustrated in Figure 2a.
Figure 2.
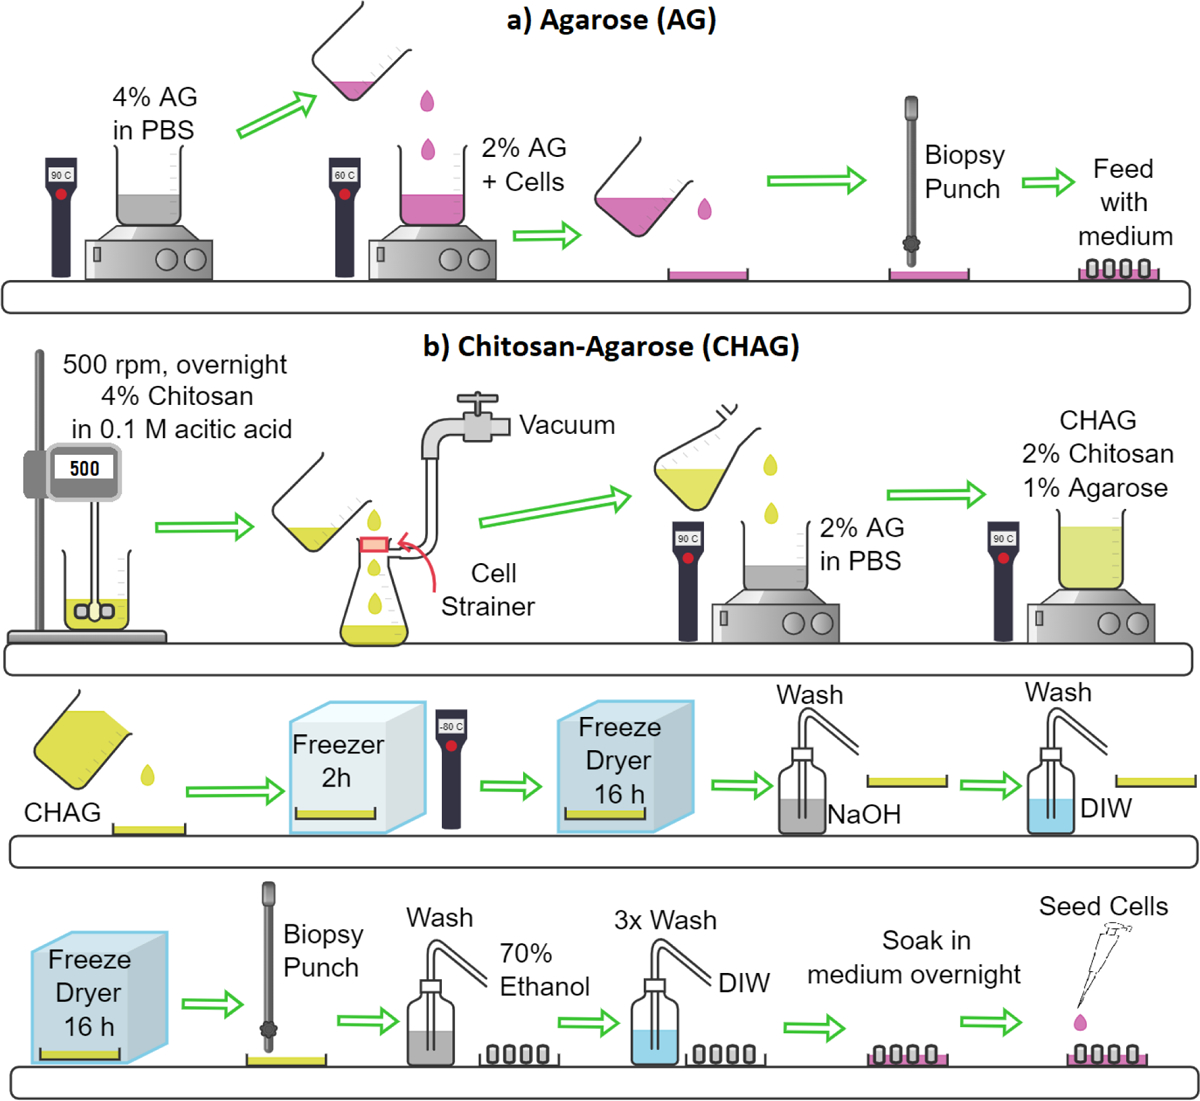
Synthesis of a) agarose (AG) scaffolds, and b) porous chitosan-agarose (CHAG) scaffolds by freeze-drying.
2.3.2. 2% Chitosan- 1% Agarose (CHAG)
CHAG scaffold was synthesized as illustrated in Figure 2b. 4% chitosan (w/v) was first prepared by dissolving in 0.1 M acetic acid with continuous mixing at 500 rpm using a mechanical stirrer for 16 hours. The dissolved solution was filtered using a 40 μm cell strainer (BIOLOGIX) in a Büchner flask. Second, Agarose (2% w/v) was dissolved in PBS at 120 °C with continuous mixing on a magnetic stirrer heated at 120 °C until completely dissolved. The molten agarose was added to an equivalent volume of the filtered chitosan solution to make a final solution with 2% chitosan and 1% agarose. The solution was then mixed for one hour at 500 rpm using a mechanical stirrer. The resulting homogenous solution was poured into polypropylene petri dishes and frozen at −80 °C for 2 hours. The frozen samples were then lyophilized for 16 hours to get the three-dimensionally (3D) porous scaffolds. The synthesized scaffolds were then washed once in 0.1 M NaOH, rinsed thoroughly with distilled water, and lyophilized again for 16 hours. The 4 mm scaffolds were obtained by punching the resulting scaffold with a 4 mm biopsy punch. The height of punched scaffolds was measured using a vernier caliber and scaffolds having a height between 4.9 and 5.1 mm were only used for the experiment. The scaffolds were sterilized by soaking in 70% ethanol for 10 minutes, followed by washing with PBS thrice, washing in cell culture medium thrice, and soaking in a cell culture medium overnight. Cells were seeded by dropping 10 μL of the high-density cell suspension (10 × 106 cell/mL) on each scaffold. Scaffolds were then placed inside a CO2 incubator at 37 °C.
2.4. SEM imaging of scaffolds
To compare the microstructure of both scaffold materials, CHAG and agarose, the scaffold surfaces were observed using a scanning electron microscopy (SEM, FEI Quanta 200F). Cell-free specimens were freeze dried, then coated with 10 Å of gold using a Technics Hummer V sputter coater. Finally, they were imaged under high vacuum in the SEM at an accelerating voltage of 20 kV.
2.5. COMSOL ® Multiphysics simulations
First, the cell strainer at the bottom of the reactor was modeled separately as a mesh of 20-micron diameter fibers giving 40-micron square openings to estimate the permeability and porosity of this mesh as their values are critical in simulating the flow within the designed bioreactor and are not reported by the manufacturer. Then, two reactor flow simulations were performed, one with a fully 3D geometry containing 15 cylindrical scaffolds, to mimic the actual scaffold set-up within the chamber, and another with 2D axisymmetric geometry that looks at a single scaffold for improved resolution. The cylindrical scaffolds were treated as porous domains with a permeability of 5.1 × 10⁻¹⁰ m2 based on experimental measurements of air pressure drop within the scaffold, and correlating that with permeability, and an average pore size of 250 for pores ranging from 160 to 260 and a porosity of 0.62 and estimated from 15 SEM images of the porous scaffold analyzed using ImageJ. Given the average pore size is only 5% smaller than the maximum value, the use of the average value is quite reliable in our COMSOL models which for flow in porous domains uses the Brinkman equations.21 The Navier-Stokes’s equations were solved for the flow in the reactor exterior to the scaffolds. The inlet flow boundary condition for both the 2D and 3D models was a uniform velocity equal to the superficial velocity in the reactor, 0.33 mm/s. The outlet boundary condition for both models was a uniform pressure at the outlet of the porous mesh domain and was arbitrarily set to zero. The side wall boundary condition for the 2D axisymmetric domain was a slip boundary condition (to simulate symmetries with adjacent scaffold domains) while the reactor wall boundary condition for the 3D domain was the no-slip boundary condition. For the 3D geometry, 12 cylindrical scaffolds were equally spaced around an outer circle of radius 10 mm while the remaining 3 scaffolds were equally spaced around an inner circle of 4 mm diameter. The angular placement of the inner scaffolds was chosen to give the most uniform overall spacing of cylinders. In COMSOL, the mesh was a “Physics-controlled” mesh with “Finer” spacing. The PARDISO direct solver was used for the 3D model. To predict the pore-wall shear stress due to intersticial flow within the porous CHAG Scaffold, the pores were treated as circular cylinders with fully developed laminar flow with a mean velocity equal to the interstitial velocity and the shear rate at the pore wall was calculated using the following formula22:
Where is the shear rate at the pore wall, and are the interstitial and superficial velocities, Rpore is the scaffold pore radius and is 39 μm here as estimated from SEM images of the CHAG scaffold analyzed using ImageJ, and ε is the porosity of CHAG. The pore-wall shear stress may be then calculated as22:
Where is the pore-wall shear stress, and is the fluid viscosity.
2.7. Viability assay
AlamarBlue (Thermo Fisher Scientific) was used to assess viability of cells after 7 days of culture. When working with 3D scaffolds, the problem is that digesting the construct itself will affect cell viability. Therefore, other means of measurement are required, and one can assess viability by relating it to metabolic activity as measured by non-toxic Resazurin dyes, i.e., AlamarBlue in our case.23 AlamarBlue was added to each sample (1:10 AlamarBlue: sample volume) and the samples incubated for 2 hours in a humidified incubator held at 37 °C with 5% CO2. After 2 hours, fluorescence was measured at an excitation/emission wavelengths of 570/590 nm. Readings were made using a Cytation plate reader (CYT5M, BioTek Instruments Inc.).
2.8. Quantification of Col, GAG, and DNA
For Col quantification on day 7, samples from cell groups were digested in 0.1 mg/mL pepsin (Sigma-Aldrich) in 0.2 M acetic acid at 37 °C for 16 hours. Sircol assay kit (Biocolor Life Science Assays) was then used to quantify Col. For GAG and DNA quantifications on day 7, samples from cell groups were digested in 125 μg/ml papain (Sigma-Aldrich) in 100 mM sodium phosphate buffer (pH 6.5) containing 10 mM L-cysteine and 10 mM EDTA at 65 °C for 16 hours. Blyscan assay kit (Biocolor Life Science Assays) was used for GAG, and the Quant-iT™ PicoGreen™ dsDNA Assay Kit was used for DNA. The three kits were used following manufacturers’ directions.
2.9. Quantification of relative gene expression using RT-PCR
All materials used for reverse transcription polymerase chain reaction (RT-PCR) are purchased from ThermoFisher Scientific. Total RNA was isolated from samples using TRIzol™ extraction following manufacturer’s protocol. Once the nucleic acid was isolated, the RNA concentration and purity of samples were measured using Nanodrop™ 2000 spectrophotometer. Extracted total RNA was reverse transcribed to cDNA using SuperScript™ IV VILO™ Master Mix with exDNase™ Enzyme. For RT-qPCR analysis, 2 μL of diluted cDNA was added to a 96-well plate containing 10 μL of PowerUp™ SYBR™ Green Master Mix, 2 μL of primers, and 6 μL of nuclease free water. Primers used for the reactions were encoded for the genes ACAN, COL2A1, COL1A1, NF-κB1 and glyceraldehyde 3-phosphate dehydrogenase (GAPDH) was used as a housekeeping gene. Primer information is summarized in Table 1.
Table 1.
Primer sequence information
| Gene | Forward Primer Sequence | Reverse Primer Sequence |
|---|---|---|
| ACAN | GGAAGGCTGCTATGGAGACAA | GGTGTCTCGGATGCCATACG |
| COL2A1 | ACTGGATTGACCCCAACCAA | TCCATGTTGCAGAAAACCTTCA |
| COL1A1 | AGAACCCAGCTCGCACATG | CAGTAGTAACCACTGCTCCATTCTG |
| SOX9 | ACACACAGCTCACTCGACCTTG | AGGGAATTCTGGTTGGTCCTCT |
| NF-κB1 | TGCAGCAGACCAAGGAGATG | TGCATTGGGGGCTTTACTGT |
| GAPDH | ACCCAGAAGACTGTGGATGG | GAGGCAGGGATGATGTTCTG |
2.10. Statistical analysis
Statistical analysis was performed using GraphPad Prism 8.4.3. One-way analysis of variance (ANOVA) was used to compare means of groups. Groups were considered significantly different when the ANOVA F test had a p-value less than 0.05, in which case, 2-sample t-test was conducted as a post hoc procedure to determine specific group differences. In all Figures, connected groups are significantly different (p<0.05) and error bars are standard deviations.
2. Results
3.1. Scaffolds microstructures
Differences in the microstructures of CHAG and AG scaffolds are clearly apparent in the side- by-side comparison of SEM micrographs shown in Figures 3 a and b. The microporous strucutures of CHAG and AG scaffolds are clearly apparent in the side view where CHAG is visibly observed with pore sizes in the 100–200 μm range. Looking at the SEM images of freeze-dried AG in Figure 3c&d, we observe the bulk non-porous structure of AG. Although AG is permeable to oxygen and glucose,24 its structure lacks microchannels that allow medium to flow within the scaffolds structure and mass transfer of nutrients and waste are expected to be more limited in the AG scaffold than in the porous CHAG structure.
Figure 3.
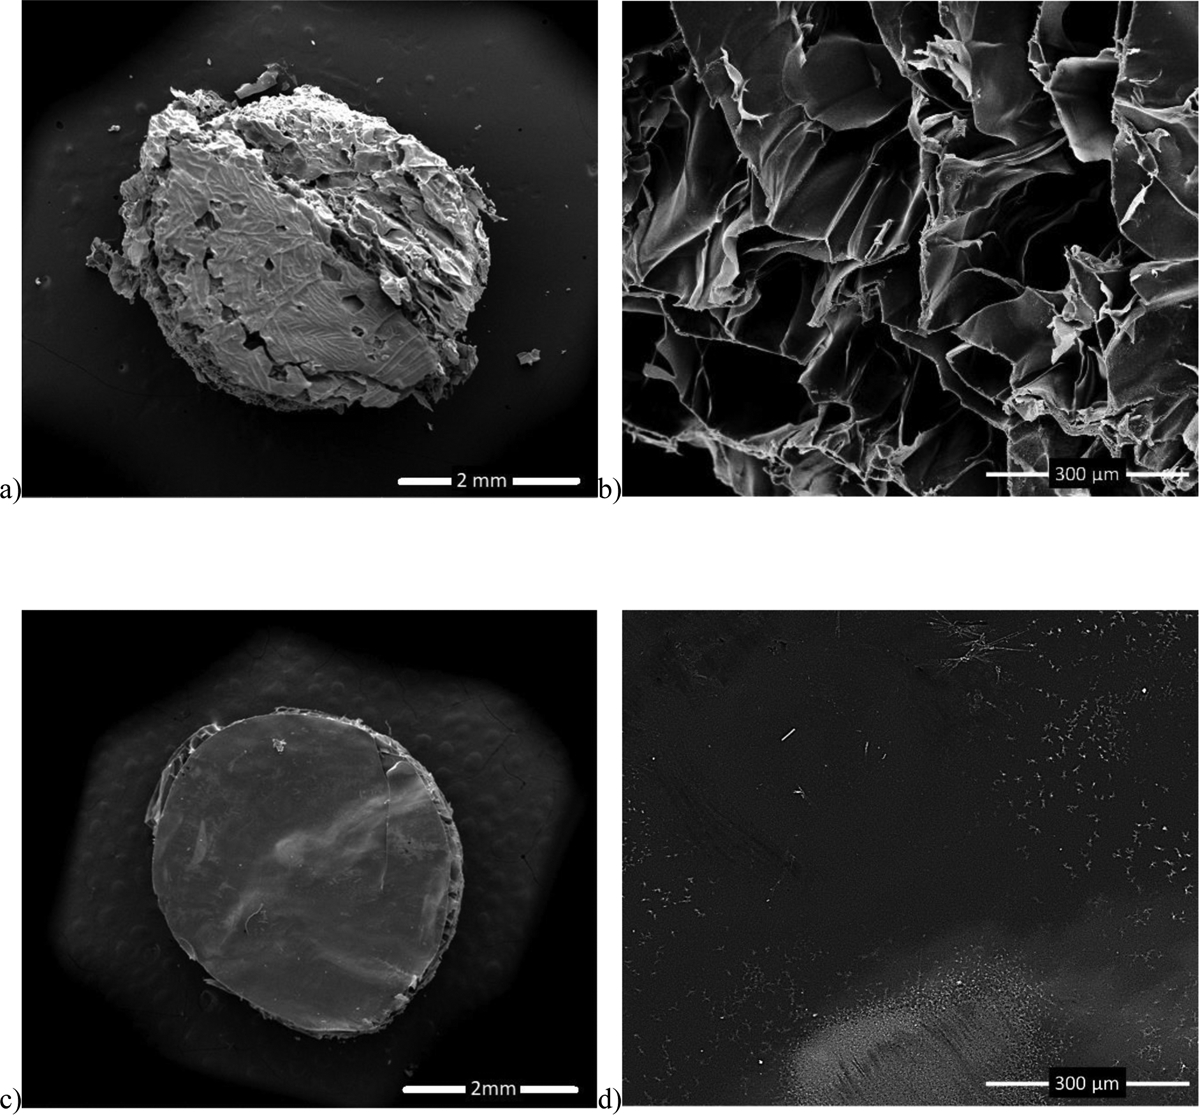
SEM images of (a) CHAG scaffold at 40x, (b) CHAG scaffold at 350x, (c) AG scaffold at 38x, and (d) AG scaffold at 280x.
3.2. Shear evaluation using COMSOL® Multiphysics simulation
COMSOL modeling allowed us to determine external shear stresses in both AG and CHAG scaffolds as the medium flows within the reactor, and internal shear stress component within the CHAG construct due to interstitial flow of medium within the scaffolds itself due to the presence of pores.
The superficial velocity in the scaffolds while in the bioreactor was obtained from the 3D model and is shown in Figure 4b. The maximum superficial velocity in the scaffolds appears to be around the bottom rim of the scaffold giving a value of 4.0 × 10⁻⁴ m/s. This yields a wall shear stress of 46 mPa. The velocity is much lower than this value over most of the scaffold volume. The volume-averaged superficial velocity in the scaffold is 3.5 × 10⁻⁴ m/s giving an average shear stress of 3.96 mPa. When comparing the velocity along the centerline of the scaffold for the 2D and 3D models (data not shown), very close agreement is observed. Given the agreement, the 2D model was used to generate a more detailed plot of the pore-wall shear stress inside the scaffold seen in Figure 4b. This plot also shows the velocity field surrounding and inside the scaffold with logarithmic scaling and the pore-wall shear stress is indicated by the colors.
Figure 4.
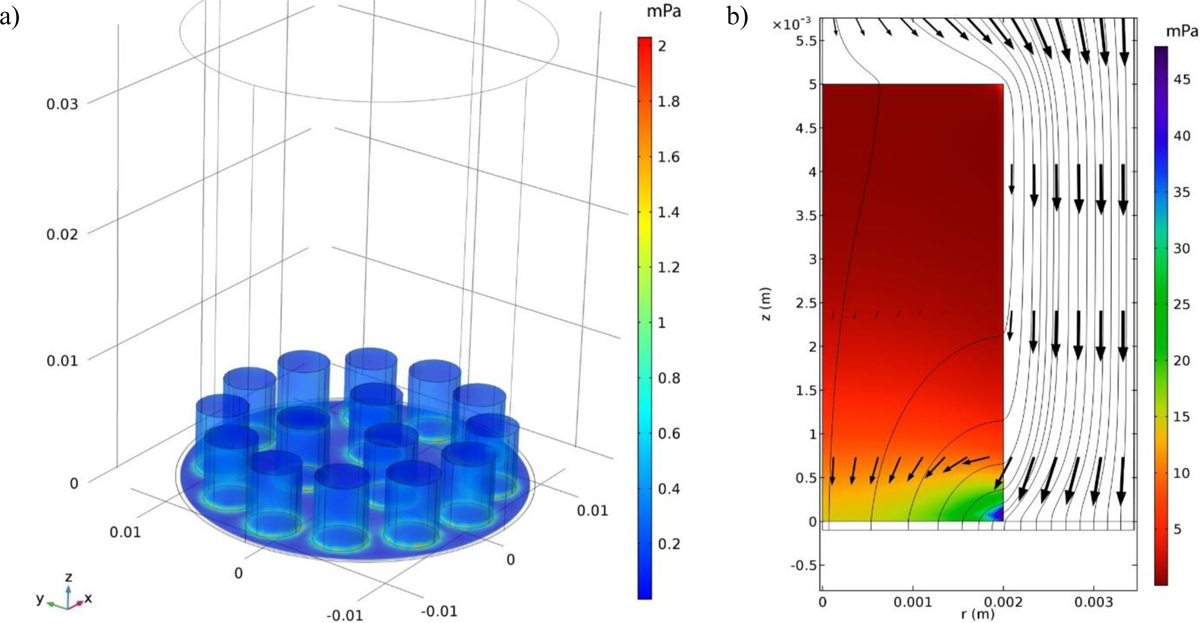
System modeling. a) surface plot of the z-component of shear stress for the 3D model in mPa and b) the pore-wall shear stress for flow past a single cylindrical porous scaffold assuming an axisymmetric geometry with the flow streamlines and velocity vectors on a logarithmic scale.
3.3. Viability and ECM production
Our novel perfusion approach did not show discernable differences in cell viability, as measured by AlamarBlue fluorescence on day 7 for the static and perfusion groups. This is illustrated in Figure 5a where hAChs in the static and perfusion groups showed no statistical differences either for CHAG or AG based on AlamarBlue fluorescence. However, mean viability values when hAChs were embedded in CHAG of 1.1 ± 0.2 ×10⁶ were 3.3-fold higher than mean viability values of 3.4 ± 1.2 ×10⁶ when hAChs were embedded in AG. Hence, we concluded that growing hAChs on CHAG scaffolds substantially boosts their viability. We support an argument that cell numbers are nearly equivalent among all constructs because of the lack of statistical differences in total DNA.
Figure 5.
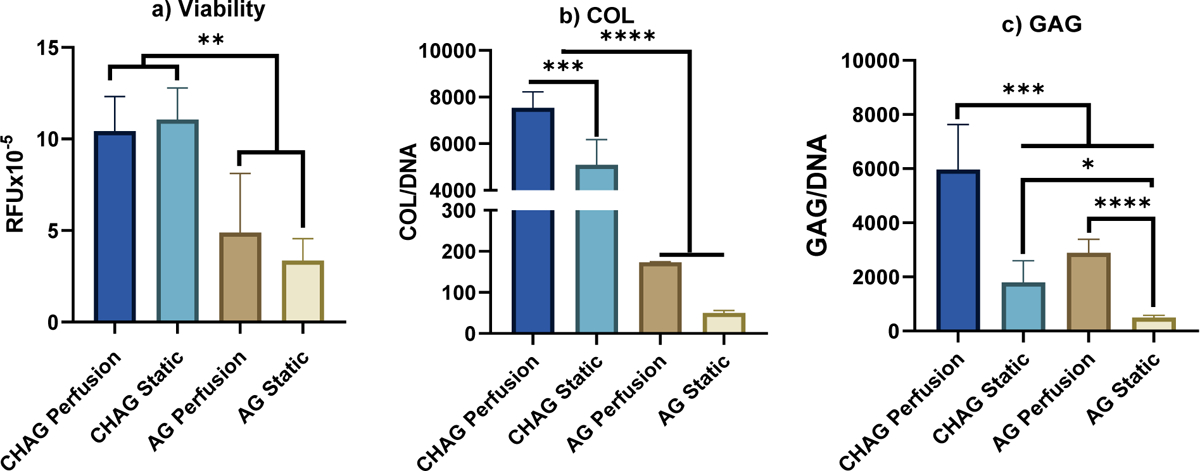
Viability and ECM deposition. Comparison of cell viability and biochemical content for cultures in porous chitosan-agarose (CHAG) scaffolds vs. those in agarose (AG) for perfusion and static cultures. a) Cell viability plotted as the fluorescence of AlamarBlue reagent by human articular chondrocytes (hAChs) in random fluorescence units (RFU) – relative amounts of DNA are not statistically different, supporting that the same total amount of cells is present for our calculation; b) normalized collagen (COL/DNA); and c) glycosaminoglycan (GAG/DNA). (N=5, *P < 0.05, **P < 0.005, ***P < 0.001, ****P < 0.0001)
COL and GAG deposition increased markedly when hAChs were cultured in CHAG compared to AG scaffolds, with further increases when perfusion was introduced as shown in Figures 5b&c. Baseline COL and GAG values for AG cultures were 52 ± 4 μg COL/μg DNA and 495 ± 85 μg GAG/μg DNA, respectively. COL and GAG values increased in AG scaffolds with perfusion by 3.7- and 5.32- fold, respectively, 114- and 2.8- fold, respectively, for static CHAG cultures and to maximal values of 150- and 11- fold, respectively for CHAG scaffolds with perfusion. When the static samples were compared to others of the same type under perfusion, significant increments were observed in GAG content between static and perfused AG samples. Normalized GAG content increased by 2300 or 4430 μg GAG/μg DNA when AG or CHAG scaffolds were subject to perfusion. COL content increased significantly by 1810 μg COL/μg DNA when CHAG scaffolds were subject to perfusion. As shown in Fig 5c, ECM production by hAChs was increased to levels that supersedes production in AG, when hAChs are seeded on porous CHAG scaffolds.
3.4. Gene expression quantification
As shown in Figures 6 a–c, perfusion increased the expression of genes encoding AC-specific proteins, COL2A1 which encodes for the alpha-1 chain of collagen type II, the major collagen in AC, and ACAN which encodes for aggrecan, the cartilage specific proteoglycan that mediates cell-cell and cell-ECM interactions, and downregulated COL1A1, the non-cartilaginous collagen, and NF-κB1, a transcription factor that is upregulated during OA and contributes to AC inflammation catabolism. The ratio of COL2A1 to COL1A1 and the relative expression of ACAN increased by 3.5- and 1.3-fold in CHAG cultures when the perfusion system was used. In contrast, gene expression of NF-B is significantly downregulated under interstitial perfusion. It has been demonstrated in a plethora of studies in the literature that levels of NF-kB expression by chondrocytes as measured by mRNA RT-PCR is always correlated with NF-kB protein expression as measured by western blotting or immunohistochemistry.25–29 Hence, we view our results as providing strong supportive evidence that because interstitial shear downregulates NF-κB1 mRNA expression, this infers downregulation of inflammatory signaling in AChs, resulting in upregulation of the anabolic and cartilage specific genes like COL2A1 and ACAN.
Figure 6. Gene expression for a) COL2A1/COL1A1, b) ACAN, c) NF-κB, d) MMP-13 relative to day 0.
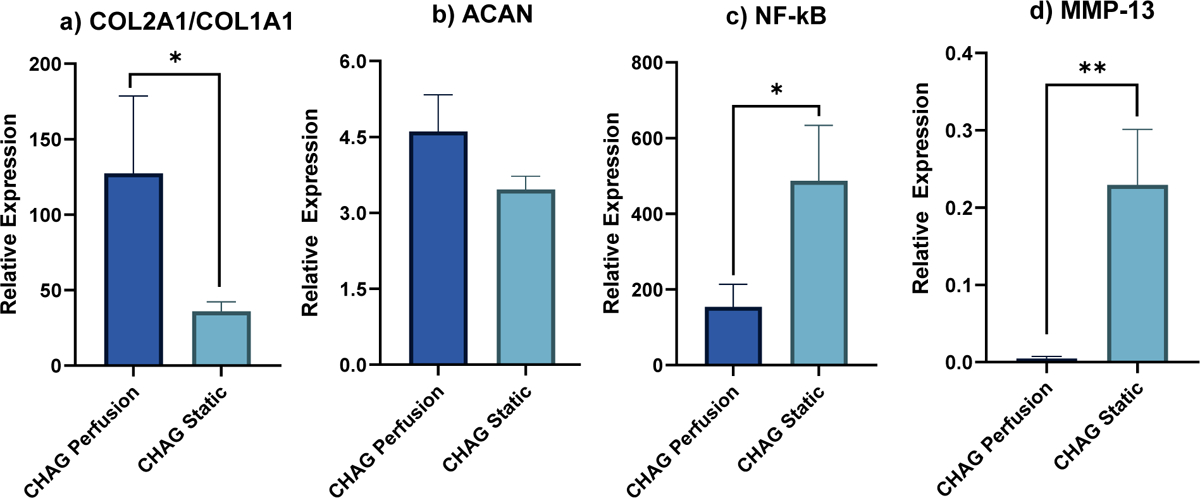
Comparison between expressions by hAChs seeded on CHAG scaffolds in static and under perfusion. (N=3, *P < 0.05, **P < 0.005)
3. Discussion
When the AG and the CHAG scaffolds are compared, the porous microstructure of CHAG is expected to promote the diffusion of nutrients to chondrocytes and as such improved cellular viability. This in turn will increase the net metabolic activity of cells and corresponding production of ECM components. The 3.3-fold increase in viability with CHAG culture over the AG culture offers strong supportive evidence that the CHAG structure promotes oxygen, nutrient, and metabolite convection with medium flow through the pores. In separate calculations (data not shown) we determined, with a glucose diffusivity of 6 × 10⁻¹⁰ m2/s in agarose, the critical diameter for glucose transport is 6 mm with cell-laden constructs. With a tighter matrix, diffusivities would be lower, and we are already approaching the size limit with our 4 mm constructs. For CHAG constructs with pores that are orders of magnitude larger transport of nutrients, metabolites and oxygen are certainly improved. Of interest is the increase in GAG content between the static and perfused AG and the static and perfused CHAG studies. The 4.4-fold increase in GAG nearly equals the enhanced viability supporting the premise that GAG production may be cell growth related. However, the 114-fold enhancement in COL is supportive of our premise that the increases in production of total COL is related to upregulation of the genes that code for collagen.
In contrast to the strong relation observed between scaffold porosity and cellular viability, perfusion had no direct effect on the viability (Figure 5a). Perfusion at a 11 mL/min within our novel system corresponds to an average superficial velocity of 0.33 mm/s and it led to ~0.3 mPa of shear on the surface of scaffolds and an additional shear of 40 mPa within the porous CHAG scaffolds. There were no significant differences between viabilities measured for static and perfusion samples, for both scaffold types. Again, the lower viability for AG implies that resistances to O2 and nutrient transport properties are greater for the AG than for CHAG. Raimondi et al. have reported enhanced metabolic activity, as measured by the MTT assay, by 1.4-fold when bovine AChs were seeded onto DegraPol® and exposed to 7 mPa of shear when compared to static cultures on the same scaffolds.16 Similarly, they have also reported a 2-fold increase in human ACh viability when exposed to shear at 0.5 mL/min.17 Their observations of increased metabolic activity are inconsistent with results achieved here, where no enhancement on viability with perfusion was observed. The inconsistency in observed effects of perfusion on viability may be explained by a couple of differences in the experimental procedures between Raimondi et al.’s work and ours. Raimondi et al. used higher shear rates in both studies and had longer culture periods of 15 days for bovine ACh and 4 weeks for human ACh. “Our analyses support an argument that perhaps the presence of pores within the scaffold is more critical for cell viability than the application of shear for short time frame cultures and when shear imposed is of the 10−4 Pa order of magnitude.”
This is the first study in which effects of external and interstitial perfusion shear stresses were quantified for COL production by human AChs. While superficial shear of 0.4 mPa caused an incremental 3.7-fold COL deposition in the AG scaffolds compared to static AG cultures, the upregulation was twice as much in CHAG relative to static AG cultures, more than an order of magnitude higher when exposed to an additional interstitial shear of 40 mPa. The COL deposition increased significantly by 1.3-fold between perfused and static CHAG cultures or by 1810 μg COL/μg DNA. This finding is particularly interesting, because it distinguishes the role of interstitial from superficial shear as a major stimulating factor for COL production, as the surface shear encountered by hAChs encapsulated in CHAG when compared to AG resulted in more than an order of magnitude increase in COL secretion. This is consistent with findings by Pazzano et al., where hydroxyproline content, a major component of collagen, increased by 1.6-fold when bovine ACh were cultured in poly-L-lactic acid (PLA), polyglycolic acid (PLLA/PGA) fibrous scaffolds and exposed to 1 μm/s flow over a static control.30 The shear stress was not computed in their study.
Increases observed in GAG deposition offer further confirmation about the critical role of interstitial flow in stimulating ECM production by AChs. Superficial shear significantly enhanced deposition of GAG within the bulk AG scaffolds by 5.3-fold when compared to AG static, but the difference between CHAG perfusion and static cultures was 3.9-fold or double the difference between AG perfusion and static cultures. The stimulatory effects of interstitial perfusion on the GAG production observed here are generally consistent with previous findings by other groups. Davisson et al. have reported increased GAG deposition by 1.4-fold when Ovine AChs cultured on PGA are exposed to a shear of 170 μm/s.14
Our work has identified crucial effects of interstitial perfusion that have not been reported before. When the expression of major anabolic genes of ACh, COL2A1 and ACAN, were quantified, an upregulation was observed when applying mild interstitial shear. While upregulation in ACAN was quantified in our study, for the first time we are aware of, similar upregulation in COL2A1 was reported previously by Raimondi et al. under 1 mPa of interstitial shear.16 However, unique to our study is the observance of the ratio of COL2A1/COL1A1 we observe from our data that is a 3.5-fold increase for CHAG perfusion over CHAG static culture. Taken collectively, the 1.32-fold increase in total COL deposition suggests that the upregulation in COL deposition is predominantly due to COL type II production and therefore the interstitial shear serves to provide an ECM more like that of AC.
No attempts in the literature were found where it was reported to describe the mechanism by which such positive effects influence cells. We hypothesize that interstitial perfusion promotes anabolic biochemical mechanisms within AChs by inhibiting the inflammatory cascade within the NF-κB inflammatory signaling pathway. We support our hypothesis with gene expression quantifications for the NF-κB1 gene. The NF-κB is a family of transcription factors that play a role in stress response and inflammatory diseases.31 When inactivated, NF-κB protein binds to inhibitors and is maintained in the cytosol.7 The activation of NF-κB by inflammatory molecules or mechanical stressors degrade NF-κB inhibitor, allowing NF-κB to translocate to the nucleus and bind to the DNA to induce transcription of inflammatory genes including MMP-13, which degrades the collagenous matrix of AC.32 The translocation of NF-κB also inhibits the promoter for COL2A1, resulting in downregulation of its expression.33 The expression of NF-κB is shown to be upregulated in cartilage diseases like osteoarthritis and rheumatoid arthritis.34
To conclude, we have shown than interstitial flow downregulates NF-κB activation, resulting in MMP-13 downregulation and COL2A1 and ACAN upregulation as shown in Figure 4.6. Our novel perfusion system and used it to investigate the effect of ultra-low shear stresses on ACh viability, ECM production and gene expression of critical AC markers by osteoarthritic ACh encapsulated within AG and porous CHAG scaffolds. We show that CHAG scaffolds enhance viability by 3.3-fold, and COL and GAG production by 114- and 4.4-fold, respectively, over AG scaffolds. We contrast the effects of superficial and interstitial shears and observe significant increments in COL and GAG deposition and COL2A1 and ACAN expression when CHAG scaffolds are exposed to low interstitial shear calculated by COMSOL modeling to have an average value of 40 mPa caused by average medium flow velocities in the 0.33 mm/s range. We used our novel system to propose a mechanism by which interstitial flow enhances the growth of engineered cartilage in vitro. Our data showed that interstitial flow suppresses the signals within the NF-κB inflammatory signal transduction pathway, which leads to increases in the expression of anabolic genes, COL2A1 and ACAN, and the deposition of critical ECM components, GAG and COL. These findings indicate that it is critical that implanted cartilage constructs need to be porous, to allow for interstitial flow and harness its beneficial effect in reducing inflammation. Results procured with our novel bioreactor design, provide a framework to further elucidate the interplay between mechanical stimulation and inflammatory suppression when starting with diseased AC tissues, and provide a tool for more comprehensive studies on inhibiting the catabolic genes in AChs isolated from osteoarthritic knees and optimizing AC engineering techniques.
While we demonstrate favorable outcomes with using a perfusion bioreactor to grow engineered AC on CHAG scaffolds in the current study, one limitation is that a single medium flowrate was tested. Studies are needed where different flowrate magnitudes and corresponding shear stresses are used to optimize the development of tissue-engineered AC under perfusion. Another limitation is that gene expression using RT-PCR was the only technique used to assess NF-kB expression. Although it has been demonstrated in the literature that mRNA always correlates with expression at the protein level, we plan to expand assays to include ELISA and Western blotting in our future experiments.
Acknowledgments
This work was supported financially by a National Science Foundation GOALI grant No.1606226 and Haneen Abusharkh was partially supported by a National Institute of Health T32 Protein Biotechnology Training Program, through grant No. GM008336-31. The authors would like to thank: 1) Alia Mallah and Mahmoud Amr for their contributions to discussions of principles related to this work; 2) Trey Reppe, an NSF REU research assistant, received training and experience in isolating human chondrocytes from tissues to the extent he was able to provide the bulk of the chondrocytes used in this study; and 3) the consenting study participants who donated cartilage post TKA surgery for the research.
Footnotes
Conflict of Interest Statement
The authors have no conflicts of interest to declare.
Data Availability
Data are available on request from the authors.
References
- 1.Deschner J, Hofman CR, Piesco NP, Agarwal S. Signal transduction by mechanical strain in chondrocytes. Curr Opin Clin Nutr Metab Care. May 2003;6(3):289–93. doi: 10.1097/01.mco.0000068964.34812.2b [DOI] [PMC free article] [PubMed] [Google Scholar]
- 2.Dolzani P, Assirelli E, Pulsatelli L, Meliconi R, Mariani E, Neri S. Ex vivo physiological compression of human osteoarthritis cartilage modulates cellular and matrix components. PLoS One. 2019;14(9):e0222947. doi: 10.1371/journal.pone.0222947 [DOI] [PMC free article] [PubMed] [Google Scholar]
- 3.Kisiday JD, Jin M, DiMicco MA, Kurz B, Grodzinsky AJ. Effects of dynamic compressive loading on chondrocyte biosynthesis in self-assembling peptide scaffolds. J Biomech. May 2004;37(5):595–604. doi: 10.1016/j.jbiomech.2003.10.005 [DOI] [PubMed] [Google Scholar]
- 4.Valhmu WB, Stazzone EJ, Bachrach NM, et al. Load-controlled compression of articular cartilage induces a transient stimulation of aggrecan gene expression. Arch Biochem Biophys. 1998;353(1):29–36. doi: 10.1006/abbi.1998.0633 [DOI] [PubMed] [Google Scholar]
- 5.Nazempour A, Quisenberry CR, Abu-Lail NI, Van Wie BJ. Combined effects of oscillating hydrostatic pressure, perfusion and encapsulation in a novel bioreactor for enhancing extracellular matrix synthesis by bovine chondrocytes. Cell Tissue Res. 10 2017;370(1):179–193. doi: 10.1007/s00441-017-2651-7 [DOI] [PMC free article] [PubMed] [Google Scholar]
- 6.Angele P, Yoo J, Smith C, et al. Cyclic hydrostatic pressure enhances the chondrogenic phenotype of human mesenchymal progenitor cells differentiated in vitro. Journal of Orthopaedic Research. 2003;21(3):451–457. [DOI] [PubMed] [Google Scholar]
- 7.Dossumbekova A, Anghelina M, Madhavan S, et al. Biomechanical signals inhibit IKK activity to attenuate NF-kappaB transcription activity in inflamed chondrocytes. Arthritis Rheum. Oct 2007;56(10):3284–96. doi: 10.1002/art.22933 [DOI] [PMC free article] [PubMed] [Google Scholar]
- 8.Chen J, Wu X. Cyclic tensile strain promotes chondrogenesis of bone marrow-derived mesenchymal stem cells by increasing miR-365 expression. Life Sci. Sep 2019;232:116625. doi: 10.1016/j.lfs.2019.116625 [DOI] [PubMed] [Google Scholar]
- 9.Wright M, Jobanputra P, Bavington C, Salter DM, Nuki G. Effects of intermittent pressure-induced strain on the electrophysiology of cultured human chondrocytes: evidence for the presence of stretch-activated membrane ion channels. Clin Sci (Lond). Jan 1996;90(1):61–71. doi: 10.1042/cs0900061 [DOI] [PubMed] [Google Scholar]
- 10.Sophia Fox AJ, Bedi A, Rodeo SA. The basic science of articular cartilage: structure, composition, and function. Sports Health. Nov 2009;1(6):461–8. doi: 10.1177/1941738109350438 [DOI] [PMC free article] [PubMed] [Google Scholar]
- 11.Poole AR, Kojima T, Yasuda T, Mwale F, Kobayashi M, Laverty S. Composition and Structure of Articular Cartilage: A Template for Tissue Repair. Clinical orthopaedics and related research. 2001. Oct 2001;(391 Suppl):S26–33. doi: 10.1097/00003086-200110001-00004 [DOI] [PubMed] [Google Scholar]
- 12.Smith R, Trindade MC, Ikenoue T, et al. Effects of shear stress on articular chondrocyte metabolism. Biorheology. 2000;37(1–2):95–107. doi: 10.1016/S0736-0266(02)00230-9 [DOI] [PubMed] [Google Scholar]
- 13.Chen T, Buckley M, Cohen I, Bonassar L, Awad HA. Insights into interstitial flow, shear stress, and mass transport effects on ECM heterogeneity in bioreactor-cultivated engineered cartilage hydrogels. Biomech Model Mechanobiol. May 2012;11(5):689–702. doi: 10.1007/s10237-011-0343-x [DOI] [PubMed] [Google Scholar]
- 14.Davisson T, Sah RL, Ratcliffe A. Perfusion increases cell content and matrix synthesis in chondrocyte three-dimensional cultures. Tissue Eng. Oct 2002;8(5):807–16. doi: 10.1089/10763270260424169 [DOI] [PubMed] [Google Scholar]
- 15.Freyria AM, Yang Y, Chajra H, et al. Optimization of dynamic culture conditions: effects on biosynthetic activities of chondrocytes grown in collagen sponges. Tissue Eng. 2005 May–Jun 2005;11(5–6):674–84. doi: 10.1089/ten.2005.11.674 [DOI] [PubMed] [Google Scholar]
- 16.Raimondi MT, Candiani G, Cabras M, et al. Engineered cartilage constructs subject to very low regimens of interstitial perfusion. Biorheology. 2008;45(3–4):471–8. [PubMed] [Google Scholar]
- 17.Raimondi MT, Boschetti F, Falcone L, Migliavacca F, Remuzzi A, Dubini G. The effect of media perfusion on three-dimensional cultures of human chondrocytes: integration of experimental and computational approaches. Biorheology. 2004;41(3–4):401–10. [PubMed] [Google Scholar]
- 18.Raimondi MT, Moretti M, Cioffi M, et al. The effect of hydrodynamic shear on 3D engineered chondrocyte systems subject to direct perfusion. Biorheology. 2006 2006;43(3,4):215–22. [PubMed] [Google Scholar]
- 19.Puetzer J, Williams J, Gillies A, Bernacki S, Loboa EG. The effects of cyclic hydrostatic pressure on chondrogenesis and viability of human adipose- and bone marrow-derived mesenchymal stem cells in three-dimensional agarose constructs. Tissue Eng Part A. Jan 2013;19(1–2):299–306. doi: 10.1089/ten.TEA.2012.0015 [DOI] [PMC free article] [PubMed] [Google Scholar]
- 20.Ng KW, Ateshian GA, Hung CT. Zonal Chondrocytes Seeded in a Layered Agarose Hydrogel Create Engineered Cartilage With Depth-Dependent Cellular and Mechanical Inhomogeneity. Tissue engineering Part A. 2009. Sep 2009;15(9):2315–24. doi: 10.1089/ten.tea.2008.0391 [DOI] [PMC free article] [PubMed] [Google Scholar]
- 21.Durlofsky L, Brady JF. Analysis of the Brinkman equation as a model for flow in porous media. The Physics of fluids. 1987;30(11):3329–3341. [Google Scholar]
- 22.Whittaker RJ, Booth R, Dyson R, et al. Mathematical modelling of fibre-enhanced perfusion inside a tissue-engineering bioreactor. J Theor Biol. Feb 2009;256(4):533–46. doi: 10.1016/j.jtbi.2008.10.013 [DOI] [PubMed] [Google Scholar]
- 23.Lavogina D, Lust H, Tahk MJ, et al. Revisiting the Resazurin-Based Sensing of Cellular Viability: Widening the Application Horizon. Biosensors. Mar 25 2022;12(4)doi: 10.3390/bios12040196 [DOI] [PMC free article] [PubMed] [Google Scholar]
- 24.Wąsik S, Arabski M, Dworecki K, et al. Laser interferometric analysis of glucose and sucrose diffusion in agarose gel. Gen Physiol Biophys. 2014;33(4):383–91. doi: 10.4149/gpb_2014016 [DOI] [PubMed] [Google Scholar]
- 25.Xu W, Li H, Chu K, et al. Effects of shuangtengbitong tincture on collagen-induced arthritis in rats. Molecular medicine reports. Nov 2013;8(5):1479–85. doi: 10.3892/mmr.2013.1693 [DOI] [PubMed] [Google Scholar]
- 26.Xu X, Li N, Wu Y, et al. Zhuifeng tougu capsules inhibit the TLR4/MyD88/NF-κB signaling pathway and alleviate knee osteoarthritis: In vitro and in vivo experiments. Frontiers in pharmacology. 2022;13:951860. doi: 10.3389/fphar.2022.951860 [DOI] [PMC free article] [PubMed] [Google Scholar]
- 27.Sun Y, Zhou L, Lv D, Liu H, He T, Wang X. Poly(ADP-ribose) polymerase 1 inhibition prevents interleukin-1β-induced inflammation in human osteoarthritic chondrocytes. Acta biochimica et biophysica Sinica. Jun 2015;47(6):422–30. doi: 10.1093/abbs/gmv033 [DOI] [PubMed] [Google Scholar]
- 28.Liang H, Yang X, Liu C, Sun Z, Wang X. Effect of NF-kB signaling pathway on the expression of MIF, TNF-α, IL-6 in the regulation of intervertebral disc degeneration. Journal of musculoskeletal & neuronal interactions. Dec 1 2018;18(4):551–556. [PMC free article] [PubMed] [Google Scholar]
- 29.Liu YX, Wang GD, Wang X, Zhang YL, Zhang TL. Effects of TLR-2/NF-κB signaling pathway on the occurrence of degenerative knee osteoarthritis: an in vivo and in vitro study. Oncotarget. Jun 13 2017;8(24):38602–38617. doi: 10.18632/oncotarget.16199 [DOI] [PMC free article] [PubMed] [Google Scholar]
- 30.Pazzano D, Mercier KA, Moran JM, et al. Comparison of chondrogensis in static and perfused bioreactor culture. Biotechnol Prog. 2000. Sep–Oct 2000;16(5):893–6. doi: 10.1021/bp000082v [DOI] [PubMed] [Google Scholar]
- 31.Agarwal S, Deschner J, Long P, et al. Role of NF-kappaB transcription factors in antiinflammatory and proinflammatory actions of mechanical signals. Arthritis Rheum. Nov 2004;50(11):3541–8. doi: 10.1002/art.20601 [DOI] [PMC free article] [PubMed] [Google Scholar]
- 32.Vincenti MP, Brinckerhoff CE. Transcriptional regulation of collagenase (MMP-1, MMP-13) genes in arthritis: integration of complex signaling pathways for the recruitment of gene-specific transcription factors. Arthritis Res. 2002;4(3):157–64. doi: 10.1186/ar401 [DOI] [PMC free article] [PubMed] [Google Scholar]
- 33.Peng H, Tan L, Osaki M, et al. ESE-1 is a potent repressor of type II collagen gene (COL2A1) transcription in human chondrocytes. J Cell Physiol. May 2008;215(2):562–73. doi: 10.1002/jcp.21338 [DOI] [PMC free article] [PubMed] [Google Scholar]
- 34.Levinger I, Levinger P, Trenerry MK, et al. Increased inflammatory cytokine expression in the vastus lateralis of patients with knee osteoarthritis. Arthritis Rheum. May 2011;63(5):1343–8. doi: 10.1002/art.30287 [DOI] [PubMed] [Google Scholar]
Associated Data
This section collects any data citations, data availability statements, or supplementary materials included in this article.
Data Availability Statement
Data are available on request from the authors.


