

Summary:
Striatal dopamine (DA) release has long been linked to reward processing, but it remains controversial whether DA release reflects costs or benefits, and how these signals vary with motivation. Here we measure DA release in the nucleus accumbens (NAc) and dorsolateral striatum (DLS) while independently varying costs and benefits, and apply behavioral economic principles to determine a mouse’s level of motivation. We reveal that DA release in both structures incorporates both reward magnitude and sunk cost. Surprisingly, motivation was inversely correlated with reward-evoked DA release. Furthermore, optogenetically-evoked DA release was also heavily dependent on sunk cost. Our results reconcile previous disparate findings by demonstrating that striatal DA release simultaneously encodes cost, benefit and motivation but in distinct manners over different time scales. Future work will be necessary to determine if the reduction in phasic DA release in highly motivated animals is due to changes in tonic DA levels.
eTOC Blurb
Eshel et al. combine economic analyses with dopamine recordings and manipulations to find that dopamine release in the striatum encodes both the magnitude of a reward and how much the mouse has worked for it. Furthermore, the higher the mouse’s motivational level, the lower the reward-evoked dopamine release.
Introduction:
Decision making requires a consideration of both costs and benefits, as influenced by motivation. Although mesolimbic DA release is crucial for reward learning and therefore decision making1–4, prior studies have disagreed over its role in encoding costs, benefits or motivation. On the one hand, disruptions to DA signaling in the NAc with pharmacological manipulations or lesions bias animals towards low-cost, less-preferred rewards rather than high-cost, more-preferred rewards without affecting reward preference or overall consumption5–8. These results led to the conclusion that NAc DA release primarily mediates cost calculations; that is, how much effort an animal exerts to obtain rewards. However, these studies often confounded cost and benefit by varying both simultaneously, and used tools that could not examine how DA activity dynamics in specific target structures underlie these behaviors. In contrast, studies of DA activity dynamics during instrumental tasks suggest that striatal DA more reliably encodes prospective benefit, not cost9–13. These studies, however, were mostly correlational and did not exploit causal tools such as optogenetics to explore how DA neuron activity directly influences behavior. Furthermore, DA recording studies have rarely explored changes in motivational state between individuals or across time except in studies of addiction, where there is longstanding debate over whether striatal DA release is sensitized14 or depleted15 once individuals transition to a highly-motivated, addicted state.
To address these limitations of previous work, we established a simple operant task that independently varies costs and benefits to generate behavioral economic demand curves in response to sucrose rewards or optogenetic stimulation of DA inputs. This approach yields a quantitative metric of motivation, defined by the willingness to overcome cost, independently from reward dose or preferred consumption at no cost. At the same time, we measured striatal DA release using a genetically-encoded sensor, allowing us to test how striatal DA release reflects costs, benefits and motivational state. We find that striatal DA release integrates cost and benefit on a trial-by-trial basis, and surprisingly, that high motivation dampens these signals. These findings reconcile discrepancies between prior studies on DA and help clarify the role of striatal DA signals in motivated behavior, although important questions still remain.
Results:
DA release in NAc and DLS signals both cost and benefit
Mice learned to poke in an active nosepoke hole for access to sucrose reward, accompanied by a brief light-sound cue (Figure 1A). Over training, mice increased the number of rewards earned in each session and decreased their latency to consume each reward (Figure 1B). Once they reached a behavioral criterion (see Methods), mice advanced to economic demand sessions, in which we varied the fixed ratio (FR, number of pokes required per reward) in 10-minute bins over 50 minutes. We considered the FR as the “cost” of reward, which the animals experienced in the following order: 46, 21, 10, 5, and 1 nosepoke(s). For each session, reward “benefit” was fixed at a single combination of sucrose concentration and quantity. Between sessions, however, we varied the concentration and quantity, such that mice experienced four different benefits: 5% and 10 μL, 5% and 25 μL, 32% and 10 μL, and 32% and 25 μL. As expected, mouse operant behavior was sensitive to both reward benefit (Figure 1C, left) and cost (Figure 1C, right).
Figure 1: DA release in NAc and DLS encodes both benefit and cost.
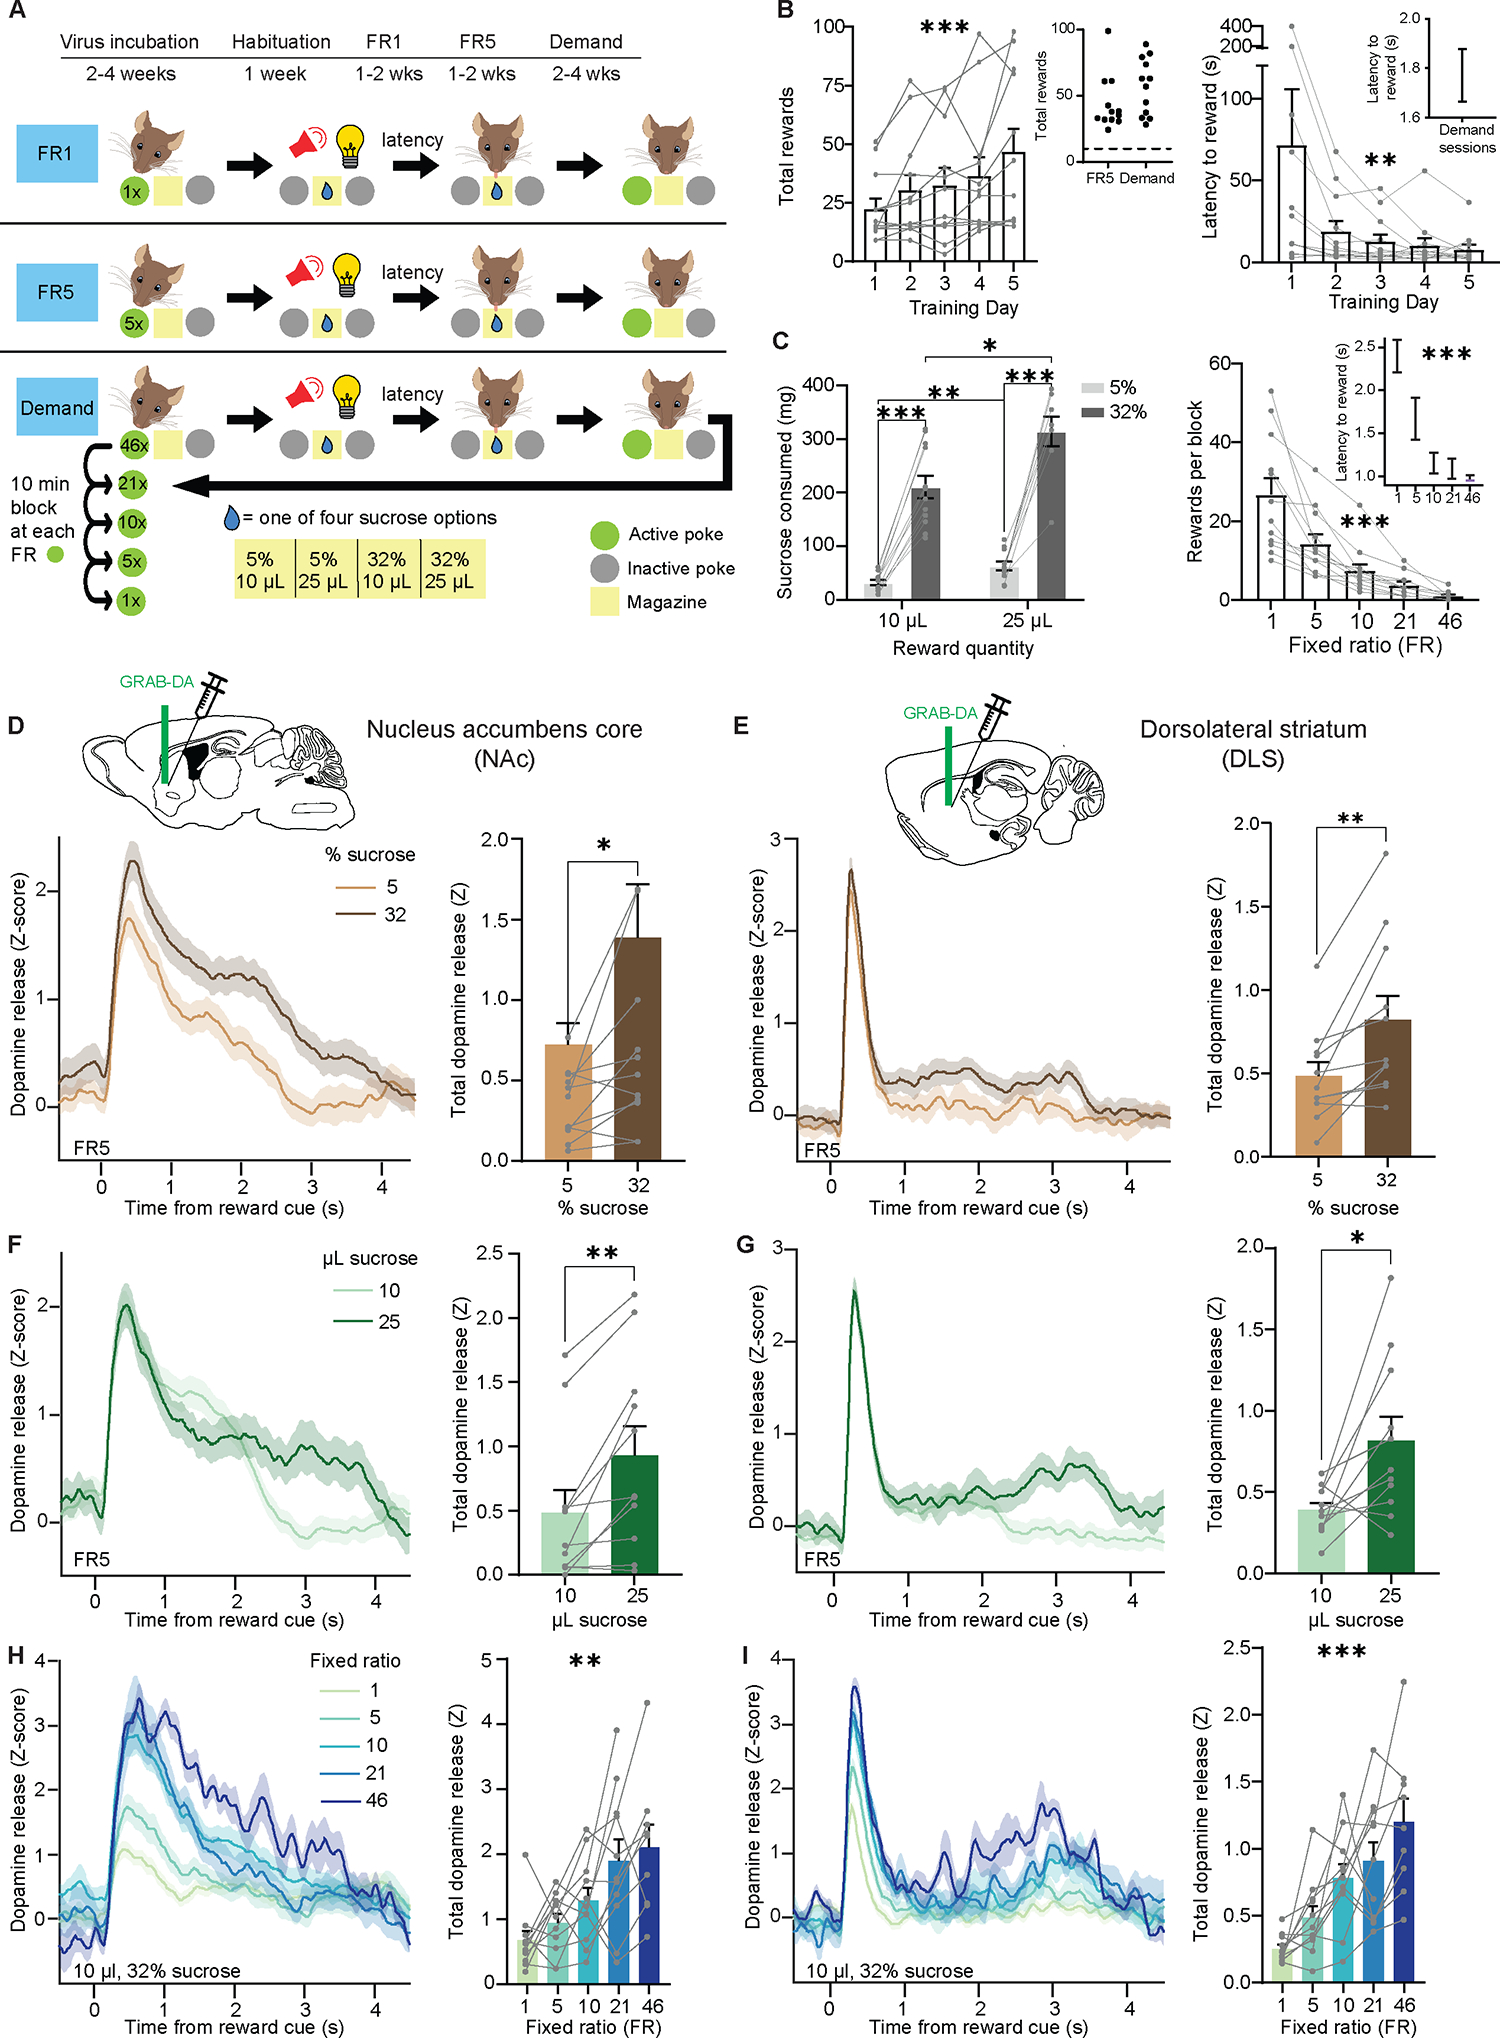
(A) Experimental timeline and schematic of behavioral task. FR, fixed ratio.
(B) Left, number of rewards earned each day during the first 5 days of FR1 training (Friedman test, Friedman statistic=22.4, P=0.0002; n=12). Inset, average number of rewards during FR5 training and demand sessions. Right, latency to enter reward port after light-sound cue (Friedman test, Friedman statistic=16.3, P=0.0026; n=12). Inset, latency after training during demand sessions.
(C) Left, sucrose consumed per session as a function of the quantity and concentration of each reward (Mixed-effects model, fixed effect of quantity, F1,11=17.9, P=0.0014; fixed effect of concentration, F1,11=176, P<0.0001; Tukey-corrected multiple comparisons: 10μL-5% vs 10μ-L32%, P<0.0001; 10μL-5% vs 25μL-5%, P=0.0029; 10μL-32% vs 25μL-32%, P=0.024; 25μL-5% vs 25μL-32%, P=0.0001; n=12). Right, average number of rewards earned for each FR (Friedman test, Friedman statistic=47.6, P<0.0001; n=12). Inset, latency to reward for each FR (Friedman test, Friedman statistic=36.4, P<0.0001; n=12)
(D-I), Left, Z-scored photometry traces of GRAB-DA fluorescence aligned to reward-predicting cues. Right, area under the curve (AUC) of Z-scored photometry traces from 0 to 4s after cue onset as a function of sucrose concentration (D: Wilcoxon matched-pairs signed rank test, W=50, P=0.024; n=12; E: Wilcoxon matched-pairs signed rank test, W=64, P=0.002; n=12), sucrose quantity (F: Wilcoxon matched-pairs signed rank test, W=62, P=0.003; n=12, G: Wilcoxon matched-pairs signed rank test, W=54, P=0.014; n=12) or FR (H: Friedman test, Friedman statistic=15.2, P=0.0043; n=12, I: Friedman test, Friedman statistic=24.2, P<0.0001; n=12). Recordings in the NAc (D, F, H) or DLS (E, G, I).
*P<0.05, **P<0.01, ***P<0.001. Error bars denote s.e.m. See also Figures S2–S4.
While mice performed this task, we used fiber photometry and the fluorescent sensor GRAB-DA16 to record DA release in two striatal regions (Figure S1): the NAc core, vital to reward learning and addiction17; and the DLS, long linked to movement initiation and habit formation18. In one influential theory, demand for drugs of abuse begins with DA release in the NAc, which then spirals up to the DLS once behavior becomes habitual19. However, compared to the NAc, many fewer studies have recorded DA release in the DLS during reward tasks.
We aligned our recordings to the cue denoting reward availability, as this cue stayed identical in all conditions even as the cost and benefit varied. Thus, any observed changes in DA release could not be due to the sensory qualities of the stimulus. To aid in comparison between and across sessions, the photometry signal was normalized per trial to a baseline shortly before cue onset (see Methods). As expected, we found that increased sucrose concentration (Figure 1D) and quantity (Figure 1F) enhanced cued DA release in the NAc. DLS DA exhibited the same overall pattern (Figure 1E and 1G), although the kinetics of the DA response in DLS was strikingly different, with a sharper initial peak and delayed effect of sucrose concentration.
Surprisingly, increased cost clearly enhanced DA responses in both regions (Figure 1H, I; Figure S2A–F), despite the cue and reward being held constant. Although “cost” can include both effort and time, our effect was not due solely to differences in the amount of time between rewards20, because even when we kept this time interval constant, DA release increased with increasing FR (Figure S3A, B). To determine whether the effect of cost on DA release might relate to the order the FRs were presented, we conducted two additional experiments. In one, we ran mice through the five FRs on different days, and still found the same effect (Figure S3C, D). In a second control experiment, we ran new cohorts of mice through two separate sessions: one where FR1 preceded FR10, and another where FR10 preceded FR1. Regardless of order, DA release was larger for the higher FR (Figure S3E–H).
We also considered if greater DA release at higher FRs was due solely to greater “surprise” rather than cost. First, we measured latency to reward consumption at different FRs and found that higher FRs corresponded to faster latency (Figure 1C, inset), contrary to the slowing effect we would expect with surprise21. Similarly, mice poked at a faster rate for the final pokes of each trial than for the first pokes of each trial, implying that they were not poking at random and could perhaps roughly estimate their progress (Figure 2A–C). Second, we measured DA release aligned to reward consumption rather than cue onset and found that increased cost was still associated with enhanced DA release, even though the preceding cue should have eliminated all surprise (Figure 2D, E). Third, we compared cue-evoked DA responses in the demand task with responses in a separate task in which rewards were delivered at randomly-selected intervals at least as long as those in the original task. In the same mice, we found that these maximally-surprising stimuli still elicited less DA release than high-FR trials in our demand task (Figure 2F–M), implying a more limited role for surprise. Fourth, we examined the effect of FR in the beginning vs the end of each block and found that the effect is stable (Figure 2N–Q). If the effect were driven by surprise, we would have expected it to dwindle by the end of each block, which we did not observe.
Figure 2: The effect of FR on DA release is not entirely explained by surprise.
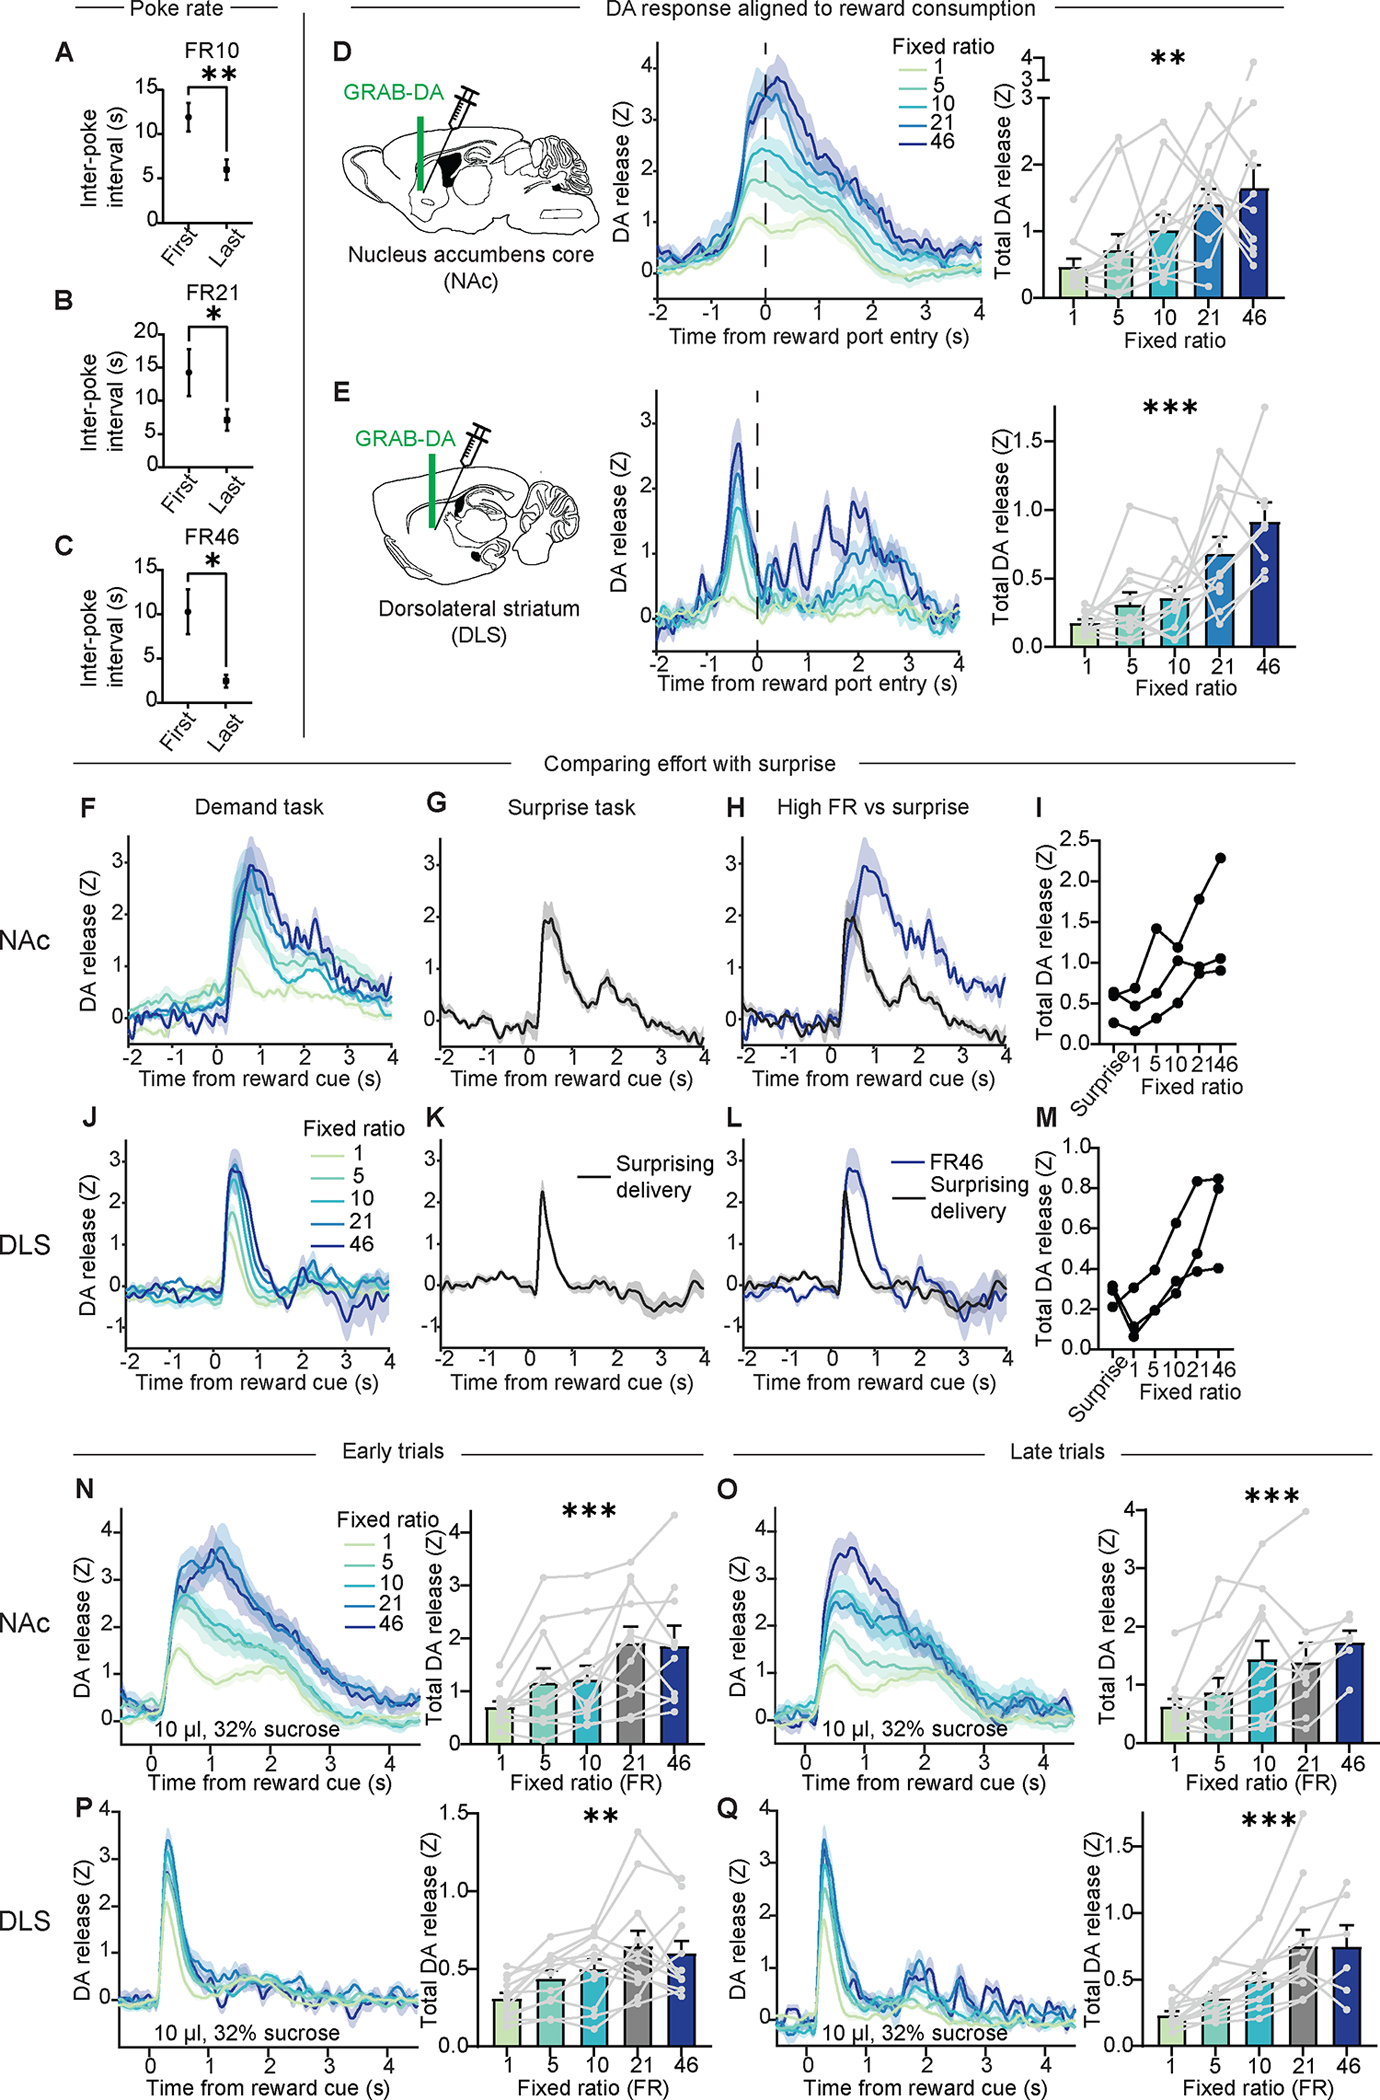
(A-C) Average inter-poke interval during the first 5 pokes vs the last 5 pokes of each trial in FR10 (A: Wilcoxon matched-pairs signed rank test, W=−74, P=0.0015; n=12), FR21 (B: Wilcoxon matched-pairs signed rank test, W=−54, P=0.034; n=12), or FR46 (C: Wilcoxon matched-pairs signed rank test, W=−54, P=0.014; n=11) blocks.
(D, E) Left, Z-scored photometry traces of GRAB-DA fluorescence in the NAc (D) or DLS (E) aligned to reward port entry when sucrose was available. Right, AUC of Z-scored photometry traces from 0 to 4s after reward port entry as a function of FR in the NAc (D: Mixed-effects model, F4,42=4.9, P=0.003; n=12) or DLS (E: Mixed-effects model, F4,37=9.48, P<0.0001; n=12).
(F, J) Z-scored photometry traces of GRAB-DA fluorescence in the Nac (F) or DLS (J) aligned to cue onset as a function of FR.
(G, K) Z-scored photometry traces of GRAB-DA fluorescence in the NAc (G) or DLS (K) aligned to cue onset in a task in which cued rewards were given at unpredictable intervals.
(H, L) Z-scored photometry traces of GRAB-DA fluorescence in the NAc (H) or DLS (L) from the same animals performing either the demand task (FR46, blue) or the surprise task (black).
(I, M) AUC of Z-scored photometry traces in the NAc (I) or DLS (M) from 0 to 4s after cue onset in response to surprising reward or rewards at various FRs (n=3).
(N-Q) Left, Z-scored photometry traces of GRAB-DA fluorescence aligned to cue onset in the NAc (N, O) or DLS (P, Q), in either the first half of trials in each block (N, P) or the last half of trials in each block (O, Q). Right, AUC of Z-scored photometry traces from 0 to 4s after cue onset as a function of FR (N: Mixed-effects model, F3,31.6=10.8, P<0.0001; n=12; O: Mixed-effects model, F2.5,22.9=8.4, P=0.001; n=12; P: Mixed-effects model, F2.27,25=7.2, P=0.0025; n=12; Mixed-effects model, F2.1,19.9=14.6, P=0.0001; n=12).
*P<0.05, **P<0.01, ***P<0.001. Error bars denote s.e.m.
As a final control, we trained mice in a new task with a different definition of cost -(Figure S4A, B). On each trial, the animals nosepoked for sucrose reward at FR1, and had a 30% chance of receiving a footshock in addition to the reward. The FR and the probability of shock always remained the same. For each 10-minute bin, however, we varied the intensity of potential footshock. We reasoned that the greater the intensity of probabilistic shock, the greater the “cost” of working for reward. We then analyzed DA release in response to non-shocked rewards, and found that there was greater DA release at higher cost (Figure S4C, D). Since the number of nosepokes and the probability of shock remained the same for each bin, it is unlikely that surprise alone can explain these findings. Note that in all of the above experiments, since fiber photometry does not reveal absolute DA levels, we cannot assess whether changes in baseline DA levels between blocks may be modulating phasic DA release. We conclude that in both striatal regions, phasic DA encodes both benefit and cost and that (sunk) cost positively correlates with DA release.
Economic demand curves dissociate consumption from motivation
To make rational decisions, individuals must combine cost and benefit to determine if the benefit is worth the cost. This cost-benefit calculus is at the heart of motivation22. To measure motivation, we turned to the classic economic analysis of demand curves23,24. For each session, we plotted reward consumption as a function of cost (Figure 3A), revealing two orthogonal parameters: Q0, the preferred level of consumption at no cost; and alpha, the sensitivity of consumption to cost (i.e., elasticity). Q0 is the y-intercept of the demand curve and is influenced predominantly by overall reward consumption or reward rate. In contrast, alpha, which depends on the demand curve’s slope, is inversely proportional to the subject’s motivation to obtain a reward25. In other words, Q0 measures reward preference when cost is minimal, while alpha measures an individual’s continued engagement with the task when the cost increases.
Figure 3: Economic demand curves dissociate consumption from motivation.
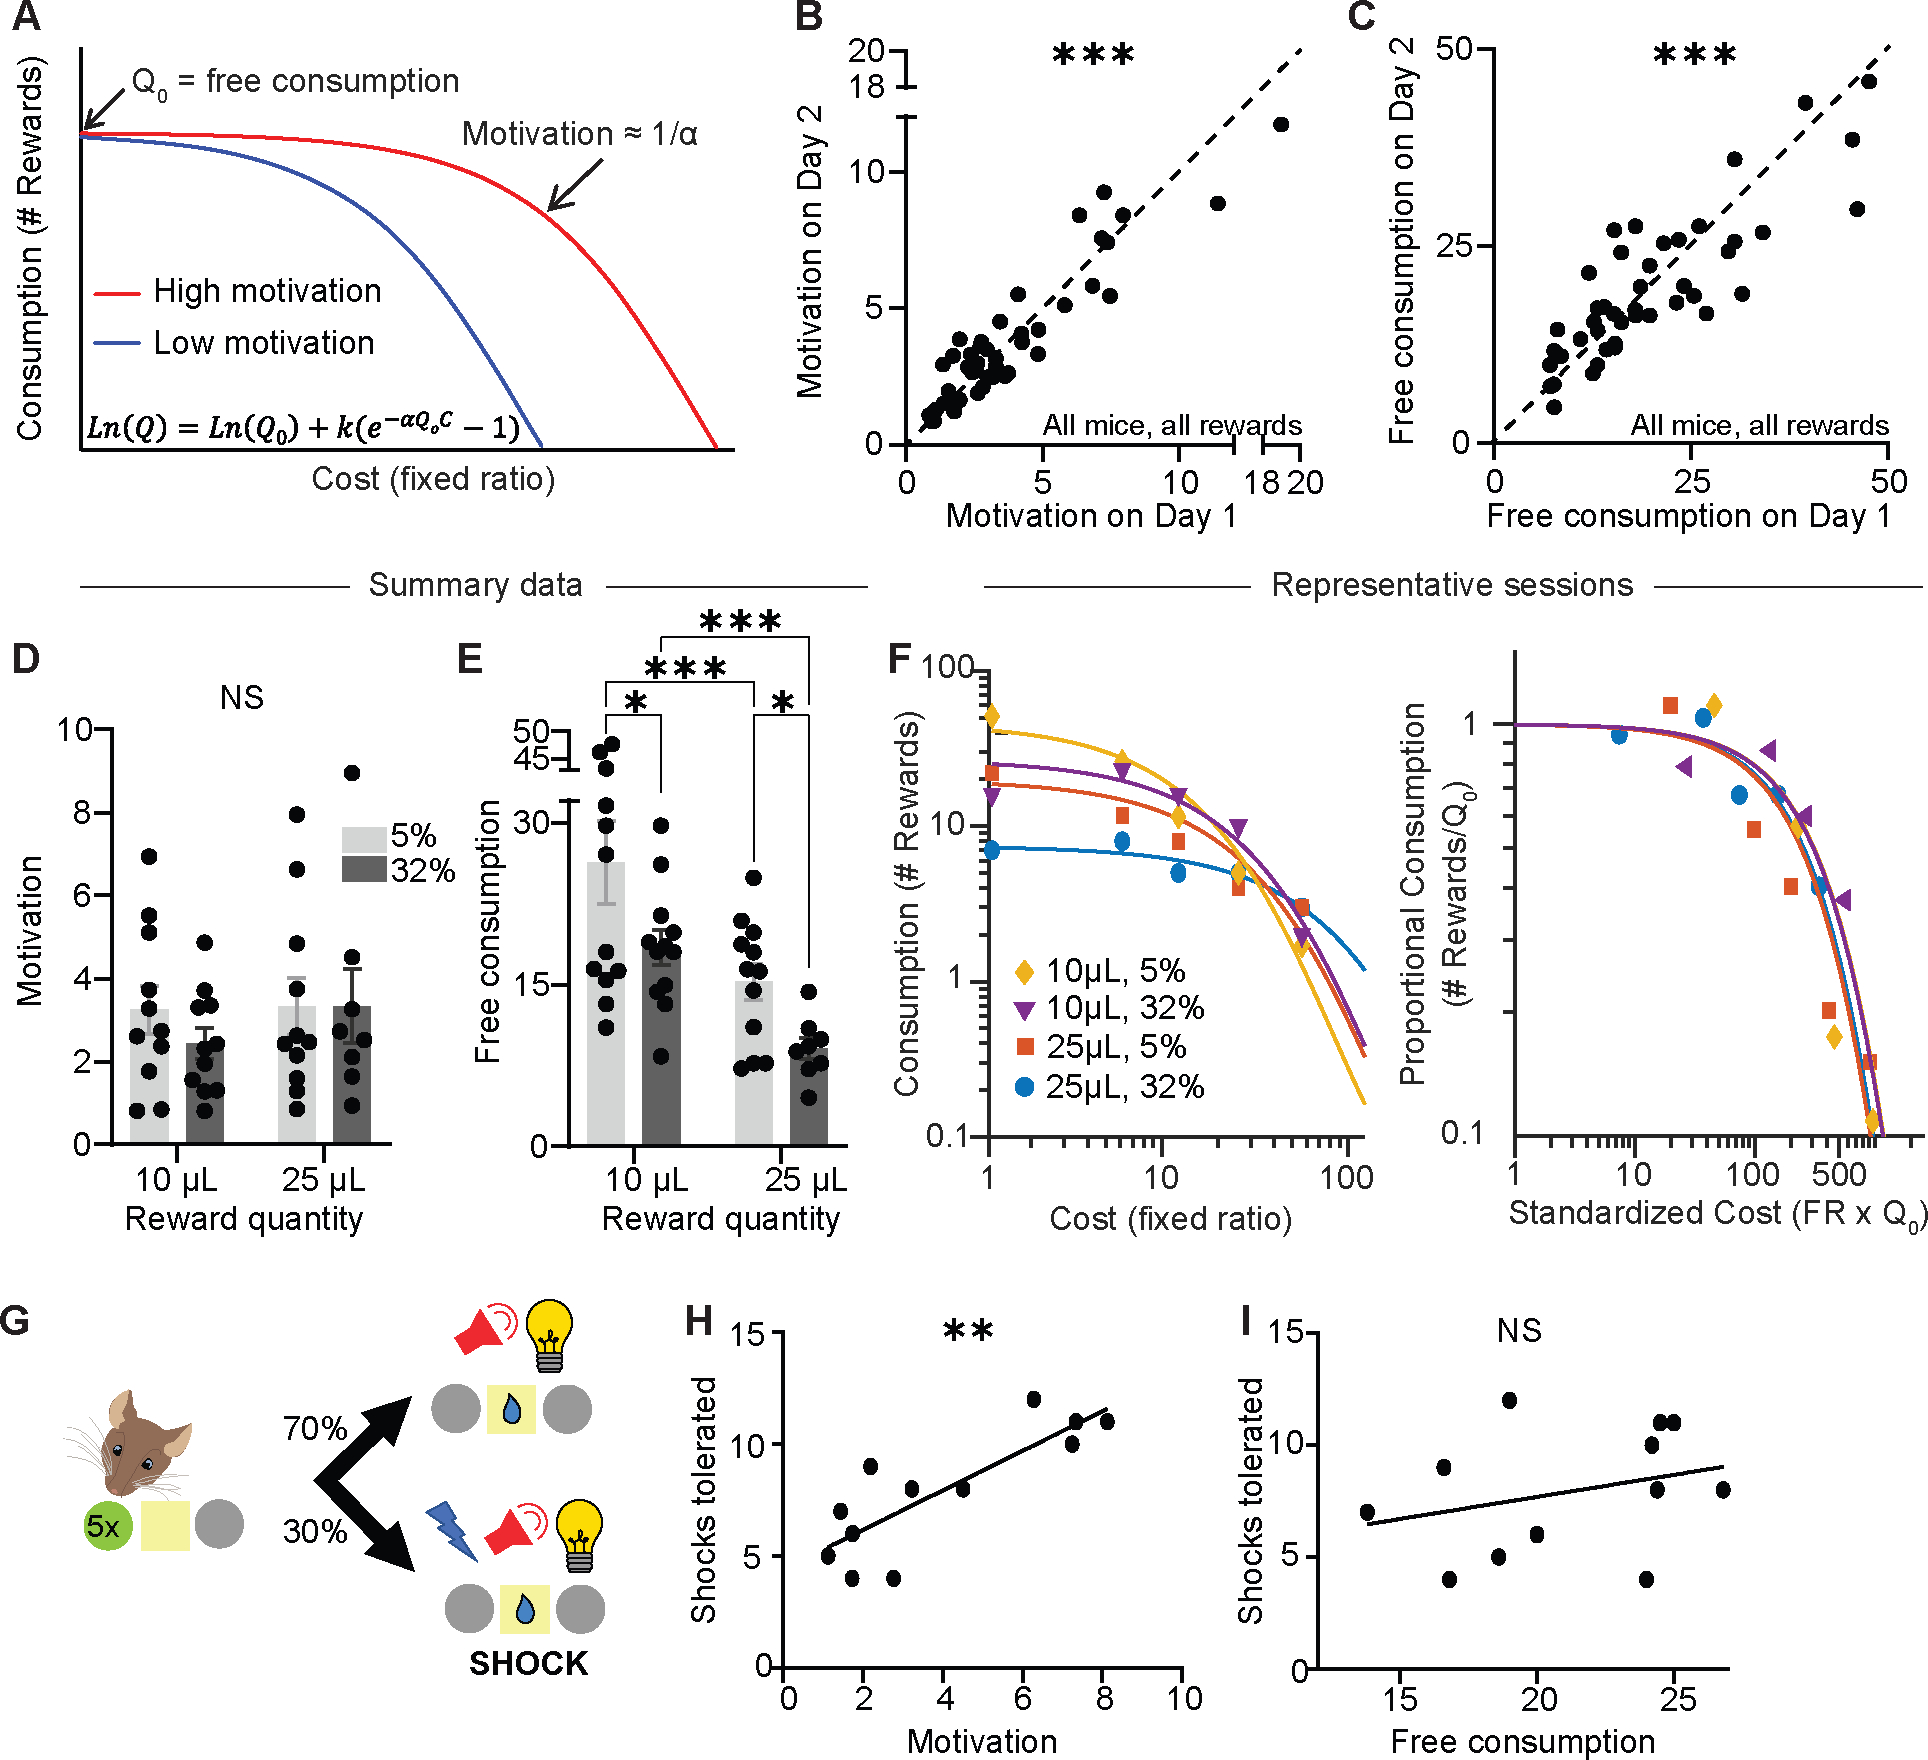
(A) Schematic demand curves plotting reward consumption as a function of cost. Shallower slope denotes higher motivation.
(B) Motivation parameter (1/alpha) on consecutive days with the same reward (Spearman correlation, r=0.86, P<0.0001; n=44 sessions from 12 mice). Dotted line is identity line.
(C) Free consumption parameter (Q0) on consecutive days with the same reward (Spearman correlation, r=0.82, P<0.0001; n=44 sessions from 12 mice). Dotted line is identity line.
(D) Average motivation as a function of sucrose quantity and concentration (Mixed-effects model, fixed effect of quantity, F1,11=3.95, P=0.073; fixed effect of concentration, F1,11=0.36, P=0.56; n=12).
(E) Average free consumption as a function of sucrose quantity and concentration (Mixed-effects model, fixed effect of quantity, F1,11=26.3, P=0.0003; fixed effect of concentration, F1,11=9.88, P=0.0093; Tukey-corrected multiple comparisons: 10μL-5% vs 10μL-32%, P=0.025; 10μL-5% vs 25μL-5%, P=0.0003; 10μL-32% vs 25μL-32%, P=0.0003; 25μL-5% vs 25μL-32%, P=0.025; n=12).
(F) Left, representative demand curves from a single mouse exposed to four rewards. Right, the same demand curves, now normalized by free consumption.
(G) Schematic of FR5 shock task.
(H, I) Previously-measured motivation (H: Spearman correlation, r=0.79, P=0.003; n=12) and free consumption (I: Spearman correlation, r=0.38, P=0.22; n=12) versus number of shocks tolerated.
NS, not significant; *P<0.05, ***P<0.001. Error bars denote s.e.m.
To validate that our analyses accurately reflected the consistency in subjects’ behavior, we repeated the same demand curve assays with a constant sucrose reward on consecutive days and found that our metrics for motivation (Figure 3B) and free consumption (Figure 3C) remained consistent, with minor day-to-day variability. Furthermore, varying the reward magnitude did not cause changes in alpha, our measure of motivation (Figure 3D), but did cause changes in Q0, the free consumption parameter (Figure 3E). This dissociation between motivation and free consumption is expected23, and helps ensure that the alpha parameter does not simply reflect the dose of the reward, but rather the animal’s motivational state (i.e., continued engagement at high cost). In a typical subject, free consumption varied from session to session as different sucrose rewards were provided (Figure 3F, left graph), but normalizing each demand curve by the free consumption (Figure 3F, right graph) revealed that alpha, the slope of the curve and hence the motivational pull of sucrose, remained consistent despite changes in dose.
As a final test of the validity of the task, we asked whether the alpha parameter predicted another common metric for motivation: tolerance to punishment. In this new task, mice received sucrose reward at FR5 on 70% of trials, and in the remaining 30% of trials, they received both sucrose reward and a mild footshock (Figure 3G). We found that the motivation parameter (1/alpha) calculated from previous demand curve assays (Figure 3H), but not the free consumption parameter, Q0 (Figure 3I), predicted the number of shocks a subject was willing to experience to obtain the reward. These results provide strong evidence that the behavioral economics task used in this study successfully measures motivation independently from dose or preferred consumption.
Striatal DA release inversely reflects motivational state
To determine how striatal DA release relates to motivation or reward consumption, we took advantage of the daily variation in subjects’ performance. Strikingly, DA release to a given fixed reward reflected motivation level (Figure 4A, B; Figure S2G–N) but not free consumption (Figure 4C, D). In sessions when mice were more motivated for a given reward, less DA was released in both striatal regions in response to the reward cue (Figure 4E, G and Figure S5A–F). Furthermore, group comparisons revealed that mice with higher average motivation levels exhibited lower average DA responses to a fixed reward in both ventral and dorsal striatum (Figure 4F, H). Thus, DA release reflects both day-to-day and individual-to-individual variability in motivation. In both cases, the lower the motivation, the higher the cue-evoked DA release. Furthermore, this effect was specific to the motivation parameter (1/alpha) but not the free consumption parameter (Q0). In a multiple linear regression, motivation was a significant predictor of DA response even after controlling for free consumption (NAc: F(1,78)=11.2, P=0.001; DLS: F(1,92)=5.5, P=0.02), and a simpler model including only the motivation parameter was superior to a model that included both motivation and free consumption (extra-sum-of-squares F test; NAc: F(1,78)=0.79, P=0.38; DLS: F(1,92)=1.8, P=0.19). Thus, our DA findings do not simply reflect changes in reward preference or consumption, but rather the willingness of the animal to pay increasing costs for that reward.
Figure 4: Striatal DA release inversely reflects motivational state.
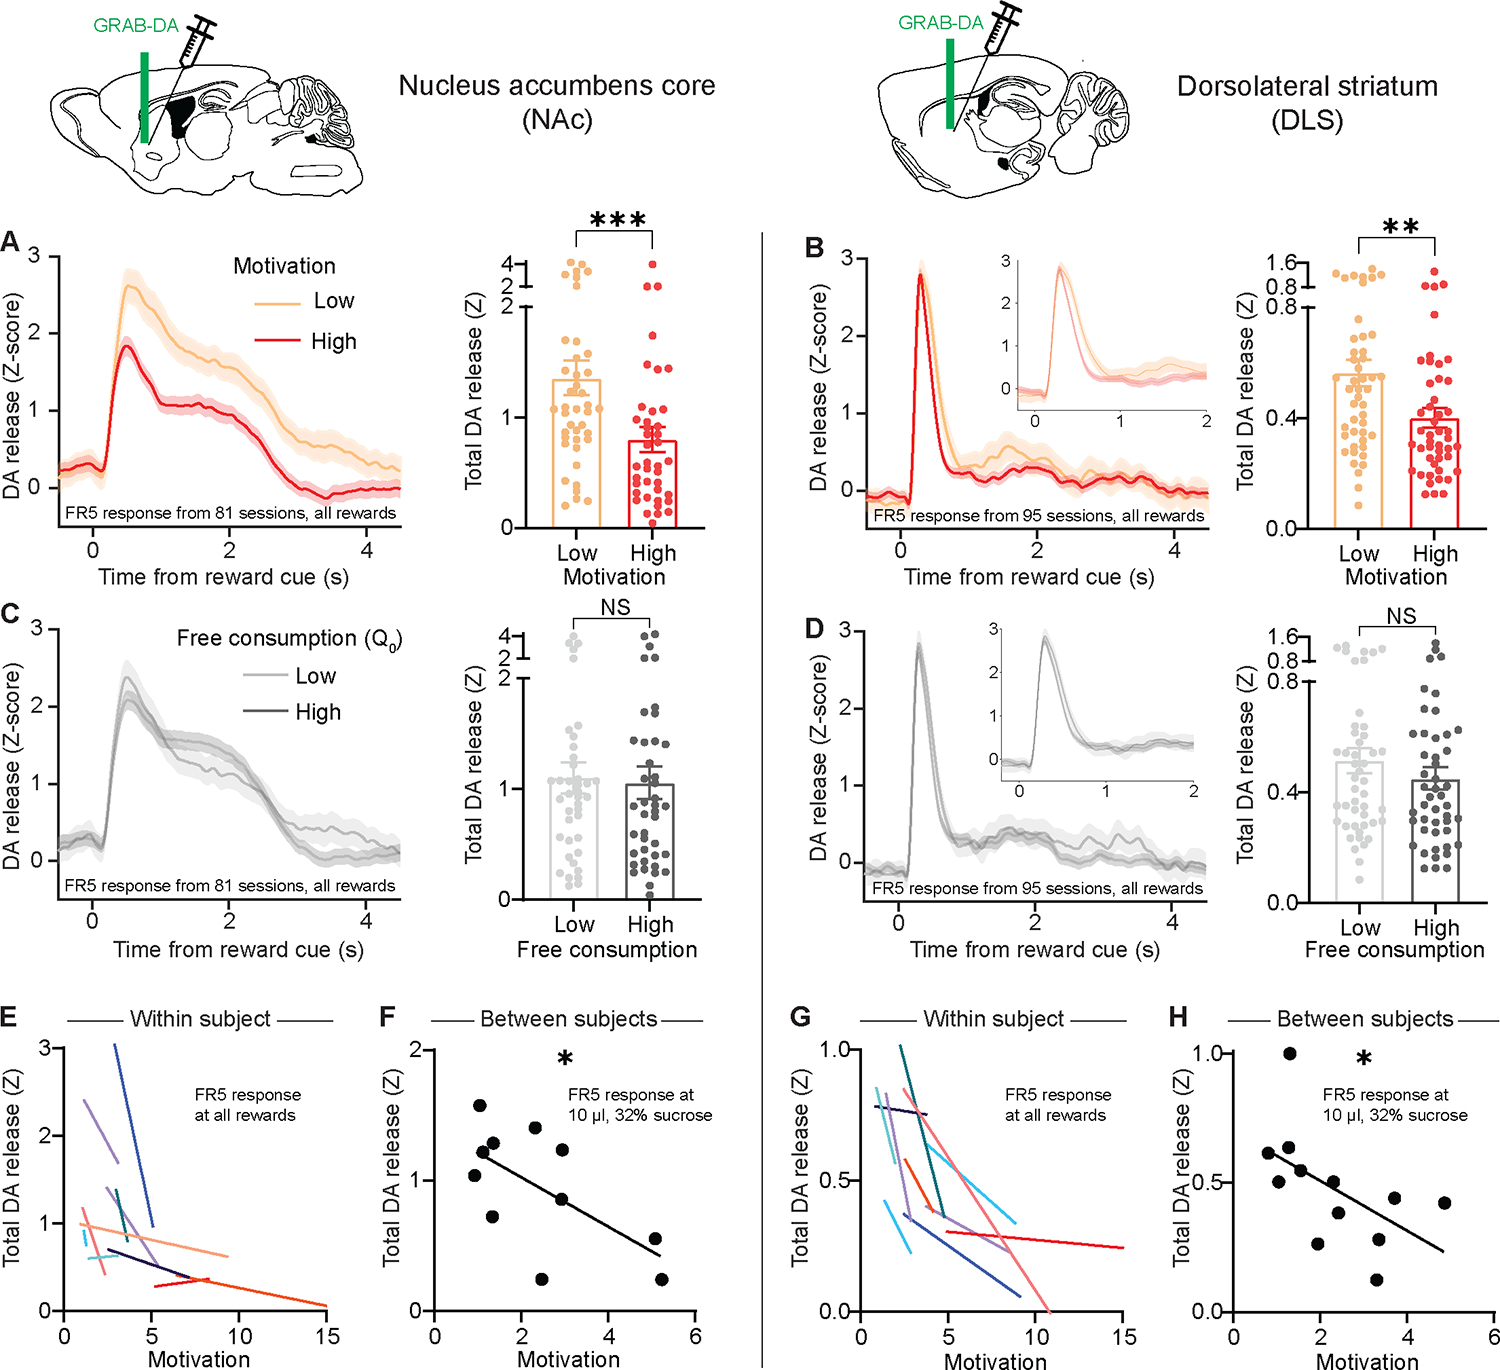
(A-D) Left, Z-scored photometry traces of GRAB-DA fluorescence in the NAc (A, C) or DLS (B, D) aligned to reward-predicting cues. Right, AUC of Z-scored photometry traces from 0 to 4s after cue onset as a function of motivation (A: Mann-Whitney test, U=475, P=0.001; n=81 sessions from 12 mice; B: Mann-Whitney test, U=735, P=0.0049; n=94 sessions from 12 mice) or free consumption (C: Mann-Whitney test, U=775, P=0.68; n=81 sessions from 12 mice, D: Mann-Whitney test, U=978, P=0.34, n=94 sessions from 12 mice).
(E, G) Motivation versus the AUC of cue-evoked GRAB-DA signal in the NAc (E) or DLS (G) for individual mice (each colored line denotes one mouse).
(F, H) Average motivation for 10 μL, 32% sucrose reward versus the average GRAB-DA signal for the cue predicting that reward in the NAc (F: Spearman correlation, r = −0.62, P=0.048; n=11) or DLS (H: Spearman correlation, r = −0.64, P=0.028; n=12). Throughout, “motivation” refers to 1/alpha as extracted from demand curves.
NS, not significant; *P<0.05, **P<0.01, ***P<0.001. Error bars denote s.e.m. See also Figures S2 and S5.
It is also possible that the mice were less organized or attentive in low-motivation sessions, and thus the reward might have been experienced as more surprising (causing higher phasic DA release due to higher reward prediction error). The fact that the motivation effect was present even at FR1, however (Figure S2G, H), makes this possibility unlikely, as reward was fully predictable in this block. Similarly, it is possible that mice in low-motivation sessions were more pessimistic about reward arrival than they were in high-motivation sessions, which could also augment phasic release through a prediction error mechanism. But again, this argument seems unlikely to apply to the FR1 block, in which the animal receives reward for each nosepoke.
Optogenetically-evoked striatal DA release is sensitive to cost.
All of the above results rely on sucrose reward, which is sensitive to circuits associated with taste and satiety. To bypass these circuits and examine the pure motivational effect of striatal DA release, in a separate group of mice we employed optogenetic self-stimulation. Each DAT-Cre mouse received two viral injections: one to deliver either the excitatory opsin ChRMINE or the inert fluorophore mScarlet in DA neurons of the ventral tegmental area (VTA) or substantia nigra pars compacta (SNc), and another to deliver GRAB-DA in the appropriate target in the NAc or DLS. We then implanted a fiber over the NAc or DLS, allowing us to simultaneously stimulate DA inputs and record the resulting DA release. The task was nearly identical as before, except that instead of poking for sucrose, mice poked for optogenetic stimulation of striatal DA release, accompanied by the same light-sound cue (Figure 5A). As expected, mice learned to poke for DA input stimulation in both the NAc (Figure 5B) and DLS (Figure 5D), increasing both the number of rewards (left) and poking accuracy (right) over training. Control mice without opsin did not learn the task for light stimulation in either NAc (Figure 5C) or DLS (Figure 5E).
Figure 5: Optogenetically-evoked striatal DA release is sensitive to sunk cost.
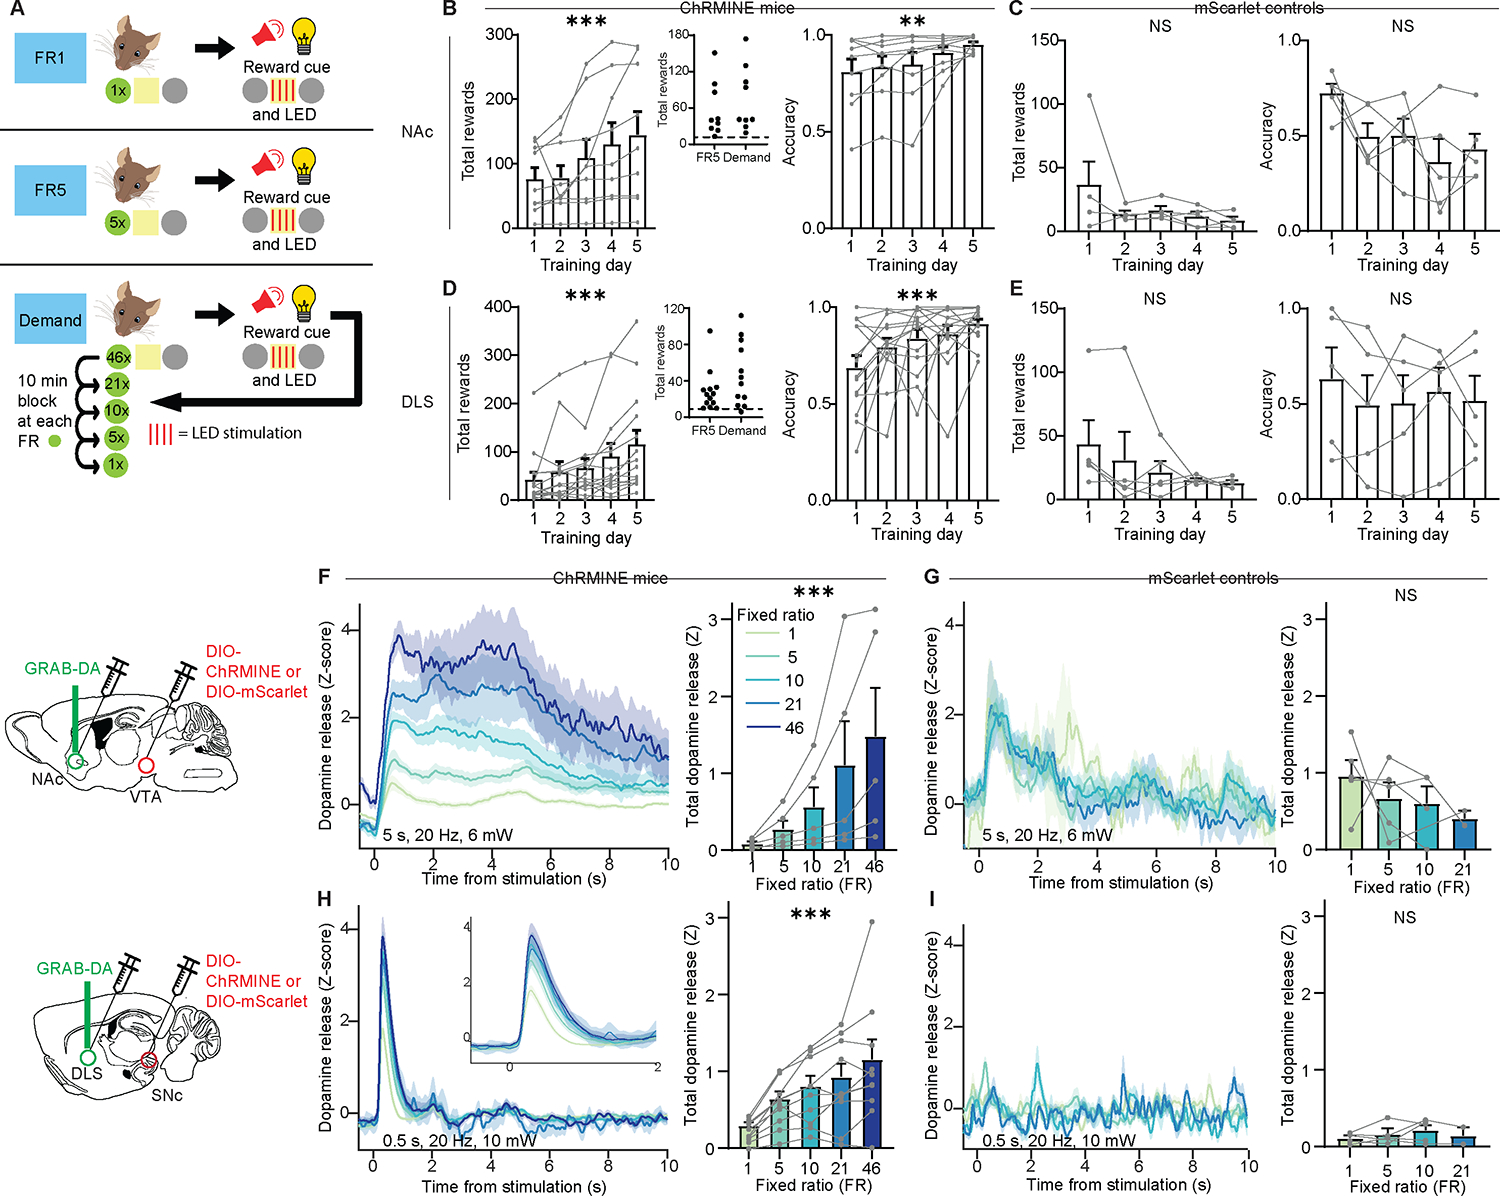
(A) Schematic of optogenetic self-stimulation task.
(B-E) Number of rewards earned each day (left) and fraction of nosepokes in the active poke (right) during FR1 training in mice with ChRMINE in the NAc (B: rewards, Friedman test, Friedman statistic=31.9, P<0.0001; n=9; accuracy, Friedman test, Friedman statistic=15.3, P=0.0042; n=9) or DLS (D: rewards, Friedman test, Friedman statistic=31.2, P<0.0001; n=14; accuracy, Friedman test, Friedman statistic=19.8, P=0.0006; n=14), or control mice with mScarlet in the NAc (C: rewards, Friedman test, Friedman statistic=9.01, P=0.061; n=5; accuracy, Friedman test, Friedman statistic=9.12, P=0.058; n=5) or DLS (E: rewards, Friedman test, Friedman statistic=2.87, P=0.58; n=5; accuracy, Friedman test, Friedman statistic=1.92, P=0.75; n=5). Insets in B and D, average number of rewards earned in FR5 and demand sessions.
(F-I), Left, Z-scored photometry traces of GRAB-DA fluorescence in the NAc (F, G) or DLS (H, I) aligned to optogenetic stimulation in ChRMINE mice (F, H) or mScarlet controls (G, I). Right, AUC of Z-scored photometry traces from 0 to 10s after stimulation onset as a function of FR in mice with ChRMINE in the NAc (F: Friedman test, Friedman statistic=20.0, P=0.0005; n=5) or DLS (H: Friedman test, Friedman statistic=32.4, P<0.0001; n=10) or control mice with mScarlet in the NAc (G: Mixed-effects model, F3,12=0.44, P=0.44; n=5) or DLS (I: Mixed-effects model, F3,8=0.81, P=0.52; n=5).
NS, not significant; *P<0.05, **P<0.01, ***P<0.001. Error bars denote s.e.m. See also Figures S6 and S7.
Despite using identical light stimulation parameters, as cost increased (i.e. the number of nosepokes required to receive stimulation), optogenetically-evoked DA release in both the NAc (Figure 5F) and the DLS (Figure 5H) increased. This result was not an artifact of the specific stimulation parameters we used, but held true with multiple different parameter combinations (Figure S6). Control mice, who occasionally nosepoked despite receiving no reward, exhibited no relationship between cost and DA release (Figure 5G, I). Although these results are consistent with the sucrose experiment (Figure 1H, I), they were unexpected in that they suggest that the effort put forth by a subject dramatically influences the magnitude of optogenetically-evoked striatal DA release, even with the exact same optogenetic stimulation. Factors such as fiber placement or viral expression level cannot account for the findings because we are reporting within-animal, within-session comparisons. Thus, we considered an alternative plausible interpretation: that the effect of varying the FR on optogenetic striatal DA release might reflect the longer interval between light stimulation during higher FRs. Perhaps at shorter time intervals, optogenetic stimulation of DA inputs depletes DA and reduces the amount of DA release for subsequent stimulations. However, when we analyzed trials with similar reward intervals at different FRs, the effect held (Figure S7A, B).
As a further test of the potential influence of the interval between optogenetic stimulations, we conducted an experiment under anesthesia, in which light stimulations were delivered at different intervals based on the average intervals for each FR in our task. Again, DA release was not influenced by the interval between light stimulations (Figure S7C, D). Finally, we considered if the order of FRs could explain the results; for example due to photobleaching of the sensor over the course of each session. We thus examined how DA release changed over time in a session where optogenetic stimulation was delivered without cost (Figure S7E, F) or with cost held constant (Figure S7G, H). In both cases, we found that DA release did not differ based on whether optogenetic stimulation was delivered at the beginning or the end of the session. Therefore, we conclude that DA release evoked by local optogenetic stimulation of DA inputs in both the NAc and DLS is greatly influenced by the effort put forth to gain that reward, i.e. the sunk cost.
Optogenetically-evoked DA release is inversely related to motivation
Analysis of behavioral economic demand curves provides a platform for determining the intrinsic motivational effects of striatal DA release. Similar to our experiments using sucrose as the reward, we took advantage of variations in motivation from day to day and mouse to mouse and compared optogenetically-induced DA release in high- versus low-motivation sessions. Consistent with previous results, DA release was greater during low motivation sessions in both the NAc and DLS (Figure 6A, B and Figure S5G–L). In contrast, the magnitude of free consumption did not affect optogenetic striatal DA release (Figure 6C, D). The inverse relationship between motivation and optogenetic striatal DA release held both within each subject (Figure 6E, G) and between subjects (Figure 6F, H), and for multiple different stimulation parameters (Figures S6). Thus, although DA release was required for animals to learn and perform the task (Figure 5C, E), greater optogenetic striatal DA release reflected lower motivation.
Figure 6: Optogenetically-evoked striatal DA release is inversely related to motivation.
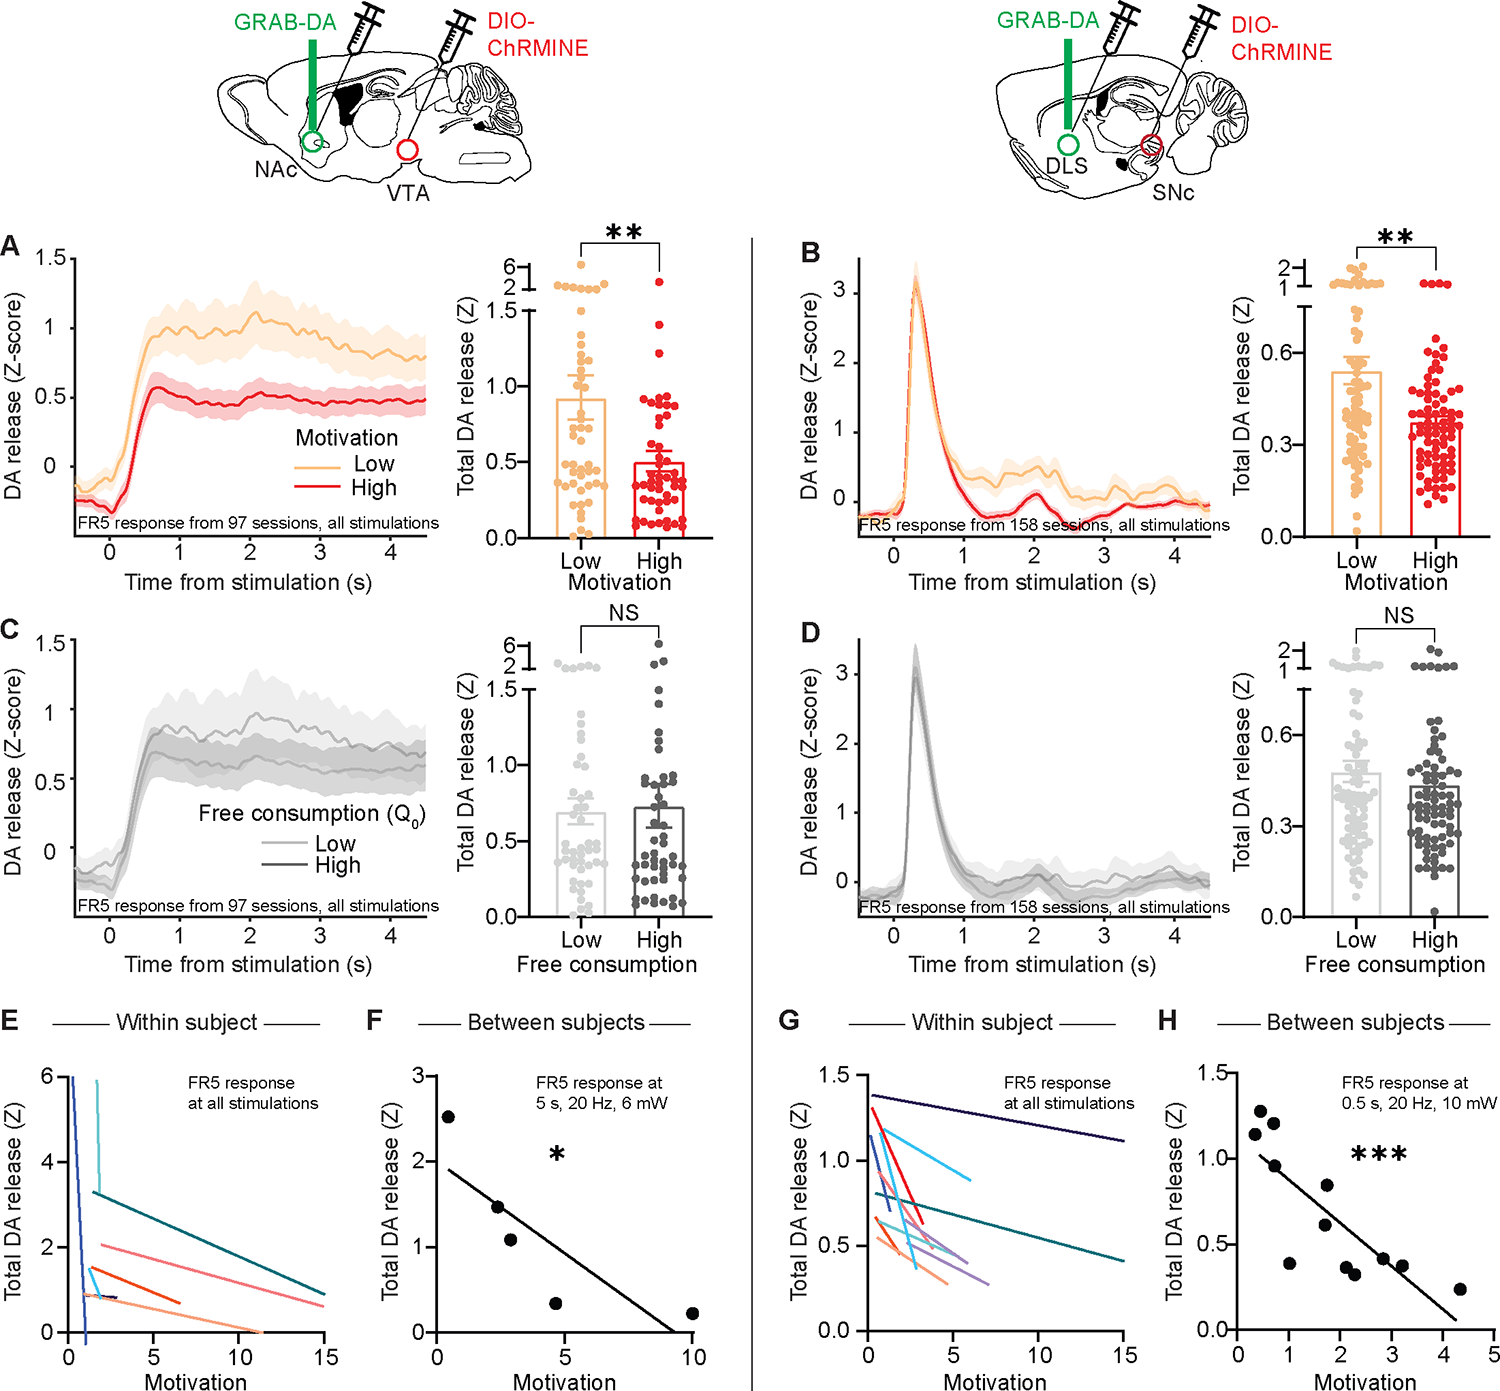
(A-D) Left, Z-scored photometry traces of GRAB-DA fluorescence in the NAc (A, C) or DLS (B, D) aligned to optogenetic stimulation. Right, AUC of Z-scored photometry traces from 0 to 4s after stimulation onset as a function of motivation (A: Mann-Whitney test, U=798, P=0.0061; n=97 sessions from 9 mice; B: Mann-Whitney test, U=2293, P=0.0038; n=158 sessions from 14 mice) or free consumption (C: Mann-Whitney test, U=1085, P=0.52; n=97 sessions from 9 mice; D: Mann-Whitney test, U=2812, P=0.29; n=158 sessions from 14 mice).
(E, G) Motivation versus the AUC of stimulation-evoked GRAB-DA signal in the NAc (E) or DLS (G) for individual mice (each colored line denotes one mouse).
(F, H) Average motivation for optogenetic stimulation reward versus the average GRAB-DA signal for that reward in the NAc (F: Spearman correlation, r = −1.0, P=0.017; n=5) or DLS (H: Spearman correlation, r = −0.86, P=0.0006; n=12). Throughout, “motivation” refers to 1/alpha as extracted from demand curves.
NS, not significant; *P<0.05, **P<0.01, ***P<0.001. Error bars denote s.e.m. See also Figures S5 and S6.
Testing the causal relationship between motivation and striatal DA release
By examining the behavioral variability that routinely occurs within and between subjects during our operant tasks, we provide evidence that the motivation to obtain a natural reward, sucrose, as well as the artificial, non-physiological “reward” of optogenetically-triggered striatal DA release, is inversely correlated with the magnitude of striatal DA release evoked by that reward. Our evidence thus far, however, cannot rule out an indirect or coincidental relationship between motivation and striatal DA release. To test the causal nature of this inverse relationship, we performed two further experiments. First, we sought to manipulate the intrinsic motivation for reward and observe the effect on striatal DA release elicited by that reward. To do so, we trained a new cohort of mice to nosepoke for sucrose reward and compared striatal DA release under two conditions: the standard condition, in which mice lack access to sucrose except for during the behavioral session; and a condition in which the animals had access to sucrose for 30 minutes before each behavioral session. As expected, prefeeding reduced motivation for sucrose (Figure 7A, C) and these sessions were associated with higher striatal DA release in response to the same sucrose reward that was provided during standard sessions (Figure 7B, D). Thus, a simple “natural” manipulation that reduced motivation for food without impairing task performance resulted in enhanced cued DA release in both the NAc and DLS.
Figure 7: Bidirectional relationship between motivation and striatal DA release.
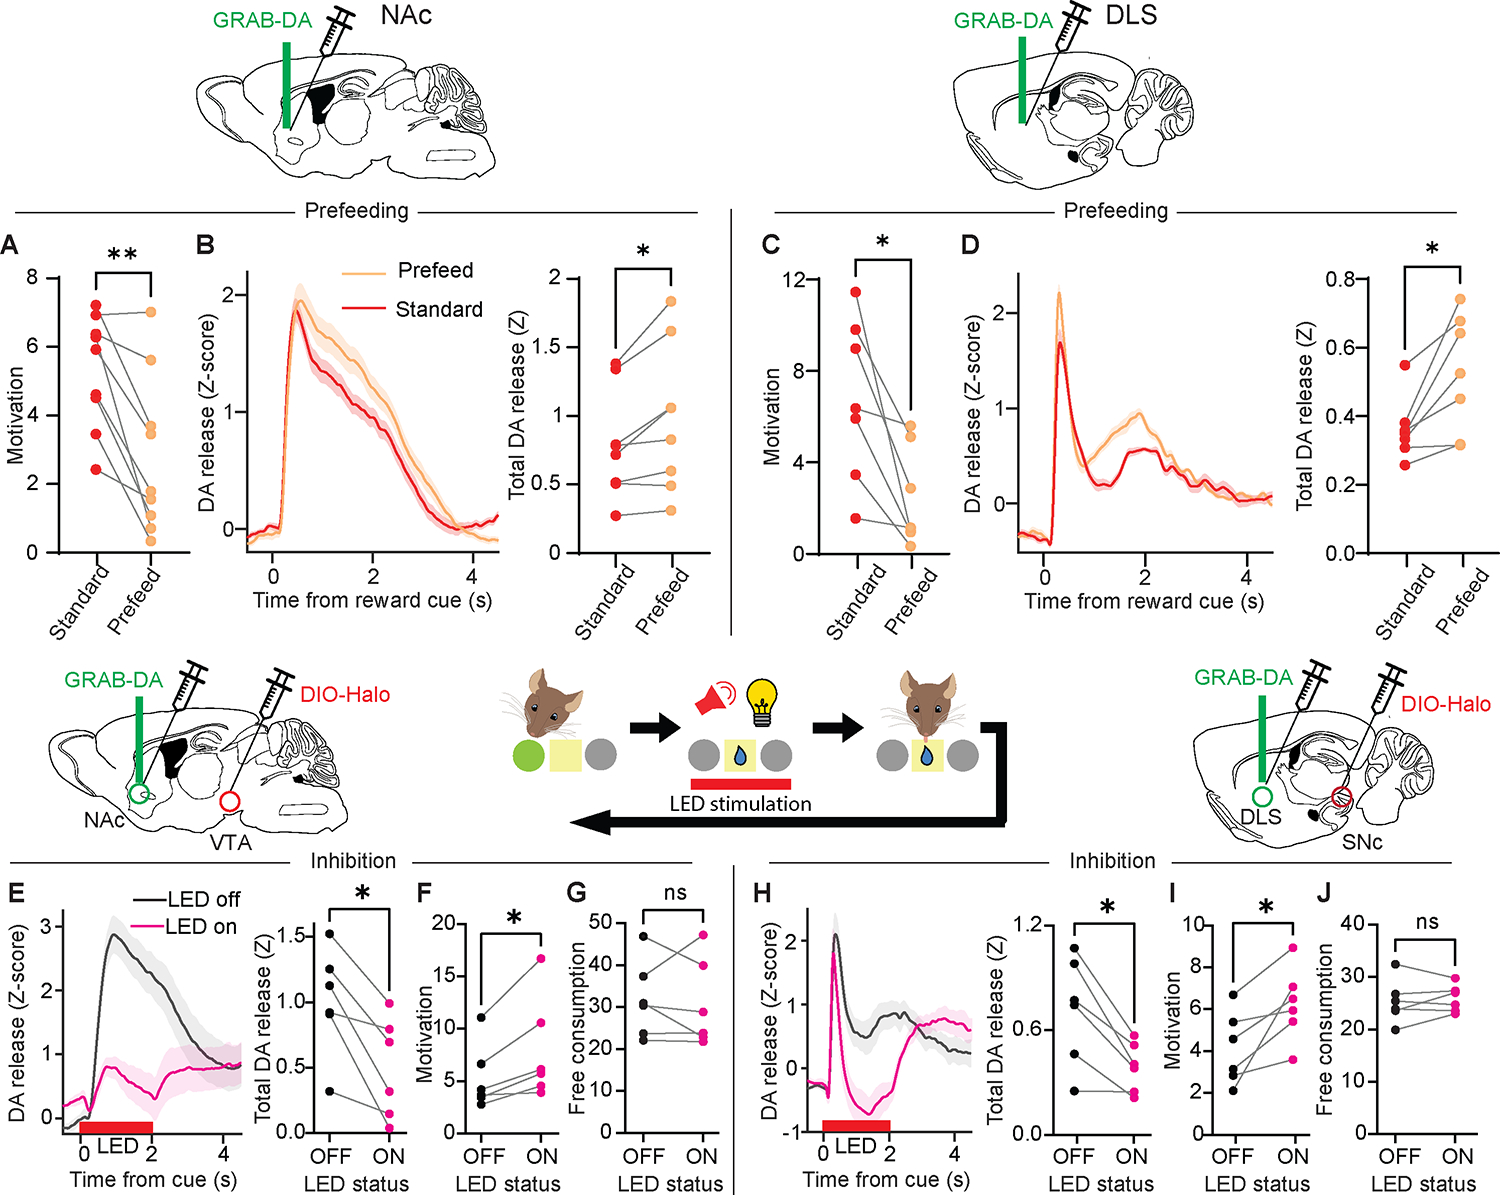
(A, C) Motivation (1/alpha) for the same sucrose reward after 24-hr sucrose deprivation versus 30-min unlimited sucrose consumption for mice with fiber implants in the NAc (A: Wilcoxon matched-pairs signed rank test, W=−43, P=0.0078; n=9) or DLS (C: Wilcoxon matched-pairs signed rank test, W=−28, P=0.016; n=7).
(B, D) Left, Z-scored photometry traces of GRAB-DA fluorescence in the NAc (B) or DLS (D) aligned to reward-predicting cues. Right, AUC of Z-scored photometry traces from 0 to 4s after cue onset in standard versus pre-fed conditions in the NAc (B: Wilcoxon matched-pairs signed rank test, W=34, P=0.016; n=8) or DLS (D: Wilcoxon matched-pairs signed rank test, W=28, P=0.016; n=7).
(E, H) Left, Z-scored photometry traces of GRAB-DA fluorescence in the NAc (E) or DLS (H) aligned to cue onset in the optogenetic inhibition experiment. Right, AUC of Z-scored photometry traces from 0 to 4 s after cue onset as a function of whether inhibitory optogenetic stimulation was delivered during the cue in the NAc (E: Wilcoxon matched-pairs signed rank test, W=−21, P=0.031; n=6) or DLS (H: Wilcoxon matched-pairs signed rank test, W=−21, P=0.031; n=6).
(F, I) Motivation (1/alpha) in sessions with or without optogenetic inhibition in the NAc (F: Wilcoxon matched-pairs signed rank test, W=21, P=0.031; n=6) or DLS (I: Wilcoxon matched-pairs signed rank test, W=21, P=0.031; n=6).
(G, J) Free consumption (Q0) in sessions with or without optogenetic stimulation in the NAc (G: Wilcoxon matched-pairs signed rank test, W=−7, P=0.56) or DLS (J: Wilcoxon matched-pairs signed rank test, W=5, P=0.69).
NS, not significant. *P<0.05, **P<0.01. See also Figure S5.
Second, we sought to manipulate the DA release elicited by a natural reward and observe the effect on motivation. A cohort of DAT-Cre mice received two viral injections: one to deliver the inhibitory opsin halorhodopsin (NpHR) in DA neurons of the VTA or SNc, and another to deliver GRAB-DA in the appropriate target in the NAc or DLS. We then implanted a fiber over the NAc or DLS, allowing us to simultaneously inhibit DA inputs and record the resulting DA release. Once mice recovered from surgery, we trained them to nosepoke for sucrose reward in the same paradigm as before. After stabilizing their performance on the behavioral economics task, we used light to inhibit DA release during the 2-sec reward cue on each trial. We found that NpHR stimulation successfully reduced DA release in the NAc (Figure 7E) and DLS (Figure 7H), and that this manipulation increased motivation for sucrose reward (Figure 7F, I), while maintaining similar levels of free consumption (Figure 7G, J; Figure S5M–P). We conclude that there is a direct, bidirectional relationship between striatal DA release and motivation for natural reward.
Discussion:
Striatal DA release has long been linked to motivation, but most studies of DA and motivation have not recorded DA activity dynamics, and most DA recording studies have not measured motivation. Here we employed concepts from behavioral economics to gauge motivation for both a natural reward, sucrose, and the artificial reward of optogenetically-evoked striatal DA release, all while recording DA transients in the NAc and DLS, two striatal regions implicated in reward processing and operant behavior.
Our experiments generated several surprising results that help resolve controversies about the functional roles of striatal DA. First, striatal DA encodes both reward magnitude and sunk cost, which is the cost that has already been paid. Prior studies have often examined DA responses before the cost is paid, finding minimal cost sensitivity9–13 even though DA manipulations do appear to affect cost calculations5–8. In addition, influential recent work has debated whether DA activity dynamics better reflect reward value26 or changes in reward value27, but these studies did not modulate cost and thus did not address how DA release signals cost-benefit trade-offs. By varying cost and measuring DA release after the cost is paid, we demonstrate robust cost sensitivity, helping resolve the longstanding debate about whether striatal DA release is primarily important for reward benefit or cost. Our results, consistent with recent work using single-unit electrophysiology in monkeys28, demonstrate that DA release encodes both. These results also provide a possible neural mechanism for the longstanding psychological observation that we value rewards more if we worked harder for them29.
Second, we found that striatal DA release elicited by optogenetic stimulation of DA inputs was highly context dependent in that it too was influenced by cost and motivation. Since we only activated DA axons, these results support the importance of local modulation of DA release30–33 in addition to input integration at the level of DA cell bodies. They also emphasize that behavioral context can influence the neural consequences of “simple” optogenetic manipulations.
Third, by leveraging individual and temporal variation in motivation, we demonstrate that there is a surprising inverse relationship between transient DA release and motivation. The higher the subject’s motivation (i.e., willingness to engage in the task at higher costs), the lower the phasic striatal DA release for a fixed reward, and vice versa. This finding may appear to contradict the commonly held notion that DA facilitates motivation4,34. However, one plausible explanation may be an inverse relationship between tonic DA (e.g., slowly-changing DA levels in target regions, determined by the pacemaker firing of DA neurons or local regulation at axon terminals) and phasic DA (e.g., the rapid, synchronized burst firing of DA neurons often elicited by salient stimuli). This inverse relationship has been hypothesized to exist for more than 30 years35 and has been observed in multiple contexts and striatal regions36–41. Such an inverse relationship would explain why microdialysis studies, measuring DA efflux over the course of minutes, have shown decreases in tonic DA with satiety42, and why pharmacological or genetic manipulations that change DA levels at longer timescales generally show increases in motivation with increases in DA tone5. In other words, the decreased phasic responses we observed here during high-motivation sessions may partially reflect higher tonic DA levels, which we cannot measure with fiber photometry but which have long been hypothesized to vary with motivational state43–46. Indeed, some classic computational models47 have suggested that tonic DA (which may determine an individual’s willingness to work) could exert a subtractive effect on phasic reward prediction errors.
The results of our pre-feeding experiment contrast with two prior studies showing decreases in cue-evoked DA release after pre-feeding48,49. However, these studies differed from ours in important ways. Specifically, pre-feeding either completely sated the animals and therefore eliminated their approach behavior altogether48 or maintained the animals’ motivation while reducing the value of one food item through selective satiety49. In our experiment, mice continued to work for and receive the same reward, with a modest decrease in motivation meant to mimic natural day-to-day variation. We designed our intervention so that animals would only be partially sated on the reward and would still perform the task (albeit with lower motivation, as shown in Fig. 7a and 7c). Furthermore, our findings are consistent with recent evidence that in a pain-induced low-motivation state, rats showed markedly higher phasic DA responses to reward50. In this paper, like our own, there was a modest reduction in motivation for a single reward and their DA findings were similar.
Our finding of reduced phasic DA release at higher levels of motivation is also consistent with the longstanding observation in stimulant addiction that the most severe drug users, who have high motivation to seek and ingest drugs of abuse, exhibit decreases in drug-elicited DA release, which predict the magnitude of drug use and craving51,52. Our findings suggest that chronic drug use, rather than simply triggering a dysphoric, low-DA withdrawal state53,54, may tap into a previously unknown mechanism that modulates striatal DA release depending on motivation. Furthermore, this mechanism appears to work in a qualitatively similar way in both the NAc and the DLS, although the two sites had different release kinetics, perhaps because of greater dopamine transporter expression55 and thus faster uptake56 in dorsal compared to ventral striatum.
Note that the effects of DA release will vary depending on their timing within a task. Our optogenetic manipulation (Fig. 7E–H) was timed to coincide with the cue guaranteeing reward delivery, which is when we observed a strong relationship between motivational state and DA levels (Fig. 4A–B). Manipulations at other timepoints may produce different behavioral effects57,58, although a recent study agreed that when animals are actively engaged in a task, DA stimulation may reduce motivation59.
DA release in the NAc has been shown to vary with reward rate, which often fluctuates in sync with motivation26,59. But motivation levels can vary even when the reward rate stays constant. Here we dissociate reward rate (closely related to free consumption) from motivation, and show that DA follows motivation, not reward rate. These findings imply that future work should be careful not to assume that total reward consumption (e.g., sucrose preference) is directly related to motivation, or to DA release. Rather, our work is consistent with the model, mostly drawn from pharmacology and lesion studies, that DA is more important for “wanting” than for “liking,” and “seeking” rather than “consuming”34,60. Our findings also extend the theory, based mainly on DA neuron recordings, that DA can act as a utility signal, incorporating not just objective reward magnitude but also preference1. Here we demonstrate that DA signals also incorporate variable levels of motivation, and that motivational influences can exert their effects even at the level of DA axon terminals.
We designed the behavioral task in this manuscript as an improvement to the progressive ratio (PR) task, which has been a common and useful tool to assess motivation. The PR task generally produces a single outcome: the breakpoint, which relates not only to the amount of work the animal is willing to expend, but also to the animal’s preferred level of reward consumption. In contrast, our task produces two orthogonal outcomes: free consumption (Q0) and willingness to work (alpha). In addition, the PR breakpoint may depend on several unrelated factors, including the specific ratios chosen by the experimenter, the time allotted to the task, an animal’s resistance to extinction, an animal’s reaction to surprise, and an animal’s response to declining rates of reinforcement23,61. Our task overcomes these limitations by taking advantage of behavioral economic demand curves, which do not depend on the specific ratios or session duration, do not necessitate extinction or declining rates of reinforcement, and at least partially control for the effect of surprise.
Our results support the proposal that striatal DA release encodes costs, benefits and motivation simultaneously but over different time scales. On a trial-by-trial basis, phasic striatal DA release integrates benefit size and sunk cost. This is consistent with classic reward prediction error theories, as the higher the reward “value” (i.e., larger reward or sunk cost), the higher the phasic DA response1–3. Motivation for rewards, in contrast, reflects a state that changes over slower time scales, consistent with recent work on hunger62,63, thirst63,64, and other internal homeostatic drives65,66. The phasic striatal DA signals encoding reward cues are dampened when motivation is high and augmented when motivation is low. As discussed above, one possible mechanism for this surprising inverse relationship is that higher motivation is associated with higher DA tone, which may downregulate phasic responses (e.g., through inhibitory autoreceptors). In other words, phasic and tonic DA signaling may encode complementary aspects of motivated behavior67: phasic DA release conveys information about stimulus identity and how it differs from expectation, while tonic DA levels may convey the level of engagement or motivation. Future work that simultaneously measures and manipulates phasic and tonic DA levels will be crucial to test this hypothesis.
Recent theoretical studies have proposed an accelerator/brake model of DA action in which a high motivational state “releases the brake” such that a lighter push on the accelerator (i.e. smaller DA release) is necessary to initiate an action, in this case picking up a reward68,69. The results here are consistent with such models. Future work that measures the downstream neural consequences of DA release in the striatum and other target regions may reveal how DA not only reflects motivation but also controls it.
STAR Methods:
RESOURCE AVAILABILITY
Lead contact
Further information and requests for resources and reagents should be directed to and will be fulfilled by the lead contact, Neir Eshel (neshel@stanford.edu).
Materials availability
This study did not generate new unique reagents.
Data and code availability
The datasets generated and/or analyzed in the current study are available from the lead contact upon reasonable request.
All original code is available in this paper’s supplemental information.
Any additional information required to reanalyze the data reported in this paper is available from the lead contact upon request.
EXPERIMENTAL MODEL AND STUDY PARTICIPANT DETAILS
Mice
Female and male mice, first-generation offspring of female CD-1 mice (Charles River, strain 22) and either male C57BL/6J mice (Jackson Laboratory, strain #664) or male DAT:IRES-Cre mice on a C57BL/6J background (Jackson Laboratory, strain #006660) were used as experimental subjects. This CD-1/C57 hybrid strategy was chosen to facilitate related research on aggressive behavior as previously validated70,71. All transgenic animals used in these experiments were genotyped and found to be heterozygous for Cre recombinase. Mice were group-housed before surgical procedures. After surgery, males were single-housed to reduce aggression within a cage. Behavioral experiments were conducted during the dark cycle (lights off at 09:00, on at 21:00) when mice were 10–24 weeks old. Mice were maintained under food restriction for all behavioral experiments (>80% body weight from baseline ad libitum period). All procedures complied with the animal care standards set forth by the National Institutes of Health (NIH) and were approved by the Stanford University Administrative Panel on Laboratory Animal Care and Administrative Panel of Biosafety.
METHOD DETAILS
Stereotactic injections and viruses
Mice (8–12 weeks of age) were anesthetized with isoflurane (5% induction, 1–2% maintenance). Meloxicam (5 mg/kg) was administered subcutaneously at the start of surgery and 24 and 48 hours after. Heads were fixed on a Kopf stereotaxic apparatus, a small incision was made in the scalp, and burr holes were drilled in the skull over the sites of injection. The following bregma coordinates were used: VTA, −3.1 mm anteroposterior (AP), ±0.7 mm mediolateral (ML), 4.2 mm dorsoventral (DV) from dura; SNc, −3.1 mm AP, ±1.0 mm ML, 4.3 mm DV; NAc, 1.5 mm AP, ±0.9 mm ML, 4.2 mm DV; DLS, 0.8 mm AP, ±2.3 ML, 3.1 mm DV. Microliter syringes (Hamilton) were lowered to the specified depth from the dura and used to inject 0.5 μL of virus solution at a flow rate of 0.1–0.25 μL min−1. For experiments with two viral injections in the same location (e.g., for optogenetic stimulation and photometry recording), a total of 1 μL mixed solution was injected. Borosilicate optic fibers for photometry and/or optogenetic stimulation with 400-μm diameter and numerical aperture 0.66 (Doric) were implanted directly above the striatal virus injection site, ipsilateral to the midbrain virus injection site, and secured to the skull using light-cured dental adhesive cement (Geristore A&B paste, DenMat). For the cohort with recordings in both NAc and DLS (Figure S1a), the NAc and DLS fibers were implanted in different hemispheres. For other cohorts, the hemisphere was counterbalanced between mice.
Adeno-associated viruses (AAVs) used for stereotactic injections were AAV9-hSyn-DA2m (DA4.4, WZ Biosciences), AAV-8-EF1α-DIO-ChRmine-mScarlet-WPRE (Stanford Gene Vector and Virus Core), AAV-8-EF1α-DIO-mScarlet-WPRE (Stanford Gene Vector and Virus Core), and AAV-DJ-EF1α-DIO-NpHR3.0-mCherry (Stanford Gene Vector and Virus Core). AAV titres ranged from 1 × 10¹² to 2 × 10¹³ gc ml−1.
Optogenetic manipulations
For photostimulation of ChRMINE or NpHR, optical implants were connected to a 625nm LED light source (Prizmatix) via a plastic fiber (1mm diameter, NA 0.63) and a fiber optic rotary joint (Doric). For the data presented in Figure 5 and Figure S7, NAc stimulation was kept at 5 s, 20 Hz and 6mW, while DLS stimulation was kept at 0.5 s, 20 Hz and 10 mW, all with a pulse width of 10 ms. This difference in duration was chosen to mimic sucrose-evoked DA release, which is dramatically longer in the NAc than in the DLS. Although these parameters are highlighted in Figure 5, in part due to a relatively larger dataset compared to other parameters, we ran the same experiments with multiple other combinations of parameters (Figures S6), varying frequency from 1–20 Hz, duration from 0.5–30 seconds and power from 3–10 mW, while pulse width was kept at 10ms. We found that when optogenetic stimulation was given during the demand task, these parameter changes did not systematically affect either motivation or DA release, and thus we combined all sessions for the analyses in Figure 6A–D, E, G and Figure S5G–L. For NpHR stimulation, light was turned on (10 mW at fiber tip) for 2 s, only during the cue period.
Fiber photometry
For photometry recordings, optical implants were connected to low-autofluorescence patch cords (400 μm diameter, 0.57 numerical aperture, Doric) via a ceramic sleeve (Doric). Signals then passed through a fiber optic rotary joint (Doric) before filtering through a fluorescence mini cube (Doric) and ultimately reaching a femtowatt photodetector (2151; Newport). Frequency-modulated blue (465 nm) and UV (405 nm) LEDs (Doric) were used to stimulate GRAB-DA emission and control signals through the same fibers. Blue LED power was adjusted to ~30μW at the fiber tip to ensure that the photodetector was not being saturated. Digital signals were sampled at 1.0173 kHz, demodulated, lock-in amplified, and recorded by a real-time signal processor (RZ5P, Tucker-Davis Technologies) using Synapse software (Tucker-Davis Technologies). Synchronized behavioral events from the Med Associates boxes were collected directly into the RZ5P digital input ports. To reduce any confounds from photobleaching, animals were recorded for about 5 min before behavioral testing began.
Behavioral training
Behavioral training began at least 2 weeks after virus injections. For the first 2 days, mice were tethered to the fiber optic patch cord and allowed to explore the behavioral chambers (Med Associates) for 30 minutes. Each chamber had a speaker for white noise and three identical nose ports, each with an associated light and an infrared emitter-sensor to measure port entry times. The central nose port was defined as the reward port and was equipped to receive 10–25 μL sucrose (at 5% or 32% concentration) from a syringe pump.
After habituation to the chamber and tether, mice were exposed to 2 days of a Pavlovian task, in which rewards were delivered at random intervals between 25 and 35 s for 30 min. Each reward was delivered in tandem with a 2-s light-sound cue (white noise and central port light), with the goal that the mice would begin to associate the cue with reward delivery. Mice were then trained on FR1, meaning that a single poke in the active port was required for reward delivery. The identity of the active port (left or right) was kept consistent for each mouse, but counterbalanced between mice. For at least the first 3 days, or until the mice achieved 10 rewards per session, the active port was baited with a fruit loop to encourage the mice to explore that port. The bait was then removed and mice continued with at least five days of FR1, or until the number of rewards per session remained within 20% for 3 consecutive days. The training data in Figure 1 derives from these unbaited FR1 sessions. Mice were then trained on FR5 until they achieved at least 10 rewards per session for 3 consecutive days, and then moved onto demand sessions (see below). Over training, all mice achieved >90% accuracy (i.e., active nosepokes / inactive nosepokes) and <2 sec average latency to enter the magazine port after reward was delivered. Note that besides ensuring at least 10 rewards per session on FR5 training, we did not attempt to equalize reward consumption between mice, but rather harnessed behavioral variability to analyze how this variability mapped onto neural recordings.
Training for optogenetic self-stimulation (Figs. 5–6) was identical, except instead of sucrose reward being delivered at the time of the light-sound cue, mice received optogenetic stimulation. Recording data from the optogenetic Pavlovian and FR5 sessions are shown in Figure S7E–H.
Male and female mice were used in approximately equal numbers in all behavioral tasks and there was no sex difference in any experimental condition. Subject mice were excluded from the analysis (less than 5% of 92 total) if they did not reach behavioral criteria or if on the basis of histological analysis, they had: (1) off-target transgene expression; (2) weak transgene expression; or (3) inaccurate implant placement. All behavioral tasks were coded in Med-PC V (Med Associates).
Demand sessions
During demand sessions, mice experienced 5 consecutive 10-min blocks, each with a different FR, in the following order: FR46, FR21, FR10, FR5, FR1. This order was chosen after extensive piloting showed that random presentation of FRs produced inconsistent responses, which concurs with prior work58. We chose not to use an ascending order of FRs to reduce the chance of satiety from rapid consumption of rewards early in a session. In control experiments, we confirmed that the demand curves extracted from single sessions were similar to those extracted over 5 days, with a different FR presented on each day (data not shown).
On each trial, mice poked the required number of times in the active port and on the last required poke, the 2-s light-sound cue was immediately presented. In the sucrose task, cue onset was simultaneous with sucrose delivery into the central port. After the cue ended and mice entered the central port to consume the sucrose, a light turned on in the active port denoting that another trial had begun and mice were free to poke again. In the optogenetic task, cue onset was simultaneous with LED stimulation. As soon as both LED stimulation and the cue had ended, a light turned on in the active port denoting that another trial had begun and mice were free to poke again. Because the reward timing was different in the sucrose and optogenetic tasks (slightly after the cue in the sucrose task while simultaneous with the cue in the optogenetic task), we did not directly compare DA release kinetics between the two tasks; instead, we focused our analysis on the effects of cost and motivation within each task.
We continued demand sessions for a single reward type for at least 2 days, or until the alpha parameter achieved stability within 20%. We then switched the reward type (i.e., sucrose volume or concentration or LED power, frequency or duration). The order of reward types was counterbalanced between mice.
Shock experiments
After mice had completed the sucrose demand sessions, they returned to the standard FR5 task for one day, and on the next day performed the FR5-shock task. In this task, mice received reward as usual after 5 pokes, but on a randomly-selected 30% of trials, they also received a mild shock (0.2 mA, 0.5 s) through an electrified grid floor (Med Associates).
A separate cohort of mice, trained on the sucrose FR1 task as usual, completed a shock task modeled after the demand sessions, except that “cost” was defined not by number of required nosepokes, but by the intensity of probabilistic shock. On each trial, the animals nosepoked for sucrose reward at FR1, and had a 30% chance of receiving a shock in addition to the reward. The FR and the probability of shock always remained the same. For each 10-minute bin, however, we varied the intensity of potential shock, in the following order: 0.05 mA, 0.1 mA, 0.2 mA, 0.4 mA, 0.6 mA. This order was chosen to minimize the risk that high-intensity shocks early in the session would abolish behavior for the rest of the session.
Surprising reward experiment
A subset of mice, after completing the sucrose demand sessions above, returned to a Pavlovian task in which cues and rewards were delivered without any poke requirements. The intervals between these “surprising” rewards were chosen at random between 35 and 350 seconds to mimic the reward timing mice normally encountered on our demand task.
Prefeeding experiment
Mice were trained to stability on the demand task as above, having access to sucrose only during the task itself. They then underwent a prefeeding procedure as follows: 30 min before the session, they were given access to 1.5 mL sucrose in their home cage. If they finished the sucrose, they were given another 0.5 mL, and if they finished that, they were given another 0.5 mL, and so on until the session was scheduled to begin. We found that this graded approach maintained the subjects’ motivation to perform the task better than providing unlimited sucrose (data not shown).
Optogenetic inhibition experiment
DAT-Cre mice were injected with Cre-dependent NpHR3.0 in the VTA or SNc and GRAB-DA in the NAc or DLS, respectively, and a fiber was implanted above the striatal target. After 2 weeks of recovery, mice were trained on the sucrose demand sessions as usual, without any optogenetic stimulation, until the alpha parameter stabilized within 20% on 2 consecutive days. They then underwent inhibition experiments, which were identical except for the addition of 2-s red light stimulation during each cue period. Mice underwent at least 3 optogenetic sessions, until the alpha parameter stabilized within 20%. Data in Figure 7E–J are derived from the last 2 days of standard performance and the last 2 days of optogenetic stimulation, when performance was stable.
Alternating FR experiment
Mice were trained on the sucrose FR1 and FR5 tasks as usual and were then split into two cohorts. One cohort performed a task with 4, 10-min blocks in the following order: FR10, then FR1, then FR1, then FR10. The other cohort performed a task with the following order: FR1, then FR10, then FR10, then FR1. Each cohort repeated the task on 2 consecutive days and the data in Figure S3E–H comes from the average of the 2 days. We designed these tasks to compare cued DA responses on consecutive blocks as a function of FR order (1 before 10 or 10 before 1). Our design allows for both within-subject comparisons (analyzing the first 2 blocks vs the last 2 blocks of a session) and between-subject comparisons (analyzing the first 2 blocks in one cohort vs the other cohort).
Anesthetized recording experiment
DAT-Cre mice were injected with Cre-dependent ChRMINE in the VTA or SNc and GRAB-DA in the NAc or DLS, respectively, and a fiber was implanted above the striatal target. After 2 weeks of recovery, mice were anesthetized with ketamine (60 mg/kg) and dexmedetomidine (0.6 mg/kg) through intraperitoneal injection, placed on a heating pad to maintain body temperature, and tethered to the photometry setup as usual. We then recorded GRAB-DA signals while mice received 60 optogenetic stimulations (for NAc: 5 s, 20 Hz, 6mW; for DLS: 0.5 s, 20 Hz, 10 mW) at intervals chosen at random from the following options: 5 s, 10 s, 20 s, 30 s, 70 s and 120 s. These intervals were chosen because they were the average intervals between rewards during the optogenetic demand task (NAc: 5s, 10s, 30s, 70s, 120s; DLS: 10s, 20s, 30s, 70s, 120s).
Immunohistochemistry
Mice were perfused with 4% PFA and brains were removed and post-fixed overnight at 4 °C. 70–75-μm coronal sections were prepared on a vibratome and free-floating sections were processed for immunohistochemistry. After three 10-min washes in PBS on a shaker, the tissue was incubated with blocking solution (5% normal goat serum and 0.3% Triton X-100 in PBS) for 1 hour and then incubated in primary antibodies overnight at 4 °C on a shaker. The primary antibodies used were: rat mCherry monoclonal antibody 1:1,000 (Invitrogen, M11217) and chicken anti-GFP 1:1,000 (Aves labs, GFP-1020). After three washes of 10 min in PBS, secondary antibodies were added and incubated for 2 h at room temperature on a shaker. The secondary antibodies used were: goat anti-rat Alexa Fluor 594 1:750 (Invitrogen, A11007) and goat anti-chicken Alexa Fluor 488 1:750 (Abcam, ab150169). After three more washes, the slices were mounted with DAPI Fluoromount-G mounting medium (SouthernBiotech) onto microscopy slides for visualization at 4x using a Keyence BZ-X810 slide scanner (Keyence Plan Apo Chromat 4× objective, NA 0.20, filter cubes: DAPI, GFP, TRITC, wavelength: 430–741 nm, bit depth of images: 14 bit).
QUANTIFICATION AND STATISTICAL ANALYSIS
Data analysis
MATLAB (MathWorks) scripts from Tucker-Davis Technologies were used for signal processing. Signals were down-sampled 10x, underwent Loess smoothing (window size = 30 ms) to reduce high-frequency noise, and analyzed in 16-s windows around each cue delivery. Z-scores of the fluorescence for each trial were calculated based on the mean and standard deviation of the local baseline signal before each cue (−8 to −4 s before cue onset, to minimize the contribution of behavior in the immediate pre-cue period, without bleeding into prior trials). In control analyses, we defined Z-scores based on various other more distal or proximal baseline periods, or defined the baseline across the entire detrended session; our results did not substantially differ depending on the chosen baseline. Furthermore, to examine if behavior or neural activity on immediately preceding trials could explain our results, we performed control analyses only on those trials with large inter-trial intervals (e.g., >150 sec), and found similar results (e.g., Figures S3A–B and S7A–B). Note that because fiber photometry does not reveal absolute DA values, we cannot assess whether changes in baseline DA levels between blocks or between sessions are modulating the phasic DA release we report here.
Trials were combined into a single session average, and sessions were then averaged together for a single mouse. All photometry figures in the manuscript show the mean and standard error of the photometry signal across mice, a more conservative approach than using the trial- or session-average. To quantify total DA release, area under the curve was calculated using trapezoidal numerical integration on the Z-scores for the windows defined in the figure legends. These windows were chosen based on visual inspection of the traces and always kept the same for any direct comparison between traces. To compare high- vs low-motivation or free consumption sessions (Figure 4A–D; Figure 6A–D), we performed a median split by the alpha parameter or Q0 parameter, respectively.
To minimize bleaching confounds, we removed the first ~5 minutes of each recording, when the steepest bleaching was likely to occur. We also analyzed short windows of data with local baselines, avoiding any analysis of longer-timescale changes, which are more likely to be confounded by bleaching or other gradual changes (e.g., slight adjustments in the connection between the implant and the patch cord). In addition, we took the approach reported by Sych et al72 and examined simultaneously-recorded control signals (405 nm), which we found to be flat or slightly negative traces with substantially lower amplitude than what we observed with the experimental excitation (465 nm). Although this analysis is imperfect because 405 nm is not the isosbestic point for GRAB-DA73, the result implies that motion artifacts, bleaching, or other intrinsic, non-DA dependent signal changes could not have made a major contribution to our results.
Finally, we repeated all of our analyses using two methods to correct for bleaching, and our results held regardless of method. In the first method, the entire session was debleached according to the iterative method outlined by Bruno et al74, which calculates the ΔF/F in short moving windows, centers and normalizes these windows, and then repeats these calculations for 100 temporally-offset windows in the same session. The final debleached signal is the average of the 100 iterations. In the second method, we used polynomial curve fitting to fit the control 405 signal to the experimental 465 signal, then subtracted the fitted 405 signal from the experimental signal, and based all subsequent analyses on this subtracted signal. We chose not to complete this as our primary analysis because 405 nm is not the isosbestic point for GRAB-DA and because we observed that the bleaching rates for the two signals were often poorly aligned.
To produce demand curves, we used a custom MATLAB script (Supplemental Information). Briefly, we used the nonlinear least squares method to fit behavioral data from each session to the following exponential equation23:
where is the number of rewards earned in a block, is the cost (FR) of each reward for that block, and is a constant that specifies the range of (here we set k = 3.2). From these fits we extracted estimates of 2 parameters: , or the preferred consumption at no cost; and , the slope or elasticity of the curve. We then converted to our measure of motivation, also known as essential value, with the following equation25:
As in prior work24, goodness of fit was calculated with R2 and sessions were included in analysis only when R2 > 0.3. The median R2 ranged between 0.88 and 0.94 for the different behavioral cohorts. Demand curves were well fit even in sessions with few total rewards, as long as mice consumed rewards in at least 3 different blocks.
Statistical methods and reproducibility
All experiments were performed without knowledge of the virus that had been injected or the transgene being expressed, and were analyzed without knowledge of the specific manipulation each mouse had undergone. No statistical methods were used to predetermine sample size, which was based on previous experience with the variance of the assays. All data were tested for normality of sample distributions and when violated, non-parametric statistical tests were used. Friedman’s test was used to compare three or more matched groups (e.g., DA response from the same animals across 5 FRs). If individual data points were missing from these matched comparisons, mixed-effects models were used instead. Mixed-effects models were also used when examining the effects of multiple fixed effects (e.g., sucrose quantity and concentration) accounting for the random effect of subject. In these cases, the significance of the fixed effects was reported in the figure legends and if there were significant fixed effects, Tukey-corrected post-hoc comparisons were reported with asterisks in the figures. Wilcoxon matched-pairs signed rank tests were used to compare two paired groups (e.g., DA response from the same animals across two concentrations of sucrose). Spearman correlations were used to measure the association between two independently-measured observations (e.g., motivation on consecutive days). Mann-Whitney tests were used to compare two unmatched groups (e.g., DA response in high-motivation vs low-motivation sessions). Kruskal-Wallis tests were used to compare three or more unmatched groups (e.g., DA responses from trials with different inter-reward intervals). To determine the specific contribution of the two demand curve parameters on DA release, we performed a multiple linear regression with DA response as the dependent variable and both Q0 and 1/alpha as predictors. We then used the extra-sum-of-squares F test to compare the model that included both parameters to the simpler model that omitted Q0. All statistical tests were two-sided and performed in MATLAB (Mathworks) or Prism (GraphPad). NS, not significant. *P < 0.05, **P < 0.01, ***P < 0.001. In all figures, data are shown as mean ± s.e.m.
Supplementary Material
Key resources table.
| REAGENT or RESOURCE | SOURCE | IDENTIFIER |
|---|---|---|
| Antibodies | ||
| mCherry, rat | Invitrogen | M11217 |
| GFP, chicken | Aves labs | GFP-1020 |
| Alexa Fluor 594, goat anti-rat | Invitrogen | A11007 |
| Alexa Fluor 488, goat anti-chicken | Abcam | ab150169 |
| Bacterial and virus strains | ||
| AAV9-hSyn-DA2m | WZ Biosciences | DA4.4 |
| AAV-8-EF1α-DIO-ChRmine-mScarlet-WPRE | Stanford Gene Vector and Virus Core | GVVC-AAV-188 |
| AAV-8-EF1α-DIO-mScarlet-WPRE | Stanford Gene Vector and Virus Core | GVVC-AAV-187 |
| AAV-DJ-EF1α-DIO-NpHR3.0-mCherry | Stanford Gene Vector and Virus Core | GVVC-AAV-31 |
| Biological samples | ||
| Chemicals, peptides, and recombinant proteins | ||
| Critical commercial assays | ||
| Deposited data | ||
| Experimental models: Cell lines | ||
| Experimental models: Organisms/strains | ||
| Wildtype CD-1 mice | Charles River | Strain #22 |
| Wildtype C57BL/6J mice | Jackson Laboratory | RRID: IMSR_JAX:000664 |
| B6.SJL-Slc6a3tm1.1(cre)Bkmn/J (Dat-Cre) | Jackson Laboratory | RRID: IMSR_JAX:006660 |
| Oligonucleotides | ||
| Recombinant DNA | ||
| Software and algorithms | ||
| MATLAB R2021a | Mathworks | https://www.mathworks.com/products/matlab.html |
| Prism 9 | GraphPad | https://www.graphpad.com/scientific-software/prism/ |
| Illustrator 2022 | Adobe | https://www.adobe.com/products/illustrator.html |
| Synapse | Tucker-David Technologies | https://www.tdt.com/component/synapse-software/ |
| Med-PC V | Med Associates | https://med-associates.com/product/med-pc-v/ |
| Demand curve MATLAB analysis script | This paper (supplemental information) | N/A |
| Fiber photometry MATLAB analysis scripts | Tucker-Davis Technologies | https://www.tdt.com/docs/sdk/offline-data-analysis/offline-data-matlab/ |
| Other | ||
Highlights.
Striatal dopamine release reflects sunk cost: the cost already paid for reward
Phasic dopamine release is diminished in high-motivation states
Optogenetically-evoked dopamine release is highly context-dependent
Acknowledgments:
We thank Marija Kamceva, Zihui Zhang, Anjali Temal, Ariana Rodrigues and members of the STAAR and Malenka labs for technical assistance and discussions. The Stanford Gene Vector and Virus Core provided reagents. Funding was provided by the following:
National Institutes of Health grant K08MH123791 (NE)
National Institutes of Health grant P50DA042012 (RCM)
Brain & Behavior Research Foundation Young Investigator Grant (NE)
Burroughs Wellcome Fund Career Award for Medical Scientists (NE)
Stanford Society of Physician Scholars Research Grant (NE)
Stanford NeuroChoice Initiative Pilot Award (NE)
Simons Foundation Bridge to Independence Award (NE)
Stanford MedScholars grants (GT, ARW)
National Science Foundation Graduate Research Fellowship (DCP)
Howard Hughes Medical Institute Gilliam Fellowship (DCP, RCM)
Stanford Wu Tsai Neurosciences Institute grant (RCM)
Inclusion and diversity:
We worked to ensure sex balance in the selection of non-human subjects. One or more of the authors of this paper self-identifies as an underrepresented ethnic minority in their field of research or within their geographical location. One or more of the authors of this paper self-identifies as a member of the LGBTQIA+ community. One or more of the authors of this paper received support from a program designed to increase minority representation in their field of research.
Footnotes
Declaration of interests: NE is a consultant for Boehringer Ingelheim. RCM is on the scientific advisory boards of MapLight Therapeutics, MindMed, Bright Minds Biosciences, Cyclerion and AZ Therapies.
Publisher's Disclaimer: This is a PDF file of an unedited manuscript that has been accepted for publication. As a service to our customers we are providing this early version of the manuscript. The manuscript will undergo copyediting, typesetting, and review of the resulting proof before it is published in its final form. Please note that during the production process errors may be discovered which could affect the content, and all legal disclaimers that apply to the journal pertain.
References:
- 1.Schultz W, Stauffer WR, and Lak A (2017). The phasic dopamine signal maturing: from reward via behavioural activation to formal economic utility. Curr. Opin. Neurobiol. 43, 139–148. 10.1016/j.conb.2017.03.013. [DOI] [PubMed] [Google Scholar]
- 2.Glimcher PW (2011). Understanding dopamine and reinforcement learning: the dopamine reward prediction error hypothesis. Proc. Natl. Acad. Sci. U.S.A. 108 Suppl 3, 15647–15654. 10.1073/pnas.1014269108. [DOI] [PMC free article] [PubMed] [Google Scholar]
- 3.Eshel N, Bukwich M, Rao V, Hemmelder V, Tian J, and Uchida N (2015). Arithmetic and local circuitry underlying dopamine prediction errors. Nature 525, 243–246. 10.1038/nature14855. [DOI] [PMC free article] [PubMed] [Google Scholar]
- 4.Berke JD (2018). What does dopamine mean? Nat Neurosci 21, 787–793. 10.1038/s41593-018-0152-y. [DOI] [PMC free article] [PubMed] [Google Scholar]
- 5.Salamone JD, Correa M, Yang J-H, Rotolo R, and Presby R (2018). Dopamine, Effort-Based Choice, and Behavioral Economics: Basic and Translational Research. Front Behav Neurosci 12, 52. 10.3389/fnbeh.2018.00052. [DOI] [PMC free article] [PubMed] [Google Scholar]
- 6.Ishiwari K, Weber SM, Mingote S, Correa M, and Salamone JD (2004). Accumbens dopamine and the regulation of effort in food-seeking behavior: modulation of work output by different ratio or force requirements. Behav Brain Res 151, 83–91. 10.1016/j.bbr.2003.08.007. [DOI] [PubMed] [Google Scholar]
- 7.Nunes EJ, Randall PA, Hart EE, Freeland C, Yohn SE, Baqi Y, Müller CE, López-Cruz L, Correa M, and Salamone JD (2013). Effort-related motivational effects of the VMAT-2 inhibitor tetrabenazine: implications for animal models of the motivational symptoms of depression. J Neurosci 33, 19120–19130. 10.1523/JNEUROSCI.2730-13.2013. [DOI] [PMC free article] [PubMed] [Google Scholar]
- 8.Salamone JD, Pardo M, Yohn SE, López-Cruz L, SanMiguel N, and Correa M (2016). Mesolimbic Dopamine and the Regulation of Motivated Behavior. Curr Top Behav Neurosci 27, 231–257. 10.1007/7854_2015_383. [DOI] [PubMed] [Google Scholar]
- 9.Walton ME, and Bouret S (2019). What Is the Relationship between Dopamine and Effort? Trends Neurosci 42, 79–91. 10.1016/j.tins.2018.10.001. [DOI] [PMC free article] [PubMed] [Google Scholar]
- 10.Varazzani C, San-Galli A, Gilardeau S, and Bouret S (2015). Noradrenaline and dopamine neurons in the reward/effort trade-off: a direct electrophysiological comparison in behaving monkeys. J Neurosci 35, 7866–7877. 10.1523/JNEUROSCI.0454-15.2015. [DOI] [PMC free article] [PubMed] [Google Scholar]
- 11.Pasquereau B, and Turner RS (2013). Limited encoding of effort by dopamine neurons in a cost-benefit trade-off task. J Neurosci 33, 8288–8300. 10.1523/JNEUROSCI.4619-12.2013. [DOI] [PMC free article] [PubMed] [Google Scholar]
- 12.Gan JO, Walton ME, and Phillips PEM (2010). Dissociable cost and benefit encoding of future rewards by mesolimbic dopamine. Nat Neurosci 13, 25–27. 10.1038/nn.2460. [DOI] [PMC free article] [PubMed] [Google Scholar]
- 13.Hollon NG, Arnold MM, Gan JO, Walton ME, and Phillips PEM (2014). Dopamine-associated cached values are not sufficient as the basis for action selection. Proc Natl Acad Sci U S A 111, 18357–18362. 10.1073/pnas.1419770111. [DOI] [PMC free article] [PubMed] [Google Scholar]
- 14.Samaha A-N, Khoo SY-S, Ferrario CR, and Robinson TE (2021). Dopamine “ups and downs” in addiction revisited. Trends Neurosci 44, 516–526. 10.1016/j.tins.2021.03.003. [DOI] [PMC free article] [PubMed] [Google Scholar]
- 15.Volkow ND, Koob GF, and McLellan AT (2016). Neurobiologic Advances from the Brain Disease Model of Addiction. N Engl J Med 374, 363–371. 10.1056/NEJMra1511480. [DOI] [PMC free article] [PubMed] [Google Scholar]
- 16.Sun F, Zeng J, Jing M, Zhou J, Feng J, Owen SF, Luo Y, Li F, Wang H, Yamaguchi T, et al. (2018). A Genetically Encoded Fluorescent Sensor Enables Rapid and Specific Detection of Dopamine in Flies, Fish, and Mice. Cell 174, 481–496.e19. 10.1016/j.cell.2018.06.042. [DOI] [PMC free article] [PubMed] [Google Scholar]
- 17.Volkow ND, and Morales M (2015). The Brain on Drugs: From Reward to Addiction. Cell 162, 712–725. 10.1016/j.cell.2015.07.046. [DOI] [PubMed] [Google Scholar]
- 18.Graybiel AM, and Grafton ST (2015). The striatum: where skills and habits meet. Cold Spring Harb Perspect Biol 7, a021691. 10.1101/cshperspect.a021691. [DOI] [PMC free article] [PubMed] [Google Scholar]
- 19.Lüscher C, Robbins TW, and Everitt BJ (2020). The transition to compulsion in addiction. Nat Rev Neurosci 21, 247–263. 10.1038/s41583-020-0289-z. [DOI] [PMC free article] [PubMed] [Google Scholar]
- 20.Wanat MJ, Kuhnen CM, and Phillips PEM (2010). Delays conferred by escalating costs modulate dopamine release to rewards but not their predictors. J Neurosci 30, 12020–12027. 10.1523/JNEUROSCI.2691-10.2010. [DOI] [PMC free article] [PubMed] [Google Scholar]
- 21.Fife KH, Gutierrez-Reed NA, Zell V, Bailly J, Lewis CM, Aron AR, and Hnasko TS (2017). Causal role for the subthalamic nucleus in interrupting behavior. Elife 6, e27689. 10.7554/eLife.27689. [DOI] [PMC free article] [PubMed] [Google Scholar]
- 22.Simpson EH, and Balsam PD (2016). The Behavioral Neuroscience of Motivation: An Overview of Concepts, Measures, and Translational Applications. Curr Top Behav Neurosci 27, 1–12. 10.1007/7854_2015_402. [DOI] [PMC free article] [PubMed] [Google Scholar]
- 23.Hursh SR, and Silberberg A (2008). Economic demand and essential value. Psychol Rev 115, 186–198. 10.1037/0033-295X.115.1.186. [DOI] [PubMed] [Google Scholar]
- 24.Bentzley BS, Fender KM, and Aston-Jones G (2013). The behavioral economics of drug self-administration: a review and new analytical approach for within-session procedures. Psychopharmacology (Berl) 226, 113–125. 10.1007/s00213-012-2899-2. [DOI] [PMC free article] [PubMed] [Google Scholar]
- 25.Hursh R, S. (2014). Behavioral Economics and the Analysis of Consumption and Choice. In The Wiley Blackwell Handbook of Operant and Classical Conditioning (John Wiley & Sons, Ltd; ), pp. 275–305. 10.1002/9781118468135.ch12. [DOI] [Google Scholar]
- 26.Mohebi A, Pettibone JR, Hamid AA, Wong J-MT, Vinson LT, Patriarchi T, Tian L, Kennedy RT, and Berke JD (2019). Dissociable dopamine dynamics for learning and motivation. Nature 570, 65–70. 10.1038/s41586-019-1235-y. [DOI] [PMC free article] [PubMed] [Google Scholar]
- 27.Kim HR, Malik AN, Mikhael JG, Bech P, Tsutsui-Kimura I, Sun F, Zhang Y, Li Y, Watabe-Uchida M, Gershman SJ, et al. (2020). A Unified Framework for Dopamine Signals across Timescales. Cell 183, 1600–1616.e25. 10.1016/j.cell.2020.11.013. [DOI] [PMC free article] [PubMed] [Google Scholar]
- 28.Tanaka S, O’Doherty JP, and Sakagami M (2019). The cost of obtaining rewards enhances the reward prediction error signal of midbrain dopamine neurons. Nat Commun 10, 3674. 10.1038/s41467-019-11334-2. [DOI] [PMC free article] [PubMed] [Google Scholar]
- 29.Inzlicht M, Shenhav A, and Olivola CY (2018). The Effort Paradox: Effort Is Both Costly and Valued. Trends Cogn Sci 22, 337–349. 10.1016/j.tics.2018.01.007. [DOI] [PMC free article] [PubMed] [Google Scholar]
- 30.Liu C, and Kaeser PS (2019). Mechanisms and regulation of dopamine release. Curr Opin Neurobiol 57, 46–53. 10.1016/j.conb.2019.01.001. [DOI] [PMC free article] [PubMed] [Google Scholar]
- 31.Liu C, Cai X, Ritzau-Jost A, Kramer PF, Li Y, Khaliq ZM, Hallermann S, and Kaeser PS (2022). An action potential initiation mechanism in distal axons for the control of dopamine release. Science 375, 1378–1385. 10.1126/science.abn0532. [DOI] [PMC free article] [PubMed] [Google Scholar]
- 32.Kramer PF, Twedell EL, Shin JH, Zhang R, and Khaliq ZM (2020). Axonal mechanisms mediating γ-aminobutyric acid receptor type A (GABA-A) inhibition of striatal dopamine release. Elife 9, e55729. 10.7554/eLife.55729. [DOI] [PMC free article] [PubMed] [Google Scholar]
- 33.Holly EN, Davatolhagh MF, España RA, and Fuccillo MV (2021). Striatal low-threshold spiking interneurons locally gate dopamine. Curr Biol 31, 4139–4147.e6. 10.1016/j.cub.2021.06.081. [DOI] [PMC free article] [PubMed] [Google Scholar]
- 34.Salamone JD, and Correa M (2012). The Mysterious Motivational Functions of Mesolimbic Dopamine. Neuron 76, 470–485. 10.1016/j.neuron.2012.10.021. [DOI] [PMC free article] [PubMed] [Google Scholar]
- 35.Grace AA (1991). Phasic versus tonic dopamine release and the modulation of dopamine system responsivity: A hypothesis for the etiology of schizophrenia. Neuroscience 41, 1–24. 10.1016/0306-4522(91)90196-U. [DOI] [PubMed] [Google Scholar]
- 36.Chew B, Hauser TU, Papoutsi M, Magerkurth J, Dolan RJ, and Rutledge RB (2019). Endogenous fluctuations in the dopaminergic midbrain drive behavioral choice variability. Proc Natl Acad Sci U S A 116, 18732–18737. 10.1073/pnas.1900872116. [DOI] [PMC free article] [PubMed] [Google Scholar]
- 37.Harun R, Hare KM, Brough EM, Munoz MJ, Grassi CM, Torres GE, Grace AA, and Wagner AK (2016). Fast-scan cyclic voltammetry demonstrates that L-DOPA produces dose-dependent, regionally selective bimodal effects on striatal dopamine kinetics in vivo. J Neurochem 136, 1270–1283. 10.1111/jnc.13444. [DOI] [PMC free article] [PubMed] [Google Scholar]
- 38.Jones SR, Gainetdinov RR, Wightman RM, and Caron MG (1998). Mechanisms of Amphetamine Action Revealed in Mice Lacking the Dopamine Transporter. J. Neurosci. 18, 1979–1986. 10.1523/JNEUROSCI.18-06-01979.1998. [DOI] [PMC free article] [PubMed] [Google Scholar]
- 39.Ejdrup AL, Wellbourne-Wood J, Dreyer JK, Guldhammer N, Lycas MD, Gether U, Hall BJ, and Sørensen G (2023). Within-Mice Comparison of Microdialysis and Fiber Photometry-Recorded Dopamine Biosensor during Amphetamine Response. ACS Chem Neurosci 14, 1622–1630. 10.1021/acschemneuro.2c00817. [DOI] [PMC free article] [PubMed] [Google Scholar]
- 40.Fuller JA, Burrell MH, Yee AG, Liyanagama K, Lipski J, Wickens JR, and Hyland BI (2019). Role of homeostatic feedback mechanisms in modulating methylphenidate actions on phasic dopamine signaling in the striatum of awake behaving rats. Prog Neurobiol 182, 101681. 10.1016/j.pneurobio.2019.101681. [DOI] [PubMed] [Google Scholar]
- 41.van den Bosch R, Lambregts B, Määttä J, Hofmans L, Papadopetraki D, Westbrook A, Verkes R-J, Booij J, and Cools R (2022). Striatal dopamine dissociates methylphenidate effects on value-based versus surprise-based reversal learning. Nat Commun 13, 4962. 10.1038/s41467-022-32679-1. [DOI] [PMC free article] [PubMed] [Google Scholar]
- 42.Ahn S, and Phillips AG (1999). Dopaminergic Correlates of Sensory-Specific Satiety in the Medial Prefrontal Cortex and Nucleus Accumbens of the Rat. J. Neurosci. 19, RC29–RC29. 10.1523/JNEUROSCI.19-19-j0003.1999. [DOI] [PMC free article] [PubMed] [Google Scholar]
- 43.Niv Y, Daw ND, Joel D, and Dayan P (2007). Tonic dopamine: opportunity costs and the control of response vigor. Psychopharmacology (Berl.) 191, 507–520. 10.1007/s00213-006-0502-4. [DOI] [PubMed] [Google Scholar]
- 44.Mikhael JG, Lai L, and Gershman SJ (2021). Rational inattention and tonic dopamine. PLOS Computational Biology 17, e1008659. 10.1371/journal.pcbi.1008659. [DOI] [PMC free article] [PubMed] [Google Scholar]
- 45.Zhang J, Berridge KC, Tindell AJ, Smith KS, and Aldridge JW (2009). A neural computational model of incentive salience. PLoS Comput Biol 5, e1000437. 10.1371/journal.pcbi.1000437. [DOI] [PMC free article] [PubMed] [Google Scholar]
- 46.van Swieten MMH, and Bogacz R (2020). Modeling the effects of motivation on choice and learning in the basal ganglia. PLoS Comput Biol 16, e1007465. 10.1371/journal.pcbi.1007465. [DOI] [PMC free article] [PubMed] [Google Scholar]
- 47.Daw ND, and Touretzky DS (2002). Long-term reward prediction in TD models of the dopamine system. Neural Comput 14, 2567–2583. 10.1162/089976602760407973. [DOI] [PubMed] [Google Scholar]
- 48.Aitken TJ, Greenfield VY, and Wassum KM (2016). Nucleus accumbens core dopamine signaling tracks the need-based motivational value of food-paired cues. Journal of Neurochemistry 136, 1026–1036. 10.1111/jnc.13494. [DOI] [PMC free article] [PubMed] [Google Scholar]
- 49.Papageorgiou GK, Baudonnat M, Cucca F, and Walton ME (2016). Mesolimbic Dopamine Encodes Prediction Errors in a State-Dependent Manner. Cell Reports 15, 221–228. 10.1016/j.celrep.2016.03.031. [DOI] [PMC free article] [PubMed] [Google Scholar]
- 50.Markovic T, Pedersen CE, Massaly N, Vachez YM, Ruyle B, Murphy CA, Abiraman K, Shin JH, Garcia JJ, Yoon HJ, et al. (2021). Pain induces adaptations in ventral tegmental area dopamine neurons to drive anhedonia-like behavior. Nat Neurosci 24, 1601–1613. 10.1038/s41593-021-00924-3. [DOI] [PMC free article] [PubMed] [Google Scholar]
- 51.Ashok AH, Mizuno Y, Volkow ND, and Howes OD (2017). Association of Stimulant Use With Dopaminergic Alterations in Users of Cocaine, Amphetamine, or Methamphetamine: A Systematic Review and Meta-analysis. JAMA Psychiatry 74, 511–519. 10.1001/jamapsychiatry.2017.0135. [DOI] [PMC free article] [PubMed] [Google Scholar]
- 52.Willuhn I, Burgeno LM, Groblewski PA, and Phillips PEM (2014). Excessive cocaine use results from decreased phasic dopamine signaling in the striatum. Nat Neurosci 17, 704–709. 10.1038/nn.3694. [DOI] [PMC free article] [PubMed] [Google Scholar]
- 53.Koob GF, and Le Moal M (2001). Drug addiction, dysregulation of reward, and allostasis. Neuropsychopharmacology 24, 97–129. 10.1016/S0893-133X(00)00195-0. [DOI] [PubMed] [Google Scholar]
- 54.Dackis CA, and Gold MS (1985). New concepts in cocaine addiction: the dopamine depletion hypothesis. Neurosci Biobehav Rev 9, 469–477. 10.1016/0149-7634(85)90022-3. [DOI] [PubMed] [Google Scholar]
- 55.Freed C, Revay R, Vaughan RA, Kriek E, Grant S, Uhl GR, and Kuhar MJ (1995). Dopamine transporter immunoreactivity in rat brain. Journal of Comparative Neurology 359, 340–349. 10.1002/cne.903590211. [DOI] [PubMed] [Google Scholar]
- 56.Cragg SJ, Hille CJ, and Greenfield SA (2000). Dopamine Release and Uptake Dynamics within Nonhuman Primate Striatum In Vitro. J. Neurosci. 20, 8209–8217. 10.1523/JNEUROSCI.20-21-08209.2000. [DOI] [PMC free article] [PubMed] [Google Scholar]
- 57.Fischbach S, and Janak PH (2019). Decreases in Cued Reward Seeking After Reward-Paired Inhibition of Mesolimbic Dopamine. Neuroscience 412, 259–269. 10.1016/j.neuroscience.2019.04.035. [DOI] [PMC free article] [PubMed] [Google Scholar]
- 58.Schelp SA, Pultorak KJ, Rakowski DR, Gomez DM, Krzystyniak G, Das R, and Oleson EB (2017). A transient dopamine signal encodes subjective value and causally influences demand in an economic context. Proc Natl Acad Sci U S A 114, E11303–E11312. 10.1073/pnas.1706969114. [DOI] [PMC free article] [PubMed] [Google Scholar]
- 59.Hamid AA, Pettibone JR, Mabrouk OS, Hetrick VL, Schmidt R, Vander Weele CM, Kennedy RT, Aragona BJ, and Berke JD (2016). Mesolimbic dopamine signals the value of work. Nat. Neurosci. 19, 117–126. 10.1038/nn.4173. [DOI] [PMC free article] [PubMed] [Google Scholar]
- 60.Berridge KC (2018). Evolving Concepts of Emotion and Motivation. Front Psychol 9, 1647. 10.3389/fpsyg.2018.01647. [DOI] [PMC free article] [PubMed] [Google Scholar]
- 61.Minnaard AM, Luijendijk MCM, Baars AM, Drost L, Ramakers GMJ, Adan RAH, Lesscher HMB, and Vanderschuren LJMJ (2022). Increased elasticity of sucrose demand during hyperdopaminergic states in rats. Psychopharmacology 239, 773–794. 10.1007/s00213-022-06068-x. [DOI] [PMC free article] [PubMed] [Google Scholar]
- 62.Burgess CR, Ramesh RN, Sugden AU, Levandowski KM, Minnig MA, Fenselau H, Lowell BB, and Andermann ML (2016). Hunger-Dependent Enhancement of Food Cue Responses in Mouse Postrhinal Cortex and Lateral Amygdala. Neuron 91, 1154–1169. 10.1016/j.neuron.2016.07.032. [DOI] [PMC free article] [PubMed] [Google Scholar]
- 63.Grove JCR, Gray LA, La Santa Medina N, Sivakumar N, Ahn JS, Corpuz TV, Berke JD, Kreitzer AC, and Knight ZA (2022). Dopamine subsystems that track internal states. Nature. 10.1038/s41586-022-04954-0. [DOI] [PMC free article] [PubMed] [Google Scholar]
- 64.Allen WE, DeNardo LA, Chen MZ, Liu CD, Loh KM, Fenno LE, Ramakrishnan C, Deisseroth K, and Luo L (2017). Thirst-associated preoptic neurons encode an aversive motivational drive. Science 357, 1149–1155. 10.1126/science.aan6747. [DOI] [PMC free article] [PubMed] [Google Scholar]
- 65.Steinmetz NA, Zatka-Haas P, Carandini M, and Harris KD (2019). Distributed coding of choice, action and engagement across the mouse brain. Nature 576, 266–273. 10.1038/s41586-019-1787-x. [DOI] [PMC free article] [PubMed] [Google Scholar]
- 66.Pettit NL, Yuan XC, and Harvey CD (2022). Hippocampal place codes are gated by behavioral engagement. Nat Neurosci 25, 561–566. 10.1038/s41593-022-01050-4. [DOI] [PMC free article] [PubMed] [Google Scholar]
- 67.Zweifel LS, Parker JG, Lobb CJ, Rainwater A, Wall VZ, Fadok JP, Darvas M, Kim MJ, Mizumori SJY, Paladini CA, et al. (2009). Disruption of NMDAR-dependent burst firing by dopamine neurons provides selective assessment of phasic dopamine-dependent behavior. Proc. Natl. Acad. Sci. U.S.A. 106, 7281–7288. 10.1073/pnas.0813415106. [DOI] [PMC free article] [PubMed] [Google Scholar]
- 68.Beeler JA, and Mourra D (2018). To Do or Not to Do: Dopamine, Affordability and the Economics of Opportunity. Front Integr Neurosci 12, 6. 10.3389/fnint.2018.00006. [DOI] [PMC free article] [PubMed] [Google Scholar]
- 69.Soutschek A, Jetter A, and Tobler PN (2022). Toward a Unifying Account of Dopamine’s Role in Cost-Benefit Decision Making. Biological Psychiatry Global Open Science. 10.1016/j.bpsgos.2022.02.010. [DOI] [PMC free article] [PubMed] [Google Scholar]
- 70.Golden SA, Aleyasin H, Heins R, Flanigan M, Heshmati M, Takahashi A, Russo SJ, and Shaham Y (2017). Persistent conditioned place preference to aggression experience in adult male sexually-experienced CD-1 mice. Genes Brain Behav. 16, 44–55. 10.1111/gbb.12310. [DOI] [PMC free article] [PubMed] [Google Scholar]
- 71.Golden SA, Jin M, Heins C, Venniro M, Michaelides M, and Shaham Y (2019). Nucleus Accumbens Drd1-Expressing Neurons Control Aggression Self-Administration and Aggression Seeking in Mice. J. Neurosci. 39, 2482–2496. 10.1523/JNEUROSCI.2409-18.2019. [DOI] [PMC free article] [PubMed] [Google Scholar]
- 72.Sych Y, Chernysheva M, Sumanovski LT, and Helmchen F (2019). High-density multi-fiber photometry for studying large-scale brain circuit dynamics. Nat Methods 16, 553–560. 10.1038/s41592-019-0400-4. [DOI] [PubMed] [Google Scholar]
- 73.Sun F, Zhou J, Dai B, Qian T, Zeng J, Li X, Zhuo Y, Zhang Y, Wang Y, Qian C, et al. (2020). Next-generation GRAB sensors for monitoring dopaminergic activity in vivo. Nat Methods 17, 1156–1166. 10.1038/s41592-020-00981-9. [DOI] [PMC free article] [PubMed] [Google Scholar]
- 74.Bruno CA, O’Brien C, Bryant S, Mejaes JI, Estrin DJ, Pizzano C, and Barker DJ (2021). pMAT: An open-source software suite for the analysis of fiber photometry data. Pharmacology Biochemistry and Behavior 201, 173093. 10.1016/j.pbb.2020.173093. [DOI] [PMC free article] [PubMed] [Google Scholar]
Associated Data
This section collects any data citations, data availability statements, or supplementary materials included in this article.
Supplementary Materials
Data Availability Statement
The datasets generated and/or analyzed in the current study are available from the lead contact upon reasonable request.
All original code is available in this paper’s supplemental information.
Any additional information required to reanalyze the data reported in this paper is available from the lead contact upon request.