

Abstract
Background:
Translational research demonstrates that drug use is inversely associated with availability and engagement with meaningful non-drug reinforcers. Evaluation of non-drug reinforcement in treatment-receiving clinical populations is limited, likely owing to the time intensive nature of existing measures. This study explores the association of non-drug reinforcers with treatment outcomes using a novel, brief measure of past month non-drug reinforcement quantifying three elements: relative frequency, access, and enjoyability.
Methods:
Respondents enrolled in substance use treatment (residential, intensive outpatient, and medically managed withdrawal) in clinics across the United States (N=5,481) completed standardized assessments of non-drug reinforcement and treatment outcomes (i.e., return to use and life satisfaction) one-month after treatment discharge. Non-drug reinforcement measures (availability, engagement, enjoyability) were used as predictors of return to use and life satisfaction using generalized linear models.
Results:
Non-drug reinforcement indices were associated with return to use and life satisfaction in unadjusted models (e.g., 12.4% versus 58.3% return to use for those with the highest and lowest availability, respectively). Consistent results were observed in models adjusted for sociodemographic variables and risk factors (i.e., sleep disturbance, anhedonia, stress). Comparisons by drug class generally showed lower non-drug reinforcement among patients reporting heroin or methamphetamine as their primary drug.
Conclusions:
Results highlight the importance of non-drug reinforcement during the first month following treatment. Rapid measurement of non-drug reinforcement in stepped care settings may illuminate critical deficits in early stages of behavior change, identify those at greatest risk for return to use, and provide targets for treatment to improve recovery trajectories.
Keywords: Behavioral Economics, Stepped Care, Substance Use, Addiction, Partial Hospitalization
1. Introduction
Substance use trends are often characterized by periodic, recurrent waves of crises, most acutely the opioid epidemic and emerging opioid-stimulant polysubstance use trends (Fischer et al., 2021; Jones et al., 2020; Strickland et al., 2019; Strickland et al., 2021). Despite severe harms that are often associated with substance use disorders, treatment seeking is relatively low in the United States, particularly in the decade following onset (Blanco et al., 2015). Among those that do receive treatment, return to use is common, with studies reporting approximately one third of people have returned to use within three months of discharge from inpatient treatment (Andersson et al., 2019). It is critical to identify novel mechanisms of behavior change predictive of treatment success that might be targeted by preventive or intervention efforts.
Behavioral economic models provide a valuable framework for the identification of systematic processes that may be leveraged for treatment and recovery (Bickel and Athamneh, 2020; Higgins et al., 2004; Tucker et al., 2022; Vuchinich et al., 2023). Behavioral economic research demonstrates that, although humans and non-human animals will often consume drugs at a high rate when this is the only available option (Ahmed, 2018), drug use is inversely associated with availability and engagement with non-drug reinforcers (Acuff et al., 2019; Herrnstein, 1974; Murphy et al., 2006; Rachlin, 1997). Thus, enhancing robust, non-drug alternative reinforcers that compete with drug reinforcers can lead to reductions in drug use. As such, addiction is considered a contextualized reinforcer pathology, in which the drug, which provides immediate reward, is overvalued in part due to the lack of availability or engagement with robust alternative non-drug rewards, which often distribute rewards on a delay (Acuff et al., 2023). Deficits in substance-free reinforcement are therefore a likely key risk factor for substance use.
The quantification of non-drug and drug reinforcement is a critical goal of behavioral economics. Within the human literature, drug and non-drug reinforcement have often been quantified through techniques that assess the frequency and/or enjoyment of activities while using drugs or alcohol and while sober (Acuff et al., 2019; Correia et al., 1998; Murphy et al., 2005). Behavioral economics emphasizes the importance of non-drug reinforcement relative to drug-related reinforcement. Studies that employ these methods have demonstrated that deficits in non-drug reinforcement are a risk factor for harmful drug and alcohol use (Meshesha et al., 2017; Murphy et al., 2006), that use of greater number of substances is inversely related to non-drug reinforcement (Meshesha et al., 2015), and that increasing substance-free reinforcement is associated with reduced consumption of drugs (Correia et al., 2005; Murphy et al., 2019). However, most studies have explored associations between non-drug reinforcement among people not currently engaged in or seeking treatment. Some particularly relevant research among individuals seeking natural resolution (i.e., resolution of the drug or drinking problem with no help from treatment or professionals) has operationalized relative reinforcing efficacy as the relative monetary expenditures for alcohol compared to alternatives (such as savings) (Tucker et al., 2008). These studies have typically explored pre-resolution spending patterns as predictors of post-resolution drinking, and consistently demonstrate that greater financial resource allocation toward non-alcohol relative to alcohol-related domains prior to a new resolution to reduce or abstain from alcohol is associated with greater likelihood of success with that resolution (Tucker et al., 2016; Tucker et al., 2008; Tucker et al., 2009).
Among people engaging in formal treatment, there has been one qualitative study exploring the role of drug-free activities in initial recovery from alcohol use disorder (Meshesha et al., 2023). Respondents identified drug-free activities as critical to maintaining early abstinence, but also acknowledged barriers to persistent engagement with quality drug-free reinforcers, including anhedonia and lack of resources. Despite these findings, there is a dearth of quantitative studies exploring the role of drug-free activities soon after treatment amongst people formally receiving formal treatment services. The lack of research within a treatment seeking population may be, in part, because of measure constraints. Existing measures are typically lengthy, requiring an individual to report frequency of engagement and enjoyment in 30 or more activities while sober and under the influence of drugs or alcohol, resulting in more than 120 items. Other methods require access to financial records to establish alcohol-related versus alcohol-free discretionary expenditures. This makes it inherently difficult to incorporate into real-world residential and outpatient treatment, which provide only limited time, if any, for data collection and outcome tracking. Further, these measures have not adequately been established as predictors of return to use among treatment-seeking individuals who meet criteria for substance use disorders.
We created a brief, four-item measure of past month non-drug reinforcement towards the goal of developing a shorter clinically-meaningful assessment of non-drug reinforcement. The first two items measure the number of discretionary hours/week engaged in free time activities, events, and experiences while using and not using alcohol or drugs. The third item uses a rating scale to capture enjoyment of non-drug activities while the fourth assess ease of access to non-drug, alternative activities (an important, but unevaluated concept in current measures). Here we sought to first introduce and evaluate this brief measure within a patient population of people who were enrolled in substance use treatment in programs across the United States. We evaluated whether non-drug reinforcement differed by drug class and was associated with return to use and life satisfaction to determine clinical relevance. Association of non-drug reinforcement variables with clinical outcomes was tested in comparison to established risk factors (sleep disturbance, anhedonia, and stress) to determine incremental, unique clinical utility. We hypothesized that higher levels of non-drug reinforcement would be associated with lower rates of return to use, even after controlling for relevant covariates and risk factors.
2. Methods
2.1. Participants and Procedures
Participants (N=5,481) were those from a cohort dataset of patients admitted to substance use treatment who completed post-treatment assessments in 2022. For this study, we evaluated data collected in a post-discharge assessment occurring one month after treatment discharge. Readmissions to treatment were excluded, and only the first treatment episodes during the time period evaluated were used; thus, all individuals in this dataset represent unique cases. Data included patients admitted to residential treatment programs (n=3,755), intensive outpatient programs (n=1,191), and medically managed withdrawal programs (n=535). The number of treatment programs represented included 87 unique treatment programs located in the United States with an average of 49 participants (SD=28) from each program (geographic location was not available due to deidentification procedures).
Data were collected using a web-based platform delivered via email or text message (depending on patient preference) one month after treatment discharge. Informed consent was obtained for experimentation with human subjects. Data were collected by a third-party treatment outcomes provider (Trac9) that partners with facilities to maintain within- and post-treatment outcomes. The study team received de-identified data via a data transfer agreement. The protocol was formally submitted to and acknowledged by the Johns Hopkins School of Medicine Institutional Review Board.
2.2. Measures
2.2.1. Frequency of Non-Drug Reinforcement
Participants were first instructed to imagine the average number of hours per week that they engaged in free time activities, events, and experiences. Free time was operationalized as time that was spent not dedicated to activities like work, school, sleeping, childcare or other family responsibilities with examples given including watching sports or television, exercising, and meeting with friends for a meal or a party. Next, participants answered two questions quantifying the number of estimated hours per week that these activities occurred while using alcohol and/or drugs and while not using alcohol and/or drugs (Supplemental Materials). We generated a relative frequency score (R-Ratio) by taking the estimated hours spent engaged in drug-related activity over the total time (non-drug + drug-related frequency) such that higher values indicated a greater proportion of time drug-related reinforcement relative to all obtained reinforcement. This item was rated based on behavior over the past 30 days.
2.2.2. Access and Enjoyability of Non-Drug Reinforcement
Two items evaluated participants perceived access to and enjoyment of non-drug activities rated on 6-point Likert scales (Supplemental Materials). The first item evaluated the ease of access to free time activities that did not involve using alcohol or drugs (i.e., “how easy it was to find”). The second item evaluated enjoyment of these activities that did not involve using alcohol or drugs (i.e., “how much you enjoyed activities”). Both items were rated considering behavior over the past 30 days.
2.2.3. Treatment Outcomes
Treatment outcomes included a return to substance use and perceived life satisfaction in the 30 days following treatment discharge. Return to substance use was operationalized as self-reported use of alcohol or illicit substance use (or non-prescribed use) in the past 30 days. Life satisfaction was measured on a 10-point scale measuring “how satisfied are you with your life?” with scale anchors ranging from Not at All Satisfied (1) to Completely Satisfied (10).
2.2.4. Established Risk Factors
Participants completed standardized assessments of risk factors (i.e., sleep disturbance, anhedonia, and stress) at their one-month follow-up. Sleep disturbance was measured using the Insomnia Severity Index, a 7-item assessment of clinically-relevant symptoms of insomnia in the past 2 weeks (Morin et al., 2011). Anhedonia was measured using a short-form of the Snaith-Hamilton Pleasure Scale (SHAPS), which evaluated responsiveness to reward in the past 30 days (Snaith et al., 1995). Stress was measured using a 4-item version of the Perceived Stress Scale, a widely-used psychological instrument to measure the perception of stress in the past 30 days (Cohen, 1988; Ingram IV et al., 2016). Sleep, stress, and anhedonia were selected a priori due to their known associations with substance-related outcomes (e.g., Du et al., 2021; Hser et al., 2017; Nguyen et al., 2020).
2.2.5. Demographics and Substance Use
Demographic information was collected at treatment entry including age, race, and sex assigned at birth. Participants were also asked to identify their primary drug at treatment intake.
2.3. Data Analysis
Descriptive statistics were first computed for the full sample with life satisfaction compared by return to use status using an independent samples t-test (zero order correlations presented in Supplemental Table 3). Non-drug reinforcement measures (R-Ratio, Access, and Enjoyability) were then compared by primary drug (eight groups: alcohol, benzodiazepines, cocaine, heroin, marijuana, methamphetamine, prescription opioids, and prescription stimulants) using a linear mixed effect model with a random effect for treatment site. Post-hoc comparisons used a false discover rate correction with corrected p values reported (Benjamini & Hochberg, 1995). Tests were conducted to determine if differences in non-drug reinforcement measures differed by return to use status across different primary drugs by testing the interaction of primary drug and return to use. Effect sizes were reported for the differences in non-drug reinforcement measure by return to use for each drug (Supplemental Table 4). Non-drug reinforcement measures were then used as a predictor of return to use and life satisfaction using generalized linear models. Only access and enjoyability data were evaluated for return to use given the similarities in measurement of drug-related activities and return to use to prevent redundancy in measurement. Models were built such that unadjusted tests were first conducted followed by tests adjusting for demographic covariates, risk factors (i.e., sleep disturbance, anhedonia, and stress), primary drug, and level of care. A final model included all three non-drug reinforcement measures and all covariates (all model results in Supplemental Tables 5–11). Effect sizes were summarized with Cohen’s d and r values. Data analysis and graphing was conducted using R statistical language and GraphPad Prism.
3. Results
3.1. Sample Characteristics
Table 1 contains sample characteristics (N=5,481). A larger percentage of the sample identified as male (62.5%) and White (85.4%). A majority of participants reported alcohol as the primary drug (59.2%) followed by methamphetamine (10.6%), prescription opioids (8.9%), and heroin (7.7%). One quarter (25%) of participants reported a return to substance use in the month following treatment. Life satisfaction was rated as an average of 7.6 (SD=2.3) at one-month follow-up assessment. Life satisfaction was significantly lower among participants that reported a return to use, t5478=31.42, p<.001, d=−0.98 [95%CI: −0.92, −1.04]. R-Ratio values were positively associated with non-drug activity availability (r=.30) and enjoyability (r=.33), which were also positively correlated with each other (r=.69).
Table 1.
Demographic Characteristics of the Full Sample (N = 5,481).
| Mean (SD)/ Percentage (n) | |
|---|---|
| Age | 41.2 (12.3) |
| Sex assigned at birth | |
| Female | 37.3% (2042) |
| Male | 62.5% (3423) |
| Other | 0.3% (16) |
| Race | |
| African American | 6.6% (361) |
| American Indian | 0.8% (46) |
| Asian | 0.9% (48) |
| Native Hawaiian/Pacific Islander | 0.2% (13) |
| Other | 5.3% (291) |
| White | 85.4% (4681) |
| Prefer Not to Answer | 0.7% (41) |
| Ethnicity | |
| Hispanic/Latino | 7.7% (417) |
| Not Hispanic/Latino | 92.3% (5023) |
| Prefer Not to Answer | 0.7% (41) |
| Level of Care | |
| Detox Program | 9.8% (535) |
| Intensive Outpatient | 21.7% (1191) |
| Residential | 68.5% (3755) |
| Primary Drug | |
| Alcohol | 59.2% (3244) |
| Benzodiazepines | 2.4% (134) |
| Cocaine | 6.3% (346) |
| Heroin | 7.7% (424) |
| Marijuana | 3.3% (180) |
| Methamphetamine | 10.6% (583) |
| Prescription Opioids | 8.9% (486) |
| Prescription Stimulant | 1.5% (84) |
3.2. Non-Drug Reinforcement by Primary Drug
3.2.1. R-Ratio
Comparison of R-Ratio values among all respondents indicated a significant difference by primary drug, group effect p<.001. Post-hoc comparisons showed the lowest R-Ratios in people reporting alcohol use as their primary drug, corrected p values<.012 (Figure 1 upper panel). Sub-setting the sample to those who returned to substance use indicated a significant difference by primary drug, group effect p<.001. Post-hoc comparisons to alcohol use showed higher R-Ratios in participants who reported primary benzodiazepine (p=.040), heroin (p<.001), methamphetamine (p<.001), and prescription opioid (p=.040) use compared to alcohol use (Figure 1 lower panel). A significant interaction between primary drug and return to use status was observed reflected in larger effect size differences in R-Ratios by return to use status for participants who reported primary benzodiazepine (d=1.23 [0.80, 1.65]), heroin (d=1.18 [0.94, 1.42]), and methamphetamine (d=1.21 [1.01, 1.41]) use compared to alcohol use (d=0.87 [0.79, 0.96]).
Figure 1.
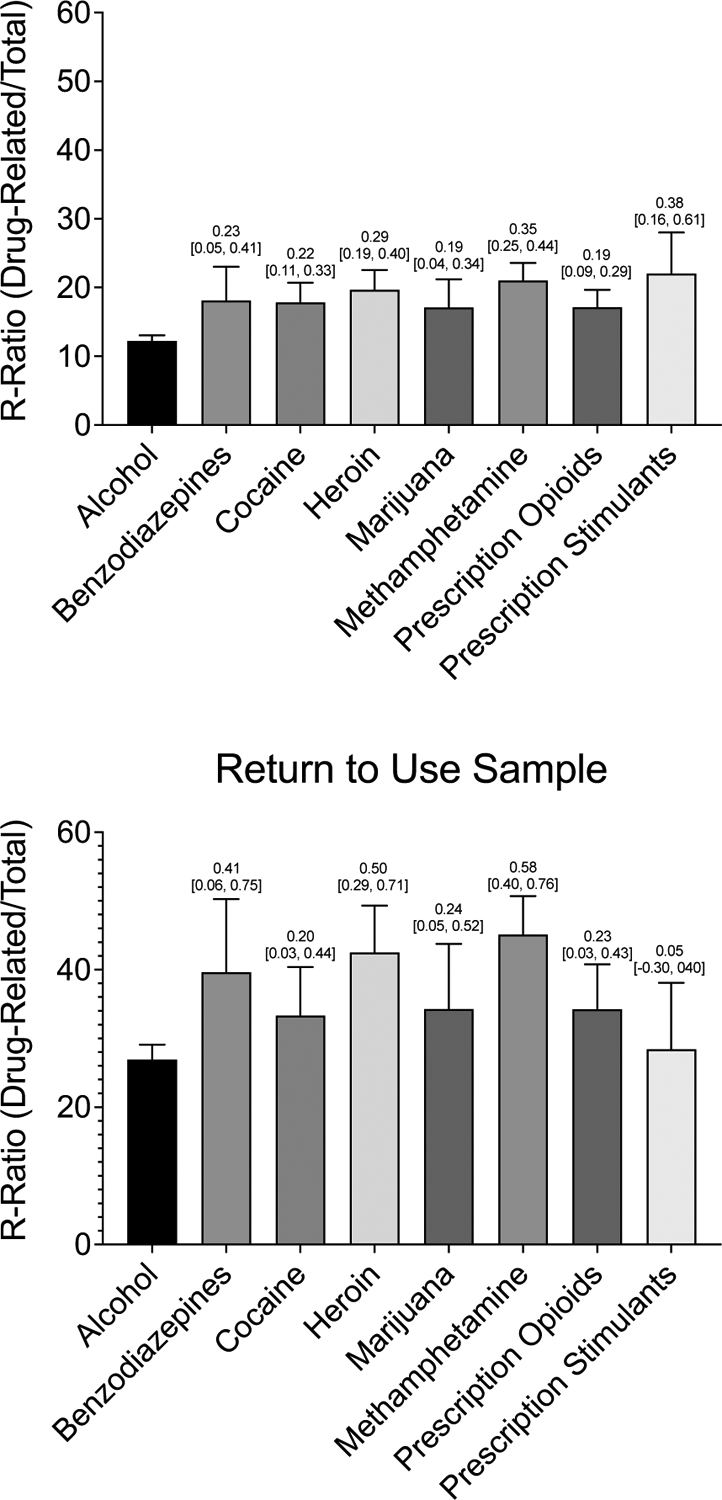
Mean Relative Drug-related Activity Frequency Split by Primary Substance in both the Full Sample (N=5,481) and among those who Returned to Use (N =1,369)
Note. Differences in relative drug-related activity engagement across primary substances. Bars represent raw means with standard errors. Numbers above each bar are Cohen’s d effect sizes, representing the size of the effects as compared to alcohol with 95% confidence intervals. The y-axis represents percentages. The top panel displays means and effect sizes in the full sample (N=5,481); the bottom panel displays means and effects sizes among a subsample of those who returned to use (N =1,369).
3.2.2. Access and Enjoyability of Non-Drug Reinforcers
Comparison of non-drug activity availability among all respondents indicated a significant difference by primary drug, group effect p<.001. Post-hoc comparisons showed respondents who reported methamphetamine use (p<.001) reported lower non-drug activity availability (Figure 2a). Sub-setting the sample to those who returned to substance use in the month following treatment also showed a significant association between primary drug and non-drug activity availability, group effect p<.001. Post-hoc comparisons again showed respondents who reported primary heroin (p=.003) and methamphetamine (p<.001) use reported lower non-drug activity availability (Figure 2b). A significant interaction between primary drug and return to use status was observed, suggesting larger effect size differences in non-drug activity availability by return to use status for participants who reported primary heroin (d=1.08 [0.85, 1.31]) and methamphetamine (d=1.01 [0.82, 1.20]) use compared to alcohol use (d=0.71 [0.62, 0.79]).
Figure 2.
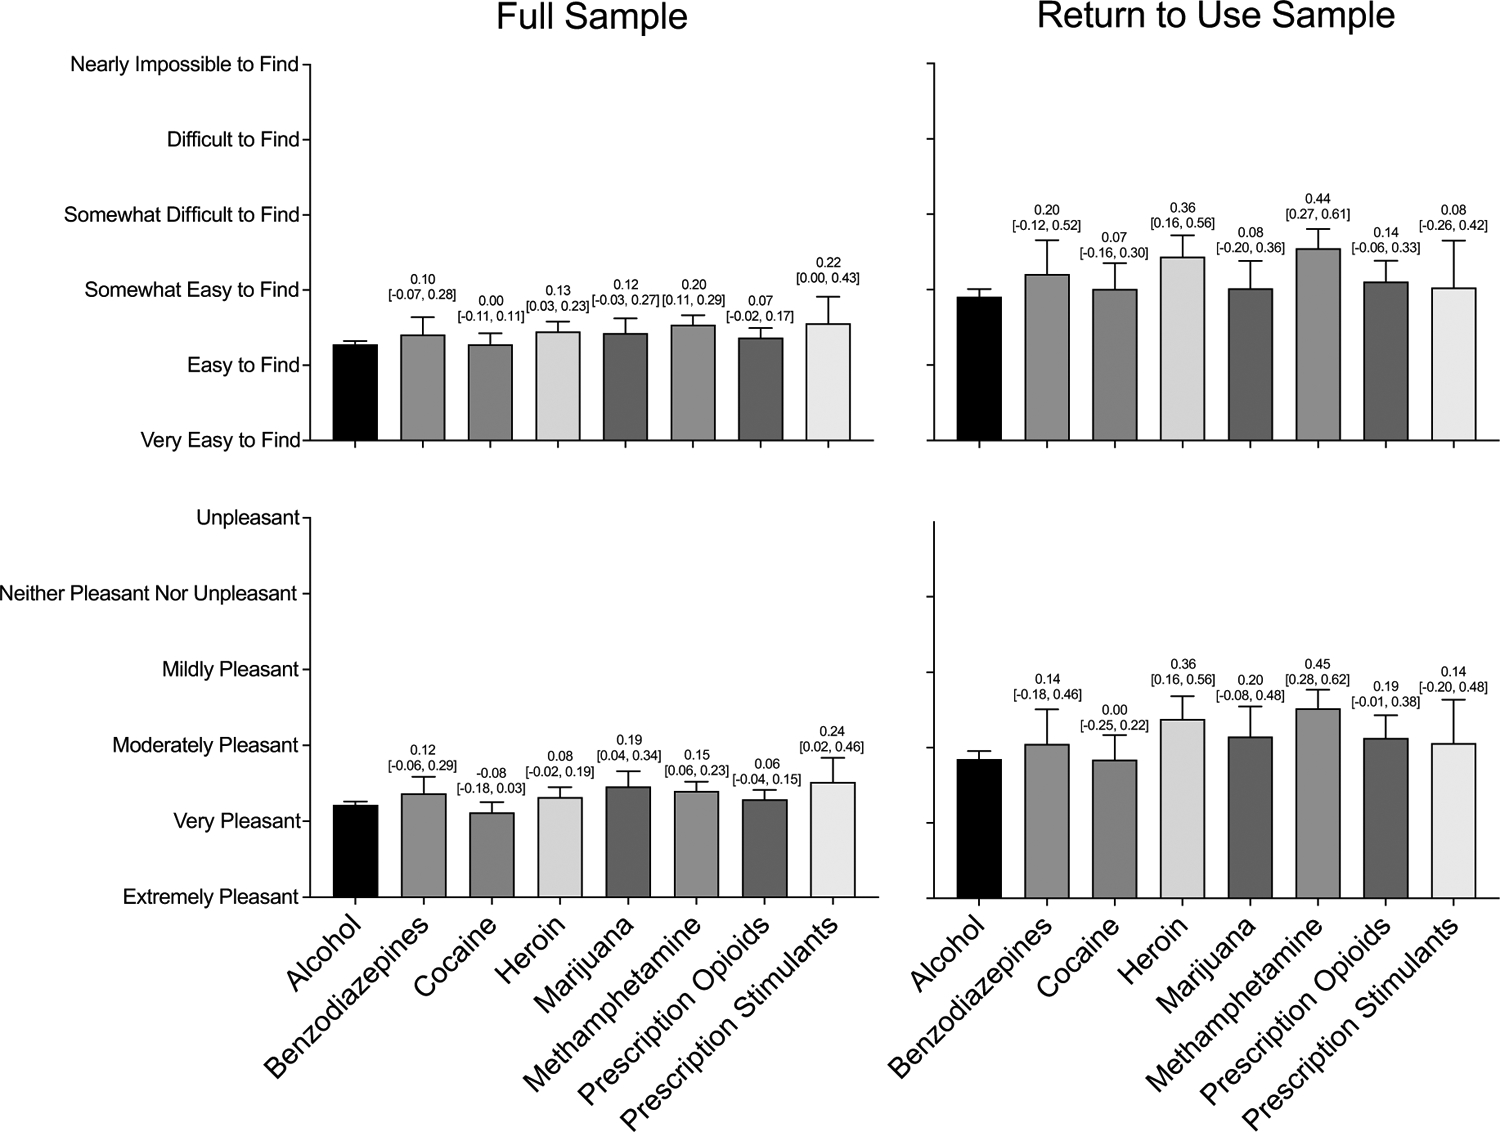
Access to and Enjoyment of Non-drug Reinforcement Split by Primary Substance in both the Full Sample (N=5,481) and among those who Returned to Use (N=1,369)
Note. Differences in access to and enjoyment of non-drug activities across primary substances. Bars represent raw means with standard errors. Numbers above each bar are Cohen’s d effect sizes, representing the size of the effects as compared to alcohol with 95% confidence intervals. The top panels display access to non-drug activities split by drug for the full and return to use samples, from left to right. The bottom panels display enjoyment of non-drug activities split by drug for the full and return to use samples.
Comparison of non-drug activity enjoyability among all respondents indicated a significant difference by primary drug, group effect p<.001. Post-hoc comparisons showed respondents who reported primary marijuana (p=.022) and methamphetamine (p=.007) use reported less non-drug activity enjoyability (Figure 2c). Sub-setting the sample to those who returned to substance use in the month following treatment showed a significant effect of primary drug, group effect p<.001. Post-hoc comparisons again showed respondents who reported primary heroin (p=.004) and methamphetamine (p<.001) use reported less non-drug activity enjoyability (Figure 2d). A significant interaction between primary drug and return to use status demonstrated larger effect size differences in R-Ratios by return to use status for participants who reported primary prescription opioid (d=0.84 [0.63, 1.05]), heroin (d=1.18 [0.95, 1.41]), and methamphetamine (d=1.17 [0.98, 1.36]) use compared to alcohol use (d=0.74 [0.65, 0.82]).
3.3. Association of Non-Drug Reinforcement with Return to Use
3.3.1. Access and Enjoyability of Non-Drug Reinforcers
Figure 3 illustrates rates of return to use at different levels of non-drug activity accessibility and availability. The association between non-drug activity accessibility and return to use was significant with greater odds of a return to use among participants with less access to non-drug reinforcers (OR=1.72 [1.64, 1.80], p<.001). This association was attenuated but remained significant (AOR=1.32 [1.24, 1.40], p<.001) when controlling for demographic covariates, risk factors (i.e., sleep disturbance, anhedonia, and stress), primary drug, and level of care. The association between non-drug activity enjoyability and return to use was also significant with greater odds of a return to use for participants with less access to non-drug reinforcers (OR=1.81 [1.72, 1.90], p<.001), an effect that also remained significant (AOR=1.38 [1.29, 1.48], p<.001) when controlling for covariates. The association of non-drug access (AOR=1.21 [1.13, 1.29], p<.001) and enjoyability (AOR=1.26 [1.17, 1.36], p<.001) remained significant in an omnibus covariate-adjusted model indicating the unique associations of each non-drug reinforcement measure.
Figure 3.
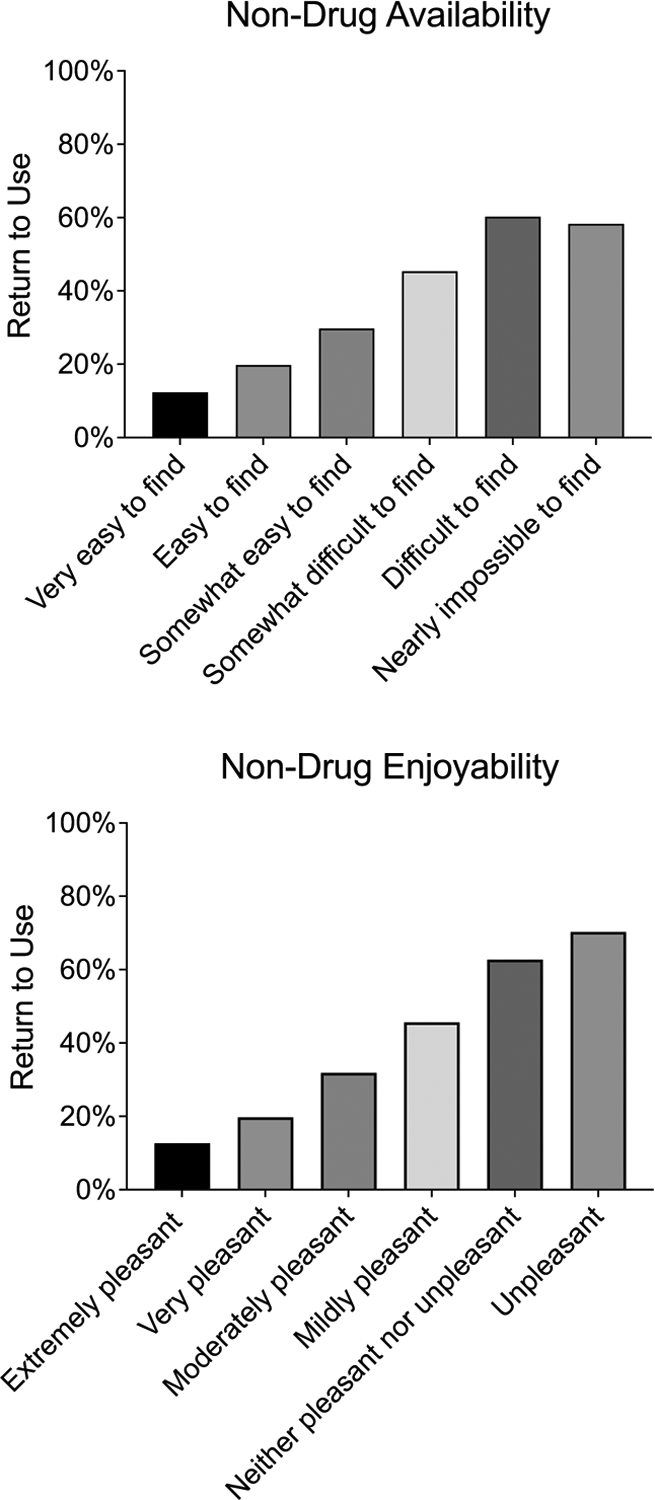
Rates of Return to Use by Non-drug Activity Availability and Enjoyability
Note. The top panel displays rates of return to use as a function of ratings on the access to non-drug activities item. The bottom panel displays rates of return to use as a function of ratings on the enjoyment of non-drug activities item.
3.4. Association of Non-Drug Reinforcement with Life Satisfaction
3.4.1. R-Ratio
The association between R-Ratios and life satisfaction was medium-to-large in effect size for the full sample (r=−.32, p<.001) and for the return to use sample (r=−.40, p<.001) representing lower life satisfaction among respondents with a higher R-Ratio. In the full sample, this association remained significant (b=−0.01, p<.001, β=−0.117) after controlling for covariates with an adjusted R2 of 0.50 in this full model. In the return to use sample, this association also remained significant (b=−0.01, p<.001, β=−0.151) after controlling for covariates with an adjusted R2 of 0.49 in the full model.
3.4.2. Access and Enjoyability of Non-Drug Reinforcers
The association between non-drug access and life satisfaction was large in effect size for the full sample (r=−.52, p<.001) and for the return to use sample (r=−.51, p<.001) representing lower life satisfaction among respondents with less access to non-drug activities (Figure 4 presents life satisfaction by response profile). In the full sample, this association remained significant (b=−0.26, p<.001, β=−0.150) after controlling for covariates with an adjusted R2 of 0.51 in this full model. In the return to use sample, this association also remained significant (b=−0.25, p<.001, β=−0.132) after controlling for covariates with an adjusted R2 of 0.49 in the full model.
Figure 4.
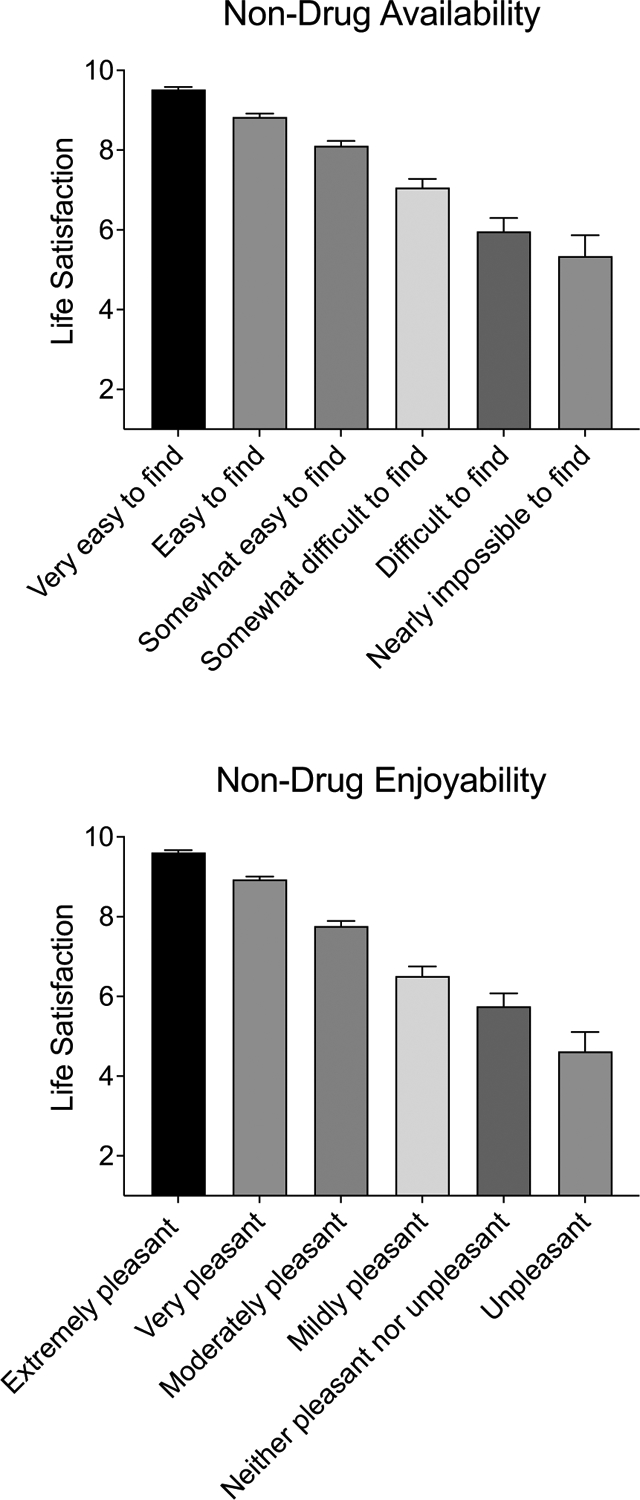
Life Satisfaction by Non-drug Activity Availability and Enjoyability
Note. Bars represent raw means with standard errors. The top panel displays adjusted means for life satisfaction as a function of ratings on the access to non-drug activities item. The bottom panel displays adjusted means for life satisfaction as a function of ratings on the enjoyment of non-drug activities item.
The association between non-drug and life satisfaction was large in effect size for the full sample (r=−.62, p<.001) and for the return to use sample (r=−.57, p<.001) representing lower life satisfaction among respondents with less enjoyment of non-drug activities (Figure 4 presents life satisfaction by response profile). In the full sample, this association remained significant (b=−0.48, p<.001, β=−0.271) after controlling for covariates with an adjusted R2 of 0.53 in this full model. In the return to use sample, this association also remained significant (b=−0.38, p<.001, β=−0.209) after controlling for covariates with an adjusted R2 of 0.50 in the full model.
3.4.3. Full Measures
In the full sample, a single model including the three measures and all covariates, the model had an adjusted R2 of 0.53 with significant associations on life satisfaction for the R-Ratio (b=−0.01, p<.001, β=−0.082), access (b=−0.08, p<.001, β=−0.047), and enjoyability (b=−0.40, p<.001, β=−0.221) with the enjoyability measure contributing the greatest variance. In the return to use sample, a single model including the three measures and all covariates, the model had an adjusted R2 of 0.51 with significant associations for the R-Ratio (b=−0.01, p<.001, β=−0.110) and enjoyability (b=−0.28, p<.001, β=−0.151), but not access (b=−0.09, p=.09, β=−0.049), with the enjoyability measure contributing the greatest variance.
4. Discussion
The current study investigated relations between non-drug alternative reinforcement and treatment outcome variables using a brief measure of non-drug reinforcement among adults recently discharged from substance use treatment. All three non-drug reinforcement indices (relative frequency, access, and enjoyability) robustly predicted return to use a month after discharge from treatment. These results are consistent with research across the translational spectrum establishing an inverse relation between non-drug reinforcement and drug use (Acuff et al., 2019; Carroll, 1996; Lamb and Ginsburg, 2018; Tucker et al., 2021; Vuchinich and Tucker, 1983). More specifically, these findings confirm findings from a qualitative analysis of the importance of drug-free reinforcement in initial recovery (Meshesha et al., 2023) within a large, treatment-receiving population by exploring relative reinforcing efficacy in the month following treatment. The results bolster support for the relative reinforcing efficacy construct and support the utility of this brief measure within a treatment population of individuals throughout recovery.
Although traditional definitions for successful treatment and recovery have narrowly focused on sustained abstinence, increasing interest has been placed on substitute or expanded definitions that encompass broader improvements in quality of life (Carroll et al., 2014; Hagman et al., 2022; Kelly et al., 2018; Kiluk et al., 2016; Kiluk et al., 2019; Witkiewitz et al., 2019). The current study did not measure recovery resolutions and therefore cannot explore whether moderation goals (if any) were achieved; however, we demonstrated that non-drug reinforcement indices were strongly associated with life satisfaction, an important quality of life proxy. These results suggest that non-drug reinforcement may be an important mechanism of successful recovery. Access to non-drug reinforcers was no longer a significant predictor of life satisfaction when included in an omnibus model controlling for enjoyability and relative frequency, perhaps suggesting that even one or two frequent and enjoyable activities may be sufficient to increase life satisfaction following drug treatment, even when there are not a wide range of non-drug activities available.
Our results also demonstrated meaningful differences in relative frequency of drug-related activities among substances. Respondents who reported benzodiazepines, heroin, and methamphetamine as a primary drug spent a greater proportion of time in drug-related activities relative to people with primary alcohol use. Further, respondents who reported their primary drug was heroin or methamphetamine reported lower non-drug activity availability and enjoyability compared to individuals who reported primary alcohol use. Chronic use of drugs may cause acute or long-term neuroadaptations in mesolimbic dopaminergic projections (French et al., 1997; Koob, 2013; Koob and Le Moal, 2008; Volkow et al., 2016), circuits implicated in reward processing; such changes have been similarly associated with anhedonic response to non-drug reinforcers. It stands to reason that variations in pharmacological effects may underlie differential changes in reward processing – either because of direct actions of the drug or differences in patterns off use (although see Hart et al., 2012 for important considerations when interpretting neurocognitive changes and differences).
Alternatively, findings of differences by drug class may be explained by understanding prior lifetime access to non-drug reinforcement and how drug use has impacted access to such reinforcement. Access to and engagement with enjoyable non-drug reinforcers in the month following treatment is likely heavily influenced by reduced access to meaningful non-drug reinforcement early in life that may be associated with greater likelihood of engagement in these two particular drugs (a “starting line” hypothesis). Alternatively, individuals who use methamphetamine or heroin may experience greater than typical levels of stigma (Blomqvist, 2009; Palamar et al., 2011), even within the healthcare system (Muncan et al., 2020). Use of these drugs may have a strong isolating effect of the individual from sources of alternative, non-drug reinforcement (a social isolation hypothesis). From the perspective of this hypothesis alone, it is perhaps more puzzling that those reporting cocaine as their primary drug did not report diminished non-drug reinforcement, as cocaine use is consistently stigmatized at levels similar to amphetamines and heroin (Blomqvist, 2009; Palamar et al., 2011). However, our study did not disaggregate routes of cocaine use (i.e., smoked cocaine colloquially referred to as “crack” versus intranasal cocaine), which are stigmatized to varying degrees (Goulian et al., 2022) and may explain this effect (or lack thereof).
4.1. Limitations & Future Directions
The current study had several strengths, including the large sample, the variability in substance use and treatment type, and the use of additional analyses controlling for other risk factors to determine unique associations. Limitations present may be addressed in future research. First, data are cross-sectional and therefore do not provide direct evidence for non-drug reinforcement as a prospective predictor of treatment outcomes over extended periods of time following treatment. Second, we primarily explored abstinence as an outcome. Novel developments in addiction science have emphasized the importance of patient autonomy in formulation of recovery resolution goals (Hagman et al., 2022), and increasingly moderation has been accepted as a legitimate goal in recovery. Third, previous research exploring the role of non-drug monetary allocation among adults undergoing natural recovery has demonstrated that these variables may better predict stable moderation, compared to abstinence (Tucker et al., 2021; Tucker et al., 2009), emphasizing the important next step of exploring any differences in these indices among those seeking abstinence versus moderation.
Fourth, respondents may have access to reinforcement they are unaware of, and future research should compare the current measure to objectively quantified measurement of reinforcement through direct behavioral observation in the natural environment to determine accuracy of responding. Fifth, return to use was self-report, and future studies should consider using objective measurement of substance use. Sixth, we did not measure SUD severity; however, given that intensive outpatient was the lowest level of stepped care from which our sample was recruited from, we suspect that the vast majority of respondents likely would have met criteria for at least moderate substance use disorder at the start of treatment. Seventh, while r-ratio values were significantly higher in those that returned to use; these values were not all zero among those that did not report return to use (i.e., 20.2% of participants that did not report a return to use reported some non-zero value). One explanation could be variability in what is considered “return to use”. Return to use and relapse are complex variables, and definitions differ even amongst scientists (Sliedrecht et al., 2022). Some patients may have focused on reporting return to use for their primary drug rather than for any drug. Further, the item assessing return to use evaluated “alcohol or illicit substance use” – respondents may not have considered use of tobacco products, legal cannabis or prescribed drugs in the return to use item but may have included this in their assessment of drug-related reinforcement. These findings collectively emphasize the importance of further investigations in alternative contexts, populations, and durations of time using this preliminary research as a guiding step. Finally, these methods may be applied for future clinical application settings to evaluate longitudinal changes in health and behavior, which could help determine thresholds for clinically meaningful change in substance-free reinforcement and the amount of change that needs to occur to result in meaningful increases in quality of life after treatment.
4.2. Clinical Implications
These results highlight the importance of access to and engagement in non-drug reinforcers during early recovery and point to specific clinical recommendations. Measurement of access to and engagement in meaningful, enjoyable non-drug activities may illuminate a critical recovery capital deficit and predict those at greatest risk for return to use. The current measures remained relevant predictors when controlling for commonly measured risk factors.
These findings also lend support for treatments that identify and bolster accessibility and engagement with valued life activities. Several evidence-based interventions, such as contingency management, explicitly target non-drug reinforcers as competing, contingent alternatives to drug use (e.g., Bolívar et al., 2021; Dutra et al., 2008; McPherson et al., 2018; Petry et al., 2004; Prendergast et al., 2006). However, these approaches are often criticized for reduced efficacy in long-term follow-up (although see Ginley et al., 2021 for meta-analysis showing modest improvements observed), partially because upon treatment termination, access to alternatives once again becomes restricted. While experimental designs are needed, our results suggest that providing either contingent or noncontingent access to alternatives following treatment may improve recovery trajectories.
Despite these promising directions for clinical implementation, it is important to note that access to enjoyable non-drug rewards may be limited by factors such as socioeconomic status and neighborhood characteristics. At least for alcohol and cannabis, this issue is further complicated by greater density of retail outlets in neighborhoods experiencing economic distress (Lee et al., 2020; Romley et al., 2007). Treatments targeting activity engagement may be thus ineffective unless these barriers are adequately addressed as a part of the treatment or at the policy level.
Supplementary Material
Highlights.
Drug use is inversely related to availability and engagement with non-drug reinforcers
We describe a brief measure for evaluating non-drug reinforcement
Non-drug reinforcement indices robustly predicted return to use and life satisfaction
Results highlight the importance of non-drug reinforcement during early recovery
Role of Funding Source
Support for Dr. Strickland was provided by grant R01DA055634 from the National Institute on Drug Abuse. Support for Drs. Ellis and Hochheimer was provided by grant T32DA07209 from the National Institute on Drug Abuse. Support for Dr. Hobelmann was provided by Ashley Addiction Treatment. Support for Dr. Huhn was provided by grant UH3DA048734 from the National Institute on Drug Abuse.
The funders had no role in the design and conduct of the study; collection, management, analysis, and interpretation of the data; preparation, review, or approval of the manuscript; and decision to submit the manuscript for publication. The authors acknowledge that the reported results are, in whole or in part, based on analyses of Trac9.com outcomes research. This manuscript may not represent the opinions of Trac9.com, nor is Trac9.com responsible for its contents or decision to publish these results. No renumeration for the associated work was provided by either Trac9 or Johns Hopkins University.
Footnotes
Publisher's Disclaimer: This is a PDF file of an unedited manuscript that has been accepted for publication. As a service to our customers we are providing this early version of the manuscript. The manuscript will undergo copyediting, typesetting, and review of the resulting proof before it is published in its final form. Please note that during the production process errors may be discovered which could affect the content, and all legal disclaimers that apply to the journal pertain.
Conflict of Interest
The authors have no conflicts of interest to disclose.
References
- Acuff SF, Dennhardt AA, Correia CJ, Murphy JG, 2019. Measurement of substance-free reinforcement in addiction: A systematic review. Clin Psychol Rev 70, 79–90. [DOI] [PMC free article] [PubMed] [Google Scholar]
- Acuff SF, MacKillop J, Murphy JG, 2023. A contextualized reinforcer pathology approach to addiction. Nature Reviews Psychology, 2, 309–323. [DOI] [PMC free article] [PubMed] [Google Scholar]
- Ahmed SH, 2018. Individual decision-making in the causal pathway to addiction: contributions and limitations of rodent models. Pharmacology Biochemistry and Behavior 164, 22–31. [DOI] [PubMed] [Google Scholar]
- Andersson HW, Wenaas M, Nordfjærn T, 2019. Relapse after inpatient substance use treatment: A prospective cohort study among users of illicit substances. Addictive Behaviors 90, 222–228. [DOI] [PubMed] [Google Scholar]
- Benjamini Y, & Hochberg Y, 1995. Controlling the false discovery rate: a practical and powerful approach to multiple testing. Journal of the Royal Statistical Society: Series B (Methodological), 57(1), 289–300. [Google Scholar]
- Bickel WK, Athamneh LN, 2020. A Reinforcer Pathology perspective on relapse. Journal of the Experimental Analysis of Behavior 113(1), 48–56. [DOI] [PMC free article] [PubMed] [Google Scholar]
- Blanco C, Iza M, Rodríguez-Fernández JM, Baca-García E, Wang S, Olfson M, 2015. Probability and predictors of treatment-seeking for substance use disorders in the US. Drug and Alcohol Dependence 149, 136–144. [DOI] [PMC free article] [PubMed] [Google Scholar]
- Blomqvist J, 2009. What is the worst thing you could get hooked on?: Popular images of addiction problems in contemporary Sweden. Nordic Studies on Alcohol and Drugs 26(4), 373–398. [Google Scholar]
- Bolívar HA, Klemperer EM, Coleman SR, DeSarno M, Skelly JM, Higgins ST, 2021. Contingency management for patients receiving medication for opioid use disorder: a systematic review and meta-analysis. JAMA Psychiatry 78(10), 1092–1102. [DOI] [PMC free article] [PubMed] [Google Scholar]
- Carroll KM, Kiluk BD, Nich C, DeVito EE, Decker S, LaPaglia D, Duffey D, Babuscio TA, Ball SA, 2014. Toward empirical identification of a clinically meaningful indicator of treatment outcome: features of candidate indicators and evaluation of sensitivity to treatment effects and relationship to one year follow up cocaine use outcomes. Drug Alcohol Depend 137, 3–19. [DOI] [PMC free article] [PubMed] [Google Scholar]
- Carroll ME, 1996. Reducing drug abuse by enriching the environment with alternative nondrug reinforcers. In Green L & Kagel JH (Eds.), Advances in behavioral economics, Vol. 3. Substance use and abuse (pp. 37–68). Ablex Publishing. [Google Scholar]
- Cohen S, 1988. Perceived stress in a probability sample of the United States. In Spacapan S & Oskamp S (Eds.), The social psychology of health (pp. 31–67). Sage Publications, Inc [Google Scholar]
- Correia CJ, Benson TA, Carey KB, 2005. Decreased substance use following increases in alternative behaviors: A preliminary investigation. Addictive Behaviors 30(1), 19–27. [DOI] [PubMed] [Google Scholar]
- Correia CJ, Simons J, Carey KB, Borsari BE, 1998. Predicting drug use: Application of behavioral theories of choice. Addictive Behaviors 23(5), 705–709. [PubMed] [Google Scholar]
- Du C, Zan MCH, Cho MJ, Fenton JI, Hsiao PY, Hsiao R, Keaver L, Lai CC, Lee H, Ludy MJ, Shen W, Swee WCS, Thrivikraman J, Tseng KW, Tseng WC, Doak S, Folk SYL, & Tucker RM, 2021. The effects of sleep quality and resilience on perceived stress, dietary behaviors and alcohol misuse: A mediation-moderation analysis of higher education students from asia, europe and north america during the COVID-19 pandemic. Nutrients, 13(2), 1–22. [DOI] [PMC free article] [PubMed] [Google Scholar]
- Dutra L, Stathopoulou G, Basden SL, Leyro TM, Powers MB, Otto MW, 2008. A meta-analytic review of psychosocial interventions for substance use disorders. Am J Psychiatry 165(2), 179–187. [DOI] [PubMed] [Google Scholar]
- Firth CL, Davenport S, Smart R, Dilley JA, 2020. How high: differences in the developments of cannabis markets in two legalized states. The International Journal on Drug Policy 75, 102611. [DOI] [PMC free article] [PubMed] [Google Scholar]
- Fischer B, O’Keefe-Markman C, Lee AM, Daldegan-Bueno D, 2021. ‘Resurgent’, ‘twin’ or ‘silent’ epidemic? A select data overview and observations on increasing psycho-stimulant use and harms in North America, Subst Abuse Treat Prev Policy, 16, 1–11. [DOI] [PMC free article] [PubMed] [Google Scholar]
- French ED, Dillon K, Wu X, 1997. Cannabinoids excite dopamine neurons in the ventral tegmentum and substantia nigra. Neuroreport 8(3), 649–652. [DOI] [PubMed] [Google Scholar]
- Ginley MK, Pfund RA, Rash CJ, Zajac K, 2021. Long-term efficacy of contingency management treatment based on objective indicators of abstinence from illicit substance use up to 1 year following treatment: A meta-analysis. Journal of Consulting and Clinical Psychology 89(1), 58. [DOI] [PMC free article] [PubMed] [Google Scholar]
- Goulian A, Jauffret-Roustide M, Dambélé S, Singh R, Fullilove RE, 2022. A cultural and political difference: comparing the racial and social framing of population crack cocaine use between the United States and France. Harm Reduction Journal 19(1), 1–5. [DOI] [PMC free article] [PubMed] [Google Scholar]
- Hagman BT, Falk D, Litten R, Koob GF, 2022. Defining recovery from alcohol use disorder: development of an NIAAA research definition. American Journal of Psychiatry 179(11), 807–813. [DOI] [PubMed] [Google Scholar]
- Hart CL, Marvin CB, Silver R, Smith EE, 2012. Is cognitive functioning impaired in methamphetamine users? A critical review. Neuropsychopharmacology 37(3), 586–608. [DOI] [PMC free article] [PubMed] [Google Scholar]
- Herrnstein RJ, 1974. Formal properties of the matching law. J Exp Anal Behav 21(1), 159–164. [DOI] [PMC free article] [PubMed] [Google Scholar]
- Higgins ST, Heil SH, Lussier JP, 2004. Clinical implications of reinforcement as a determinant of substance use disorders. Annu. Rev. Psychol 55, 431–461. [DOI] [PubMed] [Google Scholar]
- Hser Y-I, Mooney LJ, Huang D, Zhu Y, Tomko RL, McClure EA, Chou C-P, & Gray KM, 2017. Reductions in cannabis use are associated with improvements in anxiety, depression, and sleep quality, but not quality of life. Journal of Substance Abuse Treatment, 81, 53–58. [DOI] [PMC free article] [PubMed] [Google Scholar]
- Ingram IV PB, Clarke E, Lichtenberg JW, 2016. Confirmatory factor analysis of the perceived stress Scale-4 in a community sample. Stress and Health 32(2), 173–176. [DOI] [PubMed] [Google Scholar]
- Jones CM, Bekheet F, Park JN, Alexander GC, 2020. The Evolving Overdose Epidemic: Synthetic Opioids and Rising Stimulant-Related Harms. Epidemiol Rev 42(1), 154–166. [DOI] [PMC free article] [PubMed] [Google Scholar]
- Kelly JF, Greene MC, Bergman BG, 2018. Beyond abstinence: Changes in indices of quality of life with time in recovery in a nationally representative sample of US adults. Alcoholism: Clinical and Experimental Research 42(4), 770–780. [DOI] [PMC free article] [PubMed] [Google Scholar]
- Kiluk BD, Carroll KM, Duhig A, Falk DE, Kampman K, Lai S, Litten RZ, McCann DJ, Montoya ID, Preston KL, 2016. Measures of outcome for stimulant trials: ACTTION recommendations and research agenda. Drug and alcohol dependence 158, 1–7. [DOI] [PMC free article] [PubMed] [Google Scholar]
- Kiluk BD, Fitzmaurice GM, Strain EC, Weiss RD, 2019. What defines a clinically meaningful outcome in the treatment of substance use disorders: reductions in direct consequences of drug use or improvement in overall functioning? Addiction 114(1), 9–15. [DOI] [PMC free article] [PubMed] [Google Scholar]
- Koob GF, 2013. Addiction is a reward deficit and stress surfeit disorder. Frontiers in psychiatry 4, 72. [DOI] [PMC free article] [PubMed] [Google Scholar]
- Koob GF, Le Moal M, 2008. Addiction and the brain antireward system. Annu. Rev. Psychol 59, 29–53. [DOI] [PubMed] [Google Scholar]
- Lamb RJ, Ginsburg BC, 2018. Addiction as a BAD, a Behavioral Allocation Disorder. Pharmacol Biochem Behav 164, 62–70. [DOI] [PMC free article] [PubMed] [Google Scholar]
- Lee JP, Ponicki W, Mair C, Gruenewald P, Ghanem L, 2020. What explains the concentration of off-premise alcohol outlets in Black neighborhoods? SSM-Population Health 12, 100669. [DOI] [PMC free article] [PubMed] [Google Scholar]
- McKetta S, Keyes KM, 2019. Heavy and binge alcohol drinking and parenting status in the United States from 2006 to 2018: An analysis of nationally representative cross-sectional surveys. PLoS medicine 16(11), e1002954. [DOI] [PMC free article] [PubMed] [Google Scholar]
- McPherson SM, Burduli E, Smith CL, Herron J, Oluwoye O, Hirchak K, Orr MF, McDonell MG, Roll JM, 2018. A review of contingency management for the treatment of substance-use disorders: adaptation for underserved populations, use of experimental technologies, and personalized optimization strategies. Subst Abuse Rehabil 9, 43–57. [DOI] [PMC free article] [PubMed] [Google Scholar]
- Meshesha LZ, Dennhardt AA, Murphy JG, 2015. Polysubstance use is associated with deficits in substance-free reinforcement in college students. Journal of Studies on Alcohol and Drugs 76(1), 106–116. [PubMed] [Google Scholar]
- Meshesha LZ, Magri TD, Braun TD, Sillice MA, Nguyen MD, Suren V, Abrantes AM, 2023. Patient Perspective on the Role of Substance-Free Activities during Alcohol Use Disorder Treatment: A Mixed-Method Study. Alcoholism Treatment Quarterly 41(3), 309–321. [DOI] [PMC free article] [PubMed] [Google Scholar]
- Meshesha LZ, Pickover AM, Teeters JB, Murphy JG, 2017. A longitudinal behavioral economic analysis of non-medical prescription opioid use among college students. The Psychological Record 67, 241–251. [Google Scholar]
- Morin CM, Belleville G, Bélanger L, Ivers H, 2011. The Insomnia Severity Index: psychometric indicators to detect insomnia cases and evaluate treatment response. Sleep 34(5), 601–608. [DOI] [PMC free article] [PubMed] [Google Scholar]
- Muncan B, Walters SM, Ezell J, Ompad DC, 2020. “They look at us like junkies”: influences of drug use stigma on the healthcare engagement of people who inject drugs in New York City. Harm Reduction Journal 17, 1–9. [DOI] [PMC free article] [PubMed] [Google Scholar]
- Murphy JG, Barnett NP, Colby SM, 2006. Alcohol-related and alcohol-free activity participation and enjoyment among college students: a behavioral theories of choice analysis. Exp Clin Psychopharmacol 14(3), 339–349. [DOI] [PubMed] [Google Scholar]
- Murphy JG, Correia CJ, Colby SM, Vuchinich RE, 2005. Using behavioral theories of choice to predict drinking outcomes following a brief intervention. Exp Clin Psychopharmacol 13(2), 93–101. [DOI] [PubMed] [Google Scholar]
- Murphy JG, Dennhardt AA, Martens MP, Borsari B, Witkiewitz K, Meshesha LZ, 2019. A randomized clinical trial evaluating the efficacy of a brief alcohol intervention supplemented with a substance-free activity session or relaxation training. J Consult Clin Psychol 87(7), 657–669. [DOI] [PMC free article] [PubMed] [Google Scholar]
- Nguyen L-C, Durazzo TC, Dwyer CL, Rauch AA, Humphreys K, Williams LM, & Padula CB, 2020. Predicting relapse after alcohol use disorder treatment in a high-risk cohort: the roles of anhedonia and smoking. Journal of Psychiatric Research, 126, 1–7. [DOI] [PMC free article] [PubMed] [Google Scholar]
- Palamar JJ, Kiang MV, Halkitis PN, 2011. Development and psychometric evaluation of scales that assess stigma associated with illicit drug users. Substance Use & Misuse 46(12), 1457–1467. [DOI] [PubMed] [Google Scholar]
- Petry NM, Tedford J, Austin M, Nich C, Carroll KM, Rounsaville BJ, 2004. Prize reinforcement contingency management for treating cocaine users: how low can we go, and with whom? Addiction 99(3), 349–360. [DOI] [PMC free article] [PubMed] [Google Scholar]
- Prendergast M, Podus D, Finney J, Greenwell L, Roll J, 2006. Contingency management for treatment of substance use disorders: A meta-analysis. J Addiction 101(11), 1546–1560. [DOI] [PubMed] [Google Scholar]
- Rachlin H, 1997. Four teleological theories of addiction. Psychonomic bulletin & review 4(4), 462–473. [Google Scholar]
- Romley JA, Cohen D, Ringel J, Sturm R, 2007. Alcohol and environmental justice: the density of liquor stores and bars in urban neighborhoods in the United States. Journal of studies on alcohol and drugs 68(1), 48–55. [DOI] [PubMed] [Google Scholar]
- Sacks JJ, Gonzales KR, Bouchery EE, Tomedi LE, Brewer RD, 2015. 2010 National and State Costs of Excessive Alcohol Consumption. Am J Prev Med 49(5), e73–e79. [DOI] [PubMed] [Google Scholar]
- Sliedrecht W, Roozen HG, Waart RD, Dom G, & Witkiewitz K, 2022. Variety in alcohol use disorder relapse definitions: should the term “relapse” be abandoned? Journal of Studies on Alcohol and Drugs, 83, 248–259. [PubMed] [Google Scholar]
- Snaith R, Hamilton M, Morley S, Humayan A, Hargreaves D, Trigwell P, 1995. A scale for the assessment of hedonic tone the Snaith–Hamilton Pleasure Scale. The British Journal of Psychiatry 167(1), 99–103. [DOI] [PubMed] [Google Scholar]
- Strickland JC, Havens JR, Stoops WW, 2019. A nationally representative analysis of “twin epidemics”: Rising rates of methamphetamine use among persons who use opioids. Drug Alcohol Depend 204, 107592. [DOI] [PMC free article] [PubMed] [Google Scholar]
- Strickland JC, Stoops WW, Dunn KE, Smith KE, Havens JR, 2021. The continued rise of methamphetamine use among people who use heroin in the United States. Drug and Alcohol Dependence, 225, 108750. [DOI] [PMC free article] [PubMed] [Google Scholar]
- Tucker JA, Buscemi J, Murphy JG, Reed DD, Vuchinich RE, 2022. Addictive behavior as molar behavioral allocation: Distinguishing efficient and final causes in translational research and practice. Psychology of Addictive Behaviors, 37, 1–12. [DOI] [PMC free article] [PubMed] [Google Scholar]
- Tucker JA, Cheong J, Chandler SD, 2021. Shifts in behavioral allocation patterns as a natural recovery mechanism: Postresolution expenditure patterns. Alcoholism: Clinical and Experimental Research 45(6), 1304–1316. [DOI] [PMC free article] [PubMed] [Google Scholar]
- Tucker JA, Cheong J, Chandler SD, Lambert BH, Pietrzak B, Kwok H, Davies SL, 2016. Prospective analysis of behavioral economic predictors of stable moderation drinking among problem drinkers attempting natural recovery. Alcoholism: Clinical and Experimental Research 40(12), 2676–2684. [DOI] [PMC free article] [PubMed] [Google Scholar]
- Tucker JA, Foushee HR, Black BC, 2008. Behavioral economic analysis of natural resolution of drinking problems using IVR self-monitoring. Experimental and clinical psychopharmacology 16(4), 332–340. [DOI] [PMC free article] [PubMed] [Google Scholar]
- Tucker JA, Roth DL, Vignolo MJ, Westfall AO, 2009. A behavioral economic reward index predicts drinking resolutions: moderation revisited and compared with other outcomes. Journal of consulting and clinical psychology 77(2), 219. [DOI] [PMC free article] [PubMed] [Google Scholar]
- Volkow ND, Koob GF, McLellan AT, 2016. Neurobiologic advances from the brain disease model of addiction. New England Journal of Medicine 374(4), 363–371. [DOI] [PMC free article] [PubMed] [Google Scholar]
- Vuchinich RE, Tucker JA, 1983. Behavioral theories of choice as a framework for studying drinking behavior. Journal of Abnormal pPsychology 92(4), 408. [DOI] [PubMed] [Google Scholar]
- Vuchinich RE, Tucker JA, Acuff SF, Reed DD, Buscemi J, Murphy JG, 2023. Matching, behavioral economics, and teleological behaviorism: Final cause analysis of substance use and health behavior. Journal of the Experimental Analysis of Behavior 119(1), 240–258. [DOI] [PubMed] [Google Scholar]
- Witkiewitz K, Wilson AD, Pearson MR, Montes KS, Kirouac M, Roos CR, Hallgren KA, Maisto SA, 2019. Profiles of recovery from alcohol use disorder at three years following treatment: can the definition of recovery be extended to include high functioning heavy drinkers? Addiction 114(1), 69–80. [DOI] [PMC free article] [PubMed] [Google Scholar]
Associated Data
This section collects any data citations, data availability statements, or supplementary materials included in this article.