

Abstract
The modern armamentarium for cancer treatment includes immunotherapy and targeted therapy, such as protein kinase inhibitors. However, the mechanisms that allow cancer-targeting drugs to effectively mobilize dendritic cells (DCs) and affect immunotherapy are poorly understood. Here, we report that among shared gene targets of clinically relevant protein kinase inhibitors, high PIKFYVE expression was least predictive of complete response in patients who received immune checkpoint blockade (ICB). In immune cells, high PIKFYVE expression in DCs was associated with worse response to ICB. Genetic and pharmacological studies demonstrated that PIKfyve ablation enhanced DC function via selectively altering the alternate/non-canonical NF-κB pathway. Both loss of Pikfyve in DCs and treatment with apilimod, a potent and specific PIKfyve inhibitor, restrained tumor growth, enhanced DC-dependent T cell immunity, and potentiated ICB efficacy in tumor-bearing mouse models. Furthermore, the combination of a vaccine adjuvant and apilimod reduced tumor progression in vivo. Thus, PIKfyve negatively controls DCs, and PIKfyve inhibition has promise for cancer immunotherapy and vaccine treatment strategies.
Keywords: PIKfyve, dendritic cell, kinase inhibitor, apilimod, immune checkpoint blockade, NF-κB, tumor, antigen-specific T cell, cancer vaccine
The success of immunotherapy has fundamentally altered our understanding of cancer and changed the standard of care for cancer treatment.1,2 Understanding the mechanisms of immunotherapy efficacy and resistance are needed to further improve cancer outcomes.3,4 Attention has centered on the countless ways in which tumor-associated antigen (TAA)-specific T cells are directly or indirectly suppressed.4-8 However, fewer studies have investigated the contribution of professional antigen presenting cells (APCs), such as dendritic cells (DCs), to antitumor immunity. DCs prime, activate, and sustain T cell responses across cancer types and are required for durable immunity against tumors.9,10 Moreover, they hold a dominant role in extinguishing ongoing immune responses, making them among the most powerful regulators of antitumoral T cell responses.
Though there are many elements in the tumor microenvironment that favor a pro or anticancer response, we now understand that the success of many approved cancer therapies ultimately depends on the sustained activation of TAA-specific CD8+ T cells through DCs.9,11,12 For example, the “DC-T cell axis” is required for response to immune checkpoint blockade (ICB) therapy. Loss of either cell type reduces ICB efficacy in preclinical models.13 DC or T cell signatures are associated with ICB treatment response in cancer patients.3,14-16 Studies have shown that certain systemic chemotherapy agents may enhance DC antigen presentation by enhancing tumor cell antigenicity.17,18 However, studies reporting a direct effect on DCs are rare,19,20 with a few agents promoting a more “DC-like” phenotype in suppressive myeloid-derived cells.21 Studies have focused on chemotherapy-induced activation of DCs as a mechanism to potentiate immunotherapy strategies, such as DC vaccines or ICB.13,21-24
The contribution of DCs to targeted therapy efficacy, such as protein kinase inhibitors, is largely unknown. Unlike ICB or chemotherapy, these drugs target DNA damage responses or oncogenic signaling pathways preferentially utilized by cancer cells.25,26 Targeting BRAF, EGFR, PDGRA, KIT, PIK3CA, ALK, MET, ROS1, ERBB, CDK12, and others has improved cancer care, however durable responses are uncommon.27,28 Historically, the ability of the FDA-approved kinase inhibitors to interact with the immune system was ignored. More recently, preclinical studies have included characterization of the immune system, focusing on associations between treatment response and T cell profiles.29-34 Efficacy of a receptor kinase inhibitor was shown to be dependent on T cells which served as a rationale for combination therapy with ICB.35,36 However, these studies have not explored the contribution of DCs to those outcomes.
As the number of clinical trials combining immunotherapy and protein kinase inhibitors continue to increase, it is imperative to understand whether they rely on DCs and modulate the DC-T cell axis. Therefore, we aimed to identify DC-associated kinases and their inhibitors in the context of ICB and characterize their ability to alter DC phenotypes and DC-dependent therapies in the tumor microenvironment.
Results
DC PIKFYVE expression is associated with ICB efficacy
Protein kinases are important targets for cancer therapy. To explore the relevance of their gene targets in ICB-induced tumor immunity, we first identified the 25 most common and unique gene targets of Phase I/Phase II/FDA-approved kinase inhibitors offered in a commercial screening library37-39 (ALK, AURKA, BTK, CSF1R, EGFR, FGFR1, FLT1, FLT3, IGF1, IGFR1, IKBKB, JAK1, JAK2, KDR, KIT, MET, MTOR, NTRK1, PDGFRA, PIKFYVE, PTK2, RAF1, RET, SRC, and SYK). We then explored the potential involvement of these 25 genes in treatment response in a clinical cohort of patients who received ICB and clinical bulk RNA-sequencing (RNA-seq) of their tumors at the University of Michigan as a part of their cancer treatment (Table 1).40
Table 1:
Demographics of a clinical cohort of patients treated with ICB.
| Percent (n) | Hazard Ratio [95% CI] | P value | ||
|---|---|---|---|---|
| Age (time of sequencing) | ||||
| Below median | 50.0% (n=46) | 1 (reference level) | - | |
| Above median | 50.0% (n=46) | 0.55 [0.29, 1.03] | 0.06 | |
| Sex | ||||
| Female | 44.5% (n=41) | 1 (reference level) | - | |
| Male | 55.5% (n=51) | 0.92 [0.46, 1.86] | 0.82 | |
| Immune checkpoint blockade agent | ||||
| Atezolizumab | 9.8% (n=9) | 1 (reference level) | - | |
| Nivolumab | 27.2% (n=25) | 0.43 [0.13, 1.40] | 0.16 | |
| Pembrolizumab | 59.7% (n=55) | 0.58 [0.23, 1.44] | 0.24 | |
| Combination | 3.3% (n=3) | 0.43 [0.065, 2.92] | 0.39 | |
| Cancer Type | ||||
| Melanoma | 9.8% (n=9) | 1 (reference level) | - | |
| Bladder | 16.3% (n=15) | 1.24 [0.39, 3.86] | 0.70 | |
| Breast | 14.1% (n=13) | 0.73 [0.22, 2.34] | 0.60 | |
| Gastrointestinal | 3.3% (n=3) | 1.20 [0.20, 7.02] | 0.83 | |
| Head and Neck | 20.7% (n=19) | 0.76 [0.28, 2.05] | 0.60 | |
| Kidney | 6.5% (n=6) | 0.27 [0.053, 1.38] | 0.11 | |
| Lung | 5.4% (n=5) | 0.10 [0.011, 0.92] | 0.042 | |
| Lymphoma | 3.3% (n=3) | 2.41 [0.53, 10.99] | 0.25 | |
| Prostate | 12.0% (n=11) | 1.16 [0.39, 3.49] | 0.77 | |
| Sarcoma | 4.3% (n=4) | 0.57 [0.13, 2.40] | 0.44 | |
| Other | 4.3% (n=4) | 1.97 [0.53, 7.30] | 0.30 | |
Pre-treatment tumor bulk RNA-seq libraries from 92 patients who received ICB treatment and clinical sequencing at the University of Michigan were included in the analysis. Hazard ratios for overall survival are included with 95% confidence intervals. P values were calculated from a multivariate cox proportional hazards model.
Seventeen percent of our cohort exhibited RECIST-defined41 complete response (CR) to ICB (Fig. 1a). As expected, the CR group had the best overall survival in our cohort (Fig. 1b). Of the kinase inhibitor gene targets evaluated, high pre-treatment PIKFYVE, KDR, NTRK1, IKBKB, FLT1, or FGFR1 expression was each associated with lower odds of achieving CR when controlling for cancer type, biopsy site, age at the time of treatment initiation, and ICB agent (Fig. 1c). Amongst these targets, we found that only high PIKFYVE expression was independently associated with worse progression-free survival (PFS) on treatment (Fig. 1d). Furthermore, a high pre-treatment CD8+ T cell activation score42,43 was associated with better overall survival, whereas a high PIKfyve score had the opposite effect (Fig. 1e). In a published prospective study,44 we found that pre-treatment PIKfyve scores were not different between patients with melanoma who were ICB-treatment-naïve (“NAÏVE”) or had previously progressed on treatment (“PROG”) (Supp. 1a). Interestingly, a high PIKfyve score was associated with worse overall survival in the PROG cohort when controlling for mutational subtype, stage of disease, and neoantigen load (Supp. 1b-c).Therefore, PIKFYVE, encoding a cytosolic lipid kinase,45-47 may be a therapeutically targetable gene with relevance in patients receiving ICB.
Figure 1: DC PIKFYVE expression is associated with ICB efficacy.
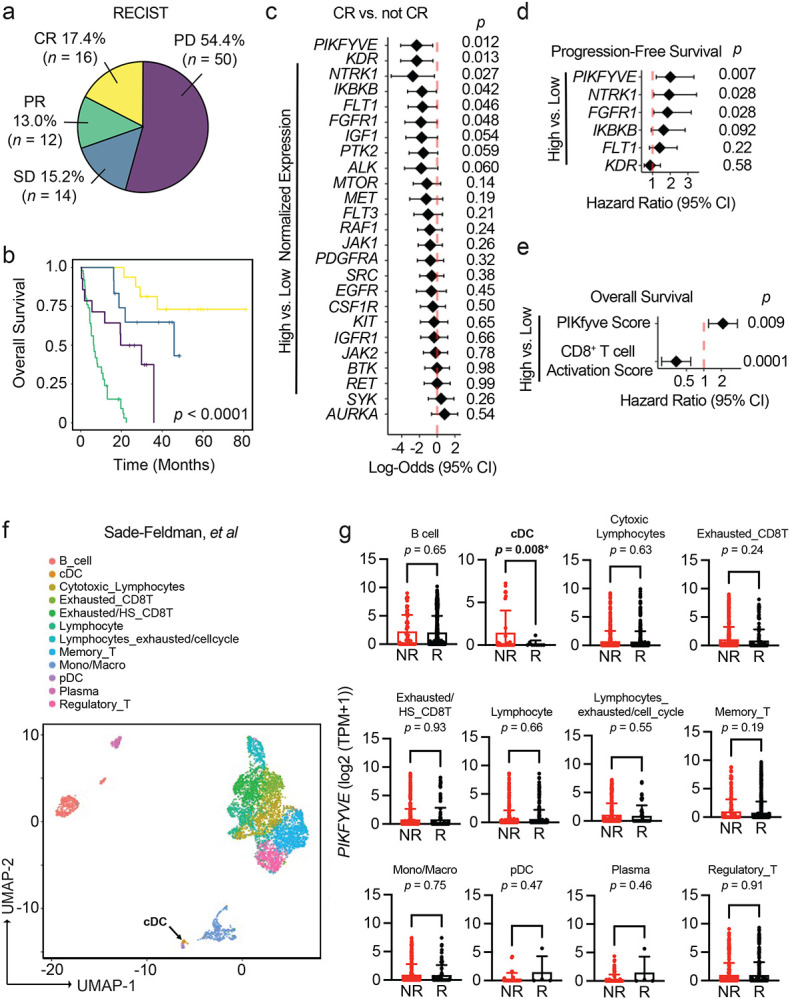
a. Pie chart of number and percentages of RECIST-defined response to treatment of patients treated with immune checkpoint blockade (ICB) at the University of Michigan, Ann Arbor (n = 92). CR, complete response; PR, partial response; SD, stable disease; PD, progressive disease.
b. Kaplan-Meier curves of overall survival of patients treated with ICB at the University of Michigan, Ann Arbor, by RECIST-defined treatment response. P value is determined by log-rank test.
c. Forest plot of log-odds of having complete response (CR) vs. not CR for 25 common Phase I/Phase II/FDA-approved drug target genes. Data from bulk RNA-seq plotted are log-odds with 95% confidence intervals. P values are determined by multivariate logistic regression controlling for cancer type, biopsy, ICB agent, and age at initiation of ICB treatment.
d. Forest plot of hazard ratios for progression-free survival of patients treated with ICB at the University of Michigan, Ann Arbor, by high vs. low gene expression for candidate drug target genes. Data from bulk RNA-seq plotted are hazard ratios with 95% confidence intervals. P values are determined by multivariate cox proportional hazards model controlling for cancer type, ICB agent, and age at initiation of ICB treatment.
e. Forest plot of hazard ratios for overall survival of patients treated with ICB at the University of Michigan, Ann Arbor, by high vs. low gene expression for PIKfyve score and CD8+ T cell activation score. Data from bulk RNA-seq plotted are hazard ratios with 95% confidence intervals. P values are determined by multivariate cox proportional hazards model controlling for cancer type, ICB agent, and age at initiation of ICB treatment.
f. t-SNE plot of immune cells in pre-treatment tumors from patients with melanoma from scRNA-seq data.49 The black arrow indicates the cDC population.
g. PIKFYVE expression (log2 (TPM+1)) across immune cell types in nonresponders (“NR” including SD and PD response) or responders (“R” including PR and CR response) to ICB treatment. Data plotted are mean ± s.d. from scRNA-seq data.49 P value determined by student t-test with Welch’s correction.
We then postulated that the correlation between PIKFYVE and ICB-associated outcomes in cancer patients may depend on cell type. We utilized published single cell RNA-seq (scRNA-seq) datasets to assess this hypothesis. We found that PIKFYVE was expressed in immune cells across multiple cancer types48 (Supp. 1d-h). Importantly, in a study of patients with melanoma treated with ICB,49 pre-treatment expression of PIKFYVE in conventional DCs (cDCs) was lower in responders (R) when compared to non-responders (NR) (Fig. 1f-g). There were no differences in PIKFYVE expression in any other immune cell type. In addition, a patient with endometrial cancer with CR50 had lower expression of PIKFYVE in their cDCs compared to nonresponders (Supp. 1i-j). Together, these data nominate DCs as an immune cell in which PIKFYVE may play a significant role in cancer immunity and ICB-associated outcomes.
PIKfyve suppresses DC function
Given these unexpected findings, we sought to understand why patients with lower DC PIKFYVE expression in tumors were inclined towards better clinical outcomes following ICB therapy. We hypothesized that PIKfyve may have a direct and functional role in modulating DCs and DC-mediated immune response against tumors. To this end, we performed genetic and pharmacologic manipulation of PIKfyve in DCs to gain a comprehensive and accurate portrayal of its functional role in this context.
First, we treated non-tumor-bearing, wild-type mice with apilimod, a potent and specific PIKfyve inhibitor that has been studied in many cell types and evaluated in Phase II clinical trials.35,51-60 Next, we performed a global assessment of immune cells enriched from spleens. We discovered increased proportions of CD69+CD8+ T cells in apilimod-treated mice compared to vehicle (Supp. 2a-b). There were no changes in the percentage of terminally differentiated, memory, or exhausted CD8+ T cells between groups (Supp. 2c-g). We also assessed myeloid lineages (Supp. 2h). We found no change in total surface expression of CD11c, F4/80, or CD11b (Supp. 2i-k). Interestingly, there was an increase in the total surface expression of XCR1 with apilimod treatment (Fig. 2a). Within the cDC subset, there was an increase in the relative percentage of cDC1s (Fig. 2b) versus cDC2 cells (Supp. 2l) with apilimod treatment. This warranted further study as cDC1s are a cDC subtype which expresses XCR1 and is involved in cross-presentation and CD8+ T cell-mediated anti-tumor responses.61-63 An increase in total surface expression of XCR1 was also observed in cultured cDCs treated with apilimod compared to dimethyl sulfoxide (DMSO) (Supp. 3a-b). To confirm that these changes were due to loss of functional PIKfyve, we bred Pikfyvef/f (“WT”) mice with ItgaxTg/0 (“CD11c-Cre”) mice to specifically and conditionally delete Pikfyve in CD11c+ DCs (“KO”). We cultured cDCs isolated from WT and KO mice in vitro and validated loss of PIKfyve expression (Supp. 3c). Intriguingly, we found that surface (Fig. 2c) and total protein (Fig. 2d) expression of XCR1 was also increased in cDCs from Pikfyve KO versus WT mice.
Figure 2: PIKfyve suppresses DC function.
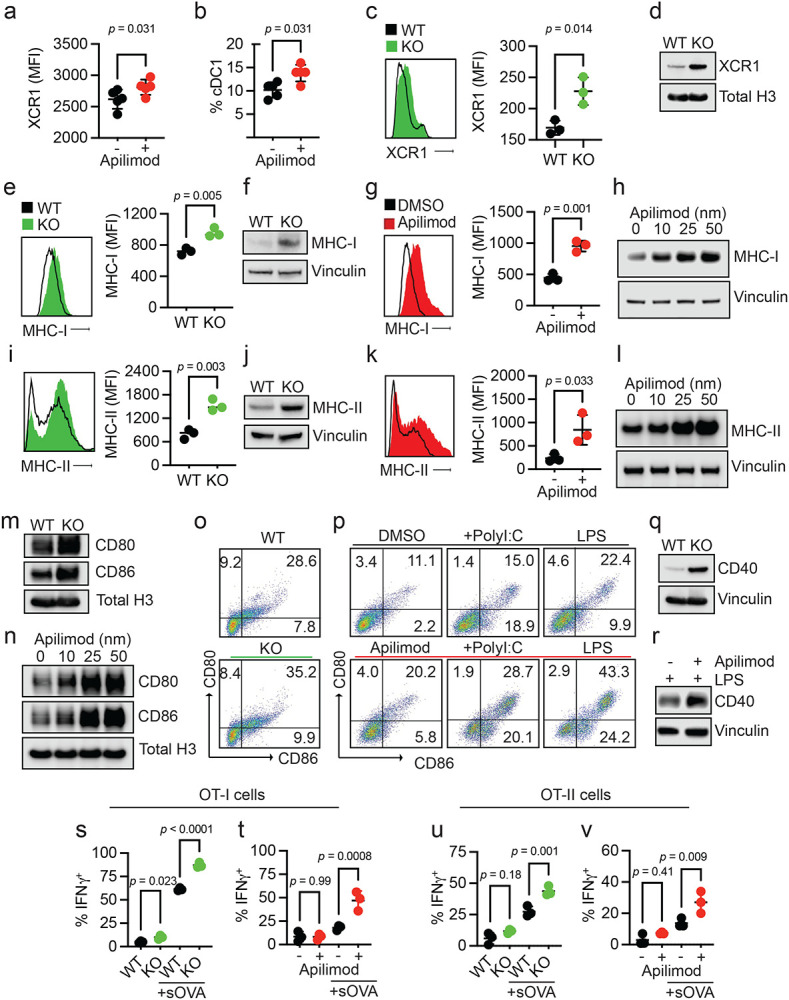
a, b. Splenic DCs in PIKfyve inhibitor-treated non-tumor-bearing mice. (a) Relative median fluorescent intensity of surface XCR1 in CD45+ cells and (b) percentage of cDC1 cells from spleens of mice treated with vehicle or apilimod (30 mg/kg daily) on day 5 of treatment (n = 5 per group). Data plotted are mean ± s.d. P values generated from student t-test.
c, d. XCR1 expression in genetic models of Pikfyve loss. (c) Relative median fluorescent intensity surface XCR1 on Pikfyvef/f (“WT”) or ItgaxTg/0 Pikfyvef/f (“KO”) cDCs on culture day 9. n = 3 biological replicates. Data plotted are mean ± s.d. P value determined by student t-test. (d) Immunoblot of total XCR1 in Pikfyve WT vs. KO cDC lysates on culture day 9. Total histone h3 serves as loading control. Images are representative of two experiments.
e-h. MHC-I expression in genetic models of Pikfyve loss. (e) Relative median fluorescent intensity surface MHC-I (H-2kb, H-2kd) on WT or KO cDCs on culture day 9. n = 3 biological replicates. Data plotted are mean ± s.d. P value determined by student t-test. (f) Immunoblot of total MHC-I in Pikfyve WT vs. KO cDC lysates on culture day 9. Vinculin serves as loading control. Images are representative of two experiments. (g) Relative median fluorescent intensity of surface MHC-I on DMSO or apilimod-treated cDCs treated for 20 hours on culture day 6. n = 3 biological replicates. Data plotted are mean ± s.d. P value determined by student t-test. (h) Immunoblot of total MHC-I in DMSO or apilimod-treated cDC lysates after 20 hours on culture day 6. Vinculin serves as loading control. Images are representative of two experiments.
i-l. MHC-II expression in PIKfyve inhibition. (i) Relative median fluorescent intensity of surface MHC-II (MHC-IA-IE) on Pikfyve WT or KO cDCs on culture day 9. n = 3 biological replicates. Data plotted are mean ± s.d. P value determined by student t-test. (j) Immunoblots of total MHC-II (MHC-IA-IE) in Pikfyve WT vs. KO cDC lysates on culture day 9. Vinculin serves as loading control. Images are representative of two experiments. (k) Relative median fluorescent intensity of surface MHC-II on DMSO or apilimod-treated cDCs treated for 20 hours on culture day 6. n = 3 biological replicates. Data plotted are mean ± s.d. P value determined by student t-test. (l) Immunoblots of total MHC-II in DMSO or apilimod-treated cDC lysates after 20 hours on culture day 6. Vinculin serves as loading control. Images are representative of two experiments.
m, n. Immunoblots of total CD80 and CD86 (m) in Pikfyve WT vs. KO cDC lysates on culture day 9 and (n) in DMSO or apilimod-treated cDC lysates after 20 hours on culture day 6. Total histone H3 serves as loading control. Images are representative of two experiments.
o, p. Representative dot plots of surface CD80 and CD86 on (o) Pikfyve WT vs. KO cDC lysates on culture day 9. Images are representative of three experiments. (p) Representative dot plots of surface CD80 and CD86 on DMSO or apilimod-treated cDCs +/− PolyI:C (50 μg/ml) or lipopolysaccharide (LPS, 50 ng/ml) treated for 20 hours on culture day 6. Images are representative of two experiments.
q, r. Immunoblots of total CD40 (q) in Pikfyve WT vs. KO cDC lysates on culture day 9 and (r) in DMSO or apilimod-treated cDC lysates treated with LPS (50 ng/ml) after 20 hours on culture day 6. Vinculin serves as loading control. Images are representative of two experiments.
s-v. OT-I/OT-II cell activation. Percentage of IFNγ+ OT-I cells after 72 hours of co-culture with (s) Pikfyve WT vs. KO or (t) DMSO or apilimod pre-treated cDCs +/− sOVA (10 μg/ml) and IFNγ+ OT-II cells co-cultured with (u) WT vs. KO or (v) DMSO or apilimod pre-treated cDCs +/− sOVA. n = 3 biological replicates. Data plotted are mean ± s.d. P value determined by student t-test.
Given this evidence that bonafide Pikfyve loss could alter cDC state, we broadly assessed phenotypic changes in cDCs with PIKfyve ablation. We found that surface (Fig. 2e) and total protein (Fig. 2f) expression of MHC-I (H2-kb, H2-kd) were significantly increased in KO cDCs when compared to those from WT mice. To determine if these findings were phenocopied by pharmacologic PIKfyve inhibition, we treated cDCs from WT mice with apilimod. Apilimod-treated cDCs showed increased surface and total protein expression of MHC-I when compared to control (Fig. 2g-h). Similarly, surface (Fig. 2i) and total protein expression (Fig. 2j) of MHC-II were increased in the KO versus WT cDCs. Furthermore, apilimod-treated cDCs had increased surface and total protein expression of MHC-II (Fig. 2k-l).
To understand whether this increase in MHCI/II expression occurred in isolation or represented a change in overall DC maturation, we examined the expression of costimulatory molecules. Total protein levels of CD80 and CD86 expression were increased in Pikfyve KO versus WT cDCs (Fig. 2m). Apilimod treatment induced CD80 and CD86 expression in WT DCs in a dose-dependent manner (Fig. 2n). The percentage of CD80+CD86+ cDCs was also increased with Pikfyve KO (Fig. 2o, Supp 3d) compared to WT. This increase in CD80+CD86+ cDCs was mirrored in apilimod-treated cells alone and in combination with PolyI:C and LPS (Fig. 2p). Furthermore, the total expression of CD40 was increased in Pikfyve KO versus WT cDCs (Fig. 2q). Addition of apilimod to LPS treatment also increased total expression of CD40 when compared to DMSO-treated cDCs (Fig. 2r).
As genetic and pharmacologic ablation of PIKfyve affected MHC and costimulatory molecules, we hypothesized that PIKfyve could, consequently, alter the ability of cDCs to present antigens and subsequently activate antigen-specific T cells. To test this possibility, we utilized the ovalbumin (OVA) and OT-I/OT-II cell systems.43,64,65 When cultured with SIINFEKL peptide (pOVA), Pikfyve KO cDCs had greater total intensity and percentage of cells with H2-kb-SIINFEKL surface expression compared to WT cDCs (Supp. 3e-f). Similarly, apilimod-treated cDCs had greater total intensity and percentage of cells with H2-kb-SIINFEKL surface expression on cDCs compared to DMSO-treated cDCs (Supp. 3g-h). In addition, we observed that peptide antigen-loaded Pikfyve KO cDCs induced a greater percentage of IFNγ+ and granzyme B+ OT-I cells compared to WT (Supp. 4a-c). This increase in T cell activation was also seen with apilimod treatment compared to DMSO (Supp. 4d-e). Finally, we loaded cDCs with soluble OVA protein (sOVA) which were then co-cultured with OT-I and OT-II cells. There were higher percentages of Ki67+ (Supp. 4f) and IFNγ+ (Fig. 2s) OT-I cells following co-culture with sOVA-loaded Pikfyve KO cDCs compared to WT cDCs. These increases were also demonstrated in OT-I cells co-cultured with apilimod-treated cDCs compared to DMSO (Fig. 2t, Supp. 4g). In addition, there were higher percentages of Ki67+ and IFNγ+ OT-II cells following co-culture with Pikfyve KO and apilimod-treated cDCs when compared to their respective controls (Supp. 4h-i, Fig. 2u-v). Together, these data indicate that PIKfyve alters DC state and negatively controls DC maturation and function.
PIKfyve suppresses NF-κB activation in DCs
To explore the mechanism through which PIKfyve suppresses DCs, we conducted RNA-seq studies. First, we performed gene set enrichment analysis on genes differentially expressed between Pikfyve KO versus WT cDCs (Supp. Table 1). Review of MSigDB curated gene sets (“C2”) revealed that a gene signature of enhanced DC maturation was positively enriched in Pikfyve KO cDCs (Supp. 5a, Supp. Table 2) consistent with our phenotypic and functional characterization of these cells.
Furthermore, examination of MSigDB hallmark gene sets (“H”) revealed positive enrichment of the “TNF_SIGNALING_VIA_NFκB” gene set in Pikfyve KO versus WT cDCs (Supp. 5b, Supp. Table 3). This was intriguing as NF-κB is known to be an essential transcription factor for driving the overall maturation and acute activation of DCs.66-69 Given our findings, we hypothesized that a more general signature of NF-κB downstream gene targets would be affected in Pikfyve KO cDCs. Thus, we curated a list of validated NF-κB gene targets from commercial assays (Supp. Table 4). In a posteriori analysis, we observed that this signature representing direct activation of downstream NF-κB genes was positively enriched in Pikfyve KO versus WT cDCs (Fig. 3a).
Figure 3: PIKfyve suppresses NF-κB activation in DCs.

a. Enrichment plots of NF-κB target genes in Pikfyve KO vs. WT cells on culture day 9.
b, c. Enrichment plots of NF-κB target genes in DMSO or apilimod-treated cDCs treated for (b) 3 hours or (c) 8 hours on culture day 6.
d. Immunoblots of p-NF-κB-p65 and total NF-κB-p65 (left) in Pikfyve WT vs. KO cDC lysates on culture day 9 and (right) in DMSO or apilimod-treated cDC lysates after 20 hours on culture day 6. Total histone H3 serves as loading control. Images are representative of two experiments.
e. Immunoblots of p-IκB-α, IκB-α, and IκB-β (left) in Pikfyve WT vs. KO cDC lysates on culture day 9 and (right) in DMSO or apilimod-treated cDC lysates after 20 hours on culture day 6. Total histone H3 serves as loading control. Images are representative of two experiments.
f. Immunoblots of IKK-α, IKK-β, and IKK-γ (left) in Pikfyve WT vs. KO cDC lysates on culture day 9 and (right) in DMSO or apilimod-treated cDC lysates after 20 hours on culture day 6. Total histone H3 serves as loading control. Images are representative of two experiments.
g. Immunoblots of IKK-ε, p-TBK-1, and TBK-1 (left) in Pikfyve WT vs. KO cDC lysates on culture day 9 and (right) in DMSO or apilimod-treated cDC lysates after 20 hours on culture day 6. Total histone H3 serves as loading control. Images are representative of two experiments.
h. Sqstm1 shown on volcano plot of differentially expressed genes in apilimod versus DMSO-treated cDCs treated for 8 hours on culture day 6 by log(fold change) and −log(adjusted P value).
i-k. TCGA Pan-Cancer analysis, (i) Correlation between SQSTM1 normalized gene expression and PIKfyve score. Correlation coefficient and P value calculated using Pearson’s product-moment correlation. (j) Forest plot of log-odds of having high vs. low SQSTM1 for patients with high vs. low NF-κB gene targets expression or (k) high vs. low cDC1 maturation score expression.67 Data from bulk RNA-seq plotted are log-odds with 95% confidence intervals. P values are determined by multivariate logistic regression controlling for cancer type.
To corroborate these data suggesting NF-κB regulation by PIKfyve, we treated WT cDCs with apilimod to identify differentially expressed genes at timepoints coinciding with early DC activation (Supp. Table 5-6). Examination of MSigDB hallmark gene sets revealed positive enrichment of “TNF_SIGNALING_VIA_NFκB” in apilimod-treated cDCs at 3 and 8 hours when compared to DMSO (Supp. 5c-d, Supp. Table 7-8). Importantly, direct NF-κB gene targets were positively enriched in apilimod-treated cDCs at these early timepoints, thus substantiating our findings from the genetic model (Fig. 3b-c). Interestingly, apilimod treatment increased Il12b transcripts (Supp. 5e, Supp. Table 5-6) in addition to the secretion of IL-12p40 (Supp. 5f) and IL-12p70 (Supp. 5g). Finally, we confirmed that both genetic loss and pharmacological inhibition of PIKfyve increased relative protein levels of p-NF-κB to NF-κB (Fig. 3d).
NF-κB is regulated by dynamic, cascading changes in a well-characterized system of upstream cytosolic regulatory proteins that culminate in an altered transcriptional landscape.70,71 Interestingly, neither genetic nor pharmacological PIKfyve ablation changed levels of IκB-β, but PIKfyve loss or inhibition did increase levels of p-IκB-α relative to IκB-α, which would allow for increased NF-κB phosphorylation and activation (Fig. 3e). To understand if this regulation extended further upstream, we also investigated the canonical and alternate/non-canonical regulators of the IκB kinase complex. Abundance of IKK-α and IKK-β were unchanged with PIKfyve ablation (Fig. 3f). Interestingly, the abundance of IKK-ε, p-TBK-1, and TBK-1 were increased with genetic and pharmacological PIKfyve ablation (Fig. 3g).
These novel findings motivated further exploration of how PIKfyve may alter NF-κB activation. Intriguingly, Sqstm1 emerged as the most significantly upregulated gene in apilimod-treated cDCs when compared to DMSO (Fig. 3h, Supp. Table 6). It was also differentially expressed in KO versus WT cDCs (Supp. Table 1). Sqstm1 is a promising mechanistic candidate in PIKfyve regulation as it is involved in vesicular trafficking, autophagy, and lysosome and proteasome degradation.72,73 Importantly, Sqstm1 can regulate NF-κB activation under various conditions72,74-76 and is known to interact with TBK-1.72,73,77-80
Utilizing the TCGA Pan-Cancer data, we found that high SQSTM1 was associated with better overall survival in patients (Supp. 6a). We also found that high SQSTM1 negatively correlated with PIKfyve scores (Fig. 3i). Furthermore, patients with high NF-κB gene target scores were more likely to have high SQSTM1 expression (Fig. 3j). Recently, Ghislat et al67 demonstrated that NF-κB pathway activation may direct maturation states within the mouse cDC1 subset. We discovered Sqstm1 expression was higher in mouse cDC181 when compared to most other myeloid lineages, including cDC2 (Supp. 6b). We investigated this further in the patient data. As expected, a published67 “cDC1 maturation score” positively correlated with NF-κB gene targets in TCGA Pan-Cancer patient samples (Supp. 6c). Moreover, patients who had higher cDC1 maturation scores were more likely to have high SQSTM1 expression (Fig. 3k). Collectively, these data suggest that PIKfyve mediates suppression of DC transcriptional maturation programs through the alternate/non-canonical NF-κB regulatory pathway.
Pikfyve loss in DCs enhances anti-tumor immunity in vivo
Since the above results showed that PIKfyve could fundamentally transform cDCs, we examined whether these alterations had any effect on a disease setting. We hypothesized that the loss of Pikfyve in DCs could attenuate tumor growth in syngeneic mouse models of cancer. Subcutaneous MC38 tumors injected into Pikfyve KO mice manifested reduced tumor growth (Fig. 4a) and tumor weights (Supp. 7a) compared to WT mice. Furthermore, this inhibitory effect on tumor growth and terminal tumor weights was also seen in KO mice bearing MCA-205 (Fig. 4b, Supp. 7b) and B16F10 (Fig. 4c, Supp. 7c) tumors.
Figure 4: Pikfyve loss in DCs enhances anti-tumor immunity in vivo.
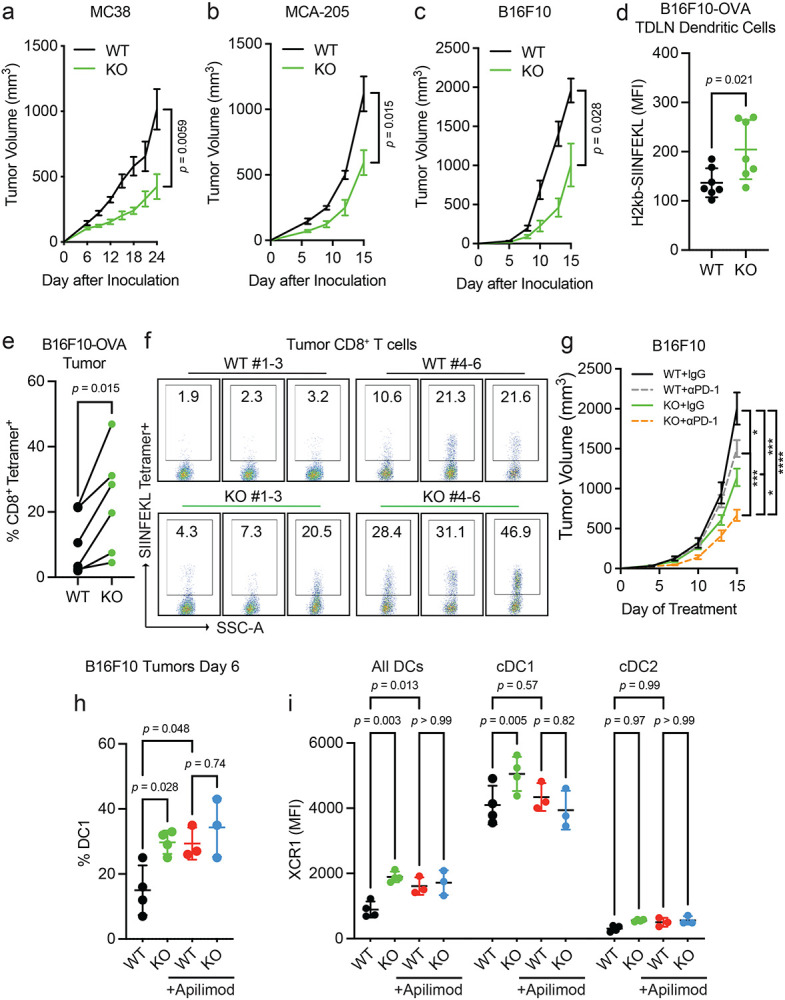
a-c. Syngeneic tumor models. (a) Subcutaneous tumor volume of MC38 tumors (mm3) in Pikfyve KO mice (n = 8) or WT mice (n = 7). Data plotted are mean ± s.e.m. P value determined by Mann-Whitney U test on Day 24. (b) Subcutaneous tumor volume of MCA-205 tumors (mm3) in Pikfyve KO mice (n = 6) or WT mice (n = 6). Data plotted are mean ± s.e.m. P value determined by Mann-Whitney U test on Day 15. (c) Subcutaneous tumor volume of B16F10 tumors (mm3) in Pikfyve KO mice (n = 8) or WT mice (n = 8). Data plotted are mean ± s.e.m. P value determined by Mann-Whitney U test on Day 15.
d-f. B16F10-OVA tumor model. (d) Relative median fluorescent intensity of surface H2-kb-SIINFEKL in WT (n = 6) vs. KO (n = 6) cDCs from tumor-draining lymph nodes of B16F10-OVA tumors. Data plotted are mean ± s.d. P value determined by Mann-Whitney U test. (e) Percentage and (f) dot plots of SIINFEKL Tetramer+ CD8+ T cells isolated from B16F10-OVA tumors. Bilateral subcutaneous tumors from each WT (n = 6) or KO (n = 6) mouse were combined for analysis. WT/KO littermate pairs #1-3 (Experiment 1) and pairs #4-6 (Experiment 2) are from two independent experiments. Data plotted are mean ± s.d. P value determined by paired Mann-Whitney U test.
g. Subcutaneous tumor volume of B16F10 tumors (mm3) in Pikfyve KO mice or WT mice treated with anti-PD1 antibody (200μg every 3 days) or isotype control (n = 8 per group) on Day 15. Data plotted are mean ± s.e.m. P value determined by ANOVA after post-hoc Tukey adjustment for multiple comparisons.
h, i. B16F10 tumor model. (h) % cDC1 of all DC cells and (i) XCR1 median fluorescent intensity by all DC, cDC1 or cDC2 subset in Pikfyve KO mice or WT mice treated with vehicle or apilimod (30 mg/kg daily). Bilateral subcutaneous tumors from each mouse (n = 4 per group) were combined for analysis. Data plotted are mean ± s.d. P value determined by ANOVA after post-hoc Tukey adjustment for multiple comparisons on day 6 of treatment.
We then investigated whether the immune response was altered with Pikfyve loss in DCs in the B16F10-OVA model. As expected, the growth of tumors (Supp. 7d-f) was decreased when inoculated in KO versus WT mice. There was no difference in the percentage of CD11c+MHC-II+ DCs isolated from tumor-draining lymph nodes (TDLNs) compared to all CD45+ cells (Supp. 7g-h). Importantly, overall H2-kb-SIINFEKL expression on the surface of DCs from the KO mice was higher than those from the WT (Fig. 4d). Concordantly, the percentage of H2kb-SIINFEKL+ DCs was increased in the KO mice (Supp. 7i). When comparing the littermate pairs of WT and KO mice, there was an increase in the percentage of SIINFEKL tetramer+ CD8+ T cells isolated from tumors from each pair (Fig. 4e-f, Supp. 7j). Therefore, Pikfyve loss enhanced DC-mediated antigen presentation and priming of antigen-specific CD8+ T cells in an in vivo tumor model.
We additionally explored whether loss of Pikfyve in DCs could alter response to anti-PD-1 therapy in the ICB-resistant B16F10 model. Tumor growth inhibition with anti-PD-1 therapy was enhanced when comparing endpoint tumor volume in Pikfyve KO mice to wild type mice (Fig. 4g).
Finally, we assessed the effects of PIKfyve inhibitor treatment on tumor-infiltrating DCs isolated from DC-selective Pikfyve KO versus WT mice. There was an increase in the percentage of cDC1s in KO versus WT mice (Fig. 4h). Importantly, treatment with apilimod increased the percentage of cDC1s amongst the WT mice but resulted in no additional increase in the KO mice. Notably, these differences were the same when evaluating total surface XCR1 expression between groups (Fig. 4i). There were no changes in the percentage of cDC2s (Supp. 8a) or total surface SIRP1α expression (Supp. 8b) between any groups. Combined, these data show that PIKfyve in DCs can modulate tumor outcomes in vivo.
Immune effects of PIKfyve are DC-dependent
Though PIKfyve inhibitors have shown anti-tumor effects in various preclinical cancer models,35,56,60,82-84 it is unclear if the activity of DCs directly contributes to its therapeutic effect. Our combined genetic and pharmagologic in vivo experiments showed no additional change in Pikfyve KO DCs with the addition of PIKfyve inhibitor treatment. Therefore, we further hypothesized that therapeutic PIKfyve inhibition required the presence of DCs to exert its full anti-tumor effect in vivo. To this end, we inoculated WT mice with subcutaneous MC38 tumors. In vivo treatment with apilimod reduced MC38 tumor growth compared to vehicle (Fig. 5a) and increased the percentage of intratumoral IFNγ+CD8+ T cells (Fig. 5b, Supp. 9a). The efficacy of apilimod was lost in immune-deficient NSG mice (Supp. 9b). To test whether drug efficacy required DCs, we used Batf3−/− mice61-63 which have loss of cDC1s. Importantly, loss of apilimod efficacy remained when comparing Batf3−/− mice to immune-competent, WT mice (Fig. 5c).
Figure 5: Immune effects of PIKfyve are DC-dependent.

a, b. MC38 tumor model. (a) Subcutaneous tumor volume of MC38 tumors (mm3) in mice treated with vehicle or apilimod (30 mg/kg x 5 days/week) (n = 10 tumors per group). Data plotted are mean ± s.e.m. P value determined by Mann-Whitney U test on day 15 of treatment. (b) Representative dot plots of percent IFNγ+ of CD8+ T cells in vehicle or apilimod-treated MC38 tumors. Bilateral subcutaneous tumors from each mouse were combined for analysis.
c. Subcutaneous tumor volume of MC38 tumors (mm3) in mice treated with vehicle versus apilimod (30 mg/kg x 5 days/week) in wild-type (n = 10 tumors per group) or Batf3−/− mice (n = 4 tumors per group). Data plotted are mean ± s.e.m. P value determined by ANOVA after post-hoc Tukey adjustment for multiple comparisons on day 15 of treatment.
d. Subcutaneous tumor volume of B16F10 tumors (mm3) in mice treated with vehicle or apilimod (30 mg/kg daily) in wild-type or Batf3−/− mice (n = 10 tumors per group). Data plotted are mean ± s.e.m. P value determined by ANOVA after post-hoc Tukey adjustment for multiple comparisons on day 9 of treatment.
e. Schematic of “vaccination” experiment demonstrating pre-treatment with oral (vehicle or apilimod) or subcutaneous (water or PolyI:C) reagents followed by B16F10-OVA tumor inoculation.
f. Individual growth curves of subcutaneous tumor volume of B16F10-OVA tumors (mm3) following 21 days of pre-treatment with vehicle versus apilimod (30 mg/kg daily) +/− subcutaneous injection of water versus PolyI:C (100 μg on Day 1 and Day 14) (n = 8 tumors per group).
g. Schematic of “vaccine therapy” experiment demonstrating combination therapy treatment with oral (vehicle or apilimod) or subcutaneous (water or PolyI:C) reagents following B16F10-OVA tumor inoculation.
h. Individual growth curves of subcutaneous tumor volume of B16F10-OVA tumors (mm3) in mice treated with vehicle or apilimod (30 mg/kg daily) +/− subcutaneous injection of water versus PolyI:C (100 μg once weekly) (n = 6 tumors per group).
We also investigated the importance of functional DC and T cell signaling pathways in apilimod treatment efficacy. In MC38 tumor-bearing mice, we observed that the efficacy of apilimod was reduced when mice were treated with neutralizing monoclonal antibodies against IL-1213 (Supp. 9c) or IFNγ35,42 (Supp. 9d) compared to isotype controls. As IL-12 is often expressed by DCs and IFNγ by T cells, the data suggests that in vivo efficacy of PIKfyve inhibition requires the presence of functional DC signaling and intact DC and T cell signaling pathways. To further validate this possibility in an additional tumor model, we inoculated WT, non-transgenic mice with subcutaneous B16F10 tumors. Treatment with apilimod in vivo reduced tumor growth compared to vehicle in this model (Supp. 9e). Again, efficacy of apilimod was lost when B16F10 tumors were inoculated into NSG (Supp. 9f) or Batf3−/− mice (Fig. 5d).
As vaccines are a DC-dependent immunotherapy strategy, we explored whether Apilimod, as a DC-modulating and DC-dependent agent could potentially modulate cancer vaccine strategies. PolyI:C and TLR agonists are commonly used as vaccine adjuvants in different tumor vaccine models.85 We treated DCs with PolyI:C or lipopolysaccharide (LPS) in the presence of apilimod in vitro. We found that PolyI:C, LPS, or apilimod stimulated MHC-I and MHC-II expression, and apilimod further enhanced this effect (Supp. 9g-h). In a proof-of-concept experiment, we explored whether PIKfyve inhibition, as a DC-maturing and DC-dependent therapy, could potentiate the effects of PolyI:C against tumor growth in vivo. First, we treated mice with apilimod or vehicle in addition to subcutaneous PolyI:C or water (control) for 21 days prior to inoculation with B16F10-OVA tumors (Fig. 5e). The combination of pre-treatment with apilimod and PolyI:C decreased subsequent tumor growth compared to control or either agent alone (Fig. 5f, Supp. 9i).
We then inoculated mice with B16F10-OVA tumors first and followed by combination therapy with vehicle or apilimod in addition to PolyI:C or water (Fig. 5g). Apilimod and PolyI:C alone resulted in modest tumor growth inhibition which was further potentiated by combination with both agents (Fig. 5h, Supp. 9j). These data suggest that PIKfyve inhibitors are clinically viable DC-dependent drugs and are promising candidates for novel combination therapy strategies with human-relevant DC-stimulating agents and adjuvants in cancer and other diseases.
Discussion
In this work, we explored whether therapeutically actionable molecular signaling pathways regulate DCs. We revealed a previously unknown fundamental mechanism for PIKfyve in controlling DC state, maturation, and function through NF-κB regulation and demonstrated its ability to potentiate immunotherapy strategies through DCs. Thus, we generated key translational insight into the potential of PIKfyve inhibitors for enhancing DC-dependent therapies in cancer, such as ICB and vaccines.
Our data are the first to comprehensively characterize a clinically viable protein kinase inhibitor strategy to enhance DC function. Though the investment into these cancer-targeted drugs has transformed cancer therapy outcomes for many patients, it is clear that further insight is required to understand how to achieve universally durable and curative responses.25,26,28,86 With the historically recent acceptance of the essential role of immunity in cancer, new studies have shown that these drugs may modulate CD8+ T cell responses and the efficacy of immunotherapy29,31-36,87-89. Notably, their impact on DCs remains largely unexplored. DCs have long been a desired target for cancer therapy given their essential role in T cell immunity.9-11 At present, it is challenging to manipulate DCs directly due to their small numbers, diversity of roles across subsets, and lack of specific targets. Our data identified a PIKfyve as a clinically-druggable molecular target in DCs. This work highlights the potential of targeting PIKfyve in DCs to improve T cell responses and immunotherapy.
Our study revealed a previously unexplored mechanistic association between PIKfyve, a lipid kinase that synthesizes phosphatidylinositol and regulates autophagy,45,47,51,52,90 and NF-κB, a transcription factor that is functionally critical for DC activation and maturation.66-70 We demonstrate that NF-κB signaling activation through PIKfyve ablation selectively occurred through the alternate or non-canonical regulators of the IκB inhibitor complex, such as TBK-1.71,91,92 Furthermore, we identified SQSTM1, which has been shown to regulate NF-κB signaling under a wide range of conditions, as a possible mechanistic linchpin.72,73,77-80 As SQSTM1 is a critical component of autophagic regulation through TBK-1,72,74-76 vesicle trafficking72,73, and transcriptional regulation,73 it is a potential nexus between PIKfyve and alternate or non-canonical NF-κB regulation. In addition, we discovered that PIKfyve may preferentially alter cDC1s in tumor models. These results are in line with a recent study demonstrating that NF-κB signaling may be crucial for cDC1 maturation.67 Our findings provide a rationale for further investigation of the potential for PIKfyve to regulate DC identity and lineage determination.
Ultimately, these data provide a strategy to transcriptionally and functionally overcome DC suppression in the tumor microenvironment through a lipid kinase. Given that PIKfyve suppresses DC function, we reason that PIKfyve inhibitors may be selected to treat cancers with high PIKfyve expression in tumors and DCs, thereby effectively targeting both tumors and the immune system. Conversely, caution may be required when considering using PIKfyve inhibitors in cancers driven by NF-κB signaling.93 Thus, these fundamental insights into DC regulation may inform optimal, “precision medicine” treatment strategies for further evaluation of PIKfyve inhibitors in specific cancers.
To our knowledge, our results are the first to distinguish PIKfyve inhibition as a DC-dependent cancer therapy. Our preclinical studies demonstrate that PIKfyve inhibitors target DCs directly, require DCs and DC/T cell signaling to prevent tumor progression, and potentiate ICB therapy. This DC-dependent nature of PIKfyve inhibitor efficacy is rooted in its ability to mediate antigen presentation to T cells. Thus, our data provides a mechanistic rationale for PIKfyve inhibitor therapy in combination with ICB and invites further inquiry into ways to potentiate other DC-dependent strategies.
In addition to ICB, tumor vaccination is an approach for cancer prevention and therapy.94-99 Many vaccination strategies involve adjuvants that directly activate DCs.85,98 In proof-of-principle experiments, we found that PIKfyve inhibition could potentiate the anti-tumor effect of Poly I:C, a cancer vaccine adjuvant. As the results of cancer vaccine therapy have remained underwhelming,100 our data provides a rationale for further investigation of PIKfyve inhibitors to vaccinate against cancers and infectious diseases. As PIKfyve inhibition is now being clinically evaluated for efficacy against COVID-19,59,101 our results substantiate the broad potential of PIKfyve inhibition as a DC-enhancing strategy across disease states.
Methods
Human studies
All clinical records in this study were obtained and utilized with the approval of Institutional Review Boards. Patients who received ICB therapy were recruited through the University of Michigan Hospital, Ann Arbor, MI, USA. Those who were enrolled in the continuous comprehensive clinical sequencing program at the Michigan Center for Translational Pathology (MCTP MI-Oncoseq program)40,42,43,102 and had bulk RNA-sequencing libraries of pre-treatment tumor were included in this analysis. Overall survival times were determined from the initiation of therapy. Response to treatment was determined using RECIST1.141 criteria with patients meeting criteria for pseudoprogression (imRECIST criteria103) being excluded from analysis. Integrative clinical sequencing was performed using standard approved protocols in the MCTP Clinical Laboratory Improvement Amendments-compliant sequencing laboratory as previously described.40,102,104 Total RNA purified using the AllPrep DNA/RNA/miRNA kit (Qiagen) was then sequenced using the exome-capture transcriptome platform on an Illumina HiSeq 2000 or HiSeq 2500 in paired-end mode. CRISP, the standard clinical RNA-Seq pipeline, was used to perform quality control, alignment, and expression quantification.105 Tables of read counts were then transformed into fragments per kilobase of transcript per million mapped reads using the Bioconductor edgeR package in R.106
Gene signature score computation
We used normalized expression of genes to define CD8+ T cell infiltration and activation (CD8A, CXCL10, CXCL9, GZMA, GZMB, IFNG, PRF1, TBX21), PIKfyve (PIKFYVE, PIP4K2A)42,43, NF-κB gene targets and cDC1 maturation scores.67 Scores were calculated by inverse-normal transformation of individual gene expression levels across the cohort followed by summation of inverse-normal values for each sample.42,43
Kinase inhibitor gene target selection
A catalog of kinase inhibitors of a commonly utilized commercial screening assay (Selleck Chem; Catalog L1800: https://www.selleckchem.com/screening/tyrosine-kinase-inhibitor-library.html)37-39,107 was utilized to identify Phase I, Phase II, and FDA-approved drugs as previously described.37
Reagents
Apilimod was purchased from Selleck Chemicals and resuspended in dimethyl sulfoxide (DMSO) for in vitro studies and in 0.5% methylcellulose (vehicle) for in vivo experiments. Lipopolysaccharides (LPS) were purchased from Millipore Sigma (L2654) and resuspended in water. EndoFit Ovalbumin (vac-pova), H-2Kb-restricted ovalbumin MHC class I epitope (257-264) peptide (vac-sin), and polyI:C (HMW) VacciGradeTM (vac-pic) were purchased from InvivoGen. EasySepTM Mouse CD8+ T cell isolation kit was purchased from Stemcell Technologies (19853).
Bone marrow-derived conventional dendritic cells
Bone marrow was collected from the femurs and tibias of mice. Dendritic cells were generated with bone marrow cells cultured with Flt3L (200 ng/ml) in IMDM (Gibco: 12440-053) supplemented with 10% FBS. For genetic knock-out studies, cells were collected on days 8-10. For pharmacologic studies, cells were collected and treated on day 6. Primary cell cultures were tested to be mycoplasma-free in accordance with standard laboratory procedures at MCTP.
Antigen presentation assays
For peptide-based antigen presentation assays, H-2Kb-restricted ovalbumin (OVA) peptide (100 ng/ml) was added to cDCs in vitro. CD8+ T cells were enriched from the lymph node and spleens of OT-I mice. 1x10⁵ OT-I T cells were then co-cultured with 1x10⁵ cDCs previously cultured with H-2Kb-restricted OVA peptide for 12 hours in 10% FBS medium with 55 μM β-ME and 5 ng/ml IL-2 in a 96-well plate. After 2 days, OT-I cells were collected and analyzed for cytokine expression.
For protein-based antigen presentation assays, CD3+ T cells were enriched from the lymph nodes and spleen of OT-I or OT-II transgenic mice. 2 x10⁵ OT-I or OT-II cells were then co-cultured with 2 x10⁵ cDCs together with soluble ovalbumin (sOVA) (10 μg/ml) for 3 days in 10% FBS medium with 55 μM β-ME and 5 ng/ml IL-2 in a 96-well plate. After 3 days, OT-I or OT-II cells were collected and analyzed for cytokine expression. In experiments with drug treatment, cDCs were pre-treated with DMSO or Apilimod (50 nM) for 4 hours and washed prior to co-culture with T cells.
Cell culture
MC38 cell line was acquired from Walter Storkus as previously described.65,108,109 B16F10 and MCA-205 were purchased from ATCC. Ovalbumin-expressing B16F10 (B16F10-OVA) was established with pCI-neo-mOVA plasmid (Addgene plasmid #25099) and selected with 1 mg/ml of G418 for 2 weeks as previously described.42,43 All cell lines were maintained at < 70% in culture and tested for mycoplasma contamination every 2 weeks according to MCTP standard protocols.
Flow cytometry analysis (FACS)
Cultured dendritic cells were collected and prepared as single cell suspensions. Single cell suspensions of mononuclear cells were isolated from bilateral tumors combined for each mouse with mechanical disassociation followed by Ficoll separation. Single cell suspensions of mononuclear cells were mechanically disassociated from bilateral tumor-draining lymph nodes.
Surface staining was performed by adding antibodies to single cell suspensions in MACS buffer (PBS, 2% FBS, 1 mM EDTA) for 30 minutes. For cytokine staining, cells were stimulated with phorbol myristate acetate (5 ng/ml), ionomycin (500 ng/ml), brefeldin A, and monensin at 37°C for 4 hours followed by surface and intracellular staining with Foxp3 /Transcription Factor Staining Buffer Set (eBioscience) per the manufacturer’s protocol. For tetramer staining, cells were first incubated with tetramer for 30 minutes prior to the addition of antibodies for surface staining. All data were acquired through LSR Fortessa (BD) and analyzed with FlowJoTM or FACS DIVA (BD Biosciences) software.
For flow cytometry analysis, the following antibodies were used: H-2Db (ThermoFisher Scientific: 28-14-8), H-2Kb (BD Biosciences: AF6-88.5), MHC-IA/IE (BD Biosciences: M5/114.15.2), CD11c (ThermoFisher Scientific: N418), CD80 (BD Biosciences: 16-10A1), CD86 (Biolegend: GL-1), XCR1 (Biolegend: ZET), and SIRP1α/CD172a (BD Biosciences: P84). H-2kb-SIINFEKL (BioLegend: 25-D1.16), CD90.2 (BD Biosciences: 53-2.1), CD8 (BD Biosciences: 53-6.7), CD4 (BD Biosciences: RM4.5), CD3 (BD Biosciences: 17A2), CD45 (BD Biosciences: 30-F11), CD45R (BD Biosciences: RA3-6B2), F4/80 (BD Biosciences: T45-2342), CD11b (ThermoFisher Scientific: M1/70), IFNγ (BD Biosciences: XMG1.2), and granzyme B (BD Biosciences: GB11). CD44 (BD Biosciences: IM7), CD62L (BD Biosciences: MEL-14), KLRG1 (BD Biosciences: 2F1). CD49a (BD Biosciences: Hα31/8), TIM-1 (BD Biosciences: 5D12), PD-1/CD279 (BD Biosciences: J43), Ki67 (BD Biosciences: B56), and CD69 (BD Biosciences: H1.2F3). For tetramer staining, iTAg Tetramer/PE against H-2 Kb OVA SIINFEKL (MBL TB-5001-1) was used.
Immunoblotting
Whole cell lysates were prepared in RIPA lysis buffer (ThermoFisher Scientific: 89900) with Halt™ Protease Inhibitor Cocktail (ThermoFisher Scientific: 78429). Protein concentrations were quantified with the Pierce BSA Standard Pre-Diluted Set (ThermoFisher: 23208). Samples were denatured in NuPage 1x LDS/reducing agent buffer for 10 minutes at 95°C. 30-60 μg protein samples were loaded into 4-12% Bis-Tris gels and transferred onto nitrocellulose membrane (ThermoFisher Scientific: 88018) using the BioRad Trans-blot Turbo System. Membranes were blocked with 5% non-fat dry milk and incubated with primary antibodies overnight at 4 °C and then incubated with host species-matched HRP-conjugated secondary antibodies (BioRad) for 1 hour at room temperature. Membranes were developed using chemiluminescence (PierceTM ECL Western Blotting Substrates, SuperSignalTM West Femto Maximum Sensitivity Substrate, Amersham ECL Prime) and detected using Li-Cor.
For immunoblot analysis, the following primary antibodies were used: MHC-I (ThermoFisher Scientific: PA5-115363), MHC-IA/IE (ThermoFisher Scientific: M5/114.15.2), CD86 (Cell Signaling: E5W6H), CD80 (Cell Signaling: E6J6N), CD40 (Cell Signaling: E2Z7), p-NF-κB p65 Ser536 (Cell Signaling: 93H1), NF-κB p65 (Cell Signaling: D14E12), p- IκB-α Ser32/36 (Cell Signaling: 5A5), IκB-α (Cell Signaling: 9242), IκB-β (Cell Signaling: D1T3Z), IKK-α (Cell Signaling: D3W6N), IKK-β (Cell Signaling: 8943), IKK-γ (Cell Signaling: 2685), IKK-ε (Cell Signaling: D61F9), p-TBK-1 (Cell Signaling: D52C2), TBK-1 (Cell Signaling: D1B4), vinculin (Sigma Aldrich: V9131), and total histone 3 (Cell Signaling: 96C10).
Preparation and analysis of bulk RNA-sequencing data
Total RNA was extracted from cDCs using the miRNeasy mini kit with the inclusion of the genomic DNA digestion step with the RNase-free DNase Kit (Qiagen). RNA quality was assessed by the Bioanalyzer RNA Nano Chip and depletion of rRNA prior to library generation was performed using RiboErase selection kit (Cat.# KK8561, Kapa Biosystems). Then, the KAPA RNA HyperPrep Kit (Cat.# KK8541, Roche Sequencing Solutions) was used to generate libraries, and sequencing was performed on the Illumina HiSeq™ 2500. Reads were aligned with the Spliced Transcripts Alignment to a Reference (STAR) to the mouse reference genome mm1068. Tables of read counts were then transformed into fragments per kilobase of transcript per million mapped reads using the Bioconductor edgeR92 package in R for further downstream analysis. Differential expression analyses were performed using the Bioconductor limma110 package in R. Gene Set Enrichment Analysis was performed using the fgsea111 package.
Analysis of published bulk RNA-sequencing data
The Riaz et al dataset44 was downloaded as FPKM expression from Gene Expression Omnibus (GEO) (GSE91061) and github (https://github.com/riazn/bms038_analysis). The TCGA Pan-Cancer dataset was downloaded as FPKM expression from the publications summary website (https://gdc.cancer.gov/about-data/publications/pancanatlas). The Murakami et al dataset81 was downloaded as TPM expression from GEO (GSE149761).
Analysis of published single cell RNA-sequencing data
We identified human cDCs in all scRNA-seq datasets as previously validated16 (C1orf54, CPVL, LGALS2, CA2, PAK1, CLEC10A, HLA-DMA, HLA-DQB1, HLA-DRA, HLA-DRB1, LYZ, FSCN1). Single-cell analysis was performed using the Seurat package (v4.1.1).112
The Qian et al dataset48 (breast, colorectal, lung, and ovarian cancers) was downloaded as raw counts from the authors’ website (https://lambrechtslab.sites.vib.be/en). Log1p data normalization and clustering was performed using the unsupervised graph-based clustering approach. The AverageExpression function was employed to extract the cell type-specific cluster gene expression.
The Sade-Feldman et al melanoma dataset49 was downloaded as log2(TPM+1) expression from the Human Cell Atlas website (https://www.humancellatlas.org/). The data was subsetted for “pre-treated” samples only. The FetchData function was utilized to evaluate gene expression per cell type.
The Chow et al endometrial cancer dataset50 was downloaded as raw counts from GEO (GSE212217). Log1p data normalization and clustering was performed using the unsupervised graph-based clustering approach. The data was subsetted for “pretreated” samples only.
Animal experiments
All animal studies were conducted with the approval of the Institutional Animal Care and Use Committee at the University of Michigan prior to initiation of procedures and data collection. Female or male wild type C57BL/6J mice (Strain #: 000664), Pikfyvef/f mice (Strain #: 029331), ItgaxTg/0 (Strain #: 007567) mice, OT-I TCR transgenic mice (Strain #:003831), OT-II TCR transgenic mice (Strain #:004194), Batf3−/− mice (Strain #: 013755), and NSG™ (Strain #: 005557) were purchased from The Jackson Laboratory. ItgaxTg/0 Pikfyvef/f C57BL/6 mice were bred internally and genotyped according to the standard protocol provided by The Jackson Laboratory. All mice were housed under specific pathogen-free conditions. All studies were compliant with all relevant ethical regulations regarding animal research. Tumor volumes were measured by caliper every 2-3 days, and tumors did not exceed 2 centimeters in any direction. All mice were maintained under pathogen-free conditions.
For in vivo studies in genetic conditional knock-out models, eight- to twelve-week-old male and female sex-matched littermate pairs of Pikfyvef/f and ItgaxTg/0 Pikfyvef/f were used for all tumor studies. For the MC38 tumor model, 1.5x10⁶ tumor cells were subcutaneously injected into both flanks of male mice. For the B16F10 and B16F10-OVA tumor models, 0.5x10⁶ tumor cells were subcutaneously injected into both flanks of female mice. For the MCA-205 tumor model, 1x10⁶ tumor cells were subcutaneously injected into both flanks of male mice. For the anti-PD-1 therapy study, on day 5 following inoculation with B16F10 tumor, 200 μg isotype control antibody (Bio X Cell: BE0089, clone 2A3) or 200 μg anti-PD-1 (Bio X Cell: BE0146, clone RMP1-14) was administered intraperitoneally to each mouse every 3 days throughout the experiment.
For drug therapy studies, six- to eight -week-old male and female wild type C57BL/6 mice were inoculated with MC38 or B16F10 syngeneic cancer cell lines. For the anti-IFNγ blockade study, on day 7 following inoculation with MC38 tumor, 100 μg isotype control antibody (Bio X Cell: BE0088, clone HRPN) or 100 μg mouse anti-IFNγ (Bio X Cell: BE0055, Clone XMG1.2) was administered intraperitoneally in 4 doses every other day to each mouse with either vehicle or apilimod 30 mg/kg given either 5 days per week (MC38) or daily (B16F10) administered by oral gavage. For the anti-IL-12 blockade study, on day 7 following inoculation with MC38 tumor, a single dose of 1 mg isotype control antibody (Bio X Cell: BE0089, clone 2A3) or 1 mg mouse anti-IL-12p40 (Bio X Cell: BE0051, Clone C17.8) was administered intraperitoneally to each mouse followed by three additional doses of 500 μg of either antibody given every other day +/− either vehicle or apilimod (30 mg/kg, 5 days per week) administered by oral gavage.
For vaccine strategy experiments, six- to eight -week-old female wild type C57BL/6 mice were inoculated with B16F10-OVA tumors. For the vaccination study, mice were pretreated with vehicle or apilimod (30 mg/kg, 5 days per week) administered by oral gavage +/− water or PolyI:C subcutaneously (100 μg on Day 1 and Day 14) for 21 days. On Day 22, B16F10-OVA tumors were inoculated and monitored for an additional 14 days in the absence of treatment. For the vaccine therapy study, B16F10-OVA tumors were inoculated. On Day 5, mice began treatment with vehicle or apilimod (30mg/kg, 5 days per week) administered by oral gavage +/− water or PolyI:C subcutaneously (100 μg on Day 5 and Day 12) for a total of eleven days of treatment.
Statistical analysis
Sample sizes for clinical statistical analyses were not predetermined. Overall survival was estimated by Kaplan-Meier methods and compared with log-rank tests. Cox proportional hazard models were used for multivariate survival analysis. Multivariate logistic regression models were used to assess binary outcomes of response to treatment. Pearson’s correlation coefficient was used to assess linear correlations between variables. Chi-square test was performed to assess independence of groups. All statistical analyses were performed using R.
In vitro experiments were carried out in duplicate or triplicate independent experiments as indicated. Student t-tests were performed to assess differences between groups. All in vivo studies included a minimum of three littermate pairs of WT or KO mice as biological replicates for genetic conditional knock-out studies and a minimum of four mice per group for drug therapy studies. Mann-Whitney U or ANOVA with post-hoc Tukey adjustment for multiple comparisons were performed to assess differences between groups as indicated. All statistical analyses were performed using GraphPad Prism software.
Data availability
Raw data are included in the Source Data or Supplementary Information. All materials are available from the corresponding authors upon reasonable request. Clinical sequencing data are publicly available.40,43 RNA-seq data newly generated in this study for in vitro analysis have been deposited in the Gene Expression Omnibus repository at NCBI (accession codes GSE235596 and GSE235599).
Supplementary Material
Extended Data Fig. 1
Supp 1a. Comparison of PIKfyve scores in patients with melanoma who were ICB treatment-naïve (“NAÏVE”) versus those who had previously progressed on ICB treatment (“PROG”). Data plotted are mean ± s.d. from bulk RNA-seq data.44 P value is determined by Mann Whitney U test.
Supp 1b. Forest plot of hazard ratios of NAÏVE cohort by high vs. low PIKfyve score, high vs. low neoantigen load, disease stage (reference is M0), and mutation subtype (reference is None). Data plotted are hazard ratios with 95% confidence intervals from bulk RNA-seq data.44 P values are determined by a multivariate cox proportional hazards model.
Supp 1c. Forest plot of hazard ratios of PROG cohort by high vs. low PIKfyve score, high vs. low neoantigen load, disease stage (reference is M1A), and mutation subtype (reference is None). Data plotted are hazard ratios with 95% confidence intervals from bulk RNA-seq data.44 P values are determined by a multivariate cox proportional hazards model.
Supp 1d-g. t-SNE plots of immune cells in pre-treatment tumors from patients with (d) breast, (e) colorectal, (f) lung or (g) ovarian cancer from scRNA-seq data.48
Supp 1h. Barplots of PIKFYVE cluster average expression by cancer, stroma, or immune cell type from scRNA-seq data.48
Supp 1i. t-SNE plot of immune cells in pre-treatment tumors from patients with endometrial cancer from scRNA-seq data.50
Supp 1j. Comparison of log (PIKFYVE) expression in cDCs in patients with endometrial cancer who were nonresponders (“NR” including SD and PD) versus CR to ICB treatment. Data plotted are mean ± s.d. from scRNA-seq data.50 P value is determined by student t-test with Welch’s correction.
Extended Data Fig. 2
Supp 2a. Gating strategy for Supp 2 panels b-g for CD8+ T cells.
Supp 2b-g. Comparison of the percentage of (b) CD69+ effector, (c) naïve, (d) terminally differentiated, (e) resident memory, (f) central memory, and (g) exhausted CD8+ T cells from spleens of non-tumor-bearing mice treated with vehicle or apilimod (30 mg/kg daily) on day 5 of treatment (n = 5 spleens per group). Data plotted are mean ± s.d. P values generated from student t-test.
Supp 2h. Gating strategy for Figure 2 panels a-b and Supp 2 panels i-l for myeloid cells and cDCs.
Supp 2i-l. Comparison of the percentage of total (i) CD11c, (j) F4/80, and (k) CD11b in CD45+ cells and (l) percentage of cDC2 cells from spleens of non-tumor-bearing mice treated with vehicle or apilimod (30 mg/kg daily) on day 5 of treatment (n = 5 per group). Data plotted are mean ± s.d. P values generated from student t-test.
Extended Data Fig. 3
Supp 3a. Gating strategy for Figure 2 panels c-r and Supp panels b-h (CD11c+ gate).
Supp 3b. Immunoblots of PIKfyve in Pikfyve WT vs. KO cDC lysates on culture day 9. Total histone H3 serves as loading control. Image is representative of two experiments.
Supp 3c. Representative density plot of median fluorescent intensity of surface XCR1 in DMSO or apilimod-treated cDCs after 20 hours on culture day 6.
Supp 3d. Comparison of the percentage of CD80+CD86+- cDCs in Pikfyve WT vs KO models. Data plotted are mean ± s.d. P values generated from student t-test across 3 replicates.
Supp 3e, f. Relative median fluorescent intensity of surface H-2kb-SIINFEKL (e) and percent H-2kb-SIINFEKL+ cells (f) in Pikfyve WT vs. KO cDC +/− pOVA (100 ng/ml) after 12 hours on culture day 9. Data plotted are mean ± s.d. P value determined by student t-test across 3 replicates. Representative plots shown.
Supp 3g, h. Relative median fluorescent intensity of surface H-2kb-SIINFEKL (g) and percent H2kb-SIINFEKL+ cells (h) in DMSO or apilimod-treated cDCs +/− pOVA (100 ng/ml) after 12 hours. Data plotted are mean ± s.d. P value determined by student t-test across 3 replicates. Representative plots shown.
Extended Data Fig. 4
Supp 4a. Gating strategy for Supp 4b-e (CD90+ CD8+ gate for OT-I cells).
Supp 4b, c. Representative dot plot and percentage of (b) IFNγ+ and (c) granzyme B+ OT-I cells after 48 hours of co-culture with Pikfyve WT vs. KO cDCs +/− pOVA 100ng/ml. n = 3 biological replicates. Data plotted are mean ± s.d. P value determined by student t-test.
Supp 4d, e. Representative dot plot and percentage of (d) IFNγ+ and (e) granzyme B+ OT-I cells after 48 hours of co-culture with DMSO or apilimod pre-treated cDCs +/− pOVA 100 ng/ml. n = 3 biological replicates. Data plotted are mean ± s.d. P value determined by student t-test.
Supp 4f, g. Percentage of Ki67+ OT-I (f) or OT-II (g) cells after 72 hours of co-culture with (Pikfyve WT vs. KO pre-treated cDCs +/− sOVA (10 μg/ml). n = 3 biological replicates. Data plotted are mean ± s.d. P value determined by student t-test.
Supp 4h, i. Percent of Ki67+ OT-I (h) or OT-II (i) cells after 72 hours of co-culture with DMSO or apilimod pre-treated cDCs +/− sOVA (10 μg/ml). n = 3 biological replicates. Data plotted are mean ± s.d. P value determined by student t-test.
Extended Data Fig. 5
Supp 5a. Enrichment plot of Dendritic Cell Maturation Up gene signature (M4562: LENAOUR_DENDRITIC_CELL_MATURATION_UP) in Pikfyve KO vs. WT cDCs on culture day 9.
Supp 5b. Enrichment plot of MSigDB Hallmark “TNF_SIGNALING_VIA_NFκB” in Pikfyve KO vs. WT cDCs on culture day 9.
Supp 5c, d. Enrichment plots of MSigDB Hallmark “TNF_SIGNALING_VIA_NFκB” in apilimod vs. DMSO-treated cDCs treated for (c) 3 hours or (d) 8 hours on culture day 6.
Supp 5e. Comparison of Il12b expression fold change by RT-qPCR in apilimod vs. DMSO-treated cDCs treated for 3 or 12 hours on culture day 6. Data plotted are mean ± s.d. P value determined by ANOVA after post-hoc Tukey adjustment for multiple comparisons across 3 replicates.
Supp 5f. Comparison of IL-12p40 protein levels by ELISA in media from apilimod vs. DMSO-treated cDCs treated for 12 hours on culture day 6. Data plotted are mean ± s.d. P values generated from student t-test across 3 replicates.
Supp 5g. Comparison of IL-12p70 protein levels by ELISA in media from apilimod vs. DMSO-treated cDCs treated for 24 hours on culture day 6. Data plotted are mean ± s.d. P values generated from student t-test across 3 replicates.
Extended Data Fig. 6
Supp 6a. Kaplan-Meier curve of overall survival of patients in the TCGA Pan-Cancer bulk RNA-seq dataset, by high or low (median) SQSTM1 normalized gene expression. P value is determined by log-rank test.
Supp 6b. Comparison of Sqstm1 normalized gene expression across myeloid lineage cell types. Data plotted are mean ± s.d. from bulk RNA-seq data.81 P value determined by ANOVA after post-hoc Tukey adjustment for multiple comparisons across all pair-wise comparisons. P value for cDC1 versus cDC2 shown on plot.
Supp 6c. Correlation between SQSTM1 normalized gene expression and NF-κB target genes expression in the TCGA Pan-Cancer bulk RNA-seq dataset. Correlation coefficient and P value calculated using Pearson’s product-moment correlation.
Extended Data Fig. 7
Supp 7a-c. Tumor weights for (a) MC38 tumor measured on Day 26, (b) MCA-205 tumor measured on Day 16, and (c) B16F10 tumor measured on Day 16. Data plotted are mean ± s.d. P values determined by Mann-Whitney U test.
Supp 7d-f. Subcutaneous tumor volume from (d) Experiment 1 and (e) Experiment 2 of B16F10-OVA tumors (mm3) in Pikfyve KO mice or WT mice. Data plotted are mean ± s.e.m. P value determined by Mann-Whitney U test on Day 15. (f) Image of B16F10-OVA tumors on Day 16. Bilateral subcutaneous tumors were excised from 3 WT/KO littermate pairs per experiment in two independent experiments.
Supp 7g. Gating strategy for Fig. 4d, Supp. 7h-i (CD45+ Lin(−) CD11c+ MHC-II+ gate for dendritic cells from tumor-draining lymph nodes).
Supp 7h. Percent dendritic cells of CD45+ cells in Pikfyve WT (n = 6) vs. KO (n = 6) tumor-draining lymph nodes of B16F10-OVA tumors. Data plotted are mean ± s.d. P value determined by Mann-Whitney U test.
Supp 7i. Percent H2-kb-SIINFEKL+ dendritic cells in WT (n = 6) vs. KO (n = 6) tumor-draining lymph nodes of B16F10-OVA tumors. Data plotted are mean ± s.d. P value determined by Mann-Whitney U test.
Supp 7j. Gating strategy for Fig. 4e-f (7-AAD-CD90+ CD3+ CD8+ gate for intratumoral CD8+ T cells).
Extended Data Fig. 8
Supp 8a, b. B16F10 tumor model. (a) % cDC2 of all DC cells and (b) SIRP1α median fluorescent intensity by all DC, cDC1, or cDC2 subset in Pikfyve KO mice or WT mice treated with vehicle or apilimod (30 mg/kg daily). Bilateral subcutaneous tumors from each mouse (n = 4 per group) were combined for analysis. Data plotted are mean ± s.d. P value determined by ANOVA after post-hoc Tukey adjustment for multiple comparisons on day 6 of treatment.
Extended Data Fig. 9
Supp 9a. Percent IFNγ+ of CD8+ T cells in vehicle or apilimod-treated (30 mg/kg x 5 days/week) MC38 tumors. Bilateral subcutaneous tumors from each vehicle or apilimod-treated (n = 5 per group) mouse were combined for analysis. Data plotted are mean ± s.d. P value determined by Mann-Whitney U test.
Supp 9b. Subcutaneous tumor volume of MC38 tumors (mm3) treated with vehicle versus apilimod (30 mg/kg x 5 days/week) (n = 6 tumors per group) in NSG™ mice. Data plotted are mean ± s.e.m. P value determined by Mann-Whitney U test on day 15 of treatment.
Supp 9c. Subcutaneous tumor volume of MC38 tumors (mm3) in mice treated with vehicle versus apilimod (30 mg/kg x 5 days/week) (n = 6 tumors per group) treated with IgG2a or αIL-12p40 blocking antibody. Data plotted are mean ± s.e.m. P value determined by ANOVA after post-hoc Tukey adjustment for multiple comparisons on day 15 treatment.
Supp 9d. Subcutaneous tumor volume of MC38 tumors (mm3) in mice treated with vehicle versus apilimod (30 mg/kg x 5 days/week) (n = 6 tumors per group) treated with IgG1 or αIFNγ blocking antibody. Data plotted are mean ± s.e.m. P value determined by ANOVA after post-hoc Tukey adjustment for multiple comparisons on day 15 of treatment.
Supp 9e. Subcutaneous tumor volume of B16F10 tumors (mm3) in mice treated with vehicle or apilimod (30 mg/kg daily) (n = 10 tumors per group). Data plotted are mean ± s.e.m. P value determined by Mann-Whitney U test on day 9 of treatment.
Supp 9f. Subcutaneous tumor volume of B16F10 tumors (mm3) in mice treated with vehicle versus apilimod (30 mg/kg daily) (n = 10 tumors per group) in NSG™ mice. Data plotted are mean ± s.e.m. P value determined by Mann Whitney U test on day 11 of treatment.
Supp 9g, h. Relative median fluorescent intensity of (g) surface MHC-I (H2-kb, H2-kd) and (h) surface MHC-II (MHC-IA-IE) on DMSO or apilimod-treated cDCs +/− PolyI:C (50 μg/ml) or LPS (50 ng/ml) treated for 20 hours on culture day 6. Images are representative of two experiments.
Supp 9i. Subcutaneous tumor volume of B16F10-OVA tumors (mm3) following 21 days of pre-treatment with vehicle versus apilimod (30 mg/kg x 5 days/week) +/− subcutaneous injection of water versus PolyI:C (100μg on Day 1 and Day 14) (n = 8 tumors per group). Data plotted are mean ± s.e.m. P value determined by Mann-Whitney U test on Day 14 after tumor inoculation.
Supp 9j. Subcutaneous tumor volume of B16F10-OVA tumors (mm3) in mice treated with vehicle or apilimod (30 mg/kg x 5 days/week) +/− subcutaneous injection of water versus PolyI:C (100μg once weekly) (n = 6 tumors per group). Data plotted are mean ± s.e.m. P value determined by Mann-Whitney U test on Day 11 of treatment.
Acknowledgements
We thank members of the Chinnaiyan and Zou/Kryczek labs in the Michigan Center for Translational Pathology for their support and intellectual contributions to this study. We thank Stephanie Miner for assistance with the review, editing, and submission of this manuscript. We also thank Stephanie Simko, Andrew Delekta, Ingrid Apel, and Mishaal Yazdani for their technical assistance and Wojtek Szeliga, Teri Elkins, Chia-Mei Huang, and Melissa Dunn for their assistance with lab management. Finally, we thank Goutham Narla and James Moon for their scholarly contributions and discussions. This work was supported by R35 (CA231996) and the NCI Prostate SPORE (P50 CA186786) grants to A.M.C. and NCI F31 (CA26461-01) grant to J.E.C. A.M.C. is a Howard Hughes Medical Institute Investigator, A. Alfred Taubman Scholar, and American Cancer Society Professor.
Footnotes
Competing interest declaration
A.M.C. is co-founder and SAB member of LynxDx, Esanik, Medsyn, and Flamingo Therapeutics. A.M.C. serves as a scientific advisor or consultant to EdenRoc, Proteovant, Rebus, and Tempus. W.Z. has served as a scientific advisor or consultant for NGM, CrownBio, Cstone, ProteoVant, Hengenix, NextCure, and Intergalactic. All other authors declare no competing interests.
References
- 1.Zhang Y. & Zhang Z. The history and advances in cancer immunotherapy: understanding the characteristics of tumor-infiltrating immune cells and their therapeutic implications. Cell. Mol. Immunol. 17, 807–821 (2020). [DOI] [PMC free article] [PubMed] [Google Scholar]
- 2.Waldman A. D., Fritz J. M. & Lenardo M. J. A guide to cancer immunotherapy: from T cell basic science to clinical practice. Nat. Rev. Immunol. 20, 651–668 (2020). [DOI] [PMC free article] [PubMed] [Google Scholar]
- 3.Litchfield K. et al. Meta-analysis of tumor- and T cell-intrinsic mechanisms of sensitization to checkpoint inhibition. Cell 184, 596–614.e14 (2021). [DOI] [PMC free article] [PubMed] [Google Scholar]
- 4.Hanahan D. Hallmarks of Cancer: New Dimensions. Cancer Discov. 12, 31–46 (2022). [DOI] [PubMed] [Google Scholar]
- 5.Zou W. Regulatory T cells, tumour immunity and immunotherapy. Nat. Rev. Immunol. 6, 295–307 (2006). [DOI] [PubMed] [Google Scholar]
- 6.Peranzoni E. et al. Macrophages impede CD8 T cells from reaching tumor cells and limit the efficacy of anti-PD-1 treatment. Proc. Natl. Acad. Sci. U. S. A. 115, E4041–E4050 (2018). [DOI] [PMC free article] [PubMed] [Google Scholar]
- 7.Baker A. T., Abuwarwar M. H., Poly L., Wilkins S. & Fletcher A. L. Cancer-Associated Fibroblasts and T Cells: From Mechanisms to Outcomes. J. Immunol. 206, 310–320 (2021). [DOI] [PubMed] [Google Scholar]
- 8.Monu N. R. & Frey A. B. Myeloid-derived suppressor cells and anti-tumor T cells: a complex relationship. Immunol. Invest. 41, 595–613 (2012). [DOI] [PMC free article] [PubMed] [Google Scholar]
- 9.Wculek S. K. et al. Dendritic cells in cancer immunology and immunotherapy. Nat. Rev. Immunol. 20, 7–24 (2020). [DOI] [PubMed] [Google Scholar]
- 10.Domogalla M. P., Rostan P. V., Raker V. K. & Steinbrink K. Tolerance through Education: How Tolerogenic Dendritic Cells Shape Immunity. Front. Immunol. 8, 1764 (2017). [DOI] [PMC free article] [PubMed] [Google Scholar]
- 11.Joffre O. P., Segura E., Savina A. & Amigorena S. Cross-presentation by dendritic cells. Nat. Rev. Immunol. 12, 557–569 (2012). [DOI] [PubMed] [Google Scholar]
- 12.Jhunjhunwala S., Hammer C. & Delamarre L. Antigen presentation in cancer: insights into tumour immunogenicity and immune evasion. Nat. Rev. Cancer 21, 298–312 (2021). [DOI] [PubMed] [Google Scholar]
- 13.Garris C. S. et al. Successful Anti-PD-1 Cancer Immunotherapy Requires T Cell-Dendritic Cell Crosstalk Involving the Cytokines IFN-γ and IL-12. Immunity 49, 1148–1161.e7 (2018). [DOI] [PMC free article] [PubMed] [Google Scholar]
- 14.Mateo J. et al. Accelerating precision medicine in metastatic prostate cancer. Nat Cancer 1, 1041–1053 (2020). [DOI] [PMC free article] [PubMed] [Google Scholar]
- 15.Chu G., Shan W., Ji X., Wang Y. & Niu H. Multi-Omics Analysis of Novel Signature for Immunotherapy Response and Tumor Microenvironment Regulation Patterns in Urothelial Cancer. Front Cell Dev Biol 9, 764125 (2021). [DOI] [PMC free article] [PubMed] [Google Scholar]
- 16.Gerhard G. M., Bill R., Messemaker M., Klein A. M. & Pittet M. J. Tumor-infiltrating dendritic cell states are conserved across solid human cancers. J. Exp. Med. 218, (2021). [DOI] [PMC free article] [PubMed] [Google Scholar]
- 17.Kepp O. et al. Molecular determinants of immunogenic cell death elicited by anticancer chemotherapy. Cancer Metastasis Rev. 30, 61–69 (2011). [DOI] [PubMed] [Google Scholar]
- 18.Kawano M. et al. Dendritic cells combined with doxorubicin induces immunogenic cell death and exhibits antitumor effects for osteosarcoma. Oncol. Lett. 11, 2169–2175 (2016). [DOI] [PMC free article] [PubMed] [Google Scholar]
- 19.Shurin G. V., Tourkova I. L., Kaneno R. & Shurin M. R. Chemotherapeutic agents in noncytotoxic concentrations increase antigen presentation by dendritic cells via an IL-12-dependent mechanism. J. Immunol. 183, 137–144 (2009). [DOI] [PMC free article] [PubMed] [Google Scholar]
- 20.Liang Y.-H. et al. Chemotherapy agents stimulate dendritic cells against human colon cancer cells through upregulation of the transporter associated with antigen processing. Sci. Rep. 11, 9080 (2021). [DOI] [PMC free article] [PubMed] [Google Scholar]
- 21.Michels T. et al. Paclitaxel promotes differentiation of myeloid-derived suppressor cells into dendritic cells in vitro in a TLR4-independent manner. J. Immunotoxicol. 9, 292–300 (2012). [DOI] [PMC free article] [PubMed] [Google Scholar]
- 22.Zhou X. et al. Chemotherapy combined with dendritic cell vaccine and cytokine-induced killer cells in the treatment of colorectal carcinoma: a meta-analysis. Cancer Manag. Res. 10, 5363–5372 (2018). [DOI] [PMC free article] [PubMed] [Google Scholar]
- 23.Yu B. et al. Effective combination of chemotherapy and dendritic cell administration for the treatment of advanced-stage experimental breast cancer. Clin. Cancer Res. 9, 285–294 (2003). [PubMed] [Google Scholar]
- 24.Rob L. et al. Safety and efficacy of dendritic cell-based immunotherapy DCVAC/OvCa added to first-line chemotherapy (carboplatin plus paclitaxel) for epithelial ovarian cancer: a phase 2, open-label, multicenter, randomized trial. J Immunother Cancer 10, (2022). [DOI] [PMC free article] [PubMed] [Google Scholar]
- 25.Cohen P., Cross D. & Jänne P. A. Kinase drug discovery 20 years after imatinib: progress and future directions. Nat. Rev. Drug Discov. 20, 551–569 (2021). [DOI] [PMC free article] [PubMed] [Google Scholar]
- 26.Arora A. & Scholar E. M. Role of tyrosine kinase inhibitors in cancer therapy. J. Pharmacol. Exp. Ther. 315, 971–979 (2005). [DOI] [PubMed] [Google Scholar]
- 27.Kannaiyan R. & Mahadevan D. A comprehensive review of protein kinase inhibitors for cancer therapy. Expert Rev. Anticancer Ther. 18, 1249–1270 (2018). [DOI] [PMC free article] [PubMed] [Google Scholar]
- 28.Madhusudan S. & Ganesan T. S. Tyrosine kinase inhibitors in cancer therapy. Clin. Biochem. 37, 618–635 (2004). [DOI] [PubMed] [Google Scholar]
- 29.Wang H. et al. Tumor immunological phenotype signature-based high-throughput screening for the discovery of combination immunotherapy compounds. Sci Adv 7, (2021). [DOI] [PMC free article] [PubMed] [Google Scholar]
- 30.Moynihan K. D. et al. Eradication of large established tumors in mice by combination immunotherapy that engages innate and adaptive immune responses. Nat. Med. 22, 1402–1410 (2016). [DOI] [PMC free article] [PubMed] [Google Scholar]
- 31.Hu-Lieskovan S. et al. Improved antitumor activity of immunotherapy with BRAF and MEK inhibitors in BRAF(V600E) melanoma. Sci. Transl. Med. 7, 279ra41 (2015). [DOI] [PMC free article] [PubMed] [Google Scholar]
- 32.Baumann D. et al. Proimmunogenic impact of MEK inhibition synergizes with agonist anti-CD40 immunostimulatory antibodies in tumor therapy. Nat. Commun. 11, 2176 (2020). [DOI] [PMC free article] [PubMed] [Google Scholar]
- 33.Peng D. H. et al. Th17 cells contribute to combination MEK inhibitor and anti-PD-L1 therapy resistance in KRAS/p53 mutant lung cancers. Nat. Commun. 12, 2606 (2021). [DOI] [PMC free article] [PubMed] [Google Scholar]
- 34.Gong K. et al. EGFR inhibition triggers an adaptive response by co-opting antiviral signaling pathways in lung cancer. Nat Cancer 1, 394–409 (2020). [DOI] [PMC free article] [PubMed] [Google Scholar]
- 35.Qiao Y. et al. Autophagy Inhibition by Targeting PIKfyve Potentiates Response to Immune Checkpoint Blockade in Prostate Cancer. Nat Cancer 2, 978–993 (2021). [DOI] [PMC free article] [PubMed] [Google Scholar]
- 36.Ribas A. et al. PD-L1 blockade in combination with inhibition of MAPK oncogenic signaling in patients with advanced melanoma. Nat. Commun. 11, 6262 (2020). [DOI] [PMC free article] [PubMed] [Google Scholar]
- 37.Corsello S. M. et al. The Drug Repurposing Hub: a next-generation drug library and information resource. Nat. Med. 23, 405–408 (2017). [DOI] [PMC free article] [PubMed] [Google Scholar]
- 38.Martin J. K. 2nd et al. A Dual-Mechanism Antibiotic Kills Gram-Negative Bacteria and Avoids Drug Resistance. Cell 181, 1518–1532.e14 (2020). [DOI] [PMC free article] [PubMed] [Google Scholar]
- 39.Tanaka K. et al. Targeting Aurora B kinase prevents and overcomes resistance to EGFR inhibitors in lung cancer by enhancing BIM- and PUMA-mediated apoptosis. Cancer Cell 39, 1245–1261.e6 (2021). [DOI] [PMC free article] [PubMed] [Google Scholar]
- 40.Robinson D. R. et al. Integrative clinical genomics of metastatic cancer. Nature 548, 297–303 (2017). [DOI] [PMC free article] [PubMed] [Google Scholar]
- 41.Eisenhauer E. A. et al. New response evaluation criteria in solid tumours: revised RECIST guideline (version 1.1). Eur. J. Cancer 45, 228–247 (2009). [DOI] [PubMed] [Google Scholar]
- 42.Wang W. et al. CD8+ T cells regulate tumour ferroptosis during cancer immunotherapy. Nature 569, 270–274 (2019). [DOI] [PMC free article] [PubMed] [Google Scholar]
- 43.Yu J. et al. Liver metastasis restrains immunotherapy efficacy via macrophage-mediated T cell elimination. Nat. Med. 27, 152–164 (2021). [DOI] [PMC free article] [PubMed] [Google Scholar]
- 44.Riaz N. et al. Tumor and Microenvironment Evolution during Immunotherapy with Nivolumab. Cell 171, 934–949.e16 (2017). [DOI] [PMC free article] [PubMed] [Google Scholar]
- 45.Krishna S. et al. PIKfyve Regulates Vacuole Maturation and Nutrient Recovery following Engulfment. Dev. Cell 38, 536–547 (2016). [DOI] [PMC free article] [PubMed] [Google Scholar]
- 46.Vicinanza M. et al. PI(5)P regulates autophagosome biogenesis. Mol. Cell 57, 219–234 (2015). [DOI] [PMC free article] [PubMed] [Google Scholar]
- 47.Giridharan S. S. P. et al. Lipid kinases VPS34 and PIKfyve coordinate a phosphoinositide cascade to regulate retriever-mediated recycling on endosomes. Elife 11, (2022). [DOI] [PMC free article] [PubMed] [Google Scholar]
- 48.Qian J. et al. A pan-cancer blueprint of the heterogeneous tumor microenvironment revealed by single-cell profiling. Cell Res. 30, 745–762 (2020). [DOI] [PMC free article] [PubMed] [Google Scholar]
- 49.Sade-Feldman M. et al. Defining T Cell States Associated with Response to Checkpoint Immunotherapy in Melanoma. Cell 175, 998–1013.e20 (2018). [DOI] [PMC free article] [PubMed] [Google Scholar]
- 50.Chow R. D. et al. Distinct Mechanisms of Mismatch-Repair Deficiency Delineate Two Modes of Response to Anti-PD-1 Immunotherapy in Endometrial Carcinoma. Cancer Discov. 13, 312–331 (2023). [DOI] [PMC free article] [PubMed] [Google Scholar]
- 51.Choy C. H. et al. Lysosome enlargement during inhibition of the lipid kinase PIKfyve proceeds through lysosome coalescence. J. Cell Sci. 131, (2018). [DOI] [PMC free article] [PubMed] [Google Scholar]
- 52.Hessvik N. P. et al. PIKfyve inhibition increases exosome release and induces secretory autophagy. Cell. Mol. Life Sci. 73, 4717–4737 (2016). [DOI] [PMC free article] [PubMed] [Google Scholar]
- 53.Baranov M. V. et al. The Phosphoinositide Kinase PIKfyve Promotes Cathepsin-S-Mediated Major Histocompatibility Complex Class II Antigen Presentation. iScience 11, 160–177 (2019). [DOI] [PMC free article] [PubMed] [Google Scholar]
- 54.Sharma G. et al. A family of PIKFYVE inhibitors with therapeutic potential against autophagy-dependent cancer cells disrupt multiple events in lysosome homeostasis. Autophagy 15, 1694–1718 (2019). [DOI] [PMC free article] [PubMed] [Google Scholar]
- 55.Cai X. et al. PIKfyve, a class III PI kinase, is the target of the small molecular IL-12/IL-23 inhibitor apilimod and a player in Toll-like receptor signaling. Chem. Biol. 20, 912–921 (2013). [DOI] [PMC free article] [PubMed] [Google Scholar]
- 56.Magid Diefenbach C. S. et al. Results of a completed phase I study of LAM-002 (apilimod dimesylate), a first-in-class phosphatidylinositol-3-phosphate 5 kinase (PIKfyve) inhibitor, administered as monotherapy or with rituximab or atezolizumab to patients with previously treated follicular lymphoma or other B-cell cancers. Journal of Clinical Oncology 38, 8017–8017 (2020). [Google Scholar]
- 57.Wada Y. et al. Apilimod inhibits the production of IL-12 and IL-23 and reduces dendritic cell infiltration in psoriasis. PLoS One 7, e35069 (2012). [DOI] [PMC free article] [PubMed] [Google Scholar]
- 58.Krausz S. et al. Brief report: a phase IIa, randomized, double-blind, placebo-controlled trial of apilimod mesylate, an interleukin-12/interleukin-23 inhibitor, in patients with rheumatoid arthritis. Arthritis Rheum. 64, 1750–1755 (2012). [DOI] [PubMed] [Google Scholar]
- 59.Kang Y.-L. et al. Inhibition of PIKfyve kinase prevents infection by Zaire ebolavirus and SARS-CoV-2. Proc. Natl. Acad. Sci. U. S. A. 117, 20803–20813 (2020). [DOI] [PMC free article] [PubMed] [Google Scholar]
- 60.Gayle S. et al. Identification of apilimod as a first-in-class PIKfyve kinase inhibitor for treatment of B-cell non-Hodgkin lymphoma. Blood 129, 1768–1778 (2017). [DOI] [PMC free article] [PubMed] [Google Scholar]
- 61.Hildner K. et al. Batf3 deficiency reveals a critical role for CD8alpha+ dendritic cells in cytotoxic T cell immunity. Science 322, 1097–1100 (2008). [DOI] [PMC free article] [PubMed] [Google Scholar]
- 62.Durai V. et al. Cryptic activation of an Irf8 enhancer governs cDC1 fate specification. Nat. Immunol. 20, 1161–1173 (2019). [DOI] [PMC free article] [PubMed] [Google Scholar]
- 63.Ferris S. T. et al. cDC1 prime and are licensed by CD4+ T cells to induce anti-tumour immunity. Nature 584, 624–629 (2020). [DOI] [PMC free article] [PubMed] [Google Scholar]
- 64.Hogquist K. A. et al. T cell receptor antagonist peptides induce positive selection. Cell 76, 17–27 (1994). [DOI] [PubMed] [Google Scholar]
- 65.Lin H. et al. Stanniocalcin 1 is a phagocytosis checkpoint driving tumor immune resistance. Cancer Cell 39, 480–493.e6 (2021). [DOI] [PMC free article] [PubMed] [Google Scholar]
- 66.Ouaaz F., Arron J., Zheng Y., Choi Y. & Beg A. A. Dendritic cell development and survival require distinct NF-kappaB subunits. Immunity 16, 257–270 (2002). [DOI] [PubMed] [Google Scholar]
- 67.Ghislat G. et al. NF-κB-dependent IRF1 activation programs cDC1 dendritic cells to drive antitumor immunity. Sci Immunol 6, (2021). [DOI] [PubMed] [Google Scholar]
- 68.Wang J. et al. Distinct roles of different NF-kappa B subunits in regulating inflammatory and T cell stimulatory gene expression in dendritic cells. J. Immunol. 178, 6777–6788 (2007). [DOI] [PubMed] [Google Scholar]
- 69.Baratin M. et al. Homeostatic NF-κB Signaling in Steady-State Migratory Dendritic Cells Regulates Immune Homeostasis and Tolerance. Immunity 42, 627–639 (2015). [DOI] [PubMed] [Google Scholar]
- 70.Zhang Q., Lenardo M. J. & Baltimore D. 30 Years of NF-κB: A Blossoming of Relevance to Human Pathobiology. Cell 168, 37–57 (2017). [DOI] [PMC free article] [PubMed] [Google Scholar]
- 71.Yum S., Li M., Fang Y. & Chen Z. J. TBK1 recruitment to STING activates both IRF3 and NF-κB that mediate immune defense against tumors and viral infections. Proc. Natl. Acad. Sci. U. S. A. 118, (2021). [DOI] [PMC free article] [PubMed] [Google Scholar]
- 72.Zhou B. et al. Extracellular SQSTM1 mediates bacterial septic death in mice through insulin receptor signalling. Nat Microbiol 5, 1576–1587 (2020). [DOI] [PMC free article] [PubMed] [Google Scholar]
- 73.Aflaki E. et al. Lysosomal storage and impaired autophagy lead to inflammasome activation in Gaucher macrophages. Aging Cell 15, 77–88 (2016). [DOI] [PMC free article] [PubMed] [Google Scholar]
- 74.Schlütermann D. et al. FIP200 controls the TBK1 activation threshold at SQSTM1/p62-positive condensates. Sci. Rep. 11, 13863 (2021). [DOI] [PMC free article] [PubMed] [Google Scholar]
- 75.Matsumoto G., Shimogori T., Hattori N. & Nukina N. TBK1 controls autophagosomal engulfment of polyubiquitinated mitochondria through p62/SQSTM1 phosphorylation. Hum. Mol. Genet. 24, 4429–4442 (2015). [DOI] [PubMed] [Google Scholar]
- 76.Prabakaran T. et al. Attenuation of cGAS-STING signaling is mediated by a p62/SQSTM1-dependent autophagy pathway activated by TBK1. EMBO J. 37, (2018). [DOI] [PMC free article] [PubMed] [Google Scholar]
- 77.Zhong Z. et al. NF-κB Restricts Inflammasome Activation via Elimination of Damaged Mitochondria. Cell 164, 896–910 (2016). [DOI] [PMC free article] [PubMed] [Google Scholar]
- 78.Lobb I. T. et al. A Role for the Autophagic Receptor, SQSTM1/p62, in Trafficking NF-κB/RelA to Nucleolar Aggresomes. Mol. Cancer Res. 19, 274–287 (2021). [DOI] [PubMed] [Google Scholar]
- 79.Shi J. et al. Cleavage of sequestosome 1/p62 by an enteroviral protease results in disrupted selective autophagy and impaired NFKB signaling. Autophagy 9, 1591–1603 (2013). [DOI] [PubMed] [Google Scholar]
- 80.Schwob A. et al. SQSTM-1/p62 potentiates HTLV-1 Tax-mediated NF-κB activation through its ubiquitin binding function. Sci. Rep. 9, 16014 (2019). [DOI] [PMC free article] [PubMed] [Google Scholar]
- 81.Murakami K. et al. A RUNX-CBFβ-driven enhancer directs the Irf8 dose-dependent lineage choice between DCs and monocytes. Nat. Immunol. 22, 301–311 (2021). [DOI] [PubMed] [Google Scholar]
- 82.Kim S. M. et al. Targeting cancer metabolism by simultaneously disrupting parallel nutrient access pathways. J. Clin. Invest. 126, 4088–4102 (2016). [DOI] [PMC free article] [PubMed] [Google Scholar]
- 83.Hou J.-Z. et al. Inhibition of PIKfyve using YM201636 suppresses the growth of liver cancer via the induction of autophagy. Oncol. Rep. 41, 1971–1979 (2019). [DOI] [PubMed] [Google Scholar]
- 84.O’Connell C. E. & Vassilev A. Combined Inhibition of p38MAPK and PIKfyve Synergistically Disrupts Autophagy to Selectively Target Cancer Cells. Cancer Res. 81, 2903–2917 (2021). [DOI] [PMC free article] [PubMed] [Google Scholar]
- 85.Martins K. A. O., Bavari S. & Salazar A. M. Vaccine adjuvant uses of poly-IC and derivatives. Expert Rev. Vaccines 14, 447–459 (2015). [DOI] [PubMed] [Google Scholar]
- 86.Zhong L. et al. Small molecules in targeted cancer therapy: advances, challenges, and future perspectives. Signal Transduct Target Ther 6, 201 (2021). [DOI] [PMC free article] [PubMed] [Google Scholar]
- 87.Shen C.-I. et al. Comparison of the outcome between immunotherapy alone or in combination with chemotherapy in EGFR-mutant non-small cell lung cancer. Sci. Rep. 11, 16122 (2021). [DOI] [PMC free article] [PubMed] [Google Scholar]
- 88.O’Shea P. J. et al. Outcomes of immunotherapy (ICI) alone vs tyrosine kinase inhibitors (TKI) alone versus ICI and TKI combined in renal cell carcinoma brain metastasis. J. Clin. Orthod. 39, 2030–2030 (2021). [Google Scholar]
- 89.Sugiyama E. et al. Blockade of EGFR improves responsiveness to PD-1 blockade in EGFR-mutated non-small cell lung cancer. Sci Immunol 5, (2020). [DOI] [PubMed] [Google Scholar]
- 90.Zolov S. N. et al. In vivo, Pikfyve generates PI(3,5)P2, which serves as both a signaling lipid and the major precursor for PI5P. Proc. Natl. Acad. Sci. U. S. A. 109, 17472–17477 (2012). [DOI] [PMC free article] [PubMed] [Google Scholar]
- 91.Xiao Y. et al. The kinase TBK1 functions in dendritic cells to regulate T cell homeostasis, autoimmunity, and antitumor immunity. J. Exp. Med. 214, 1493–1507 (2017). [DOI] [PMC free article] [PubMed] [Google Scholar]
- 92.Fitzgerald K. A. et al. IKKepsilon and TBK1 are essential components of the IRF3 signaling pathway. Nat. Immunol. 4, 491–496 (2003). [DOI] [PubMed] [Google Scholar]
- 93.Xia Y., Shen S. & Verma I. M. NF-κB, an active player in human cancers. Cancer Immunol Res 2, 823–830 (2014). [DOI] [PMC free article] [PubMed] [Google Scholar]
- 94.Romero P. et al. The Human Vaccines Project: A roadmap for cancer vaccine development. Sci. Transl. Med. 8, 334ps9 (2016). [DOI] [PubMed] [Google Scholar]
- 95.Steinman R. M. & Pope M. Exploiting dendritic cells to improve vaccine efficacy. J. Clin. Invest. 109, 1519–1526 (2002). [DOI] [PMC free article] [PubMed] [Google Scholar]
- 96.Melief C. J. M. et al. Strong vaccine responses during chemotherapy are associated with prolonged cancer survival. Sci. Transl. Med. 12, (2020). [DOI] [PubMed] [Google Scholar]
- 97.Tanyi J. L. et al. Personalized cancer vaccine effectively mobilizes antitumor T cell immunity in ovarian cancer. Sci. Transl. Med. 10, (2018). [DOI] [PubMed] [Google Scholar]
- 98.Carreno B. M. et al. Cancer immunotherapy. A dendritic cell vaccine increases the breadth and diversity of melanoma neoantigen-specific T cells. Science 348, 803–808 (2015). [DOI] [PMC free article] [PubMed] [Google Scholar]
- 99.Rosenblatt J. et al. Individualized vaccination of AML patients in remission is associated with induction of antileukemia immunity and prolonged remissions. Sci. Transl. Med. 8, 368ra171 (2016). [DOI] [PMC free article] [PubMed] [Google Scholar]
- 100.Daud A. I. Negative but not futile: MAGE-A3 immunotherapeutic for melanoma. The lancet oncology vol. 19 852–853 (2018). [DOI] [PubMed] [Google Scholar]
- 101.Huang P.-T., Einav S. & Asquith C. R. M. PIKfyve: a lipid kinase target for COVID-19, cancer and neurodegenerative disorders. Nat. Rev. Drug Discov. 20, 730 (2021). [DOI] [PMC free article] [PubMed] [Google Scholar]
- 102.Wu Y.-M. et al. Inactivation of CDK12 Delineates a Distinct Immunogenic Class of Advanced Prostate Cancer. Cell 173, 1770–1782.e14 (2018). [DOI] [PMC free article] [PubMed] [Google Scholar]
- 103.Hodi F. S. et al. Immune-Modified Response Evaluation Criteria In Solid Tumors (imRECIST): Refining Guidelines to Assess the Clinical Benefit of Cancer Immunotherapy. J. Clin. Oncol. 36, 850–858 (2018). [DOI] [PubMed] [Google Scholar]
- 104.Parolia A. et al. Distinct structural classes of activating FOXA1 alterations in advanced prostate cancer. Nature 571, 413–418 (2019). [DOI] [PMC free article] [PubMed] [Google Scholar]
- 105.Cieslik M. et al. The use of exome capture RNA-seq for highly degraded RNA with application to clinical cancer sequencing. Genome Res. 25, 1372–1381 (2015). [DOI] [PMC free article] [PubMed] [Google Scholar]
- 106.Robinson M. D., McCarthy D. J. & Smyth G. K. edgeR: a Bioconductor package for differential expression analysis of digital gene expression data. Bioinformatics 26, 139–140 (2010). [DOI] [PMC free article] [PubMed] [Google Scholar]
- 107.Mead B. E. et al. Screening for modulators of the cellular composition of gut epithelia via organoid models of intestinal stem cell differentiation. Nat Biomed Eng 6, 476–494 (2022). [DOI] [PMC free article] [PubMed] [Google Scholar]
- 108.Tanikawa T. et al. Interleukin-10 ablation promotes tumor development, growth, and metastasis. Cancer Res. 72, 420–429 (2012). [DOI] [PMC free article] [PubMed] [Google Scholar]
- 109.Lin H. et al. Host expression of PD-L1 determines efficacy of PD-L1 pathway blockade-mediated tumor regression. J. Clin. Invest. 128, 805–815 (2018). [DOI] [PMC free article] [PubMed] [Google Scholar]
- 110.Ritchie M. E. et al. limma powers differential expression analyses for RNA-sequencing and microarray studies. Nucleic Acids Res. 43, e47 (2015). [DOI] [PMC free article] [PubMed] [Google Scholar]
- 111.Korotkevich G. et al. Fast gene set enrichment analysis. bioRxiv 060012 (2021) doi: 10.1101/060012. [DOI] [Google Scholar]
- 112.Hao Y. et al. Integrated analysis of multimodal single-cell data. Cell 184, 3573–3587.e29 (2021). [DOI] [PMC free article] [PubMed] [Google Scholar]
Associated Data
This section collects any data citations, data availability statements, or supplementary materials included in this article.
Supplementary Materials
Extended Data Fig. 1
Supp 1a. Comparison of PIKfyve scores in patients with melanoma who were ICB treatment-naïve (“NAÏVE”) versus those who had previously progressed on ICB treatment (“PROG”). Data plotted are mean ± s.d. from bulk RNA-seq data.44 P value is determined by Mann Whitney U test.
Supp 1b. Forest plot of hazard ratios of NAÏVE cohort by high vs. low PIKfyve score, high vs. low neoantigen load, disease stage (reference is M0), and mutation subtype (reference is None). Data plotted are hazard ratios with 95% confidence intervals from bulk RNA-seq data.44 P values are determined by a multivariate cox proportional hazards model.
Supp 1c. Forest plot of hazard ratios of PROG cohort by high vs. low PIKfyve score, high vs. low neoantigen load, disease stage (reference is M1A), and mutation subtype (reference is None). Data plotted are hazard ratios with 95% confidence intervals from bulk RNA-seq data.44 P values are determined by a multivariate cox proportional hazards model.
Supp 1d-g. t-SNE plots of immune cells in pre-treatment tumors from patients with (d) breast, (e) colorectal, (f) lung or (g) ovarian cancer from scRNA-seq data.48
Supp 1h. Barplots of PIKFYVE cluster average expression by cancer, stroma, or immune cell type from scRNA-seq data.48
Supp 1i. t-SNE plot of immune cells in pre-treatment tumors from patients with endometrial cancer from scRNA-seq data.50
Supp 1j. Comparison of log (PIKFYVE) expression in cDCs in patients with endometrial cancer who were nonresponders (“NR” including SD and PD) versus CR to ICB treatment. Data plotted are mean ± s.d. from scRNA-seq data.50 P value is determined by student t-test with Welch’s correction.
Extended Data Fig. 2
Supp 2a. Gating strategy for Supp 2 panels b-g for CD8+ T cells.
Supp 2b-g. Comparison of the percentage of (b) CD69+ effector, (c) naïve, (d) terminally differentiated, (e) resident memory, (f) central memory, and (g) exhausted CD8+ T cells from spleens of non-tumor-bearing mice treated with vehicle or apilimod (30 mg/kg daily) on day 5 of treatment (n = 5 spleens per group). Data plotted are mean ± s.d. P values generated from student t-test.
Supp 2h. Gating strategy for Figure 2 panels a-b and Supp 2 panels i-l for myeloid cells and cDCs.
Supp 2i-l. Comparison of the percentage of total (i) CD11c, (j) F4/80, and (k) CD11b in CD45+ cells and (l) percentage of cDC2 cells from spleens of non-tumor-bearing mice treated with vehicle or apilimod (30 mg/kg daily) on day 5 of treatment (n = 5 per group). Data plotted are mean ± s.d. P values generated from student t-test.
Extended Data Fig. 3
Supp 3a. Gating strategy for Figure 2 panels c-r and Supp panels b-h (CD11c+ gate).
Supp 3b. Immunoblots of PIKfyve in Pikfyve WT vs. KO cDC lysates on culture day 9. Total histone H3 serves as loading control. Image is representative of two experiments.
Supp 3c. Representative density plot of median fluorescent intensity of surface XCR1 in DMSO or apilimod-treated cDCs after 20 hours on culture day 6.
Supp 3d. Comparison of the percentage of CD80+CD86+- cDCs in Pikfyve WT vs KO models. Data plotted are mean ± s.d. P values generated from student t-test across 3 replicates.
Supp 3e, f. Relative median fluorescent intensity of surface H-2kb-SIINFEKL (e) and percent H-2kb-SIINFEKL+ cells (f) in Pikfyve WT vs. KO cDC +/− pOVA (100 ng/ml) after 12 hours on culture day 9. Data plotted are mean ± s.d. P value determined by student t-test across 3 replicates. Representative plots shown.
Supp 3g, h. Relative median fluorescent intensity of surface H-2kb-SIINFEKL (g) and percent H2kb-SIINFEKL+ cells (h) in DMSO or apilimod-treated cDCs +/− pOVA (100 ng/ml) after 12 hours. Data plotted are mean ± s.d. P value determined by student t-test across 3 replicates. Representative plots shown.
Extended Data Fig. 4
Supp 4a. Gating strategy for Supp 4b-e (CD90+ CD8+ gate for OT-I cells).
Supp 4b, c. Representative dot plot and percentage of (b) IFNγ+ and (c) granzyme B+ OT-I cells after 48 hours of co-culture with Pikfyve WT vs. KO cDCs +/− pOVA 100ng/ml. n = 3 biological replicates. Data plotted are mean ± s.d. P value determined by student t-test.
Supp 4d, e. Representative dot plot and percentage of (d) IFNγ+ and (e) granzyme B+ OT-I cells after 48 hours of co-culture with DMSO or apilimod pre-treated cDCs +/− pOVA 100 ng/ml. n = 3 biological replicates. Data plotted are mean ± s.d. P value determined by student t-test.
Supp 4f, g. Percentage of Ki67+ OT-I (f) or OT-II (g) cells after 72 hours of co-culture with (Pikfyve WT vs. KO pre-treated cDCs +/− sOVA (10 μg/ml). n = 3 biological replicates. Data plotted are mean ± s.d. P value determined by student t-test.
Supp 4h, i. Percent of Ki67+ OT-I (h) or OT-II (i) cells after 72 hours of co-culture with DMSO or apilimod pre-treated cDCs +/− sOVA (10 μg/ml). n = 3 biological replicates. Data plotted are mean ± s.d. P value determined by student t-test.
Extended Data Fig. 5
Supp 5a. Enrichment plot of Dendritic Cell Maturation Up gene signature (M4562: LENAOUR_DENDRITIC_CELL_MATURATION_UP) in Pikfyve KO vs. WT cDCs on culture day 9.
Supp 5b. Enrichment plot of MSigDB Hallmark “TNF_SIGNALING_VIA_NFκB” in Pikfyve KO vs. WT cDCs on culture day 9.
Supp 5c, d. Enrichment plots of MSigDB Hallmark “TNF_SIGNALING_VIA_NFκB” in apilimod vs. DMSO-treated cDCs treated for (c) 3 hours or (d) 8 hours on culture day 6.
Supp 5e. Comparison of Il12b expression fold change by RT-qPCR in apilimod vs. DMSO-treated cDCs treated for 3 or 12 hours on culture day 6. Data plotted are mean ± s.d. P value determined by ANOVA after post-hoc Tukey adjustment for multiple comparisons across 3 replicates.
Supp 5f. Comparison of IL-12p40 protein levels by ELISA in media from apilimod vs. DMSO-treated cDCs treated for 12 hours on culture day 6. Data plotted are mean ± s.d. P values generated from student t-test across 3 replicates.
Supp 5g. Comparison of IL-12p70 protein levels by ELISA in media from apilimod vs. DMSO-treated cDCs treated for 24 hours on culture day 6. Data plotted are mean ± s.d. P values generated from student t-test across 3 replicates.
Extended Data Fig. 6
Supp 6a. Kaplan-Meier curve of overall survival of patients in the TCGA Pan-Cancer bulk RNA-seq dataset, by high or low (median) SQSTM1 normalized gene expression. P value is determined by log-rank test.
Supp 6b. Comparison of Sqstm1 normalized gene expression across myeloid lineage cell types. Data plotted are mean ± s.d. from bulk RNA-seq data.81 P value determined by ANOVA after post-hoc Tukey adjustment for multiple comparisons across all pair-wise comparisons. P value for cDC1 versus cDC2 shown on plot.
Supp 6c. Correlation between SQSTM1 normalized gene expression and NF-κB target genes expression in the TCGA Pan-Cancer bulk RNA-seq dataset. Correlation coefficient and P value calculated using Pearson’s product-moment correlation.
Extended Data Fig. 7
Supp 7a-c. Tumor weights for (a) MC38 tumor measured on Day 26, (b) MCA-205 tumor measured on Day 16, and (c) B16F10 tumor measured on Day 16. Data plotted are mean ± s.d. P values determined by Mann-Whitney U test.
Supp 7d-f. Subcutaneous tumor volume from (d) Experiment 1 and (e) Experiment 2 of B16F10-OVA tumors (mm3) in Pikfyve KO mice or WT mice. Data plotted are mean ± s.e.m. P value determined by Mann-Whitney U test on Day 15. (f) Image of B16F10-OVA tumors on Day 16. Bilateral subcutaneous tumors were excised from 3 WT/KO littermate pairs per experiment in two independent experiments.
Supp 7g. Gating strategy for Fig. 4d, Supp. 7h-i (CD45+ Lin(−) CD11c+ MHC-II+ gate for dendritic cells from tumor-draining lymph nodes).
Supp 7h. Percent dendritic cells of CD45+ cells in Pikfyve WT (n = 6) vs. KO (n = 6) tumor-draining lymph nodes of B16F10-OVA tumors. Data plotted are mean ± s.d. P value determined by Mann-Whitney U test.
Supp 7i. Percent H2-kb-SIINFEKL+ dendritic cells in WT (n = 6) vs. KO (n = 6) tumor-draining lymph nodes of B16F10-OVA tumors. Data plotted are mean ± s.d. P value determined by Mann-Whitney U test.
Supp 7j. Gating strategy for Fig. 4e-f (7-AAD-CD90+ CD3+ CD8+ gate for intratumoral CD8+ T cells).
Extended Data Fig. 8
Supp 8a, b. B16F10 tumor model. (a) % cDC2 of all DC cells and (b) SIRP1α median fluorescent intensity by all DC, cDC1, or cDC2 subset in Pikfyve KO mice or WT mice treated with vehicle or apilimod (30 mg/kg daily). Bilateral subcutaneous tumors from each mouse (n = 4 per group) were combined for analysis. Data plotted are mean ± s.d. P value determined by ANOVA after post-hoc Tukey adjustment for multiple comparisons on day 6 of treatment.
Extended Data Fig. 9
Supp 9a. Percent IFNγ+ of CD8+ T cells in vehicle or apilimod-treated (30 mg/kg x 5 days/week) MC38 tumors. Bilateral subcutaneous tumors from each vehicle or apilimod-treated (n = 5 per group) mouse were combined for analysis. Data plotted are mean ± s.d. P value determined by Mann-Whitney U test.
Supp 9b. Subcutaneous tumor volume of MC38 tumors (mm3) treated with vehicle versus apilimod (30 mg/kg x 5 days/week) (n = 6 tumors per group) in NSG™ mice. Data plotted are mean ± s.e.m. P value determined by Mann-Whitney U test on day 15 of treatment.
Supp 9c. Subcutaneous tumor volume of MC38 tumors (mm3) in mice treated with vehicle versus apilimod (30 mg/kg x 5 days/week) (n = 6 tumors per group) treated with IgG2a or αIL-12p40 blocking antibody. Data plotted are mean ± s.e.m. P value determined by ANOVA after post-hoc Tukey adjustment for multiple comparisons on day 15 treatment.
Supp 9d. Subcutaneous tumor volume of MC38 tumors (mm3) in mice treated with vehicle versus apilimod (30 mg/kg x 5 days/week) (n = 6 tumors per group) treated with IgG1 or αIFNγ blocking antibody. Data plotted are mean ± s.e.m. P value determined by ANOVA after post-hoc Tukey adjustment for multiple comparisons on day 15 of treatment.
Supp 9e. Subcutaneous tumor volume of B16F10 tumors (mm3) in mice treated with vehicle or apilimod (30 mg/kg daily) (n = 10 tumors per group). Data plotted are mean ± s.e.m. P value determined by Mann-Whitney U test on day 9 of treatment.
Supp 9f. Subcutaneous tumor volume of B16F10 tumors (mm3) in mice treated with vehicle versus apilimod (30 mg/kg daily) (n = 10 tumors per group) in NSG™ mice. Data plotted are mean ± s.e.m. P value determined by Mann Whitney U test on day 11 of treatment.
Supp 9g, h. Relative median fluorescent intensity of (g) surface MHC-I (H2-kb, H2-kd) and (h) surface MHC-II (MHC-IA-IE) on DMSO or apilimod-treated cDCs +/− PolyI:C (50 μg/ml) or LPS (50 ng/ml) treated for 20 hours on culture day 6. Images are representative of two experiments.
Supp 9i. Subcutaneous tumor volume of B16F10-OVA tumors (mm3) following 21 days of pre-treatment with vehicle versus apilimod (30 mg/kg x 5 days/week) +/− subcutaneous injection of water versus PolyI:C (100μg on Day 1 and Day 14) (n = 8 tumors per group). Data plotted are mean ± s.e.m. P value determined by Mann-Whitney U test on Day 14 after tumor inoculation.
Supp 9j. Subcutaneous tumor volume of B16F10-OVA tumors (mm3) in mice treated with vehicle or apilimod (30 mg/kg x 5 days/week) +/− subcutaneous injection of water versus PolyI:C (100μg once weekly) (n = 6 tumors per group). Data plotted are mean ± s.e.m. P value determined by Mann-Whitney U test on Day 11 of treatment.
Data Availability Statement
Raw data are included in the Source Data or Supplementary Information. All materials are available from the corresponding authors upon reasonable request. Clinical sequencing data are publicly available.40,43 RNA-seq data newly generated in this study for in vitro analysis have been deposited in the Gene Expression Omnibus repository at NCBI (accession codes GSE235596 and GSE235599).