Abstract
Isotope tracing has helped to determine the metabolic activities of organs. Methods to probe metabolic heterogeneity within organs are less developed. We couple stable-isotope-labeled nutrient infusion to matrix-assisted laser desorption ionization imaging mass spectrometry (iso-imaging) to quantitate metabolic activity in mammalian tissues in a spatially resolved manner. In the kidney, we visualize gluconeogenic flux and glycolytic flux in the cortex and medulla, respectively. Tricarboxylic acid cycle substrate usage differs across kidney regions; glutamine and citrate are used preferentially in the cortex and fatty acids are used in the medulla. In the brain, we observe spatial gradations in carbon inputs to the tricarboxylic acid cycle and glutamate under a ketogenic diet. In a carbohydrate-rich diet, glucose predominates throughout but in a ketogenic diet, 3-hydroxybutyrate contributes most strongly in the hippocampus and least in the midbrain. Brain nitrogen sources also vary spatially; branched-chain amino acids contribute most in the midbrain, whereas ammonia contributes in the thalamus. Thus, iso-imaging can reveal the spatial organization of metabolic activity.
Metabolism is regulated by various cell-and tissue-dependent factors, including enzyme expression and nutrient accessibility. Within the complex architecture of tissues, differentiated cells exhibit diverse metabolic specialization; thus, metabolic heterogeneity is an important aspect of mammalian physiology. Mass spectrometry (MS) coupled with pre-separation techniques, such as liquid or gas chromatography1,2, is frequently used for metabolomics studies. Chromatography-based MS methods can separate diverse analytes on the basis of their physical properties and masses, thereby providing high specificity and broad metabolome coverage, but fail to preserve the spatial distribution of metabolites.
Because spatially resolved analyses are valuable for understanding complex biological systems and physiological processes, particularly in heterogeneous tissues, imaging tools have been developed to visualize the localization of metabolites for both diagnostic and research purposes. These include positron emission tomography, dynamic nuclear polarization coupled to magnetic resonance spectroscopic imaging3, fluorescent metabolic sensors4 and Raman spectroscopy5. These methods, however, are limited in their ability to measure numerous metabolites simultaneously. In addition, these methods are not well-suited for tracing the downstream fates of nutrients. For example, fluorodeoxyglucose positron emission tomography imaging relies on radioactive glucose tracers, where the tracer remains trapped at the start of glycolysis.
MS imaging (MSI) using matrix-assisted laser desorption ionization (MALDI) enables the simultaneous mapping of hundreds of molecules while providing spatial information at a near-single-cell level (~10–50 μm)6,7. Recent progress in matrix chemistry and instrumentation is expanding its utility8,9. This technique has recently been applied to various disease states, including cancer, to discover diagnostic, prognostic and survival markers. In addition, it is increasingly widely used to probe drug distribution within tissues and tumors.
Metabolites are produced and consumed by an extensive network of biochemical reactions involving hundreds of enzymes. In addition to measuring metabolite concentrations, there is great value in measuring pathway activities with stable-isotope tracers to understand these metabolic networks10,11. In vivo isotope tracing of an exogenously administered 13C-glucose bolus in the ischemic heart revealed active oxidative metabolism in areas adjacent to the infarct, providing a glimpse into the potential utility of spatially resolving 13C-labeling patterns with MSI12,13. As cell types within tissues have different rates of nutrient uptake, infusing stable-isotope tracers to an isotopic pseudo-steady-state enables a more direct comparison of metabolic activity between spatially distinct regions. Here, we couple stable-isotope infusions to MSI and visualize and quantitatively assess region-specific metabolism (Fig. 1a). This strategy, which we call isotope tracing-MSI (iso-imaging), integrates the infusion of stable-isotope-labeled nutrients (such as 13C or 15N), MS imaging and quantitative analysis of observed labeling patterns. Analysis of labeled metabolites with iso-imaging at the isotopic pseudo-steady-state facilitates quantitation of different nutrients’ fractional contributions to downstream metabolites across tissue regions. Using iso-imaging to investigate the murine kidney’s regional metabolism, we directly visualize expected regional differences in glycolysis and gluconeogenesis and identify spatial variation in tricarboxylic acid (TCA) cycle substrate usage. In the brain, we show that while there is nearly uniform use of glucose to fuel the TCA cycle under a standard carbohydrate-rich diet, regional variation in the use of glucose versus 3-hydroxybutyrate emerges with a ketogenic diet. Moreover, brain nitrogen sources vary across regions.
Fig. 1 |. Iso-imaging workflow and spatial distribution of glycolytic and gluconeogenic activity in the kidney.
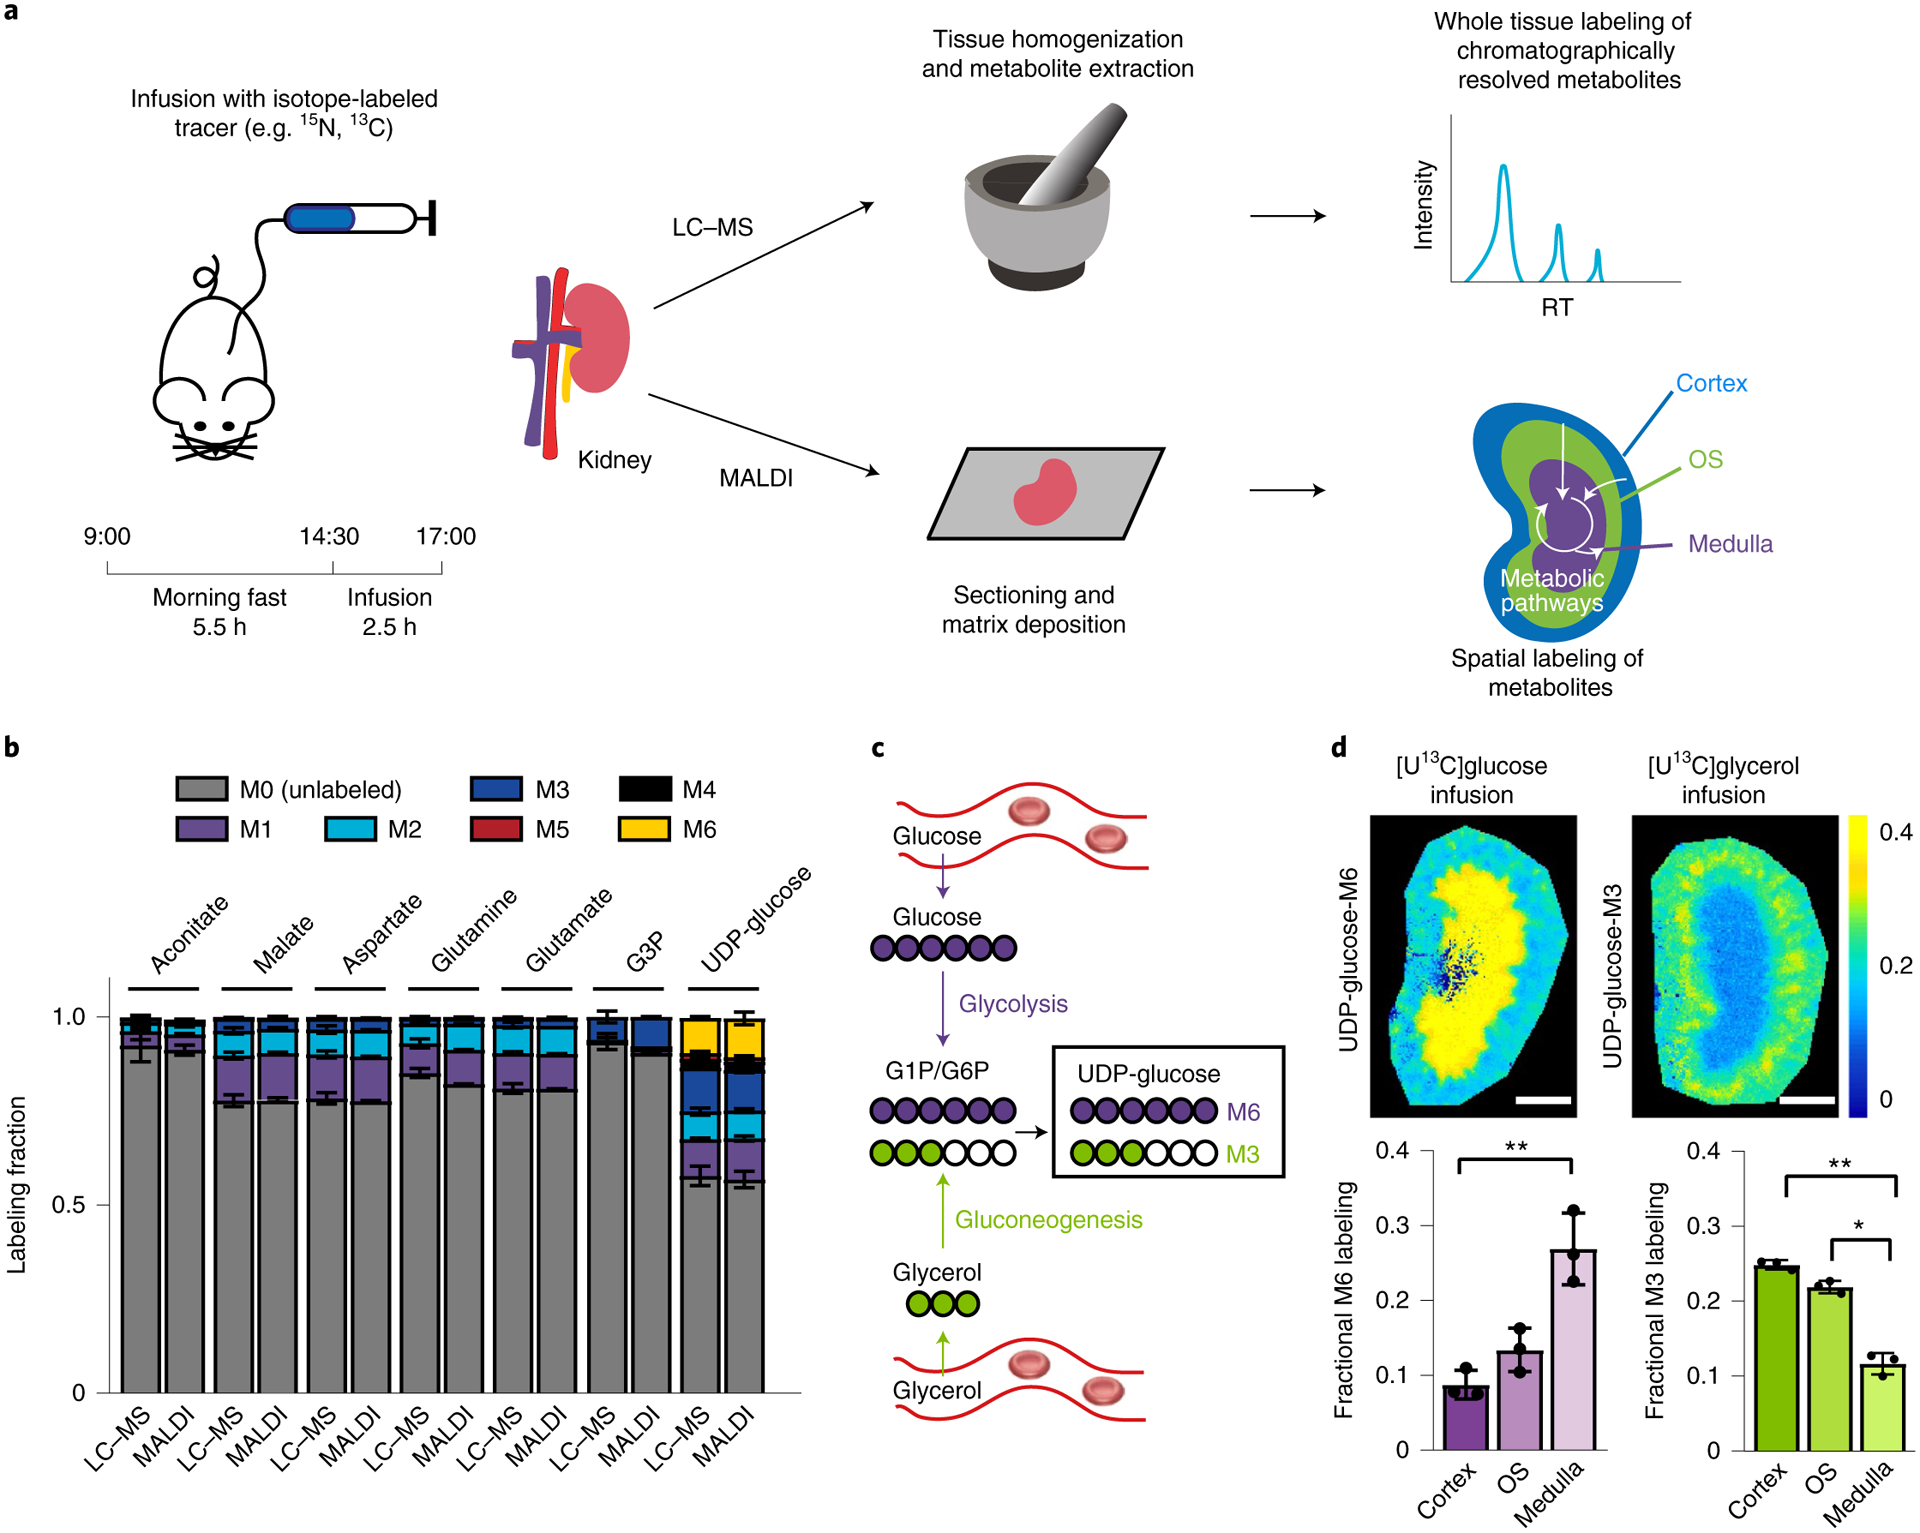
a, Illustration of the infusion of stable-isotope-labeled nutrients coupled to LC–MS (top) or iso-imaging (bottom). OS, outer stripe; RT, retention time. b, Quantitation ions for iso-imaging were selected based on their showing matching isotope labeling by MALDI imaging and LC–MS. c, Schematic of metabolic pathways to UDP-glucose from infused [U-13C]glucose or [U-13C]glycerol. d, UDP-glucose labeling in murine kidney from [U-13C]glucose infusion (M6 isotopolog of UDP-glucose) and [U-13C]glycerol (M3 isotopolog of UDP-glucose) infusion. Colors reflect the labeled fraction of the indicated isotope form of UDP-glucose (spatially resolved in the kidney), normalized to the enrichment of the same isotopic form of the infused tracer in serum. Scale bars, 1 mm. Bar graphs are mean ± s.d. n = 3. *P < 0.05; **P < 0.001, by unpaired two-sided Student’s t-test with Welch’s correction for unequal variances. exact P values are provided in the Source Data.
Results
Workflow and evaluation of iso-imaging.
The iso-imaging pipeline begins with the introduction of stable-isotope-labeled substrates. This was carried out by the infusion of 13C-or 15N-labeled nutrients into the right jugular vein of a fasted C57BL/6N mouse (Fig. 1a). A key variable in such studies is labeled nutrient infusion rate. We selected an intermediate rate that resulted in ~20–40% tracer labeling, which was sufficient to facilitate downstream analysis with modest perturbation of endogenous metabolite levels and circulatory flux (Extended Data Fig. 1a,b and Supplementary Table 1). Mice were killed and tissues were rapidly collected (<2 min) and frozen using powdered dry ice. Tissues were then cryosectioned, the matrix was deposited and MALDI MSI was carried out on a 9.4 Tesla magnetic resonance cyclotron mass spectrometer at an average of 120,000 mass resolving power. Initial experiments employed three matrices: 9-aminoacridine (9-AA), 1,5-diaminonaphthalene (DAN) and N-(1-naphthyl) ethylenediamine dihydrochloride (NEDC). NEDC was selected for subsequent experiments due to its low signal interference and broad metabolome coverage14 (Extended Data Fig. 1c and Extended Data Fig. 1d). Adjacent tissue sections were used for histology (hematoxylin and eosin (H&E)) or immunohistochemistry (IHC) analysis to obtain anatomical information or liquid chromatography (LC)–MS analysis to validate MSI signal assignments.
By grinding a tissue slice and analyzing it with LC–MS in negative ionization mode, more than 200 canonical metabolites were identified based on m/z value and retention time (Extended Data Fig. 1e). As MSI lacks chromatographic separation, a key priority was to determine which of these metabolites could be measured and robustly identified without interference from other ions. A standard approach for ion identification is MS/MS and we validated 19 metabolite ions in this manner (Extended Data Fig. 2a–c and Supplementary Table 2). As a complementary method, we compared isotopic labeling patterns achieved by MSI and by LC–MS following infusion of [U-13C] tracers. Taking [U-13C]glucose infusion as an example, we determined consistent metabolite isotope labeling patterns for seven abundant central metabolites spanning glycolysis, gluconeogenesis, TCA cycle and amino acid metabolism (Fig. 1b). These metabolites (aconitate, malate, aspartate, glutamine, glutamate, glycerol-3-phosphate (G3P) and UDP-glucose) were subsequently used for labeling quantitation. Use of additional tracers can expand this set. For example, [U-13C]methionine infusion validated the identity of its downstream product cystathionine (Extended Data Fig. 2d). While many other ions matching the m/z of known metabolites were detected by MSI, their utility for labeling quantitation was limited either by insufficient sensitivity to detect low fractional labeling (as occurs in vivo for minimally perturbative tracer infusions) or by the presence of interfering ions. For example, the C6H12O6 signal reflects a mixture of glucose and inositol, which can be resolved chromatographically but not by mass, precluding facile measurement of either metabolite’s isotope labeling pattern by MSI (Extended Data Fig. 2e,f).
Current software for MSI was developed for visualizing the spatial distribution of ion intensities but not labeling patterns. We developed an open-source code called IsoScope for this purpose. IsoScope speeds data handling for standard MSI functions, including generating ion images (Extended Data Fig. 3a and Methods). More distinctively, it enables the spatial display of the fraction of different isotopic forms of a metabolite (relative to all detected forms), the average extent of labeling (such as the average number of labeled carbon atoms in the molecule) and labeling normalized to the infused circulating tracer’s labeling measured based on LC–MS analysis of serum (Extended Data Fig. 3a,b and Methods). These display features are valuable for visually assessing the fate of a labeled substrate (or source of a tissue metabolite) across a spatially heterogeneous organ.
Glycolytic and gluconeogenic activity in the mouse kidney.
Among major organs, the kidney has one of the highest resting metabolic rates to support continuous waste filtration, nutrient reabsorption and electrolyte balancing15. Both blood flow and tissue oxygen level are higher in the outer portion of the kidney (cortex) where filtration and most nutrient reabsorption occur and lower in the inner portion (medulla) where urine is concentrated. The medulla’s exterior portion is known as the outer stripe and is rich in blood vessels compared to the inner medulla.
To assess spatial patterns of glycolysis and gluconeogenesis in the kidney, we infused mice with [U-13C]glucose and [U-13C]glycerol. We relied on UDP-glucose as an abundant, specific metabolite ion that provides a readout of upper glycolytic labeling and report fractional labeling of UDP-glucose. When [U-13C]glucose enters glycolysis, it produces 13C6-UDP-glucose (M6) (Fig. 1c) and such labeling delimited the renal medulla (Fig. 1d). In contrast, when [U13C] glycerol is used for gluconeogenesis, it produces 13C3-UDP-glucose (M3) and such labeling was observed prominently in the renal cortex (Fig. 1d). These data vividly highlight the propensity of the renal medulla for glycolysis and of the renal cortex for gluconeogenesis16.
Circulating metabolite inputs to the kidney TCA cycle.
Lactate and glutamine together contribute about half of TCA cycle carbon in the mouse kidney in the fasted state1. Based on spatial differences in glycolysis and gluconeogenesis observed in the medulla and cortex, we hypothesized that there would be regional variations in the contribution of circulating nutrients to TCA cycle substrates (Fig. 2a). We infused mice with 13C-labeled nutrient tracers corresponding to notable energy substrates and used isotope labeling of the TCA cycle intermediate malate (normalized to average carbon labeling of the infused tracer, as measured by LC–MS analysis of serum) as a readout for the contributions of each circulating carbon source to the TCA cycle. This approach does not capture use of internal carbon sources such as glycogen or lipid droplets17. Unlabeled malate signal intensity, reflecting its concentration, was high in the cortex, intermediate in the central medulla and lowest in the medulla’s outer stripe and provided a convenient way to define kidney anatomical regions on MS images (Fig. 2b). Isotope tracing studies with glucose, acetate and 3-hydroxybutyrate yielded similar normalized malate labeling in the cortex and medulla (Fig. 2c). Lactate, glycerol, glutamine and citrate labeled the cortex significantly more than the medulla (Fig. 2d). In contrast, the abundant circulating free fatty acid oleate labeled the medulla more than the cortex (Fig. 2e). Thus, free fatty acids are major contributors to TCA cycle carbon in the renal medulla. In contrast, glutamine and citrate are used more in the renal cortex.
Fig. 2 |. Regional nutrient preference to fuel the TCA cycle in murine kidney.
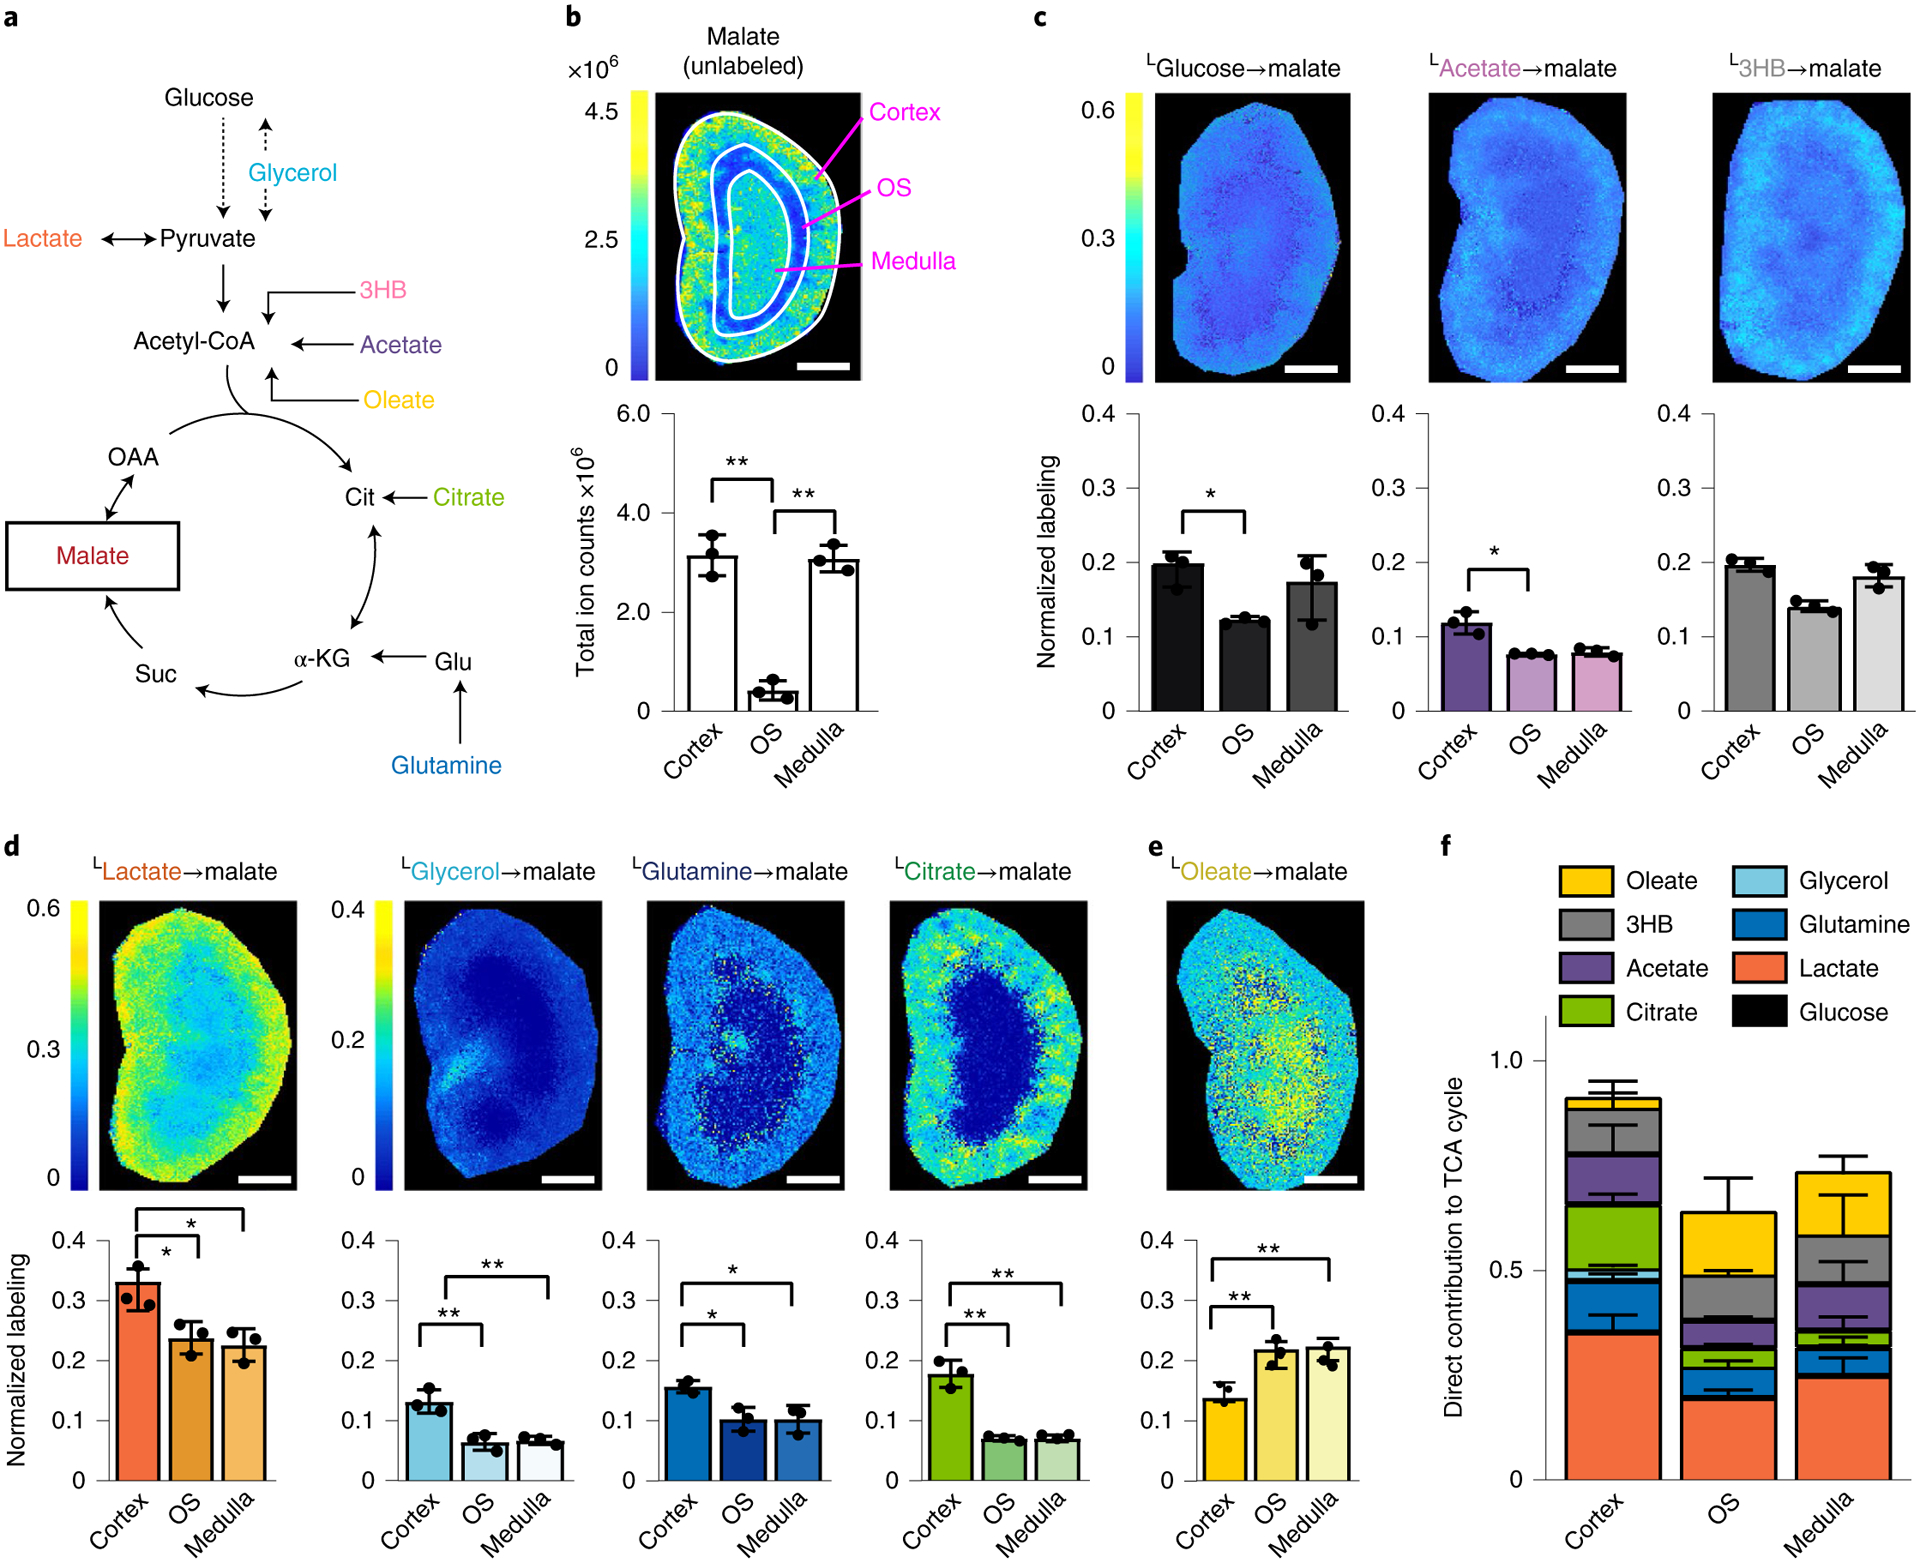
a, Schematic of pathways from infused nutrients to the TCA cycle intermediate malate. 3HB, 3-hydroxybutyrate; α-KG, α-ketoglutarate; OAA, oxaloacetate; suc, succinate; cit, citrate; glu, glutamate. b, MSI of unlabeled malate signal intensity (reflective of malate concentration). c, Normalized malate labeling in murine kidney from the indicated U-13C tracers. Colors reflect the average carbon atom labeling of malate spatially resolved in the kidney(, where n = 4, as malate has four carbons and Mi is the ratio of malate’s M + i form) normalized to the average carbon atom labeling of the infused tracer in serum. d, Analogous to c, for tracers showing significantly higher labeling in cortex than medulla. e, Analogous to c, for the tracer showing significantly higher labeling in medulla than cortex. f, Direct carbon contributions to malate in cortex, OS and medulla of the murine kidney. Calculated from data in c–e. Scale bars, 1 mm. n = 3 for all experiments. Data are mean ± s.d. *P < 0.05; **P < 0.001, by unpaired two-sided Student’s t-test with Welch’s correction for unequal variances. exact P values are provided in the Source Data.
Infused isotope tracers can contribute to tissue metabolites either directly (through metabolism locally within tissues or cells) or indirectly (after being converted elsewhere in the body into a different circulating metabolite). To evaluate the direct contributions of circulating nutrients to renal regions, we employed linear modeling18. Based on the extent that each tracer labels different circulating and tissue metabolites, direct nutrient contributions to TCA cycle carbon in the cortex, outer stripe and medulla were determined. In each kidney region, glucose contributes to TCA cycle intermediates primarily via circulating lactate (Fig. 2f). Similarly, glycerol’s labeling is mainly indirect. Quantitatively, lactate and citrate are the two largest direct contributors in the cortex, whereas lactate and free fatty acids are the largest direct contributors to the medulla’s TCA cycle. Similar results were obtained using either glutamate or aspartate, abundant amino acids that are in rapid exchange with TCA cycle metabolites, instead of malate as the TCA cycle carbon readout (other TCA cycle intermediates did not ionize with sufficient intensity for equally effective isotope labeling measurements; Extended Data Fig. 4a). Analysis of integrated MSI signal across the entire kidney without the consideration of tissue boundaries yielded comparable results to previous LC–MS analyses1 (Extended Data Fig. 4b). In summary, we show that iso-imaging can be used to probe metabolic activity in distinct tissue regions quantitatively.
Renal enzyme and transporter expression.
Metabolic activity differences within organs presumably reflect expression or activity patterns of relevant transporters and enzymes. Many transporters and enzymes are spatially segregated within the kidney. For example, the glycolytic enzymes hexokinase and pyruvate kinase are found preferentially in the collecting duct and cortical ascending limb of the loop of Henle19.
We were curious to see whether the preference for using citrate and glutamine for the TCA cycle in the renal cortex aligns with relevant transporter or enzyme levels and whether we could gain insights into flux control by looking at the spatial labeling patterns not only of downstream TCA cycle metabolites, but also of intermediary metabolites, including the tracers themselves. [U-13C]citrate infusion resulted in renal citrate labeling that was most intense in the outer stripe and weakest in the central medulla (Fig. 3a). The downstream metabolites glutamate (which is in exchange with the TCA cycle intermediate α-ketoglutarate) and malate were also least labeled in the medulla. The low labeling of both citrate and its downstream products in the medulla aligns with weak expression of the citrate transporters SLC13A2 and SLC13A3 in the medulla; low transporter expression results in little labeling of citrate or its downstream products (Fig. 3b and Extended Data Fig. 4c,d).
Fig. 3 |. Kidney isotope labeling patterns and transporter and enzyme expression.
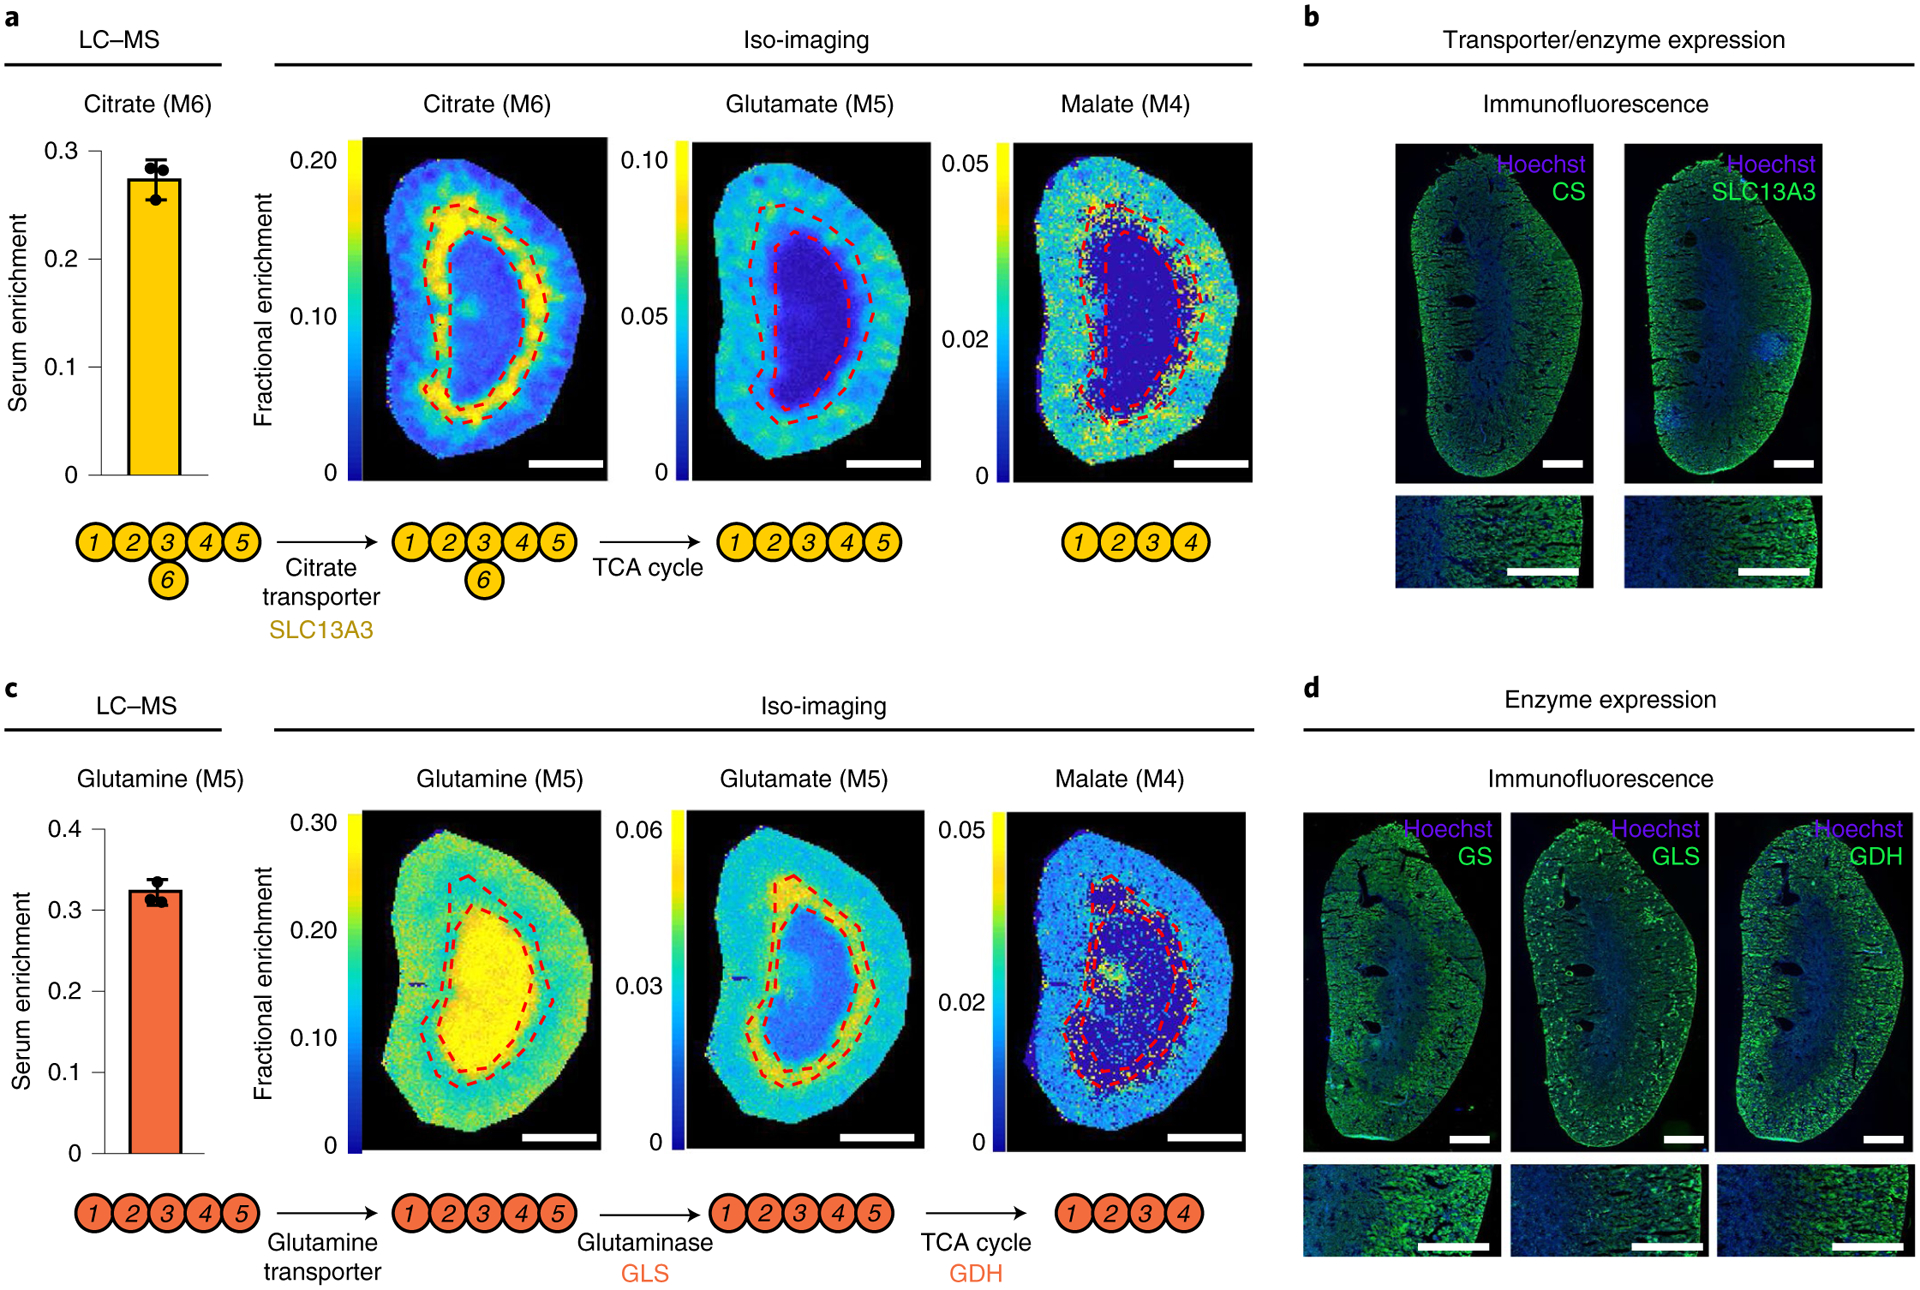
a, Absolute labeling of the indicated metabolites from [U-13C]citrate tracer. Colors reflect fractional abundance of the indicated isotopic forms (without normalization to serum tracer labeling, which is shown as a bar graph). b, Immunofluorescence analysis of citrate synthase (CS) and the citrate transporter SLC13A3. c, Absolute labeling of the indicated metabolites from [U-13C] glutamine tracer. Colors reflect the fractional abundance of the indicated isotopic forms (without normalization to serum tracer labeling, which is shown as a bar graph). d, Immunofluorescence analysis of the enzymes glutamate synthase (GS), glutaminase (GLS) and glutamate dehydrogenase (GDH). Scale bars, 1 mm. Data are mean ± s.d. Images are reflective of results obtained from n = 3 independent replicates.
Citrate labeling was strongest in the outer stripe, whereas glutamate and malate labeling from the infused labeled citrate was strongest in the cortex (Fig. 3a). The stronger labeling of citrate in the outer stripe than cortex can be rationalized by lower outer stripe expression of citrate synthase, whose activity produces unlabeled citrate, thereby diluting the labeling from the infused 13C-citrate (Fig. 3b and Extended Data Fig. 4c,d). The greater labeling of glutamate and malate in the cortex is less obviously explained and may reflect compartmentation.
Similar analyses following [U-13C]glutamine infusion revealed distinctive regional labeling of glutamine, glutamate and malate. Glutamine itself was most intensely labeled in the central medulla, glutamate in the outer stripe and malate in the cortex (Fig. 3c). The strong labeling of glutamine but not its downstream products in the medulla is well explained by low medulla protein expression of both glutamine synthetase and glutaminase. As there is little glutamine synthetase, the infused labeled glutamine labeling is barely diluted. As there is little glutaminase, downstream labeling is low (Fig. 3d and Extended Data Fig. 4c,d).
The high glutamate labeling in the outer stripe versus cortex aligns with incomplete mixing in the outer stripe between glutamate and TCA cycle intermediates (perhaps due to limited outer stripe glutamate dehydrogenase expression), whereas the high cortical malate labeling from glutamine aligns with glutaminase and glutamate dehydrogenase enzyme levels being highest in the cortex. Thus, integrative analysis of isotope labeling and protein expression patterns hold potential for understanding of regional metabolic activity and its molecular control mechanisms.
Diet-induced carbon source preferences in the mouse brain.
We next turned our attention to another major organ with well-defined anatomical regions, the brain. Iso-imaging data were overlaid with H&E-stained sections (Fig. 4a) based on characteristic metabolite abundances in different brain regions (Extended Data Fig. 5a). Ions corresponding to the formula C6H12O6 (which in the brain is primarily inositol; Extended Data Fig. 5b) and C22H32O2 (docosahexaenoic acid (DHA)) showed particularly notable spatial patterns that were used for image alignment (Extended Data Fig. 5c,d).
Fig. 4 |. Diet-dependent carbon sources for glutamate synthesis in murine brain.
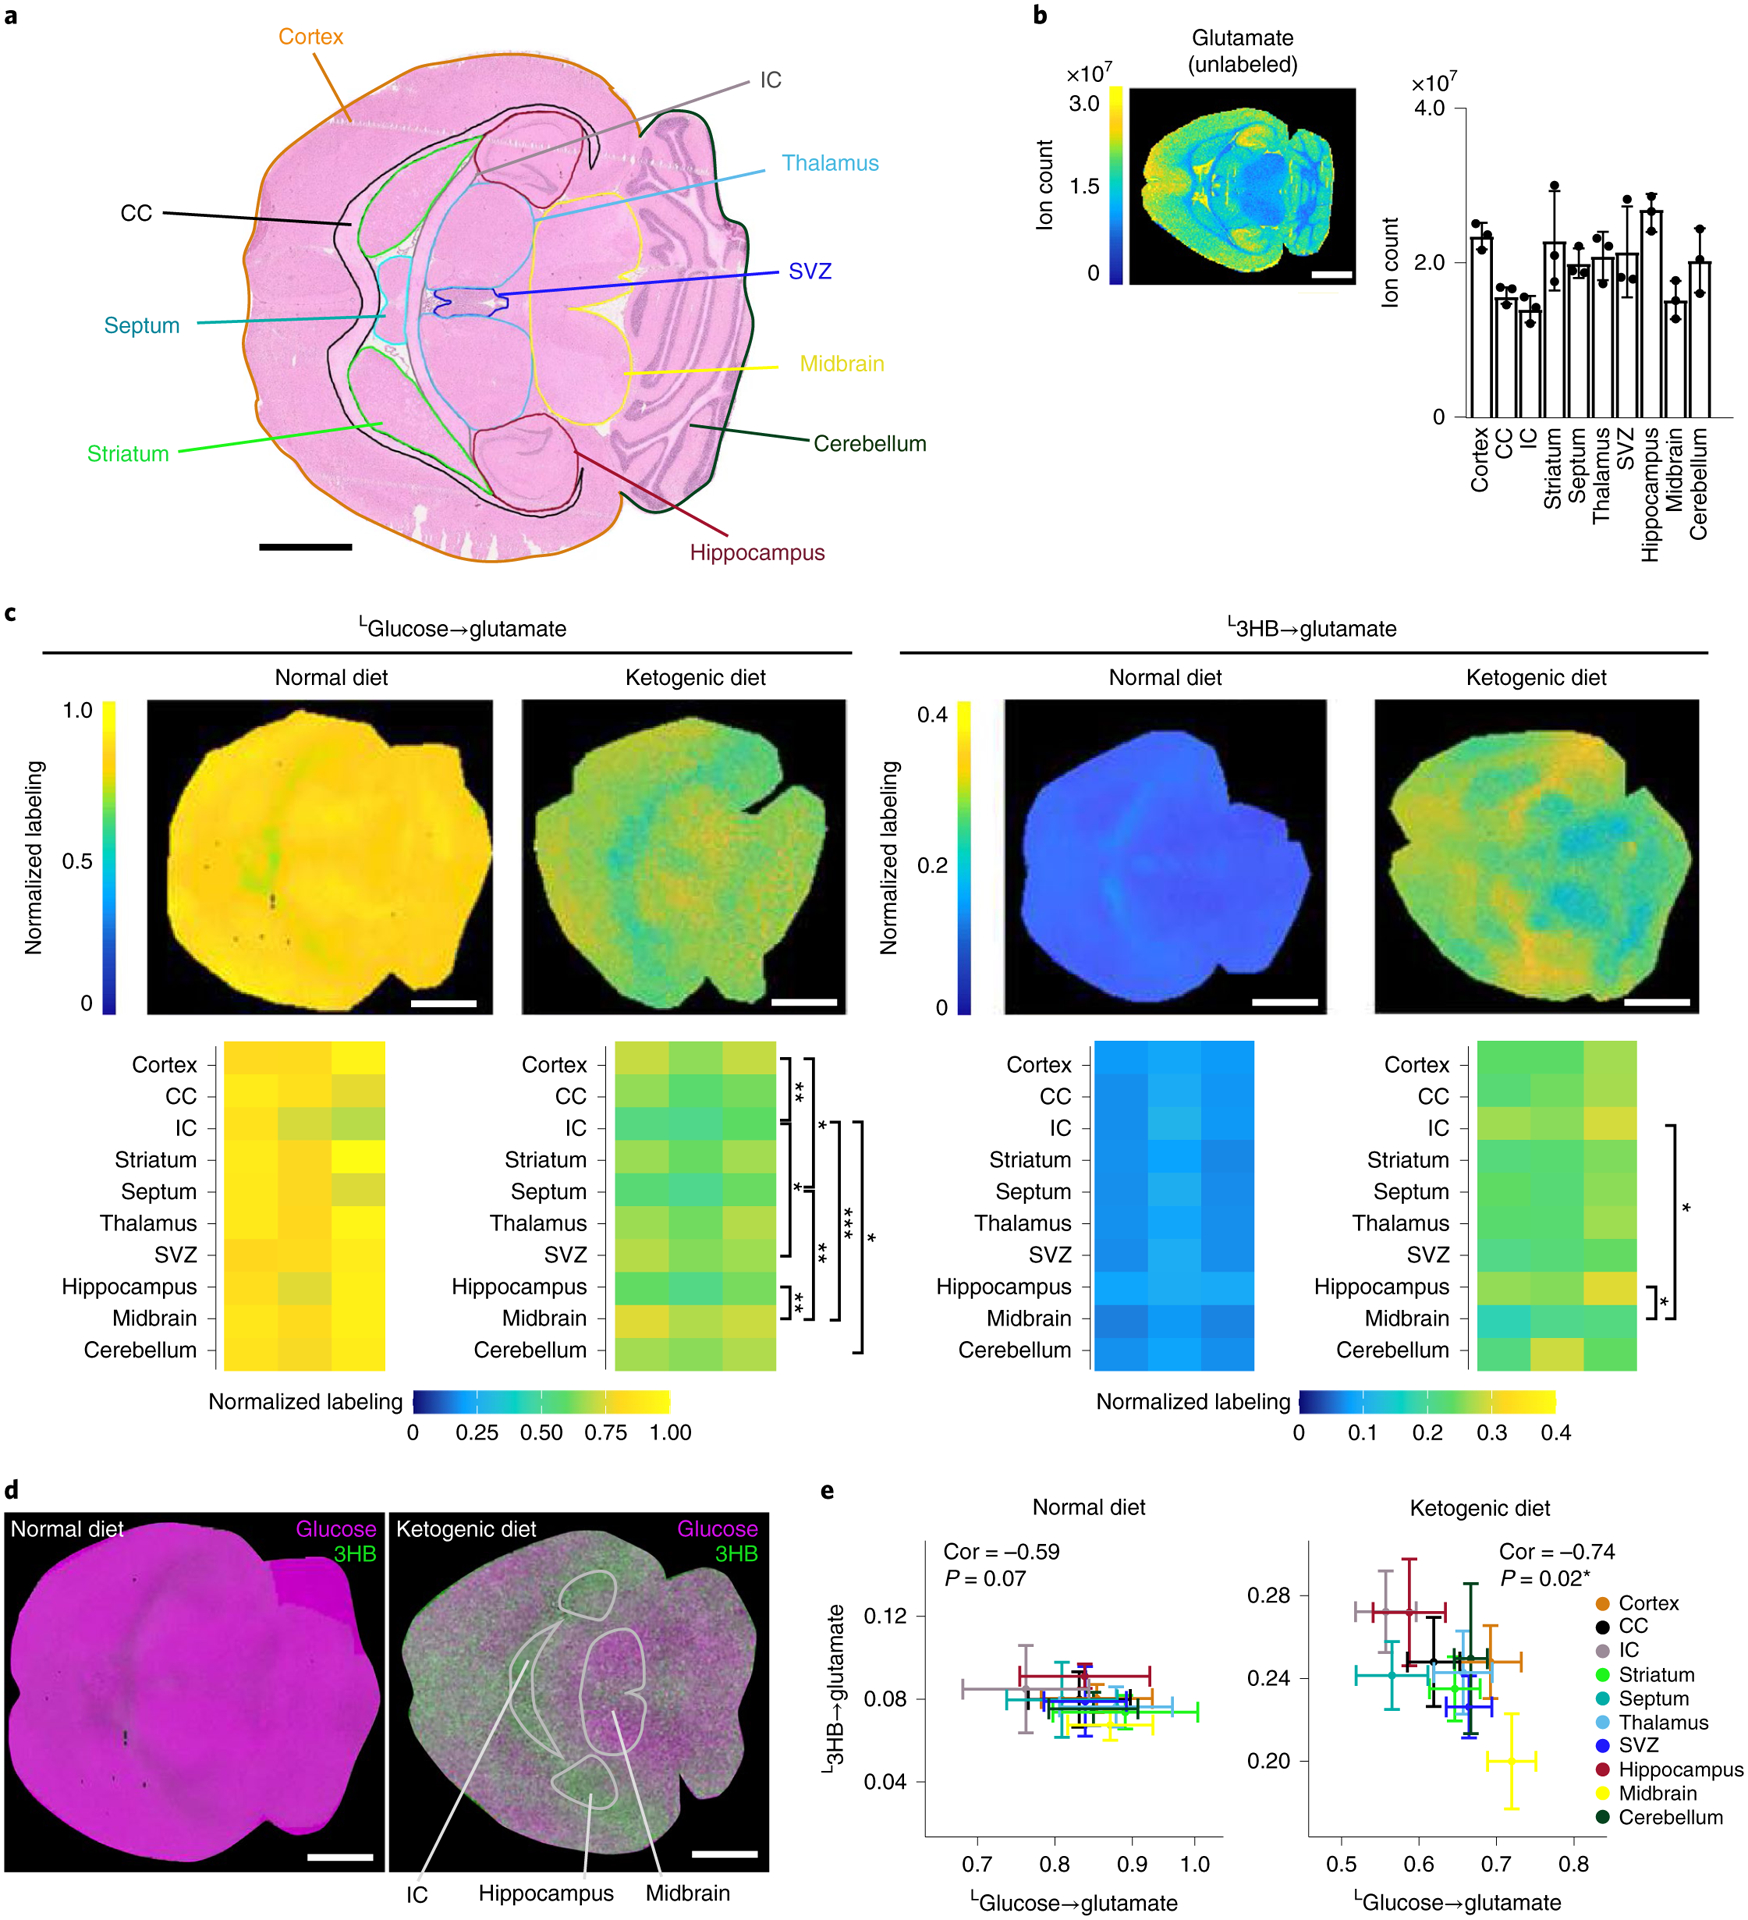
a, H&e staining of the murine brain. Colored outlines designate regions of the brain used for iso-imaging quantification. CC, corpus callosum; IC, internal capsule. b, MSI of unlabeled glutamate signal intensity (reflective of glutamate concentration). c, Normalized glutamate labeling in the murine brain from the indicated U-13C tracers under a normal high-carbohydrate or ketogenic diet. Colors reflect the average carbon atom labeling of glutamate spatially resolved in the brain (, where n = 5, as glutamate has five carbons and Mi is the ratio of glutamate’s M + i form) normalized to the average carbon atom labeling of the infused tracer in serum. d, Two-color visualization of labeling from glucose (magenta) and 3HB (green) spatially throughout the murine brain under a normal or ketogenic diet. e, Correlation between 3HB and glucose labeling under a standard and ketogenic diet. Correlation coefficient (cor) and P value are indicated for each. Scale bars, 1 mm. error bars represent mean ± s.d. n = 3. *P < 0.05; **P < 0.001; ***P < 0.0001, by one-way analysis of variance (ANOVA) with Tukey’s multiple comparisons test. exact P values are provided in the Source Data. 3HB, 3-hydroxybutyrate.
Another ion showing substantial regional variation in concentration (high in the cortex and hippocampus and low in the midbrain) is glutamate (Fig. 4b). Glutamate plays a central role in linking nitrogen metabolism and the TCA cycle. Highly abundant in most tissues, it is particularly abundant in the brain (Extended Data Fig. 6a), where it serves as a major excitatory neurotransmitter. Glutamate is a particularly valuable metabolite for iso-imaging because it provides a readout of both nitrogen and TCA cycle carbon inputs.
To explore the carbon sources for brain glutamate synthesis, we performed isotope tracing studies with eight 13C-labeled major circulating carbon carriers. Within a 50-μm resolution (and without ruling out spatial heterogeneity at a finer length scale), the 13C-tracers showed remarkably homogeneous contributions across the brain, with minimal contribution from glutamine (Extended Data Fig. 6b), greatest labeling from glucose and second greatest from lactate (Fig. 4c and Extended Data Fig. 6c,d). The 13C-glycerol infusion also labeled glutamate throughout the brain, but quantitative analysis of direct contributions revealed that this was via circulating glucose, with glucose being the dominant direct carbon contributor in all brain regions (Fig. 4c and Extended Data Fig. 6d–f).
Up to this point, all experiments used mice that were fed a standard carbohydrate-rich chow (before fasting for 6 h before infusion). Given the dominance of glucose as a brain substrate under these conditions and associated lack of clear spatial patterns in TCA cycle substrate choice within the brain, we also examined mice that were fed a ketogenic diet (mainly fat with low protein and very low carbohydrate), before fasting for the experiment. A ketogenic diet has profound effects on the brain, including therapeutic benefits in seizure disorders20. Biochemically, it induces high circulating levels of 3-hydroxybutyrate, which becomes one of the major brain fuels. As expected, in the ketogenic diet condition, the contribution of glucose to brain glutamate and TCA cycle carbon fell and that of 3-hydroxybutyrate increased (Fig. 4c). In addition, regional patterns in substrate utilization emerged, with 3-hydroxybutyrate used most avidly in the hippocampus and least in the midbrain (Fig. 4d). Consistent with different brain regions preferring either glucose or 3-hydroxybutyrate, their regional use as a glutamate source was inversely correlated in mice on ketogenic diet (Fig. 4e).
Nitrogen substrates for brain glutamate synthesis.
Glutamate synthesis in the brain recruits nitrogen through aminotransferases and glutamate dehydrogenase21, but the exact sources of nitrogen (for example amino acids or ammonia) and whether their usage is region-specific is unknown. We observed comparable brain glutamate nitrogen contributions from five different 15N-labeled nutrients: leucine, valine, glutamine, alanine and ammonia. In contrast, contributions from serine, glycine, threonine, phenylalanine, histidine, arginine and lysine were minimal (Extended Data Fig. 7a,b).
The primary nitrogen contributors showed differential contributions across brain regions. Leucine and valine are branched-chain amino acids and transfer nitrogen to α-ketoglutarate to form glutamate, catalyzed by the enzyme BCAT. Both branched-chain amino acids contributed preferentially in the thalamus, subventricular zone (SVZ) and midbrain, which together comprise most of the center of the mouse brain (Fig. 5a and Extended Data Fig 7b,c). In contrast, glutamine and alanine contributed to glutamate nitrogen most strongly in the internal capsule and SVZ, which are contiguous (Fig. 5a and Extended Data Fig. 7b,c). Finally, ammonia, which can directly react with α-ketoglutarate to form glutamate via glutamate dehydrogenase, contributed most strongly to the thalamus and deep areas of the cerebellum (Fig. 5a). Thus, nitrogen source utilization shows regional variation, both between and within classical anatomical brain regions (Fig. 5b).
Fig. 5 |. Nitrogen sources for glutamate synthesis in murine brain.
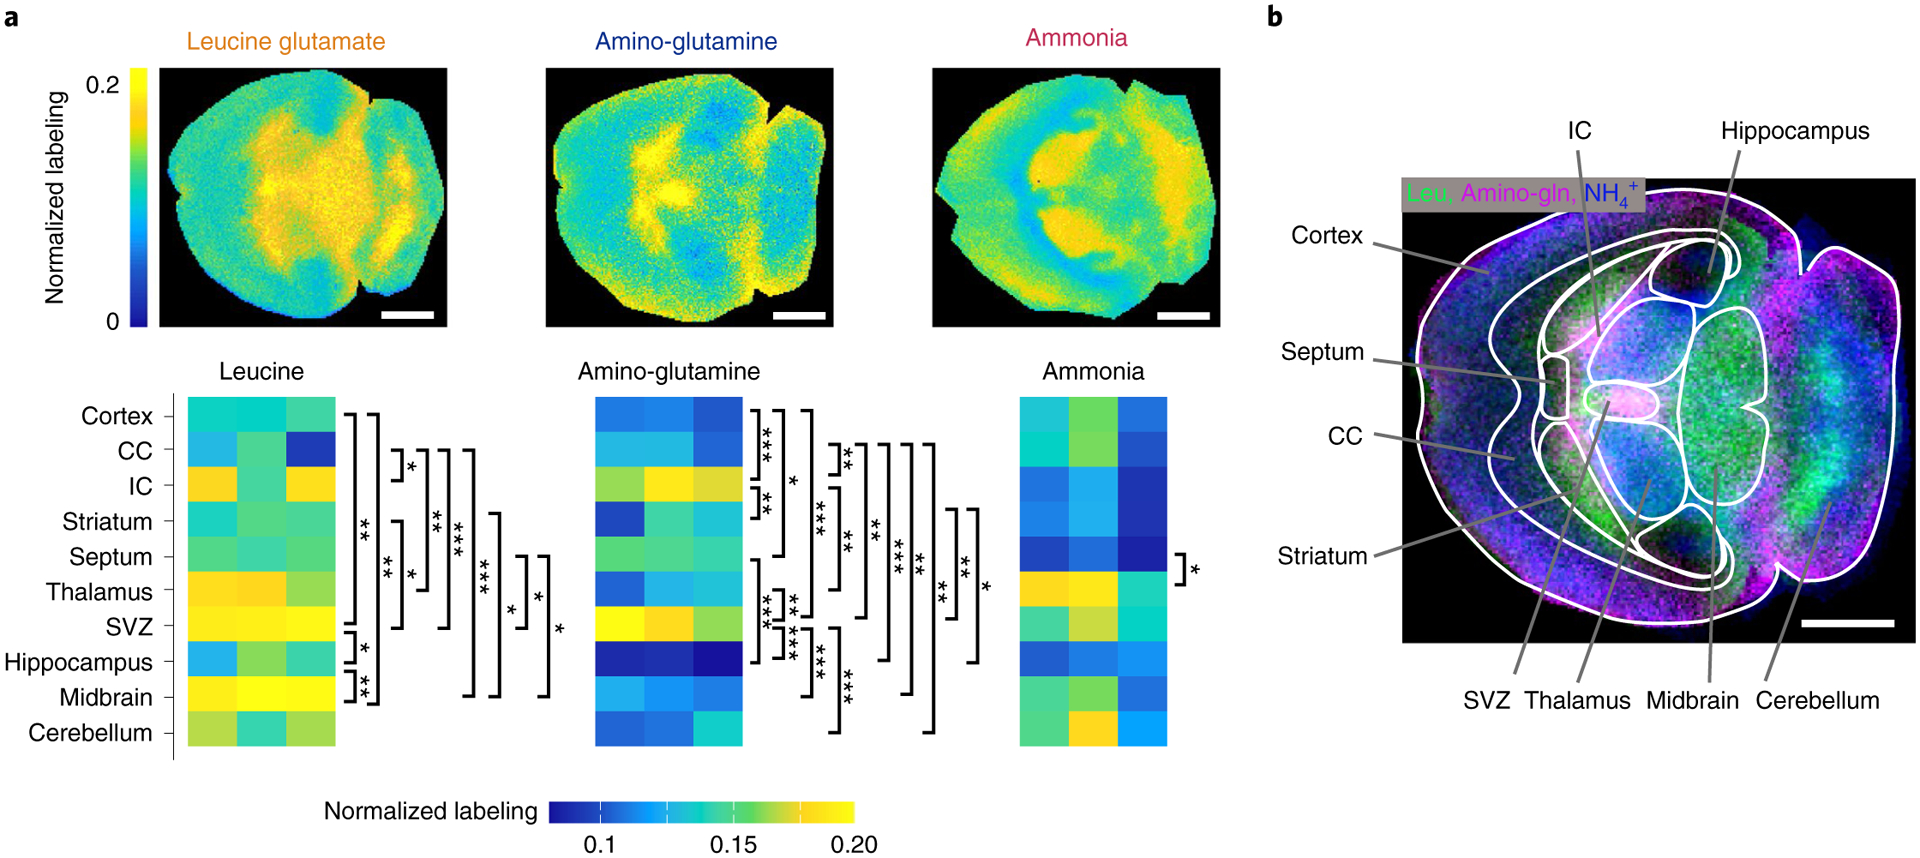
a, Normalized glutamate nitrogen labeling in the murine brain from the indicated 15N tracers. Note that the employed glutamine tracer is labeled only on its amino nitrogen. Colors reflect the 15N-labeling fraction of glutamate spatially resolved in the brain normalized to labeling of the infused tracer in serum. b, Three-color visualization of labeling from ammonia (blue), leucine (green) and glutamine’s amino nitrogen (magenta) spatially throughout the murine brain. Scale bars, 1 mm. error bars represent mean ± s.d. n = 3. *P < 0.05; **P < 0.001; ***P < 0.0001, by one-way ANOVA with Tukey’s multiple comparisons test. exact P values are provided in the Source Data.
Discussion
Organs continually uptake and release circulating metabolites. Arterial–venous metabolite gradient measurements and whole-tissue isotope tracing are useful approaches for investigating metabolic activity22,23. Organs, however, are heterogeneous, composed of distinct spatial regions and cell types. Traditional techniques are ill-suited to the spatial mapping of heterogeneity in metabolic activity.
One emerging approach is spatial transcriptomics of metabolic enzymes24,25. While informative, RNA levels capture only one aspect of metabolic regulation; enzymes are also controlled by translation, covalent modification, localization, substrate and product concentrations and small molecule effectors. To dissect such regulation, the ability to measure metabolic reaction rates in situ is critical. Iso-imaging is a substantial step in this direction.
Iso-imaging builds upon traditional MSI by visualizing isotope labeling patterns, reflective of metabolic flux, in addition to ion intensities reflective of metabolite abundances. We establish a pipeline from isotope tracer infusion through data visualization, with a focus on steady-state infusions and labeling quantitation in carefully selected reported metabolites. The application of iso-imaging vividly reveals glycolytic and gluconeogenic regions of the kidney, discovers preferential utilization of fatty acids as fuels in the poorly vascularized renal medulla, reveals homogeneous use of glucose as the primary brain carbon source under a standard carbohydrate-rich diet, identifies brain parts that most avidly use 3-hydroxybutyrate under a ketogenic diet and captures regional variation in nitrogen sources across the brain.
The spatial resolution of MSI has yet to reach the single-cell level and this correspondingly limits the spatial resolution of iso-imaging. Moreover, the steady-state tracing experiments carried out here measure fractional pathway contributions, not absolute fluxes. For example, our finding (in the carbohydrate-rich diet condition) of homogeneous glucose contribution to brain glutamate does not argue against regional heterogeneity in absolute glycolytic or TCA cycle flux, simply that glucose is the main TCA cycle substrate throughout. In addition, while we made progress here toward understanding molecular mechanisms underlying spatial fluxes in the kidney by integrating iso-imaging with enzyme and transporter IHC, more comprehensive metabolite coverage and quantitative assessment of flux control mechanisms will be important to enhancing such efforts.
We anticipate that technological advances, both in terms of sample preparation and MS hardware, will enable broader and higher spatial resolution analyses of metabolic activity in the coming years. It will be important to revisit the basic physiological questions addressed here, such as heterogeneity of brain nutrient use, with improved technology. In parallel, we anticipate increasing utilization of iso-imaging to explore disease biology.
Methods
IACUC statement and animal models.
All animal studies were approved by the Princeton University Committee of Animal Care (2032–19). C57BL/6N male mice were purchased from Charles River Laboratories and allowed at least 7 d of acclimation to the Princeton University animal facilities before experimentation. Right jugular vein catheters were placed at either Charles River Laboratories or Princeton University. Mice were housed on a standard light cycle (from 8:00 to 20:00) and fed a standard rodent chow (PicoLab Rodent 205053). Ambient temperature was 20–26 °C and humidity was maintained between 40–60%. For ketogenic diet experiments, mice were switched to a ketogenic diet (Bioserv, S3666) 2 weeks before tracer experiments. Tracer experiments were carried out at 10–14 weeks of age.
Infusions.
Animals were fasted for 8 h starting at 9:00 and infusions were performed in conscious animals at 14:30. A constant infusion of isotope-labeled nutrient was administered for 2.5 h (Supplementary Table 1 lists infusion rates). Tail vein plasma was collected from each infusion experiment. Animals were then killed by cervical dislocation and kidneys and brains were dissected rapidly.
Tissue storage and slide preparation.
Frozen kidneys and brains were stored intact at −80 °C until MALDI MSI analysis. For each tissue, ~10-μm thick sections were collected on a cryostat (Leica, CM3050S). Sections for MALDI MSI were thaw-mounted on indium tin oxide (ITO)-coated glass slides (Bruker Daltonics) and desiccated under vacuum for 10 min. Alternating serial sections for IHC and immunofluorescence were collected on standard glass slides.
Matrix coating.
Desiccated tissue sections mounted on ITO glass slides were sprayed using an HTX TM sprayer (HTX Technologies) with one of 10 mg ml−1 NEDC (Sigma, 222488), 10 mg ml−1 9-AA (Sigma, 8183620010) or 10 mg ml−1 DAN (Sigma, 88461), each dissolved in 70%:30% methanol:water. The sprayer temperature was set to 80 °C, with a flow rate of 0.1 ml min−1, velocity of 1,000 mm min−1, track spacing of 2 mm, pressure of 10 psi and 3 l min−1 gas flow rate. Ten passes of the matrix were applied to slides with 10 s of drying time between each pass.
MALDI mass spectrometry.
For MALDI Fourier transform ion cyclotron resonance (FT ICR)(F measurements, matrix-coated slides were immediately loaded into a slide adaptor (Bruker Daltonics) and then into a solariX XR FT ICR mass spectrometer equipped with a 9.4T magnet (Bruker Daltonics). The resolving power is 120,000 at m/z 500. Mass accuracy was calibrated within 1 ppm by using 1 mg ml−1 arginine solution before starting the run. m/z 124.0068 (taurine), m/z 133.0136 (malate) and m/z 145.0611 (glutamate) were used as lock masses during the run because of their high abundance in kidney and brain tissues. Absolute minimum intensity for peak picking during acquisition was set at 5 × 10³. The laser focus was set to ‘small’ and the x–y raster width was set to 20–50 μm, using Smartbeam-II laser optics. A spectrum was accumulated from 200 laser shots at 1,000 Hz and ions were accumulated using the cumulative accumulation of selected ions (CASI) mode within an m/z range of 70–300 before being transferred to the ICR cell for a single scan. Data collection was performed using Bruker FlexImaging software (Bruker Daltonics).
LC–MS.
Serial sections of 10-μm thickness of tissue were collected using a cryostat and immediately transferred into 100 μl extraction solvent (80%:20% methanol:water). The solution was kept at −20 °C for 10 min and centrifuged at 16,000g for 25 min at 4 °C. The supernatant was collected for LC–MS analysis. LC was performed on an Xbridge BEH amide HILIC column (Waters) with a Vanquish UHPLC system (Thermo Fisher). Solvent A was 95:5 water: acetonitrile with 20 mM ammonium acetate and 20 mM ammonium hydroxide at pH 9.4. Solvent B was acetonitrile. The gradient used for metabolite separation was 0 min, 90% B; 2 min, 90% B; 3 min, 75%; 7 min, 75% B; 8 min, 70% B, 9 min, 70% B; 10 min, 50% B; 12 min, 50% B; 13 min, 25% B; 14 min, 25% B; 16 min, 0% B, 21 min, 0% B; 21 min, 90% B; and 25 min, 90% B. MS analysis was performed on a Q-Exactive Plus mass spectrometer (Thermo Fisher) in negative ionization mode, scanning an m/z range of 70 to 1,000. Circulating glycerol labeling was measured by converting serum glycerol to glycerol-3-phosphate using glycerol kinase, which can then be measured using LC–MS. Acetate was derivatized by mixing tissue extract with a mixture of 12 mM 3-Ethyl-1-[3-(dimethylamino)propyl]carbodiimide hydrochloride, 15 mM 3-nitrophenylhydrazine and pyridine (2/5 v/v) in methanol. The reaction was quenched by adding 0.5 mM β-mercaptoethanol and 0.1% formic acid after reacting for 1 h at 4 °C. After centrifugation at 16,000g for 30 min, the supernatant was loaded for LC–MS analysis. Data were analyzed using El-MAVEN Software26 (Elucidata; elucidata.io). For tracer experiments, isotope labeling was corrected for the natural abundance of 13C and 15N isotopes.
MALDI MS/MS.
Sample preparation.
Mouse brain and kidney tissue sections (~10-μm thick) were thaw-mounted on ITO-coated glass slides and dehydrated in a vacuum chamber for ~15 min. Three different matrix solutions, 10 mg ml−1 NEDC (negative mode), 5 mg ml−1 9-AA (negative mode) and 7 mg ml−1 DAN (positive and negative mode) were prepared for spray-coating tissue sections using an HTX TM sprayer (HTX Technologies). NEDC was directly dissolved in 7:3 (v:v) methanol:water, whereas 9-AA and DAN were dissolved separately in 7:3 (v:v) methanol:water at 70 °C, followed by filtration (0.45-μm pore size). All matrix solutions were pumped at a flow rate of 0.1 ml min−1, with a nozzle temperature of 70 °C, drying gas pressure of 10 psi and track spacing of 2 mm. For NEDC, 9-AA and DAN, the number of passes was set to 10, 15 and 13, respectively, with 10 s of drying time between each pass.
MALDI-FTICR MS/MS.
Before acquiring MALDI-MS/MS spectra from tissue sections, mass measurement calibration was performed in positive and negative ion modes by electrospray ionization using arginine solution (1 mg ml−1). Post-calibration mass measurement error was <1 ppm for 70 ≤ m/z ≤ 900. For MALDI MS/MS from tissue sections, the laser focus was set to small and a laser power of 20% was used to generate a spectrum that was averaged from 200 laser shots at a repetition rate of 1,500 Hz. For ion isolation, the quadrupole isolation window was set between 0.5 and 1 Da, depending on the difference between the m/z of the targeted (parent) ion and neighboring peaks. At first, the collision voltage (CV) was set to 0 V to inspect parent ion isolation and the S/N per scan. Then, the CV was ramped up to 5 V ≤ CV ≤ 20 V to initiate ion fragmentation by collision-induced dissociation until the intensity of the parent ion was less than or equal to the intensity of at least one of the fragment ions. The collision gas (argon) pressure was set to ~5 × 10³ mbar during collision-induced dissociation. When the S/N per scan was low for some parent ions, the sample stage was moved after each scan to collect ions from ‘fresh’ tissue spots and the total acquired scans were averaged to enhance the S/N.
MALDI-MS/MS spectral matching.
For ion assignment by MS/MS, the parent and fragment m/z values in tandem MS spectra that were recorded at several collision energies were compared to those available at the Human Metabolome Database (https://hmdb.ca/) and Metlin (https://metlin.scripps.edu/landing_page.php?pgcontent=mainPage). With the exception of heme, all MS/MS spectra adopted from the two online databases for comparison (Extended Data Fig. 2d and Supplementary Table 2) were generated experimentally (according to the databases). For heme, in silico MS/MS spectra were used for comparison as the experimental version was not available.
Histology and pathology.
Histology and immunostaining were performed using standard methods (Supplementary Methods). Pathological assessments from a trained neuropathologist (O.A.-D.) were used to draw regions of interest (ROIs).
IsoScope.
IsoScope, an open-source software package, was written in MATLAB to visualize and perform data analysis of MSI data, with a focus on isotope labeling. The package was designed and tested with Bruker solariX data, but can also take the standard .imzML data format. Example data are provided with the software download. Like many other commercial and open-source MALDI image software, IsoScope has the basic functionalities of data parsing, processing, peak detection, image browsing, mass spectrum browsing, ROI selection, data extraction and image overlay and registration. IsoScope stands out for enabling facile analysis of isotope-labeled imaging data (including 13C, 15N, 2H and 13C15N double tracer). Specifically, with only a few clicks, the software can present spatial images for isotope-labeled forms or average carbon atom labeling of a metabolite, including after natural isotope abundance correction. In addition, when provided with circulating tracer labeling, IsoScope will normalize images to the tracer enrichment.
IsoScope takes either the standard mzXML/ibd file format or the Bruker’s peaks .sqlite file as the input. The input file is then parsed into a ‘.mat’ file containing centroided data consisting of centroid mass and intensity values for each two-dimensional spatial pixel. The resulting scrubbed ‘.mat’ file is a comfortable size for rapid manipulation and image visualization on a typical personal computer.
Data are presented via a graphical user interface that includes a user-specified list of compounds with associated molecular formulas. Clicking on a compound brings up the associated spatial intensity image. Peaks are included in the image based on their falling within a user-specified ppm window (typically between 1–3 ppm) of the target analyte ion m/z. The user can also select labeled atoms of interest and the software will generate intensity images for specific metabolite isotopic forms. Before generating such images, the user can apply natural isotope abundance correction (to remove ‘background’ isotopic signals arising from naturally occurring isotopes rather than the introduced tracer). The isotope correction function works for both low- and high-mass resolution data. For example, it will separately correct for the natural 15N and 13C M + 1 form in cases where the instrument mass resolution is sufficient for these to be isotopically resolved.
The user can toggle between displaying labeled metabolite intensities as raw ion counts or fractions of all isotopic forms of the metabolite (fractional labeling). In addition, the software can compute the weighted average of different labeled forms to generate images of average atom labeling (L) given by:
where n is the number of C or N atoms in the metabolite, Mi is the fraction of different mass isotopologs after natural isotope abundance correction (M0, M1,…, Mn). All isotope labeling images can optionally be normalized to user-provided circulating tracer enrichment data.
H&E.
Meyer and Briggs’ hematoxylin (Sigma, MHS32) and eosin (Sigma, HT110332) were used for H&E staining with our protocol adapted from the manufacturer’s recommendations. Matrix was removed by placing slides used for MALDI MSI in ice-cold pure methanol for 5 min. Slides were washed with PBS and water and then incubated with hematoxylin for 15 min. Slides were then dehydrated in 95% ethanol for 30 s, then incubated with eosin for 1 min before being dehydrated further in 95% ethanol followed by pure ethanol. Following a 2-min xylene wash, slides were mounted using Cytoseal 60 mounting medium (Thermo Fisher Scientific, 8310–4) and imaged and visualized using a Hamamatsu Nanozoomer with NDP.view2 software (Hamamatsu).
Immunofluorescence.
After a 10-min fixation with 4% PFA, tissue samples were washed with PBS and then incubated with PBS + 0.1% Triton-X to permeabilize cell membranes. Tissues were then blocked with 5% goat serum in PBS containing 300 mM glycine or in PBS + 0.1% Triton-X containing 0.1% BSA for 1 h and incubated with primary antibody (glutaminase at 5 μg ml−1 (Abcam, ab93434) or 1:500 dilution (Abcam, ab156876); glutamine synthetase at 1:50 dilution (ProteinTech, 11037–2-AP); glutamate dehydrogenase at 1:300 dilution (Cell Signaling Technology, D9F7P); citrate synthase at 1:100 dilution (Cell Signaling Technology, D7V8B); SLC13A2 at 1:200 dilution (Thermo Fisher, 21722–1-AP); SLC13A3 at 1:200 dilution (Invitrogen, PA5–69137)) for 2 h or overnight. Samples were then washed and incubated with fluorescent secondary antibodies (1:500 dilution) for 1 h. For antibodies raised in mice, tissues were stained following Mouse on Mouse (MOM) Immunodetection kit recommendations (Vector Laboratories, BMK-2202). Following permeabilization, slides were incubated with MOM blocking reagent and washed with MOM diluent. Nuclei were stained using 4,6-diamidino-2-phenylindole (1 μg ml−1) (Invitrogen, D1306) or Hoechst (1:1,000 dilution; Invitrogen, H3570) and tissues were mounted using prolong gold antifade (Invitrogen, P36930) or Fluoromount-G (Southern Biotech, 0100–01) and imaged on a Hamamatsu Nanozoomer. Images were then exported using the NDP.view2 software (Hamamatsu) and processed in Fiji. For the quantifications in Extended Data Fig. 4, three ROIs per kidney region (medulla, outer stripe and cortex) of the same dimensions were manually selected in Fiji and the mean gray values in each were compared by one-way ANOVA.
Single-cell RNA-sequencing analysis.
A single-cell RNA-sequencing dataset of adult murine kidney27 (Gene Expression Omnibus, GSE129798) was processed using Seurat28. The data were normalized, scaled and clustered following the recommended Seurat pipeline. Cluster markers were compared to those used in the original publication1 to match each cluster and to classify each cluster of ureteric or nephron epithelial cells as belonging to the medulla, outer stripe or cortex. We excluded clusters of other cell types (vascular, immune and stromal) and clusters not clearly belonging to a specific region. Expression levels of genes encoding metabolic enzymes were then compared between each region by plotting mean expression levels and the percentage of cells in each region that expressed the gene of interest.
Extended Data
Extended Data Fig. 1 |. Iso-imaging pipeline, quantitation ions and control experiments.
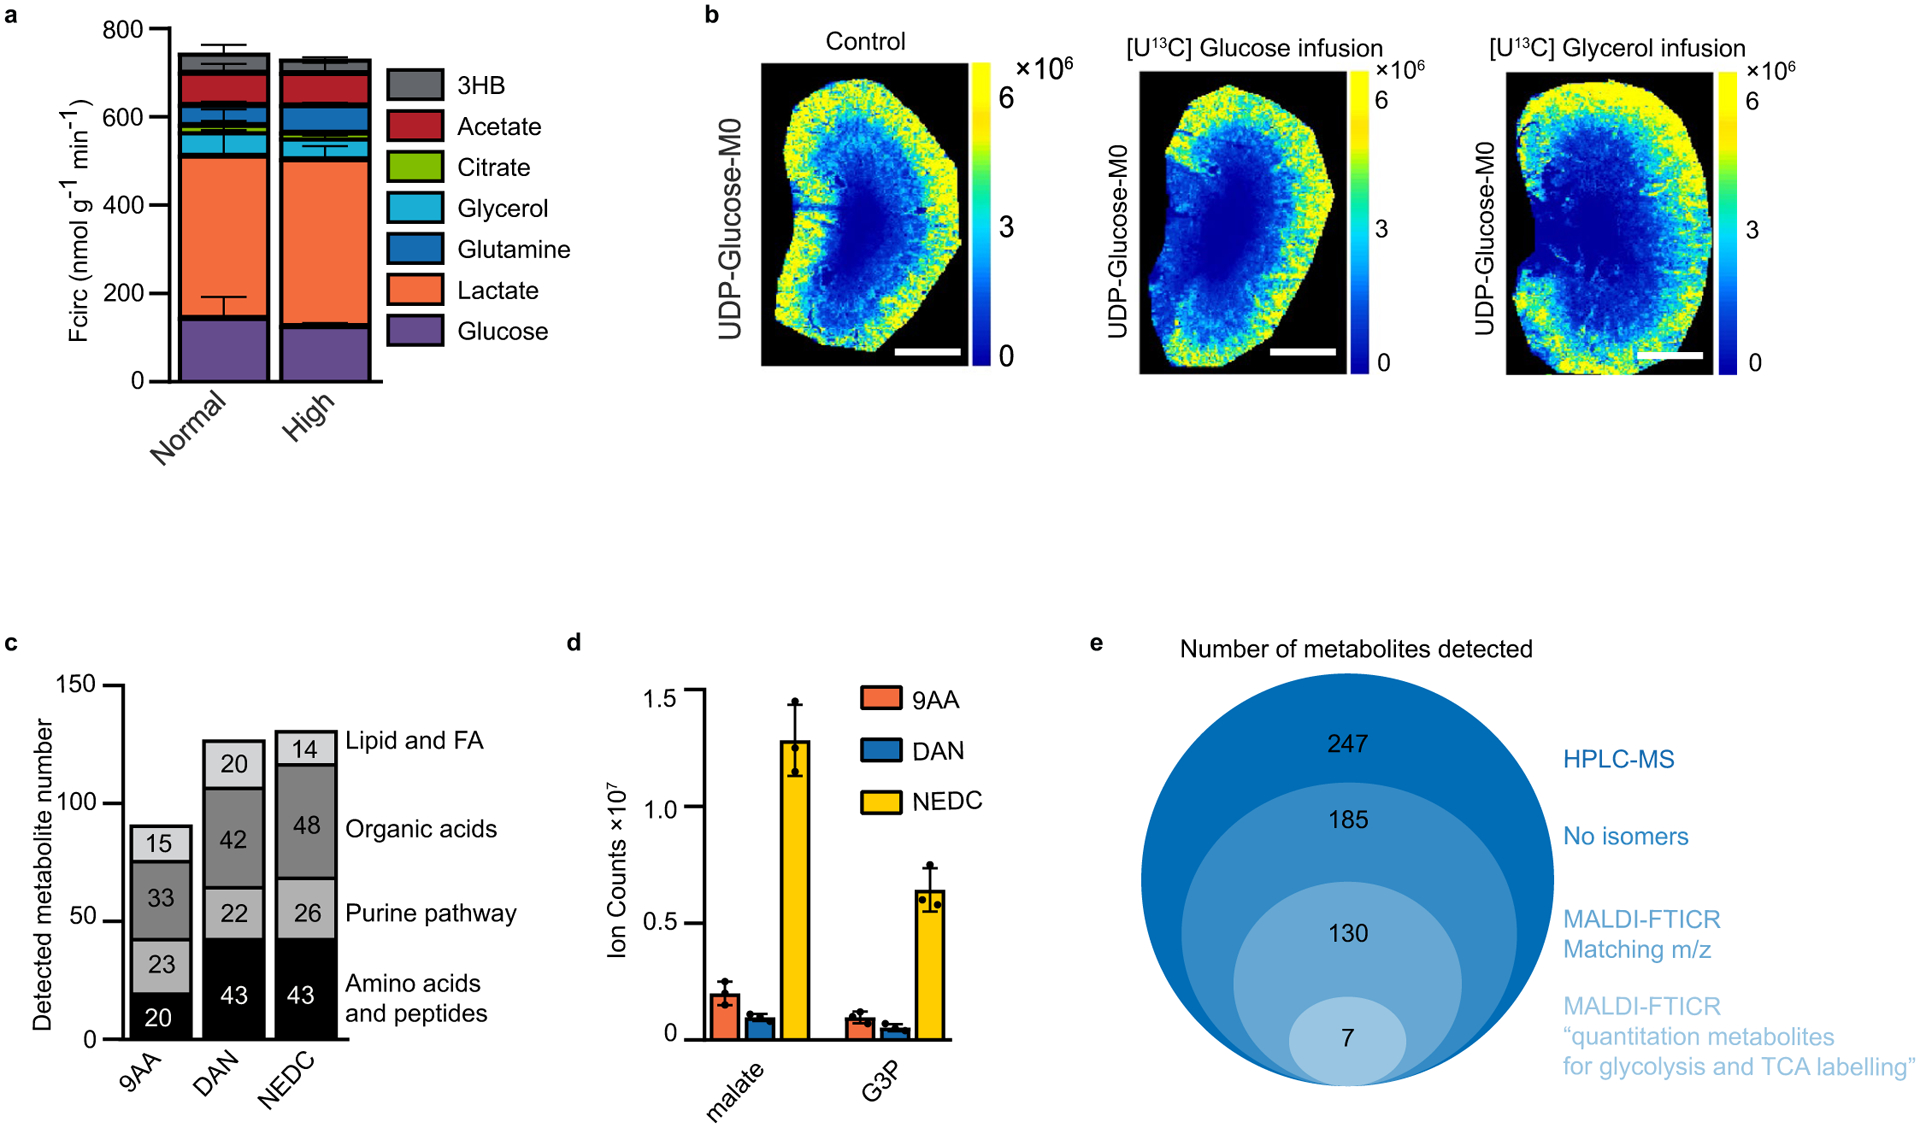
a. Quantification of the circulatory turnover flux (Fcirc) at minimally perturbative infusion rates previously employed1 and somewhat higher infusion rates employed here to enable more facile measurement of downstream metabolite labeling (Supplementary Table 1). Note that the modestly higher infusion rates do not substantially perturb endogenous metabolic fluxes. b. Imaging mass spectrometry of UDP-glucose unlabeled signal intensity (M0) in control kidneys, after [U-13C]glucose infusion and after [U-13C]glycerol infusion. Note that the infusions are minimally perturbative, that is they do not alter UDP-glucose’s spatial distribution or signal intensity. c. Number of metabolites of different classes detected by MALDI–MSI using three different matrices (9-AA: 9-aminoacridine, 1,5-DAN: diaminonaphthalene, NeDC: N-(1-naphthyl) ethylenediamine) in negative ionization mode. d. Ion intensities of malate and glycerol-3-phosphate by MALDI–MSI with the indicated matrix in negative ionization mode. e. Steps used to select the quantitation metabolites for iso-imaging. 247 water soluble metabolites were readily quantified by HPLC-MS in negative mode (HPLC-MS). These were the initial candidates. Among these, 185 metabolites were observed as single LC–MS peaks without obvious isomers (‘no isomers’). Using NeDC as the matrix, 130 ions aligning with these metabolites were detected using MALDI-FTICR in negative ionization mode (MALDI-NeDC). Of these, seven metabolites showed similar isotope labeling patterns by LC–MS and MALDI (matching labeling patterns, ‘Quantitation metabolites’) from U13C-glucose infusion. Scale bars: 1 mm. n = 3 for all experiments unless otherwise indicated. Data presented as mean + /− s.d.
Extended Data Fig. 2 |. Identifying small molecules by stable-isotope labeling and MS/MS.
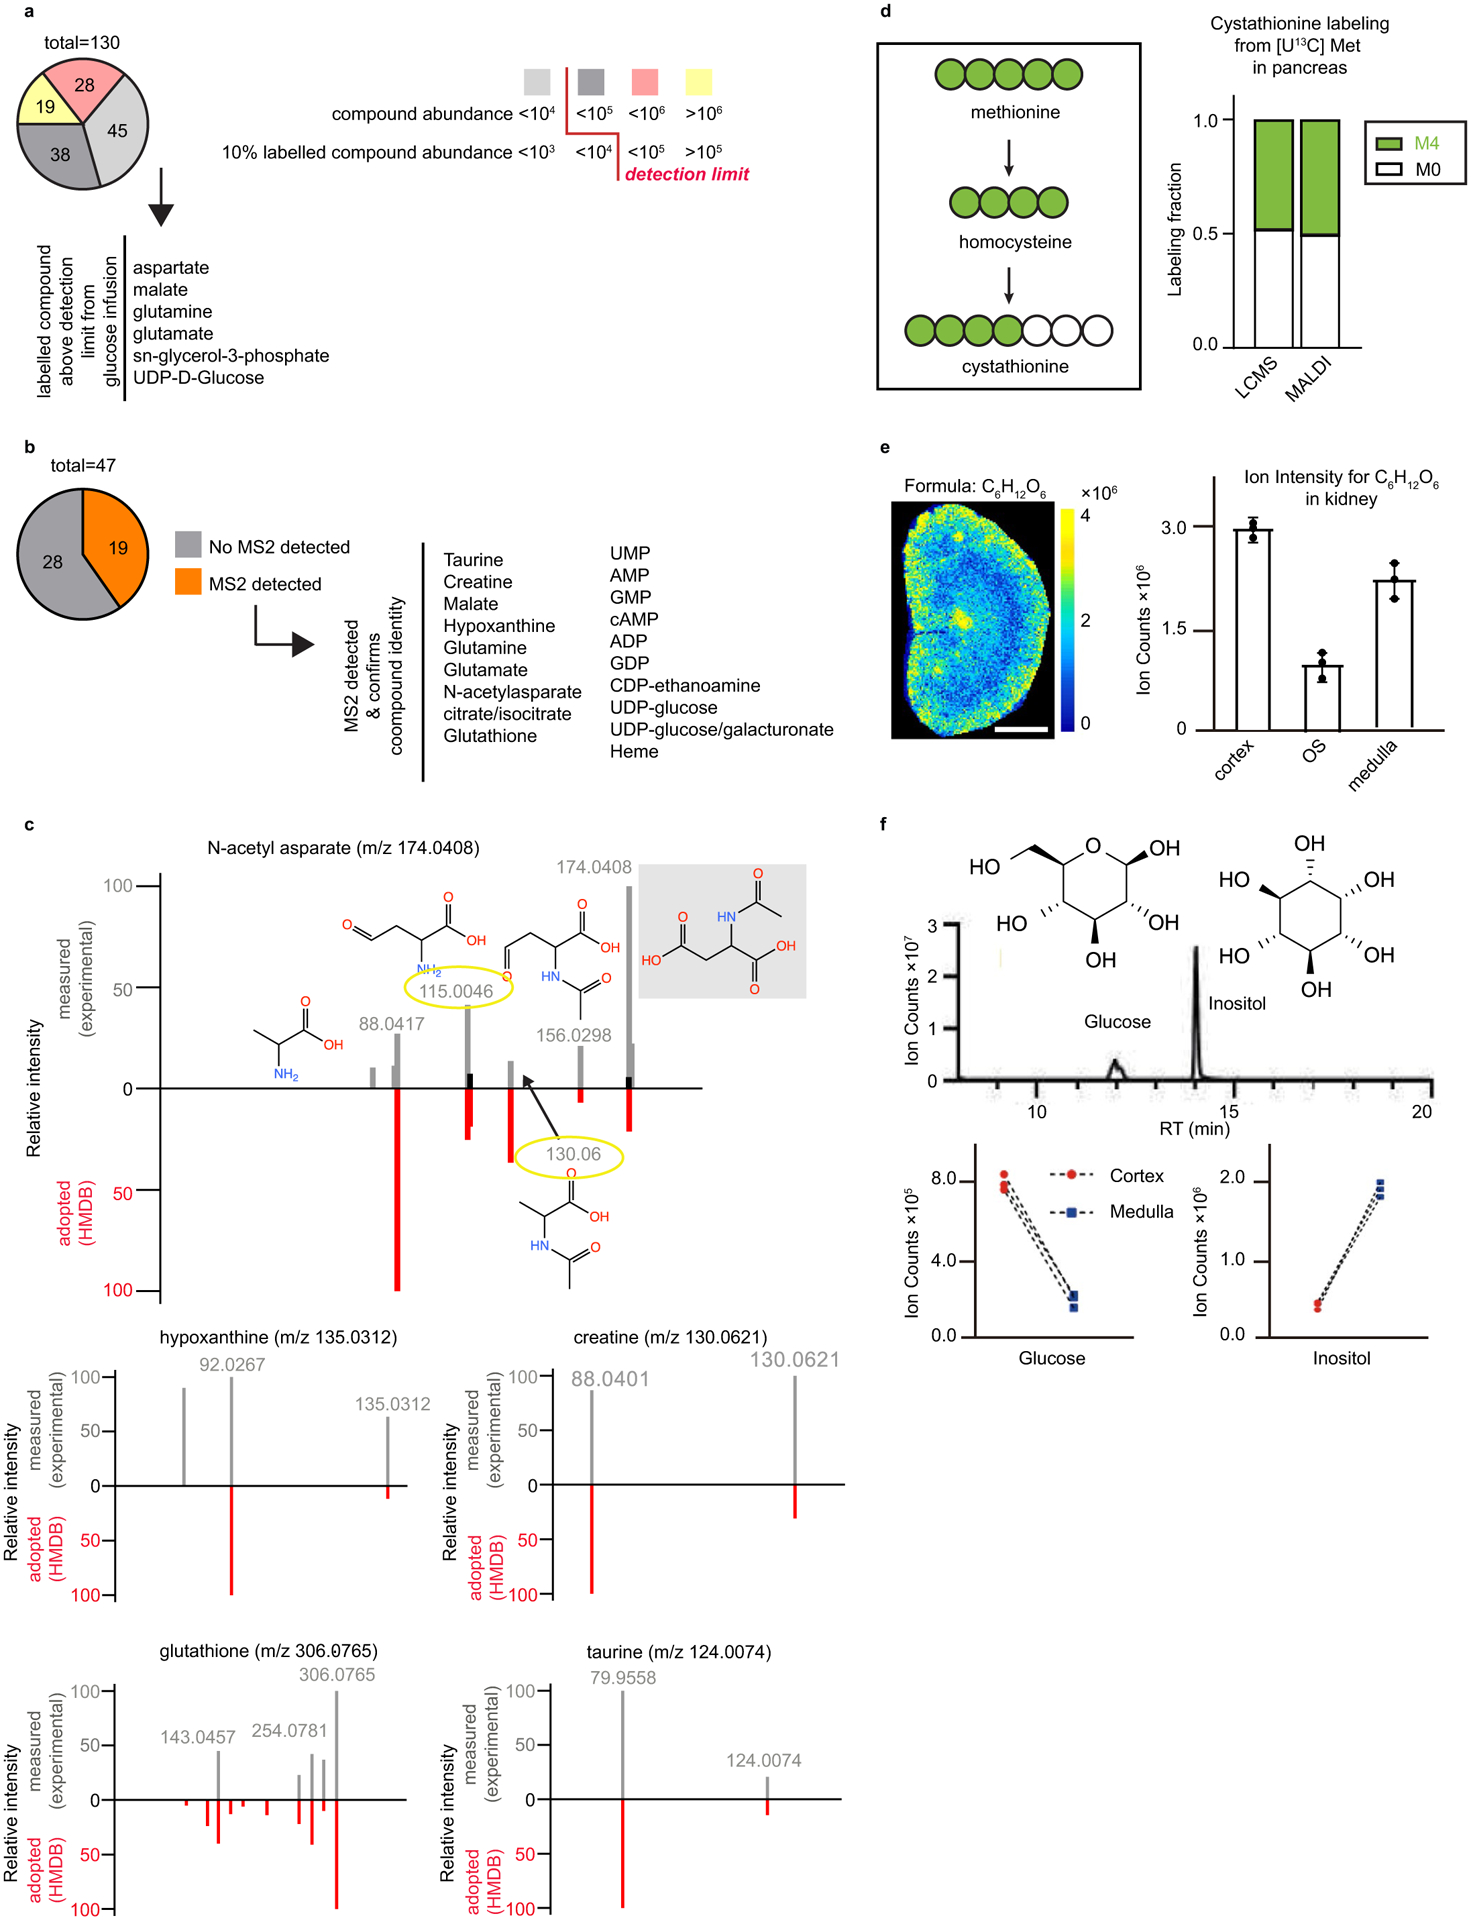
a Breakdown of metabolites grouped by unlabeled parent compound abundance. Detection limit prevents identification of certain compounds (<104) at their monoisotopic m/z and of others by their labeled compounds (<105), whose abundance falls below the detection limit. b Diagram depicting the first steps of the transsulfuration pathway starting with the reaction of [U-13C] methionine (M6) to homocysteine (M4, in two steps, not shown) and to cystathionine and labeled fraction of cystathionine (M4) from [U-13C] methionine in the pancreas by LC–MS and MALDI. c Breakdown of metabolites that can be detected and then verified by MS2. d Spectra of metabolites detected in MALDI by MS2. experimentally measured (gray) and HMDB-adopted (red) spectra are shown on the positive and negative y axes, respectively. Fragment structures are provided for an example metabolite (N-acetyl aspartate). Molecular structures depict predicted (adopted from Metlin) neutral fragments and the corresponding m/z peaks refer to the [M-H]− ions. e. Imaging mass spectrometry of unlabeled C6H12O6 signal intensity (mixture of glucose and inositol) in murine kidney. f. LC–MS analysis showing the relative abundance of the isomers glucose and inositol in the dissected renal cortex and medulla. Scale bars: 1 mm. n = 3 for all experiments unless otherwise indicated. Data presented as mean + /− s.d.
Extended Data Fig. 3 |. IsoScope data input, analysis pipeline, and graphical user interface (GuI).
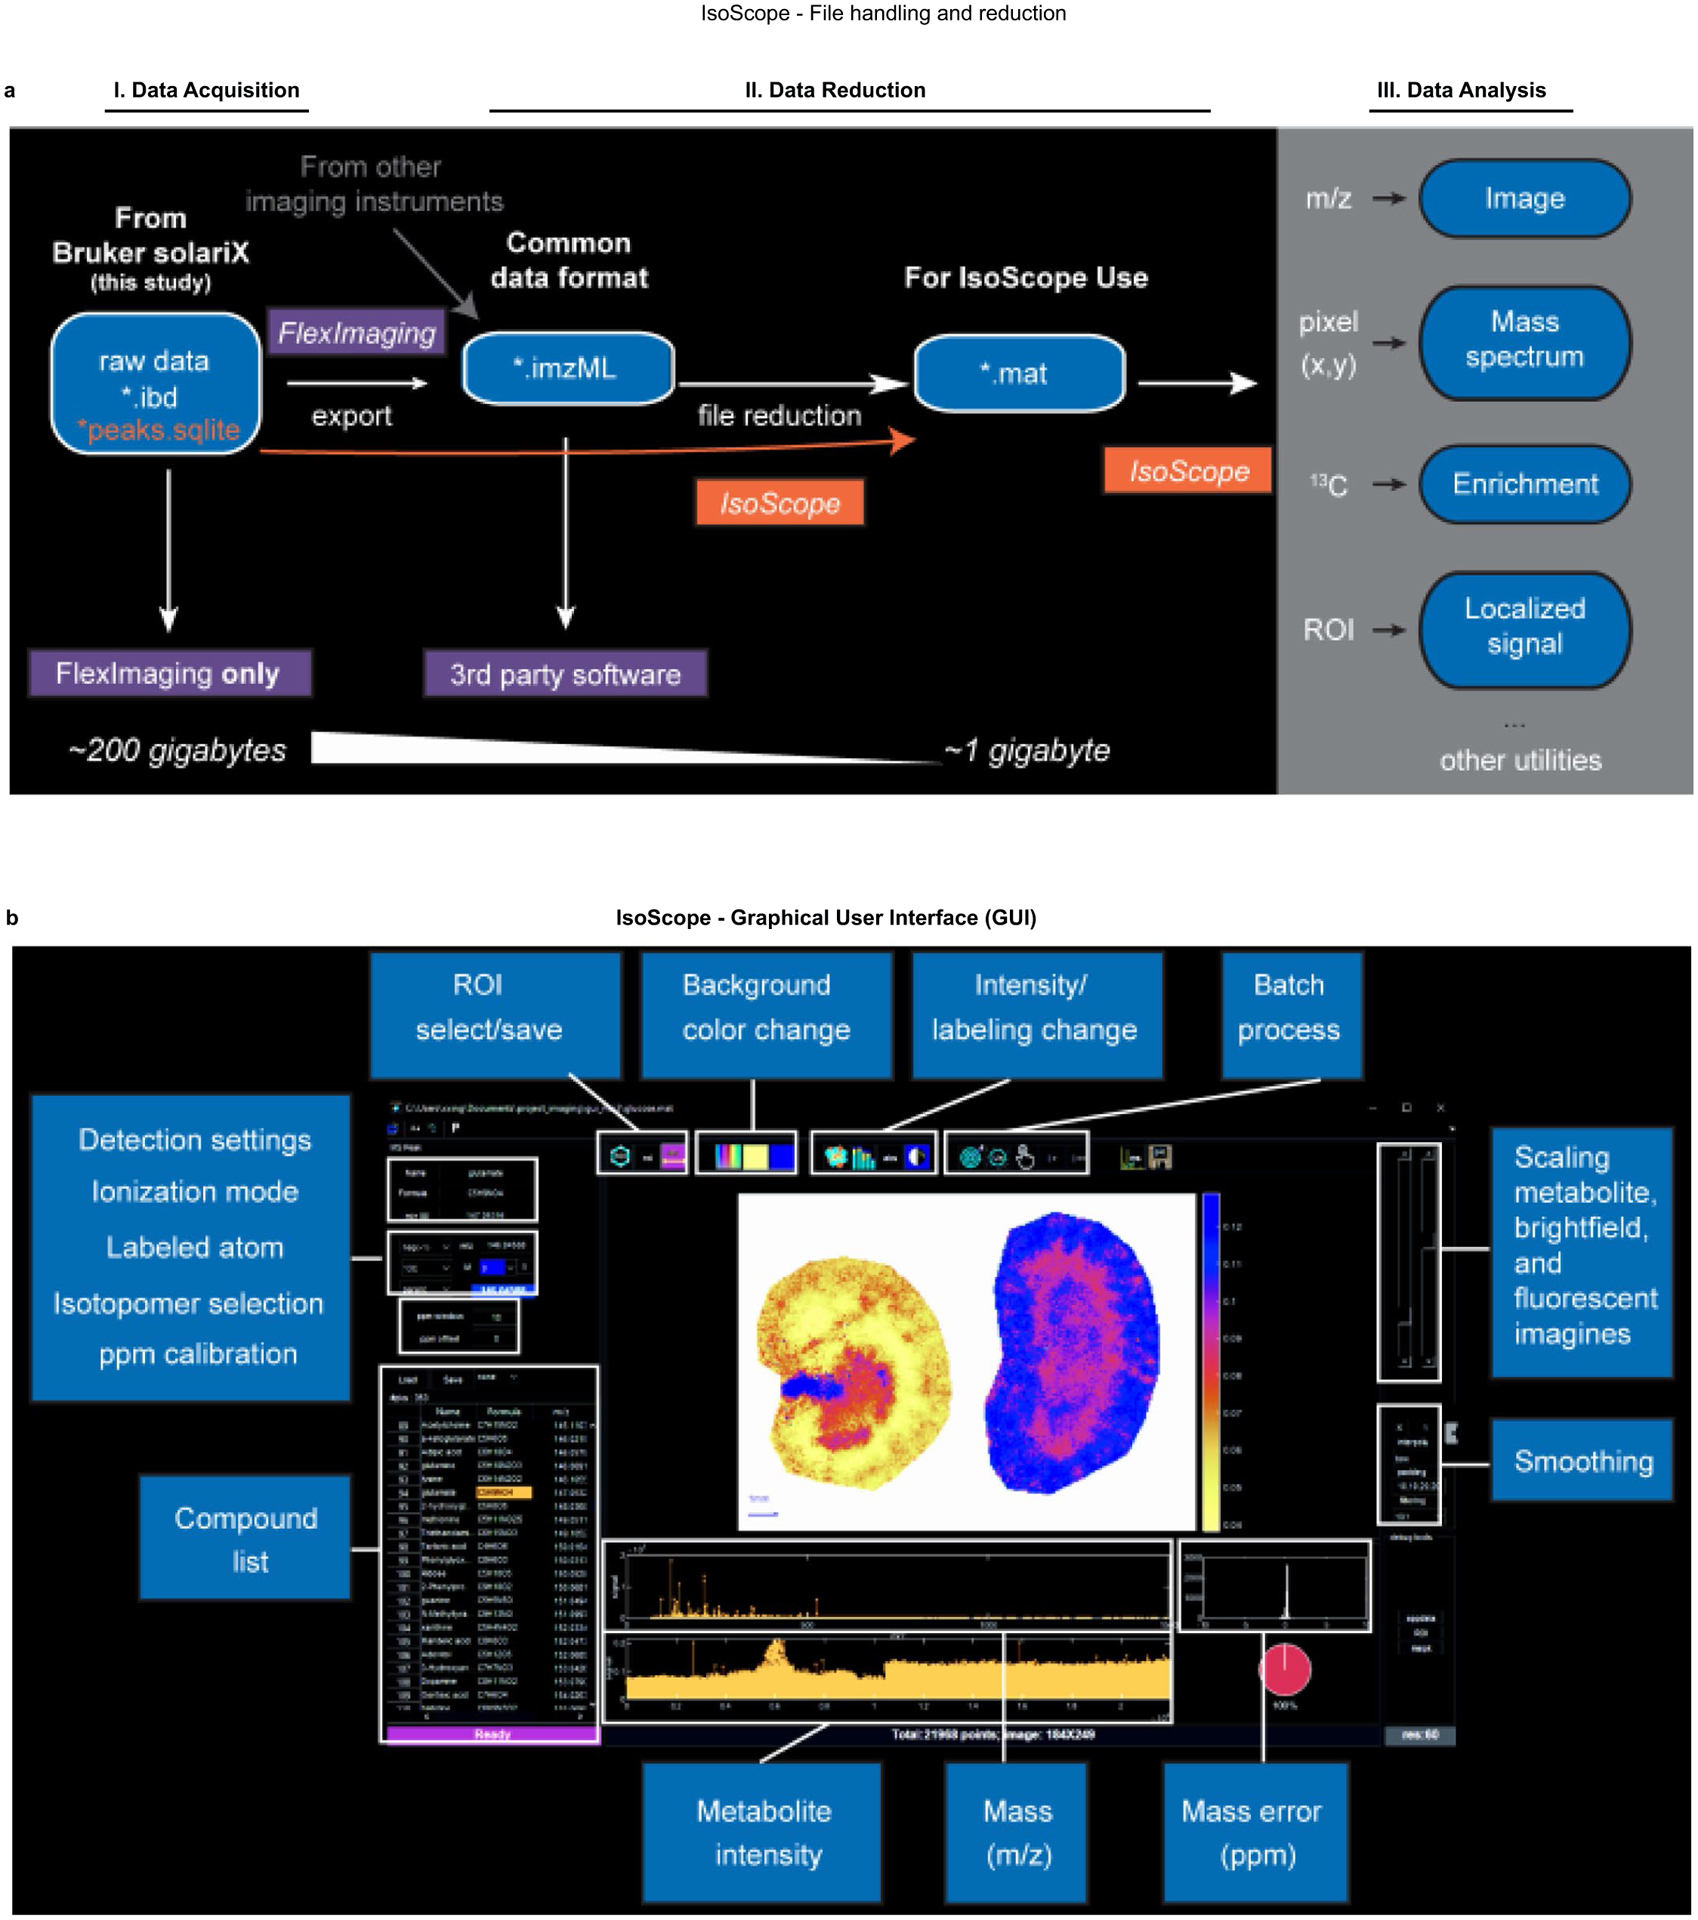
a. Workflow for file loading into IsoScope and options for data visualization within IsoScope. b. Graphical user interface.
Extended Data Fig. 4 |. Direct contributions to malate and TCA-associated amino acids in murine kidney cortex and medulla.
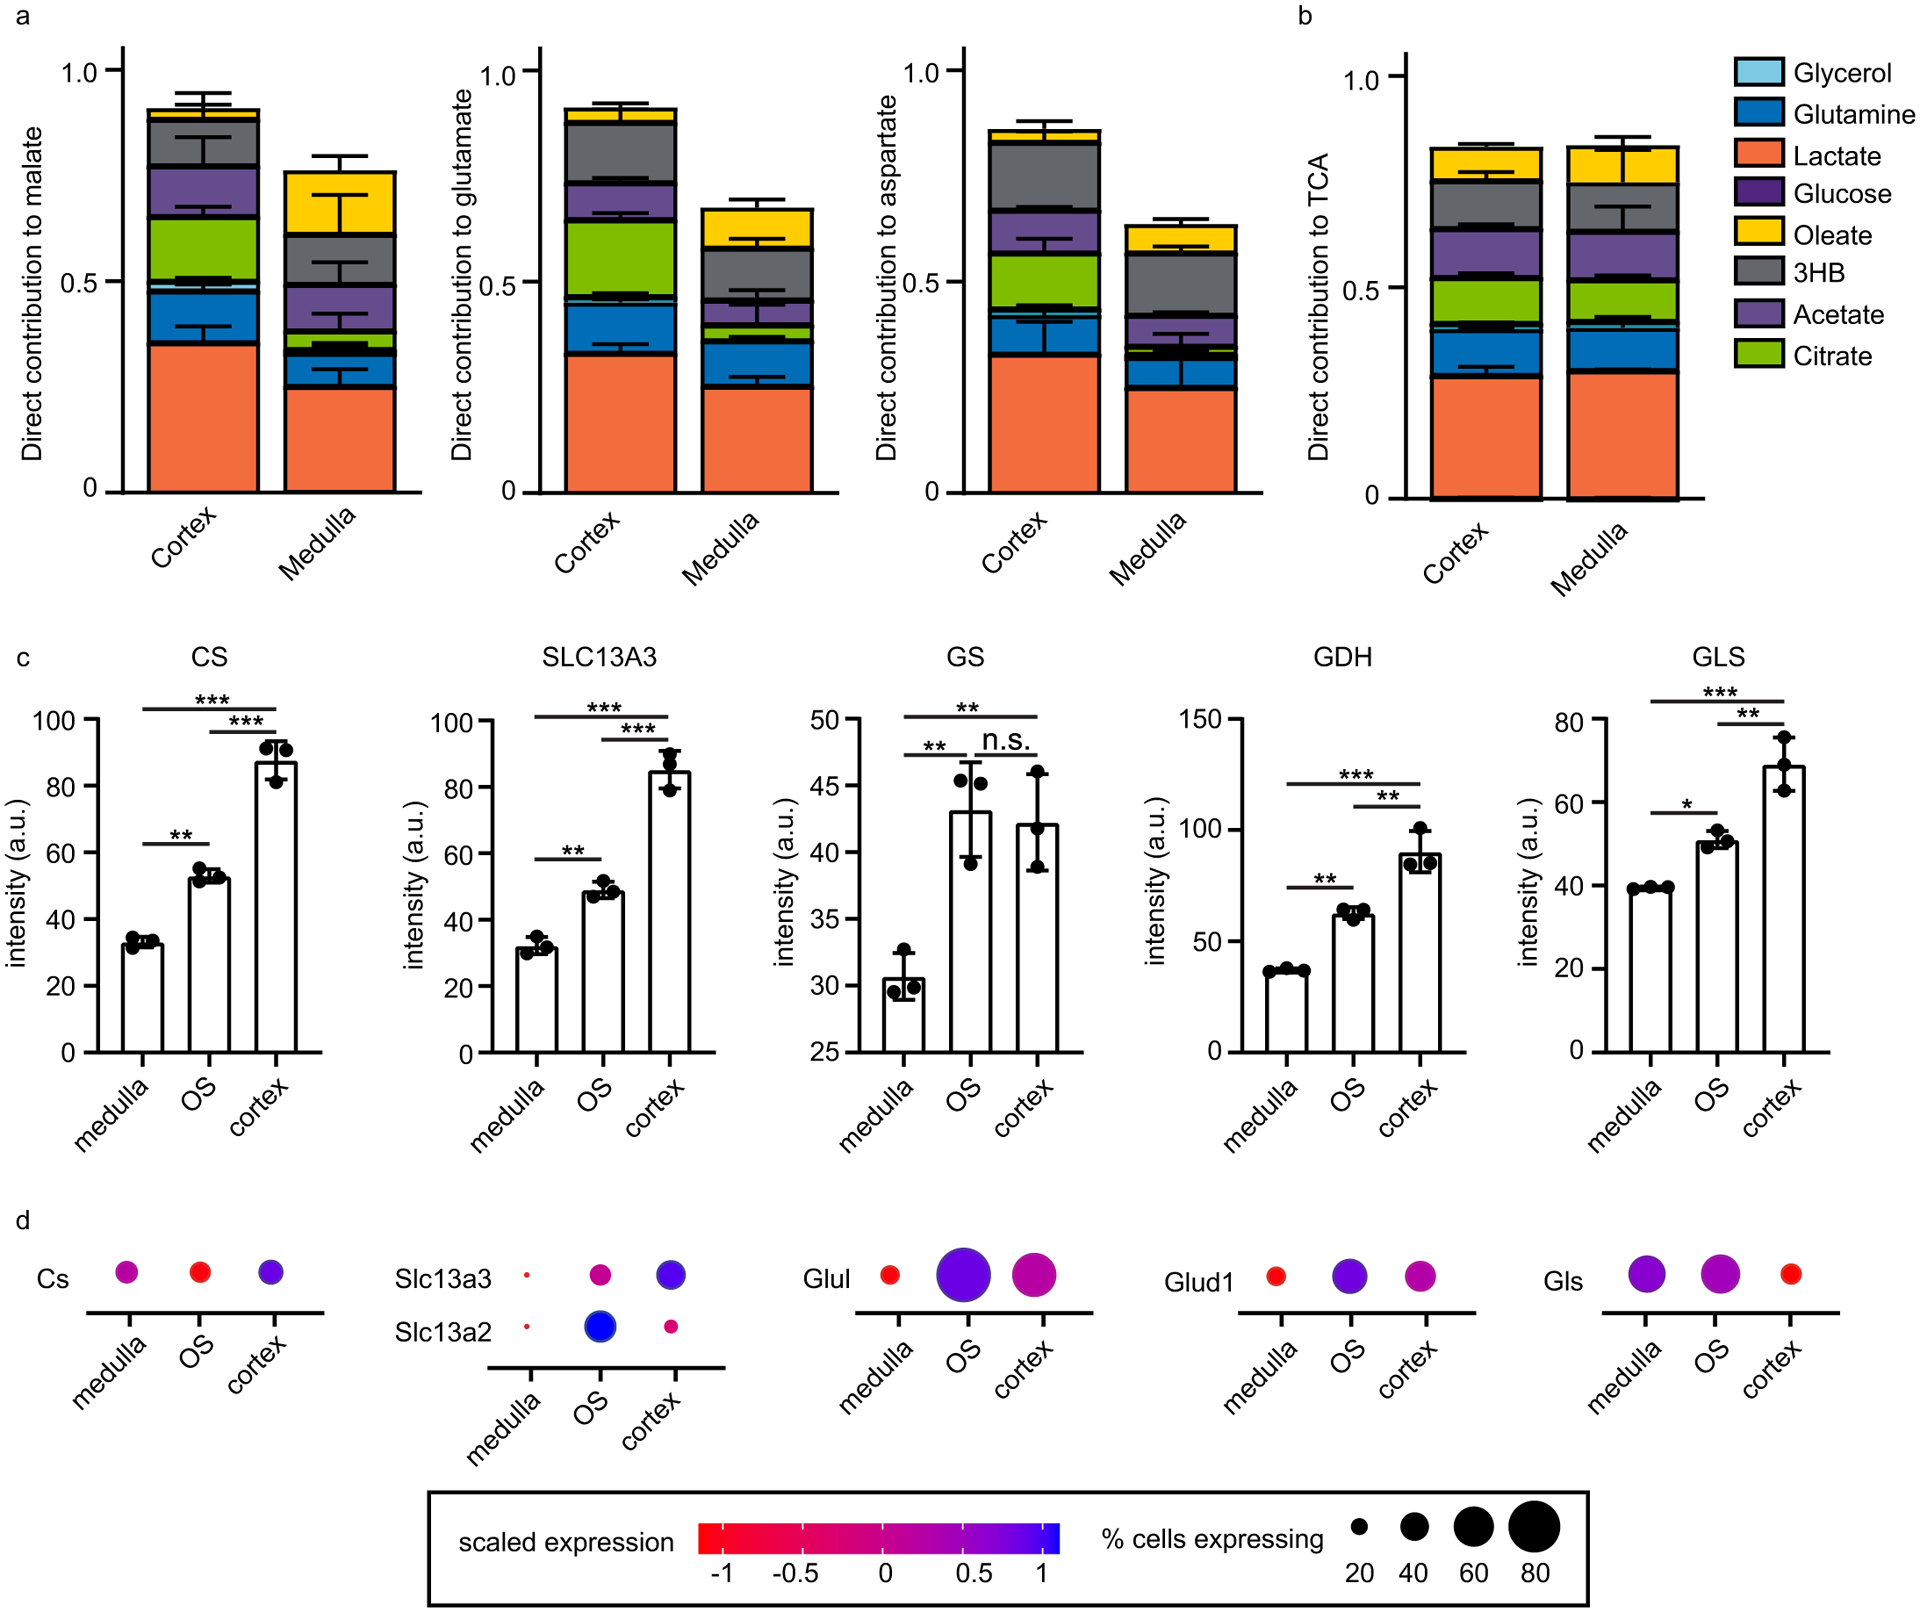
a The direct contribution of each nutrient tracer to malate, glutamate, and aspartate in the cortex and medulla of the murine kidney. b The direct contribution of each of the nutrient tracers to the metabolites in equilibrium with TCA cycle intermediates by LC–MS (homogenized tissue slice) compared to MALDI (whole tissue area). c Quantification of fluorescence intensity in 3 ROIs per region of the kidney in images in Fig. 3b, d. Groups were compared by one-way ANOVA. *** indicates p value <0.0001, ** p < 0.001, * p < 0.05, n.s. not significant. d Region-specific expression levels and percent of cells expressing each metabolic enzyme based on single-cell RNA-sequencing of murine kidney. n = 3 for all tracers. Data are mean + /− s.d.
Extended Data Fig. 5 |. Co-registration of ion images with h&E-stained brain sections.
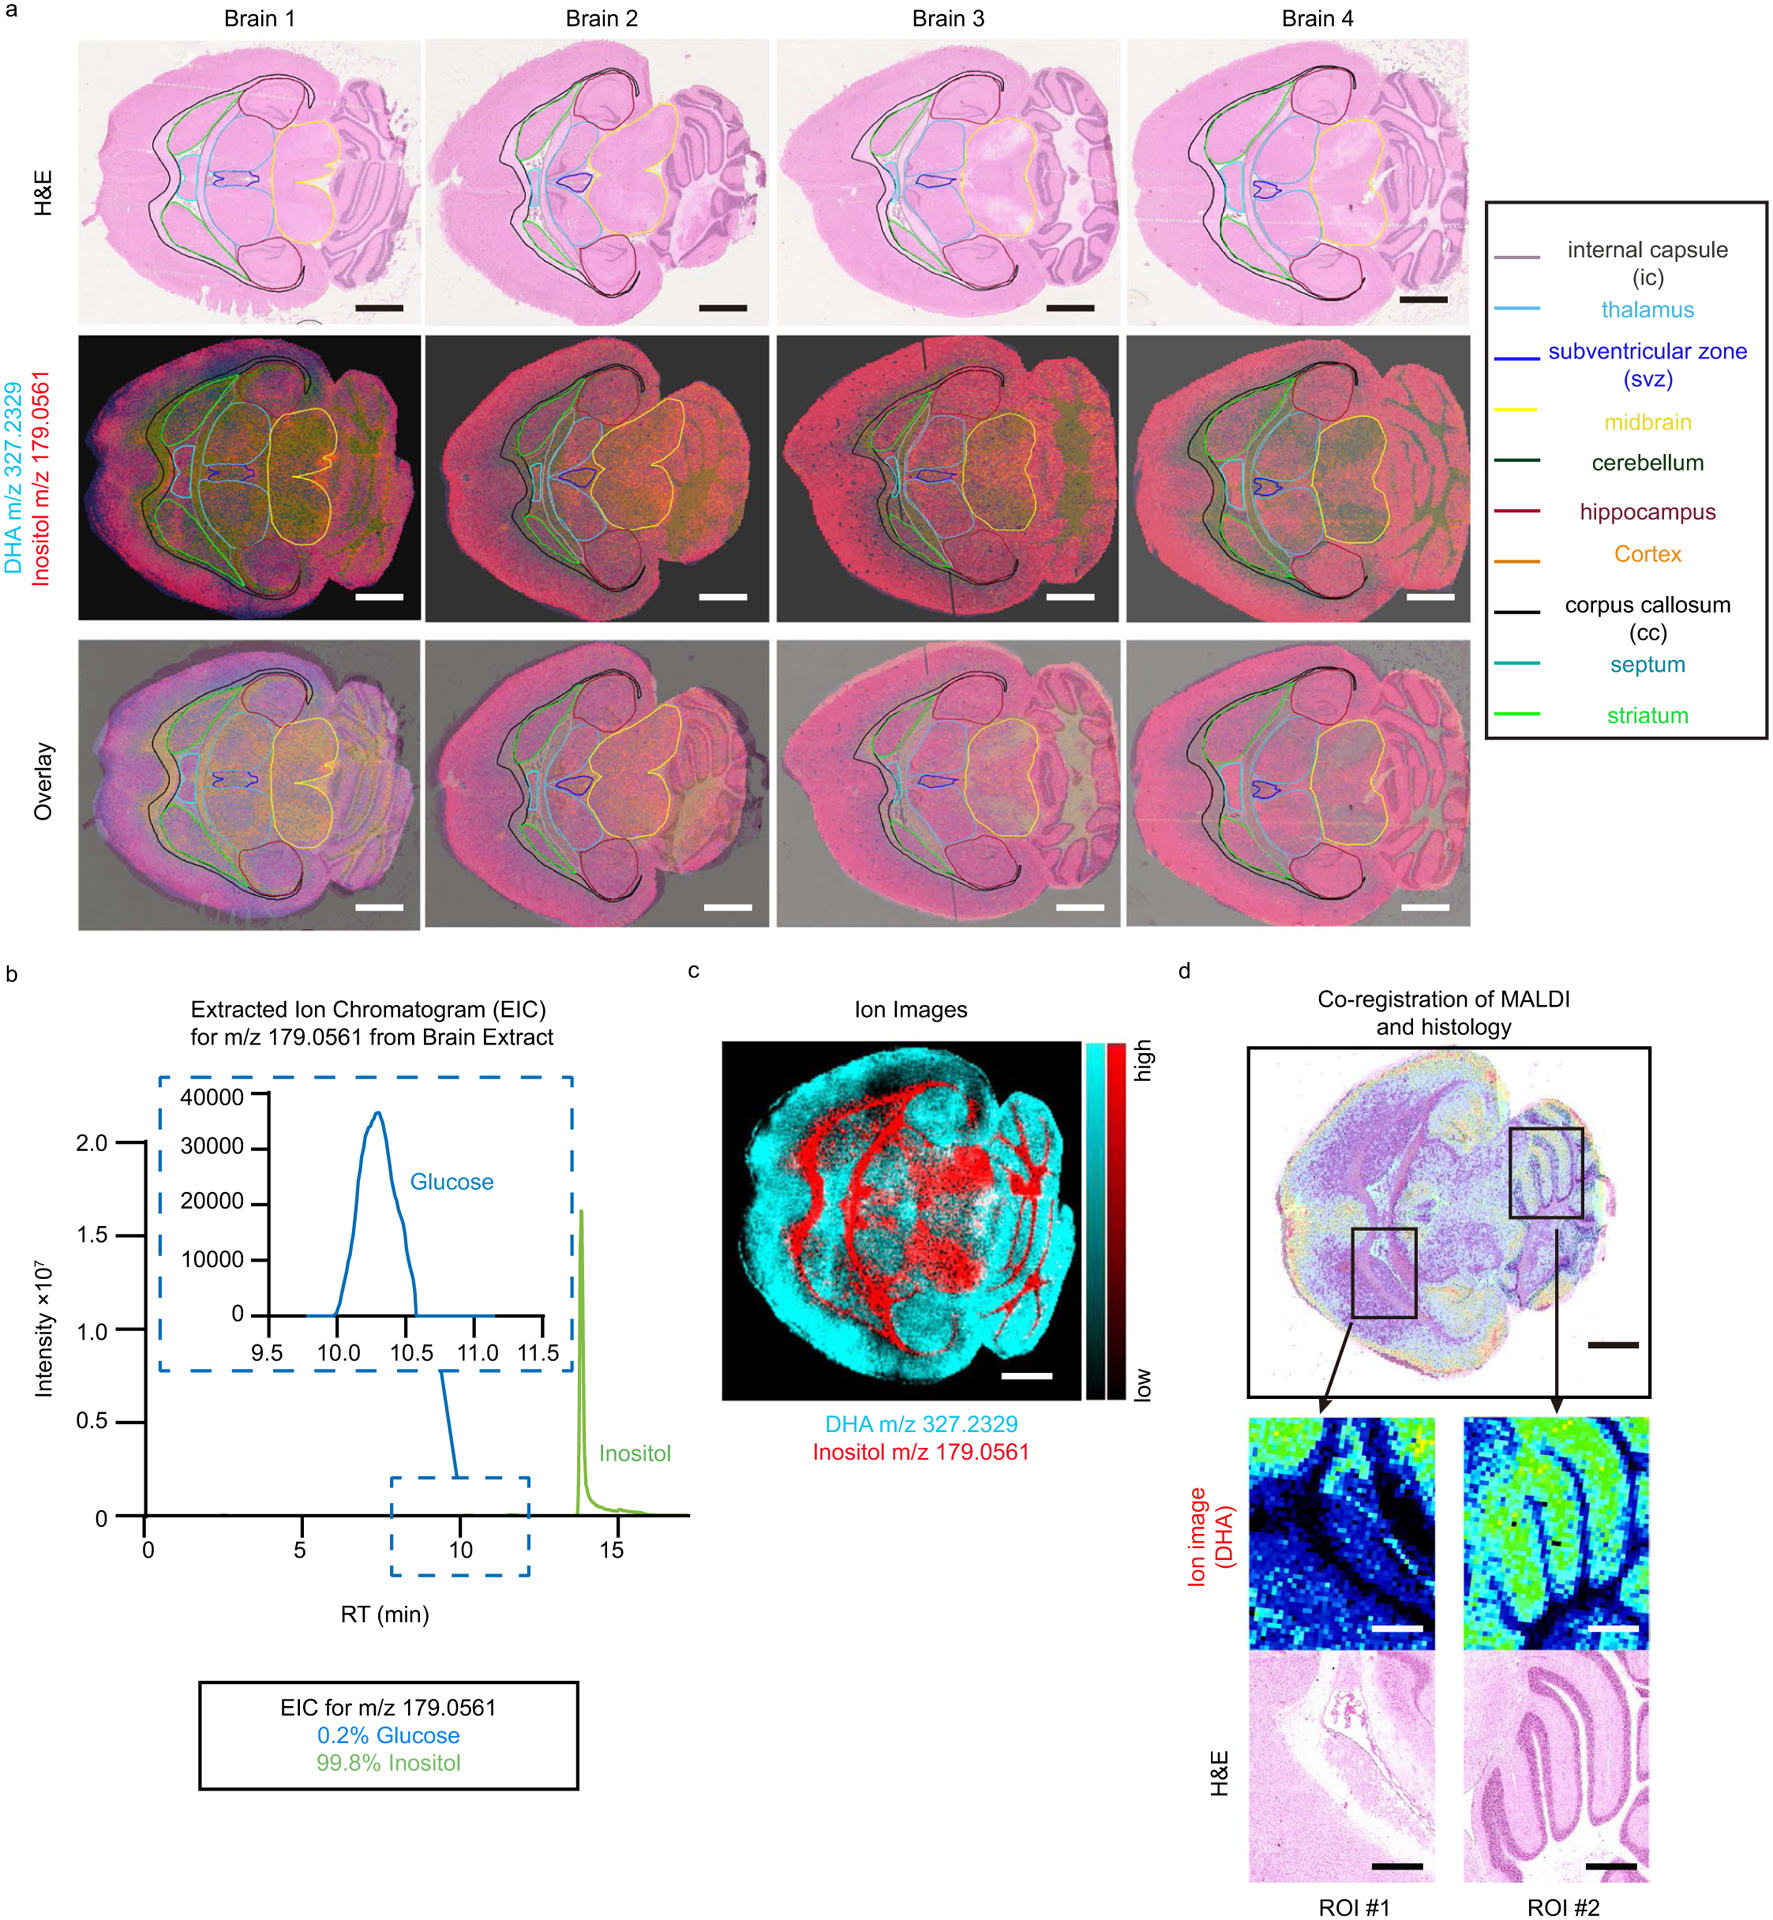
a. Representative H&e staining (top row), ion images for glucose/inositol (m/z 179.0561) and DHA (m/z 327.2329) (middle row), and overlay of H&e with glucose/inositol and DHA (bottom row). b. LC-MS analysis shows that inositol is the dominant ion of m/z 179.0561 in the brain. c. Alternative color representation of the ions used to define brain regions: glucose/inositol (m/z 179.0561) (red) and DHA (m/z 327.2329) (cyan). d. Magnification of ion intensity of DHA and its co-registration with H&e using IsoScope. Scale bars: 1 mm.
Extended Data Fig. 6 |. Glutamate levels in different organs and fractional contribution of carbon-labeled substrates to glutamate in mice fed normal or ketogenic diet.
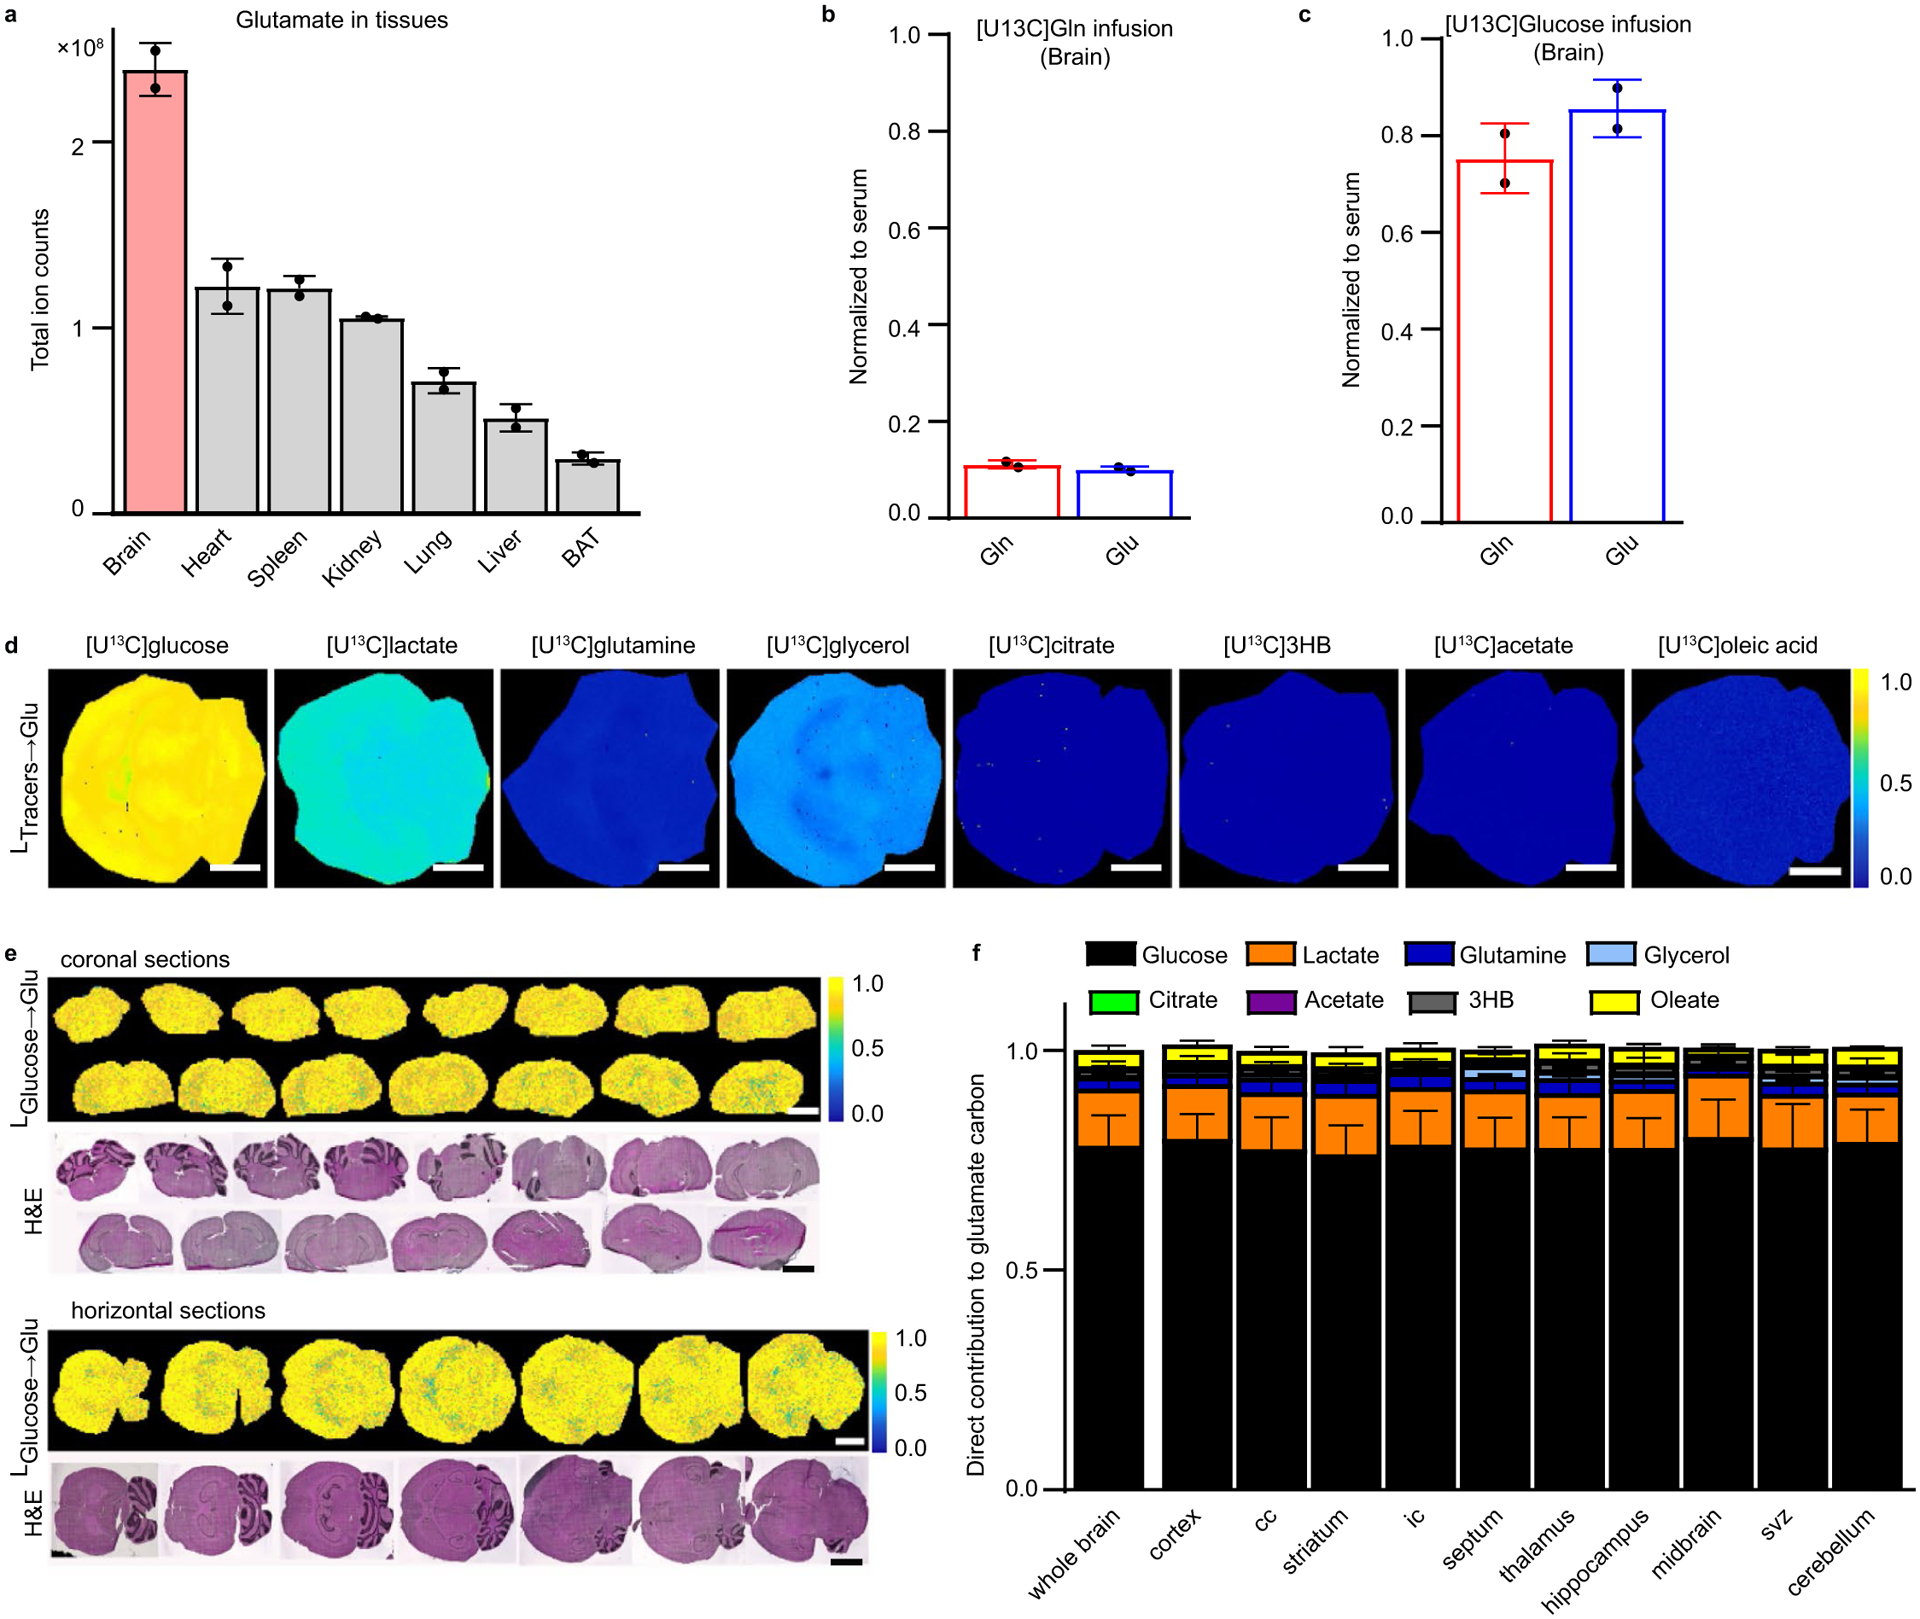
a. Relative glutamate levels in organs of the mouse. n = 2. (BAT = brown adipose tissue). b. Average carbon atom labeling of glutamine and glutamate in the brain normalized to serum after [U-13C]glutamine infusion. n = 2. c. Average carbon labeling of glutamine and glutamate in the brain normalized to serum after [U-13C]glucose infusion. n = 2. d. Iso-imaging of glutamate labeling in the murine brain from the indicated U-13C-tracers. Colors reflect the average carbon atom labeling of glutamate spatially resolved in the brain ( where n = 5 as glutamate has five carbons, and Mi is the ratio of glutamate’s M + i form) normalized to the average carbon atom labeling of the infused tracer in serum. e. Horizontal and coronal sections of the murine brain showing homogeneous normalized labeling of glutamate by [U-13C]glucose throughout the entire organ. f. Direct carbon contributions to glutamate in different regions of the murine brain. Calculated from data in Fig. 4c and extended Data Fig. 5d. Scale bar: 700 μm, Data are mean + /− s.d. n = 3 for all experiments unless otherwise indicated.
Extended Data Fig. 7 |. Fractional contribution of nitrogen-labeled substrates to glutamate.
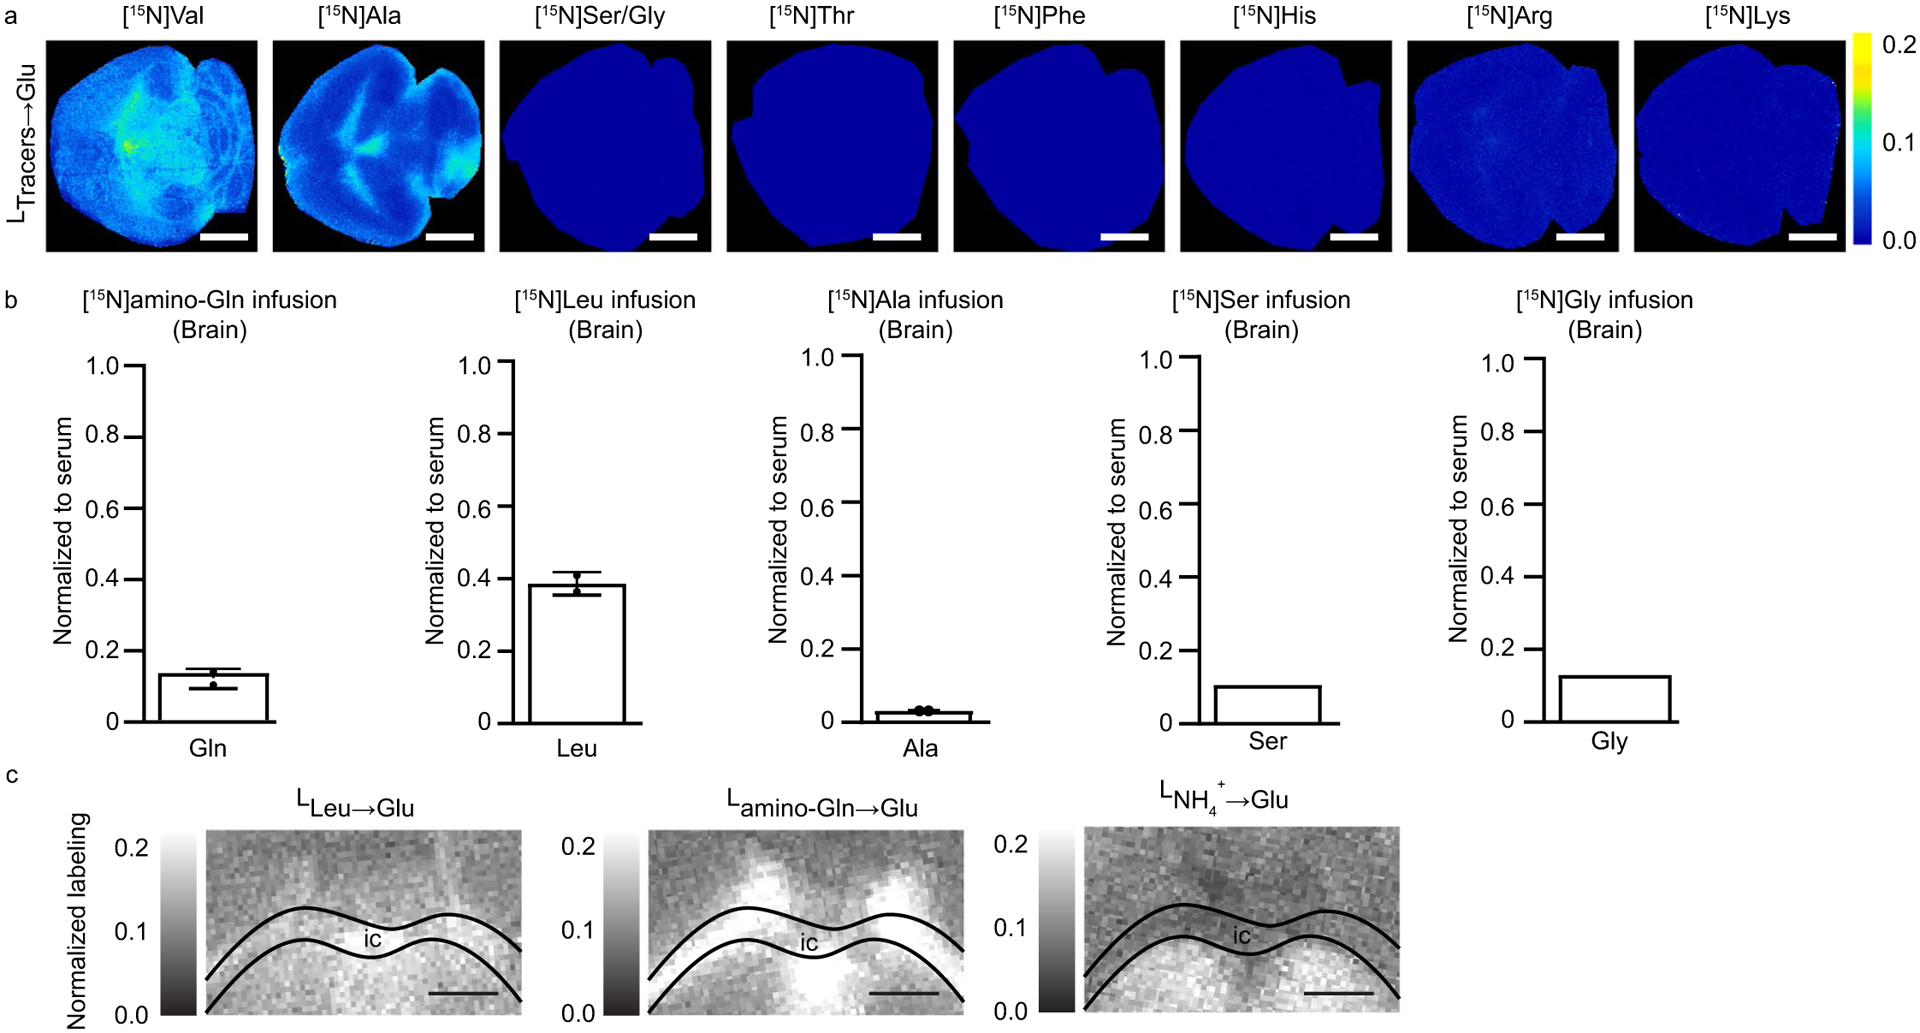
a. Normalized glutamate nitrogen labeling in the murine brain from the indicated 15N-tracers. Colors reflect the 15N-labeling fraction of glutamate spatially resolved in the brain normalized to labeling of the infused tracer in serum. b. 15N-labeling of the indicated tracer metabolite in the brain normalized to serum. (n=1 for 15N Ser and 15N Gly infusion) c. Magnification of internal capsule IC (Fig. 4e) and annotation using overlay of H&e and contribution to brain glutamate from circulating nitrogen sources. Scale bar: 700 μm, Data are mean + /− s.d. n = 3 for all experiments unless otherwise indicated.
Supplementary Material
Acknowledgements
This work was supported by the National Institutes of Health Pioneer award 1DP1DK113643 (J.D.R.), the Paul G. Allen Family Foundation grant 0034665 (J.D.R. and S.M.D.) and a Rutgers Cancer Institute of New Jersey New Investigator Award from the Cancer Center Support Grant P30 CA072720 (S.M.D.). We thank members of the Rabinowitz and Davidson Laboratories for scientific discussions and IsoScope feedback.
Footnotes
Online content
Any methods, additional references, Nature Research reporting summaries, source data, extended data, supplementary information, acknowledgements, peer review information; details of author contributions and competing interests; and statements of data and code availability are available at https://doi.org/10.1038/s41592-021-01378-y.
Reporting Summary. Further information on research design is available in the Nature Research Reporting Summary linked to this article.
Code availability
IsoScope was developed in MATLAB. MATLAB code and the users’ manual for IsoScope are available for non-commercial use in GitHub (https://github.com/xxing9703/Isoscope).
Competing interests
J.D.R. is a member of the Rutgers Cancer Institute of New Jersey and the University of Pennsylvania Diabetes Research Center; a co-founder and stockholder in Toran, Sofro and Serien Therapeutics; and advisor and stockholder in Agios Pharmaceuticals, Kadmon Pharmaceuticals, Bantam Pharmaceuticals, Colorado Research Partners, Rafael Pharmaceuticals, Barer Institute and L.E.A.F. Pharmaceuticals. S.M.D. is an associate member of Rutgers Cancer Institute of New Jersey. All other authors declare no competing interests.
Extended data is available for this paper at https://doi.org/10.1038/s41592-021-01378-y.
Supplementary information The online version contains supplementary material available at https://doi.org/10.1038/s41592-021-01378-y.
Data availability
All MALDI MSI data in .mat format were deposited in FigShare at https://doi.org/10.6084/m9.figshare.15482112 (for kidneys) and https://doi.org/10.6084/m9.figshare.15505848 (for brains). Source data are provided with this paper.
References
- 1.Hui S et al. Glucose feeds the TCA cycle via circulating lactate. Nature 551, 115–118 (2017). [DOI] [PMC free article] [PubMed] [Google Scholar]
- 2.Yankeelov TE, Abramson RG & Quarles CC Quantitative multimodality imaging in cancer research and therapy. Nat. Rev. Clin. Oncol 11, 670–680 (2014). [DOI] [PMC free article] [PubMed] [Google Scholar]
- 3.Wilson DM & Kurhanewicz J Hyperpolarized 13C MR for molecular imaging of prostate cancer. J. Nucl. Med. Publ. Soc. Nucl. Med 55, 1567–1572 (2014). [DOI] [PMC free article] [PubMed] [Google Scholar]
- 4.Zhang Z, Cheng X, Zhao Y & Yang Y Lighting up live-cell and in vivo central carbon metabolism with genetically encoded fluorescent sensors. Annu. Rev. Anal. Chem 13, 293–314 (2020). [DOI] [PubMed] [Google Scholar]
- 5.Zhang L et al. Spectral tracing of deuterium for imaging glucose metabolism. Nat. Biomed. Eng 3, 402–413 (2019). [DOI] [PMC free article] [PubMed] [Google Scholar]
- 6.Gilmore IS, Heiles S & Pieterse CL Metabolic imaging at the single-cell scale: recent advances in mass spectrometry imaging. Annu. Rev. Anal. Chem 12, 201–224 (2019). [DOI] [PubMed] [Google Scholar]
- 7.Caprioli RM Imaging mass spectrometry: molecular microscopy for the new age of biology and medicine. Proteomics 16, 1607–1612 (2016). [DOI] [PMC free article] [PubMed] [Google Scholar]
- 8.Dueñas ME, Larson EA & Lee YJ Toward mass spectrometry imaging in the metabolomics scale: increasing metabolic coverage through multiple on-tissue chemical modifications. Front. Plant Sci 10, 1–11 (2019). [DOI] [PMC free article] [PubMed] [Google Scholar]
- 9.Niehaus M, Soltwisch J, Belov ME & Dreisewerd K Transmission-mode MALDI-2 mass spectrometry imaging of cells and tissues at subcellular resolution. Nat. Methods 16, 925–931 (2019). [DOI] [PubMed] [Google Scholar]
- 10.Jang C, Chen L & Rabinowitz JD Metabolomics and isotope tracing. Cell 173, 822–837 (2018). [DOI] [PMC free article] [PubMed] [Google Scholar]
- 11.Davidson SM et al. Environment impacts the metabolic dependencies of RAS-driven non-small cell lung cancer. Cell Metab. 23, 517–528 (2016). [DOI] [PMC free article] [PubMed] [Google Scholar]
- 12.Hattori K et al. Paradoxical ATP elevation in ischemic penumbra revealed by quantitative imaging mass spectrometry. Antioxid. Redox Signal 13, 1157–1167 (2010). [DOI] [PMC free article] [PubMed] [Google Scholar]
- 13.Sugiura Y et al. Visualization of in vivo metabolic flows reveals accelerated utilization of glucose and lactate in penumbra of ischemic heart. Sci. Rep 6, 32361 (2016). [DOI] [PMC free article] [PubMed] [Google Scholar]
- 14.Wang J et al. MALDI-TOF MS imaging of metabolites with a N-(1-naphthyl) ethylenediamine dihydrochloride matrix and its application to colorectal cancer liver metastasis. Anal. Chem 87, 422–430 (2015). [DOI] [PubMed] [Google Scholar]
- 15.Wang ZM et al. Specific metabolic rates of major organs and tissues across adulthood: evaluation by mechanistic model of resting energy expenditure. Am. J. Clin. Nutr 92, 1369–1377 (2010). [DOI] [PMC free article] [PubMed] [Google Scholar]
- 16.Chen Y, Fry BC & Layton AT Modeling glucose metabolism in the kidney. Bull. Math. Biol 78, 1318–1336 (2016). [DOI] [PMC free article] [PubMed] [Google Scholar]
- 17.TeSlaa T et al. The source of glycolytic intermediates in mammalian tissues. Cell Metab. 33, 367–378.e5 (2021). [DOI] [PMC free article] [PubMed] [Google Scholar]
- 18.Hui S et al. Quantitative fluxomics of circulating metabolites. Cell Metab. 32, 676–688.e4 (2020). [DOI] [PMC free article] [PubMed] [Google Scholar]
- 19.Ross BD, Espinal J & Silva P Glucose metabolism in renal tubular function. Kidney Int. 29, 54–67 (1986). [DOI] [PubMed] [Google Scholar]
- 20.Wheless JW History of the ketogenic diet. Epilepsia 49 (Suppl.), 3–5 (2008). [DOI] [PubMed] [Google Scholar]
- 21.Cooper AJ & Jeitner TM Central role of glutamate metabolism in the maintenance of nitrogen homeostasis in normal and hyperammonemic brain.Biomolecules 6, 16 (2016). [DOI] [PMC free article] [PubMed] [Google Scholar]
- 22.Murashige D et al. Comprehensive quantification of fuel use by the failing and nonfailing human heart. Science 370, 364–368 (2020). [DOI] [PMC free article] [PubMed] [Google Scholar]
- 23.Jang C et al. Metabolite exchange between mammalian organs quantified in pigs. Cell Metab. 30, 594–606 (2019). [DOI] [PMC free article] [PubMed] [Google Scholar]
- 24.Marx V Method of the year: spatially resolved transcriptomics. Nat. Methods 18, 9–14 (2021). [DOI] [PubMed] [Google Scholar]
- 25.Rodriques SG et al. Slide-seq: a scalable technology for measuring genome-wide expression at high spatial resolution. Science 363, 1463–1467 (2019). [DOI] [PMC free article] [PubMed] [Google Scholar]
- 26.Agrawal S et al. El-MAVEN: a fast, robust, and user-friendly mass spectrometry data processing engine for metabolomics. Methods Mol. Biol 1978, 301–321 (2019). [DOI] [PubMed] [Google Scholar]
- 27.Ransick A et al. Single-cell profiling reveals sex, lineage, and regional diversity in the mouse kidney. Dev. Cell 51, 399–413 (2019). [DOI] [PMC free article] [PubMed] [Google Scholar]
- 28.Butler A, Hoffman P, Smibert P, Papalexi E & Satija R Integrating single-cell transcriptomic data across different conditions, technologies, and species. Nat. Biotechnol 36, 411–420 (2018). [DOI] [PMC free article] [PubMed] [Google Scholar]
Associated Data
This section collects any data citations, data availability statements, or supplementary materials included in this article.
Supplementary Materials
Data Availability Statement
All MALDI MSI data in .mat format were deposited in FigShare at https://doi.org/10.6084/m9.figshare.15482112 (for kidneys) and https://doi.org/10.6084/m9.figshare.15505848 (for brains). Source data are provided with this paper.


