



Abstract
The lack of standardized methods and large differences in virus concentration and extraction workflows have hampered Severe Acute Respiratory Syndrome (SARS-CoV-2) wastewater surveillance and data reporting practices. Numerous studies have shown that adsorption-extraction (AE) method holds promise, yet several uncertainties remain regarding the optimal AE workflow. Several procedural components may influence the recovered concentrations of target nucleic acid, including membrane types, homogenization instruments, speed and duration, and lysis buffer. In this study, 42 different AE workflows that varied these components were compared to determine the optimal workflow by quantifying endogenous SARS-CoV-2, human adenovirus 40/41 (HAdV 40/41), and a bacterial marker gene of fecal contamination (Bacteroides HF183). Our findings suggest that the workflow chosen had a significant impact on SARS-CoV-2 concentrations, whereas it had minimal impact on HF183 and no effect on HAdV 40/41 concentrations. When comparing individual components in a workflow, such as membrane type (MF-Millipore™ 0.45 μm MCE vs. Isopore™ 0.40 μm), we found that they had no impact on SARS-CoV-2, HAdV 40/41, and HF183 concentrations. This suggests that at least some consumables and equipment are interchangeable. Buffer PM1 + TRIzol-based workflows yielded higher concentrations of SARS-CoV-2 than other workflows. HF183 concentrations were higher in workflows without chloroform. Similarly, higher homogenization speeds (5000–10,000 rpm) led to increased concentrations of SARS-CoV-2 and HF183 but had no effect on HAdV 40/41. Our findings indicate that minor enhancements to the AE workflow can improve the recovery of viruses and bacteria from the wastewater, leading to improved outcomes from wastewater surveillance efforts.
Keywords: WBE, Adsorption-extraction, Centrifugation, SARS-CoV-2, HAdV 40/41, HF183
Graphical Abstract

1. Introduction
Wastewater surveillance has become an effective tool for monitoring human populations for infectious pathogens, as these pathogens are often excreted in the feces of infected individuals (Wigginton et al., 2015; Zhou et al., 2017). It is an invaluable tool for public health management of Coronavirus Disease 2019 (COVID-19) globally, with wastewater surveillance programs becoming common during the pandemic. The approach entails monitoring the quantities of Severe Acute Respiratory Syndrome Coronavirus 2 (SARS-CoV-2) genetic fragments in wastewater using quantitative PCR (qPCR) and reverse transcription qPCR (RT-qPCR), enabling many countries to monitor and examine COVID-19 prevalence within communities (Ahmed et al., 2020a; La Rosa et al., 2020; Randazzo et al., 2020; Haramoto et al., 2020; Medema et al., 2020; Sherchan et al., 2020; Wu et al., 2020). In some cases, SARS-CoV-2 surveillance has acted as an early warning system, detecting the presence of genetic fragments in wastewater samples 1–3 weeks before clinical cases emerged (Medema et al., 2020; Peccia et al., 2020; Randazzo et al., 2020; Ahmed et al., 2021a; Hata et al., 2021).
Furthermore, wastewater surveillance has demonstrated its utility in facilitating small-scale population surveillance on a localized scale, including discrete areas like dormitories, hospitals, prisons, and other vulnerable communities (Prado et al., 2021; Lu et al., 2022; Acosta et al., 2021). Historically, the implementation of wastewater surveillance of viruses commenced with monitoring poliovirus (WHO, 2003; Garg et al., 2018), but the recent advancements have broadened its scope to encompass the monitoring of additional viruses such as influenza virus (IAV), rhinovirus (RhV), respiratory syncytial virus (RsV), and monkeypox virus (MPV) (Dumke et al., 2022; Ahmed et al., 2023a; De Jonge et al., 2022).
Despite sustained global attention on wastewater surveillance for pathogenic agents, a lack of consensus persists regarding the most efficient workflows for concentrating and extracting genetic fragments of viruses from the complex wastewater matrix. Different workflows have varying sensitivity for detection and accurate quantification of viral genetic fragments. The recovery of viruses and associated nucleic acid from wastewater exhibits considerable variability depending on the procedural components used within the chosen workflow, with the recovery range spanning several orders of magnitude (Pecson et al., 2021). Moreover, the efficiency of virus DNA/RNA recovery from wastewater samples varies between different wastewater treatment plants (WWTPs) and within the same WWTP, despite using identical concentration and extraction workflow (Ahmed et al., 2023b). These discrepancies likely stem from variations in wastewater composition and the state of the virus in wastewater (i.e., intact virion, degraded RNA fragments etc.). As a result, the application of an inefficient virus concentration and extraction method can significantly hinder the effectiveness of wastewater surveillance results, especially when virus levels are low or near the assay limit of detection (ALOD) (Ahmed et al., 2022).
A range of virus concentration and extraction workflows are described in wastewater surveillance research. They include Polyethylene Glycol (PEG) precipitation (Sapula et al., 2021; Barril et al., 2021), adsorption-extraction (AE) with electronegative membranes (Ahmed et al., 2020b), adsorption elution with negatively charged membrane followed by ultrafiltration (Barril et al., 2021), ultrafiltration (Patel et al., 2020; Ahmed et al., 2020b), AlCl3 flocculation (Barril et al., 2021), and skim milk flocculation (Barril et al., 2021) in combination with various extraction processes most often using commercial kits. Among these workflows, the AE workflow has been proven to be highly effective in concentrating a wide spectrum of viruses, including enveloped and non-enveloped DNA and RNA viruses (Ahmed et al., 2021b; Kongprajug et al., 2021; Miura et al., 2021; Ando et al., 2023). The AE workflow utilized in most wastewater surveillance studies encompasses the utilization of a negatively charged membrane with a pore size of 0.45 μm to capture viruses from approximately 50–100 mL of wastewater (Ahmed et al., 2020b; LaTurner et al., 2021). Subsequently, commercially available extraction kits are employed to extract nucleic acid directly from the membranes (Ahmed et al., 2020b; Ahmed et al., 2023a). However, several crucial factors within the AE workflow can significantly affect the accurate quantification of viruses or bacteria in wastewater. These factors include the speed and number of homogenization cycles, membrane type and pore size, the effectiveness of the lysis buffer, and the choice of nucleic acid extraction kits (Ando et al., 2023; Ahmed et al., 2023c; Feng et al., 2023).
The objective of the study was to evaluate the AE workflow by modifying its components such as membrane types, homogenization instruments, speed and number of cycles, and lysis buffer. Wastewater samples were collected from three WWTPs and two endogenous RNA and DNA viruses (SARS-CoV-2, human adenovirus 40/41 (HAdV 40/41)), and one bacterium (Bacteroides HF183) were quantified using quantitative/reverse-transcriptase polymerase reaction (qPCR/RT-qPCR). The study emphasized that certain components in the AE workflow could enhance the quantitative detection of viruses and bacteria in wastewater.
2. Materials and methods
2.1. Sample collection
A total of nine untreated 24-h composite wastewater samples were collected from three WWTPs (referred to as WWTP A, B and C hereafter) in Queensland, Australia, between May 23 and June 6, 2023. These WWTPs primarily treat domestic wastewater from populations of around 150,000, 100,000, and 250,000, respectively. Wastewater samples were collected from the influent of each WWTP using sterile 1-L plastic bottles and delivered cool directly to the laboratory. For this study, three composite wastewater samples from each WWTP were mixed to create one combined wastewater sample (i.e., 3 L).
2.2. Concentration and extraction using AE workflows
Endogenous SARS-CoV-2, HAdV 40/41 and HF183 were concentrated from wastewater samples using 42 AE workflows (Fig. 1). In AE workflow, 25 mM of dissolved MgCl2 (Sigma-Aldrich, St. Louis, Missouri, USA) was added to a 50 mL wastewater sample. After amendment with 0.5 mL of MgCl2, each 50 mL wastewater sample was immediately filtered through MF-Millipore™ 0.45 μm MCE (47 mm; Cat no. HAWP04700) (AE-1 to AE-7; AE-15 to AE-21; AE-29 to AE-35) and Isopore™ 0.40 μm membrane (47 mm; HTTP04700) (Millipore, Burlington, Massachusetts, USA) (AE-8 to AE-14; AE-22 to AE-28; AE-36 to AE-42) separately via a magnetic filter funnel (Pall Corporation, Port Washington, New York, USA) and filter flask (Merck Millipore Ltd.) (Ahmed et al., 2020b). After filtration, the membrane was aseptically rolled and transferred into a 5-mL bead-beating tube (Qiagen, Hilden, Germany) for nucleic acid extraction.
Fig. 1.

Adsorption-extraction (AE) workflows used in this study for qPCR/RT-qPCR quantification of SARS-CoV-2, HAdV 40/41 and Bacteroides HF183.
Qiagen RNeasy® PowerWater® Kit (Cat. No. 14700–50-NF) was used to extract nucleic acid directly from the membranes. Briefly, the 5 mL bead-beating tube containing the membrane was lysed with 990 μL of buffer PM1 (contains guanidine hydrochloride) and 10 μL of 2-Mercaptoethanol (Gibco, Waltham, USA) (will be referred to as PM1 hereafter) for workflows from AE-1 to AE-14, 840 μL of buffer PM1, 10 μL of 2-Mercaptoethanol and 150 μL of chloroform (Sigma-Aldrich, Missouri, USA) (will be referred as PM1+ Chloroform hereafter) for workflows from AE-15 to AE-28, and 840 μL of buffer PM1, 10 μL of 2-Mercaptoethanol and 150 μL of TRIzol reagent (Ambion, Sigma-Aldrich, California, USA) (will be referred to as PM1 + TRIzol hereafter) for workflows from AE-29 to AE-42. The bead-beating tubes containing lysed samples were homogenized with a Precellys 24 homogenizer (Bertin Technologies, Montigny-le-Bretonneux, France) or Vortex-Genie®-2 (Scientific Industries, Bohemia, New York, USA).
Various homogenization parameters were used to homogenize samples with the Precellys. When using buffer PM1, Precelly’s settings included 2 and 3 cycles at 15 s each, at speeds of 10,000 rpm, 7500 rpm, and 5000 rpm, with 10 s intervals. When working with buffer PM1 + chloroform and PM1 + TRIzol, Precelly’s settings also involved 2 and 3 cycles at 15 s each, at speeds of 9000 rpm, 7500 rpm, and 5000 rpm, with 10 s intervals. Vortex-Genie®-2 (Scientific Industries) parameters were 3200 rpm for a duration of 5 min using the horizontal holder (SI-H512). Following homogenization, the tubes underwent centrifugation at 4000 g for 4 min to separate the filter debris and beads from the supernatant. Subsequently, a sample lysate supernatant ranging from 600 to 800 μL in volume was processed according to the manufacturer’s protocol to obtain purified nucleic acids. DNase I solution was omitted from the protocol to isolate both DNA and RNA targets simultaneously. The sample was then eluted with 100 μL of nuclease-free water. The concentrations and quality of nucleic acid samples were measured using DeNovix DS-11 Series Spectrophotometer/Fluorometer (Wilmington, DE, USA). After measurements, nucleic acid samples were stored at −20 °C until qPCR/RT-qPCR analysis.
2.3. PCR inhibition assessment using Sketa22 PCR assay
To evaluate the existence of PCR inhibition in extracted nucleic acid samples, the Sketa22 real-time PCR assay was employed (Haugland et al., 2005). This inhibition assessment involved adding a predetermined copy number (104 gene copies (GC)/reaction) of Oncorhynchus keta (O. keta) DNA to the samples, following the established protocol (Ahmed et al., 2020a). The reference PCR quantification cycle (Cq) values were then compared with the Cq values obtained from all wastewater samples. Any wastewater samples exhibiting Cq values within a 2-quantification cycle (Cq) range of the reference Cq value were deemed to be free from PCR inhibition (Ahmed et al., 2020a). All samples were analyzed alongside three PCR negative controls.
2.4. RT-qPCR and qPCR assays
Previously published RT-qPCR and qPCR assays were utilized for the quantification of SARS-CoV-2 (CDC, 2019), HAdV 40/41 (Ko et al., 2005), and HF183 (Green et al., 2014) as described in Supplementary Table ST1. For the SARS-CoV-2 RT-qPCR, HAdV 40/41 and HF183 qPCR assays, positive controls in the form of gBlocks gene fragments were acquired from Integrated DNA Technologies (Idtdna.com; Coralville, IA, US). The SARS-CoV-2 standard curve was prepared following the methodology described in a previous study (Ahmed et al., 2023b). Standard curves for HAdV 40/41 and HF183 were established using gBlocks, with dilutions ranging from 5 × 10⁶ to 5 × 10⁻¹ GC/reaction. SARS-CoV-2 RT-qPCR analyses were performed in 20 μL reactions using TaqMan™ Fast Virus 1-Step Master Mix (Applied Biosystem, California, USA). SARS-CoV-2 RT-qPCR mixtures contained 5 μL of Supermix, 800 nM of each forward and reverse primer, 200 nM of probe and 5 μL of nucleic acid.
The amplification of HAdV 40/41 and HF183 and was conducted using 20 μL reaction with the QuantiNova Probe PCR Kit (Qiagen, Hilden, Germany). HAdV 40/41 qPCR mixtures using 10 μL of Supermix, 400 nM of each primer, 100 nM of probe, and 5 μL of template nucleic acid. HF183 qPCR mixtures contained 10 μL of Supermix, 1000 nM of each forward and reverse primer, 100 nM of probe and 5 μL of template nucleic acid. The qPCR and RT-qPCR assays were performed on a Bio Rad CFX96 thermal cycler (Bio-Rad Laboratories, Hercules, California, USA) using manual settings for threshold and baseline. All RT-qPCR and qPCR reactions were performed in triplicate, and were analyzed alongside three PCR negative controls.
2.5. Data analysis
In the qPCR/RT-qPCR experiments, samples were classified as positive if amplification was observed in at least 2 out of the 3 replicates within 45 cycles. The threshold values were set up higher than baseline fluorescence (i.e., background noise). All data were tested for normality and homogeneity of variances before statistical analysis using GraphPad software (Prism 9.5.1, La Jolla, CA, USA). The log10/50 mL concentrations of viral genomic copies (GC) resulting from all samples aggregated across three wastewater treatment plants (WWTPs) were compared using one-way analysis of variance (ANOVA) to determine if there were significant distinctions among the AE workflows based on the variables under investigation. Furthermore, the influence of the membrane and homegenization instruments (Precellys 24 homegenizer vs. Vortex-Genie®-2) was assessed for all aggregated data using student’s t-test or Mann-Whitney test if concentration data were not normally distributed. One-way ANOVA was used to assess the influence of lysis buffer on the quantitative detection of endogenous SARS-CoV-2, HAdV 40/41 and HF183 in wastewater samples.
Workflows showing significant difference among the lysis buffers (PM1, PM1 + Chloroform and PM1 + TRIzol) were subject to Tukey’s HSD post-hoc test. If significant difference was observed among lysis buffers, the influence of homogenization speed and number of cycles were compared within each lysis buffer treatment. The influence of homogenization speed (bead-beating and vortex) was assessed using student’s t-test or Mann-Whitney test. The influence of homogenization speed and number of cycles was assessed using two-way ANOVA to determine the main and interaction effect between homogenization speed and number of cycles on quantification of SARS-CoV-2, HAdV 40/41 and HF183. Workflows showing significant difference among different homogenization speeds were subject to Tukey’s HSD post-hoc test. A p value <0.05 was considered to indicate a significant difference.
3. Results
3.1. qPCR and RT-qPCR performance characteristics and quality assurance (QA)/quality control (QC)
The qPCR/RT-qPCR efficiency, linearity, slope, and Y-intercept for each assay are shown in Table 1 and indicates adherence to the recommended performance values outlined in the MIQE guidelines (Bustin et al., 2009). The standard curves exhibited a linear quantification range spanning from 5 × 10⁶ to 5 × 10⁻¹ GC/reaction for all three assays. It is noteworthy that no PCR inhibition was detected in the nucleic acid extracted from any wastewater sample. The concentrations of nucleic acids ranged from 9.40 to 702 ng/μL and A260/280 ratio ranged between 1.80 and 2.10, which is considered of good quality.
Table 1.
Performance characteristics of SARS-CoV-2 RT-qPCR, HAdV 40/41 and Bacteroides HF183 qPCR assays.
| Assays | qPCR/RT-qPCR performance characteristics | |||
|---|---|---|---|---|
| Efficiency (E) (%) | Linearity (r2) | Slope | Y-intercept | |
| SARS-CoV-2 | 93.4 | 0.994 | −3.490 | 40.50 |
| HAdV 40/41 | 96.0 | 1.000 | −3.411 | 39.31 |
| Bacteroides HF183 | 90.1 | 0.999 | −3.586 | 42.97 |
Efficiency: −1 + 10(−1/slope).
3.2. Concentrations of SARS-CoV-2 with AE workflows
The concentrations of SARS-CoV-2 in wastewater samples from the studied WWTPs exhibited variations. In WWTP A, SARS-CoV-2 could not be detected (ND) with workflow AE-3 (PM1-based with bead-beating speed of 5000 rpm), whereas AE-27 workflow (PM1 + Chloroform-based with bead-beating speed of 5000 rpm) yielded the highest concentration (4.38 log10 GC/50 mL) (Fig. 2 and Supplementary Table ST2). In WWTP B, the lowest concentration (2.49 log10 GC/50 mL) was obtained with workflow AE-2 (PM1-based with bead-beating speed of 7500 rpm), and the highest concentration (4.58 log10 GC/50 mL) was achieved with workflow AE-30 (PM1 + TRIzol-based with bead-beating speed of 5000 rpm). In WWTP C, the lowest (2.50 log10 GC/50 mL) and highest (4.51 log10 GC/50 mL) concentrations of SARS-CoV-2 were observed with workflows AE-7 (PM1-based with vortexing speed of 3200 rpm) and AE-40 (PM1 + TRIzol-based with bead-beating speed of 7500 rpm), respectively. The SARS-CoV-2 data obtained from each WWTP were pooled. For pooled dataset, the lowest (2.75 log10 GC/50 mL) concentration of SARS-CoV-2 was observed for workflow AE-2 (PM1-based with bead-beating speed of 7500 rpm), while the highest (4.22 log10 GC/50 mL) concentration was observed for AE-36 (PM1 + TRIzol-based with bead-beating speed of 9000 rpm) and AE-40 (PM1 + TRIzol-based with bead-beating speed of 7000 rpm) workflows. One-way ANOVA was used to assess the significant difference in SARS-CoV-2 GC concentrations in wastewater samples across all 42 workflows. Among the 861 pairwise comparison (i.e., Tukey’s HSD post-hoc test), 60 showed significant differences (Supplementary Table ST5). The concentrations of SARS-CoV-2 obtained with the workflow AE-1 (PM1-based with bead-beating speed of 10,000 rpm) were significantly greater (p < 0.05) than those obtained with AE-2 (PM1-based with bead-beating speed of 7500 rpm) and AE-7 (PM1-based with vortexing speed of 3200 rpm). Workflows AE-29 through 42 except for AE-31 (PM1 + TRIzol-based), showed significantly greater values (p < 0.05) than AE-1, AE-2, AE-5, AE-7, AE-9, AE-16, AE-19, AE-21, AE-23, and AE-26 (PM1 and PM1 + Chloroform-based).
Fig. 2.

Mean concentrations (log10 GC/50 mL) of endogenous SARS-CoV-2 in wastewater samples collected from WWTPs A, B, and C using 42 AE-workflows. Error bars represent the standard deviation for RT-qPCR replicates. The asterisk (*) represents the workflow that resulted in the highest mean concentration of GC/50 mL.
3.3. Concentrations of HAdV 40/41 with AE workflows
The concentrations of HAdV 40/41 in wastewater samples collected from WWTPs displayed variations. Within WWTP A, the concentrations of HAdV 40/41, assessed through the AE-3 (PM1-based with bead-beating speed of 5000 rpm) and AE-2 (PM1-based with bead-beating speed of 7500 rpm) workflows, ranged between 3.03 (the minimum value) and 5.38 log10 GC/50 mL (the maximum value). Such data for all three WWTPs are visually represented in Fig. 3 and Supplementary Table ST3. When employing all 42 workflows, none of the pair-wise comparisons demonstrated significant variations in the concentrations of HAdV 40/41.
Fig. 3.
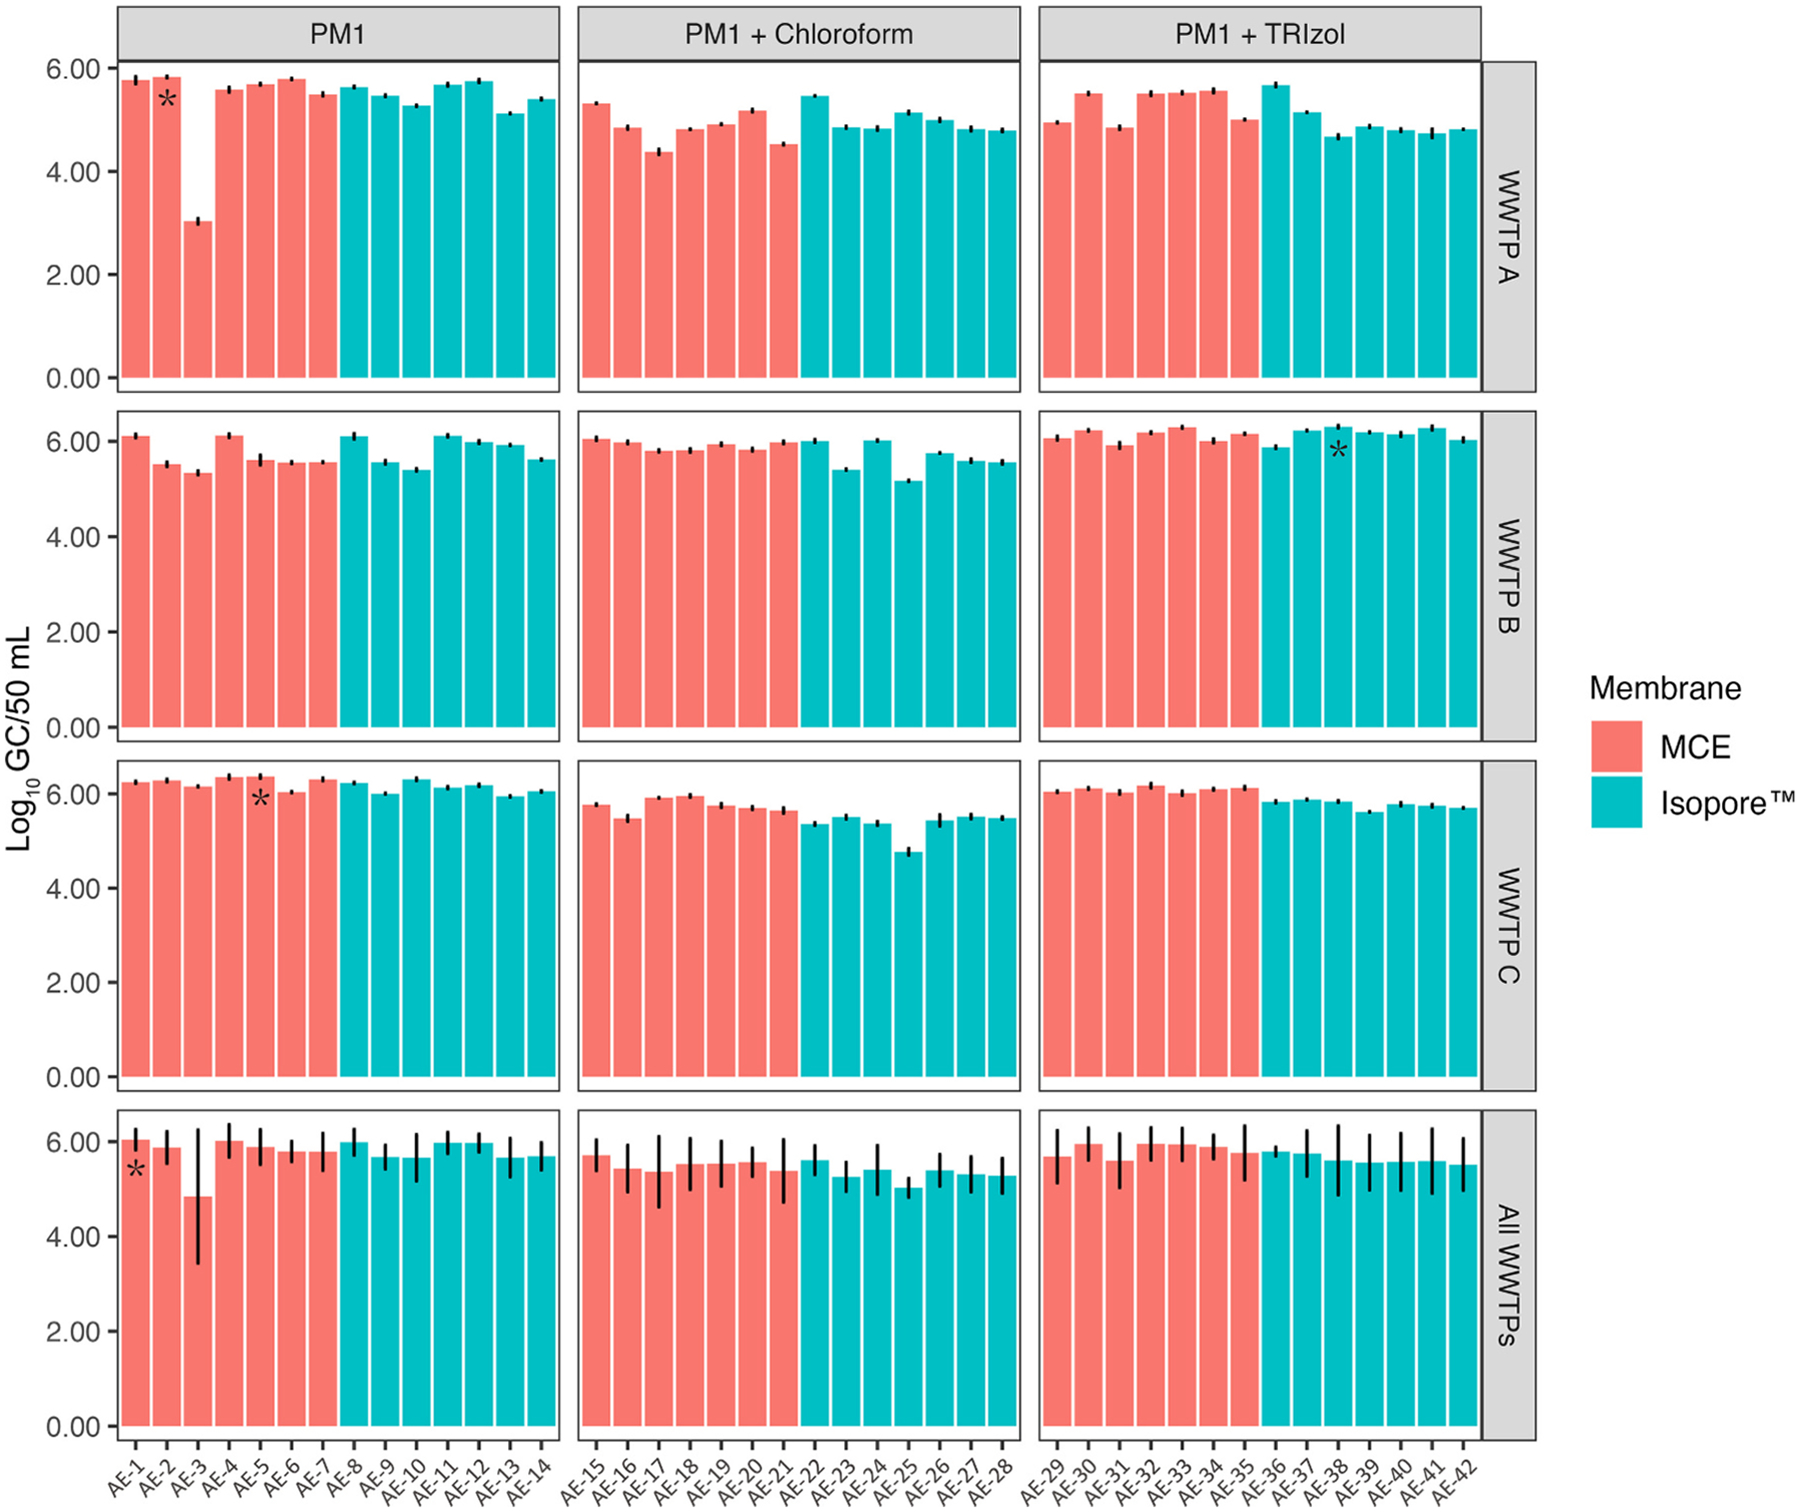
Mean concentrations (log10 GC/50 mL) of endogenous HAdV 40/41 in wastewater samples collected from WWTPs A, B, and C using 42 AE-workflows. Error bars represent the standard deviation for RT-qPCR replicates. The asterisk (*) represents the workflow that resulted in the highest mean concentration of GC/50 mL.
3.4. Concentrations of HF183 with AE workflows
In WWTP A, the concentrations as determined by workflows AE-3 (utilizing PM1 with bead-beating speed of 5000 rpm), and AE-5 (utilizing PM1 with bead-beating speed of 7500 rpm) exhibited a range from 4.64 (the lowest) to 7.67 log10 GC/50 mL (the highest) (Fig. 4 and Supplementary Table ST4). Fig. 4 and Supplementary Table ST4 are also displaying concentrations obtained for HF183 in wastewater samples from WWTP B and C. Among the 861 pairwise comparison, 11 showed significant differences (Supplementary Table ST6). The concentrations of HF183 obtained using the workflow AE-3 (PM1-based with bead-beating speed of 5000 rpm), was significantly lower (p < 0.05) than AE-1, AE-4, AE-8 (PM1-based workflows with bead-beating speed of 10,000 rpm), AE-15, AE-16, AE-18 (PM1 + Chloroform-based workflows with bead-beating speed of 7500 and 9000 rpm), AE-29, AE-30, AE-32, AE-33, and AE-37 (PM1 + TRIzol-based workflows with bead-beating 7500 and 9000 rpm).
Fig. 4.

Mean concentrations (log10 GC/50 mL) of endogenous HF183 in wastewater samples collected from WWTPs A, B, and C using 42 AE-workflows. Error bars represent the standard deviation for RT-qPCR replicates. The asterisk (*) represents the workflow that resulted in the highest mean concentration of GC/50 mL.
3.5. Influence of membranes, lysis buffer, homogenization instruments, speed, and number of cycles on the concentrations of SARS-CoV-2, HAdV 40/41 and HF183
No significant differences (p > 0.05) were observed between MCE and Isopore™ membranes for SARS-CoV-2, HAdV 40/41 and HF183 GC concentrations (Supplementary Tables ST7). However, for SARS-CoV-2, certain combinations of lysis buffer affected the GC levels recovered (Supplementary Table ST8). Specifically, combination of PM1 with TRIzol produced significantly higher GC concentrations than that of PM1 (p < 0.0001) and PM1 + Chloroform (p < 0.0001) while no difference was observed between PM1 and PM1 + Chloroform (p > 0.05) (Supplementary Table ST9). The composition of the lysis buffer mixtures also affected the GC concentrations of HAdV 40/41 and HF183, as both were significantly lower (p < 0.05) using PM1 + Chloroform when compared with PM1 and PM1 + TRIzol (Supplementary Table ST9). For each lysis buffer workflow, no significant differences were observed for the different homogenization speed used for the aggregated dataset (i.e., bead-beating and vortexing) when comparing GC concentrations of SARS-CoV-2, HAdV 40/41 and HF183 (Supplementary Table ST10–12). However, significant differences (p < 0.05) were observed for PM1 workflows where homogenization speed was identified as the main factor influencing the GC concentrations of SARS and HF183, but not HAdV 40/41 (Supplementary Table ST13–15). Homogenization speed at 10,000 rpm yielded significant greater GC concentrations than 7500 rpm for SARS-CoV-2 (p < 0.05), and homogenization speed at 10,000 and 7500 rpm yielded significant greater GC levels than 5000 rpm for HF183 (Supplementary Table ST16). The homogenization cycles had no effect on either analyte.
4. Discussion
In this study, we intentionally refrained from introducing exogenous viruses or bacteria into wastewater samples. The inclusion of gamma-irradiated SARS-CoV-2 could potentially lead to discrepancies, given their distinct structural forms and partitioning behaviors compared to naturally excreted viruses from infected individuals, as elucidated by Kantor et al. (2021). Furthermore, HAdV 40/41 and Bacteroides HF183 naturally exist in substantial quantities within wastewater, negating any requirement for artificially introducing these organisms. Additionally, the recovery rate of an exogenous virus may not provide an accurate representation of the recovery rates for the diverse array of indicator, enteric, and respiratory viruses, each possessing distinct characteristics.
In a review paper, Wong et al. (2012) suggested that capturing viruses on membranes and subsequently performing direct nucleic acid extraction may lead to superior recovery rates when compared to protocols that involve viral elution from membranes. Ahmed et al. (2015) reported that direct nucleic acid extraction of viruses captured on membranes offers improved recovery rates for HAdV and human polyomavirus (HPyV) in tap and river water, compared to using an adsorption/elution-based protocol with negatively charged membranes. The AE protocol with MgCl2 pre-treatment, was also found to be superior in recovering murine hepatitis virus (MHV) from wastewater compared to six other concentration methods including centrifugal filter devices, PEG precipitation, and ultracentrifugation (Ahmed et al., 2020b). Since then, several studies have employed AE method for the quantification of SARS-CoV-2 from wastewater samples with varying lysis buffer, membranes, and homogenization instruments (Jafferali et al., 2021; LaTurner et al., 2021; Sapula et al., 2021; Sharkey et al., 2021; Fonseca et al., 2022; Kumblathan et al., 2023; Othman et al., 2023). However, none of these studies optimized the various components of the AE workflow. Optimization is particularly important as it influences its performance to detect trace quantities of target nucleic acids in a complex wastewater sample (Ahmed et al., 2022).
The goal of the present study was to assess the effectiveness of 42 different AE workflows for quantifying endogenous SARS-CoV-2, HAdV 40/41 and HF183 in untreated wastewater samples. Several alternative AE workflows were employed, utilizing two distinct membranes, three lysis buffers, and two homogenization instruments: Prcellys with varying speeds and cycles, and Vortex-Genie®-2, with a fixed speed for a specified time. Among the workflows, it appears that using 10,000 rpm bead-beating speed performed better than 7500 and 5000 rpm and vortexing (i.e., 3200 rpm) for lysis buffer PM1 (AE1–14) and PM1 + Chloroform-based workflows (AE-15 to AE-28) for SARS-CoV-2 quantitation in wastewater samples likely because the bead-beating step facilitates the rupture of virus particles adsorbed to the membrane surface. Our data (and visual inspection) of wastewater samples suggest that at the lower homogenization/vortexing speed of 3200 or 5000 rpm, the membrane did not homogenize completely in the lysis buffer PM1 and PM1 + Chloroform. Consequently, it’s probable that viral lysed particles or genetic fragments remained adhered to minuscule segments of membranes. Following the centrifugation process, these small membrane fragments, which contained lysed viral particles or genetic fragments, gathered in a pellet alongside the beads. This may have led to a lower recovery of genetic fragments in comparison to the 9000/10,000 rpm setting, which fully homogenized the membranes, eliminating the presence of smaller fragments. Based on the results, we recommend avoiding vortexing when using buffer PM1 alone or in combination with chloroform especially when the target concentration is low in a wastewater sample.
Nevertheless, an increase in bead-beating speed didn’t necessarily lead to improved quantitative detection of SARS-CoV-2 in PM1 + TRIzol-based workflows. This implies that the incorporation of TRIzol in buffer PM1 enhanced the ability to quantify low concentrations of SARS-CoV-2, regardless of factors such as membranes, homogenization speed, and number of cycles. Since the TRIzol reagent (comprising a phenol–guanidine isothiocyanate solution) is effective in deactivating native RNA, destabilizing proteins, and dissolving biological components found in sample (Chomczynski and Sacchi, 2006), it was observed through visual examination that even membranes subjected to vortexing exhibited enhanced homogenization when treated with PM1 + TRIzol lysis buffer.
If TRIzol is incorporated into the PM1 lysis buffer, the use of high-speed and expensive bead-beating instruments might become unnecessary. Babler et al. (2022) compared electronegative filtration to magnetic bead-based concentration methods for quantifying SARS-CoV-2 in wastewater samples. The authors successfully quantified SARS-CoV-2 in wastewater without a bead-beating step. Nevertheless, for the precise and sensitive detection of SARS-CoV-2, it is still advisable to opt for bead-beating over vortexing. In this study, a homogenization speed of 9000 rpm was employed for PM1 + TRIzol-based protocols to prevent any potential leakage of TRIzol solution from the bead-beating tubes. It’s important to note that TRIzol is a substance of high corrosiveness and toxicity, capable of causing skin burns upon contact, and even systemic poisoning. Hence, it is imperative to take proper health and safety precautions when working with TRIzol reagents. Similarly, chloroform is a volatile compound that can produce vapors which, when inhaled, can depress the central nervous system, leading to symptoms such as dizziness, headache, nausea, and in extreme cases, unconsciousness. Furthermore, chloroform can be absorbed through the skin, potentially leading to irritation, dermatitis, or systemic effects if absorbed in large quantities.
In this study, workflows utilizing PMI + TRIzol consistently demonstrated superior performance compared to other AE-workflows in quantifying SARS-CoV-2 genetic fragments in wastewater samples. A recent investigation similarly documented lower Cq values for US CDC N1 and PMMoV genes when employing Precelly’s bead-beating and PM1 + TRIzol lysis buffer, as opposed to vortexing with PM1 or using Precelly’s with PM1. These findings align with the outcomes presented in the current study (Ando et al., 2023).
Like SARS-CoV-2, the concentration of HAdV 40/41 and HF183 were not greatly influenced by variations across the workflows. In fact, there was no significant difference among the 42 workflows for HAdV 40/41, but overall, significantly higher concentrations of HF183 were obtained using workflows that used higher bead-beating speeds irrespective of the lysis buffer composition. When individual components of the workflows were compared, membrane type, choice of instruments and number of cycles of the bead-beating step did not have significant effect on concentrations of HAdV 40/41 or HF183. This suggests that for these steps of the process, certain variables and equipment can be used inter-changeably without affecting the results. Notably, the choice of lysis buffer composition mixture affected concentrations of both HAdV 40/41 and HF183, with significantly lower concentrations obtained when chloroform was included, compared to PM1 alone and PM1 + TRIzol combination. While DNA extractions based on phenol-chloroform purification tend to produce better DNA purity, they often lead to reduced DNA yields likely due to chemical interactions with organic compounds which are absent in PM1 or TRIzol approaches (Dandare et al., 2022; Lahiri et al., 1992; Shaffer et al., 2022).
Finally, similar to our observation for the majority of the workflows, higher bead-beating speeds resulted in significantly higher concentrations of HF183 for PM1 workflows, but not HAdV 40/41. Similar to SARS-CoV-2, elevated speeds likely resulted in a more complete homogenization of the membrane yielding higher concentrations. It is unclear why there was no significant difference among the 42 workflows on HAdV 40/41 concentrations, or why none of the variables except the lysis buffer had an impact. Identifying the factors that contribute to the differences is not straightforward when a workflow consists of 4 or 5 variables and additional research is needed for thorough investigation on the impacts of variables on the recovery of viruses and bacteria from wastewater. Additional research is necessary to clarify the influence of mechanical homogenization on the retrieval of viral nucleic acid in comparison to workflows that exclude the homogenization step.
Ever since the initial assessment of the AE workflows in 2020 for the quantitative detection of SARS-CoV-2 in wastewater, numerous studies have determined the efficiency of AE workflows by comparing them with alternative concentration processes. Several studies have indicated that AE or modified AE workflows outperform other protocols (Ahmed et al., 2020b; LaTurner et al., 2021; Sharkey et al., 2021; Kumblathan et al., 2023). Other studies have presented contrary findings when comparing AE workflows to alternative concentration methods (Jafferali et al., 2021; Sapula et al., 2021; Fonseca et al., 2022; Othman et al., 2023). However, it’s noteworthy that in these other studies, either the AE workflow was altered, or distinct homogenization tools and conditions were employed, deviating from the procedures detailed in the Ahmed et al. (2020b) paper, which might have contributed to diminished performance. The findings of our study suggest that some components of the AE workflow are not influencing the recovery of SARS-CoV-2, HAdV 40/41 or HF183 allowing for substitutions by individual laboratories. Furthermore, we demonstrated that relatively simple improvements in the AE workflow (such as substitution of lysis buffer mixture composition and an increased homogenization speed) can significantly improve recoveries of viruses and bacteria from the wastewater and have important implications for future wastewater surveillance efforts. However, it is difficult to evaluate impact of factors contributing to an improved AE workflow when multiple variables are tested simultaneously. Also, small number of replicates were analyzed in this study, which may have influenced the power of statistical analysis. Therefore, additional research is warranted for a more detailed and precise evaluation of variables on the recovery of viruses and bacteria from wastewater.
5. Conclusions
The results of this study indicated that the AE workflow is reliable for concentration and extraction of respiratory and enteric viruses and as well as bacteria from small volume of wastewater sample for downstream RT-qPCR and qPCR analysis.
Among the workflows evaluated, AE workflows that used TRIzol in the lysis step yielded greater concentrations of SARS-CoV-2, HAdV 40/41 and HF-183 compared to other workflows regardless of membranes, homogenization instruments, speed, and number of cycles.
Bead-beating at >9000 rpm seems crucial for PM1 and PM1 + Chloroform based AE workflows but not for PM1 + TRIzol based workflows, thus offering different approaches for laboratories without access to expensive instruments.
Further research is needed to understand the efficacy of various nucleic acid extraction methods, different lysis buffer composition mixtures, different type of beads which may in turn improve the recovery of the entire AE workflow for the quantification of viruses and bacteria from wastewater. Further research is also needed to understand how AE workflows and homogenization steps could impacts sequencing results of viruses and bacteria from wastewater samples.
Supplementary Material
HIGHLIGHTS.
AE workflow is reliable for concentration and extraction of viruses/bacteria from wastewater.
TRIzol used in the lysis step yielded >concentrations of viruses and bacteria.
Bead-beating at >9000 rpm is crucial for buffer PM1 and PM1 + Chloroform-based AE workflows.
Bead-beating instruments may not be required for buffer PM1 + TRIzol based AE workflows.
Acknowledgements
This research was partly supported by The University of Science and Technology (UST), South Korea Overseas Training Program (2023). We are deeply grateful to CSIRO Environment for providing high quality facilities and scientific expertise. Additionally, we acknowledge the financial support provided by the [Project, NRF 2021K1A4A8A01079319], which is a part of the “National R&D Program through the National Research Foundation of Korea (NRF)” funded by the Ministry of Science and ICT.
Footnotes
Disclaimers
The research presented was not performed or funded by USEPA and was not subject to USEPA’s quality system requirements. The views expressed in this article are those of the author(s) and do not necessarily represent the views or policies of the U.S. Environmental Protection Agency.
CRediT authorship contribution statement
Jesmin Akter: Methodology, Formal analysis, Investigation, Writing – original draft. Wendy J.M. Smith: Methodology, Investigation. Yawen Liu: Formal analysis, Writing – original draft. Ilho Kim: Writing – original draft. Stuart Simpson: Funding acquisition, Writing – original draft. Phong Thai: Methodology. Asja Korajkic: Formal analysis, Writing – original draft. Warish Ahmed: Methodology, Investigation, Writing – original draft.
Declaration of competing interest
The authors declare that they have no known competing financial interests or personal relationships that could have appeared to influence the work reported in this paper.
Appendix A. Supplementary data
Supplementary data to this article can be found online at https://doi.org/10.1016/j.scitotenv.2023.167966.
Data availability
Data will be made available on request.
References
- Acosta N, Bautista MA, Hollman J, McCalder J, Beaudet AB, Man L, Waddell BJ, Chen J, Li C, Kuzma D, Bhatnagar S, Leal J, Meddings J, Hu J, Cabaj JL, Ruecker NJ, Naugler C, Pillai DR, Achari G, Ryan MC, Conly JM, Frankowski K, Hubert CRJ, Parkins MD, 2021. A multicenter study investigating SARS-CoV-2 in tertiary-care hospital wastewater. Viral burden correlates with increasing hospitalized cases as well as hospital-associated transmissions and outbreaks. Water Res 201, 117369. [DOI] [PMC free article] [PubMed] [Google Scholar]
- Ahmed W, Harwood VJ, Gyawali P, Sidhu JP, Toze S, 2015. Comparison of concentration methods for quantitative detection of sewage-associated viral markers in environmental waters. Appl. Environ. Microbiol 81, 2042–2049. [DOI] [PMC free article] [PubMed] [Google Scholar]
- Ahmed W, Angel N, Edson J, Bibby K, Bivins A, Brien JWO, Choi PM, Kitajima M, Simpson SL, Li J, Tscharke B, Verhagen R, Smith WJM, Zaugg J, Dierens L, Hugenholtz P, Thomas KV, Mueller JF, 2020a. First confirmed detection of SARS-CoV-2 in untreated wastewater in Australia: a proof of concept for the wastewater surveillance of COVID-19 in the community. Sci. Total Environ 728, 138764. [DOI] [PMC free article] [PubMed] [Google Scholar]
- Ahmed W, Bertsch PM, Bivins A, Bibby K, Farkas K, Gathercole A, Haramoto E, Gyawali P, Korajkic A, McMinn BR, Mueller JF, Simpson SL, Smith WJM, Symonds EM, Thomas KV, Verhagen R, Kitajima M, 2020b. Comparison of virus concentration methods for the RT-qPCR-based recovery of murine hepatitis virus, a surrogate for SARS-CoV-2 from untreated wastewater. Sci. Total Enviro 739, 139960. [DOI] [PMC free article] [PubMed] [Google Scholar]
- Ahmed W, Tscharke B, Bertsch PM, Bibby K, Bivins A, Choi P, Clarke L, Dwyer J, Edson J, Nguyen TMH, O’Brien JW, Simpson SL, Sherman P, Thomas KV, Verhagen R, Zaugg J, Mueller JF, 2021a. SARS-CoV-2 RNA monitoring in wastewater as a potential early warning system for COVID-19 transmission in the community: a temporal case study. Sci. Total Environ 761, 144216. [DOI] [PMC free article] [PubMed] [Google Scholar]
- Ahmed W, Bivins A, Simpson SL, Smith WJM, Metcalfe S, McMinn B, Symonds EM, Korajkic A, 2021b. Comparative analysis of rapid concentration methods for the recovery of SARS-CoV-2 and quantification of human enteric viruses and a sewage-associated marker gene in untreated wastewater. Sci. Total Environ 799, 149386. [DOI] [PMC free article] [PubMed] [Google Scholar]
- Ahmed W, Simpson SL, Bertsch PM, Bibby K, Bivins A, Blackall LL, Bofill-Mas S, Bosch A, Brandão J, Choi PM, Ciesielski M, Donner E, D’Souza N, Farnleitner AH, Gerrity D, Gonzalez R, Griffith JF, Gyawali P, Haas CN, Hamilton KA, Hapuarachchi HC, Harwood VJ, Haque R, Jackson G, Khan SJ, Khan W, Kitajima M, Korajkic A, La Rosa G, Layton BA, Lipp E, McLellan SL, McMinn B, Medema G, Metcalfe S, Meijer WG, Mueller JF, Murphy H, Naughton CC, Noble RT, Payyappat S, Petterson S, Pitkänen T, Rajal VB, Reyneke B, Roman FA Jr., Rose JB, Rusiñol M, Sadowsky MJ, Sala-Comorera L, Setoh YX, Sherchan SP, Sirikanchana K, Smith W, Steele JA, Sabburg R, Symonds EM, Thai P, Thomas KV, Tynan J, Toze S, Thompson J, Whiteley AS, Wong JCC, Sano D, Wuertz S, Xagoraraki I, Zhang Q, Zimmer-Faust AG, Shanks OC, 2022. Minimizing errors in RT-PCR detection and quantification of SARS-CoV-2 RNA for wastewater surveillance. Sci. Total Environ 805, 149877. [DOI] [PMC free article] [PubMed] [Google Scholar]
- Ahmed W, Bivins A, Stephens M, Metcalfe S, Smith WJM, Sirikanchana K, Kitajima M, Simpson SL, 2023a. Occurrence of multiple respiratory viruses in wastewater in Queensland, Australia: potential for community disease surveillance. Sci. Total Environ 864, 161023. [DOI] [PMC free article] [PubMed] [Google Scholar]
- Ahmed W, Bivins A, Korajkic A, Metcalfe S, Smith WJM, Simpson SL, 2023b. Comparative analysis of adsorption-extraction (AE) and Nanotrap® magnetic virus particles (NMVP) workflows for the recovery of endogenous enveloped and non-enveloped viruses in wastewater. Sci. Total Environ 859, 160072. [DOI] [PMC free article] [PubMed] [Google Scholar]
- Ahmed W, Smith WJM, Sirikanchana K, Kitajima M, Bivins A, Simpson SL, 2023c. Influence of membrane pore-size on the recovery of endogenous viruses from wastewater using an adsorption-extraction method. J. Virol. Methods 317, 114732. [DOI] [PMC free article] [PubMed] [Google Scholar]
- Ando H, Murakami M, Ahmed W, Iwamoto R, Okabe S, Kitajima M, 2023. Wastewater-Based Prediction of COVID-19 Cases Using a Highly Sensitive SARS-CoV-2 RNA Detection Method Combined with Mathematical Modeling. Environ, Int, p. 107743. [DOI] [PMC free article] [PubMed] [Google Scholar]
- Babler KM, Amirali A, Sharkey ME, Williams SL, Boone MM, Cosculluela GA, Currall BB, Grills GS, Laine GJ, Mason CE, Reding BD, Schürer SC, Stevenson M, Vidovic D, Solo-Gabriele HM, 2022. Comparison of electeronegative filtration to magnetic bead-based concentration and V2G-qPCR to RT-qPCR for quantifying viral SARS-CoV-2 RNA from wastewater. ACS EST Wat 2, 2004–2013. [DOI] [PMC free article] [PubMed] [Google Scholar]
- Barril PA, Pianciola LA, Mazzeo M, Ousset MJ, Jaureguiberry MV, Alessandrello M, Sanchez G, Oteiza JM, 2021. Evaluation of viral concentration methods for SARS-CoV-2 recovery from wastewaters. Sci. Total Environ 756, 144105. [DOI] [PMC free article] [PubMed] [Google Scholar]
- Bustin SA, Benes V, Garson JA, Hellemans J, Huggett J, Kubista M, Mueller R, Nolan T, Pfaffl MW, Shipley GL, Vandesompele J, Wittwer CT, 2009. The MIQE guidelines: minimum information for publication of quantitative real-time PCR experiments. Clin. Chem 55, 611–622. [DOI] [PubMed] [Google Scholar]
- CDC (2019). Novel coronavirus (2019-nCoV) real-time RT-PCR diagnostic panel, https://www.fda.gov/media/134922/download. [DOI] [PMC free article] [PubMed]
- Chomczynski P, Sacchi N, 2006. The single-step method of RNA isolation by acid guanidinium thiocyanate-phenol-chloroform extraction: twenty-something years on. Nat. Protocols 1, 581–585. [DOI] [PubMed] [Google Scholar]
- Dandare A, Rafiq M, Liaquat A, Khan MJ, 2022. Two hours method for RNA and DNA co-extraction from blood of coronary artery disease patients: fast, simple and economical technique. Pakistan J. Med Sci 38, 1754–1759. [DOI] [PMC free article] [PubMed] [Google Scholar]
- De Jonge EF, Peterse CM, Koelewijn JM, Drift AR, Der Van, van der Beek R, Nagelkerke E, Lodder WJ, 2022. The detection of monkeypox virus DNA in wastewater samples in the Netherlands. Sci. Total Environ 852, 158265. [DOI] [PMC free article] [PubMed] [Google Scholar]
- Dumke R, Geissler M, Skupin A, Helm B, Mayer R, Schubert S, Oertel R, Renner B, Dalpke AH, 2022. Simultaneous detection of SARS-CoV-2 and influenza virus in wastewater of two cities in southeastern Germany, January to may 2022. Int. J. Environ. Heal. Res. Public Heal 19, 13374. [DOI] [PMC free article] [PubMed] [Google Scholar]
- Feng S, Owens SM, Shrestha A, Poretsky R, Hartmann EM, Wells G, 2023. Intensity of sample processing methods impacts wastewater SARS-CoV-2 whole genome amplicon sequencing outcomes. Sci. Total Environ 876, 162572. [DOI] [PMC free article] [PubMed] [Google Scholar]
- Fonseca MS, Machado BAS, de Araújo Rolo C, Hodel KVS, dos Santos Almeida E, de Andrade JB, 2022. Evaluation of SARS-CoV-2 concentrations in wastewater and river water samples. Case Studies Chem. Environ. Eng 6, 100214. [DOI] [PMC free article] [PubMed] [Google Scholar]
- Garg A, Pattamadilok S, Bahl S, 2018. Successes and challenges of expansion of environmental poliovirus surveillance in the WHO South-East Asia region. WHO South-East Asia. J. Public Heal 7, 122–128. [DOI] [PubMed] [Google Scholar]
- Green HC, Haugland RA, Varma M, Millen HT, Borchardt MA, Field KG, Walters WA, Sivaganesan M, Kelty CA, Shanks OC, 2014. Improved HF183 quantitative real-time PCR assay for characterization of human fecal pollution in ambient surface water samples. Appl. Environ. Microbiol 80, 3086–3094. [DOI] [PMC free article] [PubMed] [Google Scholar]
- Haramoto E, Malla B, Thakali O, Kitajima M, 2020. First environmental surveillance for the presence of SARS-CoV-2 RNA in wastewater and river water in Japan. Sci. Total Environ 731, 140405. [DOI] [PMC free article] [PubMed] [Google Scholar]
- Hata A, Hara-Yamamura H, Meuchi Y, Imai S, Honda R, 2021. Detection of SARS-CoV-2 in wastewater in Japan during a COVID-19 outbreak. Sci. Total Environ 758, 143578. [DOI] [PMC free article] [PubMed] [Google Scholar]
- Haugland RA, Siefring SC, Wymer LJ, Brenner KP, Dufour AP, 2005. Comparison of Enterococcus measurements in freshwater at two recreational beaches by quantitative polymerase chain reaction and membrane filter culture analysis. Water Res 39, 559–568. [DOI] [PubMed] [Google Scholar]
- Jafferali MH, Khatami K, Atasoy M, Birgersson M, Williams C, Cetecioglu Z, 2021. Benchmarking virus concentration methods for quantification of SARS-CoV-2 in raw wastewater. Sci. Total Environ 755, 142939. [DOI] [PMC free article] [PubMed] [Google Scholar]
- Kantor RS, Nelson KL, Greenwald HD, Kennedy LC, 2021. Challenges in measuring the recovery of SARS-CoV-2 from wastewater. Environ. Sci. Technol 55, 3514–3519. [DOI] [PubMed] [Google Scholar]
- Ko G, Jothikumar N, Hill VR, Sobsey MD, 2005. Rapid detection of infectious adenoviruses by mRNA real-time RT-PCR. J. Virol. Methods 127, 148–153. [DOI] [PubMed] [Google Scholar]
- Kongprajug A, Chyerochana N, Rattanakul S, Denpetkul T, Sangkaew W, Somnark P, Patarapongsant Y, Tomyim K, Sresang M, Mongkolsuk S, Sirikanchana K, 2021. Integrated analyses of fecal indicator bacteria microbial source tracking markers and pathogens for southeast Asian beach water quality assessment. Water Res 203, 117479. [DOI] [PubMed] [Google Scholar]
- Kumblathan T, Liu Y, Qiu Y, Pang L, Hrudey SE, Le XC, Li XF, 2023. An efficient method to enhance recovery and detection of SARS-CoV-2 RNA in wastewater. J. Environ. Sci (China: ) 130, 139–148. [DOI] [PMC free article] [PubMed] [Google Scholar]
- La Rosa G, Iaconelli M, Mancini P, Bonanno G, Ferraro GB, Veneri C, Bonadonna L, Lucentini L, Suffredini E, 2020. First detection of SARS-CoV-2 in untreated wastewaters in Italy. Sci. Total Environ 736, 139652. [DOI] [PMC free article] [PubMed] [Google Scholar]
- Lahiri DK, Bye S, Nurnberger JI Jr., Hodes ME, Crisp M, 1992. A non-organic and non-enzymatic extraction method gives higher yields of genomic DNA from whole-blood samples than do nine other methods tested. J.Biochem. Biophys Methods 25, 193–205. [DOI] [PubMed] [Google Scholar]
- LaTurner ZW, Zong DM, Kalvapalle P, Gamas KR, Terwilliger A, Crosby T, Ali P, Avadhanula V, Santos HH, Weesner K, Hopkins L, Piedra PA, Maresso AW, Stadler LB, 2021. Evaluating recovery cost and throughput of different concentration methods for SARS-CoV-2 wastewater-based epidemiology. Water Res 197, 117043. [DOI] [PMC free article] [PubMed] [Google Scholar]
- Lu E, Ai Y, Davis A, Straathof J, Halloran K, Hull N, Winston R, Weir MH, Soller J, Bohrerova Z, Oglesbee M, Lee J, 2022. Wastewater surveillance of SARS-CoV-2 in dormitories as a part of comprehensive university campus COVID-19 monitoring. Environ. Res 212, 113580. [DOI] [PMC free article] [PubMed] [Google Scholar]
- Medema G, Heijnen L, Elsinga G, Italiaander R, 2020. Presence of SARS-Coronavirus-2 RNA in sewage and correlation with reported COVID-19 prevalence in the early stage of the epidemic in the Netherlands. Environ. Sci. Technol. Lett 7, 511–516. [DOI] [PubMed] [Google Scholar]
- Miura T, Takino H, Gima A, Haramoto E, Akiba M, 2021. Recovery of nucleic acids of enteric viruses and host-specific bacteroidales from groundwater by using an adsorption-direct extraction method. Appl. Environ. Microbiol 87, 1–10. [DOI] [PMC free article] [PubMed] [Google Scholar]
- Othman I, Helmi A, Slama I, Hamdi R, Mastouri M, Aouni M, 2023. Evaluation of three viral concentration methods for detection and quantification of SARS-CoV-2 in wastewater. J. Water Health 21, 354–360. [DOI] [PubMed] [Google Scholar]
- Patel M, Chaubey AK, Pittman CU Jr., Mlsna T, Mohan D, 2020. Coronavirus (SARS-CoV-2) in the environment: occurrence, persistence, analysis in aquatic systems and possible management. Sci. Total Environ 765, 142698. [DOI] [PMC free article] [PubMed] [Google Scholar]
- Peccia J, Zulli A, Brackney DE, Grubaugh ND, Kaplan EH, Casanovas-Massana A, Ko AI, Malik AA, Wang D, Wang M, Warren JL, Weinberger DM, Arnold WO, Saad B, 2020. Measurement of SARS-CoV-2 RNA in wastewater tracks community infection dynamics. Nat. Biotechnol 38, 1164–1167. [DOI] [PMC free article] [PubMed] [Google Scholar]
- Pecson BM, Darby E, Haas CN, Amha YM, Bartolo M, Danielson R, Dearborn Y, Di Giovanni G, Ferguson C, Fevig S, Gaddis E, Gray D, Lukasik G, Mull B, Olivas L, Olivieri A, Qu Y, 2021. SARS-CoV-2 interlaboratory consortium reproducibility and sensitivity of 36 methods to quantify the SARS-CoV-2 genetic signal in raw wastewater: findings from an interlaboratory methods evaluation in the U.S. Environ. Sci. Water Res. Technol 7, 504–520. [DOI] [PMC free article] [PubMed] [Google Scholar]
- Prado T, Fumian TM, Mannarino CF, Resende PC, Motta FC, Eppinghaus ALF, Chagas do Vale VH, Braz RMS, de Andrade JDSR, Maranhão AG, Miagostovich MP, 2021. Wastewater-based epidemiology as a useful tool to track SARS-CoV-2 and support public health policies at municipal level in Brazil. Water Res 191, 116810. [DOI] [PMC free article] [PubMed] [Google Scholar]
- Randazzo W, Truchado P, Ferranfo EC, Simon P, Allende A, Sanchez G, 2020. SARS-CoV-2 RNA titers in wastewater anticipated COVID-19 occurrence in a low prevalence area. Water Res 115942. [DOI] [PMC free article] [PubMed] [Google Scholar]
- Sapula SA, Whittall JJ, Pandopulos AJ, Gerber C, Venter H, 2021. An optimized and robust PEG precipitation method for detection of SARS-CoV-2 in wastewater. Sci. Total Environ 785, 147270. [DOI] [PMC free article] [PubMed] [Google Scholar]
- Shaffer JP, Carpenter CS, Martino C, Salido RA, Minich JJ, Bryant M, Sanders K, Schwartz T, Humphrey G, Swafford AD, Knight R, 2022. A comparison of six DNA extraction protocols for 16S, ITS and shotgun metagenomic sequencing of microbial communities. BioTechniques 73, 34–46. [DOI] [PMC free article] [PubMed] [Google Scholar]
- Sharkey ME, Kumar N, Mantero AMA, Babler KM, Boone MM, Cardentey Y, Cortizas EM, Grills GS, Herrin J, Kemper JM, Kenney R, Kobetz E, Laine J, Lamar WE, Mader CC, Mason CE, Quintero AZ, Reding BD, Roca MA, Ryon K, Solle NS, Schürer SC, Shukla B, Stevenson M, Stone T, Tallon JJ Jr., Venkatapuram SS, Vidovic D, Williams SL, Young B, Solo-Gabriele HM, 2021. Lessons learned from SARS-CoV-2 measurements in wastewater. Sci. Total Environ 798, 149177. [DOI] [PMC free article] [PubMed] [Google Scholar]
- Sherchan SP, Shahin S, Ward LM, Tandukar S, Aw TG, Schmiz B, Ahmed W, Kitajima M, 2020. First detection of SARS-CoV-2 RNA in wastewater in North America: a study in Louisiana, USA. Sci. Total Environ 743, 140621. [DOI] [PMC free article] [PubMed] [Google Scholar]
- WHO, 2003. Guidelines for environmental surveillance of poliovirus circulation WHO/V&B/03.03.
- Wigginton KR, Ye Y, Ellenberg RM, 2015. Emerging investigators series: the source and fate of pandemic viruses in the urban water cycle. Environ. Sci. Water Res. Technol 1, 735–746. [Google Scholar]
- Wong K, Fong TT, Bibby K, Molina M, 2012. Application of enteric viruses for fecal pollution source tracking in environmental waters. Environ. Int 45, 151–164. [DOI] [PubMed] [Google Scholar]
- Wu F, Zhang J, Xiao A, Gu X, Lee WL, Armas F, Kauffman K, Hanage W, Matus M, Ghaeli M, Endo N, Duvallet C, Poyet M, Moniz K, Washburne AD, Ericson TB, Chai PR, Thompson J, Alm EJ, 2020. SARS-CoV-2 titers in wastewater are higher than expected from clinically confirmed cases. mSystems 5 (4), e00614–20. [DOI] [PMC free article] [PubMed] [Google Scholar]
- Zhou J, Li C, Zhao G, Chu H, Wang D, Yan HHN, Poon VKM, Wen L, Wong BHY, Zhao X, Chiu MC, Yang D, Wang Y, Au-Yeung RKH, Chan IHY, Sun S, Chan JFW, To KKW, Memish ZA, Corman VM, Drosten C, Hung IFN, Zhou Y, Leung SY, Yuen KY, 2017. Human Intestinal Tract Serves as an Alternative Infection Route for Middle East Respiratory Syndrome Coronavirus. Sci, Adv, p. 3. [DOI] [PMC free article] [PubMed] [Google Scholar]
Associated Data
This section collects any data citations, data availability statements, or supplementary materials included in this article.
Supplementary Materials
Data Availability Statement
Data will be made available on request.