

Summary
There is a need to develop effective therapies for pancreatic ductal adenocarcinoma (PDA), a highly lethal malignancy with increasing incidence1 and poor prognosis2. Although targeting tumor metabolism has been the focus of intense investigation for more than a decade, tumor metabolic plasticity and high risk of toxicity have limited this anticancer strategy3,4. Here we use genetic and pharmacological approaches in human and mouse in vitro and in vivo models to show that PDA has a distinct dependence on de novo ornithine synthesis from glutamine. We find that this process, which is mediated through ornithine aminotransferase (OAT), supports polyamine synthesis and is required for tumor growth. This directional OAT activity is usually largely restricted to infancy and contrasts with the reliance of most adult normal tissues and other cancer types on arginine-derived ornithine for polyamine synthesis5,6. This dependency associates with arginine depletion in the PDA tumor microenvironment and is driven by mutant KRAS. Activated KRAS induces the expression of OAT and polyamine synthesis enzymes, leading to alterations in the transcriptome and open chromatin landscape in PDA tumor cells. The distinct dependence of PDA, but not normal tissue, on OAT-mediated de novo ornithine synthesis provides an attractive therapeutic window for treating patients with pancreatic cancer with minimal toxicity.
PDA generates polyamines from glutamine
Our prior work on nitrogen metabolism in PDA7 led to the unexpected finding that the amine nitrogen of glutamine is directly channeled into de novo ornithine synthesis (DNS), independent of the urea cycle. This OAT- catalyzed reversible reaction is largely restricted to early infancy in the direction of ornithine and arginine synthesis, whereas the majority of adult tissues favor the reverse direction, degrading ornithine to generate glutamate5 (Fig. 1a, Extended Data Fig. 1a). In adults, ornithine is classically produced from arginine via arginase (ARG1/2), serving both as a substrate for citrulline synthesis in the urea cycle and as precursor for polyamines, including putrescine, spermidine and spermine (Extended Data Fig. 1a). These small polycationic molecules are involved in multiple fundamental processes of cell growth and survival6.
Fig. 1 |. PDA uses glutamine for de novo ornithine and polyamine synthesis.

a, Schematic for OAT reaction. b, c, Percent 15N-labeled ornithine (b) and putrescine (c) in cancer and tissue-matched non-cancer (arrowheads) cell lines fed 15N-(amine)Gln for 24 h. (BRCA: breast carcinoma; LUAD, COAD and PRAD: adenocarcinomas of the lung, colon and prostate, respectively). n = 4 biological replicates. d, Schematic of tumor-bearing iKras and control mice treated with Dox, 3 weeks prior to infusion with 15N-(amine)Gln or 15N4-Arg. e, f, Relative abundance of 15N-labeled (e) or total (f) ornithine and putrescine in normal pancreas or PDA tumors from mice in d, infused with 15N-(amine)Gln for 1 h, 2 h or 3 h. n = 4 mice per group. g, Percent 15N-labeled ornithine and putrescine in normal pancreas or PDA tumors from mice in d, infused with 15N-(amine)Gln or 15N4-Arg for 3 h. n = 4 mice per group. h, Schematic for isolation of tumor interstitial fluid (TIF) or normal interstitial fluid (NIF) from PDA tumors or normal pancreas of iKrasG12D or iKrasWT mice, respectively. i, Relative abundance of metabolites in TIF and NIF from h. n = 6 biological replicates. Data are mean ± s.d. p-values were obtained by one-way (b, c, i) or two-way (e, f) ANOVA, followed by Tukey test or unpaired two-tailed t-test (g). In b, c, statistical significance is for cancer cells vs. tissue-matched normal cells. In i, p-values are for NIF vs. PlasmaWT or TIF vs. PlasmaG12D, unless otherwise indicated by lines. In b, c, data represent two independent experiments.
We thus asked whether glutamine-derived, rather than arginine-derived ornithine serves as an unconventional source for polyamines in PDA. Metabolic tracing in human AsPC-1 cells fed either 15N(amine)-glutamine (15N-Gln, Extended Data Fig. 1b) or 15N4-arginine (15N-Arg, Extended Data Fig. 1c) revealed that the glutamine nitrogen is not transferred to citrulline, argininosuccinate, arginine or urea, consistent with incomplete urea cycle in vitro7, but is significantly detected in ornithine, confirming active DNS (Fig. 1b, Extended Data Fig. 1d). Even if the urea cycle were active, this nitrogen would be donated to urea (Extended Data Fig. 1b, black circles) and not ornithine (gray circles), making DNS the only pathway for its transfer to ornithine (red circles). Glutamine rather than arginine (Extended Data Fig. 1d, e) proved to be the main source for ornithine (40% M+1 and M+2 from 15N-Gln vs. 17% M+2 from 15N-Arg) and its polyamine derivatives, putrescine (65% from 15N-Gln vs. 16% from 15N-Arg) and spermidine (45% from 15N-Gln vs. 9% from 15N-Arg). These results contrast with the recognized role of arginine as the main nitrogen donor for ornithine and polyamines6 and were confirmed in 29 human cancer cell lines representing 5 cancer types (pancreatic, breast, lung, colon and prostate) and 6 tissue-matched non-transformed cell lines (Fig. 1b, c, Extended Data Fig. 1f, g). In human pancreatic ductal epithelial (HPDE) cells and all non-PDA cancer cell lines tested, arginine was the main source of ornithine and putrescine with up to 87% ornithine and 80% putrescine derived from 15N-Arg vs. 40% ornithine and 41% putrescine from 15N-Gln. In contrast, all PDA cell lines, except for the non-KRAS driven BxPC3, preferred glutamine: up to 71% ornithine and 77% putrescine from 15N-Gln vs. 35% ornithine and 26% putrescine from 15N-Arg (Fig. 1b, c, Extended Data Fig. 1f, g). These results distinguish PDA, over 90% of which is driven by KRAS8, from normal pancreatic cells and other cancer types, in its unconventional usage of glutamine as a source for polyamine synthesis. Importantly, this feature is not the simple consequence of enhanced glutaminolysis9, as the 15N-Gln differential labeling pattern was not only maintained but became further evident, following normalization to 15N-glutamate (Extended Data Fig. 1h, i); nor is it due to increased proliferative potential, given that lung, colon, prostate and some breast cancer cells, displayed doubling times comparable to PDA (Extended Data Fig. 2a). Moreover, despite common use by both DNS and proline synthesis of the intermediate glutamate-γ-semialdehyde (Extended Data Fig. 1a), only a mild increase in 15N-Gln-derived proline was detected in PDA compared to other cancers (Extended Data Fig. 2b), indicating that PDA favorably channels glutamate towards OAT for DNS. High levels of arginine in the culture media (e.g. RPMI 1.15 mM) can cause reversal of the argininosuccinate lyase (ASL) reaction (Extended Data Fig. 1c) leading to accumulation of 15N-Arg-derived argininosuccinate in vitro10 (Extended Data Fig. 1e) where the urea cycle is inactive7,10 (Extended Data Fig. 1d). This phenotype is however not specific to PDA (Extended Data Fig. 2c), and is abrogated in low plasma levels of arginine (64 μM, Extended Data Fig. 2d, e), where PDA cells continue to favor glutamine over arginine for polyamine synthesis (Extended Data Fig. 2f, g).
To extend our findings to an in vivo setting, we infused the doxycycline (Dox)-inducible mouse model of PDA8, p48-Cre-LSL-KrasG12D;p53fl/fl, or iKrasG12D and non-tumor-bearing controls (iKrasWT) with either 15N(amine)-Gln or 15N-Arg (Fig. 1d–g and Extended Data Fig. 2h–l). In all mice, steady-state plasma enrichment (~60%) was achieved within 30 min (Extended Data Fig. 2h, j), with ~ 54% 15N-Gln or ~30–40% 15N-Arg being reached in normal pancreas and tumors over the course of 3 hours (Extended Data Fig. 2i, k). Strikingly, both the synthesis rates of 15N-Gln-derived ornithine and putrescine (3.5- to 5.9-fold) and their total pools (3 to 3.7-fold) were significantly higher in PDA tumors (Fig. 1e, f), with glutamine contributing to 45% and 23% of ornithine and putrescine labeled fractions, respectively, in PDA compared to its 19% and 3% contributions in normal pancreas (Fig. 1g). In contrast, arginine was the major contributor to ornithine (51%) and putrescine (16%) in normal pancreas, compared to PDA, where only 14% ornithine and 6% putrescine were arginine-derived (Fig. 1g, Extended Data Fig. 2l). These data confirm predominant usage by PDA, compared to normal tissue, of glutamine-derived rather than arginine-derived ornithine for in vivo polyamine synthesis.
Arginine is depleted in PDA TME
Because nutrient availability influences metabolic behavior11–13, we asked whether the tumor microenvironment (TME) contributes to PDA predominant usage of glutamine over arginine for polyamine synthesis. Targeted polar metabolite profiling of the plasma and interstitial fluids (IF) of tumors (TIF) or normal pancreas (NIF) isolated from iKrasG12D or iKrasWT mice, respectively (Fig. 1h) unveiled similarity in the metabolic composition of the host plasma, independent of tumor presence (Extended Data Fig. 3a); this composition was however quite distinct from that of the TIF12, with significant variance additionally detected between the NIF and TIF (Extended Data Fig. 3a–d). Thus, major metabolic differences associated with tumor presence in the pancreas occur within the TME, rather than the circulation. Notably, compared to plasma, the levels of both arginine and glutamine were lower in the NIF of control mice, indicative of usage (Fig. 1i); however, only arginine and its urea cycle precursor citrulline were further depleted in the TIF, whilst glutamine levels remained high as in plasma12 (Fig. 1i). This arginine depletion was recently found to result from arginine breakdown by ARG1-expressing myeloid cells in the PDA TME14,15, promoting a compensatory induction of de novo arginine biosynthesis in PDA cells14. As such, KRAS-driven PDA cells are able to survive and proliferate, albeit slowly, in medium completely depleted of arginine14 or containing levels comparable to those in TIF (2μM, Extended Data Fig. 3e, f).
The low in vivo availability of arginine led us to hypothesize that PDA rewires its metabolism to favor unconventional use of glutamine for polyamine synthesis. However, the mechanisms for maintenance of such rewiring in vitro despite abundant arginine in the media (Fig. 1b, c) remain elusive and may involve epigenetic changes. Indeed, ornithine, putrescine and spermidine were strikingly enriched in the TIF, but not in NIF (Fig. 1i) mirroring their higher intracellular levels within tumors (Extended Data Fig. 3g–j). Our findings thus validate the distinct usage of glutamine by PDA for polyamine synthesis, so as to adapt to its arginine-depleted microenvironment.
DNS is a metabolic dependency in PDA
Although OAT mRNA levels are notably lower in human pancreas compared to other tissues, they are induced in PDA tumors compared to normal pancreas (Extended Data Fig. 4a), as confirmed in 20 cancer and 3 tissue-matched normal cell lines (Extended Data Fig. 4b), and further validated by immunohistochemical staining in murine or human whole tissue sections and in tumor microarrays (TMAs, Extended Data Fig. 4c–e). In addition to its production from glutamine via OAT, or arginine via ARG, ornithine can be generated from arginine via glycine amidinotransferase (GATM) in the creatine synthesis pathway (Fig. 2a, Extended Data Fig. 1a). To assess their distinct contributions to polyamine synthesis and tumor growth, each of the three ornithine-synthesizing enzymes, was knocked down individually in AsPC-1 cells and compared to knockdown of the rate-limiting enzyme of polyamine synthesis, ODC1 (Extended Data Fig. 5a). ARG2 and not ARG1 was chosen, because ARG1 is not expressed at detectable levels in PDA cells7. Silencing of OAT, but not ARG2 or GATM completely suppressed the synthesis of 15N-Gln-derived ornithine (Fig. 2b), decreasing its total pools (3.5-fold, Fig. 2c). Similar to ODC1 but unlike ARG2 or GATM, knockdown of OAT caused significant suppression of glutamine-derived 15N-putrescine (32-fold, Fig. 2b) resulting in ~7-fold-decrease in its total pools (Fig. 2c). Although a mild 1.5 to 2-fold increase in 15N-Arg-derived ornithine was observed upon OAT knockdown (Fig. 2b), a compensatory increase was not reflected in total ornithine levels (Fig. 2c), nor did it significantly affect the levels of labeled or total putrescine (Fig. 2b, c) indicating that inhibition of DNS does not result in compensatory increase in arginine-derived ornithine or polyamine synthesis in PDA. In contrast, ODC1 knockdown led to the accumulation of its substrate ornithine (1.5- to 2.5-fold, Fig. 2c) and reversal of the OAT reaction, towards ornithine degradation (Fig. 2b, left). This in turn resulted in a compensatory increase in 15N-Arg-derived synthesis of ornithine (M+2) (Fig. 2b, left) and urea (M+2) via ARG2, and the production of creatine and creatinine via GATM (M+2, Extended Data Fig. 5b, c). The 15N-Arg-derived ornithine was then channeled towards the synthesis of glutamate (M+1) and proline (M+1) (Extended Data Fig. 5b, c). Thus although genetic silencing of ODC1 or OAT similarly suppresses polyamine synthesis, knockdown of ODC1 but not OAT, results in compensatory induction of arginine-mediated ornithine synthesis.
Fig. 2 |. OAT is required for PDA polyamine synthesis and tumor growth.
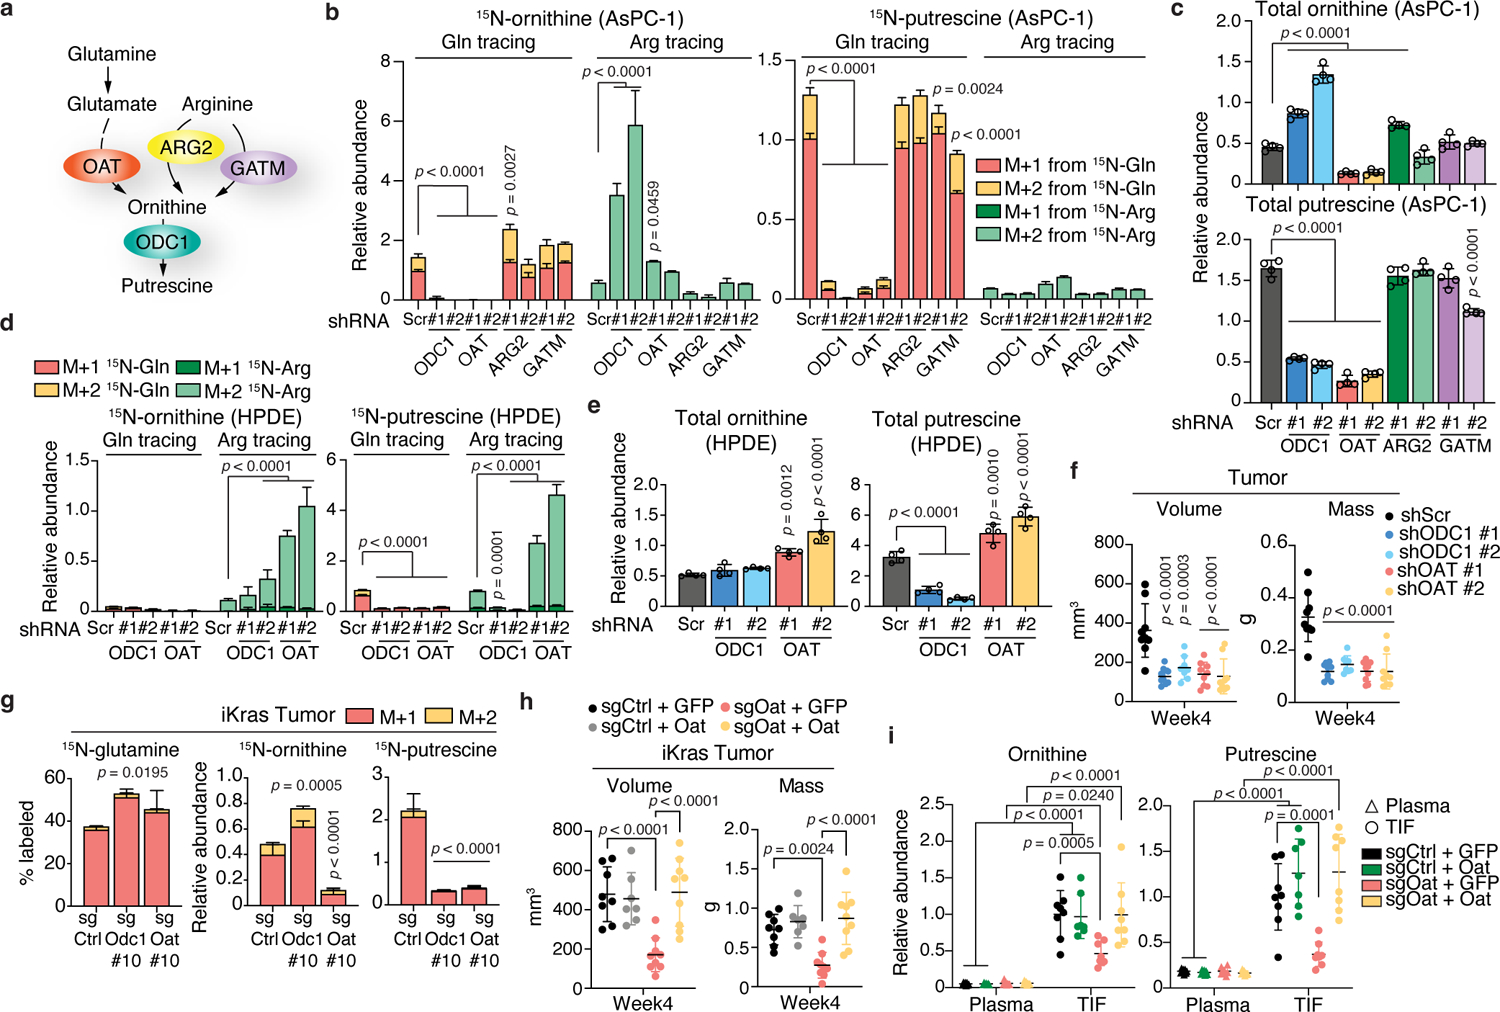
a, Schematic illustrating enzymatic reactions for glutamine-derived (via OAT) vs. arginine-derived (via ARG2 or GATM) ornithine synthesis leading to putrescine synthesis (via ODC1). b, c, Relative abundance of 15N-labeled (b) or total (c) ornithine and putrescine in AsPC-1 cells with knockdown of genes depicted in a (2 hairpins/gene) or control Scramble (Scr). n = 4. d, e, Abundance of 15N-labeled (d) or total (e) ornithine and putrescine in HPDE cells with knockdown of ODC1, OAT or Scr. n = 4. In b-e, cells were fed 15N-(amine)Gln or 15N4-Arg for 24 h. f, Volumes (caliper) and weights of orthotopic AsPC-1 tumors injected into Rag1−/− mice. n = 9 except shODC1 #2, n = 8. g, Percent 15N-labeled glutamine and relative abundance of 15N-labeled ornithine and putrescine in murine iKras orthotopic tumors (from Extended Data Fig. 7a) with control (Ctrl), Odc1 or Oat knockout, post-infusion with 15N-(amine)Gln. n = 4. h, Volumes (caliper) and weights of orthotopic iKras-sgOat tumors overexpressing GFP or Oat. n = 8 (sgCtrl + GFP); n = 7 (sgCtrl + Oat); n = 9 (sgOat #10 + GFP; sgOat #10 + Oat). i, Metabolite abundance in TIF or plasma of mice from h. n = 8 except sgCtrl + Oat (7). n indicates biological replicates (b-e) or mice (f-i) per group. Data are mean ± s.d. p-values were obtained by one-way (b-h) or two-way (i) ANOVA followed by Tukey test. Data represent four (b, c), or two (d, e) independent experiments.
Consistent with DNS requirement for ornithine and putrescine synthesis, loss of OAT, but not ARG2 or GATM mimicked ODC1 loss in suppressing AsPC-1 cell proliferation, which was rescued with 10 μM putrescine (Extended Data Fig. 5d, e). This indicates that OAT is required for PDA cell growth and OAT-mediated putrescine production is a major contributor to growth maintenance. Similar results were observed in two additional human PDA cell lines, MIA PaCa-2 and SUIT-2 (Extended Data Fig. 5f–j). Furthermore, knockdown specificity was confirmed via ectopic expression of OAT or ODC1, which rescued proliferation as well as total and 15N-Gln-derived ornithine and putrescine levels (Extended Data Fig. 6a–d).
In non-transformed HPDE cells, OAT silencing (Extended Data Fig. 6e) further suppressed the low levels of 15N-Gln-derived ornithine and putrescine, while simultaneously inducing a striking compensatory increase (7- to 9-fold) in synthesis from 15N-Arg (Fig. 2d). This in turn led to a moderate increase (1.5- to 2-fold) in total ornithine and putrescine pools (Fig. 2e), without affecting proliferation (Extended Data Fig. 6f). These data contrast with the effects of OAT silencing in PDA, where no significant compensatory increase in arginine-derived ornithine or putrescine is observed (Fig. 2b, c), and PDA cell proliferation is severely mitigated (Extended Data Fig. 5d, e, j), underscoring the critical role of OAT in pancreatic cancer but not normal cells, and its potential for therapeutic targeting.
To evaluate the in vivo requirement for DNS in PDA, we generated and monitored the growth of orthotopic xenografts derived from human PDA cells bearing knockdown of OAT or ODC1. Silencing of OAT or ODC1 suppressed PDA growth (Fig. 2f, Extended Data Fig. 6g, h), significantly reducing tumor size over a 4-week period (2.45 and 2.7-fold, respectively). Similar to human PDA cells, knockdown of Oat or Odc1 in murine cells derived from iKrasG12D mice resulted in impaired glutamine-derived ornithine and putrescine synthesis (Extended Data Fig. 6i–k) and suppressed in vitro proliferative capacity, which was rescued by putrescine supplementation (Extended Data Fig. 6l). This was mirrored in iKras cells with CRISPR/Cas9 loss of Oat or Odc1 (Extended Data Fig. 7a–e), although ornithine did not accumulate as significantly as in human PDA cells upon ODC1 loss (Extended Data Figs. 6k, 7d, compared to Fig. 2c), preventing strong suppression of DNS or induction of arginine-derived ornithine synthesis (Extended Data Figs. 6j, 7c compared to Fig. 2b). Similar to human orthotopic xenografts in immune-deficient Rag1−/− mice (Fig. 2f, Extended Data Fig. 6g, h) murine PDA orthotopic transplants derived from Oat-null or Odc1-null iKras cells displayed suppressed in vivo growth in syngeneic immune-competent mice (Extended Data Fig. 7f–h). These in vitro and in vivo results indicate that the requirement for DNS and polyamine synthesis for PDA growth is cell-autonomous and independent of a previously reported role for polyamines in inducing evasion from anti-tumor immunity16. Consistent with the in vitro findings, both DNS and polyamine synthesis were impaired in Oat KO transplant tumors, but only putrescine synthesis was impaired in Odc1 KO tumors, as evidenced by depletion of 15N-labeled and total levels of ornithine and putrescine (Oat KO) or putrescine only (Odc1 KO) following infusion of 15N-Gln into tumor-bearing mice (Fig. 2g, Extended Data Fig. 7i, j). Although ARG2 is required for in vivo PDA growth7, the mechanisms of its effects involving enhanced nitrogen flux through active urea cycle in vivo, are distinct from that of OAT, which supports polyamine synthesis both in vitro and in vivo, independent of urea cycle activity. Indeed, neither ARG2 knockdown nor Arg2 knockout led to polyamine depletion in human or murine orthotopic transplants, respectively, but were rather accompanied by an indirect moderate increase in polyamine levels (Extended Data Fig. 7k, l). Importantly, the specificity of Oat and Odc1 knockouts was validated in vitro and in vivo. Overexpression of either gene in KO cell lines completely rescued cellular proliferation as well as glutamine-derived synthesis of ornithine (Oat) and putrescine (Oat and Odc1) (Extended Data Fig. 7m–p), and this rescue was reflected in the recovered in vivo growth of Oat-KO orthotopic transplant tumors ectopically expressing Oat, but not GFP, (Fig. 2h, Extended Data Fig. 7q).
We then asked whether uptake by PDA cells of polyamines from the TME could compensate for decreased intracellular levels, potentially hindering the success of in vivo targeting of polyamine synthesis6,17. We found that impaired DNS, which results in depletion of intracellular and intratumoral ornithine and putrescine pools (Fig. 2b, c, g, Extended Data Fig. 7c, d, j), leads to a similar decrease in the TIF of orthotopic Oat-null tumors, which is then rescued by ectopic Oat expression (Fig. 2i, Extended Data Figure 7r). These results indicate that polyamines present in the TME are mostly derived from PDA cells, and not from non-cancer cells, providing a therapeutic window for specific and efficient targeting of PDA simply via OAT inhibition.
KRAS drives polyamine synthesis in PDA
An in silico search for putative transcription factor (TF) motifs common to all four key polyamine synthesis genes in PDA (OAT, ODC1, SRM and SMS) revealed 6 potential candidates conserved between humans and mice that are located near the transcriptional start site of OAT: ZBTB14, SP1, KLF6, GTF2IRD1, CHURCH1, EGR1 (Extended Data Fig. 9a, b). Because MYC, a KRAS responsive gene, can transcriptionally induce ODC1 in lymphoma18, we also validated its role, and found it only mildly affects Srm expression (Extended Data Fig. 9c). Silencing of Klf6 however, but none of the other TFs, significantly decreased the expression of Oat, Odc1, Srm, Sms, but not Arg2 (Extended Data Fig. 9d, e). These effects were abrogated upon KrasG12D extinction (Fig. 3g, Extended Data Fig. 9f), indicating that Klf6 is a downstream effector of KrasG12D, likely at the post-transcriptional level as Klf6 mRNA levels were only mildly decreased (Extended Data Fig. 9g). Consistently, loss of Klf6 suppressed glutamine-derived but not arginine-derived ornithine or putrescine levels, even in the presence of KrasG12D (Fig. 3h, Extended Data Fig. 9h). Thus Klf6 is a key player in Kras-driven transcriptional upregulation of de novo ornithine and polyamine synthesis (Fig. 3i).
Fig. 3 |. KRAS promotes DNS and polyamine synthesis in PDA.

a, b, Relative abundance of 15N-labeled (a) or total (b) ornithine and putrescine in 2 iKras cell lines maintained with or without Dox (72 h) and fed 15N-(amine)Gln or 15N4-Arg 24 h before harvest. n = 4. c, Relative abundance of metabolites in a normalized to abundance of 15N-glutamate. d, mRNA levels in cells from a deprived of Dox for indicated times. n = 3. e, Protein levels in cells from d, off Dox for 72 h. Arrowhead indicates non-specific band (ODC1 antibody ab97395). f, Protein levels in human PDA cells with Dox-inducible knockdown of GFP (Tet on-shGFP) or KRAS (Tet on-shKRAS hairpins #1 and #2). g, mRNA levels of genes in iKras cells with Scramble (Scr) or Klf6 (hairpins #1 and #3) knockdown, with or without Dox (72 h; n =3). h, Relative abundance of 15N-labeled ornithine and putrescine in iKras cells from g, fed 15N-(amine)Gln or 15N4-Arg 24 h before harvest. n = 4. i, Model for KRAS transcriptional regulation of polyamine synthesis in PDA. n indicates biological replicates. Data are mean ± s.d. p-values were obtained by one-way (a-c) or two-way (d, g, h) ANOVA followed by Tukey test. In d, g, statistical significance is for Off Dox vs. On Dox (d) or shKLF6 vs. shScr (g). In e, f, β-Actin was used as loading control. Data represent three (a-e, g) or two (f, h) independent experiments.
Inhibition of OAT mitigates PDA growth
We compared the impact of pharmacological inhibition of OAT to that of ODC1, on PDA growth. We used the ODC1 inhibitor difluoromethylornithine (DFMO)19,20, which failed as a single therapeutic agent in cancer clinical trials but displays more promise in chemoprevention21. In comparison, we used 5-fluoromethylornithine (5-FMO), a specific irreversible inhibitor of OAT22, previously used in zebrafish and mice to enhance ammonia detoxification and protect the liver from toxic agents22–24. Treatment of human or murine PDA cells with 5-FMO robustly suppressed, to almost undetectable levels, glutamine-derived, but not arginine-derived, ornithine and putrescine synthesis (Fig. 4a, Extended Data Fig. 10a), leading to ~3-fold reduction in total ornithine and ~10-fold or 3-fold reduction in total putrescine pools in human or murine cells, respectively (Extended Data Fig. 10b, c); conversely, only the synthesis of putrescine, whether derived from glutamine or arginine (Fig. 4a, Extended Data Fig. 10a), was suppressed by DFMO, which effects on total putrescine pools were comparable to those of 5-FMO (Extended Data Fig. 10b, c).
Fig. 4 |. OAT inhibition suppresses PDA and alters its transcriptome similar to ODC1.

a, 15N-labeled ornithine and putrescine in AsPC-1 cells treated (72 h) with OAT (5-FMO) or ODC1 (DFMO) inhibitors and fed 15N-(amine)Gln or 15N4-Arg 24 h before harvest. n = 4. b-e, Growth (7 days) of 5-FMO-treated PDA (b) or breast cancer (c) cells; or HPDE cells with OAT #1, ODC1 #1 or Scramble (Scr) knockdown treated with either 5-FMO (d) or DFMO (e). n = 8. f, Weights of tumors from iKrasG12D mice pre-treated with Dox 7 days prior to daily intraperitoneal injection of saline or 5-FMO for 14 days. n = 11 except female saline (10) or 10mg kg−1 (9). g, Percent 15N-labeled glutamine and abundance of 15N-ornithine and putrescine in tumors of male mice from f. n = 4. h, Heatmap of differentially expressed genes in AsPC-1 cells with Scr, ODC1, OAT, or ARG2 knockdown (2 hairpins per gene). n = 3. Clusters I-VIII were identified by unsupervised k-means clustering (1-Spearman correlation). i, Correlation of gene expression changes and nearby (< 25 kb) chromatin accessibility for 561 genes from Cluster I in h. Dark blue dots indicate genes in negatively enriched pathways (GSEA), with total number indicated in specific plot quadrants (See Extended Data Fig. 12d, f). j, Heatmaps of genes from negatively enriched pathways in cells from h (n = 3), with corresponding GSEA plots. NES normalized enrichment scores, FDR false discovery rate, Nom. Nominal. n indicates biological replicates, or mice per group in f, g. Data are mean ± s.d. (a, f, g) or ± s.e.m (b-e). p-values were obtained by one-way ANOVA followed by Tukey test (a, f, g) or paired two-tailed test (d, e). Data represent two (a, c, e) or three (b, d) independent experiments.
Similar to genetic OAT inhibition, the growth of both murine and human PDA cell lines was impeded by 5-FMO (Fig. 4b). In contrast, and consistent with their preference for polyamine synthesis from arginine, human breast cancer cells were not affected or mildly affected by 5-FMO (Fig. 4c). Importantly, either loss of OAT or addition of putrescine (10 μM) obliterated the anti-proliferative effect of 5-FMO on PDA cells (Extended Data Fig. 10d–f), demonstrating specificity of 5-FMO in targeting OAT, which is required for polyamine synthesis. In contrast, impairment of PDA cell growth by DFMO was either maintained or became further exaggerated upon knockdown or knockout of ODC1, indicating off-target effects (Extended Data Fig. 10g, h). Moreover, unlike 5-FMO, DFMO significantly suppressed the proliferation of HPDE cells, independent of ODC1 expression (Fig. 4d, e) This indicates that DFMO indiscriminately affects cancer and non-cancer cells, and that the drug anti-proliferative effects are non-specific to ODC1, perhaps partially contributing to its limited success in clinical trials.
We then tested whether inhibition of polyamine biosynthesis could promote a compensatory uptake of extracellular polyamines, attenuating its anti-cancer therapeutic potential6. Genetic but not pharmacological inhibition of OAT (Extended Data Fig. 10i, j), led to a moderate (~1.5-fold) increase in uptake within 1 hour of 13C-putrescine addition, indicating that chronic rather than acute inhibition may be required for compensation to occur. Polyamine blocking therapy (PBT), which combines polyamine biosynthesis inhibition with blockade of polyamine transport, has recently emerged as a strategy to circumvent this compensatory uptake17. We thus tested the combinatorial effects of 5-FMO and the polyamine transport inhibitor AMXT-150125,26 on PDA cell growth over 7 days. Whereas the presence of putrescine had no effect in the absence of inhibitors (Extended Data Fig. 10k, grey bars), indicating that DNS is sufficient to drive full proliferative capacity, putrescine addition rescued a 2.3-fold growth suppression resulting from 5-FMO treatment (red bars). AMXT-1501 alone however, led to a modest (1.3-fold) decrease in cell growth only in the presence of putrescine (blue bars), confirming drug specificity and indicating that the contribution of extracellular polyamines to PDA growth is not fully compensated for by DNS within this experimental timeframe. Consequently, combinatorial treatment with both inhibitors led to an additive growth suppressive effect when putrescine was present (3.6-fold, Extended Data Fig. 10k, grey vs. green bars). Because the total number and nature of polyamine transport systems remain largely unknown6 however, alternative mechanisms for the observed transport inhibitor effects in the presence of putrescine (Extended Data Fig. 10k, green bars) cannot be currently ruled out. Moreover, although these results suggest a promising potential of PBT, they require further validation in an in vivo setting, where intrinsic OAT expression in PDA cells is the major contributor to polyamines in the TME (Fig. 2i), and its genetic loss alone is sufficient to significantly suppress tumor growth (Fig. 2f, Extended Data Figs. 6g, h and 7f–h). Consistently, pharmacological inhibition of OAT in vivo caused a significant and dose-dependent suppression of PDA in iKras mice treated with 5-FMO alone (~1.4-fold for 10mg/kg and 1.9-fold for 30mg/kg, Fig. 4f), and was accompanied by almost complete suppression of ornithine and putrescine synthesis with ~ 2.3 to 2.5-fold decreases in total pools, respectively (Fig. 4g, Extended Data Fig. 10l, m). Notably, no toxicity-related changes in liver weight were observed (Extended Data Fig. 10n) and the treated mice maintained their body weights as compared to non-treated controls (Extended Data Fig. 10o), which experienced tumor-associated body wasting. Future in vivo studies would further validate the effectiveness of combinatorial use of OAT inhibitors with current therapeutic interventions in pancreatic cancer, as in vitro co-treatment of PDA cells with 5-FMO and the chemotherapeutic agent gemcitabine led to an additive anti-proliferative effect (Extended Data Fig. 10p).
Polyamines can alter the immune populations in the TME27,28 inducing evasion from anti-tumor immunity16,29,30. Lack of either Oat or Odc1 in orthotopic iKras PDA tumors did not alter the frequency of CD8+ T cells, but did result in a modest yet significant increase in CD4+ T cells, along with a reduction in immune suppressive granulocytic MDSCs (GrMDSCs, Extended Data Fig. 11a), consistent with smaller tumor sizes and reduced polyamine content in the TME (Fig. 2h, i). However, this is unlikely to be the major anti-tumorigenic mechanism of decreased polyamine levels because silencing of OAT or ODC1 in human PDA cells resulted in a reduction in tumor burden when grown orthotopically in RAG1−/− mice that lack adaptive immunity and are hence devoid of T cells (Fig. 2f, Extended Data Fig. 6g, h). Moreover, pharmacologic inhibition of OAT with 5-FMO (10 or 30mg.kg−1) in autochthonous immune-proficient iKras tumor-bearing mice failed to induce any significant changes in any of the immune cell populations analyzed in the tumors or tumor draining lymph nodes (Extended Data Fig. 11b–f). Although this may seem at odds with recent findings by Puleston et al. 2021 who showed that polyamine synthesis is critical for differentiation of Tregs from naïve CD4+ T cells27, we propose that maintenance of existing Treg populations -as is the case in this study- may be less dependent on polyamine synthesis.
OAT mediates genomic alterations in PDA
Polyamines can affect transcription, translation6,31, chromatin structure27,28,32,33 and epigenetically modulate the activation and specification of immune cells27,28,32. However, how polyamines alter the open chromatin landscape and transcriptome in cancer cells, particularly PDA, remains unknown. We used RNA-Seq to profile transcripts in human AsPC-1 PDA cells that either express or lack ODC1, OAT or ARG2, allowing us to assess the differential contribution of glutamine-derived vs. arginine-derived polyamines to transcriptional alterations in PDA. We found that the numbers of differentially expressed genes (q < 0.05) common to cells with knockdown of OAT or ODC1 are approximately double those shared among cells with ARG2 or ODC1 knockdown (Extended Data Fig. 12a). Unsupervised k-means clustering of differentially expressed genes with ODC1 knockdown (q < 0.05) demonstrated higher similarity in transcriptional changes in cells with knockdown of OAT rather than ARG2, with the latter being more similar to control (Fig. 4h). Given that ODC1 is the main rate-limiting enzyme for polyamine synthesis, these data consolidate our findings of greater contribution for OAT rather than ARG2 in providing ornithine for polyamine synthesis and further indicate significant effects of OAT inhibition on polyamine-induced transcriptional changes.
To investigate a potential epigenetic basis for these transcriptional alterations, we performed assays for transposase-accessible chromatin with high throughput screening (ATAC-Seq) on the PDA cells and identified subtle but significant changes in chromatin access (q < 0.05) upon silencing of ODC1, including gains and losses at 137 and 175 enhancer regions, respectively (Extended Data Fig. 12b). Zooming into the largest clusters of differentially expressed genes that hold consistent common changes upon ODC1 and OAT knockdown (Fig. 4h, cluster I: 561 genes and cluster V: 403 genes), we found that reduced mRNA levels for ODC1 and OAT but not ARG2 knockdown, are concordant with decreases in chromatin access in cluster I (Fig. 4i) and vice versa in cluster V (Extended Data Fig. 12c), implying a role for OAT but not ARG2 in polyamine-driven alterations in chromatin access that correspond to significant changes in gene expression.
Gene set enrichment analysis (GSEA) on all 2,698 differentially expressed genes in PDA cells with ODC1 knockdown (Fig. 4h) identified top 18 negatively enriched pathways involving 122 genes related to cellular proliferation, differentiation, response to growth factors, cytokines and response to starvation (Fig. 4j, Extended Data Fig. 12d, e), consistent with suppressed tumor growth upon OAT or ODC1 silencing (Fig. 2, 4, Extended Data Figs. 5, 6, 7). About half of these genes (58/122) form part of cluster I (Fig. 4h), and their expression correlates with nearby (< 25kb) chromatin accessibility (Fig. 4i, dark blue dots, Extended Data Fig. 12f). Importantly, expression of a randomly selected sample (7 genes) from this group can be restored upon supplementation with putrescine (Extended Data Fig. 12g), further confirming a significant role for OAT but not ARG2 in polyamine-driven transcriptional and epigenetic changes related to PDA growth.
Altogether, these results highlight a distinct dependency of PDA on glutamine-derived ornithine for polyamine synthesis. This dependency contrasts with that of the majority of normal tissues and other cancer types, which rely on arginine-derived ornithine. Because polyamines are involved in fundamental cellular processes that are critical for both normal and tumor cells, the unique dependency of PDA on OAT-mediated DNS provides a specific and effective strategy to tackle pancreatic cancer with minimal toxicity.
Discussion
We propose that PDA dependence on glutamine-derived DNS stems from both its major oncogenic driver KRAS and its TME arginine depletion12. The latter is consistent with PDA enrichment with myeloid-derived ARG114,15, but could also result from PDA reliance on protein and amino acid turnover34, enhancing flux into the urea cycle7 for the disposal of excess nitrogen and the use of arginine for protein synthesis. This would then direct the OAT-catalyzed reaction, as in infancy and the adult fasting intestine5, towards ornithine synthesis from glutamine, which is abundant in the TME12 (Fig. 1i).
Therapeutic failure of ODC1 inhibition in the clinic was attributed to a compensatory increase in polyamine uptake by cancer cells, with current efforts directed towards concomitant inhibition of polyamine transport6,17. We find however that PDA cells are the major contributors to TME polyamines via DNS and propose that the limited effectiveness of DFMO may have stemmed from its off-target effects, potential harm on normal cells35, and poor pharmacokinetics. The latter may partly result from DFMO rapid in vivo clearance36 and the short half-life (~20 min) of its target ODC137, which contrast with a more stable OAT protein (~24 h half-life)38 and slower clearance of its inhibitor 5-FMO22.
Although ODC1 inhibitors with higher specificity could be developed, this enzyme is also required for polyamine synthesis in normal cells. In contrast, OAT presents as a more attractive target, with its inhibition suppressing polyamine levels in PDA but not normal cells, without inducing compensatory increases in arginine-derived polyamine synthesis. It is noteworthy that OAT deficiency causes gyrate atrophy, a rare autosomal recessive disorder that can lead to vision loss by mid to late adulthood5,39. However, given the slowly progressing nature of this disease, and that it takes decades for ocular lesions to manifest, acute systemic inhibition of OAT is expected to be safe and effective, as reported in mice22,23,40,41. With the exception of one study linking murine hepatocellular carcinoma (HCC) to enhanced Oat-mediated ornithine degradation to generate glutamine42, no correlation had previously been reported between OAT and cancer and none were described in the direction of DNS and polyamine synthesis, perhaps justifying the lack of 5-FMO testing in cancer patients.
Importantly, MEK activation may not fully account for all downstream metabolic effects of KRAS in PDA, including OAT activity. MEK inhibition could also result in release of negative feedback loops, activating compensatory pro-tumorigenic signaling43, partially explaining lack of efficacy in using AZD6244 as a single agent or a second-line treatment in patients with advanced pancreatic cancer44,45. Instead, available OAT inhibitors such as 5-FMO, or more potent specific inhibitors developed in the future could be used as a novel strategy, in combination with chemotherapy, to treat pancreatic cancer patients with minimal toxicity.
Methods
Reagents.
Antibodies for immunoblots, immunostaining and flow cytometry are described in SI Table 1; Chemicals and other reagents are described in SI Table 2.
Animal work.
All animal studies and procedures were approved by and performed in compliance with the Institutional Animal Care and Use Committee (IACUC) at Boston Children’s Hospital. No statistical methods were used to predetermine sample size. For experiments using autochthonous models of PDA, the established Dox-inducible TetO-LSL-KrasG12D;ROSA-rtTA;p53fl/fl;p48-Cre or iKrasG12D mouse model was used8. iKrasG12D mice and littermates harboring p53fl/fl;p48-Cre alleles but not TetO-LSL-KrasG12D transgene, herein termed iKrasWT were administered 2g. L−1 Dox in the drinking water at 5 weeks of age for 3 weeks, prior to euthanasia and tissue harvest.
For human orthotopic xenografts of PDA (except those with or without ARG2 expression), 500,000 AsPC-1 cells suspended in 25 μl 33% Matrigel (BD Biosciences 356231) in HBSS were injected into the pancreas of 6–7 week-old male immune-deficient B6.129S7-Rag1tm1Mom/J mice termed Rag1−/− mice (Jackson Laboratory #002216) and grown for 4 weeks; For xenografts of PDA with ARG2 silencing, 100,000 AsPC-1 cells were injected into the pancreas of 12–14 week old male Rag1−/− mice and grown for 6 weeks. For immune-proficient murine orthotopic transplant models of PDA (except those with or without ARG2 expression), 500,000 iKras cells previously derived from male iKrasG12D mice were injected into the pancreas of 10-week old male mice of the same strain that however lack p48-Cre. Transplant mice were then administered 2g. L−1 Dox in the drinking water to maintain tumor KrasG12D expression. For murine orthotopic transplants that lack or express Arg2, Arg2+/+ or Arg2−/− KPC cell lines previously derived from KPC; Arg2+/+ or KPC; Arg2−/− mice7, respectively, were injected (2.5 × 10⁵ cells) into the pancreas of 11–13 week old male C57BL/6J-129 svJae mice and grown for 2 weeks. KPC;Arg2+/+ and KPC;Arg2−/− mice had been generated by crossing KPC46,47 mice (LSL-KrasG12D;p53fl/fl;pdx-1-Cre) to Arg2−/− mice (Arg2tm1Weo/J, Jackson Laboratory #020286). In all in vivo experiments, tumor burden did not exceed the maximum permitted by the IACUC, that is 15% of the mouse body weight or 1.5 cm in combined sum of diameters of all tumors (if multiple are present), whichever comes first. The experiments were not randomized. The investigators were not blinded to allocation during experiments or outcome assessment.
Ultrasound imaging.
In vivo ultrasound imaging (Vevo 3100, FujiFilm, MS559D Scanhead) was used to detect and quantify pancreatic tumors in mice at the Small Animal Imaging Lab (SAIL) at Boston Children’s Hospital. An abdominal 3D scan was performed to measure tumor dimensions and volume as previously described48.
Necropsy.
Mice were euthanized at the beginning of the light cycle after retroorbital blood withdrawal for plasma preparation. Tumors were harvested and weighed, followed by measurement of their dimensions (termed a, b and c) with a caliper and tumor volume was estimated according to the ellipsoid formula49: 4/3 × π × (a/2 × b/2 × c/2). Tumors were then either immediately frozen in liquid nitrogen or fixed in formalin for subsequent processing.
Isolation of interstitial fluid.
Pancreatic tumor interstitial fluid (TIF) and normal pancreas interstitial fluid (NIF) were collected by centrifugal methods as described previously12. Rapidly dissected tumors and pancreas were quickly rinsed in saline, blotted on filter paper (Whatman, 1001) and placed on top of a 20 μm nylon filter (Spectrum Labs, Waltham, MA, 148134) followed by centrifugation (10 min, 200 × g, 4 °C). Interstitial fluids and tissues were collected and snap-frozen in liquid nitrogen for LC-MS analysis. NIFs were pooled from 2–3 healthy pancreas to get sufficient amounts (>10 μL) for LC-MS analysis, whereas TIF did not necessitate pooling (each tumor yielded 20–150 μL).
Cell culture.
Human pancreatic, breast, colon and prostate cancer cell lines were obtained from the American Type Culture Collection or ATCC (pancreatic: AsPC-1, BxPC-3, HPAC, MIA PaCa-2, PANC-1 and SW1990; breast: BT-474, MCF7, MDA-MB 157, MDA-MB 361, T-47D and ZR-75–1; lung: A549, Calu-1, NCI-H596, NCI-H838, NCI-H1299 and NCI-H1975; colorectal: SW480, SW620; prostate: PC3, DU-145); except for pancreatic cancer cells SUIT-2 which were from the Japanese Collection of Research Bioresources; PA-TU-8902 and PA-TU-8988T were from the German Collection of Microorganisms and Cell Cultures; PI3K-wild-type and mutant isogenic colorectal cancer cells HCT116WT and HCT116PIK3CA as well as DLD-1WT, were kindly provided by Bert Vogelstein50 (Johns Hopkins University, MD). Non-transformed immortalized cells were obtained as follows: human pancreatic ductal epithelial (HPDE) cells were a gift of Ming-Sound Tsao at University Health Network, Princess Margaret Hospital (Toronto, Canada); mammary epithelial cells (MCF10A) were from the Karmanos Cancer Institute (Michigan, USA); lung bronchial epithelial (BEAS-2B), colonic epithelial (FHC) and prostate epithelial (RWPE-1 and RWPE-2) cells were from ATCC. Prevalent genetic mutations in the above cancer cell lines are described in SI Table 3. All cancer cell lines were grown in RPMI-1640 (Sigma) supplemented with 10% fetal bovine serum and 1% penicillin-streptomycin (Gibco). HPDE, RWPE-1 and RWPE-2 were grown in keratinocyte serum-free media supplemented with 5 ng ml−1 of human recombinant epidermal growth factor and 50 mg ml−1 of bovine pituitary extract (Invitrogen, 17005042); BEAS-2B was grown in bronchial epithelial cell medium (Lonza, CC-3170). MCF10A and FHC cells were maintained as previously described51,52. Human PDA cell lines were authenticated by STR profiling at ATCC. Murine PDA cell lines (iKras #1 and iKras #2) were established from two independent iKrasG12D;p53fl/fl primary tumors as previously described8 and maintained in RPMI-1640 medium containing 10% fetal bovine serum, 1% penicillin-streptomycin (Gibco) and 1μg ml−1 of Dox. The same Dox concentration (1μg ml−1) was used to induce gene knockdown in Tet on-shKRAS vs. Tet on-shGFP cells. All PDA cell lines tested negative for mycoplasma using LookOut Mycoplasma PCR Kit (Sigma, MP0035). Cells were maintained at 37 °C in a humidified incubator with 5% CO2 and passaged every 48h to 72 h so they do not exceed 70% confluency.
Cell proliferation and cell death assays.
Cells were seeded on day 0 in their respective maintenance culture medium in 96-well plates, at a density of 1,000 cells per well except for MIA PaCa-2, PA-TU-8988T, SUIT-2 (500 per well) and iKras cells (200 per well), and were grown for 7 days. On day 1, the cells were washed twice with serum-free RPMI medium and incubated in their experimental medium supplemented with 10% dialyzed FBS and propidium iodide (PI, 2 μg ml−1) for up to 7 days without media replenishment. Cells were imaged and counted on the indicated days using the Celigo Image Cytometer (Nexcelom Bioscience). For live cell proliferation curves, the number of PI-negative cells on each day was normalized to day 1 and fitted to the exponential growth equation Y=Y0e(kX) to obtain the rate constant (k), where X is time (in hours) and Y is fold change in live cell number. Then, the equation DT = ln(2)/k was used to compute doubling time. For growth inhibition curves upon drug treatment, fold changes in live cell number for 7 days (day7/day1) of PDA cells treated with inhibitors were normalized to fold changes of untreated control cells. Dead cells were presented as percentage of PI-positive cells per total cell number.
Infusion of labeled metabolites.
Mice were infused via the jugular vein53 with 15N(amine)-glutamine (99% enrichment; Cambridge Isotope Laboratories) as a bolus of 0.28 mg g−1 body weight (0.3 ml) administered over 1 min, followed by continuous infusion of 0.005 mg g−1 min−1 for 180 min; alternatively, mice were infused with15N4-arginine (98% enrichment; Cambridge Isotope Laboratories) as a bolus of 0.084 mg g−1 body weight (0.3 ml) administered over 1 min, followed by continuous infusion of 0.0015 mg g−1 min−1 for 180 min. Tail blood was collected at 30 min intervals and used to quantify plasma enrichment of labeled nutrients by LC-MS. Mice were euthanized after 1h-, 2h- or 3h-infusion and the tumors or normal pancreas rapidly harvested, weighed and snap-frozen in liquid nitrogen for LC-MS analysis.
Metabolic tracing and analyses.
In all tracing studies, M+1 and M+2 indicate mass shifts of 1 or 2 nitrogens, respectively. For in vitro 15N-based stable isotope labeling studies, cultured cells were incubated for 24 h with 15N(amine)-glutamine or 15N4-arginine in RPMI medium supplemented with 0.1% FBS and 100 ng ml−1 IGF-1, in lieu of 10% FBS, so as to exclude serum arginase activity, as previously established7. Cells were then rinsed in ice-cold PBS and metabolites extracted with ice-cold 80% methanol, vortexed and centrifuged (10 min, 13,300 × g, 4 °C). Supernatants were transferred and dried with Speedvac. Dried extracts were suspended in 100 μl of extraction solution containing isotope-labeled internal standards (acetonitrile: methanol: formic acid at 75:25:0.2, v:v:v), 0.2 ng μl−1 d8-phenylalanine and d8-valine followed by centrifugation and analysis of the supernatant by LC-MS.
For in vivo tracing of 15N(amine)-glutamine or 15N4-arginine: tissues (20–30 mg) were homogenized using a Qiagen TissueLyzer II in water at 1:4 (w:v). 10 μl of each tissue homogenate was combined with 90 μl of the above extraction solution and the supernatants were analyzed using a liquid chromatography tandem mass spectrometry (LC-MS) method designed to measure polar metabolites as described previously54. Briefly, hydrophilic interaction liquid chromatography (HILIC) analyses of water-soluble metabolites in the positive ionization mode were conducted using an LC-MS system comprised of a Shimadzu Nexera X2 U-HPLC (Shimadzu Corp.; Marlborough, MA) coupled to a Q Exactive mass spectrometer (Thermo Fisher Scientific; Waltham, MA). The samples were centrifuged (10 min, 10,000 × g, 4°C), and the supernatants were injected directly onto a 150 × 2 mm, 3 μm Atlantis HILIC column (Waters; Milford, MA). The column was eluted isocratically at a flow rate of 250 μl min−1 with 5% mobile phase A (10 mM ammonium formate and 0.1% formic acid in water) for 0.5 min followed by a linear gradient to 40% mobile phase B (acetonitrile with 0.1% formic acid) over 10 min. MS analyses were carried out using electrospray ionization in the positive ion mode using full scan analysis over 55–750 m/z at 70,000 resolution and 3 Hz data acquisition rate. Other MS settings were: sheath gas 40, sweep gas 2, spray voltage 3.5 kV, capillary temperature 350°C, S-lens RF 40, heater temperature 300°C, microscans 1, automatic gain control target 1e6, and maximum ion time 250 ms. All 15N-isotopologues were corrected for natural abundance and normalized by protein concentration, and are indicated in figures as “relative abundance” comparing each metabolite among the different conditions. Abundance of total pools in the 15N-isotope tracing experiments indicates the sum of all 15N-labeled isotopologues corrected for natural abundance and 14N-isotopologues (unlabeled) that are then normalized to protein concentration.
For global steady-state metabolite profiling, data were generated by Metaboanalyst 4.0(55), median-normalized, log-transformed, mean-centered and divided by the s.d. of each variable.
Generation of cells with stable gene knockdown or knockout.
Sequences for the short hairpin (sh)RNAs and single guide (sg)RNAs used in this study are described in SI Table 4; For generation of PDA and HPDE cells with stable knockdown of the indicated genes, lentiviral supernatants produced from pLKO plasmids encoding the corresponding hairpins were used, and infected cells were selected for at least 7 days with 2 μg mL−1 puromycin or 10 mg mL−1 blasticidin. For generation of PDA cells with Dox-inducible KRAS knockdown, two distinct human KRAS hairpins were cloned into Tet-pLKO-puro plasmid (21915; Addgene). AsPC-1 and MIA PaCa-2 were infected with lentiviral supernatants from the above constructs (Tet on-shKRAS #1 and #2) and selected with puromycin.
To generate CRISPR/Cas9-mediated gene knockout in iKras cells, sgRNAs were cloned into the empty backbone construct pSpCas9(BB)-2A-Puro (PX459). 24 h after seeding, iKras cells were transfected with either the PX459 guide construct or empty PX459 plasmid for generation of sgCtrl cells using FuGENE 6 (Promega, E2691) according to the manufacturer’s protocol. Two days after transfection, cells were selected for 72 h with 2 μg mL−1 puromycin and then allowed to recover for 1 week in medium without puromycin before clonal selection. Individual clones that survived selection were validated by qPCR and Western blotting. At least two distinct single clones of Odc1 KO (#3 and #10) and Oat KO (#10 and #11) were expanded and used in experiments.
Ectopic expression in PDA cells.
For ectopic re-expression of ODC1 or OAT in human PDA cells with stable knockdown of either gene, cDNAs resistant to the respective hairpins were used as follows. Human ODC1 cDNA sequence from pCMV6-ODC1-Myc-DDT (Origene, RC 206858) was subcloned into the lentiviral vector pLJM15-neo-GFP (a gift from D.M. Sabatini, Whitehead Institute, Cambridge, MA) using the AgeI/EcoR1 restriction sites, thus excising the GFP cDNA from the vector. Because the hairpin sequence is in an intron of ODC1 gene, no further modification was made to this cDNA, which is inherently resistant to the hairpin. Human OAT cDNA sequence from pCMV6-OAT-Myc-DDT (Origene, RC201610) was subcloned into the lentiviral vector pLJM15-neo-GFP as described above and the target sequence in the cDNA modified by mutating three codons for threonine 26 from ACA to ACT, valine 28 from GTT to GTA and threonine 30 ACT to ACA using site-directed mutagenesis (QuikChange II Site-Directed Mutagenesis Kit, Agilent 200521).
For expression of Odc1 and Oat in knockout iKras cells, mouse Odc1 cDNA (Clone ID: 2645291) from pCMV-SPORT6-Odc1 (Horizon) and mouse Oat cDNA (Clone ID: 3498240) from pCMV-SPORT6-Oat (Horizon) were subcloned into the lentiviral vector pLJM15-neo-GFP as described above and stably transfected into iKras Odc1 KO and Oat KO cells. Because prior guide RNA expression for Crispr/Cas9 knockout in iKras cells was only transient, no further modification was made to the cDNAs as they would not be a target for Crispr/Cas9 deletion. Lentiviral supernatants were generated by transfecting the above constructs into HEK 293T cells and used to infect target cells. The infected cells were selected for at least 7 days with 1200 μg ml−1 G418.
Quantitative PCR or qPCR analysis.
Total mRNA was isolated using RNA STAT-60 according to the manufacturer’s instructions, treated with DNase I (RNase-free) and reverse-transcribed into cDNA with random hexamers using the SuperScript II First-Strand Synthesis System (Invitrogen, 18064071). The validated qPCR primers used in this study are listed in SI Table 5. qPCR reactions were performed in triplicates using an Applied Biosystems ViiA 7 Real-Time PCR system as previously decribed56. Reactions contained cDNA resulting from reverse transcription of 25 ng total RNA, 150 nM of each primer and 5 μl 2X-Jump Start SYBR Green PCR Mix (Invitrogen) in10 μl total volume. Relative mRNA levels were calculated using the comparative Ct (cycle threshold) method and normalized to cyclophilin.
Immunoblotting.
For western blotting, cells were rinsed once in ice-cold PBS and collected in lysis buffer containing 50 mM HEPES KOH, pH 7.4, 40 mM NaCl, 2 mM EDTA, 1.5 mM orthovanadate, 50 mM NaF, 10 mM pyrophosphate, 10 mM glycerophosphate, EDTA-free protease inhibitors and 1% Triton X-100. Proteins from total lysates were resolved by 8–12% SDS–PAGE, transferred to polyvinylidene difluoride (PVDF) and the blot was exposed to film. β-Actin was used as loading control.
Immunohistochemistry and analysis of PDA samples.
Formalin-fixed paraffin-embedded murine PDA tumors or normal pancreas, and human PDA tumors (8 cases, 4 represented) or human PDA tissue microarrays (TMAs, 31 cases) with 2–4 cores per case, were sectioned and stained with OAT antibody according to the manufacturer’s protocol. For human samples, patients seeking treatment at Massachusetts General Hospital (MGH), and having had no neoadjuvent treatment, consented that any resected tissues, which would otherwise be discarded following diagnosis, be used instead for research purposes (Institutional Review Board or IRB Protocol Number 2003P001289). Patients were provided this option irrespective of age, sex/gender, race of any other bias that could influence study outcomes. A pathologist assessed semi-quantitatively and in a blinded fashion, the expression of OAT using H score based on the intensity (0–3) of cytoplasmic staining and extent (%) of positive tumor cells (3 × percentage of strongly staining cells + 2 × percentage of moderately staining cells + 1 × percentage of weakly staining cells) ranging from 0 to 300.
Analysis of public data.
Gene expression plots in Extended Data Fig. 4a were obtained using RNA sequencing data of tumors and normal samples from the TCGA and GTEx projects that were analyzed on the Gene Expression Profiling Interactive Analysis or GEPIA57 web server: http://gepia.cancer-pku.cn. For each cancer type, the expression data were first log2(TPM+1) transformed for differential analysis and the log2FC (fold change) was defined as median(tumor) - median(normal). One-way ANOVA was conducted and genes were considered differentially expressed using a log2FC cut-off of 1 and p-value cut-off of 0.01.
Identification of transcription factors regulating ornithine and polyamine synthesis genes.
Transcription factors and their binding sites were predicted using TRANSFAC database (version 1.9) with the MATCH tools (FMatch for analysis of a set of genes; Match for analysis of a single gene). The default −500 – +100 bp from of the transcription start site of each gene (OAT, ODC1, SRM and SMS) was analyzed.
RNA-Seq.
250,000 cells per 10 cm plate were seeded overnight, washed with PBS and incubated in RPMI medium supplemented with 0.1% serum and 100 ng ml−1 IGF-1 for 24 h. Total RNA was isolated and purified using miRNeasy Mini Kit (Qiagen-217004) and sent to Novogene Corporation, Inc. (Sacramento, CA) for sequencing library preparation (polyA). The libraries were sequenced with the NovaSeq 6000 platform, pair-end mode of 150 bp to obtain 30 million read sequencing depth per sample. Sequence reads were aligned to a transcriptome reference by STAR aligner (version 2.7.8a)58 using the GRCh38 reference genome supplemented by read-length-specific exon-exon junction sequences (GENCODE V35 gene annotations) and bam files were generated using Samtools (version 1.11)59. Differential expression analysis was performed in a pairwise manner across all conditions using DESeq260. To quantify exon and gene expression, reads per kilobase per million mapped reads (RPKM) metrics was calculated using DESeq2 total normalized count. Pathway enrichment analysis was performed using GSEA (version 4.1)61 and Molecular Signature Database (MSigDB) version 7.4, Gene Ontology (GO) sets c5.all. All figures were generated by R statistical software62. In heatmaps, red indicates higher expression, blue lower expression, relative to the mean expression level of each gene across all groups.
ATAC-Seq.
100,000 cells per well in 6-well plate were seeded overnight, washed with PBS and incubated in the optimized RPMI medium that was supplemented with 0.1% serum and 100 ng ml−1 IGF-1 for 24 h. Cells were then trypsinized and 50,000 single cells were washed twice in ice-cold PBS, resuspended in 50 μl ice-cold ATAC lysis buffer (10 mM Tris-HCl, pH 7.4, 10 mM NaCl, 3 mM MgCl2, 0.1% (v/v) Igepal CA-630), and centrifuged at 500 g at 4°C to isolate nuclear pellets that were treated in 50 μL reactions with Nextera Tn5 Transposase (Illumina, FC-121–1030) for 30 min at 37°C. Transposed DNA was purified using a PCR purification kit (Zymo research, D4034) and then amplified immediately in 50 μl reactions with high-fidelity 2X PCR Master Mix (New England Biolabs) using a common forward primer and different reverse primers with unique barcodes for each sample. From the reaction mix, 45 μl was kept on ice after 5 cycles of PCR, while 5 μl was amplified by qPCR for 20 additional cycles; the remaining 45 μl was then amplified for the 5–7 cycles required to achieve 1/3 of the maximum qPCR fluorescence intensity. Amplified DNA was purified over columns and primer dimers (< 100 bp) were removed using AMPure beads (Beckman Coulter), after which the amplified DNA was quantified using High-sensitivity Qubit dsDNA Assay Kit (ThermoFisher) and DNA size distribution was determined using High Sensitivity DNA Assay on Agilent Bioanalyzer. Libraries were sequenced using NovaSeq 6000 platform (Novogene Corporation, Inc. Sacramento, CA) to obtain 150 bp pair-end reads. Sequence reads were aligned to GRCh38 using Bowtie2 (version 2.4.2)63 and converted to bam format by Samtools (version 1.11). Sequence reads that aligned to the same genomic coordinate were counted only once in the profile generation. Enriched regions were identified using MACS264 in each data with q-value threshold of 0.01. MACS2 identified enriched regions overlapping with ENCODE65 blacklist regions were eliminated. The remaining regions across all data were then merged into a single catalogue of open chromatin regions. Bedtool (version 2.30)66 and DESeq2 were used to calculate the number of reads in each region for each library and determine differentially marked regions (q < 0.05) across all samples, respectively. Normalized signal across each region was calculated as reads per kilobase per million mapped reads (RPKM) using DESeq2 normalized total reads. Heatmap of ATACseq signal was generated using Deeptools (version 3.5.1)67 with 1X normalization.
Flow cytometry.
Tissues were prepared for flow cytometry analysis using the protocol adapted from previous work68. Briefly, pancreas was excised, weighed, then pancreatic draining lymph nodes were removed and pancreatic head and tail were separated. Samples were minced then placed in RPMI-1640 containing collagenase type IV and soybean trypsin inhibitor at 37°C for 30 min. Tumors were filtered through a 40-micron cell strainer, washed with PBS and centrifuged at 300g for 5 min. The cell pellet was resuspended in FACS buffer (PBS with 2% fetal calf serum) and stained with a master mix of antibodies purchased from Biolegend, as described in SI Table 1. Draining lymph nodes were crushed through a 40-micron cell strainer and resuspended FACS buffer for staining. Cells from pancreatic draining lymph nodes, pancreas head and pancreas tail were incubated with extracellular staining mix in FACS buffer for 30 min on ice, washed once with PBS and either resuspended in 1% formalin/PBS for extracellular analysis or fixed, permeabilized and stained with intracellular antibodies against specific cytokines (eBioscience Foxp3/Transcription Factor Staining Buffer Set). Analysis was performed on a BD Fortessa flow cytometer using FlowJo v10.8 Software (BD Life Sciences). Gating details are provided in Extended Data Fig. 11 legend.
Statistical analysis.
Data are presented as mean ± .s.d. or ± s.e.m., unless otherwise indicated. For each in vitro assay, the number of biological replicates (3 to 8) per experiment, and the number of independent experiments (2 to 6) are indicated within the legend. When comparing two groups, a two-tailed non-paired Student’s t-test was conducted, unless the data were paired, so a paired t-test was performed instead. For three or more groups, one-way ANOVA was conducted, unless 2 independent variables existed (e.g. proliferation curves), so two-way ANOVA was conducted. ANOVA was followed by post hoc Tukey’s multiple-comparison test. p < 0.05 was considered statistically significant.
Extended Data
Extended Data Fig. 1 |. PDA favors the use of glutamine over arginine for polyamine synthesis.

a, Schematic depicting all 3 pathways leading to synthesis of the polyamine precursor ornithine: De novo ornithine synthesis (DNS) via OAT in red, urea cycle via ARG2 in yellow and creatine synthesis via GATM in purple. ARG, arginase; ASL, argininosuccinate lyase; ASS1, argininosuccinate synthase 1; CPS1, carbamoyl-phosphate synthase 1; GAMT, guanidinoacetate N-methyltransferase; GATM, glycine amidinotransferase; GLS, glutaminase; GSA, glutamate-γ-semialdehyde; α-KG, α-ketoglutarate; NOS, nitric oxide synthase; OAA, oxaloacetate; OAT, ornithine aminotransferase; ODC1, ornithine decarboxylase 1; OTC, ornithine transcarbamoylase; P5C, pyrroline-5-carboxylate; P5CS, pyrroline-5-carboxylate synthase (product of ALDH18A1 gene or aldehyde dehydrogenase 18 family member A1); P5CDH, pyrroline-5-carboxylate dehydrogenase (product of ALDH4A1 gene or aldehyde dehydrogenase 4 family member A1); PRODH, proline dehydrogenase 1; PYCR, pyrroline-5-carboxylate reductase; SMS, spermine synthase; SRM, spermidine synthase. b, c, Schematics tracing the fates of 15N-(amine) of glutamine (b) or all 4 nitrogens of 15N4-arginine (c) into ornithine and polyamine synthesis (left), or the urea cycle (right). Circles in White: 12C; in Red (b) or Green (c): 15N; in Gray: 14N; in Black: 14N when the urea cycle is off, as in PDA cells in vitro, but 15N when the urea cycle is on, as in PDA tumors in vivo7. Thicker arrows indicate enhanced flux into DNS and polyamine synthesis (b) or into generation of argininosuccinate, urea, ornithine and polyamines (c). d, Percent 15N-labeled metabolites in AsPC-1 cells fed 15N-(amine)Gln for 24 h. n = 6 biological replicates. e, Percent 15N-labeled metabolites in AsPC-1 cells fed 15N4-Arg for 24 h. Consistent with urea cycle inactivity, only 15N4-Arg-derived citrulline (M+3), the result of nitrogen oxide synthase (NOS) activity, but not citrulline (M+2), product of ornithine transcarbamoylase (OTC) in the urea cycle, was detected (see schematic in c). Furthermore, arginine-derived 15N-argininosuccinate (As, M+4) but not (M+2) was detected, indicating reverse argininosuccinate lyase (ASL) reaction10, rather than transfer of 15N from citrulline via argininosuccinate synthetase (ASS1) in the urea cycle (see schematic in c). n = 4 biological replicates. f, g, Percent labeled 15N-ornithine (f) and 15N-putrescine (g) in 29 cancer cell lines representing 5 cancer types (PDA; BRCA: breast carcinoma; LUAD, COAD and PRAD: adenocarcinomas of the lung, colon and prostate, respectively) with tissue-matched normal cell lines, indicated by arrowheads, that were fed 15N4-Arg for 24 h. n = 4 biological replicates per cell line. h, i, Relative abundance of 15N-labeled ornithine (h) or 15N-labeled putrescine (i) normalized to 15N-labeled glutamate in cell lines fed 15N-(amine)Gln for 24 h, as described in Fig. 1b, c. n = 4 biological replicates. M+1 and M+2 indicate a mass shift of 1 or 2 nitrogens, respectively. Data represent the mean ± s.d. p-values were obtained by one-way ANOVA, followed by Tukey test. Stars indicate statistical significance between each cancer cell line and its tissue-matched normal cell line/s. Data are representative of six (d), three (e) or two (f-i) independent experiments.
Extended Data Fig. 2 |. Enhanced de novo ornithine synthesis is a distinct feature of PDA.
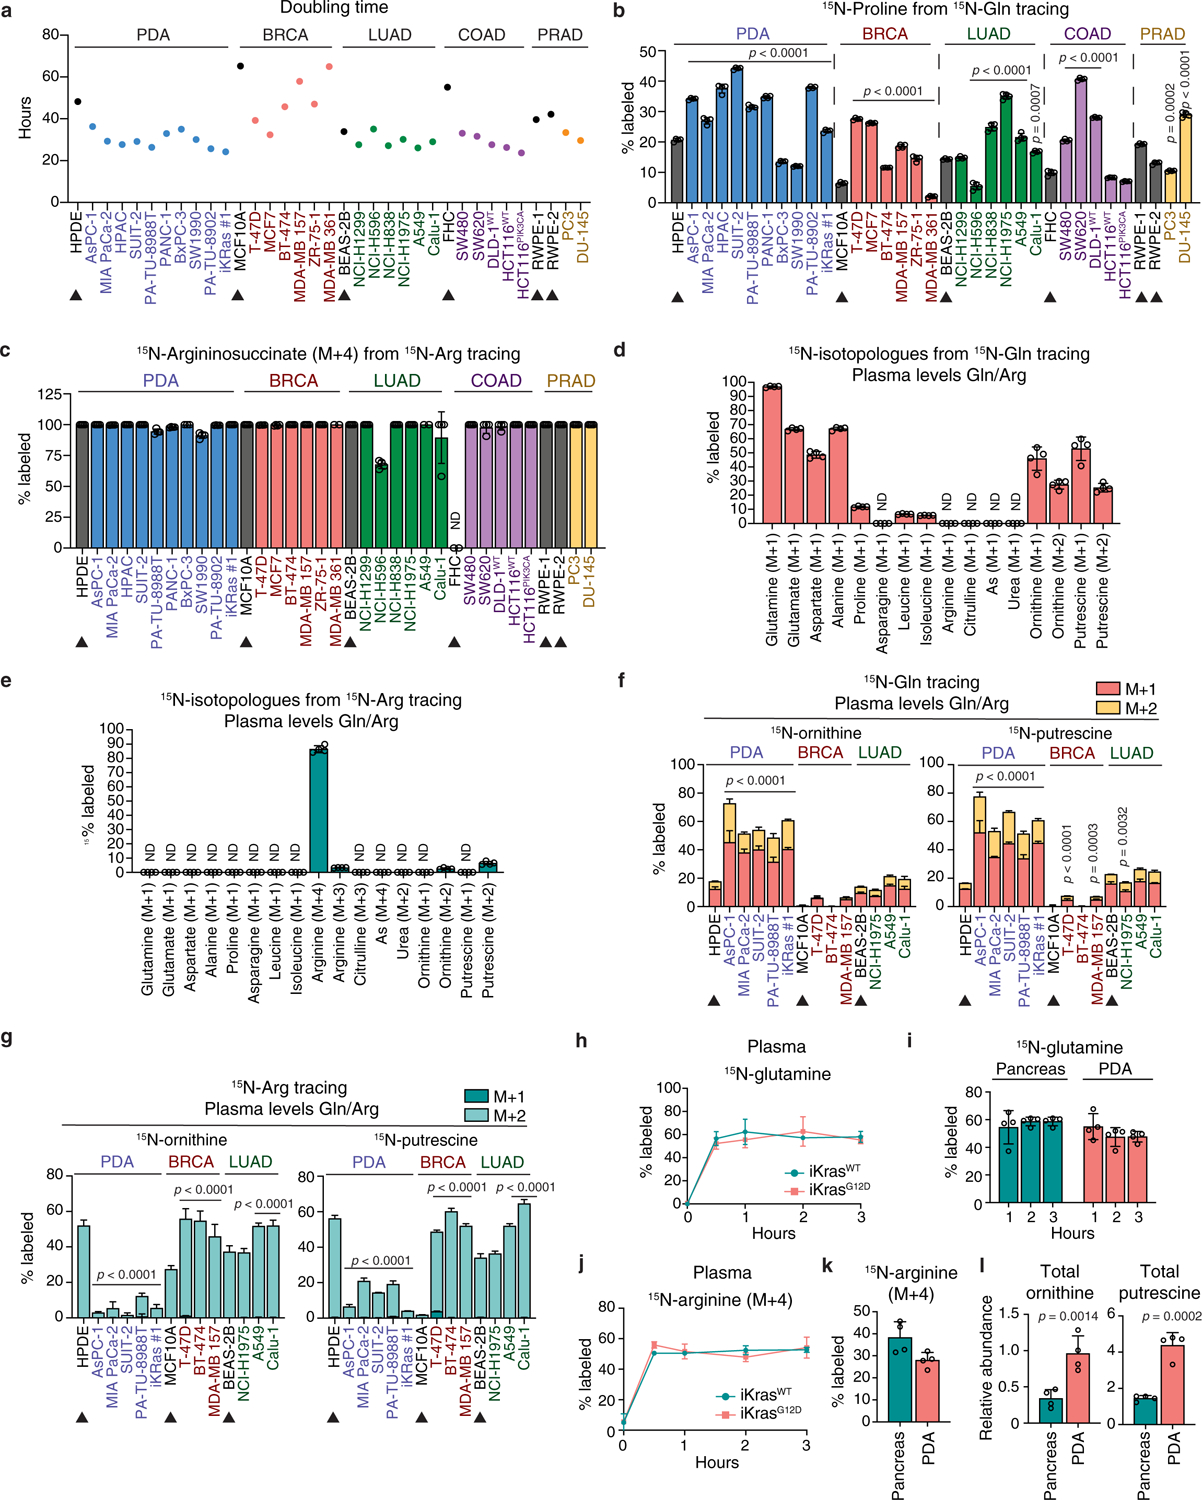
a, Doubling times of cell lines in Fig. 1b, c. n = 8 biological replicates. b, Percent labeled 15N-proline in 15N-(amine)Gln-fed cells from Fig. 1b, c. n = 4 biological replicates. c, Percent labeled 15N-argininosuccinate (M+4) in 15N4-Arg-fed cells described in Extended Data Fig. 1f, g. n = 4 biological replicates. d, e, Percent 15N-labeled metabolites in AsPC-1 cells fed for 24 h, either 650 μM 15N-(amine)Gln (d) or 64 μM 15N4-Arg (e) in the presence of 64 μM unlabeled arginine (d) or 650 μM unlabeled glutamine (e). These amino acid concentrations reflect levels found in human plasma. n = 4 biological replicates. f, g, Percent labeled 15N-ornithine and 15N-putrescine in 11 cancer cell lines representing 3 cancer types (PDA; BRCA: breast carcinoma; LUAD, lung adenocarcinoma) with tissue-matched normal cell lines (arrowheads), that were fed 15N-(amine)Gln (f) or 15N4-Arg (g) and maintained for 24 h in plasma glutamine and arginine levels as described in d, e. n = 4 biological replicates. h, i, 15N enrichment in plasma glutamine (h) and percent 15N-labeled glutamine in normal pancreas or PDA tumors (i) derived from tumor-bearing iKrasG12D mice and non-tumor-bearing iKrasWT mice treated with Dox (2g l−1 drinking water) for 3 weeks prior to infusion with 15N-(amine)Gln for 1, 2 or 3 hours as described in Fig. 1e–g. n = 4 mice per group. j, 15N enrichment in plasma arginine of iKras mice described in Fig. 1g, that were treated with Dox for 3 weeks prior to infusion with 15N4-Arg for 3 h. n = 4 mice per group. k, l, Percent 15N-labeled arginine (k) and relative abundance of total ornithine and putrescine (l) in normal pancreas or PDA tumors derived from either control or tumor-bearing mice described in Fig. 1g, that were infused with 15N4-Arg for 3 h. n = 4 mice per group. Data represent the mean ± s.d. p-values were obtained by one-way (b, c, f, g) or two-way (h-j) ANOVA, followed by Tukey test, or unpaired two-tailed t-test (k, l). In b, f, g, statistical significance is for each cancer cell line vs. its tissue-matched normal cell line/s. In a-g, data are representative of two independent experiments.
Extended Data Fig. 3 |. Polyamines are enriched in PDA cells and their tumor microenvironment.

a, Principal component (PC) analysis of the abundance of 263 polar metabolites in plasma or tumor interstitial fluid (TIF) or normal interstitial fluid (NIF) from PDA tumors or normal pancreas of iKrasG12D or iKrasWT mice, respectively, described in Fig. 1h, i. Data were obtained by Metaboanalyst 4.0. n = 6 biological replicates. b, Top 10 enriched metabolic pathways in TIF compared to plasma (top); or TIF compared to NIF (bottom) based on abundance of metabolites in a. FDR false discovery rate. c, Volcano plot illustrating the fold change (log2-transformed) in metabolite levels between TIF and plasma of tumor-bearing iKrasG12D mice described in a. n = 6 biological replicates. Pink dots indicate significantly altered metabolites (> 1.5-fold; p < 0.01). d, Heatmaps listing in descending order of statistical significance (p < 0.05 by unpaired two-tailed t-test), metabolites in arginine metabolism from TIF vs. plasma of iKrasG12D mice (left) or TIF vs. NIF (right) described in a. n = 6 biological replicates. e, f, Relative live cell number (e) percent dead cells (f) in 4 KRAS-mutant and 1 non-KRAS-mutant (BxPC-3) PDA cell lines as well as normal HPDE cells grown in TIF arginine levels (2 μM). n = 8 biological replicates. g, Principal component (PC) analysis of the abundance of intracellular polar metabolites (263) in PDA tumors of iKrasG12D mice vs. normal pancreas of iKrasWT mice from a. n = 6 biological replicates. h, Top 10 enriched metabolic pathways in PDA tumors compared to normal pancreas of mice from g. i, Heatmap listing in descending order of statistical significance (p < 0.05 by unpaired two-tailed t-test), metabolites involved in arginine metabolism from PDA tumors and normal pancreas described in g. n = 6 biological replicates. j, Relative abundance of intracellular ornithine, putrescine, and spermidine in PDA tumors or normal pancreas described in g. n = 6 biological replicates. Data in a-d and g-i were obtained by Metaboanalyst 4.0. In d, i, Red indicates higher level and blue lower level, relative to the median. Data in e, f, j represent the mean ± s.d. p-values were obtained by two-way ANOVA followed by Tukey test (e, f) or by unpaired two-tailed t-test (j). In e, f, statistical significance is for days 3, 5 or 7 vs. day1. Data are representative of two independent experiments.
Extended Data Fig. 4 |. OAT is enriched in human and murine PDA tumors.

a, Gene expression analysis showing higher mRNA levels of OAT but not ALDH18A1 (aldehyde dehydrogenase 18 family member A1), ARG2 or ODC1 in human tumors compared to normal tissues. Data were derived from TCGA and GTEx datasets and represent 5 cancer types including pancreatic adenocarcinoma (PAAD), breast carcinoma (BRCA), lung, colon and prostate adenocarcinomas (LUAD, COAD and PRAD, respectively). TPM, transcript per million. T, tumor and N, normal tissue. Number of tissue samples n is indicated at bottom of panel. Box plots represent the interquartile range of data with the middle line being the median and whiskers spanning the minimum and maximum values. Plots and statistics were generated by GEPIA57 software. *p < 0.01 (one-way ANOVA). b, mRNA levels of genes in a quantified by qPCR, in 20 human cancer cell lines and 3 tissue-matched normal cell lines from the panel described in Fig. 1b, c. Ct indicates cycle threshold for each gene in the normal cell lines and is inversely proportional to mRNA levels. Data represent the mean of 3 technical replicates and are representative of two independent experiments. c, Representative immunohistochemical staining of OAT in PDA tumors and normal pancreas of tumor-bearing iKrasG12D or non-tumor-bearing iKrasWT mice treated with Dox (2g l−1 drinking water) for 3 weeks. Scale bar: 100μm. d, Representative immunohistochemical OAT staining in human PDA, pancreatic intraepithelial neoplasia (PanIn) and adjacent normal cells in whole tissue sections of resected tumors from 4 different patients (Cases 1–4). Scale bar: 100μm. In c, d, framed top corner insets represent a 5-fold magnification of the area delineated by a dashed square; data are representative of 2 independent experiments. e, H scores of OAT staining in PDA tumors and patient-matched normal pancreatic tissue performed on tissue microarrays (TMAs) of resected tumors from n = 31 patients. Data represent the mean ± s.d and p = 0.0003 was obtained by paired two-tailed t-test.
Extended Data Fig. 5 |. OAT is required for PDA growth.

a, Levels of ODC1, OAT or ARG2 proteins in AsPC-1 cells with knockdown of ODC1, OAT, ARG2 or GATM (left) and mRNA levels of GATM (right) in AsPC-1 cells with GATM knockdown as compared to Scramble (Scr). 2 hairpins per gene were used. b, Percent 15N-labeled metabolites in proline synthesis, urea cycle and creatine synthesis pathways in AsPC-1 cells with knockdown of ODC1, OAT, ARG2 or GATM (described in Fig. 2b, c), that were fed 15N4-Arg for 24 h. n = 4 biological replicates. c, Schematic demonstrating reversal of the OAT reaction upon ODC1 loss, accompanied by a compensatory increase in ARG2 and GATM activities to re-generate ornithine as demonstrated in b. d, e, Proliferation of AsPC-1 cells with knockdown of ODC1, OAT, ARG2, GATM or Scr (d) or those with knockdown of ODC1, OAT, or Scr, that were grown in the presence or absence of 10 μM putrescine (e). n = 8 biological replicates. f, Levels of ODC1 and OAT proteins in MIA PaCa-2 cells harboring ODC1, OAT or Scr knockdown. Arrowhead indicates non-specific band detected by ODC1 antibody (ab97395). g, h, Relative abundance of 15N-labeled putrescine (g) or total putrescine or ornithine (h) in cells from f, that were fed 15N-(amine)Gln or 15N4-Arg for 24 h. n = 4 biological replicates. i, mRNA levels of ODC1 and OAT genes in SUIT-2 cells with control Scr, ODC1, or OAT knockdown. j, Proliferation of MIA PaCa-2 and SUIT-2 cells with either ODC1, OAT, or Scr knockdown that were grown in the presence or absence of 10 μM putrescine. n = 8 biological replicates. Data represent the mean ± s.d. in a, b, g-i, or mean ± s.e.m. in d, e, j. p-values were obtained by one-way ANOVA (a, b, g-i) or two-way ANOVA (d, e, j), followed by Tukey test. In a and f, β-Actin was used as a loading control. Data are representative of three (a, d, e, f, i, j) or two (b, g, h) independent experiments.
Extended Data Fig. 6 |. Silencing of OAT decreases polyamine pools in PDA cells and suppresses proliferation.

a, Levels of ODC1 and OAT proteins in AsPC-1 cells with control Scramble (Scr), ODC1 or OAT knockdown overexpressing either GFP control or respective rescue cDNAs for ODC1 or OAT. b, c, Relative abundance of 15N-labeled (b) or total (c) ornithine and putrescine in AsPC-1 cells described in a, that were fed 15N-(amine)Gln for 24 h. n = 4 biological replicates. d, Proliferation of AsPC-1 cells in a. n = 8 biological replicates. e, Levels of ODC1 and OAT proteins in HPDE cells with control Scr, ODC1 or OAT knockdown. f, Proliferation of HPDE cells from e. n = 8 biological replicates. g, Representative ultrasound images of orthotopic xenografts 3 weeks post-injection of AsPC-1 cells bearing knockdown of Scr, ODC1 or OAT into the pancreas of Rag1−/− mice, as described in Fig. 2f. T, Tumor; S, Spleen; K, Kidney. h, Volumes by ultrasound, of orthotopic human PDA tumors from g and Fig. 2f. n = 9 except for shODC1 #2, n = 8 mice per group. i, Levels of ODC1 and OAT proteins in 2 iKras cell lines with control Scr, Odc1 or Oat knockdown (2 hairpins per gene). j, k, Relative abundance of 15N-labeled (j) or total (k) ornithine and putrescine in iKras cells from i. n = 4 biological replicates. l, Proliferation of iKras cells from i, grown in the presence or absence of 10 μM putrescine. n = 8 biological replicates. Data represent the mean ± s.d. (b, c, h, j, k) or mean ± s.e.m. (d, f, l). p-values were obtained by one-way (b, c, j, k) or two-way (d, f, h, l) ANOVA, followed by Tukey test. In d, l, statistical significance is for each condition vs. control “shScr + GFP” (d) or each gene knockdown vs. Scr control in the presence or absence of putrescine (l). In e, i, Arrowhead indicates non-specific band detected by ODC1 antibody (ab97395). In a, e, i, β-Actin was used as a loading control. Data are representative of two (a-c, i-k) or three (d, e, f, l) independent experiments.
Extended Data Fig. 7 |. OAT maintains in vivo tumor polyamine pools supporting PDA growth.

a, Generation of murine orthotopic PDA transplants lacking Odc1 or Oat. iKras clonal cell lines with CRISPR/Cas9 knockout of Odc1 (clones #3 and #10) or Oat (clones #10 and #11) using single guide (sg) RNAs each, or sgControl (sgCtrl) were injected (5 × 10⁵ cells) into the pancreas of non-Cre-expressing iKras mice. All mice were treated with Dox (2g l−1 drinking water) and monitored for tumor growth by ultrasound over 3 weeks, prior to subjecting them to a 3-hour infusion with 15N-(amine)Gln. b, Levels of ODC1 and OAT proteins in iKras cells from a. c, d, Relative abundance of 15N-labeled (c) or total (d) ornithine and putrescine in iKras cells from a that were fed for 24 h 15N-(amine)Gln or 15N4-Arg. n = 4 biological replicates. e, Proliferation of iKras cells described in a. n = 8 biological replicates. f-h, Volumes (ultrasound) of orthotopic iKras tumors with control (Ctrl), Odc1 or Oat knockout from a, injected into non-tumor-bearing mice (f), with representative ultrasound images (g), and weights (h), 3 weeks post-injection of iKras cells. n = 9 (sgCtrl); n = 10 (sgOdc1 #10; sgOat #10); n = 6 (sgOdc1 #3; sgOat #11). T, Tumor; S, Spleen. i, 15N enrichment in plasma glutamine of tumor-bearing mice in f-h, that were infused with 15N-(amine)Gln over 3 hours, 3 weeks post-tumor cell injection (related to Fig. 2g). n = 4 mice per group. j, Relative abundance of indicated metabolites in orthotopic tumors derived from iKras cells with knockout for Odc1, Oat, or control, described in a. n = 6 mice per group. k, Relative abundance of putrescine and spermidine in human orthotopic PDA tumors derived from AsPC-1 cells with ARG2 or Scramble (Scr) knockdown, that were injected (105 cells) into the pancreas of Rag1−/− mice and grown for 6 weeks. n = 7 mice per group. l, Relative abundance of the indicated metabolites in murine orthotopic transplant tumors derived from KPC cells (see Methods) expressing or lacking Arg2 (Arg2+/+ or Arg2−/−, respectively) that were injected (2.5 × 10⁵ cells) into the pancreas of mice of the same strain and grown for 2 weeks. n = 6 mice per group. In j-l, Box plots represent medians ± 10–90 percentile and whiskers span minimum and maximum values. m, Levels of OAT and ODC1 proteins in iKras cells with control (sgCtrl) or Odc1 or Oat knockout (sgOdc1 or sgOat) that are overexpressing GFP control or the respective gene cDNA (Odc1 or Oat). n, o, Relative abundance of 15N-labeled (n) or total (o) ornithine and putrescine levels in iKras cells described in m, that were fed 15N-(amine)Gln for 24 h. n = 4 biological replicates. p, Proliferation of iKras cells described in m. n = 8 biological replicates. q, Volumes of syngeneic orthotopic tumor transplants derived from iKras cells described in m that were grown and quantified by ultrasound, 2 and 3 weeks post-cell injection (related to Fig. 2h). n = 8 mice (sgCtrl + GFP); n = 7 (sgCtrl + Oat); n = 9 (sgOat #10 + GFP; sgOat #10 + Oat). r, Metabolite abundance in TIF or plasma of mice related to Fig. 2i. n = 8 except sgCtrl + Oat (7). In i, j, m-r, sgOdc1 clone #10 and sgOat clone #10 from a-h were used. Data represent the mean ± s.d. (c, d, f, h, i, n, o, q, r) or mean ± s.e.m. (e, p). p-values were obtained by one-way (c, d, h, j, n, o) or two-way (e, f, i, p, q, r) ANOVA followed by Tukey test, or by unpaired two-tailed t-test (k, l). In e, n-p, statistical significance is for each condition vs. control knockout “sgCtrl” (e) or each condition vs. “sgCtrl + GFP” (n-p). In b, m, Arrowhead indicates non-specific band detected by ODC1 antibody (ab97395) and β-Actin was used as a loading control. Data are representative of two (b-d, m-o) or three (e, p) independent experiments.
Extended Data Fig. 8 |. Oncogenic KRAS induces the expression of OAT and polyamine synthesis genes.

a, mRNA levels of Srm, Sms and Arg2 in iKras cell lines #1 and #2 maintained in Dox (1μg ml−1) for 24 h prior to Dox deprivation for 24, 48, or 72 hours. n = 3 biological replicates. b, c, mRNA levels of KRAS, OAT, ODC1, SRM, SMS and ARG2 in human PDA AsPC-1 (b) or MIA PaCa-2 (c) cells with Dox-inducible knockdown of GFP (Tet on-shGFP) or KRAS (Tet on-shKRAS hairpins #1 and #2) that were cultured in Dox (1μg ml−1) for 24, 48 or 72 hours. In b, n = 3 and in c, n =2 biological replicates. d, mRNA levels of ornithine and polyamine synthesis genes (OAT, ODC1, SRM, SMS and ARG2) in AsPC-1 and MIA PaCa-2 cells treated with vehicle control DMSO or inhibitors of: PI3K (BKM 120, 150 nM); AKT (MK2206, 200 nM); MEK (AZD6244, 50 nM); mTORC1 (Rapamycin, 20 nM) for 72 h. n = 3 biological replicates. Data represent the mean ± s.d. (a, b, d) of biological replicates from 3 independent experiments or the mean of biological replicates from 2 independent experiments (c). p-values were obtained by two-way (a, b) or one-way (d) ANOVA followed by Tukey test. Statistical significance is for Off Dox vs. On Dox (a) or for shKRAS vs. shGFP (b) at each indicated time, or for each inhibitor vs. DMSO (d). e, Levels of proteins in cells from d. β-Actin was used as loading control and data represent two independent experiments.
Extended Data Fig. 9 |. Transcription factor KLF6 mediates KRAS-driven polyamine synthesis in PDA.

a, b, Putative transcription factor (TF) binding sites identified and scored by FMatch tool in the promoter regions of all 4 ornithine and polyamine synthesis genes responsive to KRASG12D, i.e. OAT, ODC1, SRM and SMS. Predicted TFs are listed in descending order of statistical significance (p-value cut-off of 0.01), with matrix score similarity ranging from 0–1, where 1 is a perfect match. Eight are conserved in human (a) and mouse (b), out of which six (in blue) have binding sites present in the OAT promoter. c, mRNA levels of Myc, Oat, Odc1, Srm, Sms and Arg2 in 2 iKras cell lines with Scramble control (Scr) or Myc knockdown (2 distinct hairpins). n = 2 biological replicates. d, mRNA levels validating knockdown (2 or 3 hairpins per gene) of each of the 6 conserved TFs with binding sites for OAT (blue in a, b), and assessing their effects on expression of Oat, Odc1, Srm, Sms and Arg2 in iKras #1 cell line. n = 3 biological replicates. e, mRNA levels of ornithine and polyamine synthesis genes (Oat, Odc1, Srm, Sms and Arg2) in iKras #2 cells with Scr or Klf6 knockdown (2 distinct hairpins). n = 3 biological replicates. f, Levels of OAT, ODC1, SRM, SMS proteins in iKras cells with Klf6 or Scramble (Scr) knockdown, with or without Dox (72 h). β-Actin was used as loading control. g, Fold change in mRNA levels of Myc and each of the 6 TFs from d in iKras #1 cell line deprived of Dox for 48 h. n = 3 biological replicates. h, Relative abundance of total ornithine and putrescine in iKras#1 cells described in Fig. 3h. Cells were fed 15N-(amine)Gln or 15N4-Arg 24 h before harvest. n = 4 biological replicates. In c-e, g, h, data represent the mean ± s.d. p-values were obtained by one-way (d, e) or two-way (h) ANOVA followed by Tukey test, or paired two-tailed t-test (g). In d, e, g, statistical significance is for each TF knockdown vs. control Scramble (d, e), or for Off Dox vs. On Dox (g). Data represent the mean of biological replicates from 2 independent experiments (c) or mean ± s.d. of biological replicates from 3 independent experiments (d, e, g). In f, h, data are representative of 2 independent experiments.
Extended Data Fig. 10 |. 5-FMO suppresses polyamine synthesis and PDA growth similar to DFMO but without off-target effects.

a, Relative abundance of 15N-labeled ornithine and putrescine in iKras cells #1 treated for 72 h with inhibitors of OAT (5-FMO) or ODC1 (DFMO) and fed 15N-(amine)Gln or 15N4-Arg 24 h before harvest. n = 4 biological replicates. b, c, Relative abundance of total ornithine and putrescine in AsPC-1 (b, related to Fig. 4a) or iKras (c) cells treated as in a. n = 4 biological replicates. d, Percent growth of human PDA cells AsPC-1 and MIA PaCa-2 with knockdown of OAT #1 or Scramble (Scr) that were treated with 5-FMO (0, 0.001, 0.025, 0.05, 0.1, 0.25, 0.5, 0.75, 1, 2.5 mM) for 7 days. e, Percent growth over 7 days of AsPC-1 cells treated with 5-FMO as in d, in the presence or absence of putrescine (10 μM). f, Percent growth of iKras #1 cells with control (Ctrl) or Oat knockout, that were treated with 5-FMO as in d. g, h, Percent growth of human PDA cells with Scramble or ODC1 #1 knockdown (g) or murine iKras #1 cells with Ctrl or Odc1 knockout (h) that were treated with DFMO (0, 0.001, 0.025, 0.05, 0.1, 0.25, 0.5, 0.75, 1, 2.5 mM) for 7 days. In f, h, sgOdc1 clone #10 and sgOat clone #10 from Extended Data Fig. 7a were used. In d-h, n = 8 biological replicates and arrowheads indicate concentrations used in a-c. i, Relative abundance of 13C-labeled (M+4) and total putrescine in AsPC-1 cells with knockdown of control Scramble (Scr), ODC1 or OAT that were treated with vehicle control (water) or 10 μM 13C4-putrescine for 1 h. n = 4 biological replicates. j, Relative abundance of 13C-labeled (M+4) and total putrescine in AsPC-1 cells that were pre-treated (or non-pre-treated) for 15 min with 1 μM AMXT-1501, then fed 10 μM 13C4-putrescine for 0, 50, 100, 150, 200 and 240 min while continuing the same AMXT-1501 treatment (0 or 1 μM) but in absence or presence of 5-FMO (0 or 100 μM). n = 4 biological replicates. In i, j, data represent the mean of n = 4 biological replicates from two independent experiments. k, Proliferation of AsPC-1 cells that were treated or not treated with 1 μM AMXT-1501 and/or 100 μM 5-FMO for 7 days in the presence or absence of 10 μM putrescine. Data represent the mean of n = 32 biological replicates from four independent experiments with n = 8 per experiment. l, 15N enrichment in plasma glutamine of tumor-bearing male iKrasG12D mice from Fig. 4f that were treated with control saline or 5-FMO (10 mg kg−1 and 30 mg kg−1) for 14 days, prior to infusing them for 3 h with 15N-(amine)Gln, as described in Fig. 4g. n = 4 mice per group. m, Relative abundance of total ornithine and putrescine in tumors of 5-FMO treated male iKras mice, related to Fig. 4g. n = 4. n, o, Weights of livers (n) and growth curves (o) of male or female iKrasG12D mice described in Fig. 4f. Male mice: n = 11 per dose; Female mice: n = 10 for saline, n = 9 for 10mg kg−1 and n = 11 for 30mg kg−1. p, Proliferation fold increase in number over 7 days of AsPC-1 cells treated with gemcitabine at 0, 0.1, 0.2, 0.4, 0.6, 0.8, 1, 2 μM in the presence or absence of 5-FMO (0, 100 or 500 μM). n = 8 biological replicates. Data represent the mean ± s.d. (a-c, i-n, p) or mean ± s.e.m. (d-h, o). p-values were obtained by one-way (a-c, m, n) or two-way (i-l, o, p) ANOVA followed by Tukey test or paired two-tailed t-test (d-h). In i, indicated p-values are for each knockdown in the presence vs. absence of putrescine at the indicated times; † and ‡ indicate significance of p < 0.0001 for each gene knockdown vs. Scr knockdown in absence (†) of putrescine; or in presence (‡) of putrescine, except for 13C4-putrescine in shOAT #1 and total putrescine in shOAT #2, where p = 0.0003. In j, significance is for each drug condition vs. vehicle control (black line). In p, † (p = 0.0006) and ‡ (p < 0.0001) indicate statistical significance between each gemcitabine-treated group and non-treated control in the absence of 5-FMO (grey bars). Data are representative of two (a-c, g, h), three (d-f, p) independent experiments.
Extended Data Fig. 11 |. Immune profiling reveals no major differences in immune subsets upon genetic or pharmacological inhibition of OAT.

a, Analysis of select immune populations in orthotopic tumors derived from iKras cells with knockout of Odc1, Oat, or control (Ctrl) that were injected (5 × 10⁵ cells) into the pancreas of non-Cre-expressing iKras mice and grown for 3 weeks. b-f, Immune profiling of PDA tumors from male and female iKrasG12D mice that were treated with Dox (2g l−1 drinking water) for 7 days, then daily intraperitoneally injected with control saline or 5-FMO (10 mg kg−1 and 30 mg kg−1) for 14 days while under continuous treatment with Dox. Single cell infiltrates from tumors and draining lymph nodes were analyzed by flow cytometry. Analysis of select immune populations (b), ratio of Tregs to CD8+ T cells and percent PD1+ CD8+ T of total CD8+ T cells (c) in PDA tumors. Analysis of select immune populations in pancreatic draining lymph nodes (dLN, d). Representative flow plots showing Tregs (CTLA-4+ and FOXP3+) in PDA tumor (e) and pancreatic draining lymph node (f) derived from saline-treated iKrasG12D mice. For tumor samples, values indicate the average of 2 replicate samples obtained from different regions of the tumor mass. n = 9–10 mice per group using both sexes (male: n = 5 per group; female: n = 4 for saline and 10 mg kg−1 5-FMO, n = 5 for 30 mg kg−1 5-FMO). In a-d, Data represent the mean ± s.d. p-values were obtained by one-way ANOVA followed by Tukey test. For gating details, analysis of select immune populations gated out of CD45+ live, single cells: CD11b+/− = CD45+; MoMDSCs = CD11b+ Gr1low; GrMDSCs = CD11b+ Gr1high; macrophages = CD11b+ SiglecF− Gr1−; eosinophils = CD11b+ SiglecF+; CD103+/MHCIIhigh; DCs = CD11b− CD4− CD8− CD11c+ MHCII+; CD4 T cells = CD11b− CD4+; CD8 T cells = CD11b− CD8+; Tregs = CD11b− CD4+ FOXP3+ CTLA4+; B cells = CD11b− CD4− CD8− B220+. All positive gates were set based on clearly separated populations except in the case of Gr-1 staining, which was divided into tertiles based on mean fluorescence intensity. Unstained cells were used to define negative gates. Forward scatter and side scatter were used to identify cell-sized objects. Fragments with FSC less than 10% of the sample median were excluded from analysis. Cell doublets were excluded based on deviation from the diagonal of FSC area vs FSC height.
Extended Data Fig. 12 |. OAT silencing results in transcriptional and epigenetic changes similar to those of ODC1 knockdown.

a, Venn diagrams showing a higher overlapping number of differentially expressed genes (q < 0.05) in AsPC-1 cells with knockdown of OAT or ODC1 (608 down-regulated and 599 up-regulated), as compared to ARG2 and ODC1 or ARG2 and OAT. Numbers reflect differential expression common to 2 hairpins per gene. b, ATAC-Seq data showing significant changes (q < 0.05) in chromatin access at enhancers located < 20 kb from transcription start sites in AsPC-1 cells with knockdown of ODC1, compared to control Scramble (Scr), OAT, or ARG2 (2 hairpins per gene). n = 2 biological replicates per hairpin. Significant changes detected include losses and gains of chromatin accessibility near 175 and 135 enhancers, respectively. c, Correlation of changes in gene expression and nearby (< 25 kb) chromatin accessibility for 403 genes that were consistently up-regulated upon ODC1 and OAT silencing in AsPC-1 cells (cluster V, Fig. 4h). Each dot represents a gene. Gene-linked enhancers (< 25 kb) show gains in accessibility upon knockdown of ODC1 or OAT, but not ARG2. d, List of top 18 pathways in descending significance (FDR 0.003–0.30) that were differentially altered at the transcriptional level (either negative or positive enrichment) upon ODC1 knockdown compared to Scr control in AsPC-1 PDA cells described in a, b. Negatively enriched pathways related to growth factors, cytokines and response to starvation are highlighted in yellow and those involved in cell shape, migration, differentiation and ion transport are highlighted in blue. Asterisks indicate representative pathways illustrated in e and Fig. 4j. e, Heatmaps of genes from representative pathways (blue) in d displaying negative enrichment upon knockdown of ODC1 compared to Scr control (n = 3), with corresponding GSEA plots. NES normalized enrichment scores, FDR false discovery rate, Nom. Nominal. f, List of differentially expressed genes from top 18 negatively enriched pathways in d, that are part of Cluster I in Fig. 4h and are indicated with dark blue dots in the correlation plots of Fig. 4i. Genes in Quadrant (Q) III of Fig. 4i plots associate with decreased chromatin accessibility, and are more numerous in cells with knockdown of ODC1 (37/58) or OAT (44/58), than ARG2 (22/58). g, Relative mRNA levels (by qPCR) of 7 representative genes in AsPC-1 cells with knockdown of ODC1, OAT, or ARG2 (2 hairpins per gene) compared to control Scr, that were maintained for 72 h in the presence or absence of 10 μM Putrescine. Genes were randomly chosen from Q III described in f and Fig. 4i, and display common decreases in expression upon OAT or ODC1 knockdown but not ARG2, along with concordant decreases in chromatin access. Data represent the mean ± s.d. of 3 biological replicates from 3 independent experiments. p-values were obtained by two-way ANOVA followed by Tukey test. Statistical significance is for knockdown of ODC1, OAT or ARG2 vs. Scr under similar putrescine condition, unless otherwise indicated by lines.
Supplementary Material
Acknowledgements.
We thank members of the N.Y.K laboratory for helpful comments and discussions and Dr. Tsao (Princess Margaret, Toronto, Canada) for the HPDE cells. This work was supported by the NIH/National Cancer Institute Grant 1R01 CA270110-01 (N.Y.K., M.-S. L.), the American Cancer Society Research Scholar Grant RSG-17-070-01-TBG (N.Y.K., M.-S. L., I.N., T.Z., A.A.) and by funds from Boston Children’s Hospital. S.K.D., A.M.B. and M.H. were funded by NIH 1R01 AI158488-01 and the Hale Center for Pancreatic Cancer Research.
Competing interests.
S.K.D. received research funding unrelated to this project from Eli Lilly and Company, Novartis Pharmaceuticals, Genocea, and Bristol-Myers Squibb and is a founder, science advisory board member (SAB) and equity holder in Kojin. M.M.-K. has served as a compensated consultant for AstraZeneca, BMS, Sanofi and Janssen Oncology and has received loyalties from Elsevier, all unrelated to the current work.
Footnotes
Reporting summary
Additional details regarding research design are available in the Nature Research Reporting Summary linked to this Article.
Supplementary information The online version contains supplementary material including SI Figure 1 and SI Tables 1–5.
Data availability
All data supporting the findings in this study are available within the Article, its Supplementary Information, Source Data files and from the corresponding author upon reasonable request. The RNA-Seq and ATAC-Seq data have been deposited in National Center for Biotechnology Information (NCBI)’s Gene Expression Omnibus and are accessible through GEO Series accession no. GSE193411. Box plots in Extended Data Fig. 4a were generated by GEPIA57 http://gepia.cancer-pku.cn/help.html, which uses a combination of public datasets from both TCGA and GTEx for expression analyses. In Extended Data Fig. 9a, b, bar plots and data were generated using TRANSFAC database (version 1.9) https://genexplain.com/transfac-2-0/. For gel source data, see Supplementary Fig. 1.
References
- 1.Rahib L, Wehner MR, Matrisian LM & Nead KT Estimated Projection of US Cancer Incidence and Death to 2040. JAMA Netw Open 4, e214708, doi: 10.1001/jamanetworkopen.2021.4708 (2021). [DOI] [PMC free article] [PubMed] [Google Scholar]
- 2.Siegel RL, Miller KD, Wagle NS & Jemal A Cancer statistics, 2023. CA Cancer J Clin 73, 17–48, doi: 10.3322/caac.21763 (2023). [DOI] [PubMed] [Google Scholar]
- 3.Encarnacion-Rosado J & Kimmelman AC Harnessing metabolic dependencies in pancreatic cancers. Nat Rev Gastroenterol Hepatol 18, 482–492, doi: 10.1038/s41575-021-00431-7 (2021). [DOI] [PMC free article] [PubMed] [Google Scholar]
- 4.Martinez-Reyes I & Chandel NS Cancer metabolism: looking forward. Nat Rev Cancer 21, 669–680, doi: 10.1038/s41568-021-00378-6 (2021). [DOI] [PubMed] [Google Scholar]
- 5.Ginguay A, Cynober L, Curis E & Nicolis I Ornithine Aminotransferase, an Important Glutamate-Metabolizing Enzyme at the Crossroads of Multiple Metabolic Pathways. Biology (Basel) 6, doi: 10.3390/biology6010018 (2017). [DOI] [PMC free article] [PubMed] [Google Scholar]
- 6.Casero RA Jr., Murray Stewart T & Pegg AE Polyamine metabolism and cancer: treatments, challenges and opportunities. Nat Rev Cancer 18, 681–695, doi: 10.1038/s41568-018-0050-3 (2018). [DOI] [PMC free article] [PubMed] [Google Scholar]
- 7.Zaytouni T et al. Critical role for arginase 2 in obesity-associated pancreatic cancer. Nat Commun 8, 242, doi: 10.1038/s41467-017-00331-y (2017). [DOI] [PMC free article] [PubMed] [Google Scholar]
- 8.Ying H et al. Oncogenic Kras maintains pancreatic tumors through regulation of anabolic glucose metabolism. Cell 149, 656–670, doi: 10.1016/j.cell.2012.01.058 (2012). [DOI] [PMC free article] [PubMed] [Google Scholar]
- 9.Son J et al. Glutamine supports pancreatic cancer growth through a KRAS-regulated metabolic pathway. Nature 496, 101–105, doi: 10.1038/nature12040 (2013). [DOI] [PMC free article] [PubMed] [Google Scholar]
- 10.Vande Voorde J et al. Improving the metabolic fidelity of cancer models with a physiological cell culture medium. Sci Adv 5, eaau7314, doi: 10.1126/sciadv.aau7314 (2019). [DOI] [PMC free article] [PubMed] [Google Scholar]
- 11.Hensley CT et al. Metabolic Heterogeneity in Human Lung Tumors. Cell 164, 681–694, doi: 10.1016/j.cell.2015.12.034 (2016). [DOI] [PMC free article] [PubMed] [Google Scholar]
- 12.Sullivan MR et al. Quantification of microenvironmental metabolites in murine cancers reveals determinants of tumor nutrient availability. Elife 8, doi: 10.7554/eLife.44235 (2019). [DOI] [PMC free article] [PubMed] [Google Scholar]
- 13.Tsai PY et al. Adaptation of pancreatic cancer cells to nutrient deprivation is reversible and requires glutamine synthetase stabilization by mTORC1. Proc Natl Acad Sci U S A 118, doi: 10.1073/pnas.2003014118 (2021). [DOI] [PMC free article] [PubMed] [Google Scholar]
- 14.Apiz-Saab JJ et al. Pancreatic tumors activate arginine biosynthesis to adapt to myeloid-driven amino acid stress. bioRxiv, doi: 10.1101/2022.06.21.497008 (2022). [DOI] [PMC free article] [PubMed] [Google Scholar]
- 15.Menjivar RE et al. Arginase 1 is a key driver of immune suppression in pancreatic cancer. Elife 12, doi: 10.7554/eLife.80721 (2023). [DOI] [PMC free article] [PubMed] [Google Scholar]
- 16.Miska J et al. Polyamines drive myeloid cell survival by buffering intracellular pH to promote immunosuppression in glioblastoma. Sci Adv 7, doi: 10.1126/sciadv.abc8929 (2021). [DOI] [PMC free article] [PubMed] [Google Scholar]
- 17.Gitto SB et al. Difluoromethylornithine Combined with a Polyamine Transport Inhibitor Is Effective against Gemcitabine Resistant Pancreatic Cancer. Mol Pharm 15, 369–376, doi: 10.1021/acs.molpharmaceut.7b00718 (2018). [DOI] [PubMed] [Google Scholar]
- 18.Nilsson JA et al. Targeting ornithine decarboxylase in Myc-induced lymphomagenesis prevents tumor formation. Cancer Cell 7, 433–444, doi: 10.1016/j.ccr.2005.03.036 (2005). [DOI] [PubMed] [Google Scholar]
- 19.Meyskens FL Jr. & Gerner EW Development of difluoromethylornithine (DFMO) as a chemoprevention agent. Clin Cancer Res 5, 945–951 (1999). [PubMed] [Google Scholar]
- 20.Holbert CE, Cullen MT, Casero RA Jr. & Stewart TM Polyamines in cancer: integrating organismal metabolism and antitumour immunity. Nat Rev Cancer 22, 467–480, doi: 10.1038/s41568-022-00473-2 (2022). [DOI] [PMC free article] [PubMed] [Google Scholar]
- 21.ClinicalTrials.gov. (2021).
- 22.Daune G, Gerhart F & Seiler N 5-Fluoromethylornithine, an irreversible and specific inhibitor of L-ornithine:2-oxo-acid aminotransferase. Biochem J 253, 481–488, doi: 10.1042/bj2530481 (1988). [DOI] [PMC free article] [PubMed] [Google Scholar]
- 23.Seiler N, Sarhan S & Knodgen B Inhibition of ornithine aminotransferase by 5-fluoromethylornithine: protection against acute thioacetamide intoxication by elevated tissue ornithine levels. Pharmacol Toxicol 70, 373–380, doi: 10.1111/j.1600-0773.1992.tb00490.x (1992). [DOI] [PubMed] [Google Scholar]
- 24.Zielonka M et al. Pharmacologic rescue of hyperammonemia-induced toxicity in zebrafish by inhibition of ornithine aminotransferase. PLoS One 13, e0203707, doi: 10.1371/journal.pone.0203707 (2018). [DOI] [PMC free article] [PubMed] [Google Scholar]
- 25.Burns MR, Graminski GF, Weeks RS, Chen Y & O’Brien TG Lipophilic lysine-spermine conjugates are potent polyamine transport inhibitors for use in combination with a polyamine biosynthesis inhibitor. J Med Chem 52, 1983–1993, doi: 10.1021/jm801580w (2009). [DOI] [PMC free article] [PubMed] [Google Scholar]
- 26.Samal K et al. AMXT-1501, a novel polyamine transport inhibitor, synergizes with DFMO in inhibiting neuroblastoma cell proliferation by targeting both ornithine decarboxylase and polyamine transport. International journal of cancer. Journal international du cancer 133, 1323–1333, doi: 10.1002/ijc.28139 (2013). [DOI] [PubMed] [Google Scholar]
- 27.Puleston DJ et al. Polyamine metabolism is a central determinant of helper T cell lineage fidelity. Cell 184, 4186–4202 e4120, doi: 10.1016/j.cell.2021.06.007 (2021). [DOI] [PMC free article] [PubMed] [Google Scholar]
- 28.Wagner A et al. Metabolic modeling of single Th17 cells reveals regulators of autoimmunity. Cell 184, 4168–4185 e4121, doi: 10.1016/j.cell.2021.05.045 (2021). [DOI] [PMC free article] [PubMed] [Google Scholar]
- 29.Alexander ET, Minton A, Peters MC, Phanstiel O. t. & Gilmour SK A novel polyamine blockade therapy activates an anti-tumor immune response. Oncotarget 8, 84140–84152, doi: 10.18632/oncotarget.20493 (2017). [DOI] [PMC free article] [PubMed] [Google Scholar]
- 30.Hayes CS et al. Polyamine-blocking therapy reverses immunosuppression in the tumor microenvironment. Cancer Immunol Res 2, 274–285, doi: 10.1158/2326-6066.CIR-13-0120-T (2014). [DOI] [PMC free article] [PubMed] [Google Scholar]
- 31.Park MH, Nishimura K, Zanelli CF & Valentini SR Functional significance of eIF5A and its hypusine modification in eukaryotes. Amino Acids 38, 491–500, doi: 10.1007/s00726-009-0408-7 (2010). [DOI] [PMC free article] [PubMed] [Google Scholar]
- 32.Hardbower DM et al. Ornithine decarboxylase regulates M1 macrophage activation and mucosal inflammation via histone modifications. Proc Natl Acad Sci U S A 114, E751–E760, doi: 10.1073/pnas.1614958114 (2017). [DOI] [PMC free article] [PubMed] [Google Scholar]
- 33.Pasini A, Caldarera CM & Giordano E Chromatin remodeling by polyamines and polyamine analogs. Amino Acids 46, 595–603, doi: 10.1007/s00726-013-1550-9 (2014). [DOI] [PubMed] [Google Scholar]
- 34.Perera RM & Bardeesy N Pancreatic Cancer Metabolism: Breaking It Down to Build It Back Up. Cancer Discov 5, 1247–1261, doi: 10.1158/2159-8290.CD-15-0671 (2015). [DOI] [PMC free article] [PubMed] [Google Scholar]
- 35.Croghan MK, Aickin MG & Meyskens FL Dose-related alpha-difluoromethylornithine ototoxicity. Am J Clin Oncol 14, 331–335, doi: 10.1097/00000421-199108000-00012 (1991). [DOI] [PubMed] [Google Scholar]
- 36.Romijn JC, Verkoelen CF & Splinter TA Problems of pharmacokinetic studies on alpha-difluoromethylornithine in mice. Cancer Chemother Pharmacol 19, 30–34, doi: 10.1007/BF00296251 (1987). [DOI] [PubMed] [Google Scholar]
- 37.Iwami K, Wang JY, Jain R, McCormack S & Johnson LR Intestinal ornithine decarboxylase: half-life and regulation by putrescine. Am J Physiol 258, G308–315, doi: 10.1152/ajpgi.1990.258.2.G308 (1990). [DOI] [PubMed] [Google Scholar]
- 38.Kobayashi K, Morris HP & Katunuma N Studies on the turnover rates of ornithine aminotransferase in Morris hepatoma 44 and host liver. J Biochem 80, 1085–1089, doi: 10.1093/oxfordjournals.jbchem.a131364 (1976). [DOI] [PubMed] [Google Scholar]
- 39.Simell O & Takki K Raised plasma-ornithine and gyrate atrophy of the choroid and retina. Lancet 1, 1031–1033, doi: 10.1016/s0140-6736(73)90667-3 (1973). [DOI] [PubMed] [Google Scholar]
- 40.Bolkenius FN, Knodgen B & Seiler N DL-canaline and 5-fluoromethylornithine. Comparison of two inactivators of ornithine aminotransferase. Biochem J 268, 409–414, doi: 10.1042/bj2680409 (1990). [DOI] [PMC free article] [PubMed] [Google Scholar]
- 41.Halmekyto M, Alhonen L, Alakuijala L & Janne J Transgenic mice over-producing putrescine in their tissues do not convert the diamine into higher polyamines. Biochem J 291 ( Pt 2), 505–508, doi: 10.1042/bj2910505 (1993). [DOI] [PMC free article] [PubMed] [Google Scholar]
- 42.Zigmond E et al. Suppression of Hepatocellular Carcinoma by Inhibition of Overexpressed Ornithine Aminotransferase. ACS Med Chem Lett 6, 840–844, doi: 10.1021/acsmedchemlett.5b00153 (2015). [DOI] [PMC free article] [PubMed] [Google Scholar]
- 43.Mendoza MC, Er EE & Blenis J The Ras-ERK and PI3K-mTOR pathways: cross-talk and compensation. Trends in biochemical sciences 36, 320–328, doi: 10.1016/j.tibs.2011.03.006 (2011). [DOI] [PMC free article] [PubMed] [Google Scholar]
- 44.Bodoky G et al. A phase II open-label randomized study to assess the efficacy and safety of selumetinib (AZD6244 [ARRY-142886]) versus capecitabine in patients with advanced or metastatic pancreatic cancer who have failed first-line gemcitabine therapy. Invest New Drugs 30, 1216–1223, doi: 10.1007/s10637-011-9687-4 (2012). [DOI] [PubMed] [Google Scholar]
- 45.Kenney C et al. Phase II study of selumetinib, an orally active inhibitor of MEK1 and MEK2 kinases, in KRAS(G12R)-mutant pancreatic ductal adenocarcinoma. Invest New Drugs 39, 821–828, doi: 10.1007/s10637-020-01044-8 (2021). [DOI] [PMC free article] [PubMed] [Google Scholar]
- 46.Hingorani SR et al. Preinvasive and invasive ductal pancreatic cancer and its early detection in the mouse. Cancer Cell 4, 437–450, doi:S153561080300309X [pii] (2003). [DOI] [PubMed] [Google Scholar]
- 47.Jonkers J et al. Synergistic tumor suppressor activity of BRCA2 and p53 in a conditional mouse model for breast cancer. Nat Genet 29, 418–425, doi: 10.1038/ng747 (2001). [DOI] [PubMed] [Google Scholar]
- 48.Sastra SA & Olive KP Quantification of murine pancreatic tumors by high-resolution ultrasound. Methods Mol Biol 980, 249–266, doi: 10.1007/978-1-62703-287-2_13 (2013). [DOI] [PMC free article] [PubMed] [Google Scholar]
- 49.Wapnir IL, Wartenberg DE & Greco RS Three dimensional staging of breast cancer. Breast Cancer Res Treat 41, 15–19 (1996). [DOI] [PubMed] [Google Scholar]
- 50.Samuels Y et al. Mutant PIK3CA promotes cell growth and invasion of human cancer cells. Cancer Cell 7, 561–573, doi: 10.1016/j.ccr.2005.05.014 (2005). [DOI] [PubMed] [Google Scholar]
- 51.Debnath J, Muthuswamy SK & Brugge JS Morphogenesis and oncogenesis of MCF-10A mammary epithelial acini grown in three-dimensional basement membrane cultures. Methods 30, 256–268, doi: 10.1016/s1046-2023(03)00032-x (2003). [DOI] [PubMed] [Google Scholar]
- 52.Siddiqui KM & Chopra DP Primary and long term epithelial cell cultures from human fetal normal colonic mucosa. In Vitro 20, 859–868, doi: 10.1007/BF02619632 (1984). [DOI] [PubMed] [Google Scholar]
- 53.Marin-Valencia I et al. Analysis of tumor metabolism reveals mitochondrial glucose oxidation in genetically diverse human glioblastomas in the mouse brain in vivo. Cell Metab 15, 827–837, doi: 10.1016/j.cmet.2012.05.001 (2012). [DOI] [PMC free article] [PubMed] [Google Scholar]
- 54.Mascanfroni ID et al. Metabolic control of type 1 regulatory T cell differentiation by AHR and HIF1-alpha. Nature medicine 21, 638–646, doi: 10.1038/nm.3868 (2015). [DOI] [PMC free article] [PubMed] [Google Scholar]
- 55.Chong J, Wishart DS & Xia J Using MetaboAnalyst 4.0 for Comprehensive and Integrative Metabolomics Data Analysis. Curr Protoc Bioinformatics 68, e86, doi: 10.1002/cpbi.86 (2019). [DOI] [PubMed] [Google Scholar]
- 56.Bookout AL & Mangelsdorf DJ Quantitative real-time PCR protocol for analysis of nuclear receptor signaling pathways. Nucl Recept Signal 1, e012, doi: 10.1621/nrs.01012 (2003). [DOI] [PMC free article] [PubMed] [Google Scholar]
- 57.Tang Z et al. GEPIA: a web server for cancer and normal gene expression profiling and interactive analyses. Nucleic Acids Res 45, W98–W102, doi: 10.1093/nar/gkx247 (2017). [DOI] [PMC free article] [PubMed] [Google Scholar]
- 58.Dobin A et al. STAR: ultrafast universal RNA-seq aligner. Bioinformatics 29, 15–21, doi: 10.1093/bioinformatics/bts635 (2013). [DOI] [PMC free article] [PubMed] [Google Scholar]
- 59.Li H et al. The Sequence Alignment/Map format and SAMtools. Bioinformatics 25, 2078–2079, doi: 10.1093/bioinformatics/btp352 (2009). [DOI] [PMC free article] [PubMed] [Google Scholar]
- 60.Love MI, Huber W & Anders S Moderated estimation of fold change and dispersion for RNA-seq data with DESeq2. Genome Biol 15, 550, doi: 10.1186/s13059-014-0550-8 (2014). [DOI] [PMC free article] [PubMed] [Google Scholar]
- 61.Subramanian A et al. Gene set enrichment analysis: a knowledge-based approach for interpreting genome-wide expression profiles. Proc Natl Acad Sci U S A 102, 15545–15550, doi: 10.1073/pnas.0506580102 (2005). [DOI] [PMC free article] [PubMed] [Google Scholar]
- 62.Team R. D. C. R: A language and environment for statistical computing. R Foundation for Statistical Computing, Vienna, Austria. http://www.r-project.org (2016). [Google Scholar]
- 63.Langmead B & Salzberg SL Fast gapped-read alignment with Bowtie 2. Nat Methods 9, 357–359, doi: 10.1038/nmeth.1923 (2012). [DOI] [PMC free article] [PubMed] [Google Scholar]
- 64.Feng J, Liu T, Qin B, Zhang Y & Liu XS Identifying ChIP-seq enrichment using MACS. Nat Protoc 7, 1728–1740, doi: 10.1038/nprot.2012.101 (2012). [DOI] [PMC free article] [PubMed] [Google Scholar]
- 65.Consortium EP An integrated encyclopedia of DNA elements in the human genome. Nature 489, 57–74, doi: 10.1038/nature11247 (2012). [DOI] [PMC free article] [PubMed] [Google Scholar]
- 66.Quinlan AR & Hall IM BEDTools: a flexible suite of utilities for comparing genomic features. Bioinformatics 26, 841–842, doi: 10.1093/bioinformatics/btq033 (2010). [DOI] [PMC free article] [PubMed] [Google Scholar]
- 67.Ramirez F, Dundar F, Diehl S, Gruning BA & Manke T deepTools: a flexible platform for exploring deep-sequencing data. Nucleic Acids Res 42, W187–191, doi: 10.1093/nar/gku365 (2014). [DOI] [PMC free article] [PubMed] [Google Scholar]
- 68.Roehle K et al. cIAP1/2 antagonism eliminates MHC class I-negative tumors through T cell-dependent reprogramming of mononuclear phagocytes. Sci Transl Med 13, doi: 10.1126/scitranslmed.abf5058 (2021). [DOI] [PMC free article] [PubMed] [Google Scholar]
Associated Data
This section collects any data citations, data availability statements, or supplementary materials included in this article.
Supplementary Materials
Data Availability Statement
All data supporting the findings in this study are available within the Article, its Supplementary Information, Source Data files and from the corresponding author upon reasonable request. The RNA-Seq and ATAC-Seq data have been deposited in National Center for Biotechnology Information (NCBI)’s Gene Expression Omnibus and are accessible through GEO Series accession no. GSE193411. Box plots in Extended Data Fig. 4a were generated by GEPIA57 http://gepia.cancer-pku.cn/help.html, which uses a combination of public datasets from both TCGA and GTEx for expression analyses. In Extended Data Fig. 9a, b, bar plots and data were generated using TRANSFAC database (version 1.9) https://genexplain.com/transfac-2-0/. For gel source data, see Supplementary Fig. 1.