Abstract

Correction to: EMBO J (2022) 41:e109566. 10.15252/embj.2021109566 | Published online 28 June 2022
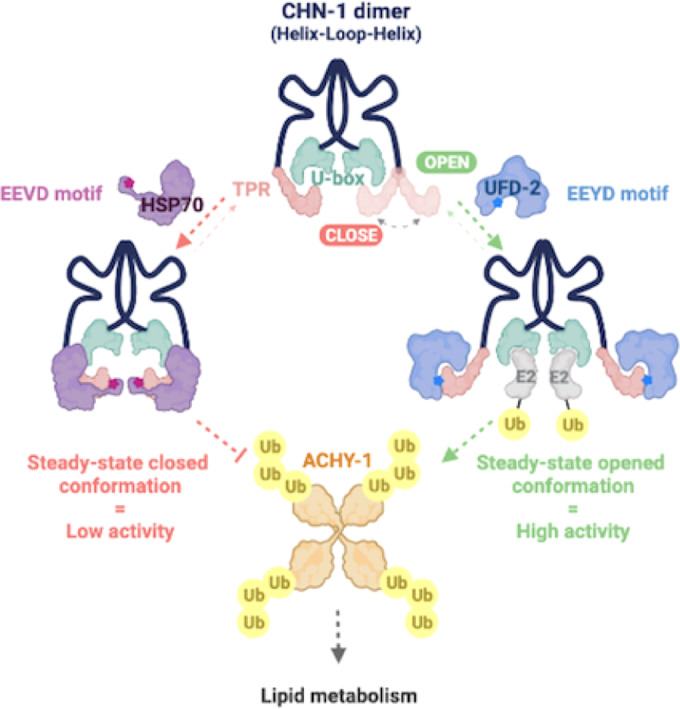
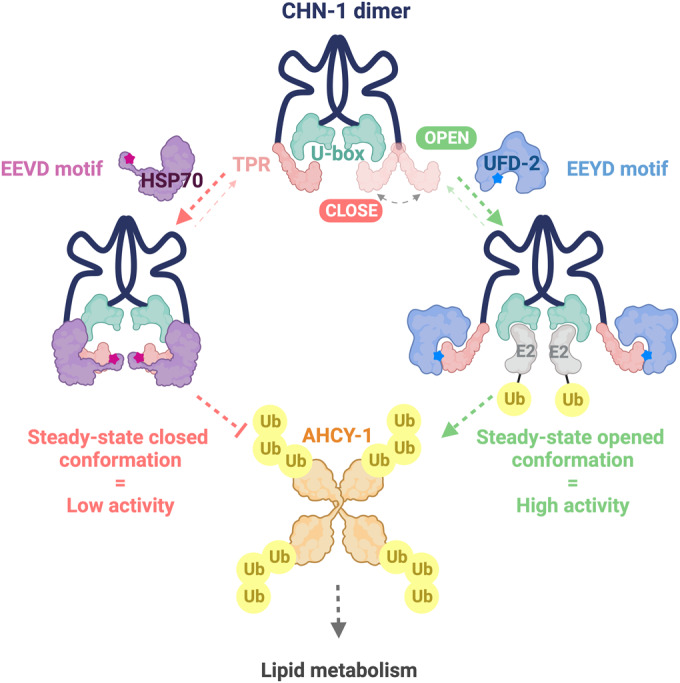
The authors contacted the journal after becoming aware of an error in the terminology of the graphical abstract, the results section of the manuscript and within the Figure 5A figure legend.
The graphical abstract is corrected.
Original:

Corrected:

The Results section is corrected.
The Figure 5A figure legend is corrected.
Page 12, line 12 of the PDF manuscript is corrected from:
“compared with the ACHY-1 status in wild-type animals (Fig 5C). As”
To (Changes in bold):
“compared with the AHCY-1 status in wild-type animals (Fig 5C). As”
Figure 5A figure legend is corrected from:
“A) Boxplot analysis showing the Z-score of normalized intensities of the 50 LC-MS/MS-identified peptides from ACHY-1 detected in N2 (wild-type), chn-1(by155), ufd-2(tm1380), and chn-1(by155); ufd-2(tm1380) mutant worms. The central band of each box is the median value, and the box defines the 25th (lower) and 75th (higher) quantile. The whiskers represent the minimum and maximum values in the data, excluding outliers. A data point is considered an outlier if the distance to the median is greater than 1.5 * inter quantile range distance to the median.”
To (Changes in bold):
“A) Boxplot analysis showing the Z-score of normalized intensities of the 50 LC-MS/MS-identified peptides from AHCY-1 detected in N2 (wild-type), chn-1(by155), ufd-2(tm1380), and chn-1(by155); ufd-2(tm1380) mutant worms. The central band of each box is the median value, and the box defines the 25th (lower) and 75th (higher) quantile. The whiskers represent the minimum and maximum values in the data, excluding outliers. A data point is considered an outlier if the distance to the median is greater than 1.5 * inter quantile range distance to the median.”
These changes do not affect the text or conclusions of the article.


