Abstract
To investigate the symptoms of SARS-CoV-2 infection, their dynamics and their discriminatory power for the disease using longitudinally, prospectively collected information reported at the time of their occurrence. We have analysed data from a large phase 3 clinical UK COVID-19 vaccine trial. The alpha variant was the predominant strain. Participants were assessed for SARS-CoV-2 infection via nasal/throat PCR at recruitment, vaccination appointments, and when symptomatic. Statistical techniques were implemented to infer estimates representative of the UK population, accounting for multiple symptomatic episodes associated with one individual. An optimal diagnostic model for SARS-CoV-2 infection was derived. The 4-month prevalence of SARS-CoV-2 was 2.1%; increasing to 19.4% (16.0%–22.7%) in participants reporting loss of appetite and 31.9% (27.1%–36.8%) in those with anosmia/ageusia. The model identified anosmia and/or ageusia, fever, congestion, and cough to be significantly associated with SARS-CoV-2 infection. Symptoms’ dynamics were vastly different in the two groups; after a slow start peaking later and lasting longer in PCR+ participants, whilst exhibiting a consistent decline in PCR- participants, with, on average, fewer than 3 days of symptoms reported. Anosmia/ageusia peaked late in confirmed SARS-CoV-2 infection (day 12), indicating a low discrimination power for early disease diagnosis.
Keywords: coronavirus, longitudinal data, symptoms dynamics
Introduction
The SARS-COV-2 pandemic has contributed to significant global morbidity and mortality. As of March 7, 2023, there have been over 759 million cases of COVID-19, including 6.8 million deaths [1]. The burden of disease was greatly felt by all public health organizations, particularly by healthcare systems that were frequently put under strain as they managed surges of infections [2]. The unprecedented scale and speed of the pandemic, its similarities to influenza, and the three major foci of care homes, hospitals, and the community, proved to be a challenging combination for devising a standard list of symptoms for COVID-19. Accurate recognition of the symptoms that indicated infection and warranted urgent testing was particularly important in the early stages of the pandemic when polymerase chain reaction (PCR) test kits were in demand [3].
The gold standard for diagnosing SARS-COV-2 infection is an oropharyngeal/nasal PCR swab, although latterly lateral flow tests are used for rapid diagnosis [4]. In the UK, PCR testing was initially prioritized for those presenting with a new (or worsening) cough, fever, or breathlessness [5]. However other symptoms such as altered or loss of smell (anosmia) or taste (ageusia), and gastrointestinal symptoms (such as loss of appetite and diarrhoea) have also been associated with COVID-19 [6–8]. In a Cochrane Review (2021), mainly based on more severely affected populations (e.g. hospitalized patients), the pooled specificities for anosmia and ageusia were high (90.5%), suggesting these symptoms may be a useful marker for COVID-19 [9]. The updated review (2022) concluded that most other individual symptoms had poor diagnostic accuracy [10].
In a study of 483 subjects in Washington D.C., 42% of whom were healthcare or essential workers, aged between 25 and 44 years, who retrospectively reported symptoms, 27% were reported to be PCR positive. Wojtusiak et al. concluded that clusters of symptoms are more predictive of COVID-19 than any one specific symptom [11]. In a different study, the same authors also examined the importance of the order of symptom occurrence in deriving a disease diagnostic model [12]. A meta-analysis based on sample data collected from nine established longitudinal cohorts designed a four-category cross-sectional outcome aiming to capture characteristics of long COVID in the UK population [13]. Based on questionnaires completed by subsets of participants between July 2020 and September 2021 and self-reported COVID results as well as the presence/absence of symptoms, the meta-analysis demonstrated considerable heterogeneity between studies [13].
The observation of previous research shows that there is a great deal of variation in data collection methods (e.g. smartphone apps, patient records [14–16]), epidemiological heterogeneity of study populations (e.g. hospitals, intensive care units, care homes [13–15]), and different reporting methods (e.g. self-reports, interviews [17]). As symptoms develop over time, cross-sectional outcomes and retrospectively collected information on symptoms may be difficult to relate to COVID-19 onset which is also known to have a variable incubation period (2–14 days) [18]. The Zoe Health Study compared three different symptom-based diagnostic models for SARS-CoV-2 and investigated the effect of demographic variables on the models’ performance metrics and found that the discrimination power of all models improved with the number of days of symptoms included, whilst the most relevant symptoms for detecting COVID-19 were anosmia and chest pain [12].
The phase 3 Novavax COVID-19 clinical trial in the UK was conducted at 33 sites and recruited 15,185 participants [19]. Its primary aim was to evaluate the efficacy and safety of the vaccine. We used the prospectively reported symptoms of possible SARS-CoV-2 infection to assess the discrimination power of individual symptoms and to investigate an optimal combination to generate a diagnostic model for the presence of SARS-CoV-2 infection in the UK population.
Methods
The data for this analysis were provided by Novavax, Inc. [19]. The methods and results of the trial are described elsewhere [19]. Data included are from October 28, 2020 to February 28, 2021.
Monitoring for COVID-19
All participants had a SARS-CoV-2 PCR test performed at recruitment and were tested for symptomatic infections throughout the study. Participants were instructed to contact the study team within 24 h if they self-assessed COVID-19 symptoms (Table 1), triggering a surveillance visit. Throat/nasal swabs were self-collected by participants approximately 24 h after the onset of symptoms, then daily for up to 3 days. A participant with suspected or confirmed COVID-19 was asked to complete a symptom diary, starting on their first day of symptoms, reporting daily for a minimum of 10 days (even if their symptoms resolved and regardless of SARS-CoV-2 PCR result). Participants with confirmed symptomatic COVID-19, signified by a positive PCR test, continued documenting their symptoms until resolution. Virologic confirmation was performed by PCR assay at the U.K. Department of Health and Social Care laboratories with the TaqPath system (Thermo Fisher Scientific).
Table 1.
Qualifying symptoms of suspected COVID-19
|
Statistical methodology
The main objective was to construct an optimal diagnostic model for COVID-19 based on participants’ symptoms and to highlight differences in the dynamics of specific symptoms in groups defined by participants who experienced COVID-19 and those who did not. To extrapolate the results to the UK population, we started by plotting and empirically comparing the distribution of age, gender, and ethnicity distributions in the sample data to that of the UK population [20–22]. We then used post-stratification techniques for incorporating population demographic distributions [23]. This procedure allowed us to produce estimates generalizable to the UK community population. Weights were derived and assigned to each participant such that the subsequent estimation procedures inflated the effect of under-represented groups (e.g. young ethnic minorities) and depressed the effect of overrepresented groups in the sample (e.g. old whites).
We constructed a master file that included multiple PCR tests per participant and multiple symptomatic episodes. The resulting data have a hierarchical structure with implications on the subsequent choice of analyses and estimation procedures (details in the Supplementary material). Participants were initially grouped by their PCR results, that is, participants with at least one PCR positive result (PCR+) and those always negative (PCR-). We reported the frequency and proportion of the symptomatic participants in the two groups. We estimated the probabilities of testing positive given a specific symptomatic episode and the mean number of reports (or number of days) of a specific symptom within an illness episode. We also investigated the symptom report dynamics and explored the extent to which symptoms were associated with demographics. These analyses identified the main confounder candidates and their potential influence on the subsequent receiver operating characteristic (ROC) analyses.
Non-parametric techniques such as local polynomial smoothing have been used to fit curves on the daily probabilities of the reports in the PCR+ and PCR− participants. A heatmap of daily probabilities of reported symptoms has also been presented in ascending order of their magnitude on the first day in positive patients.
We assessed the effect of reporting the number of days of each specific symptom on the probability of testing PCR+ vs. PCR−, measured as odds ratios and their 95%CIs. We derived a symptom-based diagnostic model using two-level logistic regression and evaluated the discriminatory power of this model using the area under the curve (AUC) as a metric for its discrimination. We also performed a two-stage process ROC analysis [24]. The technique allows multiple episodes to be associated with an individual, and adjustments using population weights. The result is an estimate of the ROC curve for each specific symptom as a function of age and ethnicity – known as a covariate-specific ROC curve [24]. Using these techniques, we also highlighted the increasing discrimination power of individual symptoms based on the temporally ordered reports restricted to the first 1, 2, 3 to longer than 15 days after the start of the symptomatic illness episode. The effect of age and ethnicity on the discrimination power of individual symptoms was also evaluated. More details are in the Supplementary material.
Results
Data summary
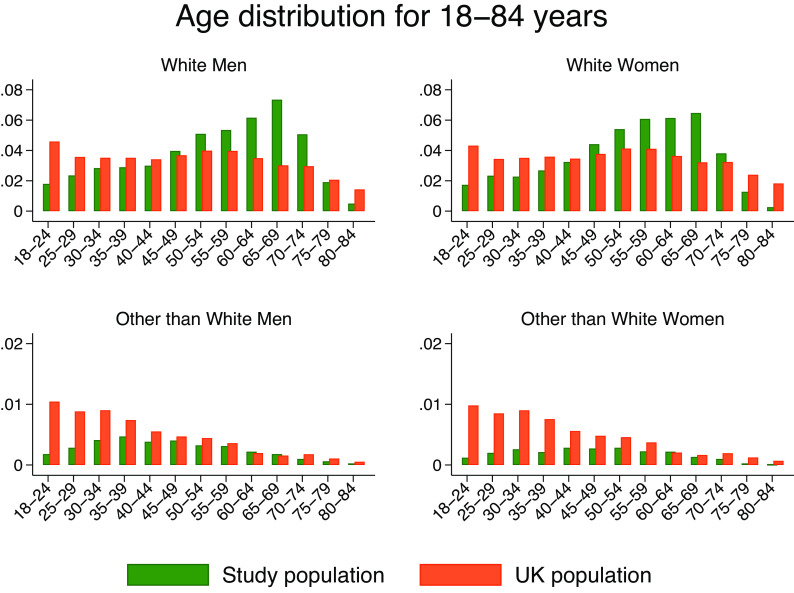
Table 2 shows a simplified picture of the data based on a binary assessment. Of 15,139 participants, 317 (2.1%) had a PCR+ episode and 3,320 (21.9%) had at least one symptomatic episode. 8% (266/3320) of the symptomatic population were PCR+ and 84% (266/317) of the PCR+ participants reported symptoms. Figure 1 shows the age distribution against that of the UK population stratified by gender and ethnicity [20–22]. These data have been used to calculate the weights associated with our analyses.
Table 2.
PCR and symptomatic status of all study participants; 3,320 (21.9%) of all participants had at least one symptomatic episode and 317 (2.1%) of all had a PCR+ episode
| Overall | |||
|---|---|---|---|
| PCR− | PCR+ | Total | |
| No symptomatic episode | 11,768 | 51 | 11,819 |
| At least one symptomatic episode | 3,054 | 266 | 3,320 (21.9%) |
| 14,822 | 317 (2.1%) | 15,139 | |
Figure 1.
Age distribution in the study sample compared to that of the UK population, stratified by gender and ethnicity.
Table 3 presents demographic data stratified by PCR status. The comorbidities variable indicates the presence of at least one comorbidity. COVID-19 was directly associated with younger age, that is, 1 year increase in age decreased the OR of COVID-19 by a small yet significant factor of 0.98 (p < 0.001). Ethnic minorities (excluding white) were twice as likely to test positive than their white counterparts, that is, OR = 1.924 (95%CI (1.169, 3.167)). The other than white category included Asians (n = 462 (3.1%)), Black (n = 60 (0.4%)), and others (n = 153 (1%)).
Table 3.
Cohort demographic characteristics stratified by participant PCR status
| Variable | Summary/category | All | PCR+ | PCR− | OR | P-value | 95%CI low | 95%CI high |
|---|---|---|---|---|---|---|---|---|
| 15,139 | 317 | 14,822 | ||||||
| Age | Mean/SD | 53.1/14.9 | 49.2/13.6 | 53.2/14.9 | 0.983 | <0.001 | 0.975 | 0.991 |
| (years) | Median (IQR) | 55(42, 65) | 51(38, 60) | 55(43, 65) | ||||
| Min–max | 18–84 | 18–79 | 18–84 | |||||
| Gender | Male | 7,808(51.6%) | 152(48.0%) | 7,656(51.6%) | 1.086 | 0.550 | .829 | 1.423 |
| Female | 7,331(48.4%) | 165(52.1%) | 7,166(48.4%) | |||||
| Ethnicity | White | 14,280 (94.3%) | 288(90.9%) | 13,992(94.4%) | 1.924 | 0.010 | 1.169 | 3.167 |
| BAME | 675(4.5%) | 26(8.2%) | 649(4.4%) | |||||
| Missing | 184 (1.2%) | 3(0.95%) | 181(1.2%) | |||||
| BMI | Mean/SD | 27.6/5.3 | 28.2/5.6 | 27.6/5.3 | 1.003 | 0.845 | .976 | 1.030 |
| Median (IQR) | 26.7(23.9–30.4) | 27.1(24.1–31.6) | 26.7(23.9–30.4) | |||||
| Min–max | 15.1–55 | 16.8–53 | 15.1–55 | |||||
| Missing | 412(2.7) | 7(2.5) | 405(2.7) | |||||
| BMI > 30 | No | 10,777(71.2%) | 216(68.1%) | 10,561(71.3%) | 1.002 | 0.991 | .759 | 1.321 |
| Yes | 3,950(26.1%) | 94(29.7%) | 3,856(26.0%) | |||||
| Missing | 412(2.7%) | 7(2.2%) | 405(2.7%) | |||||
| Presence of comorbidities | No | 8,372 (55.3%) | 177(55.8%) | 8,195(55.3%) | 0.816 | 0.128 | .628 | 1.060 |
| Yes | 6,767 (44.7%) | 140 (44.2%) | 6,627(44.7%) |
The ORs measure univariate associations between the PCR status and population characteristics, irrespective of the presence of symptoms. Statistically significant associations are marked in bold.
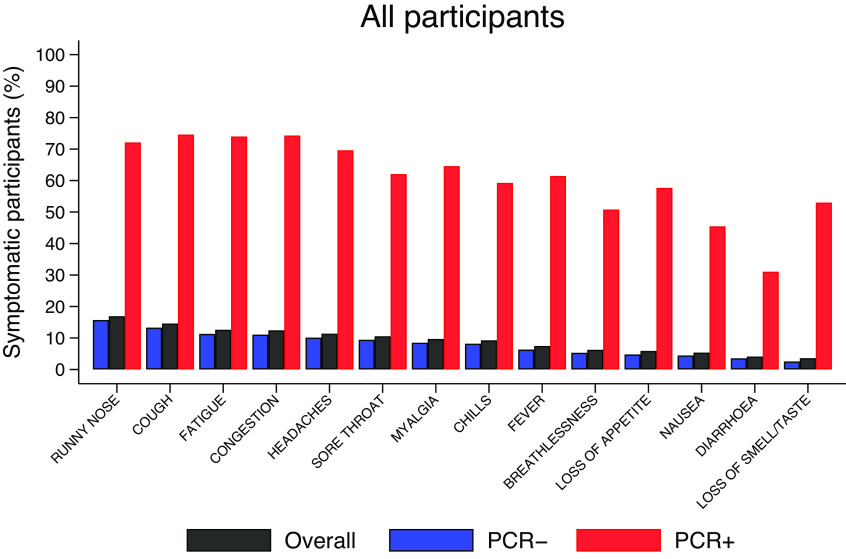
Summary symptoms data (overall and stratified by PCR status) are presented in the Supplementary Material and illustrated in Figure 2. Runny nose (16.9%) was the most reported symptom in this cohort, followed by cough (14.6%) and tiredness (12.6%). Nausea (5.3%), diarrhoea (4.1%), and anosmia/ageusia (3.6%) were the least reported. This ordering is preserved in PCR− participants; however, in PCR+ participants cough (75.1%) was the most frequent symptom, followed by congestion (74.8%) and tiredness (74.4%). Anosmia/ageusia was reported by 53.3% of PCR+ participants versus 2.5% of PCR− participants.
Figure 2.
Proportions of participants with specific symptoms, overall, and stratified by PCR status, as shown in the Supplementary Material. For example, overall, 16.9% of all participants reported runny nose at least once but the figure is much higher (72.6%) among PCR+ contrasting with 15.7% among PCR−.
The probabilities of PCR status by specific symptom reports
Figure 3 shows the probabilities of testing PCR+ conditioned on each symptom (reported at least once). The prevalence of COVID-19 was 31.9% (27.1%–36.8%) in those reporting anosmia/ageusia and 19.4% (16%–22.7%) for loss of appetite.
Figure 3.
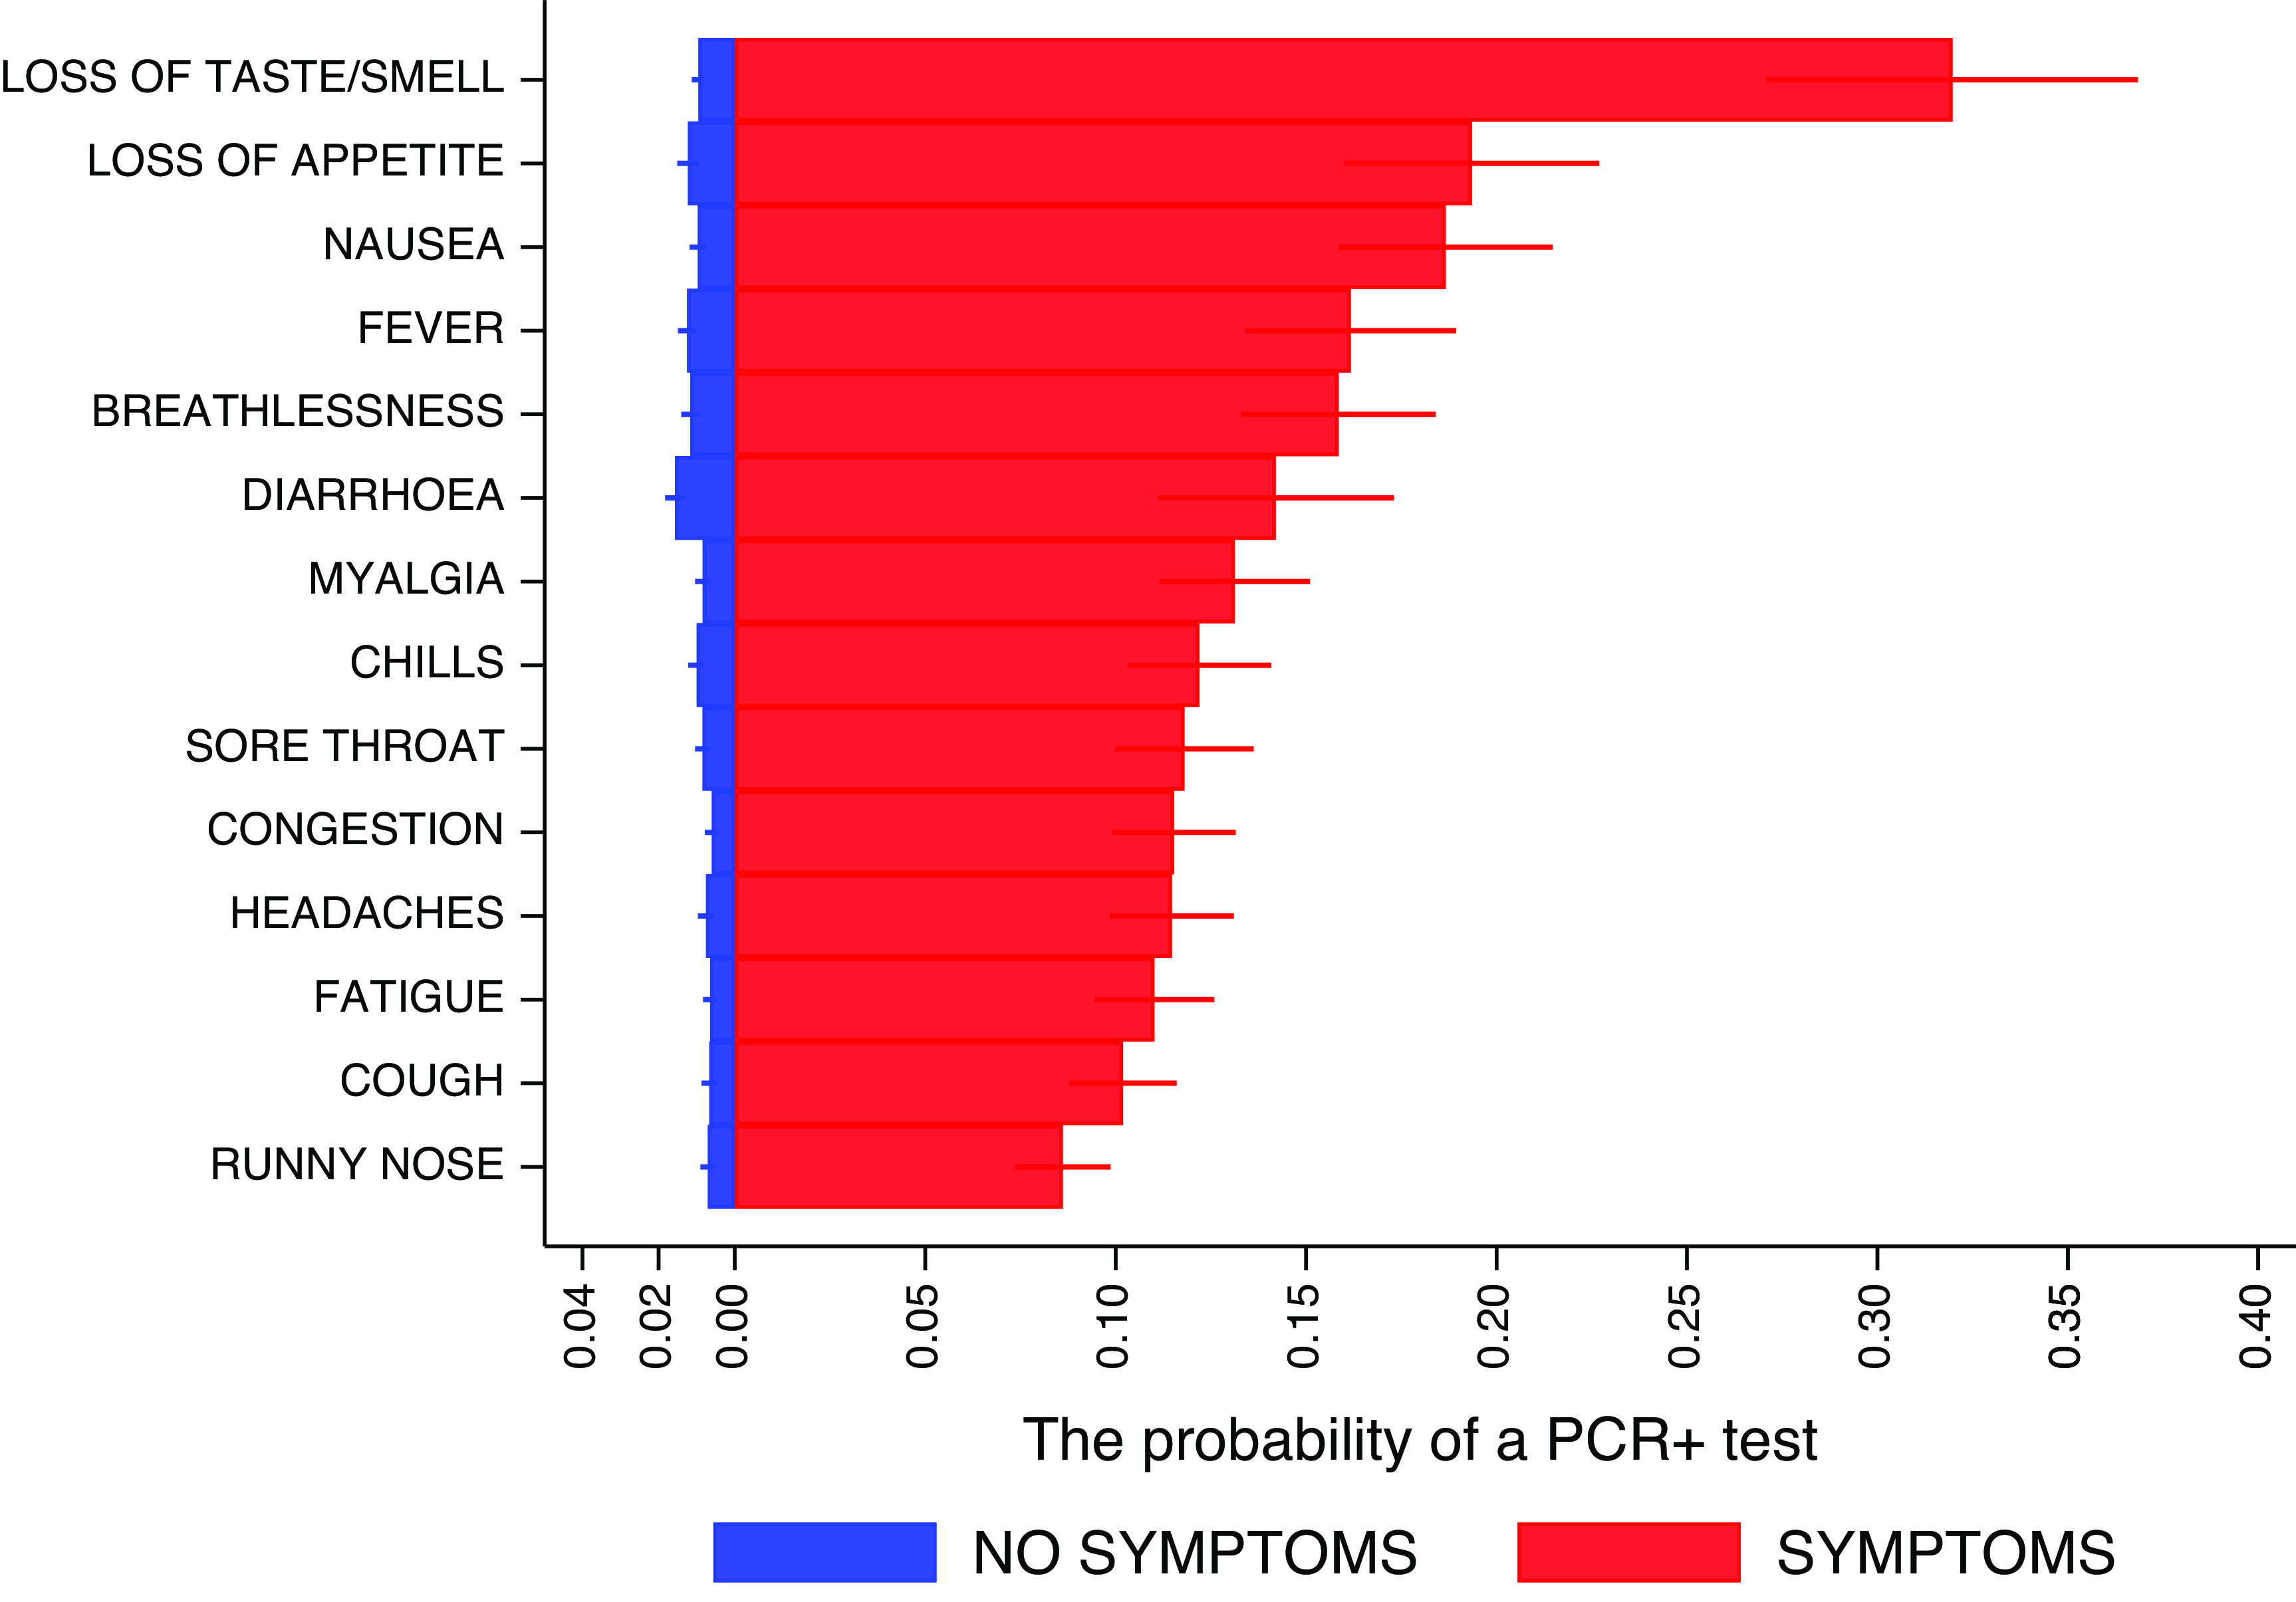
Predicted probabilities of PCR+ status, stratified by the presence of specific symptoms, and their 95%CIs. Predictions related to each specific symptom are unadjusted for the others and are based on a binary regression with robust standard errors accounting for multiple episodes with events associated with a participant. For example, in participants with loss of taste or smell, regardless of the presence or absence of other symptoms, the probability of a positive PCR test is 0.319 (31.9%).
The number of specific symptom analyses
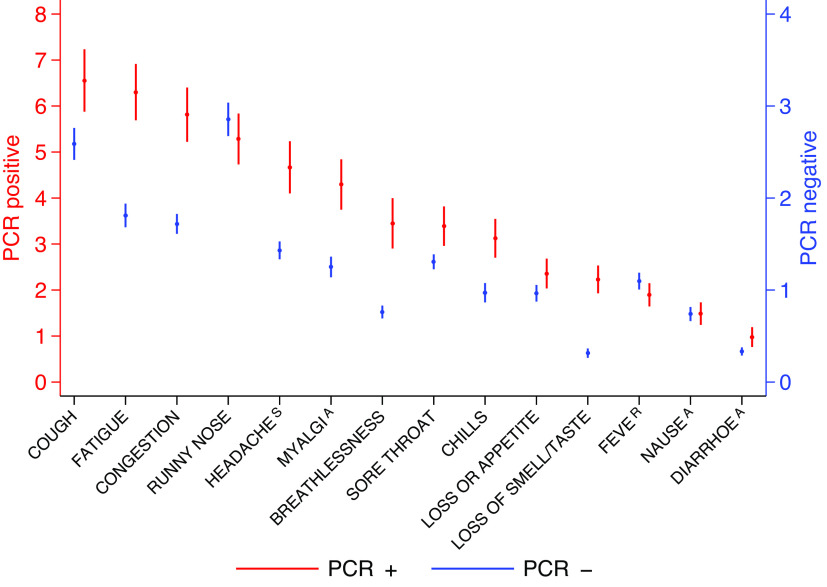
Figure 4 shows the mean number of days (and their 95%CIs) that each specific symptom was reported during a symptomatic episode, stratified by PCR status. PCR+ participants reported a significantly longer duration of specific symptoms compared to PCR− participants. For example, the mean number of days of cough was 6–7 in PCR+ participants and 2–3 in PCR− participants.
Figure 4.
Predicted mean of number of days specific symptoms were reported during an episode and their 95%CIs. The red values (PCR+) are referred to the left axis and the blue values (PCR−) are referred to the right axis. The analysis is restricted to symptomatic participants only. For example, for those participants reporting cough as part of an episode, the mean of the number of days was 6–7 days in PCR+ participants and 2–3 days in PCR−.
Table 4 presents an exploratory analysis on the rate ratios (fold-effects) as measures of associations between the mean number of days of specific symptoms with population characteristics, this has been also analyzed in the PCR+ subgroup in the Supplementary Material. From Table 4, we learn that age was directly associated with an increased number of reports of runny nose, cough, and loss of appetite, but inversely associated with sore throat and anosmia/ageusia. Women reported 24.3% (95%CI (11.4%, 38.7%)) more headaches than men. Other than white participants reported fewer symptoms than white participants; for runny nose by a factor of 0.76 (95%CI (0.65, 0.89)), cough (by a factor of 0.77 (95% (0.62, 0.95)), and congestion (by a factor of 0.77 (95% (0.62, 0.96)). Increasing BMI was associated with increased reporting of myalgia (P = 0.033) and breathlessness (p < 0.001). Those with co-morbidities reported 18.5% (95%CI (8.1%, 29.8%)) more days of cough, 16.1% (95%CI (1.9%, 32.2%)) more days of myalgia, and 22.4% (95%CI (3.6%, 44.5%)) more days of breathlessness on average, than those without co-morbidities (Table 4).
Table 4.
Fold-effects (risk ratios) of demographics and their 95%CIs on the mean number of days of specific symptoms reported during a symptomatic episode
| Age | Gender | Ethnicity | BMI | Comorbidities | ||||||||||||||||
|---|---|---|---|---|---|---|---|---|---|---|---|---|---|---|---|---|---|---|---|---|
| RR | P-value | 95%CI low–high | RR | P-value | 95%CIlow–high | RR | P-value | 95%CI low–high | RR | P-value | 95%CI low–high | RR | P-value | 95%CIlow–high | ||||||
| Runny nose | 1.005 | <0.001 | 1.003 | 1.008 | 0.960 | 0.301 | 0.888 | 1.037 | 0.758 | 0.001 | 0.645 | 0.891 | 0.999 | 0.765 | 0.992 | 1.006 | 1.076 | 0.060 | 0.997 | 1.162 |
| Cough | 1.006 | <0.001 | 1.003 | 1.009 | 0.966 | 0.477 | 0.879 | 1.062 | 0.769 | 0.014 | 0.624 | 0.949 | 1.005 | 0.140 | 0.998 | 1.013 | 1.185 | <0.001 | 1.081 | 1.298 |
| Fatigue | 0.998 | 0.307 | 0.994 | 1.002 | 1.040 | 0.447 | 0.940 | 1.151 | 0.885 | 0.210 | 0.731 | 1.071 | 1.004 | 0.315 | 0.996 | 1.012 | 1.081 | 0.118 | 0.980 | 1.192 |
| Congestion | 0.997 | 0.182 | 0.994 | 1.001 | 1.049 | 0.370 | 0.945 | 1.164 | 0.773 | 0.020 | 0.622 | 0.961 | 1.005 | 0.214 | 0.997 | 1.014 | 1.050 | 0.352 | 0.948 | 1.162 |
| Headaches | 0.998 | 0.265 | 0.994 | 1.002 | 1.243 | <0.001 | 1.114 | 1.387 | 0.894 | 0.386 | 0.694 | 1.152 | 1.005 | 0.329 | 0.995 | 1.014 | 1.047 | 0.408 | 0.939 | 1.167 |
| Sore throat | 0.995 | 0.021 | 0.990 | 0.999 | 1.056 | 0.419 | 0.925 | 1.205 | 0.887 | 0.488 | 0.633 | 1.244 | 0.998 | 0.781 | 0.988 | 1.009 | 1.039 | 0.567 | 0.912 | 1.182 |
| Myalgia | 1.005 | 0.060 | 1.000 | 1.010 | 0.975 | 0.713 | 0.853 | 1.115 | 0.820 | 0.101 | 0.647 | 1.040 | 1.012 | 0.033 | 1.001 | 1.023 | 1.161 | 0.025 | 1.019 | 1.322 |
| Chills | 1.001 | 0.786 | 0.994 | 1.008 | 1.043 | 0.661 | 0.865 | 1.257 | 0.751 | 0.080 | 0.545 | 1.035 | 1.003 | 0.718 | 0.989 | 1.017 | 1.102 | 0.282 | 0.923 | 1.315 |
| Fever | 0.999 | 0.842 | 0.994 | 1.005 | 1.052 | 0.573 | 0.881 | 1.257 | 0.852 | 0.453 | 0.561 | 1.295 | 1.014 | 0.033 | 1.001 | 1.027 | 1.111 | 0.227 | 0.936 | 1.319 |
| Breathlessness | 1.001 | 0.740 | 0.995 | 1.007 | 1.043 | 0.606 | 0.888 | 1.226 | 0.684 | 0.059 | 0.461 | 1.014 | 1.024 | <0.001 | 1.012 | 1.037 | 1.224 | 0.017 | 1.036 | 1.445 |
| Anorexia | 1.009 | 0.018 | 1.001 | 1.016 | 1.021 | 0.822 | 0.849 | 1.228 | 0.720 | 0.139 | 0.466 | 1.113 | 1.012 | 0.066 | 0.999 | 1.025 | 1.184 | 0.070 | 0.986 | 1.420 |
| Nausea | 1.002 | 0.499 | 0.995 | 1.009 | 1.106 | 0.375 | 0.885 | 1.382 | 0.759 | 0.309 | 0.446 | 1.291 | 1.008 | 0.273 | 0.994 | 1.023 | 1.061 | 0.588 | 0.856 | 1.317 |
| Diarrhoea | 0.997 | 0.494 | 0.990 | 1.005 | 0.900 | 0.426 | 0.696 | 1.166 | 1.168 | 0.475 | 0.763 | 1.787 | 1.008 | 0.416 | 0.989 | 1.026 | 1.137 | 0.328 | 0.879 | 1.471 |
| Loss of smell/taste | 0.989 | 0.018 | 0.979 | 0.998 | 1.239 | 0.112 | 0.951 | 1.614 | 0.894 | 0.763 | 0.433 | 1.847 | 0.994 | 0.656 | 0.966 | 1.022 | 0.802 | 0.105 | 0.614 | 1.047 |
The estimation uses a Poisson zero-inflated model on the number of reports of an episode and allows for multiple episodes with events associated with one participant. Statistically significant associations are marked in bold.
In those with a positive PCR (Supplementary Material), many of these trends remained significant, for example, the effect of age on myalgia (P = 0.039) and loss of appetite (P = 0.012), the effect of gender on headaches (P = 0.033), of ethnicity on congestion (P = 0.002) and of BMI on breathlessness (P = 0.012). Increased BMI was associated with longer duration of cough (P = 0.022).
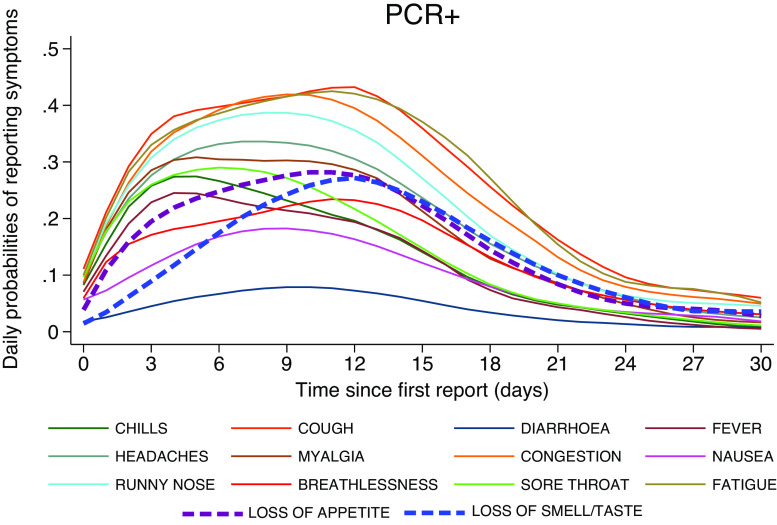
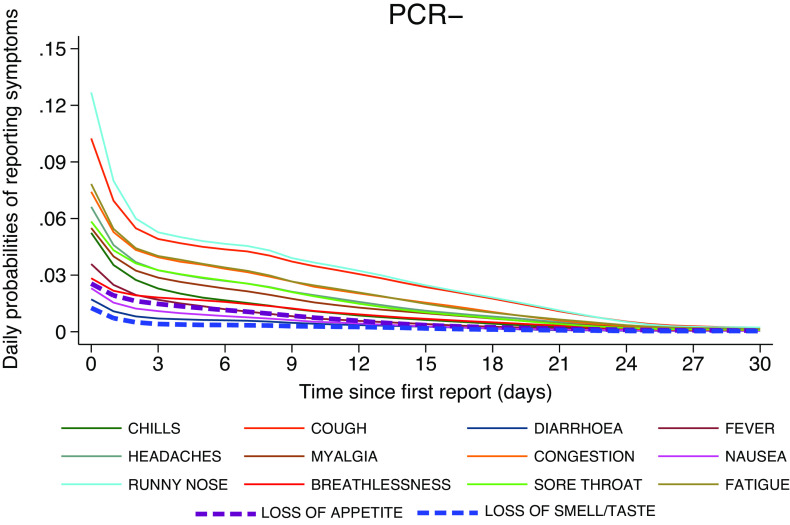
Figures 5 and 6 present the daily probabilities of specific symptoms (starting with the first report of any symptom), stratified by PCR result. Whilst these probabilities fall swiftly in PCR− participants (Figure 6), they start more slowly and peak later in those with COVID-19 (Figure 5). Fever peaked on the 4th day (24%), followed by chills (27%), whilst myalgia (31%) and loss of appetite (28%) peaked on the 5th day. Anosmia/ageusia (27%) and cough (43%) peaked on the 12th day. These findings are also reflected in Figure 7; symptoms in PCR− participants fall rapidly shown by the dark purple, whereas they are later to peak and slower to fade in PCR+ participants, shown by the changing colour scale.
Figure 5.
Daily probabilities of reporting specific symptoms starting with the first report conditioned on PCR+ participants and their corresponding illness episode, that is, ignoring the symptomatic episodes associated with these participants which were PCR-. Non-parametric methodology was used to capture the shape of the individual longitudinal daily reports.
Figure 6.
Daily probabilities of reporting specific symptoms starting with the first report using PCR- symptomatic episodes across all participants.
Figure 7.
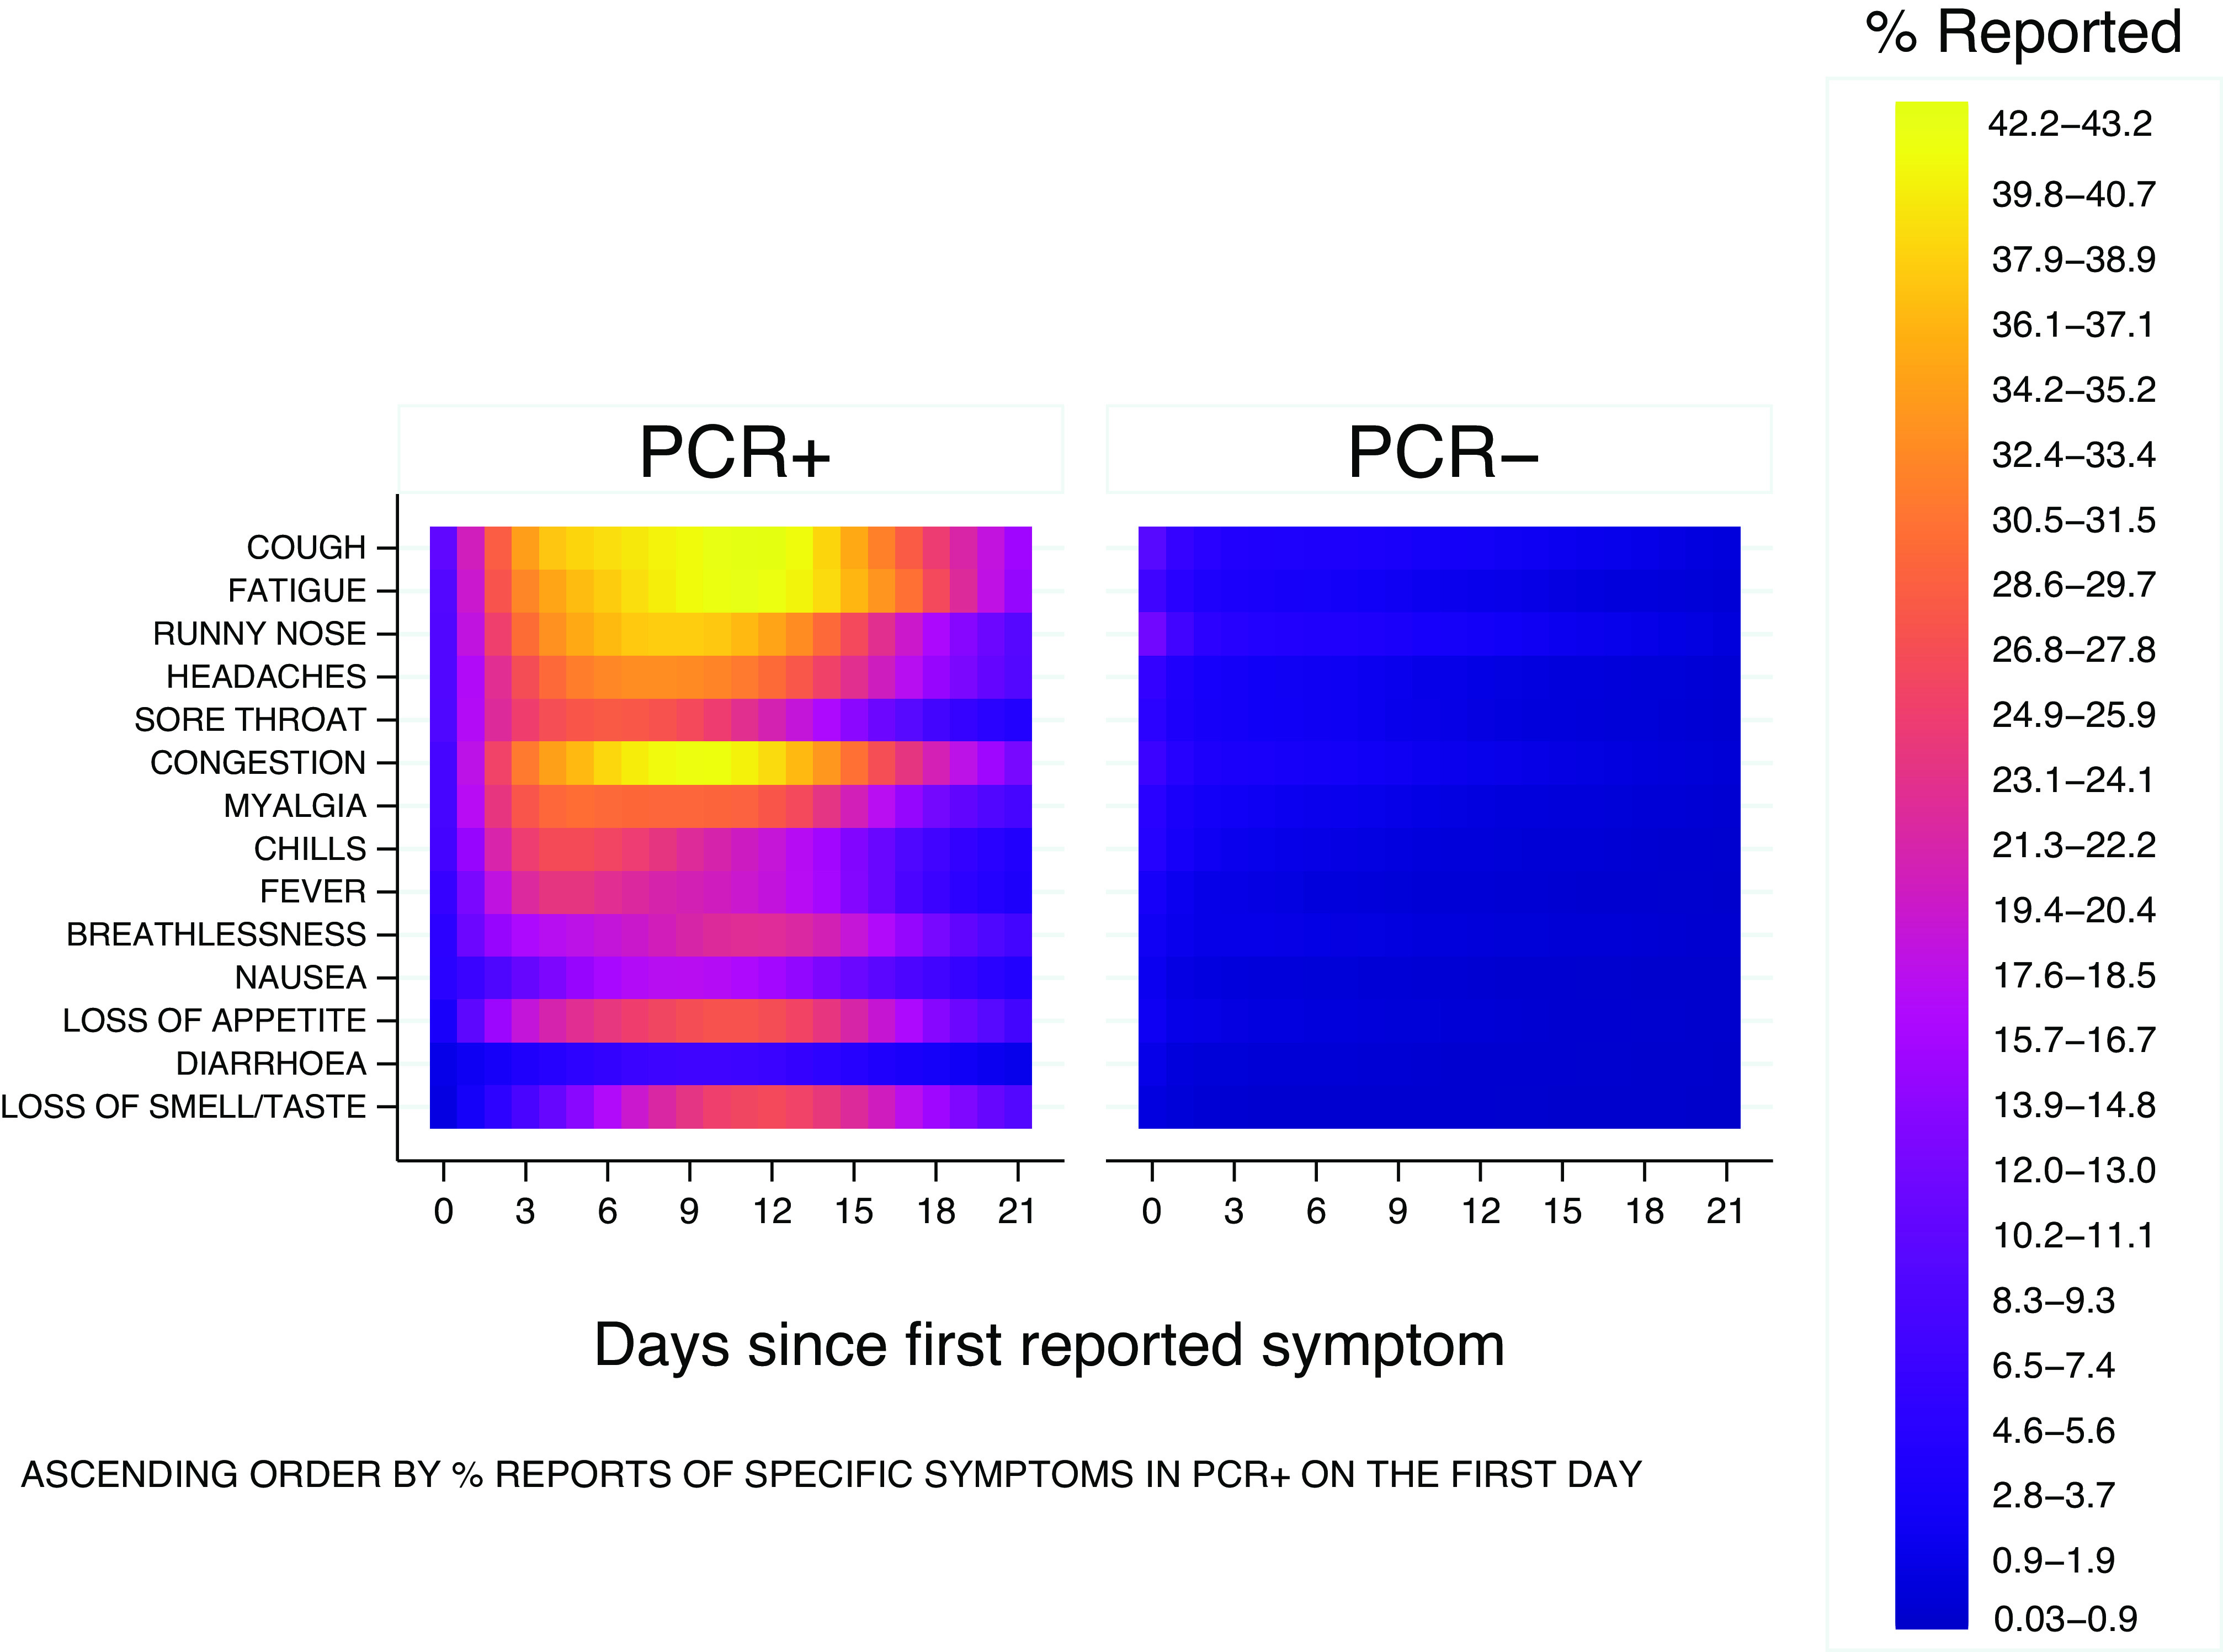
Probabilities of daily occurrences of various symptoms have similar magnitude in both PCR+ and PCR− groups on the first reporting day whilst they peak up later during illness evolution in PCR+ patients and decline in those PCR−, also reflected in previous figures 5 and 6.
The optimal diagnostic model for testing PCR+ based on symptoms and controlled for population characteristics
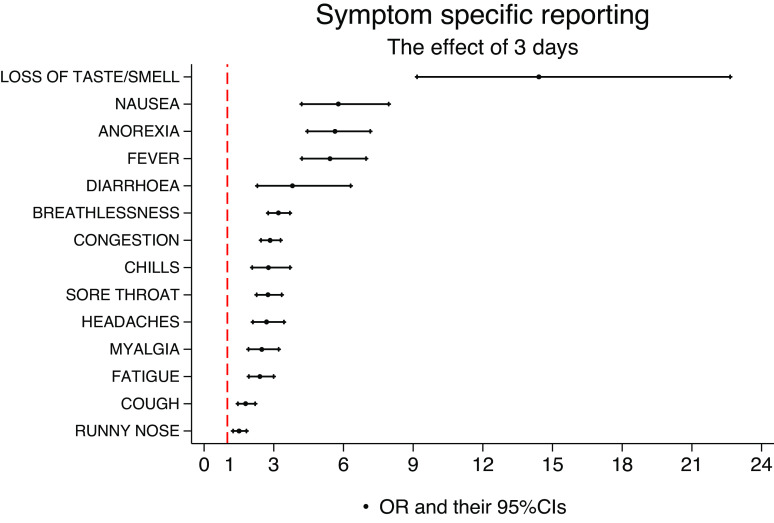
Figure 8 presents the effects (ORs) of reporting a specific symptom for 3 days within an episode, on the probability of testing PCR+. The rationale for considering the 3-day symptom effect as a meaningful magnitude for the length of reports was inspired by Figure 4. In this figure, all specific symptoms seem to have a mean of less than 3 days in PCR− participants. Anosmia/ageusia (OR = 14.4 (95%CI 9.2, 22.6)), nausea (OR = 5.8 (95%CI 4.2, 7.9)), loss of appetite (OR = 5.6 (95%CI 4.5, 7.2)), and fever (OR = 5.4 (95%CI 4.2, 6.97)) have the strongest effects in terms of magnitude and statistical significance.
Figure 8.
Effect (OR) of reporting a specific symptom for 3 days during an episode, irrespective of other symptoms reported during that episode.
The most parsimonious model, that is, the model with the least number of predictors, yet explaining the most variability in the data, is shown in Table 5. The model retains anosmia/ageusia (OR = 5.2 (95%CI 3.4, 7.9)), loss of appetite (OR = 2.3 (95%CI 1.6, 3.3)), fever (OR = 1.9 (95%CI 1.4, 2.6)), congestion (OR = 1.9 (95%CI 1.5, 2.4)), and cough (OR = 1.3 (95%CI 1.1, 1.6)) as key symptoms associated with a PCR+ episode, whilst runny nose (OR = 0.7 (95%CI 0.5, 0.9)) and chills (OR = 0.6 (95%CI 0.4, 0.8)) are associated with testing PCR−. This model has a discrimination power of approximately 0.86 in terms of AUC but does not account for population weights.
Table 5.
Optimal model for PCR+ based on symptoms and population characteristics on a two-level weighted logistic regression analysis
| Variable | OR | P-value | 95%CI low | 95%CI high |
|---|---|---|---|---|
| Loss of taste and smell | 5.181 | 0.000 | 3.400 | 7.894 |
| Loss of appetite | 2.323 | 0.000 | 1.643 | 3.283 |
| Fever | 1.880 | 0.000 | 1.385 | 2.552 |
| Congestion | 1.875 | 0.000 | 1.464 | 2.402 |
| Cough | 1.338 | 0.004 | 1.098 | 1.631 |
| Runny nose | 0.662 | 0.004 | 0.500 | 0.877 |
| Chills | 0.578 | 0.000 | 0.443 | 0.753 |
| Age | 0.988 | 0.024 | 0.977 | 0.998 |
| BAME vs. white | 2.434 | 0.001 | 1.406 | 4.214 |
The adjusted effects of three days of specific reports are shown.
Supplementary Material presents combinations of symptoms predicting the probabilities of COVID-19 using the optimal model. For example, a white participant of 50 years of age would have over 90% probability of testing PCR+ if s/he reported 3 days of loss of taste and smell, 3 days of loss of appetite, 3 days of fever, and 3 days of cough with 1 day of congestion, runny nose, and chills.
The discriminatory power of specific symptoms
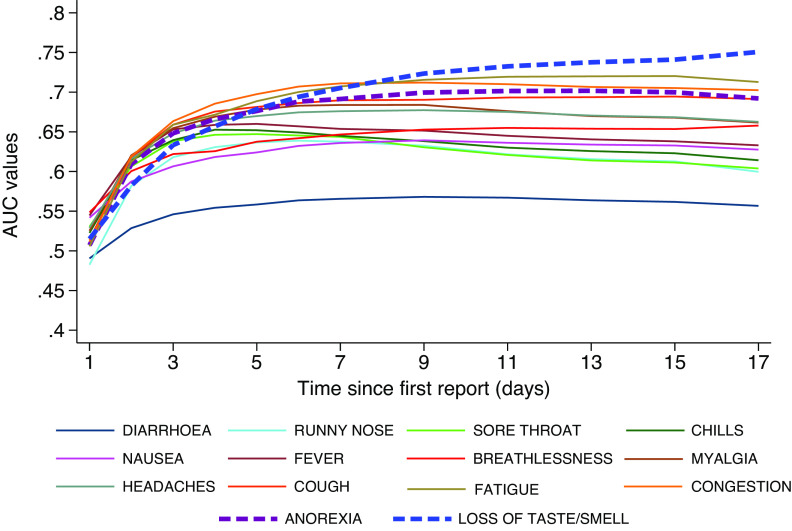
Figure 9 shows how the discriminatory power of individual symptoms evolves if only the first number of days after onset is considered – that is only day 1, only days 1–2, only days 1–3, and so on. Symptoms that peak later such as anosmia/ageusia gain discrimination power as the number of days of reporting increases. For other less specific symptoms, the individual discrimination power remains constant or even declines, for example, sore throat peaks very early and then tapers off.
Figure 9.
Discrimination power of individual symptoms based on the temporally ordered reports restricted to the first 1, 2, 3 to longer than 15 days after the symptomatic illness episode starts.
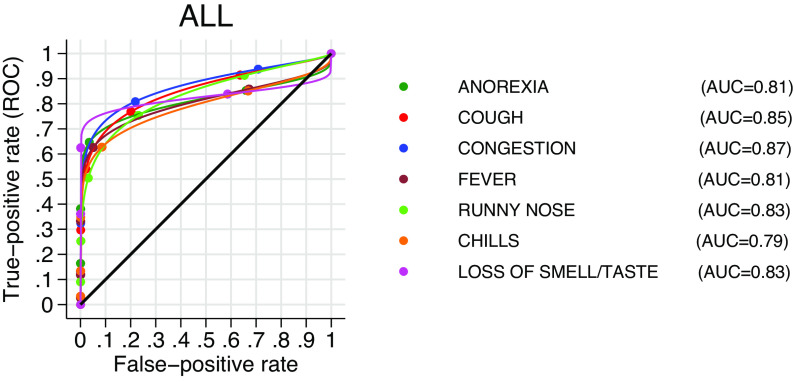
The area under the curve in Figure 10 shows the discrimination power of each symptom in the model using the maximum likelihood ROC 2-stage regression analysis (uncontrolled for age and ethnicity and population-weighted). The higher the AUC, the better the symptom discriminates between PCR+ and PCR−, the steep incline of the curve followed by the flattening line suggests that discrimination is little affected as the number of false positives increases.
Figure 10.
Estimated discrimination power of each classifier. The plot and the AUC estimate follow a maximum likelihood ROC-weighted regression analysis uncontrolled for age and ethnicity.
When controlled for age and ethnicity, the two-stage ROC model does not quantify their effects on the ROC curve of specific symptoms in a directly interpretable manner, but qualitative conclusions are displayed in Table 6 and visualized in Figure 11. Age and ethnicity affect the ROC curve for each symptom, notably, the discriminatory power of anosmia/ageusia decreased with increasing age and is smaller ethnic minorities, compared to white ethnicity.
Table 6.
Effect of age and ethnicity on the ROC curve and subsequently on discrimination power associated with each classifier in the model.
| Symptoms | Coefficient | P-value | 95%CI low | 95%CI high | |
|---|---|---|---|---|---|
| Loss of taste/smell | BAME vs. white | −0.436 | 0.041 | −0.853 | −0.019 |
| Age | −0.012 | 0.011 | −0.021 | −0.003 | |
| Anorexia | BAME vs. white | −0.312 | 0.116 | −0.701 | 0.077 |
| Age | 0.009 | 0.053 | 0.000 | 0.018 | |
| Fever | BAME vs. white | −0.390 | 0.040 | −0.761 | −0.018 |
| Age | 0.007 | 0.109 | −0.002 | 0.016 | |
| Congestion | BAME vs. white | −0.556 | 0.016 | −1.007 | −0.105 |
| Age | −0.003 | 0.583 | −0.012 | 0.007 | |
| Cough | BAME vs. white | −0.521 | 0.028 | −0.986 | −0.055 |
| Age | 0.004 | 0.408 | −0.005 | 0.014 | |
| Runny nose | BAME vs. white | −0.467 | 0.034 | −0.897 | −0.036 |
| Age | 0.000 | 0.998 | −0.009 | 0.009 | |
| Chills | BAME vs. white | −0.191 | 0.316 | −0.564 | 0.182 |
| Age | 0.010 | 0.023 | 0.001 | 0.019 |
The coefficients are only qualitatively interpreted.
Figure 11.
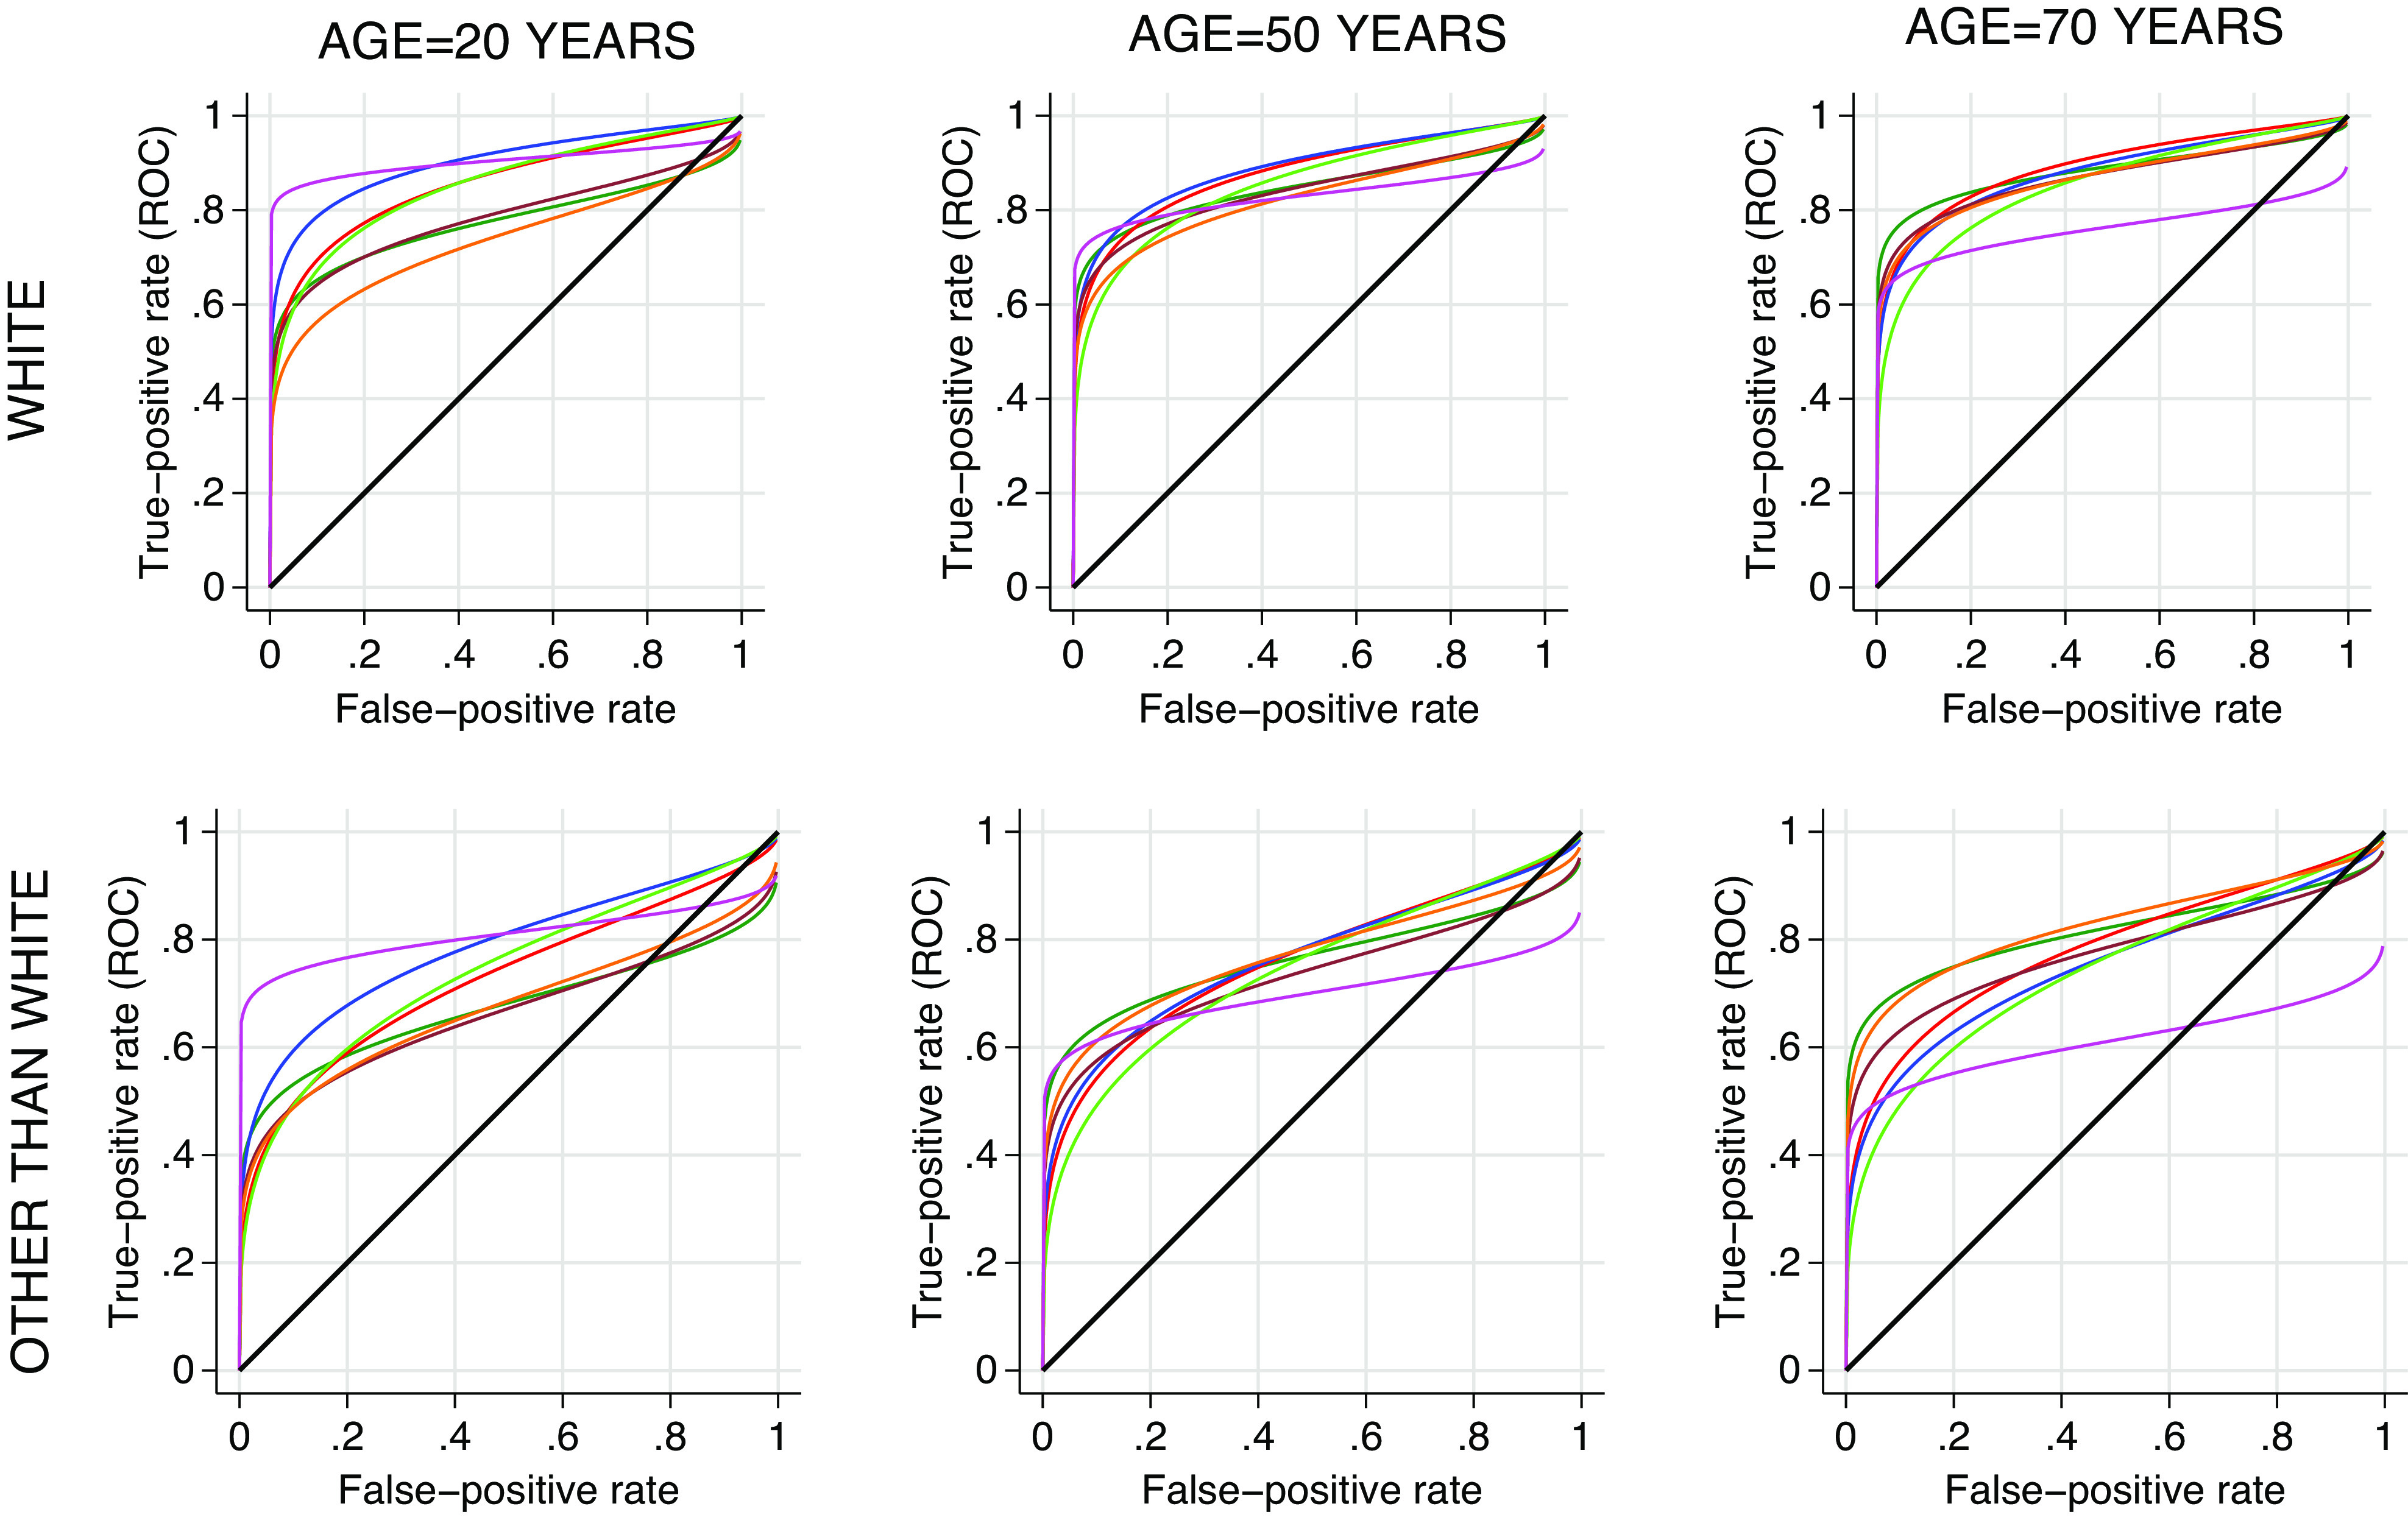
Effect of age and ethnicity on the ROC curve and subsequently on discrimination power associated with each classifier in the model. The colours indicating specific symptom are similar to those displayed in Figure 10.
Discussion
The main objectives of this study were to develop a symptom-based diagnostic model for a PCR− proven SARS-CoV-2 infection, and investigate the dynamics of the symptoms and their discrimination power for a potential COVID-19 diagnostic model. Our prospective, longitudinal, real-time collection, together with analytical techniques (post-stratification weights [20–22]), which produce generalizable results for the UK adult community population, provides a better understanding of the dynamics of COVID-19 symptomology. The rather poor engagement of people other than white in COVID-19 clinical trials has been documented [25] but our method overcame this difficulty.
We found a 4-month prevalence of COVID-19 of 2.1%, in line with the estimated population prevalence at that time [26]. Of the individual symptoms, anosmia and/or ageusia were the least reported symptoms overall (3.6%); however, participants reporting them for 3 days were more likely to test positive for COVID-19 (OR = 14.4 (95%CI 9.2, 22.6)). Figure 3 presents the probabilities of testing positive conditioned on symptom reports. Also, of those testing positive for SARS-CoV-2, over half (53.3%) reported the presence of anosmia or ageusia (Figure 2). Other symptoms such as loss of appetite, a new fever, congestion, and cough were strongly associated with a positive result. Fever, cough, and anosmia/ageusia have been identified as the strongest candidates for predicting COVID-19 in studies such as a REACT-1 and also in a meta-analysis of 9 studies examining symptoms of COVID-19 and long COVID syndrome [13, 17]. The odds of having COVID-19 have been reported as positively associated with 3 days reported with shortness of breath (OR = 3.1, (95%CI(2.9, 3.3)), although our results do not support it as a ‘leading’ symptom [13]. On its own runny nose was the most reported symptom (16.9%) in our study, and frequently reported in those with confirmed COVID-19 (72.6%). The participants reporting it were the least likely (8%) to test positive for COVID-19 (Figure 3), when accounting for the entire episode, and the symptom turned out to have high discriminatory power (AUC = 0.83, Figure 9) in ruling out the disease, consistent with other findings [11, 17].
Unlike many other studies [6–8, 10, 16], this research examined the number of days that specific symptoms are reported within an infection episode. We found that PCR+ participants reported a significantly longer duration of specific symptoms per episode, compared with those that were PCR−; cough had the longest duration followed by tiredness whilst runny nose had the longest duration among PCR− participants. We also found that cough, anosmia/ageusia, and loss of appetite peaked later in SARS-CoV-2 infection, typically around day 12 (Figure 5). Research in Czechoslovakia demonstrated anosmia and ageusia had a later onset than other symptoms, beginning a median of two or more days after the onset of symptoms, and lasting longer than fever or loss of appetite [27]. These findings are consistent with Wojtusiak et al. who found that headaches, chills, and cough were more relevant if they occurred at onset, whilst loss of taste and smell and loss of appetite had a higher relevance if they occurred later in the infection [12].
Previous research has suggested that individual symptoms are not predictive of COVID-19 on their own. Our analysis has suggested that individual symptoms would not have had sufficient predictive power for COVID-19 early in their occurrence but that this would increase with the number of days in which they manifest (Figure 9). Hence, our final predictive model is based on specific symptomatic episodes, that is, their entire number of symptomatic days within an episode and adjusted for age and ethnicity. The model retained episodes of anosmia/ageusia, loss of appetite, fever, congestion, and cough as all positively associated with testing PCR+, together with runny nose, chills, and age as all negatively associated with testing PCR+ (Table 5) consistent with other findings [28]. The concept of 3 days as a meaningful magnitude for the length of reports was inspired by Figure 4, in which all symptoms had a mean of less than 3 days in PCR− participants. In light of this, this information may be particularly useful at the time of clinical triage, namely the number of days symptoms have been experienced by subjects presenting for hospital care. The model, based on two-level logistic regression, has a discriminating power of ~86%.
Our ROC analysis showed that the discrimination power of anosmia/ageusia increased from irrelevance during the first few days to exceeding all others after day 9 (Figure 9). Our report also showed that the discriminatory power of anosmia/ageusia decreases with age, which may reflect a biological phenomenon associated with ageing [29]. Cough alone remained relatively constant in its discrimination power, however, PCR− participants also reported prolonged cough. Our data do not support diarrhoea as a candidate symptom of COVID-19.
Two-stage ROC analysis suggests that the prediction power may be less discriminatory in older participants and in those from ethnic minorities, this was true for all symptoms. Comparatively, the Canas et al. model showed better discrimination in participants of normal weight compared to those who were underweight and/or overweight, and in non-healthcare workers and, consistent with our results, found that younger people were more likely to test PCR+, possibly due to increased social mixing [15]. Our diagnostic model is similar to this model as it identified persistent cough and loss of smell, alongside abdominal pain and myalgia as early features of COVID-19 [15]. However, the Canas model had a younger population than our study (mean age 46.7 years vs. 53.1 years) and COVID-19 was self-reported, thereby the results are difficult to compare [15]. Moreover, the study reported ‘blisters on the feet’ and ‘eye soreness’ as relevant features of COVID-19, the significance of which the paper questions itself [15].
Our estimated prevalences of specific symptoms among both positive and negative groups are higher than those presented in the meta-analysis by Bowyer et al. [13]. Although the study participants stem from nine longitudinal cohorts, the data collection is essentially retrospective and cross-sectional. The authors stated a great deal of heterogeneity. Notably, the data have been collected during the summer whilst ours were collected during the winter, including Christmas, when transmission intensified, hence we postulate that variation could be attributable to the season. Our prevalence of specific symptoms among PCR+ and PCR− are closest to those from Generation Scotland cohort (access via Bowyer et al. or from the University of Edinburgh) [13, 30] consistent with our explanation above, given somewhat cooler temperatures in Scotland during the summer. We have retrieved some partial information and appended a relevant comparative table in the Supplementary material.
Though multiple centres participated in the clinical trial, the three-level regression techniques did not reveal important differences in the estimates or their standard errors. Variability between the centres was not expected to be significant as the same trial protocol and procedures were used. We have disregarded the effect of the intervention (placebo or vaccine), as preliminary analysis did not show a significant impact on results (data not shown).
Limitations
Despite the data being gathered prospectively and in real-time, we observed gaps in daily records, for example, a participant may report fever for 3 consecutive days, then none on the fourth day and then again on the fifth and sixth days. The statistical analysis considered the number of reports (i.e. the number of days with specific symptoms) rather than the whole length of time they were experienced. This may have led to underestimating their effect; however, we are confident that recall bias has been minimalized to a greater extent than if the data had been collected from a retrospectively collected self-report. Asymptomatic infections are likely to be underrepresented in this analysis. As this research set out to explore symptoms of COVID-19, we do not believe this to be a major limitation to our analysis, but it does mean we cannot calculate the true prevalence of COVID-19 infections in the study population. Unfortunately, we also did not benefit from information such as recent contacts or travel/work patterns, which could have been useful in building a reliable diagnostic model as suggested by the Cochrane Review article [10]. At the time of data collection, the circulating strain of SARS-CoV-2 was the alpha variant [31], however, omicron has a higher tropism for nasoepithelial cells than pulmonary cells [32] and anosmia has been reported less frequently with the omicron variant [33]. Therefore, care should be taken if applying the model outside our study population.
Conclusion
This research adds to the body of literature on COVID-19 symptoms as an in-depth exploration of symptoms reported by those unaware of their diagnosis at the time of reporting, thereby minimizing reporting bias. We found younger participants, and those from ethnic minorities were more likely to test positive for COVID-19 and, consistent with previous research, anosmia and/or ageusia most strongly predict a positive PCR result; however, we have also shown that these symptoms peak late in infection. This calls into question their consideration as early markers of the disease. Similar to other research we found that a cluster of fever, congestion, and cough are all positively associated with COVID-19, with PCR+ participants reporting more days of symptoms, for example, cough, than those who were PCR−. We also found that diarrhoea, runny nose, and chills are not indicative of COVID-19. Overall, our model has a discriminating power of 86% to predict COVID-19; although, as anosmia and ageusia often develop later in the infection, our proposed model is unlikely to identify early infections, particularly, in the elderly or those from ethnic minorities.
Supporting information
Bird et al. supplementary material
Acknowledgements
2019nCoV-302 Study Group Members:
The NVX-CoV2373-2019nCoV-302 clinical trial was a collective group effort across multiple institutions and locations. Below is a list of sites and staff that significantly contributed to the implementation and conduct of the NVX-CoV2373-2019nCoV-302 clinical trial.
| Site | Investigators |
|---|---|
| Aberdeen Royal Infirmary, NHS Grampian | Roy L. Soiza, Robin Brittain-Long, Chiara Scicluna, Carole Edwards, Lynn Mackay, Mariella D’Allesandro, Amy Nicol, Karen Norris, Sandra Mann, Heather Lawrence, Ruth Valentine |
| Accelerated Enrollment Solutions | Marianne Elizabeth Viljoen, Carol H. Pretswell, Helen Nicholls, Imrozia Munsoor, Agnieszka Meyrick, Christina Kyriakidou, Shalini Iyengar, Arham Jamal, Nick Richards, Helen Price, Bridie Rowbotham, Danielle Bird, Karen Smith, Olga Littler, Kirsty Fielding, Anna Townsend-Rose, Karen Miller, Jessica Davis, Alison Elliot-Garwood, Lauren Trottier, Paul Edwards |
| Belfast Health and Trust | Margaret McFarland |
| Betsi Cadwaladr University Health Board | Thomas Eadsforth, Jonathan Heseltine, Nick Heseltine, Rebecca Andrews, Lynne Grundy, Laura Longshaw, Julia Parton |
| Blandford Group Practice | Katharine Lucy Broad |
| Bradford Teaching Hospitals NHS Foundation Trust | Karen Regan, Kim Storton, Declan Ryan-Wakeling, Brad Wilson, Malathy Munisamy, John Wright, Anil Shenoy, Beverley English, Lucy Brear |
| Centre for Clinical Vaccinology and Tropical Medicine, University of Oxford | Paola Cicconi |
| Chelsea and Westminster Hospital | Marta Boffito, Ana Milinkovic, Ruth Byrne, Roya Movahedi, Rosalie Housman, Julie Logan, Alfredo Soler-Carracedo, Veronica Canuto, Serge Fedele, Candida Fernandez, Liam Sutcliffe |
| County Durham & Darlington NHS Foundation Trust | Naveed Kara, Ellen Brown, Andrea Kay |
| Department of Psychiatry, University of Oxford, NIHR Oxford Health Cognitive Health Clinical Research Facility and NIHR Oxford Health Biomedical Research Centre | Andrea Cipriani, Mary-Jane Attenburrow, Katharine A. Smith |
| Division of Epidemiology and Public Health, University of Nottingham | Jonathan Packham |
| Dorset Research Hub, Royal Bournemouth Hospital, University Hospitals Dorset NHS Foundation Trust | Geoff Sparrow |
| East Suffolk and North Essex NHS Foundation Trust | Richard Smith, Josephine M Rosier, Khalid Saja, Nyasha Nago, Brian Camilleri, Anita Immanuel, Mike Hamblin, Rawlings Osagie, Mahalakshmi Mohan |
| Epsom and St Helier University Hospitals NHS Trust | Hilary Floyd, Suzanne Goddard, Sanjay Mutgi, John Evans, Sean McKeon, Neringa Vilimiene, Rosavic Chicano, Rachel Hayre, Alice Pandaan |
| Faculty of Health and Life Sciences, Oxford Brookes University | Catherine Henshall |
| Guy’s and St Thomas’ NHS Foundation Trust NIHR BRC | Anna Goodman, Cherry Paice, Naimh Spence, Alice Packham, Movin Abeywickrama, Teona Serafimova, Suhail Aslam, Tanveer Bawa, Sonia Serrano, Moncy Mathew, Karen Bisnauthsing, Samantha Broadhead, Grainne Cullen, Jo Salkeld, Henry Fok, Thurkka Rajeswaran, Andrea Mazzella |
| Health and Care Research Wales | Nicola Williams, Jayne Goodwin |
| Highcliffe Medical Centre | Zelda Cheng |
| Keele University | Toby Helliwell, Adrian Chudyk |
| Kings College London | Rafaela Giemza, John Lord Villajin, Noah Yogo, Esther Makanju, Pearl Dulawan, Deepak Nagra, April Buazon, Alice Russell, Georgie Bird |
| Lakeside Healthcare Research, Lakeside Surgery | Amardeep Heer, Rex Sarmiento, Balraj Sanghera, Melanie Mullin, Adam Champion, Aisling Bevan, Kinzah Iqbal, Alshia Johnson |
| Layton Medical Centre | Rebecca Clark, Sarah Shaw, Steven Shaw, Amanda Chalk, Martin Lovatt, Caroline Lillicrap, Angela Parker, Jan Hansel, Zhi Wong, Galvin Gan, Eyad Tuma |
| Leeds Teaching Hospitals NHS Trust | Jane Minton, Jennifer Murira, Razan Saman, Alistair Hall, Kyra Holliday, Zara Khan, James Calderwood, George Twigg, Helena Baker, Julie Corrigan, Katy Houseman |
| Midlands Partnership NHS Foundation Trust | Subhra Raguvanshi, Dominic Heining, Jake Weddell, Liz Glaves, Kim Thompson, Francis Davies, Ruth Lambley Burke |
| MRC–University of Glasgow Centre for Virus Research, and Queen Elizabeth University Hospital, NHS Greater Glasgow & Clyde, Glasgow, Scotland | Emma C. Thomson |
| National Institute for Health Research Patient Recruitment Centre and Bradford Teaching Hospitals NHS Foundation Trust, Bradford | Dinesh Saralaya |
| Newcastle University | Adam Farrier |
| NIHR Clinical Research Facility, University Hospital Southampton NHS Foundation Trust | Lisa Berry |
| NIHR Clinical Research Network, Thames Valley and South Midlands, Oxford University Hospitals NHS Foundation Trust | Nancy Hopewell, Leigh Gerdes |
| NIHR Southampton Clinical Research Facility and NIHR Wessex Local Clinical Research Network, University Hospital Southampton NHS Foundation Trust | Mihaela Pacurar, Saul N. Faust |
| Norfolk and Norwich University Hospital NHS Foundation Trust | Jeremy Turner, Christopher Jeanes, Adele Cooper, Jocelyn Keshet-Price, Lou Coke, Melissa Cambell-Kelly, Ketan Dhatariya, Claire Williams, Georgina Marks, James Sudbury, Lisa Rodolico |
| Northern Ireland Clinical Research Facility, Queen’s University Belfast and Belfast Health and Social Care Trust | Sharon Carr, Roisin Martin, Angelina Madden |
| Northern Ireland Clinical Research Network | Maurice O’Kane, Paul Biagioni, Sonia McKenna, Alison Clinton |
| North Tees and Hartlepool NHS Foundation Trust | Justin Carter, Matthew Dewhurst, Bill Wetherill, Rachel Taylor |
| Oxford Health NHS Foundation Trust, Warneford Hospital | Thandiwe Hoggarth, Katrina Lennon Collins, Marie Chowdhury, Adil Nathoo, Anna Heinen, Jayne E. Starrett, Orla MacDonald, Tokoza Muimo, Claudia Hurducas, Liliana Cifuentes, Sarah McCartney |
| Quadram Institute | Jane Ewing |
| Queen Elizabeth University Hospital, NHS Greater Glasgow and Clyde | Guy Mollett, Rachel Blacow, John Haughney, Jonathan MacDonald, John Paul Seenan, Stewart Webb, Colin O’Leary, Scott Muir, Beth White, Neil Ritchie |
| Queen’s University Belfast and Belfast Health and Social Care Trust | Judy Bradley, Daniel F. McAuley, Jonathan Stewart |
| Research and Development, NHS Grampian | Chiara Scicluna, Mariella D’Alessandro, Carole Edwards, Lynn MacKay, Amy Nicol, Karen Norris, Heather Lawrence, Sandra Mann, Ruth Valentine |
| Royal Bournemouth Hospital, University Hospitals Dorset NHS Foundation Trust | Nicki Lakeman, Laura Purandare |
| Royal Cornwall Hospital NHS Trust | Duncan Browne, David Tucker, Peter Luck, Angharad Everden, Lisa Trembath, Michael Visick, Nick Morley, Laura Reid, Helen Chenoweth, Kirsty Maclean |
| Royal Devon University Healthcare | Ray P. Sheridan, Tom Burden, Craig Francis Lunt, Shirley Todd, Stephanie Estcourt, Jasmine Marie Pearce, Suzanne Wilkins, Cathryn Love-Rouse |
| Royal Free London NHS Foundation Trust | Eva Torok-Pollok, Mike Youle, Sara Madge, Natalie Hills, Nikesh Devani, Aarti Nandani, Janet North, Nargis Hemat, Suluma Mohamed |
| Royal Oldham Hospital, Northern Care Alliance, Greater Manchester | Rachel Newport |
| Salford Royal Hospital, Northern Care Alliance, Greater Manchester | Philip A. Kalra, Chukwuma Chukwu, Olivia Wickens, Vikki O’Loughlin, Hema Mistry, Louise Harrison, Robert Oliver, Anne-Marie Peers, Jess Zadik, Katie Doyle |
| South Tees Hospitals NHS Foundation Trust | David R. Chadwick, Kerry Colling, Caroline Wroe, Marie Branch, Alison Chilvers, Sarah Essex, Vicky Hanlon, Helen Dunn, Steven Liggett, Jane Greenaway, Tarn Nozedar |
| Stafford Town Primary Care Network | Mark Stone |
| Vaccine Institute, St George’s University of London & St George’s University Hospitals NHS Foundation Trust | Alberto San Francisco Ramos, Emily Beales, Olivia Bird, Zsofia Danos, Hazel Fofie, Cecilia Hultin, Sabina Ikram, Fran Mabesa, Aoife Mescall, Josyanne Pereira, Jennifer Pearce, Natalina Sutton |
| St Helens and Knowsley Teaching Hospitals NHS Trust | Emma Snashall |
| Stockport NHS Foundation Trust, Stepping Hill Hospital | David Neil Baxter, Sara Bennett, Debbie Suggitt, Kerry Hughes, Wiesia Woodyatt, Lynsey Beacon, Alissa Kent, Chris Cooper, Milan Rudic, Simon Tunstall, Matthew Jackson |
| Swanage Medical Practice | Claire Hombersley |
| The Adam Practice | Patrick Moore, Rebecca Cutts |
| University College London | Danielle Solomon, Janet M. North |
| University Hospitals of Morecambe Bay NHS Foundation Trust | Andrew Higham, Marwan Bukhari, Mohamed Elnaggar, Michelle Glover, Fiona Richardson, Alexandra Dent, Shahzeb Mirza, Rajiv Ark, Jennie Han |
| University of Exeter Medical School, William Wright House, Royal Devon and Exeter Hospital | Suzy V. Hope, Philip J. Mitchelmore |
| University of Liverpool | Rostam Osanlou, Thomas Heseltine |
Supplementary material
For supplementary material accompanying this paper visit http://doi.org/10.1017/S0950268824000037.
click here to view supplementary material
Data availability statement
The data are available upon request and subject to Novavax’s permission. Please contact Professor Paul T. Heath, pheath@sgul.ac.uk.
Author contribution
Writing – review & editing: A.S.F.R., I.C.S., A.H., C.M., C.K., A.H., A.M.M., A.L.G., C.H.P., C.C., C.J., D.N.B., D.R.C., D.S., D.B., E.P.G., E.T., F.B., F.M., H.N., I.M., J.G., J.T., J.P., J.M.B., M.E.V., M.B., O.O., P.M., P.A.S., P.T.H., P.A.K., R.P.S., R.C., R.S., R.L.S., S.I., O.B.; Conceptualization: I.C.S., P.T.H., O.B.; Formal analysis: I.C.S., P.T.H., O.B.; Methodology: I.C.S., P.T.H., O.B.; Supervision: I.C.S., P.T.H.; Validation: I.C.S.; Writing – original draft: I.C.S., P.T.H., O.B.; Investigation: P.T.H.
Funding statement
This study received no specific funding.
Competing interest
C.A.C. reports receiving grant support, paid to her institution, from Novavax, Moderna, GSK. A.L.G. reports receiving grant support, paid to her institution, from Novavax and entered into a partnership with AstraZeneca for further development of ChAdOx1 nCoV-19. A.L.G. is named as an inventor on a patent covering the use of a particular promoter construct that is often used in vectored vaccines and is incorporated in the ChAdOx1 nCoV-19 vaccine and may benefit from royalty income paid to the University of Oxford from sales of this vaccine by AstraZeneca and its sublicensees under the university’s revenue sharing policy. P.T.H. reports receiving grant support, paid to his institution, from Novavax, Pfizer, Moderna, Valneva, Janssen, Astra Zeneca. I.C.S. declares receiving grant support, paid to her institution, from NIHR and Astra Zeneca. Other authors reported no competing interest.
Disclaimer
The findings and conclusions presented here are the authors and do not necessarily represent the views of Novavax themselves, although the affiliated authors were given the opportunity to review the submission and provide feedback.
References
- [1].World Health Organisation (2023) WHO Coronavirus (COVID-19) Dashboard, WHO Coronavirus (COVID-19) Dashboard With Vaccination Data. Available at https://covid19.who.int/ (accessed 7 March 2023).
- [2].Emanuel EJ, et al. (2020) Fair allocation of scarce medical resources in the time of COVID-19. The New England Journal of Medicine 382, 2049–2055. [DOI] [PubMed] [Google Scholar]
- [3].Rossman H, et al. (2020) A framework for identifying regional outbreak and spread of COVID-19 from one-minute population-wide surveys. Nature Medicine 26(5), 634–638. [DOI] [PMC free article] [PubMed] [Google Scholar]
- [4].National Health Service (2022) Main Symptoms of Coronavirus (COVID-19) – NHS. Available at https://www.nhs.uk/conditions/coronavirus-covid-19/symptoms/main-symptoms/ (accessed 30 March 2022).
- [5].Johnson-León M, et al. (2021) Executive summary: It’s wrong not to test: The case for universal, frequent rapid COVID-19 testing. eClinicalMedicine 33, 100759. [DOI] [PMC free article] [PubMed] [Google Scholar]
- [6].Lara BA, et al. (2021) Clinical prediction tool to assess the likelihood of a positive SARS-Cov-2 (COVID-19) polymerase chain reaction test in patients with flu-like symptoms. Western Journal of Emergency Medicine 22(3), 592–598. [DOI] [PMC free article] [PubMed] [Google Scholar]
- [7].Duque MP, et al. (2021) COVID-19 symptoms: A case-control study, Portugal, March–April 2020. Epidemiology & Infection 149, e54. [DOI] [PMC free article] [PubMed] [Google Scholar]
- [8].French N, et al. (2021) Creating symptom-based criteria for diagnostic testing: A case study based on a multivariate analysis of data collected during the first wave of the COVID-19 pandemic in New Zealand. BioMed Central Infectious Diseases 21(1), 1119. [DOI] [PMC free article] [PubMed] [Google Scholar]
- [9].Struyf T, et al. (2021) Signs and symptoms to determine if a patient presenting in primary care or hospital outpatient settings has COVID-19. Cochrane Database of Systematic Reviews 2(2), CD013665. [DOI] [PMC free article] [PubMed] [Google Scholar]
- [10].Struyf T, et al. (2022) Signs and symptoms to determine if a patient presenting in primary care or hospital outpatient settings has COVID‐19. Cochrane Database of Systematic Reviews 5(5), CD013665. [DOI] [PMC free article] [PubMed] [Google Scholar]
- [11].Wojtusiak J, et al. (2023) The role of symptom clusters in triage of COVID-19 patients. Quality Management in Health Care 32(suppl. 1), S21–S28. [DOI] [PMC free article] [PubMed] [Google Scholar]
- [12].Wojtusiak J, et al. (2023) Order of occurrence of COVID-19 symptoms. Quality Management in Health Care 32(suppl. 1), S29–S34. [DOI] [PMC free article] [PubMed] [Google Scholar]
- [13].Bowyer RCE, et al. (2023) Characterising patterns of COVID-19 and long COVID symptoms: Evidence from nine UK longitudinal studies. European Journal of Epidemiology 38(2), 199–210. [DOI] [PMC free article] [PubMed] [Google Scholar]
- [14].Drew DA, et al. (2020) Rapid implementation of mobile technology for real-time epidemiology of COVID-19. Science 368(6497), 1362–1367. [DOI] [PMC free article] [PubMed] [Google Scholar]
- [15].Canas LS, et al. (2021) Early detection of COVID-19 in the UK using self-reported symptoms: A large-scale, prospective, epidemiological surveillance study. The Lancet Digital Health 3(9), e587–e598. [DOI] [PMC free article] [PubMed] [Google Scholar]
- [16].Menni C, et al. (2020) Real-time tracking of self-reported symptoms to predict potential COVID-19. Nature Medicine 26(7), 1037–1040. [DOI] [PMC free article] [PubMed] [Google Scholar]
- [17].Elliott J, et al. (2021) Predictive symptoms for COVID-19 in the community: REACT-1 study of over 1 million people. Public Library of Science Medicine 18(9), e1003777. [DOI] [PMC free article] [PubMed] [Google Scholar]
- [18].Lauer SA, et al. (2020) The incubation period of coronavirus disease 2019 (COVID-19) from publicly reported confirmed cases: Estimation and application. Annals of Internal Medicine 172(9), 577–582. [DOI] [PMC free article] [PubMed] [Google Scholar]
- [19].Heath PT, et al. (2021) Safety and efficacy of NVX-CoV2373 COVID-19 vaccine. New England Journal of Medicine 385(13), 1172–1183. [DOI] [PMC free article] [PubMed] [Google Scholar]
- [20].Office for National Statistics (2023) Population Estimates for the UK, England and Wales, Scotland and Northern Ireland. Office for National Statistics. Available at https://www.ons.gov.uk/peoplepopulationandcommunity/populationandmigration/populationestimates/bulletins/annualmidyearpopulationestimates/mid2020#age-structure-of-the-uk-population (accessed 27 January 2023).
- [21].Office for National Statistics (2023) Population Estimates by Ethnic Group, England and Wales. Office for National Statistics. Available at https://www.ons.gov.uk/peoplepopulationandcommunity/culturalidentity/ethnicity/datasets/populationestimatesbyethnicgroupenglandandwales (accessed 27 January 2023).
- [22].Office for National Statistics (2023) Estimates of the Population for the UK, England, Wales, Scotland and Northern Ireland. Office for National Statistics. Available at https://www.ons.gov.uk/peoplepopulationandcommunity/populationandmigration/populationestimates/datasets/populationestimatesforukenglandandwalesscotlandandnorthernireland (accessed 27 January 2023).
- [23].Little RJA (1993) Post-stratification: A modeler’s perspective. Journal of the American Statistics Association 88(423), 1001–1012. [Google Scholar]
- [24].Alonzo TA, et al. (2002) Distribution-free ROC analysis using binary regression techniques. Biostatistics 3(3), 421–432. [DOI] [PubMed] [Google Scholar]
- [25].Murali M, et al. (2023) Ethnic minority representation in UK COVID-19 trials: Systematic review and meta-analysis. BioMed Central Medicine 21, 111. [DOI] [PMC free article] [PubMed] [Google Scholar]
- [26].Office for National Statistics (2023) Coronavirus (COVID-19) Infection Survey, UK – Office for National Statistics. Available at https://www.ons.gov.uk/peoplepopulationandcommunity/healthandsocialcare/conditionsanddiseases/bulletins/coronaviruscovid19infectionsurveypilot/19february2021 (accessed 15 January 2023).
- [27].Weinbergerova BE, et al. (2021) COVID-19’s natural course among ambulatory monitored outpatients. Scientific Reports 11(1), 10124. [DOI] [PMC free article] [PubMed] [Google Scholar]
- [28].Rodriguez-Palacios A, et al. (2020) Modeling the onset of symptoms of COVID-19. Frontiers in Public Health 8, 473. [DOI] [PMC free article] [PubMed] [Google Scholar]
- [29].Boyce JM, et al. (2006) Effects of ageing on smell and taste. Postgraduate Medical Journal 82(966), 239–241. [DOI] [PMC free article] [PubMed] [Google Scholar]
- [30].Generation Scotland (2023) Access Our Resources. University of Edinburgh. Available at https://www.ed.ac.uk/generation-scotland/for-researchers/access (accessed 28 October 2023).
- [31].Public Health England (2023) SARS-CoV-2 Variants of Concern and Variants under Investigation in England. Available at https://assets.publishing.service.gov.uk/government/uploads/system/uploads/attachment_data/file/975742/Variants_of_Concern_VOC_Technical_Briefing_8_England.pdf (accessed 8 May 2023).
- [32].Willett BJ, et al. (2022) SARS-CoV-2 omicron is an immune escape variant with an altered cell entry pathway. Nature Microbiology 7(8), 1161–1179. [DOI] [PMC free article] [PubMed] [Google Scholar]
- [33].Menni C, et al. (2022) Articles symptom prevalence, duration, and risk of hospital admission in individuals infected with SARS-CoV-2 during periods of omicron and delta variant dominance: A prospective observational study from the ZOE COVID study. The Lancet 399(10335), 1618–1624. [DOI] [PMC free article] [PubMed] [Google Scholar]
Associated Data
This section collects any data citations, data availability statements, or supplementary materials included in this article.
Supplementary Materials
Bird et al. supplementary material
For supplementary material accompanying this paper visit http://doi.org/10.1017/S0950268824000037.
click here to view supplementary material
Data Availability Statement
The data are available upon request and subject to Novavax’s permission. Please contact Professor Paul T. Heath, pheath@sgul.ac.uk.


