Abstract
Increased dietary fructose in rodents recapitulates many aspects of the Metabolic Syndrome with hypertension, insulin resistance and dyslipidemia. Here we show that fructose increased jejunal NaCl and water absorption which was significantly decreased in mice whose apical chloride/base exchanger Slc26a6 (PAT1, CFEX) was knocked out. Increased dietary fructose intake enhanced expression of this transporter as well as the fructose-absorbing transporter Slc2a5 (Glut5) in the small intestine of wild type mice. Fructose feeding decreased salt excretion by the kidney and resulted in hypertension, a response almost abolished in the knockout mice. In parallel studies, a chloride-free diet blocked fructose-induced hypertension in Sprague Dawley rats. Serum uric acid remained unchanged in animals on increased fructose intake with hypertension. We suggest that fructose-induced hypertension is likely caused by increased salt absorption by the intestine and kidney and the transporters Slc26a6 and Slc2a5 are essential in this process.
Keywords: salt absorption, increased fructose intake, small intestine, kidney, metabolic syndrome
Metabolic syndrome, which is manifested by visceral obesity, hypertension, glucose intolerance, insulin resistance, and atherogenic dyslipidemia,1–6 is reaching epidemic proportions worldwide, with over 30 million in the United States alone. Its increased incidence correlates with marked increase in the amount of dietary fructose consumption from high fructose corn syrup, a common sweetener used in the food industry, table sugar, and fruits.1–6 Although the increase in the incidence of obesity has been attributed to increased calorie intake and decreased physical activity, the pathogenesis of hypertension in metabolic syndrome remains less well understood.7–11 In rodents, increased dietary fructose intake for 4–12 weeks recapitulates many aspects of metabolic syndrome.12–17
SLC26A6 (human)/Slc26a6 (mouse), also known as PAT1 (putative anion transporter 1) or CFEX (chloride/formate exchanger), is a major apical chloride/base exchanger in the small intestine and kidney proximal tubule.18–23 PAT1, which can function in Cl−/HCO−3 and Cl−/oxalate exchange modes in vivo,21,24,25 plays an important role in the absorption of salt and secretion of bicarbonate in the small intestine.24–28 The absorption of fructose in the small intestine and kidney proximal tubule is thought to be mediated predominantly by Glut5 (Slc2a5).29,30
Hypertension is a complex, multifactorial disorder and attributing its etiology to a single factor is probably simplistic. One major factor, however, which is essential to the understanding of blood pressure regulation and its disturbance in hypertension, is altered salt homeostasis.31–35 There are no studies on the role of altered salt absorption in the intestine or the kidney as a major contributor to hypertension in metabolic syndrome or, specifically, in fructose-induced hypertension.
RESULTS
Colocalization of PAT1 and Glut5 on the apical membrane in the jejunum
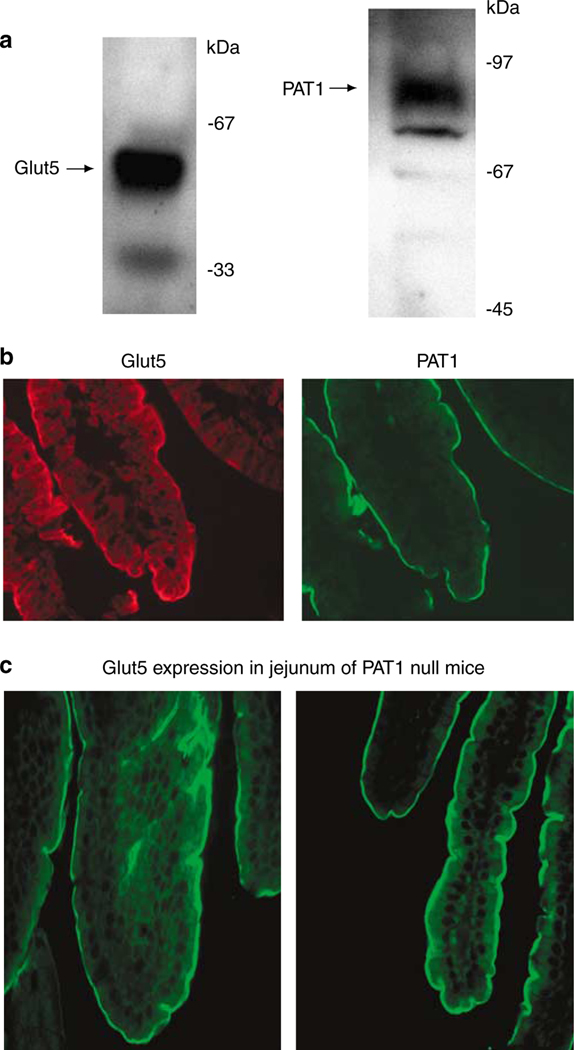
Western blot analysis in apical membrane proteins from jejunum detected Glut5 as a doublet at ~55 kDa, with a strong upper band and a faint lower band in normal (Slc26a6+/+) mice (Figure 1a, left panel). PAT1 was detected as a ~90-kDa band in the same membrane proteins (Figure 1a, right panel). Figure 1b is an immunofluorescence labeling indicating the localization of Glut5 and PAT1 (Slc26a6) on the apical membrane of villi in the jejunum. Glut5 mediates the absorption of fructose whereas Slc26a6 is a chloride-absorbing transporter. Both Glut5 and PAT1 demonstrate identical distribution pattern along the length of jejunal villi. The distribution pattern and labeling intensity of Glut5 in jejuna of Slc26a6−/− mice (Figure 1c) was similar to that in Slc26a6+/+ mice (Figure 1b).
Figure 1 |. Expression of Glut5 and PAT1 in jejuna of Slc26a6+/+ mice.
(a) Immunoblot analysis of Glut5 and PAT1 in jejuna of Slc26a6+/+ mice. The Glut5 appears as a doublet at ~55 kDa, with the upper band showing enhanced intensity and lower band showing decreased intensity in mouse jejunum. (b) Immunofluorescence labeling of Glut5 and Slc26a6+/+ in normal mouse jejunum. Both Glut5 and Slc26a6 label the apical membranes in jejunum villi. (c) Expression of Glut5 in jejunum of Slc26a6+/+ (left) and Slc26a6−/− mice (right).
Fructose stimulates salt absorption in the jejunum predominantly by activating PAT1
Given the colocalization of Glut5 and PAT-1 on the apical membrane of jejunum and the fact that PAT1 plays an important role in salt absorption in this segment,28 we entertained the possibility that fructose may stimulate salt absorption by activating Slc26a6. Accordingly, we examined the effect of fructose on the absorption of salt in the jejunum in Slc26a6+/+ and Slc26a6−/− mice. Toward this end, proximal jejunum was perfused in vivo with isotonic perfusate, and net fluid absorption was examined, before and after the addition of fructose according to Materials and Methods.
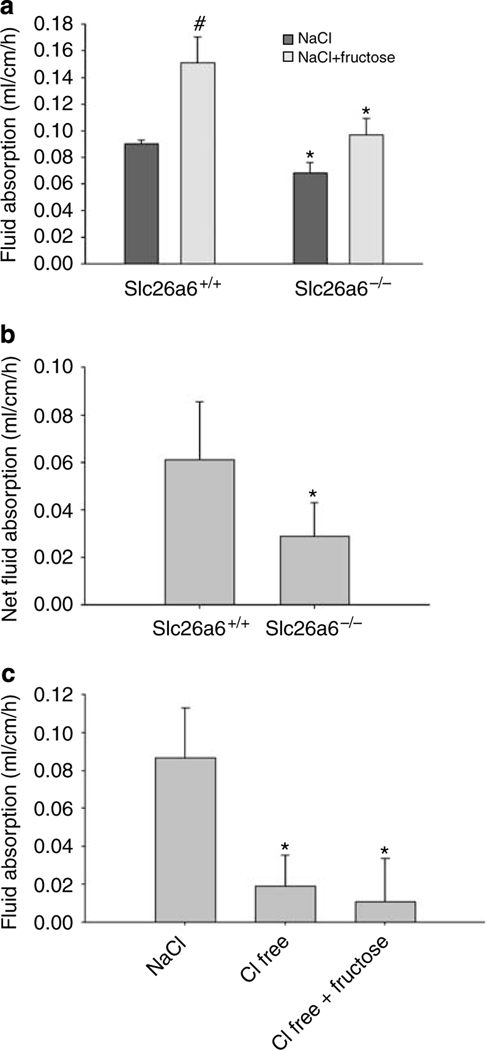
Figure 2a depicts basal and fructose-induced jejunal fluid absorption in Slc26a6+/+ and Slc26a6−/− mice. The basal fluid absorption was reduced by ~25% in Slc26a6−/− mice as compared with Slc26a6+/+ littermates (P<0.05, n = 5 in each group). As shown in Figure 2a, fructose at 40 mM elicited a ~67% increase in fluid absorption in Slc26a6+/+ mice (P<0.01, n = 5), a response which was significantly blunted in Slc26a6−/− mice. When analyzed, the magnitude of fructose-stimulated fluid absorption was ~110% higher in Slc26a6+/+ mice as compared with Slc26a6−/− mice (P<0.05, n = 5) (Figure 2b).
Figure 2 |. Effect of fructose on fluid (salt) absorption in Slc26a6 and Glut5 mutant mice.
(a) Basal and fructose-induced jejunal fluid absorption in Slc26a6+/+ and Slc26a6−/− mice. Basal rates were reduced by ~25% in Slc26a6−/− mice as compared with Slc26a6+/+ littermates. 40 mM fructose elicited ~67% increase in fluid absorption in Slc26a6+/+ mice but only ~39% in Slc26a6−/− mice. #P<0.01 as compared with NaCl control. (b) Fructose-induced jejunal fluid absorption in Slc26a6+/+ and Slc26a6−/− mice. The magnitude of fructose-stimulated fluid absorption was B110% higher in Slc26a6+/+ mice as compared with Slc26a6−/− mice. *P<0.05 compared with wild-type control. Results are mean ± s.e.m. (c) The role of chloride ion in basal and fructose-stimulated fluid absorption. After basal period measurement in the presence of NaCl, jejunum was perfused with iso-osmolar chloride-free (150 mM Na gluconate) solution. Chloride removal inhibited basal fluid absorption by 75%. Replacement of 40 mM gluconate completely blocked the fructose-stimulated fluid absorption in normal mouse jejunum. *P<0.05 compared with NaCl control.
The significant reduction in jejuna of Slc26a6−/− mice indicated that the majority of fructose-stimulated fluid absorption is mediated by Slc26a6, which is the major apical chloride-absorbing transporter in the upper villus of small intestine.21,27 In the next series of experiments, we examined the role of perfusate chloride on fructose-stimulated fluid absorption. As shown in Figure 2c, the removal of chloride from the perfusate inhibited the basal fluid absorption by 75% and completely abrogated the fructose-stimulated fluid absorption in Slc26a6+/+ mice (*P<0.05 compared with NaCl control).
Fructose-induced hypertension is dependent on the presence of PAT1
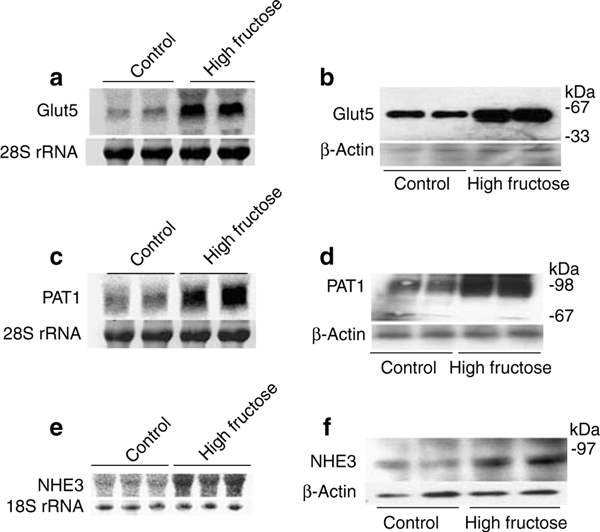
In the next series of experiments, we examined the effect of fructose-stimulated, PAT-1-dependent salt absorption in the small intestine in the generation of fructose-induced hypertension. First, we observed that increased dietary fructose intake (60% fructose) for 2 weeks enhances the expression of Glut5 and PAT1 mRNA (Figure 3a and c), and protein (Figure 3b and d) in mouse jejunum when compared with the control diet (60% starch). The mRNA expression of Glut5 and PAT1 increased by ~500% and ~240%, respectively, in mice on increased fructose intake (P<0.001 compared with mice on control diet, n = 4). The protein abundance of Glut5 and PAT1 increased by 150 and 130% in mice on increased fructose intake (P<0.03 vs mice on control diet, n = 4). The mRNA expression and protein abundance of NHE3 increased by ~80 and ~42%, respectively, in mice on increased fructose intake for 2 weeks (Figure 3e and f, P<0.05 for both parameters, n = 3). The 2-week time point for expression studies was chosen based on the fact that animals did not develop hypertension within this interval of high dietary fructose intake (personal observation).
Figure 3 |. Effect of increased dietary fructose intake on Glut5, PAT1, and NHE3 expression in the intestine in Slc26a6+/+ and Slc26a6−/− mice.
(a–d) Increased dietary fructose intake upregulates the expression of Glut5 and Slc26a6 in jejunum. The expression of Glut5 and Slc26a6 was determined by northern hybridization (a and b) and western blotting (c and d) at 2 weeks. The northern blot membrane was first probed for Glut5 expression, and then stripped and reprobed for Slc26a6. (e and f) The mRNA expression (e) and protein abundance (f) of NHE3 in jejuna of mice on increased fructose intake for 2 weeks.
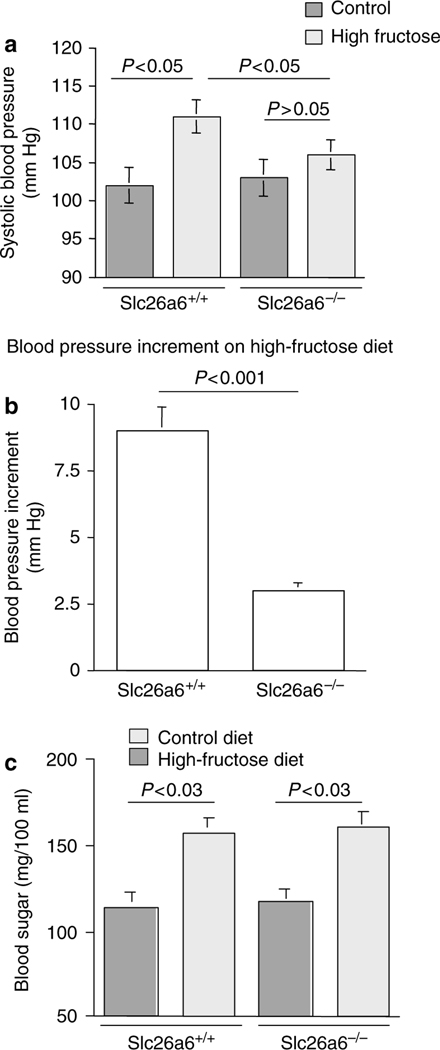
We next ascertained the role of Slc26a6 in the pathogenesis of fructose-induced hypertension by examining Slc26a6+/+ and Slc26a6−/− mice. Toward this end, mice were subjected to increased dietary fructose intake (60% fructose) for 12 weeks and compared with mice on control diet (60% starch). As shown in Figure 4a, Slc26a6+/+ mice on a high-fructose diet developed significant increase in their blood pressure compared with control diet. The systolic blood pressure in Slc26a6+/+ mice increased from 102 ± 2mmHg on a normal diet to 111 ± 2.2mmHg on a high-fructose diet (P<0.02, n = 5). However, Slc26a6−/− mice failed to develop hypertension on a high-fructose diet (Figure 4a). The blood pressure in Slc26a6−/− mice was 103 ± 2.1mmHg on a normal diet and 106 ± 2mmHg on a high-fructose diet (P>0.05, n = 5; Figure 4a). The magnitude of fructose-induced blood pressure elevation was 9 ± 1.3mmHg in Slc26a6+/+ and 3 ± 0.3mmHg in Slc26a6−/− mice (P<0.001; Figure 4b). Slc26a6−/− displayed normal food intake and weight gain on control diet or on increased dietary fructose intake relevant to Slc26a6−/− mice. Blood sugar increased in both Slc26a6+/+ and Slc26a6−/− mice on increased dietary fructose intake for 12 weeks (Figure 4c). The increase in the concentration of plasma fructose, measured by HPLC, was comparable in both Slc26a6+/+ and Slc26a6−/− mice on increased dietary fructose (155 ± 21 and 195 ± 29μmol/100ml in Slc26a6+/+ and Slc26a6−/− mice, respectively, P>0.05, n = 4) or on control diet (28 ± 3 vs 37 ± 4 μmol/100ml in Slc26a6+/+ and Slc26a6−/− mice, respectively, P>0.05, n = 4). These results indicate that deletion of Slc26a6 did not affect the absorption of fructose in the intestine.
Figure 4 |. High-fructose diet increases blood pressure in Slc26a6+/+ but not in Slc26a6−/− mice.
(a) Systolic blood pressure was increased significantly in Slc26a6+/+ mice but remained unchanged in Slc26a6−/− mice on increased dietary fructose intake for 12 weeks. (b) Fructose-induced blood pressure increment in Slc26a6+/+ and Slc26a6−/− mice. The increment in blood pressure elevation by the high-fructose diet was significantly higher in Slc26a6+/+ compared with Slc26a6−/− mice. (c) High-fructose diet increases blood sugar in both Slc26a6+/+ and Slc26a6−/− mice. Blood sugar increased significantly in both Slc26a6+/+ and Slc26a6−/− mice after 12 weeks of increased dietary fructose intake.
Fructose-induced hypertension in rat
Sprague–Dawley rats have been extensively used for the examination of fructose-induced hypertension. In the last series of experiments, the effect of high-fructose diet on blood pressure was examined in Sprague–Dawley rats in the presence or the absence of chloride in the diet, so as to inhibit the apical chloride/base exchangers in the small intestine.
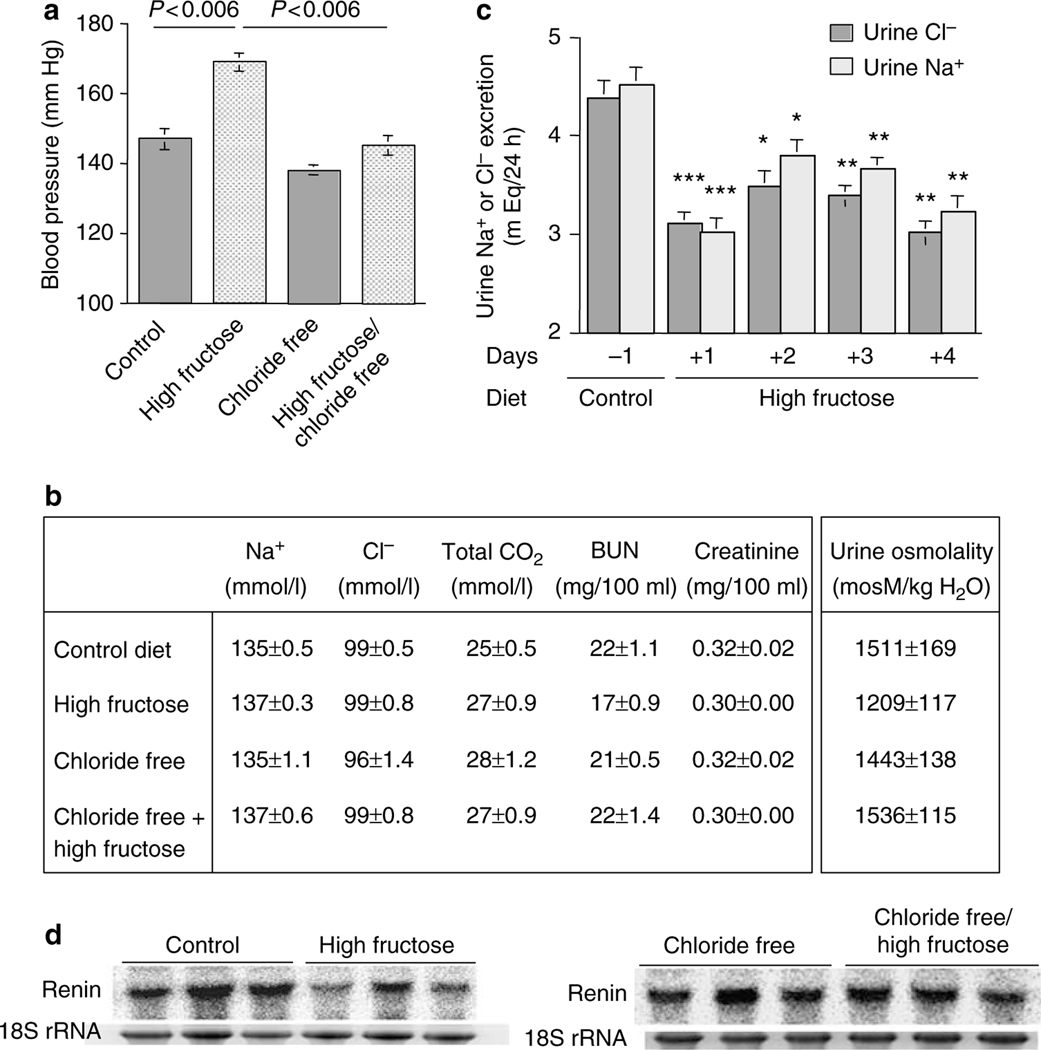
As shown in Figure 5a, increased dietary fructose intake for 5 weeks resulted in a significant systolic blood pressure elevation as compared with the control diet (147 ± 3.0 mm Hg in control vs 169 ± 3.0 mm Hg in high-fructose group, P<0.001, n = 5). However, the removal of chloride from the high-fructose diet (chloride free/high fructose) blocked the fructose-induced hypertension by 70% when compared with chloride-free alone (138 ± 2 mm Hg in chloride free vs 145 ± 3 mm Hg in chloride free/high fructose) and by ~100% when compared with the control diet (147 ± 3 mm Hg in control diet vs 145 ± 3mm Hg in chloride-free/high-fructose diet; Figure 5a).
Figure 5 |. Effect of dietary chloride intake on fructose-induced hypertension, and blood and urine chemical analysis in rat.
(a) Chloride-free diet blocks fructose-induced hypertension in rats. Systolic blood pressure increased significantly in rats on increased dietary fructose intake for 5 weeks. The chloride-free/high-fructose diet prevented a rise in blood pressure that was observed in rats on a high-fructose (normal chloride) diet. (b) Serum and urine chemical analysis in rats on increased fructose intake with or without chloride. Urine and serum chemistries indicated that the kidney function and vascular volume were normal in rats on the high-fructose, chloride-free, or chloride-free/high-fructose diet. (c) Daily urinary excretion of chloride and sodium in rats on high-fructose diet. The 24-h urinary excretion of chloride and sodium reduced significantly in rats on increased fructose dietary intake, when compared with control diet in the same rats. Animals were in metabolic cages for 5 days, with 1 day on control diet and the following 4 days on increased fructose intake diet. *P<0.02, **P<0.005, and ***P<0.002 vs control diet. (d) Expression of renin in kidneys of Slc26a6+/+ mice on increased fructose intake. Expression of renin decreased by ~50% in animals on high-fructose diet for 2 weeks. BUN; blood urea nitrogen.
Daily food intake was comparable in all four groups (18.1 ± 0.6 g in control, 17.5 ± 0.6 g in high-fructose, 16.7 ± 1.0 g in chloride-free, and 17.9 ± 1.4 g in chloride-free/high-fructose diet; n = 5 in each group and P>0.05 between all groups). The kidney function parameters, including serum blood urea nitrogen and creatinine, and urine osmolarity, remained unchanged in all four groups indicating that the inhibitory effect of chloride-free diet on blood pressure elevation was not due to volume depletion (Figure 5b). Body weights were comparable in rats on the control, high-fructose, or chloride-free diet and mildly lower in rats on the chloride-free/high-fructose diet.
Increased fructose intake stimulates salt absorption in the kidney
The purpose of the next series of experiments was to ascertain the effect of increased dietary fructose intake on chloride and sodium excretion by the kidney. Accordingly, rats were placed in metabolic cages and the 24-h urine chloride and sodium excretion was determined before and after placement on a high-fructose diet. The results demonstrated that switching from the control diet to high-fructose diet significantly decreased the daily excretion of chloride and sodium by the kidney, an effect that was evident for the 4-day duration of experiments (Figure 5c). Food intake was comparable before and after switching to high-fructose diet, indicating that decreased excretion of sodium and chloride was not due to decreased salt intake.
The increase in salt absorption in the intestine (Figures 2 and 3) and kidney (Figure 5c) in early stages of increased dietary fructose intake suggested possible salt overload. To assess vascular volume status in animals on increased dietary fructose intake, the expression of renin in the kidney was examined. The results, depicted in Figure 5d (left panel), demonstrated that the expression of renin decreased by ~45% in kidneys of animals on increased fructose intake for 2 weeks (P<0.05 vs mice on normal diet, n = 3). The expression of renin in animals on chloride-free/high-fructose diet remained the same as in animals on chloride-free diet (Figure 5d, right panel).
Fructose-induced hypertension is not associated with alterations in serum uric acid
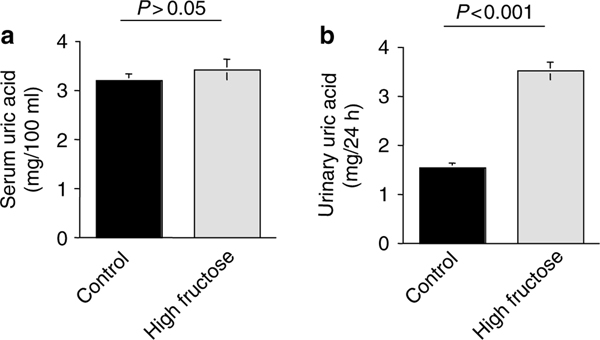
In the next series of experiments, we examined the plasma uric acid and the 24-h urine uric acid excretion in rats on increased dietary fructose intake for 5 weeks. As shown in Figure 6, rats on high-fructose diet for 5 weeks did not demonstrate any elevation in serum uric acid (3.53 ± 0.13 mg/100 ml in control and 3.45 ± 0.14 mg/100 ml in high-fructose group, P>0.05, n = 5), but showed enhanced excretion of uric acid in the urine (1.54 ± 0.13 mg/24 h in control vs 3.78 ± 0.21 mg/24 h in high-fructose group, P<0.0001, n = 5).
Figure 6 |. Serum uric acid and urine uric acid excretion in rats on increased fructose intake.
Rats on high-fructose diet for 5 weeks did not demonstrate any elevation in serum uric acid (a), but showed enhanced excretion of uric acid in the urine (b).
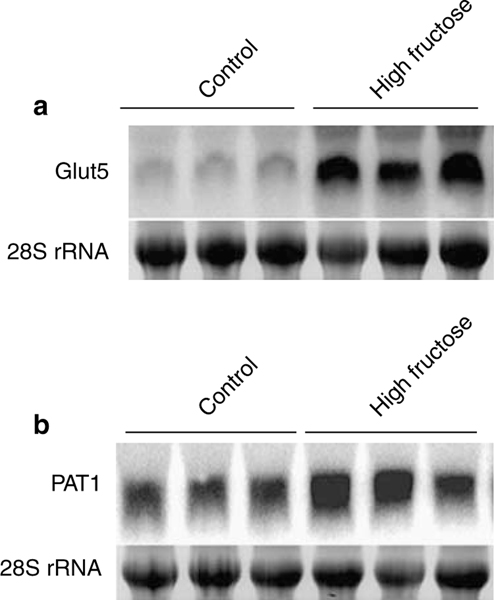
In the last series of experiments, the expression of Glut5 and PAT1 was examined in jejuna of wild-type mice on control or high-fructose diet for 12 weeks. As shown in Figure 7 (panels A and B), the expression of Glut5 and PAT1 was increased in mice on increased fructose intake compared with control diet, with Glut5 expression increasing by ~700% (P<0.001, n = 3) and the expression of PAT1 increasing by ~55% (P<0.05, n = 3), indicating that the expression of these transporters remains elevated throughout the experiment. It is worth mentioning that the magnitude of expression of PAT1 at 12 weeks (Figure 7b) is less than the increase at 2 weeks of increased dietary fructose intake, which was at ~200% (Figure 3b).
Figure 7 |. Expression of Glut5 and PAT1 in the intestine of Slc26a6+/+ mice after 12 weeks of increased fructose intake.
Expression of PAT1 and Glut5 increased in the intestine of mice on high-fructose intake for 12 weeks (panels a and b).
DISCUSSION
The increase in the incidence of metabolic syndrome, which is reaching an epidemic proportion in developed countries, correlates with increased dietary fructose intake. The present studies provide novel insight into the pathogenesis of fructose-induced hypertension by establishing a strong link between increased fructose intake and enhanced salt absorption in the small intestine and kidney tubules.
Unlike the well-studied stimulatory role of glucose on salt absorption in the intestine, which is mediated predominantly by the sodium glucose cotransporter (Sglt) and to some extent the Na+/H+ exchanger NHE3,36,37 the role of fructose on salt absorption remains less well understood, despite elegant studies over 30 years ago by Fordtran.38 The current studies confirm such an interaction and delineate the molecular machinery of fructose-induced salt absorption by identifying Slc26a6 (PAT1) and Glut5 as integral molecules in that process.
Slc2a5 (or Glut5) is a high-affinity fructose transporter whereas Slc26a6 (or PAT1) is a major chloride/base exchanger. Both are expressed on the apical membranes in the small intestine and kidney proximal tubule.20,21,29,30 Fructose-stimulated, PAT-1-mediated chloride absorption (Figure 2) establishes a direct link between increased fructose intake and enhanced salt absorption in the intestine. In addition, fructose was shown to increase the absorption of salt in the kidney tubules (Figure 5c). Taken together, these results indicate that increased dietary fructose intake causes a state of salt overload, at least in the early stages of the experiments, by increasing the absorption of salt in the intestine and decreasing its excretion by the kidney.
The most salient feature of the present studies is the prevention of generation of fructose-induced hypertension in mice lacking Slc26a6 and in rats on a chloride-free diet (Figures 4 and 5), clearly establishing the role of dietary chloride and chloride-absorbing transporter Slc26a6 in the pathogenesis of fructose-induced hypertension. Although low-salt diet was shown to blunt the magnitude of hypertension in rats on a high-fructose diet, the molecular basis of that observation was not delineated.39 The Slc26a6 deletion did not prevent the increase in blood glucose (Figure 4c), clearly indicating that the pathogenesis of hypertension is distinct from that of blood sugar elevation in animals on increased fructose intake. These latter results are consistent with comparable fructose absorption in the jejunum of Slc26a6+/+ and Slc26a6−/− mice, as determined by 14C-fructose absorption (data not shown) and serum fructose concentration (Results).
The stimulatory effect of fructose on PAT1-mediated chloride absorption and generation of hypertension are dependent on Glut5 in the intestinal villi. This conclusion is supported by our studies demonstrating that acute application of fructose to the perfusate in jejunum had no stimulatory effect on salt absorption in Glut5 null mice (Stacey Fussell, Sharon Barone, Anurag Kumar Singh, Hassane Amlal, Fred Lucas, Jie Xu, Xudong Wu, Yiling Yu, Clifford W Schweinfest, Ursula Seidler, Jian Zuo and Manoocher Soleimani. The Slc2a5 (Glut5) is absolutely essential for the absorption of fructose in intestine and generation of fructose-induced hypertension (manuscript submitted)). Further, increased dietary fructose intake caused massive small intestinal malabsorption and severe volume depletion in Glut5 null mice as early as 72h after the initiation of experiments (the above manuscript in preparation).
Increased dietary fructose intake for 2 weeks robustly increased the expression of Glut5, PAT1, and NHE3 in the jejunum (Figure 3), consistent with enhanced absorption of fructose and salt. Taken together, these results demonstrate two distinct effects of fructose on ion transporters in the jejunum; the first effect is an acute effect, which is evident immediately and in a matter minutes following the exposure to fructose (Figure 2) and is likely independent of a new protein synthesis. The other effect is observed in response to long-term exposure to high fructose and involves the synthesis of new proteins for Glut5 and Slc26a6 (Figure 3).
Increased dietary fructose intake decreased the urinary excretion of salt in the very early stages of experiment (Figure 5). Coupled with the increased absorption of salt in the intestine (Figure 2), we propose that increased fructose intake generates a state of salt overload, at least in the early stages of increased fructose intake. This assumption is supported by reduced expression renin in the kidneys of mice on increased fructose intake for 2 weeks and before the development of hypertension (Figure 7c). The link between salt retention and the subsequent generation of hypertension has been studied. It has been suggested that salt retention can trigger a cascade of regulatory events that eventually leads to the release of an endogenous Na+–K+-ATPase inhibitor in the blood, which, on one hand, enhances the excretion of salt by decreasing its absorption in the kidney, and, on the other hand, increases vascular resistance by increasing the intracellular calcium in vascular smooth muscle cells. In support of this hypothesis, recent studies demonstrated that the administration of ouabain in mice caused hypertension40 and that preventing the binding of endogenous ouabain with the Na+–K+-ATPase blocked the hypertension in various mice models.41 Our collaborative studies with Dr Bagarov at NIH demonstrated increased concentration of plasma endogenous ouabain (Na+–K+-ATPase inhibitor) in animals on high-fructose diet as early as 5 days after the start of increased fructose diet (data not shown).
Recent studies demonstrated that SLC26A4 (pendrin), which is another member of the SLC26 family, can transport fructose.42 We, therefore, tested the ability of SLC26A6 (human)/Slc26a6 (mouse) to transport 14C-fructose in cultured COS7 cells and compared the results to Glut5mediated fructose absorption. Our results demonstrate that although Glut5-transfected cells display robust fructose uptake, the ability of PAT-1-transfected cells to transport fructose is minimal, both in the presence and the absence of chloride in the perfusate (Stacey Fussell, Sharon Barone, Anurag Kumar Singh, Hassane Amlal, Fred Lucas, Jie Xu, Xudong Wu, Yiling Yu, Clifford W Schweinfest, Ursula Seidler, Jian Zuo and Manoocher Soleimani. The Slc2a5 (Glut5) is absolutely essential for the absorption of fructose in intestine and generation of fructose-induced hypertension (manuscript submitted)). These results indicate that PAT-1 does not play a direct role in fructose absorption in the intestine. In support of this conclusion, we find that Slc26a6 null mice, unlike Glut5 null mice, have no difficulty with the absorption of fructose, as determined by normal food intake, normal body weight gain, increased blood glucose and fructose concentrations, and the absence of diarrhea on increased dietary fructose intake.
Serum uric acid concentration remained unchanged in rats on increased dietary intake for 5 weeks (Figure 6). Enhanced generation of uric acid in rats on increased fructose intake results in increased uric acid excretion, thus maintaining serum uric acid concentrations at normal range (Figure 6). Given the fact that rats were hypertensive at the time of serum uric acid measurement (Figure 5), our studies strongly suggest that serum uric acid alteration does not play a major role in blood pressure elevation in the early stages of fructose-induced hypertension. The reports demonstrating the elevation of serum uric acid in rats on increased dietary fructose intake were performed after 8–10 weeks of experiments, and revealed decreased uric acid excretion in the kidney.43 It is plausible that the elevation in serum uric acid in those studies were in large part secondary to the decline in the kidney function due to the detrimental effect of sustained hypertension, which could have decreased the excretion of uric acid. A closer look at the kidney function in animals on increased dietary fructose intake for 8 weeks or longer is warranted.
Several studies have demonstrated the important role of enhanced salt intake and absorption in the kidney, in the context of high insulin levels, to the pathophysiology of hypertension in metabolic syndrome.44–46 Although our studies did not examine the role of insulin in the generation of fructose-induced hypertension directly, it is plausible that increased insulin could increase the absorption of chloride and sodium in the kidney proximal tubule by activating the sodium- and chloride-absorbing transporters (NHE3 and PAT1). The near absence of fructose-induced hypertension in Slc26a6−/− mice strongly suggests that any modulating role of insulin is likely mediated by Slc26a6 or pathways downstream to it.
The role of increased dietary fructose intake, as a causative factor in the development of metabolic syndrome and the hypertension associated with it, is getting recognized. Our studies strongly suggest that fructose-induced hypertension is largely generated by enhanced salt absorption in the small intestine and kidney subsequent to the activation of the apical chloride/base exchanger PAT1 (Slc26a6) and Slc2a5 (Glut5). Low dietary chloride or inhibitors of PAT1 (or Glut5) could play important role in the prevention of hypertension and subsequent kidney damage in fructose-induced hypertension.
MATERIALS AND METHODS
Animals
All studies were approved by the Animal Care Committees at the University of Cincinnati in Cincinnati (OH, USA) and Hannover Medical School (Hannover, Germany). Experiments were performed using Slc26a6−/− and Slc26a6+/+ mice on a C57/B6 background and in Sprague–Dawley rats. Care was taken to use equal numbers of male and female mice pairs. Mice were 3–5 months of age. The genotype of Slc26a6 (Slc26a6−/−) knockout mice was verified by PCR as described.21 Animals were housed in standard animal care rooms with a 12-hour light–dark cycle and were allowed free access to food and water.
RNA isolation and northern blot hybridization
Total cellular RNA was extracted from intestines of mice or rats on a high-fructose diet according to established methods,47 quantitated spectrophotometrically, and stored at −80°C. Total RNA samples (30 μg/lane) were fractionated on a 1.2% agarose–formaldehyde gel, transferred to Magna NT nylon membranes, cross-linked by UV light, and baked. Hybridization was performed according to Church and Gilbert.48 The membranes were washed, blotted dry, and exposed to a Phosphor Imager screen (Molecular Dynamics, Sunnyvale, CA, USA). A DNA fragment encompassing mouse Slc26a6 (nucleotides 445–3038) or Glut5 (nucleotides 78–1062) was used for northern hybridization. Hybridizations were performed on separate samples from three or four different animals.
Immunofluorescence labeling
Animals were killed with an overdose of sodium pentobarbital and perfused through the left ventricle with 0.9% saline followed by cold 4% paraformaldehyde in 0.1 M sodium phosphate buffer (pH 7.4). Jejuna and kidneys were removed, cut in tissue blocks, and fixed in formaldehyde solution overnight at 4°C. Single immunofluorescence labeling was performed as described.20,21 Primary antibodies were polyclonal Slc26a6 antibodies (at 1/30 dilution)21 and monoclonal Glut5 antibodies from Alpha Diagnostics (San Antonio, TX, USA) (at 1/80 dilution) that were mixed in −0.3% Triton X-100–phosphate-buffered saline solution and applied to sections overnight at room temperature.20,21 Alexa Fluor 488 (green) or Alexa Fluor 568 (red) goat or mouse antibodies were used as secondary antibodies. Only slides processed at the same time with the same concentrations of primary and secondary antibodies applied under identical protocols were compared. Acquisition parameters were kept constant between the experimental groups to allow for comparisons of the intensity of fluorescent labeling.
Immunoblot analysis of Glut5, PAT1, and NHE3
Apical membrane proteins were isolated from jejunal scrapings from mice or rats.21,49 Proteins were resolved by SDS-polyacrylamide gel electrophoresis (40 μg/lane) and transferred to nitrocellulose membrane. The membrane was blocked with 5% milk proteins, and then incubated for 6h with antibodies against Slc26a6 (PAT1), Glut5, or NHE3. The secondary antibody was a donkey anti-rabbit IgG conjugated to horseradish peroxidase (Pierce, Rockford, IL, USA). The results were visualized using chemiluminescence method (Super-Signal Substrate; Pierce) and captured on light-sensitive imaging film (Kodak, Rochester, NY, USA). The abundance of Slc26a6, Glut5, or NHE3 in various experimental groups was quantitated as fold change compared with control after adjustment for protein loading, as detected by blotting with β-actin antibody on the same membrane. NHE3 antibodies were purchased from Alpha Diagnostics.
Transient transfection of Glut5 and PAT1 in cultured cells
Cultured COS7 cells were transiently transfected with mouse PAT1 or Glut5 cDNA. Full-length mouse PAT1 cDNA (GenBank accession number NM_134420) and Glut5 cDNA (GenBank accession number NM_019741) were amplified from RNA isolated from small intestine by reverse transcription-PCR using specific primers and subcloned into mammalian expression vectors. 14C-fructose uptake, at 10min, was assayed at 48h in cells transfected with the PAT1 or Glut5 cDNA and compared with sham-transfected cells according to established methods.
Surgical procedure
Animals (Slc26a6+/+, Slc26a6−/−, Glut5+/+, and Glut5−/− mice) were fasted overnight before the experiment. Induction of anesthesia was achieved by administration of 10 μl/g i.p. haloperidol/midazolam/fentanyl cocktail (haloperidol 12.5 mg/kg, fentanyl 0.325 mg/kg, and midazolam 5mg/kg body weight). Abdomen was opened by one small central incision, and approximately 10–15 cm of the jejunum was used for measurement. A small polyethylene tube (PE100) with a distal flange was advanced into the jejunum (3–4cm away from stomach), and secured by a ligature that served as an inlet tube. PE200 flanged tubing was secured by ligature to allow for drainage. The 10–15-cm isolated jejunum segment with an intact blood supply was gently flushed and then perfused (Perfusor compact; BRAUN, Bethlehem, PA, USA) at a rate of 3ml/h with 150mmol/l NaCl. Effluents from the isolated segment were visually free of blood throughout all experiments. Animals were maintained at 37°C using a heating pad controlled by a rectal thermistor probe. Anesthesia was maintained using the cocktail at 20% of the initial dose every 30–45min as indicated by respiratory rate and toe pinch reflex. In both Slc26a6−/− and Slc26a6+/+ animals, the effects of 40mM fructose on fluid absorption was evaluated. The effect of chloride removal from the perfusate on fluid absorption was examined by using 150mM Na gluconate. After an initial 30-min washout and recovery period, basal fluid absorption was measured for 30min. To examine the effect of luminal fructose, the jejunal segment was perfused with isotonic solution NaCl+fructose (130mM NaCl+40mM fructose) or NaCl alone (150 mM NaCl) as control. At the end of the experiments, mice were killed by cervical dislocation and length of jejunum was measured.
Measurement of fluid absorption in the jejunum
Slc26a6+/+, Slc26a6−/−, Glut5+/+, and Glut5−/− mice were used. The perfusate was collected in a preweighed 4.5-ml collecting tube. After a 30-min period, the tube was weighed again and the difference of the two up to four places of decimal was taken as the amount of fluid recovered after 30min (taking density of fluid roughly at about 1g/ml). The difference was further subtracted from 1.5mm, which was the original volume recovered after 30min in case of no fluid absorption. All values were represented in milliliters of fluid absorbed per centimeter jejunum length per hour (ml/cm/h).
High-fructose diet
Slc26a6+/+ and Slc26a6−/− mice were placed on a high-fructose (60% fructose) or control diet (60% starch) for 12 weeks, according to published reports. In parallel studies, rats were placed on a regular (60% starch), high-fructose (60% fructose), chloride-free (chloride replaced by bicarbonate), or chloride-free/high-fructose diet prepared by Harlan Teklad (Madison, WI, USA) for up to 5 weeks.
Metabolic studies in animals on increased dietary fructose intake
Rats and wild-type mice were placed in metabolic cages. After acclimatization to the cage environment, animals (n = 5) were placed on control diet and after 48h were switched to a high-fructose diet. Daily urine output was collected and assayed for the excretion of sodium and chloride. Urine sodium and chloride concentrations were assayed as described.21 Blood chemical analysis, including kidney profile function (blood urea nitrogen, serum creatinine, and urine osmolarity) was performed as described.21
Blood pressure monitoring
Systolic blood pressure in conscious rats was determined using a tail-cuff sphygmomanometer (Visitech BP2000; Visitech Systems, Apex, NC, USA). Systolic blood pressure in conscious mice was measured by a tail-cuff sphygmomanometer using a BP-2000 (Visitech Systems). Measurements for each rat or mouse represent mean value of three consecutive recordings performed in the last week of experiments. All experimental animals were preconditioned for blood pressure measurements 2 weeks (rats) or 6 weeks (mice) before euthanasia.
Statistical analysis
Descriptive statistics were expressed as means ± s.e.m., with the number of experiments given in parentheses. The statistical analyses were performed using Student’s t-test for unpaired data and analysis of variance, and Fisher’s protected least significant difference for paired data. Results were considered significant at P<0.05.
Materials
[32P]dCTP and 36Cl were purchased from Perkin-Elmer Life Sciences, Shelton, CT, USA. 14C-fructose was purchased from Amersham Biosciences (Piscataway, NJ, USA). Nitrocellulose filters and other chemicals were purchased from Sigma, St Louis, MO, USA. The RadPrime DNA labeling kit was purchased from Invitrogen, Carlsbad, CA, USA.
ACKNOWLEDGMENTS
These studies were supported by NIH Grant DK 62809, a merit review award (to MS), grants from Deutsche Forschungsgemeinschaft Se 460/9-5 and Se 460/13-2, grants from Sonderforschungsbereich 621/C9 (to US), and research funds from DCI Inc., Nashville, TN, USA (to MS and HA).
Footnotes
DISCLOSURE
All the authors declared no competing interests.
REFERENCES
- 1.Elliott SS, Keim NL, Stern JS et al. Fructose, weight gain, and the insulin resistance syndrome. Am J Clin Nutr 2002; 76: 911–922. Review. [DOI] [PubMed] [Google Scholar]
- 2.Sacks FM. Metabolic syndrome: epidemiology and consequences. J Clin Psychiatry 2004; 65(Suppl 18): 3–12. Review. [PubMed] [Google Scholar]
- 3.Spinler SA. Challenges associated with metabolic syndrome. Pharmacotherapy 2006; 26: 209S–217S. [DOI] [PubMed] [Google Scholar]
- 4.Grundy SM. Metabolic syndrome: a multiplex cardiovascular risk factor. J Clin Endocrinol Metab 2007; 92: 399–404. [DOI] [PubMed] [Google Scholar]
- 5.Obesity Sinaiko A., insulin resistance and the metabolic syndrome. J Pediatr (Rio J) 2007; 83: 3–4. [DOI] [PubMed] [Google Scholar]
- 6.Wassink AM, Olijhoek JK, Visseren FL. The metabolic syndrome: metabolic changes with vascular consequences. Eur J Clin Invest 2007; 37: 8–17. [DOI] [PubMed] [Google Scholar]
- 7.Reusch JE. Current concepts in insulin resistance, type 2 diabetes mellitus, and the metabolic syndrome. Am J Cardiol 2002; 90: 19G–26G. Review. [DOI] [PubMed] [Google Scholar]
- 8.Stuhlinger MC, Abbasi F, Chu JW et al. Relationship between insulin resistance and an endogenous nitric oxide synthase inhibitor. JAMA 2002; 287: 1420–1426. [DOI] [PubMed] [Google Scholar]
- 9.Cirillo P, Sato W, Reungjui S et al. Uric Acid, the metabolic syndrome, and renal disease. J Am Soc Nephrol 2006; 17(12 Suppl 3): S165–S168. [DOI] [PubMed] [Google Scholar]
- 10.Kagota S, Yamaguchi Y, Tanaka N et al. Disturbances in nitric oxide/cyclic guanosine monophosphate system in SHR/NDmcr-cp rats, a model of metabolic syndrome. Life Sci 2006; 78: 1187–1196. [DOI] [PubMed] [Google Scholar]
- 11.Sarafidis PA, Bakris GL. Insulin and endothelin: an interplay contributing to hypertension development? J Clin Endocrinol Metab 2007; 92: 379–385. [DOI] [PubMed] [Google Scholar]
- 12.Giacchetti G, Sechi LA, Griffin CA et al. The tissue renin–angiotensin system in rats with fructose-induced hypertension: overexpression of type 1 angiotensin II receptor in adipose tissue. J Hypertens 2000; 18: 695–702. [DOI] [PubMed] [Google Scholar]
- 13.Lee DH, Lee JU, Kang DG et al. Increased vascular endothelin-1 gene expression with unaltered nitric oxide synthase levels in fructose-induced hypertensive rats. Metabolism 2001; 50: 74–78. [DOI] [PubMed] [Google Scholar]
- 14.Catena C, Giacchetti G, Novello M et al. Cellular mechanisms of insulin resistance in rats with fructose-induced hypertension. Am J Hypertens 2003; 16(11 Part 1): 973–978. [DOI] [PubMed] [Google Scholar]
- 15.Hsieh PS, Tai YH, Loh CH et al. Functional interaction of AT1 and AT2 receptors in fructose-induced insulin resistance and hypertension in rats. Metabolism 2005; 54: 157–164. [DOI] [PubMed] [Google Scholar]
- 16.Sanchez-Lozada LG, Tapia E, Jimenez A et al. Fructose-induced metabolic syndrome is associated with glomerular hypertension and renal microvascular damage in rats. Am J Physiol Renal Physiol 2007; 292: F423–F429. [DOI] [PubMed] [Google Scholar]
- 17.Farah V, Elased KM, Morris M. Genetic and dietary interactions: role of angiotensin AT1a receptors in response to a high-fructose diet. Am J Physiol Heart Circ Physiol 2007; 293: H1083–H1089. [DOI] [PubMed] [Google Scholar]
- 18.Lohi H, Kujala M, Kerkela E et al. Mapping of five new putative anion transporter genes in human and characterization of SLC26A6, a candidate gene for pancreatic anion exchanger. Genomics 2000; 70: 102–112. [DOI] [PubMed] [Google Scholar]
- 19.Knauf F, Yang CL, Thomson RB et al. Identification of a chloride–formate exchanger expressed on the brush border membrane of renal proximal tubule cells. Proc Natl Acad Sci USA 2001; 98: 9425–9430. [DOI] [PMC free article] [PubMed] [Google Scholar]
- 20.Wang Z, Petrovic S, Mann E et al. Identification of an apical Cl−/HCO−3 exchanger in the small intestine. Am J Physiol Gastrointest Liver Physiol 2002; 282: G573–G579. [DOI] [PubMed] [Google Scholar]
- 21.Wang Z, Wang T, Petrovic S et al. Kidney and intestine transport defects in Slc26a6 null mice. Am J Physiol Cell Physiol 2005; 288: C957–C965. [DOI] [PubMed] [Google Scholar]
- 22.Chernova MN, Jiang L, Friedman DJ et al. Functional comparison of mouse slc26a6 anion exchanger with human SLC26A6 polypeptide variants: differences in anion selectivity, regulation, and electrogenicity. J Biol Chem 2005; 280: 8564–8580. [DOI] [PubMed] [Google Scholar]
- 23.Mount DB, Romero MF. The SLC26 gene family of multifunctional anion exchangers. Pflugers Arch 2004; 447: 710–721. [DOI] [PubMed] [Google Scholar]
- 24.Freel RW, Hatch M, Green M et al. Ileal oxalate absorption and urinary oxalate excretion are enhanced in Slc26a6 null mice. Am J Physiol Gastrointest Liver Physiol 2006; 290: G719–G728. [DOI] [PubMed] [Google Scholar]
- 25.Jiang Z, Asplin JR, Evan AP et al. Calcium oxalate urolithiasis in mice lacking anion transporter Slc26a6. Nat Genet 2006; 38: 474–478. [DOI] [PubMed] [Google Scholar]
- 26.Tuo B, Riederer B, Wang Z et al. Involvement of the anion exchanger SLC26A6 in prostaglandin E2- but not forskolin-stimulated duodenal. Gastroenterology 2006; 130: 349–358. [DOI] [PubMed] [Google Scholar]
- 27.Simpson JE, Schweinfest CW, Shull GE et al. PAT-1 (Slc26a6) is the predominant apical membrane Cl/HCO3 exchanger in the upper villous epithelium of the murine duodenum. Am J Physiol Gastrointest Liver Physiol 2007; 292: G1079–G1088. [DOI] [PubMed] [Google Scholar]
- 28.Seidler U, Rottinghaus I, Hillesheim J et al. Sodium and chloride absorptive defects in the small intestine in Slc26a6 null mice. Pflugers Arch 2008; 455: 757–766. [DOI] [PubMed] [Google Scholar]
- 29.Kayano T, Burant CF, Fukumoto H et al. Human facilitative glucose transporters. Isolation, functional characterization, and gene localization of cDNAs encoding an isoform (GLUT5) expressed in small intestine, kidney, muscle, and adipose tissue and an unusual glucose transporter pseudogene-like sequence (GLUT6). J Biol Chem 1990; 265: 13276–13282. [PubMed] [Google Scholar]
- 30.Miyamoto K, Tatsumi S, Morimoto A et al. Characterization of the rabbit intestinal fructose transporter (GLUT5). Biochem J 1994; 303(Part 3): 877–883. [DOI] [PMC free article] [PubMed] [Google Scholar]
- 31.O’Shaughnessy KM, Karet FE. Salt handling and hypertension. J Clin Invest 2004; 113: 1075–1081. Review. [DOI] [PMC free article] [PubMed] [Google Scholar]
- 32.de Wardener HE, He FJ, MacGregor GA. Plasma sodium and hypertension. Kidney Int 2004; 66: 2454–2466. Review. [DOI] [PubMed] [Google Scholar]
- 33.Meneton P, Jeunemaitre X, de Wardener HE et al. Links between dietary salt intake, renal salt handling, blood pressure, and cardiovascular diseases. Physiol Rev 2005; 85: 679–715. Review. [DOI] [PubMed] [Google Scholar]
- 34.Karppanen H, Mervaala E. Sodium intake and hypertension. Prog Cardiovasc Dis 2006; 49: 59–75. Review. [DOI] [PubMed] [Google Scholar]
- 35.Haddy FJ. Role of dietary salt in hypertension. Life Sci 2006; 79: 1585–1592. Review. [DOI] [PubMed] [Google Scholar]
- 36.Wright EM, Martin MG, Turk E. Intestinal absorption in health and disease—sugars. Best Pract Res Clin Gastroenterol 2003; 17: 943–956. Review. [DOI] [PubMed] [Google Scholar]
- 37.Zhao H, Shiue H, Palkon S et al. Ezrin regulates NHE3 translocation and activation after Na+-glucose cotransport. Proc Natl Acad Sci USA 2004; 101: 9485–9490. [DOI] [PMC free article] [PubMed] [Google Scholar]
- 38.Fordtran JS. Stimulation of active and passive sodium absorption by sugars in the human jejunum. J Clin Invest 1975; 55: 728–737. [DOI] [PMC free article] [PubMed] [Google Scholar]
- 39.Catena C, Cavarape A, Novello M et al. Insulin receptors and renal sodium handling in hypertensive fructose-fed rats. Kidney Int 2003; 64: 2163–2171. [DOI] [PubMed] [Google Scholar]
- 40.Dostanic I, Paul RJ, Lorenz JN et al. The alpha2-isoform of Na–K-ATPase mediates ouabain-induced hypertension in mice and increased vascular contractility in vitro. Am J Physiol 2005; 288: H477–H485. [DOI] [PubMed] [Google Scholar]
- 41.Dostanic-Larson I, Van Huysse JW, Lorenz JN et al. The highly conserved cardiac glycoside binding site of Na,K-ATPase plays a role in blood pressure regulation. Proc Natl Acad Sci USA 2005; 102: 15845–15850. [DOI] [PMC free article] [PubMed] [Google Scholar]
- 42.Chambard JM, Ashmore JF. Sugar transport by mammalian members of the SLC26 superfamily of anion–bicarbonate exchangers. J Physiol 2003; 550(Part 3): 667–677. [DOI] [PMC free article] [PubMed] [Google Scholar]
- 43.Nakagawa T, Hu H, Zharikov S et al. A causal role for uric acid in fructose-induced metabolic syndrome. Am J Physiol Renal Physiol 2006; 290: F625–F631. [DOI] [PubMed] [Google Scholar]
- 44.Hall JE, Brands MW, Hildebrandt DA et al. Obesity-associated hypertension. Hyperinsulinemia and renal mechanisms. Hypertension 1992; 19(1 Suppl): I45–I55. Review. [DOI] [PubMed] [Google Scholar]
- 45.Bjorntorp P, Holm G, Rosmond R et al. Hypertension and the metabolic syndrome: closely related central origin? Blood Press 2000; 9: 71–82. Review. [DOI] [PubMed] [Google Scholar]
- 46.Ogihara T, Asano T, Fujita T. Contribution of salt intake to insulin resistance associated with hypertension. Life Sci 2003; 73: 509–523. Review. [DOI] [PubMed] [Google Scholar]
- 47.Chomczynski P, Sacchi N. Single-step method of RNA isolation by acid guanidinium thiocyanate–phenol–chloroform extraction. Anal Biochem 1987; 162: 156–159. [DOI] [PubMed] [Google Scholar]
- 48.Church GM, Gilbert W. Genomic sequencing. Proc Natl Acad Sci USA 1984; 81: 1991–1995. [DOI] [PMC free article] [PubMed] [Google Scholar]
- 49.Schweinfest CW, Spyropoulos DD, Henderson KW et al. Slc26a3 (dra)-deficient mice display chloride-losing diarrhea, enhanced colonic proliferation, and distinct up-regulation of ion transporters in the colon. J Biol Chem 2006; 281: 37962–37971. [DOI] [PubMed] [Google Scholar]


