

Abstract
Background & Aims:
Fecal incontinence (FI) can considerably impair quality of life. Through a systematic review and meta-analysis, we sought to determine the global prevalence and geographic distribution of FI and to characterize its relationship with sex and age.
Methods:
We searched PubMed, Web of Science, and Cochrane Library databases to identify population-based surveys of the prevalence of FI.
Results:
Of the 5,175 articles identified, the final analysis included 80 studies; the median response rate was 66% (IQR, 54%−74%). Among 548,316 individuals, the pooled global prevalence of FI was 8.0% (95% CI, 6.8%−9.2%); by Rome criteria, it was 5.4% (95% CI, 3.1%−7.7%). FI prevalence was greater for persons aged 60 years and older (9.3% [95% CI, 6.6%−12.0%]) compared with younger persons (4.9% [95% CI, 2.9%−6.9%]) (odds ratio [OR], 1.75 [95% CI, 1.39–2.20]), and it was more prevalent among women (9.1% [95% CI, 7.6%−10.6%]) than men (7.4% [95% CI, 6.0%−8.8%]) (OR, 1.17 [95% CI, 1.06–1.28]). The prevalence was highest in Australia and Oceania, followed by North America, Asia, and Europe, but prevalence could not be estimated in Africa and the Middle East. The risk of bias was low, moderate, and high for 19 (24%), 46 (57%), and 15 (19%) studies, respectively. Exclusion of studies with high risk of bias did not affect the prevalence of FI or heterogeneity. In the meta-regression, the high study heterogeneity (I2=99.61%) was partly explained by age.
Conclusions:
Approximately 1 in 12 adults worldwide have FI. The prevalence is greater among women and older people.
Keywords: accidental bowel leakage, anal incontinence, bowel incontinence, epidemiology
Graphical Abstract

Introduction
Fecal incontinence (FI), defined as the uncontrolled passage of feces, is often a distressing symptom that can markedly affect quality of life.1–3 Its severity depends not only on the frequency of FI but also on the type (ie, liquid and/or solid stool), the amount of stool leakage, and the presence and severity of rectal urgency.4 Patients with extreme urgency often curtail their daily activities and live their lives close to a toilet.3
Clinicians’ understanding of the prevalence and risk factors for FI have evolved with time. Initially, FI was regarded as a symptom that predominantly affected older people, especially nursing home residents.5 Its prevalence among community-dwelling adults was underrecognized, possibly because persons with FI were hesitant to even disclose that they were symptomatic.6 Now, we recognize that FI is common in the community. The only meta-analysis to date of the prevalence of FI, published in 2006, included community and noncommunity studies and estimated the mean FI prevalence to be 4.3% (95% CI, 3.5%−5.4%).7 Systematic reviews in 2015 and 2016 subsequently estimated the community prevalence of any FI and of FI defined by Rome II criteria; any FI had a median prevalence of 7.7% (range, 2.0%−20.7%), and FI defined by Rome II criteria had a mean prevalence of 4.3% (95% CI, 3.5%−5.4%).8, 9 However, these systematic reviews included only a few studies from Asia and Africa and did not assess the geographic distribution of FI. One review8 but not another7 observed an association between FI and sex. Prompted by these differences, by recent studies on the prevalence of FI, and by temporal trends in the main risk factors for FI (eg, obstetric procedures,10, 11 the proportion of older persons in the population, and the prevalence of irritable bowel syndrome [IBS]12, 13), we conducted a systematic review and meta-analysis to determine the worldwide prevalence of FI in community-dwelling adults (primary outcome). Secondary outcomes were to characterize the relationship of prevalence with age, sex, geographic location, and survey characteristics.
Methods
Search Strategy
This review is registered on the PROSPERO platform (CRD42022324272). The literature search and meta-analysis are reported following the Preferred Reporting Items for Systematic Reviews and Meta-Analyses (PRISMA) guidelines14 and the Meta-Analysis Of Observational Studies in Epidemiology (MOOSE) guidelines,15 respectively. An experienced librarian generated specific terms to use when searching in PubMed, Web of Science, and Cochrane Library databases; searches were conducted on June 16, 2023 (Supplement 1). Endnote software (version 19; Clarivate) was used to organize references.
Eligibility Criteria
Studies were eligible if they assessed the prevalence of FI or anal incontinence among teenagers and adults living in the community, regardless of ethnicity, income, health status, or other factors. Some studies were limited by age and/or sex. Any assessment method (eg, by electronic media or mail) was acceptable.
Study Selection, Data Collection, and Organization
To identify eligible studies, the database search results were combined, and duplicates were removed. Next, the titles and abstracts were screened independently (by C.G. and I.M.) to identify appropriate studies. Full-text articles were evaluated for eligibility, and equivocal studies (<5% of all considered articles) were resolved by discussion, with adjudication by a third author (P.E.), if necessary. Interrater reliability was high (κ=.98). Information on FI definition, method of data collection, geographic region, sex, and age were organized with Excel spreadsheet software (Microsoft Corp).
Data Extraction and Statistical Analysis
For each article included in the analysis, we extracted the following data from the full-text article: publication year (by I.M., C.G.), geographic region (I.M., C.G.), study type (I.M., C.G.), method of data collection (I.M., C.G.), response rate (H.H.), sample characteristics (eg, sample size, sex, age [I.M., C.G.]), and the number of participants with and without FI (I.M., C.G.). Data from all participants (all studies) were pooled and analyzed. Additionally, we conducted subgroup analyses according to assessment method and different FI definitions, and we conducted sensitivity analyses for geographic region, sex, and age.
The data were summarized with frequency and percentage, median (IQR), or range, as appropriate. The pooled prevalence, based on the proportion of individuals with FI in each study, was calculated by using a random-effects model and the meta-analysis software Meta-Essentials 1.5.16 The data are summarized as total sample size, number of cases, prevalence, and 95% CI and are displayed with forest plots. Odds ratios (ORs) and 95% CIs were calculated to summarize the relationship of FI prevalence with age and sex. Statistical heterogeneity was examined by visually inspecting forest plots and calculating the I2 statistic to quantify inconsistency among studies. Additionally, R was used to calculate linear regression, and the R package “metafor”17 was used to conduct the meta-regression analysis, conduct the Egger test to identify publication bias, and create a funnel plot.
The risk of bias was estimated by summing the scores for 10 items (Supplement 1),18, 19 of which 4 items pertained to external validity and 6 to internal validity. Each item was scored 1 or 0, depending on whether the criterion was satisfied. Total scores greater than 8 were considered to have low risk of bias; scores of 6 to 8, moderate risk of bias; and scores of 5 or lower, high risk of bias.
All authors had access to the study data and have reviewed and approved the final manuscript.
Results
Study Selection and Characteristics
Of the 5,175 identified studies, 147 seemed relevant; of these, 81 original articles (derived from 80 studies; 548,316 participants) were included in the final analysis (Figure 1). The median response rate was 66% (range, 5%−100%; IQR, 54%−74%). Table 1 summarizes the characteristics of individual studies: the FI prevalence ranged from 0.4% to 25%; 70% of participants were women; and the median age was 52.5 (IQR, 46.0–60.5) years. Study cohorts were from North America (31 studies, n=287,546), South America (5 studies, n=5,762), Europe (21 studies, n=114,287), Australia and New Zealand (12 studies, n=26,625), Asia (7 studies, n=35,524), Africa (2 studies, n=819), and the Middle East (1 study, n=800). One study reported the prevalence in summary for North America and the United Kingdom,97 and a worldwide study with 73,076 participants did not report the prevalence of FI by country.21
Figure 1.

PRISMA Flow Chart of Studies Included in the Meta-Analysis. a Eighty-one separate manuscripts were identified, but Sperber et al (2021)21 and Jaafari et al (2023)20 refer to the same study population.
Table 1.
Study Characteristics
| Study | Geographic region | Sample size, No. | Age, mean (range), y | Women, % | Fecal incontinence criteria | Data collection method | Responses, No.a | Total | Response rate, % |
|---|---|---|---|---|---|---|---|---|---|
| Adolfsson et al,221998 | Europe | 314 | 68 (50–80) | 0 | Leakage of feces | Self-administered postal questionnaire | 314 | 435 | 72.2 |
| Aitola et al,23 2010 | Europe | 3,163 | 55 (30–81) | 58.3 | Fecal incontinence in any frequency within the past year | Self-administered postal questionnaire | 3,163 | 7,960 | 39.7 |
| AlAmeel et al,24 2010 | North America | 8,917 | 73 (65-NR) | 57 | Problems controlling stool in the past year (Did you lose stool when you didn’t intend to?) | Interview (not clearly defined) | 8,917 | 12,368 | 72.1 |
| Alimohammadian et al,25 2014 | Middle East | 800 | 54 (40–95) | 100 | Involuntary loss of liquid or solid stool or gas via the anus | Face-to-face interview | 800 | NR | NR |
| Amaro et al,26 2009 | South America | 685 | 47 (20-NR) | 100 | At least 1-time loss, either solid or liquid stool, per year | Self-administered postal questionnaire and interview at home | 685 | 685 | 100 |
| Andy et al,27 2016 | North America | 6,329 | NR (50-NR) | 48.6 | At least 1-time loss of solid, liquid, or mucus stool per month | Face-to-face interview at home and examination in a mobile examination center | 6,329 | 8,317 | 76.1 |
| Bartlett et al,28 2013 | Australia and Oceania | 1,366 | 54 (NR-NR) | 58.5 | At least 1-time leakage of solid or liquid stool in the past year | Self-administered postal questionnaire | 1,523 | 3,165 | 48.1 |
| Bharucha et al,29 2005 | North America | 2,800 | NR (20-NR) | 100 | At least 1-time leakage of solid or liquid stool in the past year | Self-administered postal questionnaire | 2,800 | 5,300 | 52.8 |
| Botlero et al,30 2011 | Australia and Oceania | 442 | 59 (26–82) | 100 | At least 1-time leakage of well-formed or loose stool in the past 3 mo | Self-administered postal questionnaire | 444 | 457 | 97.2 |
| Bowling et al,31 2010 | Africa | 424 | 37 (NR-NR) | 100 | Bowel incontinence, 1–3 times per month | Self-administered, in-person questionnaire | 424 | NR | NR |
| Boyce et al,32 2006 | Australia and Oceania | 762 | 47 (18-NR) | 51.1 | Rome II criteria | Self-administered postal questionnaire | 762 | 1,225 | 62.2 |
| Brittain et al,33 2006 | Europe | 38,633 | 57 (48–68) | 54 | Any stool leakage, several times a month or more often | Self-administered postal questionnaire | 38,633 | 60,939 | 63.4 |
| Buckley and Lapitan,34 2009 | Europe | 1,040 | NR (18-NR) | 53 | Any involuntary leakage of feces | Online questionnaire via email | 1,040 | 7,000 | 14.9 |
| Bytzer et al,35 2001 | Australia and Oceania | 8,657 | 45 (18-NR) | 53.5 | Rome II criteria | Self-administered postal questionnaire | 8,657 | 14,571 | 59.4 |
| Chen et al,36 2003 | Asia | 1,247 | 43 (20-NR) | 100 | Any involuntary leakage of liquid or solid stool | Face-to-face interview at home | 1,253 | 1,584 | 79.1 |
| Coyne et al,37 2011 | North America | 2,000 | NR (40-NR) | 53.6 | Rarely or more often accidental loss of stool | Online questionnaire via email | 2,106 | 5,002 | 42.1 |
| Damon et al,38 2006 | Europe | 706 | 47 (18-NR) | 51.7 | Anal incontinence: Jorge-Wexner score ≥5 | Self-administered postal questionnaire | 713 | 2,800 | 25.5 |
| de Miguel et al,39 1999 | Europe | 800 | 56 (NR-NR) | 50.4 | Involuntary loss of gas, solid stool, or liquid stool | Face-to-face interview | 800 | NR | NR |
| de Souza Santos and Santos,40 2011 | South America | 519 | NR (18-NR) | 65.9 | Fecal Incontinence Severity Index | Face-to-face interview at home | 519 | 745 | 69.7 |
| Denis et al,41 1992 | Europe | 1,100 | 54 (45-NR) | NR | Leakage of liquid or solid stool | Telephone interview | 1,100 | NR | NR |
| Diokno et al,42 1990 | North America | 1,956 | NR (60-NR) | 59 | Not clearly defined | Face-to-face interview at home | 1,956 | 3,005 | 65.1 |
| Ditah et al,43 2014 | North America | 14,759 | 49 (20-NR) | 51.3 | At least 1-time loss of mucus, liquid, or solid stool in the past month (Fecal Incontinence Severity Index) | Face-to-face interview at home | 14,759 | 23,198 | 63.6 |
| Drossman et al,44 1993 | North America | 5,430 | 49 (15-NR) | 51 | Rome I criteria | Self-administered postal questionnaire | 5,430 | 8,250 | 65.8 |
| Edwards and Jones,45 2001 | Europe | 2,794 | NR (65-NR) | 60.6 | Any involuntary leakage of rectal contents through the anal canal | Face-to-face interview at home | 2,818 | 3,000 | 93.9 |
| Eva et al,46 2003 | Europe | 1,299 | 50 (exactly 40 or 60 years old) | 100 | Any stool leakage, several times a month or more often | Self-administered postal questionnaire | 1,336 | 2,000 | 66.8 |
| Goode et al,47 2005 | North America | 1,000 | 75 (65–106) | 50 | At least 1-time, involuntary loss of fecal material in the previous 12 mo | Face-to-face interview at home | 1,000 | NR | NR |
| Halland et al,48 2013 | Australia and Oceania | 4,815 | NR (82–87) | 100 | At least 1-time leakage of liquid or solid stool a month during the past year | Self-administered questionnaire (likely postal) | 4,815 | 7,003 | 68.8 |
| Horng et al,49 2014 | Asia | 2,715 | NR (65-NR) | 50.5 | At least 1-time loss of stool or inability to hold a bowel movement in the past year | Face-to-face interview at home | 2,715 | NR | NR |
| Ilnyckyj,50 2010 | North America | 727 | 47 (18-NR) | 50.3 | Involuntary loss of solid or liquid stool in the previous 12 mo | Telephone interview | 727 | 1,153 | 63.1 |
| Kalantar et al,51 2002 | Australia and Oceania | 642 | 45 (18-NR) | 54.2 | At least 1-time loss of liquid or solid feces in the past 12 mo | Self-administered postal questionnaire | 651 | 990 | 65.8 |
| Khan et al,52 2021 | North America | 2,503 | 46 (NR-NR) | 100 | At least 1-time loss of mucous, liquid, or solid stool monthly | Computer-assisted personal interview system | 2,503 | NR | NR |
| Kok et al,53 1992 | Europe | 625 | NR (60-NR) | 100 | Occasional involuntary loss of feces | Self-administered postal questionnaire | 625 | 1,049 | 59.6 |
| Koloski et al,54 2002 | Australia and Oceania | 2,910 | 44 (18-NR) | 51.9 | Rome I criteria | Self-administered postal questionnaire | 2,910 | 4,500 | 64.7 |
| Lam et al,55 1999 | Australia and Oceania | 618 | 56 (24–99) | 58.1 | Two of the following 3 criteria: 1) stool leakage, 2) wearing a pad to prevent soiling, or 3) frequent incontinence of flatus (>25% of the time) | Self-administered postal questionnaire | 618 | 955 | 64.7 |
| Lawrence et al,56 2008 | North America | 4,103 | 57 (25–84) | 100 | Leakage of gas, as well as solid and liquid stool (Epidemiology of Prolapse and Incontinence Questionnaire, anal incontinence: Involuntary loss of liquid or solid stool or gas, 1 or more times per month, and this loss is bothersome enough to seek treatment) | Self-administered postal questionnaire | 4,103 | 12,200 | 33.6 |
| Lim et al,57 2014 | Asia | 381 | 52 (21–86) | 52.8 | Jorge-Wexner Continence Grading Scale, Comprehensive Fecal Incontinence Questionnaire | Face-to-face interview at home | 381 | 1,000 | 38.1 |
| Lopez-Colombo et al,58 2012 | South America | 500 | 40 (NR-NR) | 61 | Rome II criteria | Face-to-face interview and questionnaire | 500 | 500 | 100 |
| Luo et al,59 2020 | Asia | 1,250 | 73 (65–92) | 56 | Involuntary loss of liquid and/or solid stool (any loss of bowel control in the past month) | Face-to-face interview | 1,250 | 1,437 | 87.0 |
| Lynch et al,60 2001 | Australia and Oceania | 717 | 45 (18–70) | 46 | At least 1-time any stool leakage per month | Self-administered postal questionnaire | 717 | 1,500 | 47.8 |
| MacLennan et al,61 2000 | Australia and Oceania | 3,010 | 44 (15–97) | 51.3 | At least 1-time any leakage of stool in the past year | Face-to-face interview at home | 3,010 | 4,400 | 68.4 |
| Markland et al,62 2016 | North America | 4,170 | NR (20–69) | 49.6 | At least 1-time leakage of mucus, liquid, and/or solid stool per month | Computer-assisted personal interview system | 4,170 | 6,150 | 67.8 |
| Matthews et al,63 2013 | North America | 64,396 | 73 (62–87) | 100 | At least 1-time leakage of liquid and/or solid stool per month | Self-administered postal questionnaire | 64,396 | 96,480 | 66.7 |
| Megabiaw et al,64 2013 | Africa | 395 | 35 (16–80) | 100 | At least 1-time, involuntary loss of fecal material in the previous 12 mo | Face-to-face interview | 395 | 405 | 97.5 |
| Meinds et al,65 2017 | Europe | 1,259 | 49 (18–85) | 54 | Rome III criteria | Internet survey, Groningen Defecation and Fecal Continence checklist | 1,642 | 3,031 | 54.2 |
| Melville et al,66 2005 | North America | 3,444 | 53 (30–90) | 100 | At least 1-time loss of liquid or solid stool per month | Self-administered postal questionnaire | 3,536 | 5,531 | 63.9 |
| Menees et al,67 2018 | North America | 71,812 | NR (18 to >65) | 59.5 | Fecal incontinence symptoms in the past week combined with fecal incontinence symptoms ever observed | Mobile app with reward system | 71,812 | 1,300,000 | 5.5 |
| Nakanishi et al,68 1997 | Asia | 1,405 | NR (65-NR) | NR | Involuntary loss of liquid or solid stool | Face-to-face interview at home | 1,405 | 1,473 | 95.4 |
| Nelson et al,69 1995 | North America | 6,959 | NR (NR-NR) | 50.4 | At least 1-time leakage of gas or solid or liquid stool in the past year | Telephone interview | 6,959 | 9,533 | 73 |
| Nygaard et al,70 2008 | North America | 1,961 | NR (20-NR) | 100 | At least 1-time leakage of solid, liquid, or mucous stool per month | Face-to-face interview at home and examination in a mobile examination center | 2,356 | 3,440 | 68.5 |
| O’Keefe et al,71 1995 | North America | 478 | 75 (65–98) | 49 | At least 1-time leakage of stool per week or use of a pad to prevent soiling | Self-administered postal questionnaire | 478 | 704 | 67.9 |
| Perry et al,72 2002 | Europe | 10,116 | NR (40-NR) | 54.2 | Any stool leakage, several times a month | Self-administered postal questionnaire | 10,116 | 14,600 | 69.3 |
| Quander et al,73 2005 | North America | 6,099 | NR (65-NR) | 61 | Loss of control of bowels in the past few months | Face-to-face interview at home | 6,099 | 7,813 | 78.1 |
| Reilly et al,74 1995 | North America | 1,535 | NR (50–90) | NR | Having problems with leakage of stool, excluding temporary illness | Self-administered postal questionnaire | 1,535 | 2,398 | 64.0 |
| Rey et al,75 2010 | North America | 1,513 | 65 (50–91) | 49.5 | Self-reported problems with leakage of stool | Self-administered postal questionnaire | 1,513 | 2,400 | 63.0 |
| Roberts et al,76 1999 | North America | 1,540 | 66 (50-NR) | 49.5 | Accidents or soiling because of the inability to control the passage of stool in the previous year | Self-administered postal questionnaire | 1,540 | 2,337 | 65.9 |
| Roig Vila et al,77 1993 | Europe | 414 | 36 (20–64) | 54.8 | Not clearly defined | Self-administered postal questionnaire | 414 | 837 | 49.5 |
| Rommen et al,78 2012 | Europe | 20,391 | 56 (30-NR) | 100 | At least 1-time leakage of any stool per week during the past month | Self-administered postal questionnaire | 20,391 | 40,955 | 49.8 |
| Rortveit et al,79 2010 | North America | 2,106 | 56 (40–69) | 100 | At least 1-time leakage of stool per month | Self-administered postal questionnaire | 2,106 | 2,817 | 74.8 |
| Santos et al,80 2014 | South America | 2,162 | 41 (NR-NR) | 55.6 | Involuntary passage of solid or liquid stool | Interview (not clearly defined) | 2,162 | NR | NR |
| Serrano Falcon et al,81 2017 | Europe | 1,000 | 75 (65–97) | 57.5 | Rome III criteria | Telephone interview (Rome III questionnaire) | 1,000 | 1,431 | 69.9 |
| Sharma et al,82 2011 | Australia and Oceania | 1,169 | 52 (18-NR) | 57.5 | Rome II criteria | Self-administered postal questionnaire and telephone interview | 1,169 | 2,000 | 58.5 |
| Siproudhis et al,83 2006 | Europe | 7,196 | 46 (15-NR) | 51.98 | At least 1-time anal leakage of gas or stool in the past 12 mo | Self-administered postal questionnaire | 7,196 | 10,000 | 72.0 |
| Sperber et al,21 2021; Jaafari et al,20 2023b | World (Sperber 2021); Europe (Jaafari 2023) | 73,076 (Sperber 2021); 2,027 (Jaafari 2023) | NR (18–65+) | 49.1 | Rome IV criteria | Online survey and face-to-face interview at home | 73,076 | NR | NR |
| Staller et al,84 2018 | North America | 51,708 | NR (NR-NR) | 100 | At least 1-time leakage of liquid or solid stool per month during the past year | Self-administered postal questionnaire | 63,195 | NR | NR |
| Stenzelius et al,85 2004 | Europe | 4,277 | 84 (75-NR) | 61.6 | Problems controlling stool during the past 3 mo | Self-administered postal questionnaire | 4,337 | 8,500 | 51 |
| Suyasa et al,86 2015 | Asia | 303 | NR (60–97) | 62 | Unable to control accidental loss of formed or solid stool in the past 3 mo | Interview (not clearly defined) | 303 | 600 | 50.5 |
| Talley et al,87 1992 | North America | 328 | NR (65–93) | NR | At least 1-time leakage of stool a week or use of a pad to prevent soiling | Self-administered postal questionnaire | 328 | 424 | 77.4 |
| Tamanini et al,88 2016 | South America | 986 | 70 (60-NR) | 64.3 | At least 1-time loss of control of bowel movements or stool in the past 12 mo | Face-to-face interview at home | 986 | 1,345 | 73.3 |
| Tamanini et al,89 2022 | South America | 1,413 | 74.5 (60-NR) | 61.8 | At least 1-time loss of control of bowel movements or stool in the past 12 mo | Face-to-face interview at home | NR | 1,413 | NR |
| Thomas et al,90 1984 | Europe | 14,844 | NR (15-NR) | 52.3 | At least 2-time leakage of feces per month | Self-administered postal questionnaire and interview (not clearly defined) | 14,844 | 16,631 | 89.3 |
| Thompson et al,91 2002 | North America | 1,149 | NR (18-NR) | 50.7 | Rome II criteria | Telephone interview | 1,149 | 10,613 | 10.8 |
| van Meegdenburg et al,92 2018 | Europe | 680 | 49 (18–80) | 100 | Rome IV criteria | Internet survey | 1,642 | 3,081 | 53.3 |
| Varma et al,93 2006 | North America | 2,106 | 56 (40 to >70) | 100 | At least 1-time leakage of stool per month | Self-administered questionnaire | 2,109 | 10,230 | 20.6 |
| Walter et al,94 2002 | Europe | 1,609 | 52 (31–76) | 53 | At least 2-time leakage of liquid or solid stool per month | Self-administered postal questionnaire | 1,610 | 2,000 | 80.5 |
| Wetle et al,95 1995 | North America | 3,809 | NR (65-NR) | 62 | Involuntary loss of control of bowels during the past few months | Face-to-face interview at home | 3,809 | 4,485 | 84.9 |
| Whitehead et al,96 2009 | North America | 4,308 | NR (20-NR) | 51.7 | At least 1-time loss of mucus, liquid, or solid stool in the past 30 d | Face-to-face interview in mobile examination centers | 4,773 | 6,719 | 71.0 |
| Whitehead et al,97 2020 | North America, Europe | 5,931 | NR (18-NR) | 50 | Rome IV criteria | Internet-based survey | 5,931 | 6,300 | 94.1 |
| Wu et al,98 2015 | North America | 7,101 | NR (50-NR) | 49.2 | At least 1-time leakage of gas, mucus, or liquid or solid stool per month | Face-to-face interview at home and examination in a mobile examination center | 7,101 | 7,994 | 88.8 |
| Yuan et al,99 2020 | Asia | 28,196 | 45 (20–99) | 100 | Any experience of uncontrollable defecation (Jorge-Wexner Score) | Questionnaire under direction of interviewer | 28,196 | 29,613 | 95.2 |
| Zeleke et al,100 2016 | Australia and Oceania | 1,517 | 72 (65–79) | 100 | Loss or leakage of well-formed or loose stool, beyond control | Self-administered postal questionnaire | 1,517 | 4,714 | 32.2 |
Abbreviation: NR, not reported.
The sample size is sometimes smaller than the number of responses because of incomplete data.
This study analyzed a subgroup of the population first described by Sperber et al (2021).21
The methods used to collect data varied among the studies. Many studies used self-administered questionnaires (n=39 [49%]) or conducted interviews (n=32 [40%]; predominantly face-to-face interviews). Three studies (4%) used questionnaires and interviews, and 6 studies (8%) administered questionnaires over the internet. The definition of FI varied considerably among studies, with only 12 (15%) reporting FI according to Rome criteria.
Risk of Bias
The overall risk of bias was low for 19 studies (24%) with 120,719 participants; moderate for 46 studies (58%) with 367,615 participants; and high for 15 studies (19%) with 40,790 participants (Table 2). The pooled prevalence of FI and heterogeneity were only slightly different when studies with a high risk of bias were excluded from the analysis (8.2% [95% CI, 6.8%−9.5%]; z=11.93; P<.001; I2=99.67%). Hence, all studies were included in the meta-analysis.
Table 2.
Risk of Bias Assessment
| Itemsa | ||||||||||||
|---|---|---|---|---|---|---|---|---|---|---|---|---|
| Study | 1 | 2 | 3 | 4 | 5 | 6 | 7 | 8 | 9 | 10 | Total score | Risk of bias |
| Adolfsson et al,22 1998 | 0 | 0 | 1 | 0 | 1 | 0 | 0 | 1 | 0 | 1 | 4 | High |
| Aitola et al,23 2010 | 1 | 1 | 1 | 0 | 1 | 1 | 1 | 1 | 1 | 1 | 9 | Low |
| AlAmeel et al24, 2010 | 0 | 1 | 1 | 0 | 0 | 1 | 0 | 1 | 0 | 1 | 5 | High |
| Alimohammadian et al,25 2014 | 0 | 1 | 1 | 0 | 1 | 1 | 0 | 1 | 1 | 1 | 7 | Moderate |
| Amaro et al,26 2009 | 0 | 1 | 1 | 1 | 1 | 0 | 0 | 1 | 0 | 1 | 6 | Moderate |
| Andy et al,27 2016 | 0 | 1 | 1 | 1 | 1 | 1 | 1 | 1 | 1 | 1 | 9 | Low |
| Bartlett et al,28 2013 | 0 | 1 | 1 | 0 | 1 | 1 | 1 | 1 | 0 | 1 | 7 | Moderate |
| Bharucha et al,29 2005 | 0 | 0 | 1 | 0 | 1 | 1 | 1 | 1 | 1 | 1 | 7 | Moderate |
| Botlero et al,30 2011 | 0 | 0 | 0 | 1 | 1 | 1 | 1 | 1 | 1 | 1 | 7 | Moderate |
| Bowling et al,31 2010 | 0 | 0 | 0 | 0 | 1 | 0 | 0 | 1 | 1 | 1 | 4 | High |
| Boyce et al,32 2006 | 1 | 1 | 1 | 0 | 1 | 1 | 1 | 1 | 1 | 1 | 9 | Low |
| Brittain et al,33 2006 | 0 | 1 | 1 | 0 | 1 | 1 | 0 | 1 | 1 | 1 | 7 | Moderate |
| Buckley and Lapitan,34 2009 | 1 | 1 | 1 | 0 | 1 | 0 | 0 | 1 | 0 | 1 | 6 | Moderate |
| Bytzer et al,35 2001 | 1 | 1 | 1 | 0 | 1 | 1 | 1 | 1 | 1 | 1 | 9 | Low |
| Chen et al,36 2003 | 0 | 0 | 0 | 1 | 1 | 1 | 0 | 1 | 0 | 1 | 5 | High |
| Coyne et al,37 2011 | 0 | 1 | 1 | 0 | 1 | 0 | 0 | 1 | 1 | 1 | 6 | Moderate |
| Damon et al,38 2006 | 1 | 1 | 1 | 0 | 1 | 1 | 1 | 1 | 1 | 1 | 9 | Low |
| de Miguel et al,39 1999 | 1 | 1 | 0 | 0 | 1 | 1 | 0 | 1 | 1 | 1 | 7 | Moderate |
| de Souza Santos and Santos,40 2011 | 1 | 0 | 1 | 0 | 1 | 0 | 0 | 1 | 0 | 1 | 5 | High |
| Denis et al,41 1992 | 1 | 0 | 0 | 0 | 1 | 0 | 0 | 1 | 1 | 1 | 5 | High |
| Diokno et al,42 1990 | 0 | 1 | 1 | 0 | 1 | 0 | 0 | 1 | 0 | 1 | 5 | High |
| Ditah et al,43 2014 | 1 | 1 | 1 | 0 | 1 | 1 | 1 | 1 | 1 | 1 | 9 | Low |
| Drossman et al,44 1993 | 1 | 0 | 1 | 0 | 1 | 1 | 1 | 1 | 1 | 1 | 8 | Moderate |
| Edwards and Jones,45 2001 | 0 | 1 | 1 | 1 | 1 | 0 | 0 | 1 | 0 | 1 | 6 | Moderate |
| Eva et al,46 2003 | 0 | 1 | 1 | 0 | 1 | 1 | 1 | 1 | 1 | 1 | 8 | Moderate |
| Goode et al,47 2005 | 0 | 0 | 0 | 0 | 1 | 1 | 0 | 1 | 0 | 1 | 4 | High |
| Halland et al,48 2013 | 0 | 0 | 0 | 0 | 1 | 1 | 0 | 1 | 1 | 1 | 5 | High |
| Horng et al,49 2014 | 1 | 1 | 1 | 0 | 0 | 1 | 0 | 1 | 0 | 1 | 6 | Moderate |
| Ilnyckyj,50 2010 | 1 | 1 | 1 | 0 | 1 | 1 | 1 | 1 | 0 | 1 | 8 | Moderate |
| Kalantar et al,51 2002 | 1 | 1 | 1 | 0 | 1 | 1 | 1 | 1 | 0 | 1 | 8 | Moderate |
| Khan et al,52 2021 | 1 | 1 | 1 | 0 | 1 | 1 | 1 | 1 | 1 | 1 | 9 | Low |
| Kok et al,53 1992 | 0 | 1 | 1 | 0 | 1 | 0 | 0 | 1 | 0 | 1 | 5 | High |
| Koloski et al,54 2002 | 1 | 1 | 1 | 0 | 1 | 1 | 1 | 1 | 1 | 1 | 9 | Low |
| Lam et al,55 1999 | 1 | 1 | 1 | 0 | 1 | 1 | 1 | 1 | 1 | 1 | 9 | Low |
| Lawrence et al,56 2008 | 0 | 1 | 1 | 0 | 1 | 1 | 1 | 1 | 1 | 1 | 8 | Moderate |
| Lim et al,57 2014 | 1 | 1 | 1 | 0 | 1 | 1 | 1 | 1 | 1 | 1 | 9 | Low |
| Lopez-Colombo et al,58 2012 | 0 | 0 | 1 | 1 | 1 | 1 | 1 | 1 | 1 | 1 | 8 | Moderate |
| Luo et al,59 2020 | 0 | 0 | 1 | 1 | 1 | 1 | 1 | 1 | 1 | 1 | 8 | Moderate |
| Lynch et al,60 2001 | 1 | 1 | 1 | 0 | 1 | 1 | 1 | 1 | 1 | 1 | 9 | Low |
| MacLennan et al,61 2000 | 1 | 1 | 1 | 0 | 1 | 1 | 0 | 1 | 0 | 1 | 7 | Moderate |
| Markland et al,62 2016 | 1 | 1 | 1 | 0 | 1 | 1 | 1 | 1 | 1 | 1 | 9 | Low |
| Matthews et al,63 2013 | 0 | 0 | 1 | 0 | 1 | 1 | 0 | 1 | 1 | 1 | 6 | Moderate |
| Megabiaw et al,64 2013 | 0 | 1 | 1 | 1 | 1 | 1 | 0 | 1 | 0 | 1 | 7 | Moderate |
| Meinds et al,65 2017 | 1 | 1 | 1 | 0 | 1 | 1 | 1 | 1 | 1 | 1 | 9 | Low |
| Melville et al,66 2005 | 0 | 1 | 1 | 0 | 1 | 1 | 1 | 1 | 1 | 1 | 8 | Moderate |
| Menees et al,67 2018 | 1 | 1 | 1 | 0 | 1 | 1 | 0 | 1 | 1 | 1 | 8 | Moderate |
| Nakanishi et al,68 1997 | 0 | 1 | 1 | 1 | 1 | 1 | 0 | 1 | 1 | 1 | 8 | Moderate |
| Nelson et al,69 1995 | 1 | 1 | 1 | 0 | 0 | 1 | 0 | 1 | 0 | 1 | 6 | Moderate |
| Nygaard et al,70 2008 | 0 | 1 | 1 | 0 | 1 | 1 | 1 | 1 | 1 | 1 | 8 | Moderate |
| O’Keefe et al,71 1995 | 0 | 1 | 1 | 0 | 1 | 1 | 1 | 1 | 1 | 1 | 8 | Moderate |
| Perry et al,72 2002 | 0 | 1 | 1 | 0 | 1 | 1 | 1 | 1 | 1 | 1 | 8 | Moderate |
| Quander et al,73 2005 | 0 | 1 | 1 | 1 | 1 | 1 | 0 | 1 | 1 | 1 | 8 | Moderate |
| Reilly et al,74 1995 | 0 | 0 | 1 | 0 | 0 | 0 | 1 | 1 | 0 | 1 | 4 | High |
| Rey et al,75 2010 | 0 | 0 | 1 | 0 | 0 | 0 | 1 | 1 | 0 | 1 | 4 | High |
| Roberts et al,76 1999 | 0 | 0 | 1 | 0 | 1 | 0 | 1 | 1 | 0 | 1 | 5 | High |
| Roig Vila et al,77 1993 | 0 | 0 | 0 | 0 | 1 | 0 | 0 | 1 | 0 | 1 | 3 | High |
| Rommen et al,78 2012 | 0 | 1 | 1 | 0 | 1 | 1 | 0 | 1 | 1 | 1 | 7 | Moderate |
| Rortveit et al,79 2010 | 0 | 0 | 1 | 1 | 1 | 1 | 0 | 1 | 1 | 1 | 7 | Moderate |
| Santos et al,80 2014 | 1 | 1 | 1 | 0 | 1 | 1 | 1 | 1 | 0 | 1 | 8 | Moderate |
| Serrano Falcon et al81, 2017 | 0 | 1 | 1 | 0 | 1 | 1 | 1 | 1 | 1 | 1 | 8 | Moderate |
| Sharma et al,82 2011 | 1 | 1 | 1 | 0 | 1 | 1 | 1 | 1 | 1 | 1 | 9 | Low |
| Siproudhis et al,83 2006 | 1 | 1 | 1 | 0 | 1 | 1 | 0 | 1 | 0 | 1 | 7 | Moderate |
| Sperber et al,21 2021 (Jaafari et al,20 2023b) | 1 | 1 | 1 | 0 | 1 | 1 | 1 | 1 | 1 | 1 | 9 | Low |
| Staller et al,84 2018 | 0 | 0 | 1 | 0 | 1 | 1 | 0 | 1 | 1 | 1 | 6 | Moderate |
| Stenzelius et al,85 2004 | 0 | 1 | 1 | 0 | 0 | 1 | 0 | 1 | 1 | 1 | 6 | Moderate |
| Suyasa et al,86 2015 | 0 | 1 | 1 | 0 | 1 | 1 | 1 | 1 | 1 | 1 | 8 | Moderate |
| Talley et al,87 1992 | 0 | 0 | 1 | 1 | 1 | 1 | 1 | 1 | 1 | 1 | 8 | Moderate |
| Tamanini et al,88 2016 | 0 | 1 | 1 | 0 | 1 | 1 | 0 | 1 | 0 | 1 | 6 | Moderate |
| Tamanini et al,89 2022 | 0 | 1 | 1 | 0 | 1 | 1 | 1 | 1 | 0 | 1 | 7 | Moderate |
| Thomas et al,90 1984 | 0 | 0 | 0 | 1 | 0 | 1 | 0 | 0 | 1 | 1 | 4 | High |
| Thompson et al,91 2002 | 1 | 1 | 1 | 0 | 1 | 1 | 1 | 1 | 1 | 1 | 9 | Low |
| van Meegdenburg et al,92 2018 | 0 | 1 | 1 | 0 | 1 | 1 | 1 | 1 | 1 | 1 | 8 | Moderate |
| Varma et al,93 2006 | 0 | 1 | 1 | 0 | 1 | 1 | 0 | 1 | 1 | 1 | 7 | Moderate |
| Walter et al,94 2002 | 0 | 0 | 1 | 1 | 1 | 1 | 0 | 1 | 1 | 1 | 7 | Moderate |
| Wetle et al,95 1995 | 0 | 0 | 1 | 1 | 1 | 1 | 0 | 1 | 1 | 1 | 6 | Moderate |
| Whitehead et al,96 2009 | 1 | 1 | 1 | 0 | 1 | 1 | 1 | 1 | 1 | 1 | 9 | Low |
| Whitehead et al,97 2020 | 1 | 0 | 1 | 1 | 1 | 1 | 1 | 1 | 1 | 1 | 9 | Low |
| Wu et al,98 2015 | 0 | 1 | 1 | 1 | 1 | 1 | 1 | 1 | 1 | 1 | 9 | Low |
| Yuan et al,99 2020 | 0 | 0 | 1 | 1 | 1 | 1 | 1 | 1 | 1 | 1 | 8 | Moderate |
| Zeleke et al,100 2016 | 0 | 1 | 1 | 0 | 1 | 1 | 1 | 1 | 1 | 1 | 8 | Moderate |
The 10 items (questions) used to assess the risk of bias are detailed in Supplement 1.
The study analyzed a subgroup of the population first described by Sperber et al (2021).21
With reference to external validity, response rates were greater than 75% for 18 studies (23%), 75% or lower in 52 studies (65%), and not reported for 10 studies (13%) (Table 1). Of the 80 studies, 51 (64%) did not ideally represent the age and/or sex distribution of the national population. Regarding the internal validity criteria, 25 studies (31%) did not precisely define FI. Moreover, the definition of FI and data collection methods varied among the studies (Table 1).
Pooled Prevalence of FI
Among the 548,316 participants, the pooled FI prevalence was 8.0% (95% CI, 6.8%−9.2%; z=13.4). Heterogeneity of the studies was high (I2=99.61%) (Figure 2). For the 102,523 participants from the 12 studies of the subgroup that reported FI according to Rome criteria, the pooled prevalence of FI was lower at 5.4% (95% CI, 3.1%−7.7%) compared with the rest of the studies at 8.5% (95% CI, 7.2%−9.9%). With the test for subgroup differences, the z value was 58.72 (P<.001). Heterogeneity remained high (Supplement 2).
Figure 2.
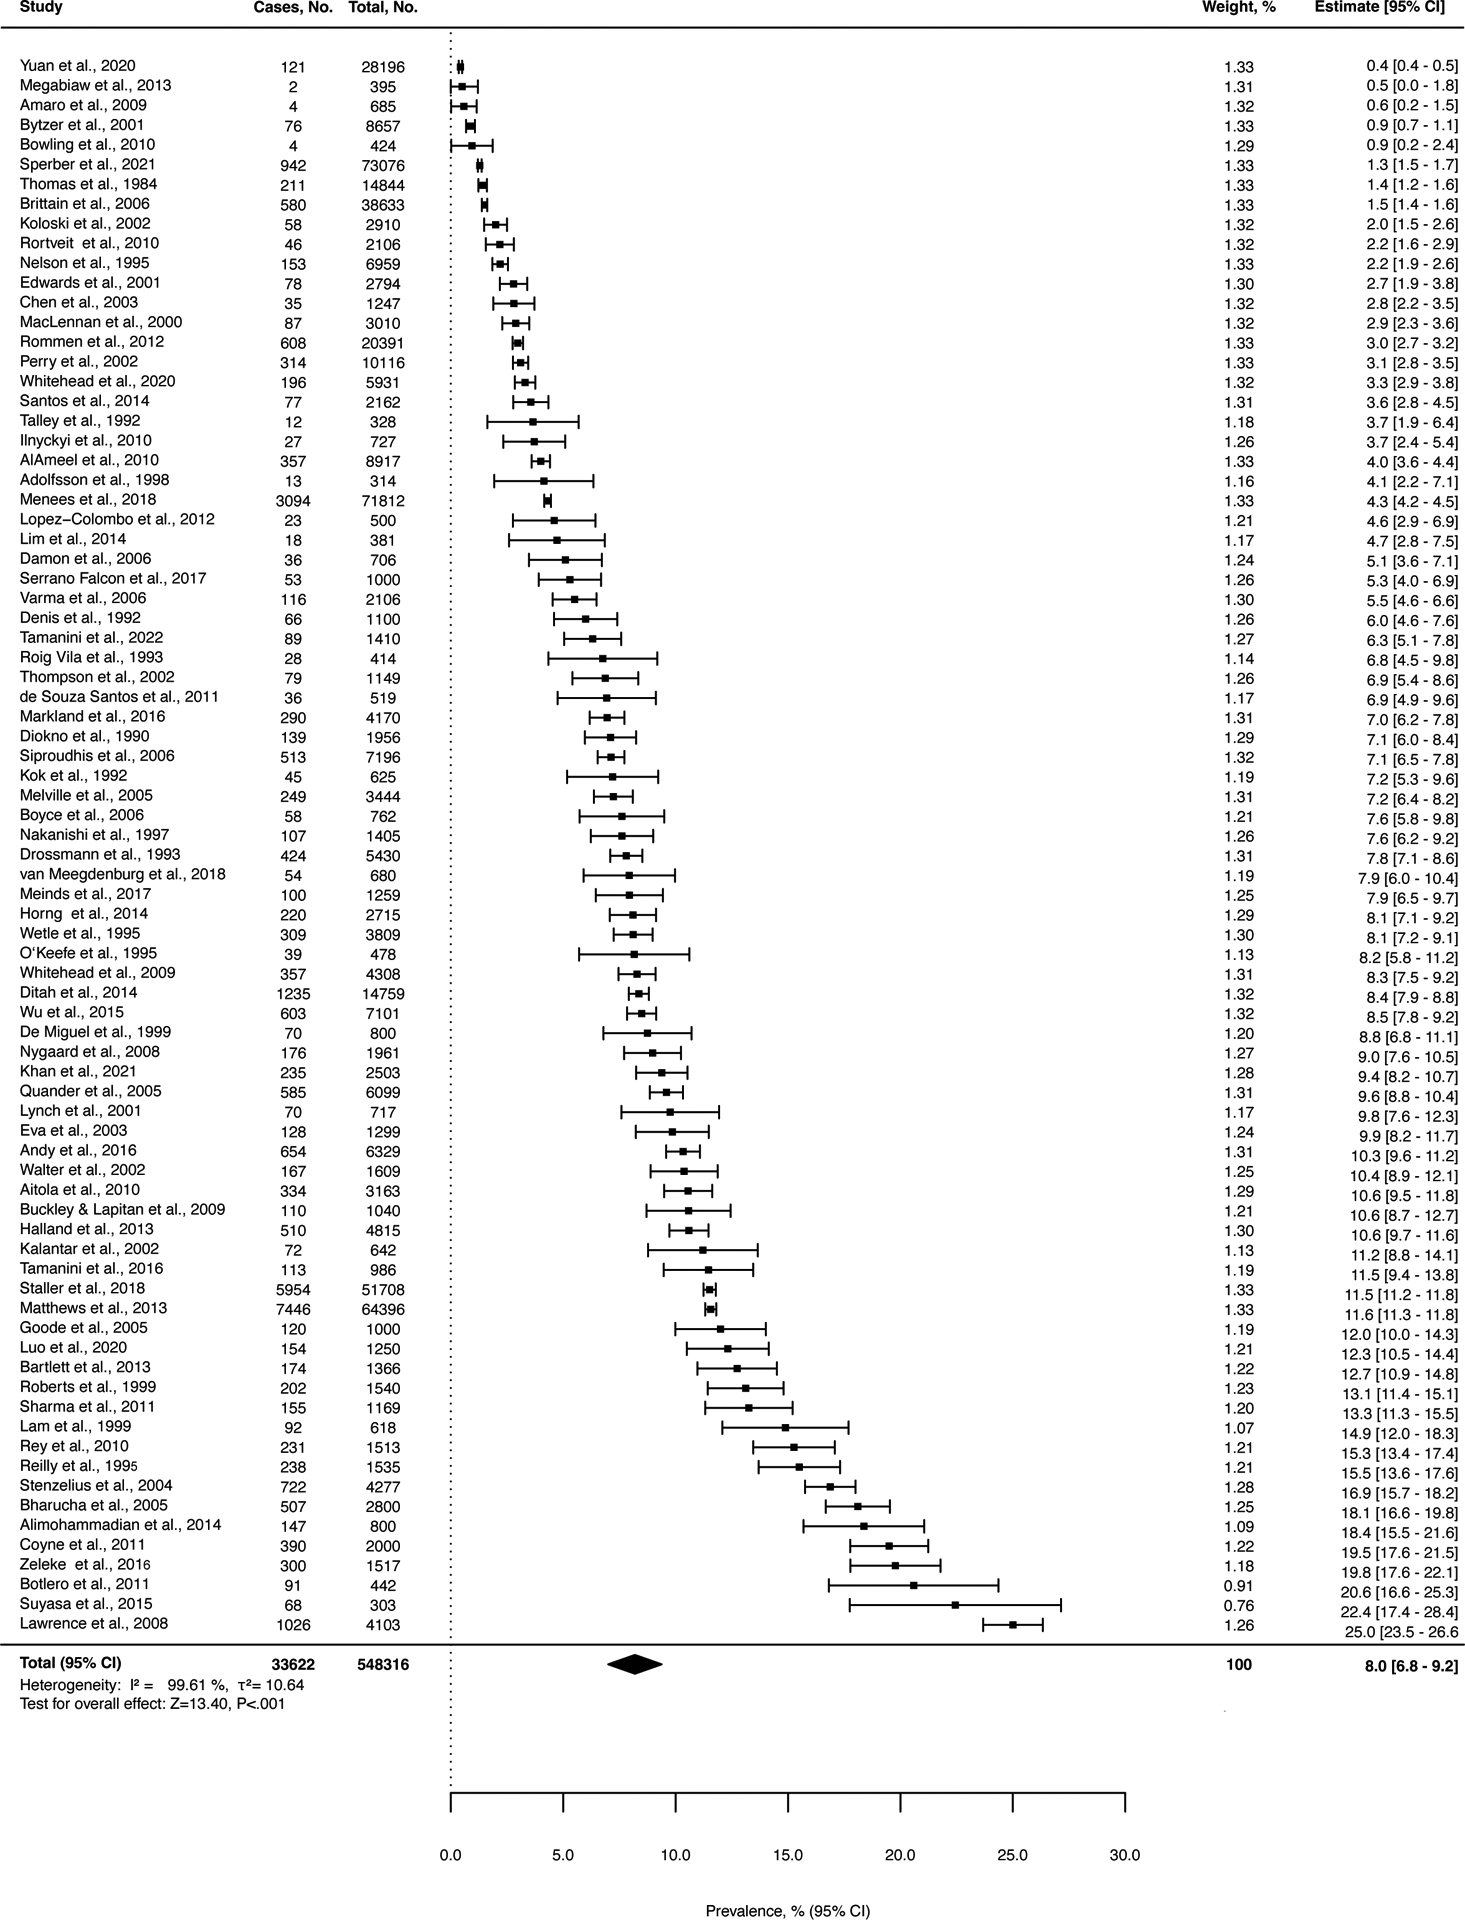
Pooled Prevalence of Fecal Incontinence Across All Studies.
Relationship Between Survey Characteristics and the Prevalence of FI
Subgroup analyses showed that the prevalence of FI was numerically greater in studies that used a mailed survey, rather than an in-person or telephone survey (Table 3, Supplement 3). Likewise, the prevalence of FI was greater when defined by a lower threshold (<1/mo), rather than a higher threshold (≥1/mo) (Table 3, Supplement 4), and when the definition included (vs excluded) flatus incontinence (Table 3, Supplement 5).
Table 3.
Relationship Between Survey Characteristics and the Prevalence of Fecal Incontinence
| Variable | Studies, No. | Prevalence (95% CI), % | z score | P value | I2, % | Statistics between respective groups |
|---|---|---|---|---|---|---|
| Participant contact during survey | z=22.39, P<.001 | |||||
| Personal contact | 33a | 6.8 (5.3–83) | 9.32 | <.001 | 99.36 | |
| No personal contact | 48a | 8.7 (7.0–10.5) | 10.01 | <.001 | 99.66 | |
| Minimum frequency of fecal incontinence | z=32.28, P<.001 | |||||
| Less than once per month | 51 | 8.7 (7.1–10.3) | 10.92 | <.001 | 99.51 | |
| Once per month or more often | 29 | 7.2 (5.3–9.0) | 7.91 | <.001 | 99.71 | |
| Anal or fecal incontinence | z=12.33, P<.001 | |||||
| Anal incontinence (including flatus) | 11 | 9.0 (3.2–14.7) | 3.52 | <.001 | 99.53 | |
| Fecal incontinence (not including flatus) | 69 | 7.9 (6.7–9.1) | 13.40 | <.001 | 99.57 |
One study assessed data either online or face-to-face, depending on the country. For details, see Supplements 3–5.
Geographic Distribution of FI
Sensitivity analyses revealed that the prevalence of FI was highest in Australia and Oceania (10.3% [95% CI, 6.2%−14.3%]; z=5.56; I2=99.06%), followed by North America (9.2% [95% CI, 7.3%−11.1%]; z=9.89; I2=99.47%), Asia (7.8% [95% CI, 1.5%−14.2%]; z=3.00; I2=98.82%), Europe (6.5% [95% CI, 4.7%−8.3%]; z=7.66; I2=98.80%), and South America (5.6% [95% CI, 0.6%−10.7%]; z=3.11; I2=97.21%). The pooled prevalence in Africa and the Middle East was not estimated because of the small sample sizes (Supplement 6).
Prevalence in Women vs Men
In a sensitivity analysis, the pooled prevalence rate for women (62 studies; n=343,818) was 9.1% (95% CI, 7.6%−10.6%; z=12.06; P<.001; I2=99.64%). The pooled prevalence rate for men (41 studies; n=124,459) was 7.4% (95% CI, 6.0%−8.8%; z=10.73; P<.001; I2=98.32%). We used the 40 studies that assessed both men and women (n=269,990) to determine the OR for FI prevalence in women vs men: OR, 1.17 (95% CI, 1.06–1.28); z=3.33; P<.001; I2=73.44% (Figure 3).
Figure 3.

Pooled Odds Ratio for Fecal Incontinence for Women vs Men.
Effects of Age
The age cutoffs varied among studies. Because the median age of onset of FI in the community is 55 years,29 for this sensitivity analysis, we categorized participants as being either younger than 60 years (19 studies; n=116,878) or 60 years and older (26 studies; n=125,159). For the younger participants, the prevalence of FI was 4.9% (95% CI, 2.9%−6.9%; z=5.15; P<.001; I2=98.50%). For the older participants, the prevalence of FI was 9.3% (95% CI, 6.6%−12.0%; z=7.03; P<.001; I2=99.47%). Among the 17 studies that included younger and older people (224,570 participants), the prevalence of FI was greater in older participants (OR, 1.75 [95% CI, 1.39–2.20]; z=5.16; P<.001; I2=86.21%) (Supplement 7).
Additional Findings From Meta-regression, Linear Regression, and the Egger Test
We performed a meta-regression based on the mean age of participants, percentage of women in the studies, and the survey response rate (Supplement 8). The included factors explained 24.4% of the overall proportion of variance. The prevalence of FI was positively associated with age (P=.001) and appeared inversely associated with the survey response rate (but the latter association was not statistically significant [P=.06]). Because of the lack of individual data, the sample size for this analysis decreased to 44 studies. The publication year of the studies had no influence on the prevalence of FI as assessed with linear regression (β=0.084; P=.23). The Egger test (z=6.5599; P<.001) and the funnel plot (Supplement 8) suggest data asymmetry, implying publication bias.
Discussion
This systematic review and meta-analysis rigorously analyzed the prevalence of FI and its relationship with age, sex, and geographic location in community-dwelling adults. Our pooled prevalence for any FI was 8.0%, which was similar to rates reported by earlier systematic reviews,8, 9 but it was greater than the estimated prevalence of FI reported by a 2006 meta-analysis.7 Our meta-analysis included 80 studies with 548,316 persons, whereas the earlier report included 29 studies with 69,152 persons.7 Furthermore, our meta-analysis rigorously assessed the studies for risk of bias and ascertained the prevalence of FI by age, sex, and geographic location.
Placed in perspective, the 8.0% prevalence of FI is lower than or similar to the global prevalence of IBS, as assessed by a meta-regression (11.2%) and by a systematic review (8.8%) using pre−Rome IV criteria, and it is 2-fold greater than the IBS prevalence assessed with Rome IV criteria.101 In contrast to an earlier systematic review,8 the current study showed that prevalence of FI was associated with age and female sex, with prevalence increasing with age (4.9% vs 9.3% for participants aged <60 vs ≥60 years). These differences are at least partly explained by age-associated declines in anorectal function (eg, lower anal resting pressure and rectal distensibility, denervation of the external anal sphincter).102–105 Among community-dwelling women, bowel disturbances are stronger risk factors for FI than anorectal dysfunction.106–108 However, the extent to which bowel disturbances contribute to the age-associated increased prevalence of FI is unclear because the key independent risk factors for FI in community-dwelling adult women (eg, idiopathic diarrhea, cholecystectomy, rectal urgency) are not associated with age.107, 108 Nevertheless, chronic constipation, which is associated with age, may contribute to the increased prevalence of FI in older persons.67
FI was more common among women than men (9.1% vs 7.4%). The greater prevalence of FI for women may be partly explained by obstetric injury to the anal sphincters and pelvic floor, lower anal resting and squeeze pressures (suggesting less functional reserve) compared with men,102, 109 and a greater prevalence of IBS compared with men.110
Although these differences in FI prevalence between men and women seem relatively small, most patients with FI who seek medical attention are women (unpublished data). We suspect that men less commonly seek medical attention for FI because they may be secretly resigned to having FI,111 because FI may have less of an emotional impact on men, and because health literacy with regard to FI is lower for men.3, 27, 102, 109, 110
Because nearly 1 in 4 community-dwelling women with FI report that the symptom has a moderate or severe impact on 1 or more domains of quality of life,112 more resources should be devoted to research in this area. Future epidemiologic studies of FI should also assess the severity of FI, risk factors for FI, and the impact of FI on quality of life. In addition, because some patients are reluctant to acknowledge or discuss FI during an in-person interview, written or internet-based surveys may be preferable.6 Even occasional FI can be bothersome, and so we suggest rephrasing survey questions to inquire about FI in the past year, rather than only in the past month. Surveys that inquire about FI only during the past month may underestimate the true prevalence of FI. Persons with FI should be asked 5 questions about the frequency, amount, type of FI (ie, solid, liquid, or both), and the presence of urgency or passive FI. Together, these questions can characterize the severity of FI.112, 113 Lastly, studies that evaluate options for preventing FI are necessary. For example, exercise and increased long-term dietary fiber intake were associated with a decreased risk of FI among older women in the Nurses’ Health Study.84 More studies that rigorously evaluate the effects and efficacy of therapeutic options for managing FI are also necessary.114
This study has several strengths and limitations. Because few studies of FI were conducted in Africa and the Middle East, the prevalence of FI in these regions could not be determined. Similar to most meta-analyses of prevalence studies, especially of diseases that are defined by symptom-based criteria (eg, IBS, chronic pain),115 our meta-analysis also showed high study heterogeneity, even though we included reports only of community-dwelling adults.101, 116 This heterogeneity is at least partly explained by age, as shown by meta-regression analysis, but differences in methodology (eg, definition of FI, data sampling methods) among studies also likely contribute to heterogeneity.8, 9
To summarize, 1 in 12 adult persons worldwide has FI. The prevalence is even greater among women and among older persons.
Supplementary Material
What You Need to Know.
Background:
Although fecal incontinence (FI) is a common and often distressing symptom, understanding of its global epidemiology is incomplete and out of date.
Findings:
One in 12 adult persons worldwide has FI. The prevalence is even greater among women and older persons.
Implications for Patient Care:
Recognizing that FI is a distressing symptom that is as prevalent as irritable bowel syndrome, clinicians should ask all of their patients, especially older women, whether they have FI.
Acknowledgments
We thank Dr Diana Mader (librarian) for helping with the generation of search terms. We also thank Miquel Bosch Bruguera for assisting with the data analyses. June Oshiro, PhD, ELS, Mayo Clinic, substantively edited the manuscript. The Scientific Publications staff at Mayo Clinic provided proofreading, administrative, and clerical support.
Grant support:
This study was supported by the National Institute of Diabetes and Digestive and Kidney Diseases grant R01 DK078924.
The funder had no role in study design, data collection and analysis, decision to publish, or preparation of the manuscript.
Abbreviations
- FI
fecal incontinence
- IBS
irritable bowel syndrome
- MOOSE
Meta-Analysis of Observational Studies in Epidemiology
- OR
odds ratio
- PRISMA
Preferred Reporting Items for Systematic Reviews and Meta-Analyses
Footnotes
Publisher's Disclaimer: This is a PDF file of an unedited manuscript that has been accepted for publication. As a service to our customers we are providing this early version of the manuscript. The manuscript will undergo copyediting, typesetting, and review of the resulting proof before it is published in its final form. Please note that during the production process errors may be discovered which could affect the content, and all legal disclaimers that apply to the journal pertain.
Conflict of interest: All authors report that they have no conflicts of interest.
Disclosures: A.E.B. jointly holds patents for an anorectal catheter fixation device (Medtronic Inc), anorectal manometry probe (Medspira Inc), and an anorectal device for fecal incontinence (Minnesota Medical Technologies), receives royalties from Medspira Inc, and received an honorarium from GI Supply Inc. P.E. reports personal fees from SymbioPharm GmbH (Herborn, Germany) and from PrecisionBiotics Ltd (Cork, Ireland).
Data availability:
Data are available from the corresponding author upon reasonable request.
References
- 1.Wald A, Bharucha AE, Limketkai B, et al. ACG Clinical Guidelines: Management of Benign Anorectal Disorders. Am J Gastroenterol. Oct 1 2021;116(10):1987–2008. doi: 10.14309/ajg.0000000000001507 [DOI] [PubMed] [Google Scholar]
- 2.Bedard K, Heymen S, Palsson OS, Bharucha AE, Whitehead WE. Relationship between symptoms and quality of life in fecal incontinence. Neurogastroenterol Motil. Mar 2018;30(3)doi: 10.1111/nmo.13241 [DOI] [PMC free article] [PubMed] [Google Scholar]
- 3.Bharucha AE, Knowles CH, Mack I, et al. Faecal incontinence. Nat Rev Dis Primers. [DOI] [PubMed] [Google Scholar]
- 4.Bharucha AE, Dunivan G, Goode PS, et al. Epidemiology, pathophysiology, and classification of fecal incontinence: state of the science summary for the National Institute of Diabetes and Digestive and Kidney Diseases (NIDDK) workshop. Am Gastroenterol. Jan 2015;110(1):127–36. doi: 10.1038/ajg.2014.396 [DOI] [PMC free article] [PubMed] [Google Scholar]
- 5.Nelson R, Furner S, Jesudason V. Fecal incontinence in Wisconsin nursing homes: prevalence and associations. Dis Colon Rectum. Oct 1998;41(10):1226–9. doi: 10.1007/BF02258218 [DOI] [PubMed] [Google Scholar]
- 6.Leigh RJ, Turnberg LA. Faecal incontinence: the unvoiced symptom. Lancet. Jun 12 1982;1(8285):1349–51. doi: 10.1016/s0140-6736(82)92413-8 [DOI] [PubMed] [Google Scholar]
- 7.Pretlove SJ, Radley S, Toozs-Hobson PM, Thompson PJ, Coomarasamy A, Khan KS. Prevalence of anal incontinence according to age and gender: a systematic review and meta-regression analysis. Int Urogynecol J Pelvic Floor Dysfunct. Jun 2006;17(4):407–17. doi: 10.1007/s00192-005-0014-5 [DOI] [PubMed] [Google Scholar]
- 8.Ng KS, Sivakumaran Y, Nassar N, Gladman MA. Fecal Incontinence: Community Prevalence and Associated Factors--A Systematic Review. Dis Colon Rectum. Dec 2015;58(12):1194–209. doi: 10.1097/DCR.0000000000000514 [DOI] [PubMed] [Google Scholar]
- 9.Sharma A, Yuan L, Marshall RJ, Merrie AE, Bissett IP. Systematic review of the prevalence of faecal incontinence. Br J Surg. Nov 2016;103(12):1589–1597. doi: 10.1002/bjs.10298 [DOI] [PubMed] [Google Scholar]
- 10.Kozak LJ, Weeks JD. U.S. trends in obstetric procedures, 1990–2000. Birth. Sep 2002;29(3):157–61. doi: 10.1046/j.1523-536x.2002.00182.x [DOI] [PubMed] [Google Scholar]
- 11.Gyhagen M, Ellstrom Engh M, Husslein H, et al. Temporal trends in obstetric anal sphincter injury from the first vaginal delivery in Austria, Canada, Norway, and Sweden. Acta Obstet Gynecol Scand. Nov 2021;100(11):1969–1976. doi: 10.1111/aogs.14244 [DOI] [PubMed] [Google Scholar]
- 12.Ehlin AG, Montgomery SM, Ekbom A, Pounder RE, Wakefield AJ. Prevalence of gastrointestinal diseases in two British national birth cohorts. Gut. Aug 2003;52(8):1117–21. doi: 10.1136/gut.52.8.1117 [DOI] [PMC free article] [PubMed] [Google Scholar]
- 13.Brummond NR, Locke GR 3rd, Choung RS, et al. Effects of Birth Cohorts on the Irritable Bowel Syndrome Support Early-Life Risk Factors. Dig Dis Sci. Jul 2015;60(7):2112–8. doi: 10.1007/s10620-015-3565-4 [DOI] [PubMed] [Google Scholar]
- 14.Liberati A, Altman DG, Tetzlaff J, et al. The PRISMA statement for reporting systematic reviews and meta-analyses of studies that evaluate healthcare interventions: explanation and elaboration. BMJ. Jul 21 2009;339:b2700. doi: 10.1136/bmj.b2700 [DOI] [PMC free article] [PubMed] [Google Scholar]
- 15.Stroup DF, Berlin JA, Morton SC, et al. Meta-analysis of observational studies in epidemiology: a proposal for reporting. Meta-analysis Of Observational Studies in Epidemiology (MOOSE) group. JAMA. Apr 19 2000;283(15):2008–12. doi: 10.1001/jama.283.15.2008 [DOI] [PubMed] [Google Scholar]
- 16.Suurmond R, van Rhee H, Hak T. Introduction, comparison, and validation of Meta-Essentials: A free and simple tool for meta-analysis. Res Synth Methods. Dec 2017;8(4):537–553. doi: 10.1002/jrsm.1260 [DOI] [PMC free article] [PubMed] [Google Scholar]
- 17.Viechtbauer W Conducting Meta-Analyses in R with the metafor Package. J Stat Softw. August/05 2010;36(3):1–48. doi: 10.18637/jss.v036.i03 [DOI] [Google Scholar]
- 18.Hoy D, Brooks P, Woolf A, et al. Assessing risk of bias in prevalence studies: modification of an existing tool and evidence of interrater agreement. J Clin Epidemiol. Sep 2012;65(9):934–9. doi: 10.1016/j.jclinepi.2011.11.014 [DOI] [PubMed] [Google Scholar]
- 19.Mogire RM, Mutua A, Kimita W, et al. Prevalence of vitamin D deficiency in Africa: a systematic review and meta-analysis. Lancet Glob Health. Jan 2020;8(1):e134–e142. doi: 10.1016/S2214-109X(19)30457-7 [DOI] [PMC free article] [PubMed] [Google Scholar]
- 20.Jaafari H, Houghton LA, West RM, et al. The national prevalence of disorders of gut brain interaction in the United Kingdom in comparison to their worldwide prevalence: Results from the Rome foundation global epidemiology study. Neurogastroenterol Motil. Jun 2023;35(6):e14574. doi: 10.1111/nmo.14574 [DOI] [PubMed] [Google Scholar]
- 21.Sperber AD, Bangdiwala SI, Drossman DA, et al. Worldwide Prevalence and Burden of Functional Gastrointestinal Disorders, Results of Rome Foundation Global Study. Gastroenterology. Jan 2021;160(1):99–114 e3. doi: 10.1053/j.gastro.2020.04.014 [DOI] [PubMed] [Google Scholar]
- 22.Adolfsson J, Helgason AR, Dickman P, Steineck G. Urinary and bowel symptoms in men with and without prostate cancer: results from an observational study in the Stockholm area. Eur Urol. 1998;33(1):11–6. doi: 10.1159/000019528 [DOI] [PubMed] [Google Scholar]
- 23.Aitola P, Lehto K, Fonsell R, Huhtala H. Prevalence of faecal incontinence in adults aged 30 years or more in general population. Colorectal Dis. Jul 2010;12(7):687–91. doi: 10.1111/j.1463-1318.2009.01878.x [DOI] [PubMed] [Google Scholar]
- 24.AlAmeel T, Andrew MK, MacKnight C. The association of fecal incontinence with institutionalization and mortality in older adults. Am J Gastroenterol. Aug 2010;105(8):1830–4. doi: 10.1038/ajg.2010.77 [DOI] [PubMed] [Google Scholar]
- 25.Alimohammadian M, Ahmadi B, Janani L, Mahjubi B. Suffering in silence: a community-based study of fecal incontinence in women. Int J Colorectal Dis. Mar 2014;29(3):401–6. doi: 10.1007/s00384-013-1809-3 [DOI] [PubMed] [Google Scholar]
- 26.Amaro JL, Macharelli CA, Yamamoto H, Kawano PR, Padovani CV, Agostinho AD. Prevalence and risk factors for urinary and fecal incontinence in Brazilian women. Int Braz J Urol. Sep-Oct 2009;35(5):592–7; discussion 598. doi: 10.1590/s1677-55382009000500011 [DOI] [PubMed] [Google Scholar]
- 27.Andy UU, Vaughan CP, Burgio KL, Alli FM, Goode PS, Markland AD. Shared Risk Factors for Constipation, Fecal Incontinence, and Combined Symptoms in Older U.S. Adults. J Am Geriatr Soc. Nov 2016;64(11):e183–e188. doi: 10.1111/jgs.14521 [DOI] [PubMed] [Google Scholar]
- 28.Bartlett LM, Nowak MJ, Ho Y. Faecal incontinence in rural and regional northern Queensland community-dwelling adults. Rural Remote Health. Oct-Dec 2013;13(4):2563. [PubMed] [Google Scholar]
- 29.Bharucha AE, Zinsmeister AR, Locke GR, et al. Prevalence and burden of fecal incontinence: a population-based study in women. Gastroenterology. Jul 2005;129(1):42–9. doi: 10.1053/j.gastro.2005.04.006 [DOI] [PubMed] [Google Scholar]
- 30.Botlero R, Bell RJ, Urquhart DM, Davis SR. Prevalence of fecal incontinence and its relationship with urinary incontinence in women living in the community. Menopause. Jun 2011;18(6):685–9. doi: 10.1097/gme.0b013e3181fee03b [DOI] [PubMed] [Google Scholar]
- 31.Bowling CB, Munoz O, Gerten KA, et al. Characterization of pelvic floor symptoms in community-dwelling women of northeastern Liberia. Int J Gynaecol Obstet. Jun 2010;109(3):251–3. doi: 10.1016/j.ijgo.2010.01.006 [DOI] [PMC free article] [PubMed] [Google Scholar]
- 32.Boyce PM, Talley NJ, Burke C, Koloski NA. Epidemiology of the functional gastrointestinal disorders diagnosed according to Rome II criteria: an Australian population-based study. Intern Med J. Jan 2006;36(1):28–36. doi: 10.1111/j.1445-5994.2006.01006.x [DOI] [PubMed] [Google Scholar]
- 33.Brittain K, Perry S, Shaw C, Matthews R, Jagger C, Potter J. Isolated urinary, fecal, and double incontinence: Prevalence and degree of soiling in stroke survivors. J Am Geriatr Soc. Dec 2006;54(12):1915–9. doi: 10.1111/j.1532-5415.2006.00987.x [DOI] [PubMed] [Google Scholar]
- 34.Buckley BS, Lapitan MC. Prevalence of urinary and faecal incontinence and nocturnal enuresis and attitudes to treatment and help-seeking amongst a community-based representative sample of adults in the United Kingdom. Int J Clin Pract. Apr 2009;63(4):568–73. doi: 10.1111/j.1742-1241.2008.01974.x [DOI] [PubMed] [Google Scholar]
- 35.Bytzer P, Talley NJ, Leemon M, Young LJ, Jones MP, Horowitz M. Prevalence of gastrointestinal symptoms associated with diabetes mellitus: a population-based survey of 15,000 adults. Arch Intern Med. Sep 10 2001;161(16):1989–96. doi: 10.1001/archinte.161.16.1989 [DOI] [PubMed] [Google Scholar]
- 36.Chen GD, Hu SW, Chen YC, Lin TL, Lin LY. Prevalence and correlations of anal incontinence and constipation in Taiwanese women. Neurourol Urodyn. 2003;22(7):664–9. doi: 10.1002/nau.10067 [DOI] [PubMed] [Google Scholar]
- 37.Coyne KS, Cash B, Kopp Z, et al. The prevalence of chronic constipation and faecal incontinence among men and women with symptoms of overactive bladder. BJU Int. Jan 2011;107(2):254–61. doi: 10.1111/j.1464-410X.2010.09446.x [DOI] [PubMed] [Google Scholar]
- 38.Damon H, Guye O, Seigneurin A, et al. Prevalence of anal incontinence in adults and impact on quality-of-life. Gastroenterol Clin Biol. Jan 2006;30(1):37–43. doi: 10.1016/s0399-8320(06)73076-7 [DOI] [PubMed] [Google Scholar]
- 39.de Miguel M, Rodriguez JM, Ortiz H, Yarnoz MC, March J, Artieda C. Prevalence of alterations in the defecatory function in the population of Navarra. Annals of the Health System of Navarra. 1999;22(Supplement 3):17–24. [Google Scholar]
- 40.de Souza Santos CR, Santos VL. [Prevalence of fecal incontinence in the urban population of Pouso Alegre, Minas Gerais, Brazil]. Rev Esc Enferm USP. Mar 2011;45(1):180–6. Prevalencia da incontinencia anal na populacao urbana de Pouso Alegre, Minas Gerais. doi: 10.1590/s0080-62342011000100025 [DOI] [PubMed] [Google Scholar]
- 41.Denis P, Bercoff E, Bizien MF, et al. [Prevalence of anal incontinence in adults]. Gastroenterol Clin Biol. 1992;16(4):344–50. Etude de la prevalence de l’incontinence anale chez l’adulte. [PubMed] [Google Scholar]
- 42.Diokno AC, Brock BM, Herzog AR, Bromberg J. Medical correlates of urinary incontinence in the elderly. Urology. Aug 1990;36(2):129–38. doi: 10.1016/0090-4295(90)80211-5 [DOI] [PubMed] [Google Scholar]
- 43.Ditah I, Devaki P, Luma HN, et al. Prevalence, trends, and risk factors for fecal incontinence in United States adults, 2005–2010. Clin Gastroenterol Hepatol. Apr 2014;12(4):636–43 e1–2. doi: 10.1016/j.cgh.2013.07.020 [DOI] [PubMed] [Google Scholar]
- 44.Drossman DA, Li Z, Andruzzi E, et al. U.S. householder survey of functional gastrointestinal disorders. Prevalence, sociodemography, and health impact. Dig Dis Sci. Sep 1993;38(9):1569–80. doi: 10.1007/BF01303162 [DOI] [PubMed] [Google Scholar]
- 45.Edwards NI, Jones D. The prevalence of faecal incontinence in older people living at home. Age Ageing. Nov 2001;30(6):503–7. doi: 10.1093/ageing/30.6.503 [DOI] [PubMed] [Google Scholar]
- 46.Eva UF, Gun W, Preben K. Prevalence of urinary and fecal incontinence and symptoms of genital prolapse in women. Acta Obstet Gynecol Scand. Mar 2003;82(3):280–6. doi: 10.1034/j.1600-0412.2003.00103.x [DOI] [PubMed] [Google Scholar]
- 47.Goode PS, Burgio KL, Halli AD, et al. Prevalence and correlates of fecal incontinence in community-dwelling older adults. J Am Geriatr Soc. Apr 2005;53(4):629–35. doi: 10.1111/j.1532-5415.2005.53211.x [DOI] [PubMed] [Google Scholar]
- 48.Halland M, Koloski NA, Jones M, et al. Prevalence correlates and impact of fecal incontinence among older women. Dis Colon Rectum. Sep 2013;56(9):1080–6. doi: 10.1097/DCR.0b013e31829203a9 [DOI] [PubMed] [Google Scholar]
- 49.Horng SS, Chou YJ, Huang N, Fang YT, Chou P. Fecal incontinence epidemiology and help seeking among older people in Taiwan. Neurourol Urodyn. Sep 2014;33(7):1153–8. doi: 10.1002/nau.22462 [DOI] [PubMed] [Google Scholar]
- 50.Ilnyckyj A Prevalence of idiopathic fecal incontinence in a community-based sample. Can J Gastroenterol. Apr 2010;24(4):251–4. doi: 10.1155/2010/894631 [DOI] [PMC free article] [PubMed] [Google Scholar]
- 51.Kalantar JS, Howell S, Talley NJ. Prevalence of faecal incontinence and associated risk factors; an underdiagnosed problem in the Australian community? Med J Aust. Jan 21 2002;176(2):54–7. [PubMed] [Google Scholar]
- 52.Khan A, Zhang N, Carolan A, Tay K, Wolter C. Evaluating the Prevalence of Pelvic Floor Disorders in Women in Nonmetropolitan Communities. Female Pelvic Med Reconstr Surg. Feb 1 2021;27(2):e295–e300. doi: 10.1097/SPV.0000000000000908 [DOI] [PubMed] [Google Scholar]
- 53.Kok AL, Voorhorst FJ, Burger CW, van Houten P, Kenemans P, Janssens J. Urinary and faecal incontinence in community-residing elderly women. Age Ageing. May 1992;21(3):211–5. doi: 10.1093/ageing/21.3.211 [DOI] [PubMed] [Google Scholar]
- 54.Koloski NA, Talley NJ, Boyce PM. Epidemiology and health care seeking in the functional GI disorders: a population-based study. Am J Gastroenterol. Sep 2002;97(9):2290–9. doi: 10.1111/j.1572-0241.2002.05783.x [DOI] [PubMed] [Google Scholar]
- 55.Lam Kennedy, Chen Lubowski, Talley. Prevalence of faecal incontinence: obstetric and constipation-related risk factors; a population-based study. Colorectal Dis. Jul 1999;1(4):197–203. doi: 10.1046/j.1463-1318.1999.00044.x [DOI] [PubMed] [Google Scholar]
- 56.Lawrence JM, Lukacz ES, Nager CW, Hsu JW, Luber KM. Prevalence and co-occurrence of pelvic floor disorders in community-dwelling women. Obstet Gynecol. Mar 2008;111(3):678–85. doi: 10.1097/AOG.0b013e3181660c1b [DOI] [PubMed] [Google Scholar]
- 57.Lim JW, Heng C, Wong MT, Tang CL. Prevalence of faecal incontinence in the community: a cross-sectional study in Singapore. Singapore Med J. Dec 2014;55(12):640–3. doi: 10.11622/smedj.2014177 [DOI] [PMC free article] [PubMed] [Google Scholar]
- 58.Lopez-Colombo A, Morgan D, Bravo-Gonzalez D, Montiel-Jarquin A, Mendez-Martinez S, Schmulson M. The epidemiology of functional gastrointestinal disorders in Mexico: a population-based study. Gastroenterol Res Pract. 2012;2012:606174. doi: 10.1155/2012/606174 [DOI] [PMC free article] [PubMed] [Google Scholar]
- 59.Luo Y, Wang K, Zou P, Li X, He J, Wang J. Prevalence and Associated Factors of Fecal Incontinence and Double Incontinence among Rural Elderly in North China. Int J Environ Res Public Health. Dec 6 2020;17(23)doi: 10.3390/ijerph17239105 [DOI] [PMC free article] [PubMed] [Google Scholar]
- 60.Lynch AC, Dobbs BR, Keating J, Frizelle FA. The prevalence of faecal incontinence and constipation in a general New Zealand population; a postal survey. N Z Med J. Oct 26 2001;114(1142):474–7. [PubMed] [Google Scholar]
- 61.MacLennan AH, Taylor AW, Wilson DH, Wilson D. The prevalence of pelvic floor disorders and their relationship to gender, age, parity and mode of delivery. BJOG. Dec 2000;107(12):1460–70. doi: 10.1111/j.1471-0528.2000.tb11669.x [DOI] [PubMed] [Google Scholar]
- 62.Markland AD, Dunivan GC, Vaughan CP, Rogers RG. Anal Intercourse and Fecal Incontinence: Evidence from the 2009–2010 National Health and Nutrition Examination Survey. Am J Gastroenterol. Feb 2016;111(2):269–74. doi: 10.1038/ajg.2015.419 [DOI] [PMC free article] [PubMed] [Google Scholar]
- 63.Matthews CA, Whitehead WE, Townsend MK, Grodstein F. Risk factors for urinary, fecal, or dual incontinence in the Nurses’ Health Study. Obstet Gynecol. Sep 2013;122(3):539–45. doi: 10.1097/AOG.0b013e31829efbff [DOI] [PMC free article] [PubMed] [Google Scholar]
- 64.Megabiaw B, Adefris M, Rortveit G, et al. Pelvic floor disorders among women in Dabat district, northwest Ethiopia: a pilot study. Int Urogynecol J. Jul 2013;24(7):1135–43. doi: 10.1007/s00192-012-1981-y [DOI] [PubMed] [Google Scholar]
- 65.Meinds RJ, van Meegdenburg MM, Trzpis M, Broens PM. On the prevalence of constipation and fecal incontinence, and their co-occurrence, in the Netherlands. Int J Colorectal Dis. Apr 2017;32(4):475–483. doi: 10.1007/s00384-016-2722-3 [DOI] [PMC free article] [PubMed] [Google Scholar]
- 66.Melville JL, Fan MY, Newton K, Fenner D. Fecal incontinence in US women: a population-based study. Am J Obstet Gynecol. Dec 2005;193(6):2071–6. doi: 10.1016/j.ajog.2005.07.018 [DOI] [PubMed] [Google Scholar]
- 67.Menees SB, Almario CV, Spiegel BMR, Chey WD. Prevalence of and Factors Associated With Fecal Incontinence: Results From a Population-Based Survey. Gastroenterology. May 2018;154(6):1672–1681 e3. doi: 10.1053/j.gastro.2018.01.062 [DOI] [PMC free article] [PubMed] [Google Scholar]
- 68.Nakanishi N, Tatara K, Naramura H, Fujiwara H, Takashima Y, Fukuda H. Urinary and fecal incontinence in a community-residing older population in Japan. J Am Geriatr Soc. Feb 1997;45(2):215–9. doi: 10.1111/j.1532-5415.1997.tb04511.x [DOI] [PubMed] [Google Scholar]
- 69.Nelson R, Norton N, Cautley E, Furner S. Community-based prevalence of anal incontinence. JAMA. Aug 16 1995;274(7):559–61. [PubMed] [Google Scholar]
- 70.Nygaard I, Barber MD, Burgio KL, et al. Prevalence of symptomatic pelvic floor disorders in US women. JAMA. Sep 17 2008;300(11):1311–6. doi: 10.1001/jama.300.11.1311 [DOI] [PMC free article] [PubMed] [Google Scholar]
- 71.O’Keefe EA, Talley NJ, Zinsmeister AR, Jacobsen SJ. Bowel disorders impair functional status and quality of life in the elderly: a population-based study. J Gerontol A Biol Sci Med Sci. Jul 1995;50(4):M184–9. doi: 10.1093/gerona/50a.4.m184 [DOI] [PubMed] [Google Scholar]
- 72.Perry S, Shaw C, McGrother C, et al. Prevalence of faecal incontinence in adults aged 40 years or more living in the community. Gut. Apr 2002;50(4):480–4. doi: 10.1136/gut.50.4.480 [DOI] [PMC free article] [PubMed] [Google Scholar]
- 73.Quander CR, Morris MC, Melson J, Bienias JL, Evans DA. Prevalence of and factors associated with fecal incontinence in a large community study of older individuals. Am J Gastroenterol. Apr 2005;100(4):905–9. doi: 10.1111/j.1572-0241.2005.30511.x [DOI] [PubMed] [Google Scholar]
- 74.Reilly WT, Talley NJ, Pemberton JH, Schleck CD, Zinsmeister AR. Fecal incontinence - Prevalence and risk factors in the community. Gastroenterology. 1995;108:A32. [Google Scholar]
- 75.Rey E, Choung RS, Schleck CD, Zinsmeister AR, Locke GR 3rd, Talley NJ. Onset and risk factors for fecal incontinence in a US community. Am J Gastroenterol. Feb 2010;105(2):412–9. doi: 10.1038/ajg.2009.594 [DOI] [PMC free article] [PubMed] [Google Scholar]
- 76.Roberts RO, Jacobsen SJ, Reilly WT, Pemberton JH, Lieber MM, Talley NJ. Prevalence of combined fecal and urinary incontinence: a community-based study. J Am Geriatr Soc. Jul 1999;47(7):837–41. doi: 10.1111/j.1532-5415.1999.tb03841.x [DOI] [PubMed] [Google Scholar]
- 77.Roig Vila JV, García García A, Flors Alandi C, Castells Ferrer P, Lledo Matoses S. [The defecation habits in a normal working population]. Rev Esp Enferm Dig. Oct 1993;84(4):224–30. Hábitos defecatorios en población laboral normal. [PubMed] [Google Scholar]
- 78.Rommen K, Schei B, Rydning A, A HS, Morkved S. Prevalence of anal incontinence among Norwegian women: a cross-sectional study. BMJ Open. 2012;2(4)doi: 10.1136/bmjopen-2012-001257 [DOI] [PMC free article] [PubMed] [Google Scholar]
- 79.Rortveit G, Subak LL, Thom DH, et al. Urinary incontinence, fecal incontinence and pelvic organ prolapse in a population-based, racially diverse cohort: prevalence and risk factors. Female Pelvic Med Reconstr Surg. Sep 2010;16(5):278–83. doi: 10.1097/SPV.0b013e3181ed3e31 [DOI] [PMC free article] [PubMed] [Google Scholar]
- 80.Santos VL, Domansky Rde C, Hanate C, Matos DS, Benvenuto CV, Jorge JM. Self-reported fecal incontinence in a community-dwelling, urban population in southern Brazil. J Wound Ostomy Continence Nurs. Jan-Feb 2014;41(1):77–83. doi: 10.1097/01.WON.0000438018.83110.88 [DOI] [PubMed] [Google Scholar]
- 81.Serrano Falcon B, Alvarez Sanchez A, Diaz-Rubio M, Rey E. Prevalence and factors associated with faecal impaction in the Spanish old population. Age Ageing. Jan 12 2017;46(1):119–124. doi: 10.1093/ageing/afw166 [DOI] [PubMed] [Google Scholar]
- 82.Sharma A, Marshall RJ, Macmillan AK, Merrie AE, Reid P, Bissett IP. Determining levels of fecal incontinence in the community: a New Zealand cross-sectional study. Dis Colon Rectum. Nov 2011;54(11):1381–7. doi: 10.1097/DCR.0b013e31822dd0f0 [DOI] [PubMed] [Google Scholar]
- 83.Siproudhis L, Pigot F, Godeberge P, Damon H, Soudan D, Bigard MA. Defecation disorders: a French population survey. Dis Colon Rectum. Feb 2006;49(2):219–27. doi: 10.1007/s10350-005-0249-8 [DOI] [PubMed] [Google Scholar]
- 84.Staller K, Song M, Grodstein F, et al. Physical Activity, BMI, and Risk of Fecal Incontinence in the Nurses’ Health Study. Clin Transl Gastroenterol. Oct 25 2018;9(10):200. doi: 10.1038/s41424-018-0068-6 [DOI] [PMC free article] [PubMed] [Google Scholar]
- 85.Stenzelius K, Mattiasson A, Hallberg IR, Westergren A. Symptoms of urinary and faecal incontinence among men and women 75+ in relations to health complaints and quality of life. Neurourol Urodyn. 2004;23(3):211–22. doi: 10.1002/nau.20030 [DOI] [PubMed] [Google Scholar]
- 86.Suyasa IG, Xiao LD, Lynn PA, Skuza PP, Paterson J. Prevalence of faecal incontinence in community-dwelling older people in Bali, Indonesia. Australas J Ageing. Jun 2015;34(2):127–33. doi: 10.1111/ajag.12141 [DOI] [PubMed] [Google Scholar]
- 87.Talley NJ, O’Keefe EA, Zinsmeister AR, Melton LJ 3rd. Prevalence of gastrointestinal symptoms in the elderly: a population-based study. Gastroenterology. Mar 1992;102(3):895–901. doi: 10.1016/0016-5085(92)90175-x [DOI] [PubMed] [Google Scholar]
- 88.Tamanini JT, de Jesus FA, Castro RA, et al. The prevalence of fecal incontinence and associated risk factors in older adults participating in the SABE study. Neurourol Urodyn. Nov 2016;35(8):959–964. doi: 10.1002/nau.22836 [DOI] [PubMed] [Google Scholar]
- 89.Tamanini JTN, Franceschi Junior O, Santos JLF, et al. Fecal incontinence: incidence and risk factors from the SABE (Health, Wellbeing and Aging) study. Int Urogynecol J. Nov 2022;33(11):2993–3004. doi: 10.1007/s00192-021-04914-8 [DOI] [PubMed] [Google Scholar]
- 90.Thomas TM, Egan M, Walgrove A, Meade TW. The prevalence of faecal and double incontinence. Community Med. Aug 1984;6(3):216–20. doi: 10.1093/oxfordjournals.pubmed.a043715 [DOI] [PubMed] [Google Scholar]
- 91.Thompson JR, Chen AH, Pettit PD, Bridges MD. Incidence of occult rectal prolapse in patients with clinical rectoceles and defecatory dysfunction. Am J Obstet Gynecol. Dec 2002;187(6):1494–9; discussion 1499–500. doi: 10.1067/mob.2002.129162 [DOI] [PubMed] [Google Scholar]
- 92.van Meegdenburg MM, Trzpis M, Broens PM. Fecal incontinence and parity in the Dutch population: A cross-sectional analysis. United European Gastroenterol J. Jun 2018;6(5):781–790. doi: 10.1177/2050640618760386 [DOI] [PMC free article] [PubMed] [Google Scholar]
- 93.Varma MG, Brown JS, Creasman JM, et al. Fecal incontinence in females older than aged 40 years: who is at risk? Dis Colon Rectum. Jun 2006;49(6):841–51. doi: 10.1007/s10350-006-0535-0 [DOI] [PMC free article] [PubMed] [Google Scholar]
- 94.Walter S, Hallbook O, Gotthard R, Bergmark M, Sjodahl R. A population-based study on bowel habits in a Swedish community: prevalence of faecal incontinence and constipation. Scand J Gastroenterol. Aug 2002;37(8):911–6. doi: 10.1080/003655202760230865 [DOI] [PubMed] [Google Scholar]
- 95.Wetle T, Scherr P, Branch LG, et al. Difficulty with holding urine among older persons in a geographically defined community: prevalence and correlates. J Am Geriatr Soc. Apr 1995;43(4):349–55. doi: 10.1111/j.1532-5415.1995.tb05806.x [DOI] [PubMed] [Google Scholar]
- 96.Whitehead WE, Borrud L, Goode PS, et al. Fecal incontinence in US adults: epidemiology and risk factors. Gastroenterology. Aug 2009;137(2):512–7, 517 e1–2. doi: 10.1053/j.gastro.2009.04.054 [DOI] [PMC free article] [PubMed] [Google Scholar]
- 97.Whitehead WE, Simren M, Busby-Whitehead J, et al. Fecal Incontinence Diagnosed by the Rome IV Criteria in the United States, Canada, and the United Kingdom. Clin Gastroenterol Hepatol. Feb 2020;18(2):385–391. doi: 10.1016/j.cgh.2019.05.040 [DOI] [PubMed] [Google Scholar]
- 98.Wu JM, Matthews CA, Vaughan CP, Markland AD. Urinary, fecal, and dual incontinence in older U.S. Adults. J Am Geriatr Soc. May 2015;63(5):947–53. doi: 10.1111/jgs.13385 [DOI] [PMC free article] [PubMed] [Google Scholar]
- 99.Yuan Y, Qiu L, Li ZY, et al. An epidemiology study of fecal incontinence in adult Chinese women living in urban areas. Chin Med J (Engl). Feb 5 2020;133(3):262–268. doi: 10.1097/CM9.0000000000000552 [DOI] [PMC free article] [PubMed] [Google Scholar]
- 100.Zeleke BM, Bell RJ, Billah B, Davis SR. Symptomatic pelvic floor disorders in community-dwelling older Australian women. Maturitas. Mar 2016;85:34–41. doi: 10.1016/j.maturitas.2015.12.012 [DOI] [PubMed] [Google Scholar]
- 101.Sperber AD. Review article: epidemiology of IBS and other bowel disorders of gut-brain interaction (DGBI). Aliment Pharmacol Ther. Dec 2021;54 Suppl 1:S1–S11. doi: 10.1111/apt.16582 [DOI] [PubMed] [Google Scholar]
- 102.Oblizajek NR, Gandhi S, Sharma M, et al. Anorectal pressures measured with high-resolution manometry in healthy people-Normal values and asymptomatic pelvic floor dysfunction. Neurogastroenterol Motil. Jul 2019;31(7):e13597. doi: 10.1111/nmo.13597 [DOI] [PMC free article] [PubMed] [Google Scholar]
- 103.Tirumanisetty P, Prichard D, Fletcher JG, Chakraborty S, Zinsmeister AR, Bharucha AE. Normal values for assessment of anal sphincter morphology, anorectal motion, and pelvic organ prolapse with MRI in healthy women. Neurogastroenterol Motil. Jul 2018;30(7):e13314. doi: 10.1111/nmo.13314 [DOI] [PMC free article] [PubMed] [Google Scholar]
- 104.Bharucha AE, Daube J, Litchy W, et al. Anal sphincteric neurogenic injury in asymptomatic nulliparous women and fecal incontinence. Am J Physiol Gastrointest Liver Physiol. Jul 15 2012;303(2):G256–62. doi: 10.1152/ajpgi.00099.2012 [DOI] [PMC free article] [PubMed] [Google Scholar]
- 105.Fox JC, Fletcher JG, Zinsmeister AR, Seide B, Riederer SJ, Bharucha AE. Effect of aging on anorectal and pelvic floor functions in females. Dis Colon Rectum. Nov 2006;49(11):1726–35. doi: 10.1007/s10350-006-0657-4 [DOI] [PubMed] [Google Scholar]
- 106.Bharucha AE, Zinsmeister AR, Locke GR, et al. Risk factors for fecal incontinence: a population-based study in women. Am J Gastroenterol. Jun 2006;101(6):1305–12. doi: 10.1111/j.1572-0241.2006.00553.x [DOI] [PubMed] [Google Scholar]
- 107.Bharucha AE, Seide BM, Zinsmeister AR, Melton LJ 3rd. Relation of bowel habits to fecal incontinence in women. Am J Gastroenterol. Jun 2008;103(6):1470–5. doi: 10.1111/j.1572-0241.2008.01792.x [DOI] [PMC free article] [PubMed] [Google Scholar]
- 108.Bharucha AE, Zinsmeister AR, Schleck CD, Melton LJ 3rd. Bowel disturbances are the most important risk factors for late onset fecal incontinence: a population-based case-control study in women. Gastroenterology. Nov 2010;139(5):1559–66. doi: 10.1053/j.gastro.2010.07.056 [DOI] [PMC free article] [PubMed] [Google Scholar]
- 109.Mazor Y, Jones M, Andrews A, Kellow JE, Malcolm A. Novel insights into fecal incontinence in men. Am J Physiol Gastrointest Liver Physiol. Jan 1 2017;312(1):G46–G51. doi: 10.1152/ajpgi.00362.2016 [DOI] [PubMed] [Google Scholar]
- 110.Enck P, Aziz Q, Barbara G, et al. Irritable bowel syndrome. Nat Rev Dis Primers. Mar 24 2016;2:16014. doi: 10.1038/nrdp.2016.14 [DOI] [PMC free article] [PubMed] [Google Scholar]
- 111.Mazor Y, Prott G, Jones M, Ejova A, Kellow J, Malcom A. Factors Associated With Response to Anorectal Biofeedback Therapy in Patients With Fecal Incontinence. Clin Gastroenterol Hepatol. Mar 2021;19(3):492–502 e5. doi: 10.1016/j.cgh.2020.03.050 [DOI] [PubMed] [Google Scholar]
- 112.Bharucha AE, Zinsmeister AR, Locke GR, Schleck C, McKeon K, Melton LJ. Symptoms and quality of life in community women with fecal incontinence. Clin Gastroenterol Hepatol. Aug 2006;4(8):1004–9. doi: 10.1016/j.cgh.2006.01.003 [DOI] [PubMed] [Google Scholar]
- 113.Noelting J, Zinsmeister AR, Bharucha AE. Validating endpoints for therapeutic trials in fecal incontinence. Neurogastroenterol Motil. Aug 2016;28(8):1148–56. doi: 10.1111/nmo.12809 [DOI] [PMC free article] [PubMed] [Google Scholar]
- 114.Bharucha AE, Gantz MG, Rao SS, et al. Comparative effectiveness of biofeedback and injectable bulking agents for treatment of fecal incontinence: Design and methods. Contemp Clin Trials. Aug 2021;107:106464. doi: 10.1016/j.cct.2021.106464 [DOI] [PMC free article] [PubMed] [Google Scholar]
- 115.Migliavaca CB, Stein C, Colpani V, et al. Meta-analysis of prevalence: I(2) statistic and how to deal with heterogeneity. Res Synth Methods. May 2022;13(3):363–367. doi: 10.1002/jrsm.1547 [DOI] [PubMed] [Google Scholar]
- 116.Mansfield KE, Sim J, Jordan JL, Jordan KP. A systematic review and meta-analysis of the prevalence of chronic widespread pain in the general population. Pain. Jan 2016;157(1):55–64. doi: 10.1097/j.pain.0000000000000314 [DOI] [PMC free article] [PubMed] [Google Scholar]
Associated Data
This section collects any data citations, data availability statements, or supplementary materials included in this article.
Supplementary Materials
Data Availability Statement
Data are available from the corresponding author upon reasonable request.