Abstract
Mapping gene networks requires large amounts of transcriptomic data to learn the connections between genes, which impedes discoveries in settings with limited data, including rare diseases and diseases affecting clinically inaccessible tissues. Recently, transfer learning has revolutionized fields such as natural language understanding1,2 and computer vision3 by leveraging deep learning models pretrained on large-scale general datasets that can then be fine-tuned towards a vast array of downstream tasks with limited task-specific data. Here, we developed a context-aware, attention-based deep learning model, Geneformer, pretrained on a large-scale corpus of ~30 million single cell transcriptomes to enable context-specific predictions in settings with limited data in network biology. During pretraining, Geneformer gained a fundamental understanding of network dynamics, encoding network hierarchy in the model’s attention weights in a completely self-supervised manner. Fine-tuning towards a diverse panel of downstream tasks relevant to chromatin and network dynamics using limited task-specific data demonstrated that Geneformer consistently boosted predictive accuracy. Applied to disease modeling with limited patient data, Geneformer identified candidate therapeutic targets for cardiomyopathy. Overall, Geneformer represents a pretrained deep learning model from which fine-tuning towards a broad range of downstream applications can be pursued to accelerate discovery of key network regulators and candidate therapeutic targets.
Mapping the gene regulatory networks that drive disease progression enables screening for molecules that correct the network by normalizing core regulatory elements, rather than targeting peripheral downstream effectors that may not be disease modifying4,5. However, mapping the gene network architecture requires large amounts of transcriptomic data to learn the connections between genes, which impedes network-correcting drug discovery in settings with limited data, including rare diseases and diseases affecting clinically inaccessible tissues. Although data remains limited in these settings, recent advances in sequencing technologies have driven a rapid expansion in the amount of transcriptomic data available from human tissues more broadly. Furthermore, single cell technologies have facilitated the observation of transcriptomic states without averaging genes’ expression across multiple cells, potentially providing more precise data for inference of network interactions, especially in diseases driven by dysregulation of multiple cell types.
Recently, the concept of transfer learning has revolutionized fields such as natural language understanding1,2 (NLU) and computer vision3 by leveraging deep learning models pretrained on large-scale general datasets that can then be fine-tuned towards a vast array of downstream tasks with limited task-specific data that would be insufficient to yield meaningful predictions when used in isolation. Unlike modeling approaches that necessitate retraining a new model from scratch for each task6,7, this approach democratizes the fundamental knowledge learned during the large-scale pretraining phase to a multitude of downstream applications distinct from the pretraining learning objective, transferring knowledge to new tasks (Fig. 1a, Extended Data Fig. 1a–b). The advent of the self-attention mechanism1,2 has further transformed the deep learning field by generating context-aware models that are able to pay attention to large input spaces and learn which elements are most important to focus on in each context, boosting predictions in a wide realm of applications2,8. Gene regulatory network architectures are highly context-dependent; and attention-based models, known as transformers, may be exceptionally suited to context-specific modeling of network dynamics.
Fig. 1 |. Geneformer architecture and transfer learning strategy.
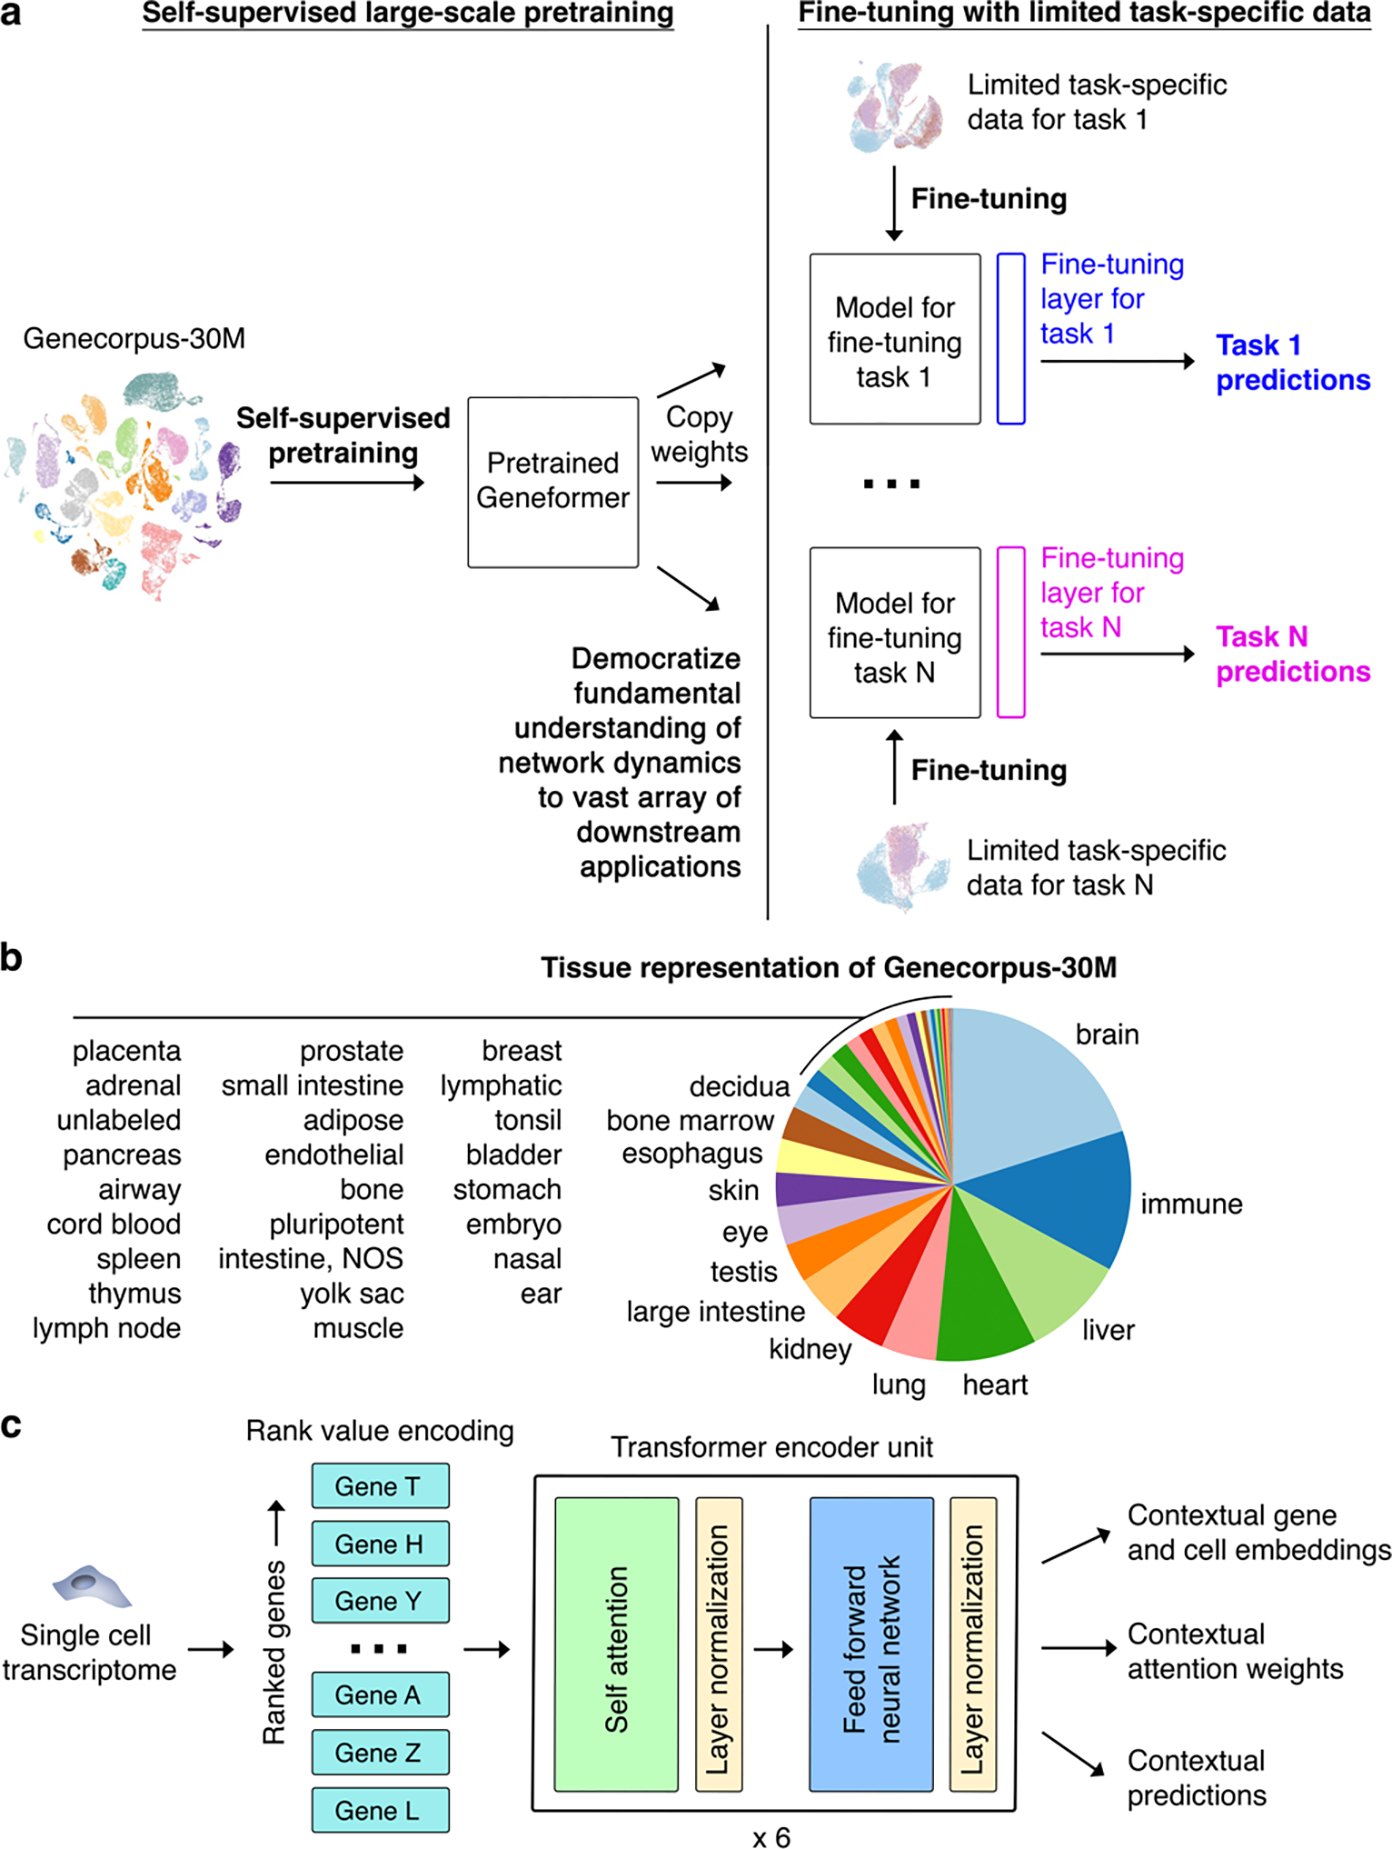
a, Schematic of transfer learning strategy with initial self-supervised large-scale pretraining, copying pretrained weights to models for each fine-tuning task, adding fine-tuning layer, and fine-tuning with limited task-specific data towards each downstream task. Through the single initial self-supervised large-scale pretraining on a generalizable learning objective, the model gains fundamental knowledge of the learning domain that is then democratized to a multitude of downstream applications distinct from the pretraining learning objective, transferring knowledge to new tasks. b, Tissue representation of Genecorpus-30M. NOS=not otherwise specified. c, Pretrained Geneformer architecture. Each single cell transcriptome is encoded into a rank value encoding that then proceeds through 6 layers of transformer encoder units with parameters: input size of 2048 (fully represents 93% of rank value encodings in Geneformer-30M), 256 embedding dimensions, 4 attention heads per layer, and feed forward size of 512. Geneformer employs full dense self-attention across the input size of 2048. Extractable outputs include contextual gene and cell embeddings, contextual attention weights, and contextual predictions.
Here, we developed a context-aware, attention-based deep learning model, Geneformer, pretrained on large-scale transcriptomic data to enable predictions in settings with limited data. We assembled a large-scale pretraining corpus, Genecorpus-30M, comprised of 29.9 million human single cell transcriptomes from a broad range of tissues from publicly available data. We then pretrained Geneformer on this corpus using a self-supervised masked learning objective to gain a fundamental understanding of network dynamics. The pretrained Geneformer accurately predicted dosage-sensitive disease genes and their downstream targets through a context-aware in silico deletion approach. Furthermore, fine-tuning Geneformer towards a diverse panel of downstream tasks relevant to chromatin and network dynamics using just a limited set of task-specific training examples demonstrated that Geneformer consistently boosted predictive accuracy. Applied to disease modeling of cardiomyopathy, Geneformer predicted candidate therapeutic targets whose experimental inhibition significantly improved cardiomyocyte contraction in an induced pluripotent stem cell (iPSC)-based model of the disease. Overall, Geneformer represents a pretrained deep learning model from which fine-tuning towards a broad range of downstream applications can be pursued to accelerate discovery of key network regulators and candidate therapeutic targets.
Geneformer architecture and pretraining
Geneformer is a context-aware, attention-based deep learning model pretrained on large-scale transcriptomic data to enable predictions in network biology with limited data through transfer learning (Fig. 1a). Geneformer harnesses the recent advent of self-attention1,2 to maintain attention over the large input space of genes expressed in each single cell’s transcriptome and learn which genes are most important to focus on to optimize predictive accuracy within the given learning objective. Importantly, network dynamics may vary across cell types, developmental timepoints, or disease states. Accordingly, context-awareness is a unique strength of Geneformer’s model architecture that allows predictions specific to each cell context.
First, we assembled a large-scale pretraining corpus, Genecorpus-30M, comprised of 29.9 million human single cell transcriptomes from a broad range of tissues from publicly available data (Fig. 1b, Supplementary Table 1). We excluded cells with high mutational burdens (e.g. malignant cells and immortalized cell lines) that could lead to substantial network rewiring without companion genome sequencing to facilitate interpretation, and we established metrics for scalable filtering to exclude possible doublets and/or damaged cells.
Each single cell’s transcriptome is then presented to the model as a novel rank value encoding where genes are ranked by their expression in that cell normalized by their expression across the entire Genecorpus-30M (Fig. 1c). Although the rank-based representation has limitations including not fully taking advantage of the precise gene expression measurements provided in transcript counts, the rank value encoding provides a nonparametric representation of each cell’s transcriptome and takes advantage of the many observations of each gene’s expression across Genecorpus-30M to prioritize genes that distinguish cell state. Specifically, this method will deprioritize ubiquitously highly expressed housekeeping genes by normalizing them to a lower rank. Conversely, genes such as transcription factors that may be lowly expressed when they are expressed but highly distinguish cell state will move to a higher rank within the encoding (Extended Data Fig. 1c). Furthermore, this rank-based approach may be more robust against technical artifacts that may systematically bias the absolute transcript counts value while the overall relative ranking of genes within each cell remains more stable.
The rank value encoding of each single cell’s transcriptome then proceeds through six transformer encoder units1,2, each composed of a self-attention layer and feed forward neural network layer (Fig. 1c). Pretraining was accomplished using a masked learning objective, which has been shown in other informational fields1,2 to improve generalizability of the foundational knowledge learned during pretraining for a wide range of downstream fine-tuning objectives. During pretraining, 15% of the genes within each transcriptome were masked, and the model was trained to predict which gene should be within each masked position in that specific cell state using the context of the remaining unmasked genes (Extended Data Fig. 1d–f). A major strength of this approach is that it is entirely self-supervised and can be accomplished on completely unlabeled data, which allows the inclusion of large amounts of training data without being restricted to samples with accompanying labels. We implemented recent advances in distributed GPU training9,10 to allow efficient pretraining on the large-scale dataset.
Context-awareness and batch integration
For each single cell transcriptome presented to Geneformer, the model embeds each gene into a 256-dimensional space that encodes the gene’s characteristics specific to the context of that cell. We first tested whether the pretrained Geneformer’s embedding of genes was impacted by common batch-dependent technical artifacts. We found that the gene embeddings were robust to sequencing platform11, preservation method12,13, and individual patient variability14 (Extended Data Fig. 2a). However, gene embeddings were dependent on the context of other genes expressed in the cell, highlighting Geneformer’s context awareness. When we in silico reprogrammed fibroblasts15 by artificially adding OCT4, SOX2, KLF4, and MYC to the front of their rank value encodings, the remaining genes in the transcriptome significantly shifted their embedding towards the iPSC state (Extended Data Fig. 2b–c). Embeddings of genes in iPSC-derived myogenic cells16 showed similar context awareness with in silico differentiation via MYOD (Extended Data Fig. 2d–e). Furthermore, genes known to be highly context-dependent, such as NOTCH receptors, showed more variability in their embeddings across variable cell types14 compared to the known housekeeping gene GAPDH (Extended Data Fig. 3).
Next, we integrated the embeddings of genes expressed in each cell to generate cell-level embeddings, which encode characteristics of that single cell’s state. Using a publicly available aortic aneurysm dataset14 as a test case, we found that while the original data was impacted by inter-patient variability, Geneformer cell embeddings clustered primarily by cell type and phenotype as opposed to individual patient (Extended Data Fig. 4a). Given that the pretrained Geneformer’s cell embeddings were robust to these technical artifacts, we next tested whether fine-tuning would impact generalizability. Using a publicly available dataset11 of iPSC differentiation to cardiomyocytes assayed in parallel on the Drop-seq (single-cell) or DroNc-seq (single-nucleus) platform, we tested whether fine-tuning the model to distinguish cell types using data from one platform would reduce generalizability to cells assayed on the other platform. Interestingly, the fine-tuned Geneformer’s cell embeddings primarily clustered by cell types and showed improved integration of platforms compared to the original data even after batch effect removal using the ComBat17 or Harmony18 methods (Extended Data Fig. 4b–f).
Although Geneformer is most focused on understanding network dynamics rather than cell-level annotations, we further investigated Geneformer’s performance in cell type annotation given it is a common application for previously published models. We compared Geneformer to alternative XGBoost7 and deep neural network-based6 models. These methods train a new model from scratch for each separate tissue using the same supervised learning objective as is used for the final cell type predictions in that specific tissue. Therefore, these approaches do not take advantage of the large amounts of data available more broadly that are not specifically labeled for that task. In contrast, Geneformer learns from large-scale unlabeled data during the self-supervised pretraining using a generalizable learning objective to gain fundamental knowledge that can then be transferred to a multitude of new and diverse fine-tuning tasks. Compared to these alternative methods, Geneformer boosted cell type predictions in a variety of tissues, with the gap in performance by accuracy and macro F1 score increasing as the number of cell type classes increased, indicating that Geneformer was robust in even increasingly complex multiclass prediction applications (Extended Data Fig. 5–6).
Gene dosage sensitivity predictions
We next tested whether Geneformer could boost predictions with limited data in a diverse set of downstream fine-tuning applications (Supplementary Table 2). A major challenge of interpreting copy number variants (CNVs) in genetic diagnosis is determining which genes are sensitive to changes in their dosage. Although conservation and allele frequency are commonly used to predict dosage sensitivity, these features do not vary across cell states and do not capture transcriptional dynamics that may inform contextual dosage sensitivity indicating which specific tissues would be affected by changes in the gene’s dosage. Using gene sets previously reported19–21 to be dosage-sensitive versus -insensitive, we fine-tuned Geneformer using only 10,000 random single cell transcriptomes to distinguish dosage-sensitive versus -insensitive transcription factors. The fine-tuned Geneformer significantly boosted the ability to predict dosage sensitivity compared to alternative methods (area under the receiver operating characteristic curve (AUC) 0.91) (Fig. 2a, Extended Data Fig. 7a). Notably, pretraining with larger and more diverse corpuses consistently improved the predictive power in the downstream task despite using the same amount of limited task-specific data for fine-tuning (Fig. 2b).
Fig. 2 |. Geneformer boosted predictions of gene dosage sensitivity with limited data.
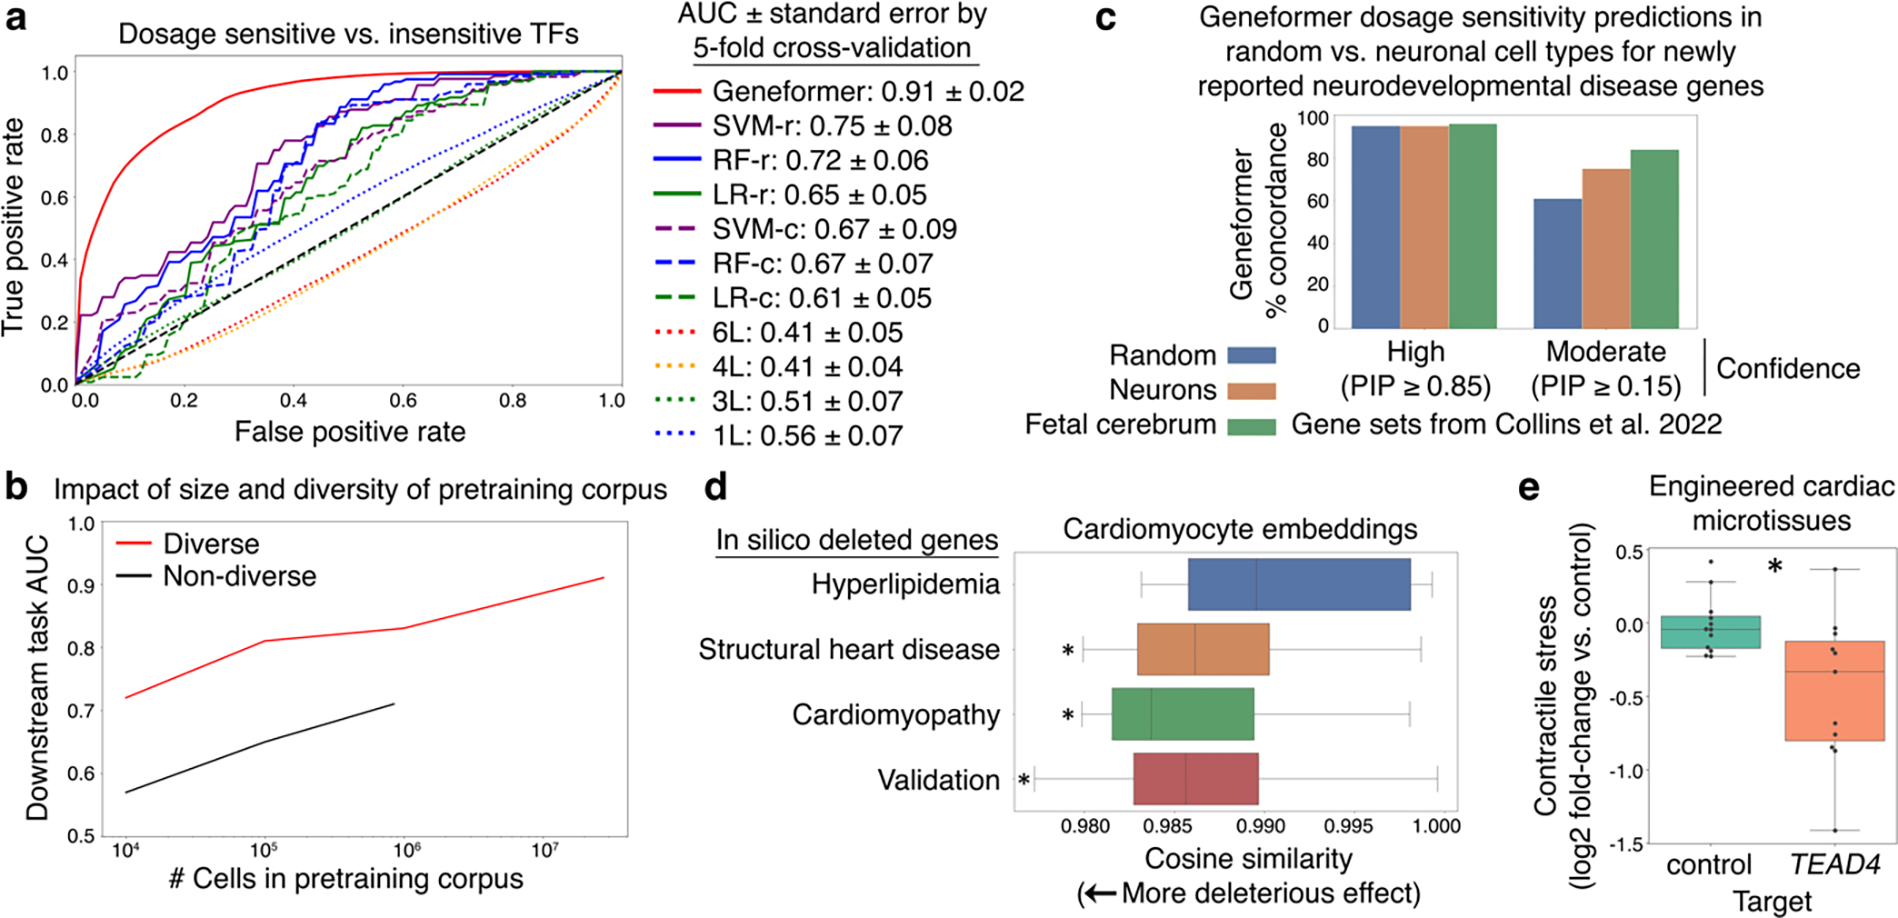
a, ROC curve of Geneformer fine-tuned to distinguish dosage-sensitive versus -insensitive transcription factors (TFs) using limited data (10,000 cells) compared to alternative methods: support vector machine (SVM), random forest (RF), or logistic regression (LR) trained on gene ranks (-r) or counts (-c) or non-pretrained attention-based models with the same architecture as Geneformer (6 layers (L)) or shallower (4, 3, or 1L) with retained depth-to-width aspect ratios. b, Larger and more diverse pretraining corpuses improved predictive potential in downstream task of distinguishing dosage-sensitive versus -insensitive TFs using the same limited task-specific data (10,000 cells). Diverse corpuses were randomly sampled from Genecorpus-30M, whereas non-diverse corpuses were randomly sampled from an esophageal dataset45. c, Fine-tuned Geneformer’s contextual dosage sensitivity predictions in (i) random cell types, (ii) neurons (including adult), and (iii) fetal cerebrum for neurodevelopmental disease genes newly reported by Collins et al. 2022. Authors reported either high or moderate confidence gene sets with the indicated posterior inclusion probability (PIP) scores. d, In silico deletion of genes associated with disease driven by cardiomyocyte pathology (cardiomyopathy and structural heart disease) had a more deleterious effect on cardiomyocyte embeddings compared to control cardiac disease genes expressed in cardiomyocytes but whose pathology occurs in non-cardiomyocyte cell types (hyperlipidemia). Validation with experimental data from patients with cardiomyopathy (see Fig. 6) demonstrated that in silico deletion of genes distinguishing the cardiomyopathy state was also predicted to be more deleterious than in silico deletion of control genes. (*p<0.05 Wilcoxon, FDR-corrected; points=outliers). e, Contractile stress (force per unit area) of cardiac microtissues derived from WT iPSCs, exposed to either control treatment or guides promoting CRISPR-mediated knockout of Geneformer-predicted dosage-sensitive gene TEAD4. (control n=12, TEAD4 n=11; p<0.05 Wilcoxon; points=replicates). In (d-e): center line=median, box limits=upper and lower quartiles, whiskers=1.5x interquartile range.
We then asked whether, without any further training, the fine-tuned model could predict the dosage sensitivity of a recently reported set of disease genes (Fig. 2c). Collins et al. analyzed CNVs from 753,994 individuals to define genes whose deletion was associated with primarily neurodevelopmental disease with either high or moderate confidence22. The fine-tuned Geneformer model correctly predicted the high confidence genes to be dosage-sensitive in the specific context of fetal cerebral cells with 96% concordance with the original study. The moderate confidence genes reported by the authors were a much more permissive set (0.15–0.85 score vs. high confidence score cutoff >0.85). The fine-tuned Geneformer predicted moderate confidence genes to be dosage-sensitive in fetal cerebral cells with 84% concordance with the original study. Interestingly, although the high confidence genes, which may have a stronger effect, were predicted by Geneformer to be dosage-sensitive at similar rates in fetal cerebral (96%) and other cells (95%), the predicted dosage sensitivity of the moderate confidence genes appeared to be more context-specific. The moderate confidence genes were predicted to be dosage-sensitive at a higher rate in fetal cerebral cells compared to neurons across any adult or developmental timepoint, consistent with these genes’ association with predominantly neurodevelopmental phenotypes where adult neurons may be less relevant. They were predicted to be dosage-sensitive at an even lower rate in random cells from any tissue, highlighting Geneformer’s context awareness.
We then designed an in silico deletion approach to identify genes whose deletion is predicted to have a deleterious effect in that particular cell context. We model gene deletion by removing the gene from the cell’s rank value encoding and quantifying the impact on the embeddings of the remaining genes in the encoding. To test this approach, we performed in silico deletion in fetal cardiomyocytes23 using the pretrained Geneformer without any fine-tuning. In silico deletion of known cardiomyopathy and structural heart disease genes had a significantly larger effect than the control set of known hyperlipidemia genes, which are expressed in cardiomyocytes and related to heart disease but whose phenotype affects cell types other than cardiomyocytes (Fig. 2d). In silico deletion of genes linked by a prior genome-wide association study24 (GWAS) to cardiac magnetic resonance imaging (MRI) traits relevant to cardiac disease also had a larger effect compared to the control set (Extended Data Fig. 7b).
Overall, genes whose deletion was predicted to have the most deleterious effect on cardiomyocytes were significantly enriched for human phenotypes including cardiomyopathy and abnormal myocardial morphology (Supplementary Table 3–4). Among the top 25 deleted genes with the most significant effect were transcription factors known to regulate myocardial development (e.g. FOXM125,26) and entirely novel dosage-sensitive gene candidates such as TEAD4 (Supplementary Table 3). Experimental validation demonstrated that CRISPR-mediated knockout of novel candidate TEAD4 in iPSC-derived cardiac microtissues caused a significant reduction in their ability to generate contractile stress (force per unit area) (Fig. 2e, Extended Data Fig. 7c). TEAD4 is a transcription factor involved in the Hippo signaling pathway27, and future work is warranted to further examine its role in cardiac development.
Chromatin dynamics predictions
Bivalent chromatin structure is known to mark key developmental genes in embryonic stem cells (ESCs), maintaining their promoters poised for activation28. Bivalent domains consist of large regions of H3K27me3 harboring smaller regions of H3K4me3. We fine-tuned Geneformer to distinguish bivalently marked genes from those whose promoters were unmethylated or marked solely by H3K4me3 using transcriptomes from ~15,000 ESCs29. The labeled gene set used for this fine-tuning included only genes found in 56 conserved regions of the genome, as previously reported28. Geneformer significantly boosted the ability to predict bivalently marked genes compared to alternative methods (AUC 0.93 and 0.88; bivalent versus unmethylated or H3K4me3-only, respectively) (Fig. 3a–b, Extended Data Fig. 7d–e). Furthermore, predictions were generalizable to the remainder of the genome that was excluded from fine-tuning (Fig. 3c, Extended Data Fig. 8a–c). Thus, by fine-tuning Geneformer using solely transcriptional data with only 56 labeled loci in ~15,000 ESCs, the model could predict the results of more recent studies30 that included genome-wide profiling of bivalent domains.
Fig. 3 |. Geneformer boosted predictions of chromatin dynamics with limited data.
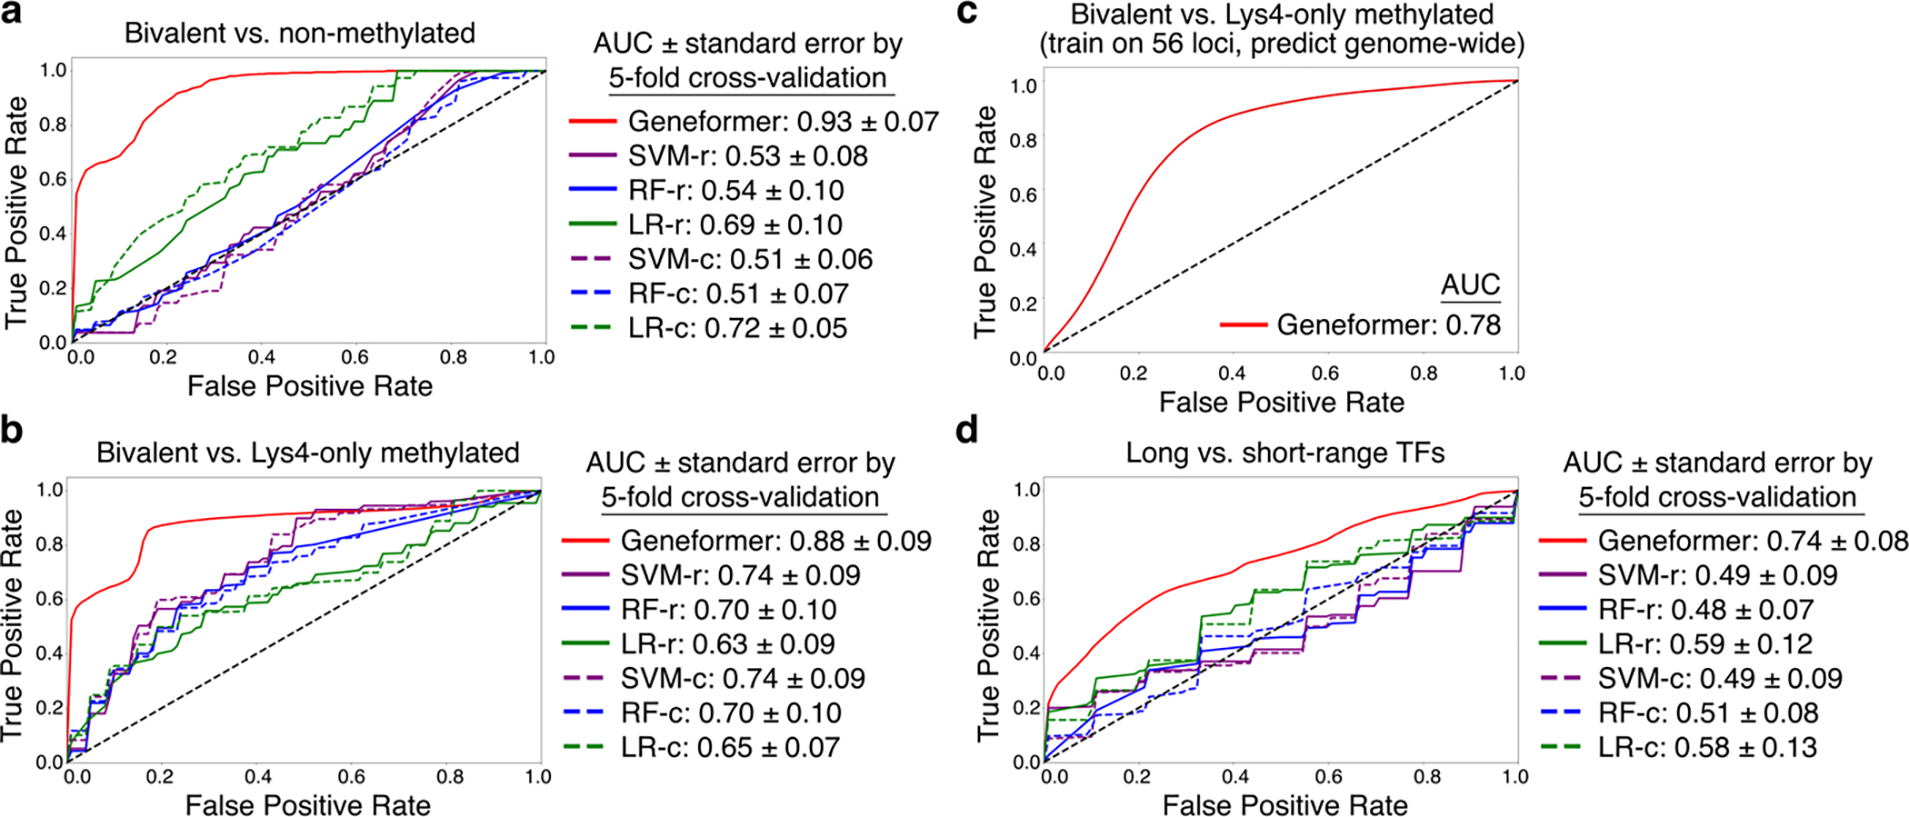
a-b, ROC curve of Geneformer fine-tuned to distinguish bivalent vs. (a) non-methylated or (b) Lys4-only-methylated genes in 56 conserved loci from Bernstein et al. Cell 2006 using limited data (~15K ESCs), compared to alternative methods. c, ROC curve of Geneformer’s genome-wide predictions of bivalent vs. Lys4-only-methylated genes after fine-tuning on only 56 loci as in (b). d, ROC curve of Geneformer fine-tuned to distinguish long- vs. short-range TFs using limited data (~38K cells from iPSC to cardiomyocyte differentiation), compared to alternative methods. (Alternative methods described in Fig. 2.)
Determining the genomic distances over which transcription factor binding influences downstream expression is valuable for interpreting regulatory variants and inferring target genes from transcription factor genome occupancy data. Chen et al. previously systematically integrated thousands of transcription factor binding and histone modification profiles assayed by chromatin immunoprecipitation sequencing (ChIP-seq) with thousands of gene expression profiles to identify two classes of transcription factors with distinct ranges of regulatory influence31. We fine-tuned Geneformer to distinguish these long- versus short-range transcription factors using only single cell transcriptomes from ~34,000 cells undergoing iPSC to cardiomyocyte differentiation11 with no associated ChIP-seq or genomic distance data. Again, Geneformer significantly boosted the ability to predict the regulatory range of transcription factors compared to alternative methods, whose predictions were near random (Fig. 3e, Extended Data Fig. 8d). Thus, fine-tuning the pretrained Geneformer model was able to improve predictions even for this higher-order transcription factor property of regulatory range, a particularly challenging characteristic to infer from transcriptional data alone.
Network dynamics predictions
Determining the hierarchy in gene networks enables the design of therapies targeting normalization of core regulatory elements that drive the disease process, rather than correction of peripheral downstream effectors that may not be disease modifying. We previously mapped the NOTCH1 (N1)-dependent gene network governing cardiac valve disease and identified central regulatory nodes whose correction had broad restorative impact on the network at large4,5. Mapping the network hierarchy required large amounts of transcriptional perturbation data from patient-specific cells with isogenic controls to learn the connections between genes.
We tested whether Geneformer could be fine-tuned to distinguish central versus peripheral factors within the N1-dependent gene network using only single cell transcriptional data from ~30,000 normal endothelial cells (ECs) from the Heart Atlas32 without any perturbation data. Again, Geneformer significantly boosted the ability to predict central versus peripheral factors compared to alternative methods (AUC 0.81) (Fig. 4a, Extended Data Fig. 8e). Additionally, fine-tuning the pretrained Geneformer on the Heart Atlas ECs32 was able to distinguish N1 downstream targets from non-targets without any perturbation data, further demonstrating the model’s ability to encode key features of gene network dynamics and again significantly boosting predictions compared to alternative methods (Fig. 4b, Extended Data Fig. 9a).
Fig. 4 |. Geneformer encoded gene network hierarchy.
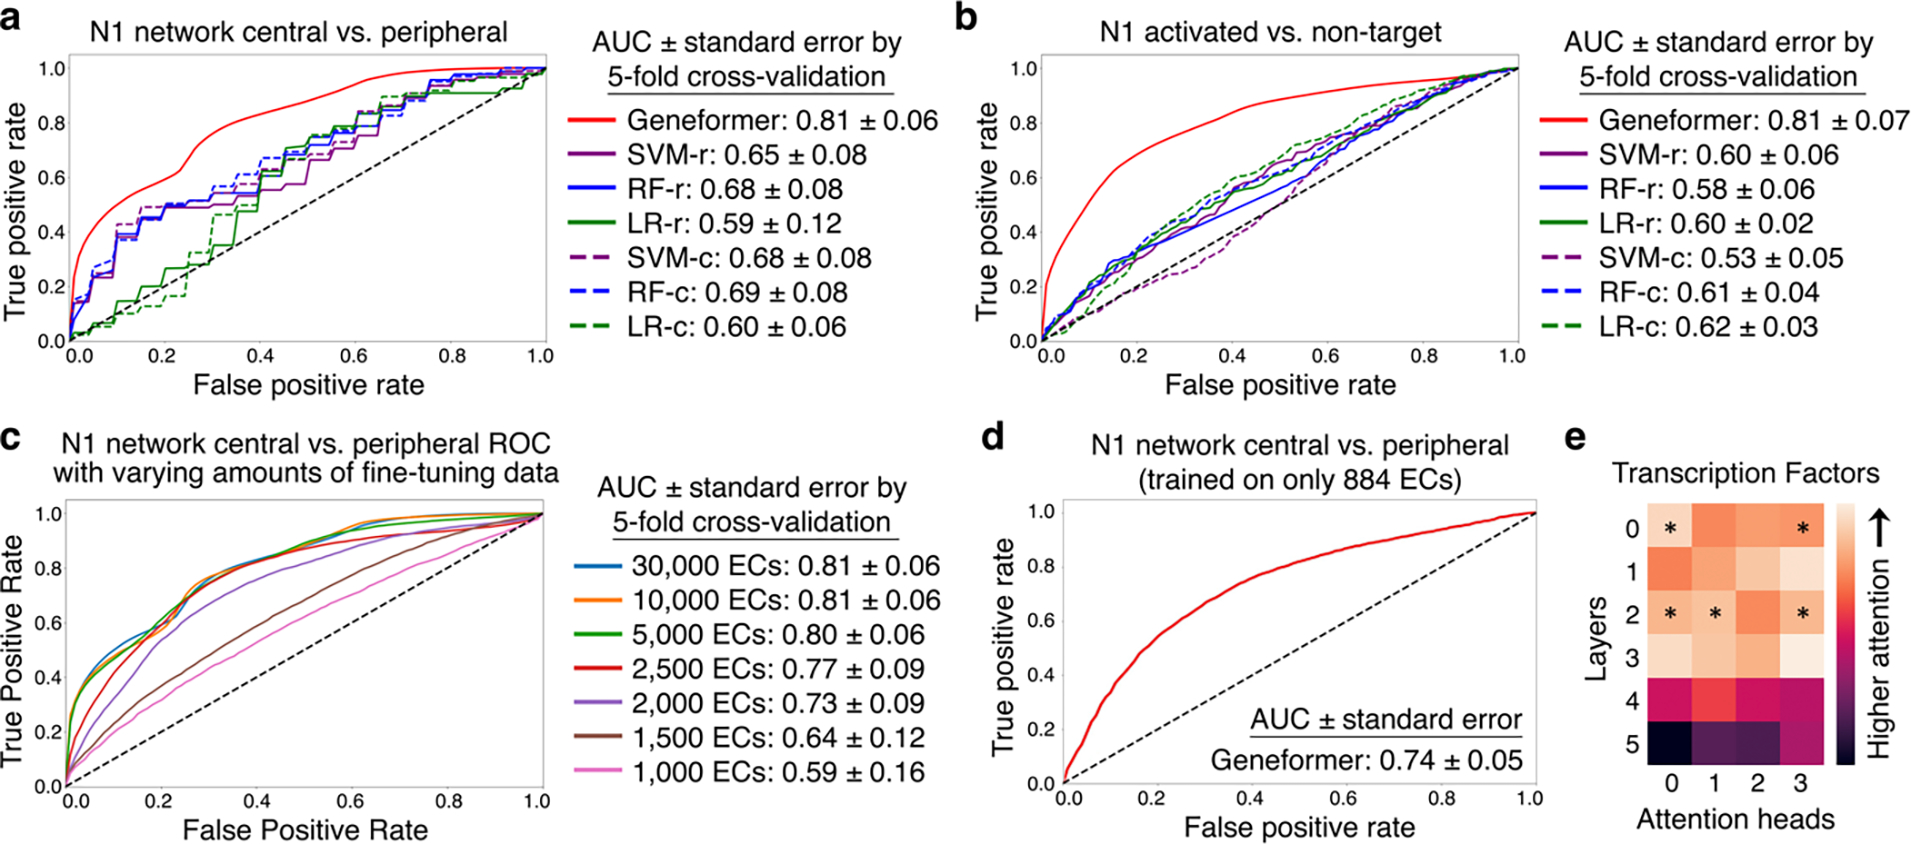
a, ROC curve of Geneformer fine-tuned to distinguish central versus peripheral genes within the N1-dependent gene network using limited data (~30K ECs), compared to alternative methods. b, ROC curve of Geneformer fine-tuned to distinguish N1 activated versus non-target genes using limited data (~30K ECs), compared to alternative methods. c, ROC curve of Geneformer fine-tuned to distinguish central versus peripheral genes within the N1-dependent gene network using increasingly limited data (1K-30K ECs). d, ROC curve of Geneformer fine-tuned to distinguish central versus peripheral genes within the N1-dependent gene network using increasingly limited but more relevant data (884 ECs from healthy or dilated aortas). AUC was higher than alternative methods trained on larger dataset of ~30K ECs (Fig. 3a). e, Pretrained Geneformer attention weights of transcription factors indicated that the model learned in a completely self-supervised way the relative importance of transcription factors, which were more highly attended than other genes in 20% of attention heads (p<0.05, Wilcoxon rank sum, FDR correction) and were more attended in earlier layers (p<0.05, Wilcoxon rank sum). (Alternative methods described in Fig. 2.)
To investigate the threshold for minimal data needed for fine-tuning, we fine-tuned the pretrained Geneformer with progressively smaller numbers of normal ECs from the Heart Atlas32 to distinguish central versus peripheral factors within the N1-dependent gene network. We found that nearly equivalent predictive potential was retained even when reducing the fine-tuning data to only 5,000 ECs (Fig. 4c). Then, to determine whether Geneformer could generate meaningful predictions using an even more miniscule number of fine-tuning training examples when the task-specific data was more relevant to the learning objective, we fine-tuned the pretrained Geneformer using only 884 ECs from healthy versus dilated aortas14. Interestingly, Geneformer was able to distinguish central versus peripheral factors in the N1-dependent network with fine-tuning on this very minimal data to a better degree than the alternative methods’ predictions trained on the larger dataset of ~30,000 ECs32, demonstrating the strength of pretraining in enabling predictions from increasingly limited data (Fig. 4d, Extended Data Fig. 9b). More than twice as many general cardiac ECs were needed to gain similar predictive potential as was possible from fine-tuning with the more relevant data from healthy versus dilated aortas, suggesting that the minimum amount of fine-tuning data needed is dependent on both the specific application and relevance of the data to that task.
Pretraining encoded network hierarchy
To investigate how the model was learning network dynamics during the pretraining stage, we examined the pretrained Geneformer attention weights. The trained attention weights of the model for each gene reflect 1) which genes that gene pays attention to and 2) which genes pay attention to that gene. These attention weights are iteratively optimized during training to generate gene embeddings that best inform the correct answer for the given learning objective. Each of Geneformer’s six layers has four attention heads that are meant to learn in an unsupervised manner to pay attention to distinct classes of genes to jointly improve predictions without prior knowledge of any gene’s biological function.
When examining the attention weights in aortic ECs14, we found that 20% of attention heads significantly attended transcription factors more than other genes, indicating that specific attention heads learned, in an entirely self-supervised manner, the relative importance of transcription factors in distinguishing cell states (Fig. 4e). Furthermore, specific attention heads significantly attended central regulatory nodes to a greater degree than peripheral genes within N1-dependent network in ECs (Extended Data Fig. 9c). Concordantly, these centrality-driven attention heads consistently attended to a significantly greater degree the highest ranked genes in each cell’s unique rank value encoding in aortic ECs, smooth muscle cells, T cells, and macrophage/monocyte/dendritic cells (which each have different sets of highest ranked genes based on cell type context) (Extended Data Fig. 9d).
Interestingly, attention heads in the earliest layers were consistently the most diverse in terms of gene ranks they attended, suggesting the model initially orients to the observed cell state through a joint survey of distinct portions of the input space. The middle layers were most broad in terms of gene ranks they attended, and the final layers were dominated by centrality-driven attention heads that focused on the highest ranked genes that uniquely define each cell state (Extended Data Fig. 9c–d).
In silico gene network analysis
Given the gene embeddings reflect the joint output of the attention weights of the network, we tested whether the pretrained Geneformer already encoded network connections between transcription factors and their targets prior to fine-tuning. We determined the genes whose embeddings in fetal cardiomyocytes23 were most impacted by in silico deletion of GATA4, a known congenital heart disease gene. In silico deletion of GATA4 had a significantly higher effect on genes known to be most significantly dysregulated by GATA4 variants in a previously reported iPSC disease model of GATA4-related heart defects33 (Extended Data Fig. 9e). Notably, direct GATA4 targets (as defined by ChIP-seq33) were significantly more impacted by in silico deletion of GATA4 in fetal cardiomyocytes compared to indirect targets (Fig. 5a). Analogously, in silico deletion of TBX5, another known congenital heart disease gene, in fetal cardiomyocytes23 more significantly impacted its direct targets (as defined by ChIP-seq34) compared to indirect targets and housekeeping genes (Extended Data Fig. 9f). These data suggest that in silico perturbation can be applied to model gene network connections.
Fig. 5 |. In silico deletion revealed network connections.

a, In silico deletion of GATA4 was significantly more deleterious to previously reported GATA4 direct targets33 than to housekeeping genes, previously reported NOTCH1 targets4, previously reported NKX2–5 targets46, or GATA4 indirect targets33 (*p<0.05 Wilcoxon, FDR-corrected; center line=median, box limits=upper and lower quartiles, whiskers=1.5x interquartile range, points=outliers). b, In silico deletion of GATA4 or TBX5 alone was significantly more deleterious to previously reported GATA4/TBX5 co-bound targets33 than to housekeeping genes; in silico deletion of the combination of GATA4 and TBX5 was even more deleterious to co-bound targets, significantly more than to housekeeping genes and significantly more than the sum of the effect of GATA4 or TBX5 alone on co-bound targets (*p<0.05 Wilcoxon, FDR-corrected).
Interestingly, the GATA4 variant studied in the iPSC disease model disrupts the interaction of GATA4 with its binding partner, transcription factor TBX533. We tested whether our in silico deletion approach could model the effect of deleting these two genes in combination (Fig. 5b). Indeed, in silico deletion of GATA4 or TBX5 alone had a significantly more deleterious effect on their known co-bound targets33 compared to housekeeping genes. Furthermore, in silico deletion of both GATA4 and TBX5 in combination had an even greater impact on their known co-bound targets than the sum of their individual in silico deletion, suggesting Geneformer recognized their cooperative action at these co-bound targets.
In silico treatment analysis
We next tested whether our in silico perturbation strategy could be applied to model human disease and reveal candidate therapeutic targets (Fig. 6a). First, we fine-tuned Geneformer to distinguish cardiomyocytes35 from non-failing hearts (n=9) or hearts affected by hypertrophic (n=11) or dilated (n=9) cardiomyopathy with an overall out-of-sample accuracy of 90% (Fig. 6b, Extended Data Fig. 10a). We then determined the genes whose in silico deletion or activation in cardiomyocytes from non-failing hearts significantly shifted the fine-tuned Geneformer cell embeddings towards the hypertrophic or dilated cardiomyopathy states (Fig. 6c–d; Extended Data Fig. 10b–c, Supplementary Table 5–11). Overall, the model identified 447 genes whose loss was predicted to shift cardiomyocytes towards the hypertrophic cardiomyopathy state, which were enriched for pathways including Titin binding36 and sarcomere organization37 known to impact hypertrophic cardiomyopathy pathogenesis. The model identified 478 genes whose loss was predicted to shift cardiomyocytes towards dilated cardiomyopathy, which were enriched for pathways involved in muscle contraction38 and mitochondrial39 function.
Fig. 6 |. In silico treatment revealed candidate therapeutic targets.
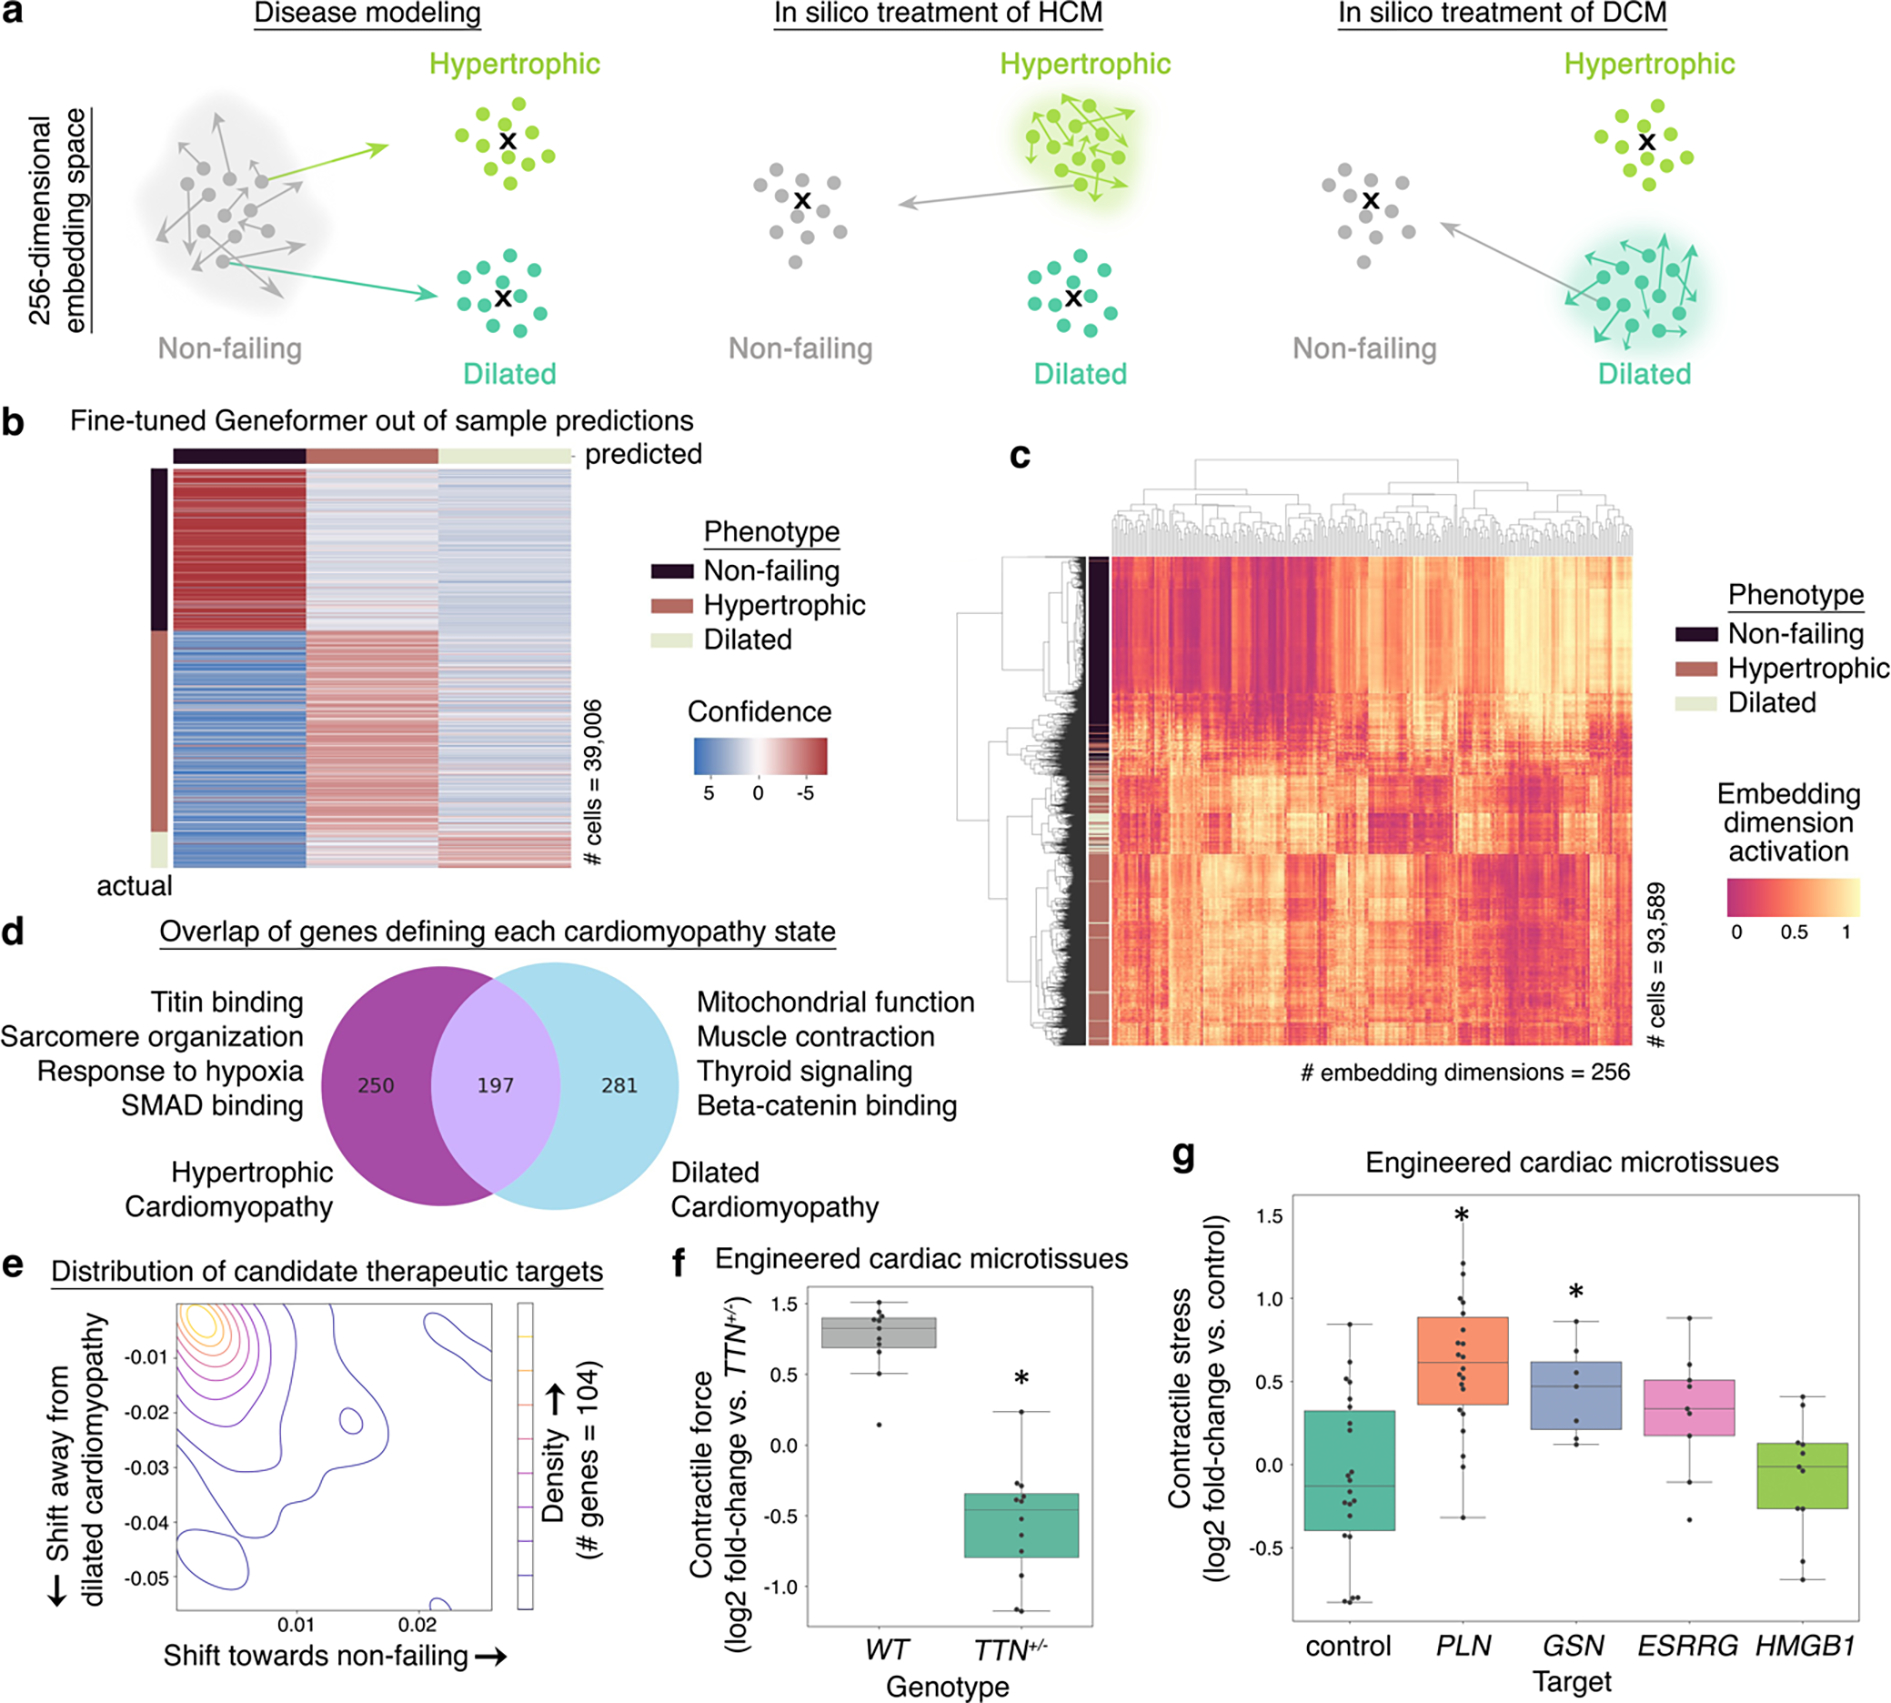
a, Fine-tuning Geneformer to distinguish cardiomyocytes from non-failing hearts or hearts affected by hypertrophic or dilated cardiomyopathy defines the embedding position of each cell state. Then, disease modeling (left) can be performed by in silico deleting or activating random genes within non-failing cardiomyocytes to define the random distribution (gray cloud) and thereby identify genes whose in silico deletion or activation shifts the embedding significantly towards either the hypertrophic or dilated cardiomyopathy state. The reverse approach is taken for in silico treatment analysis (center and right). b, Out-of-sample predictions of Geneformer fine-tuned to distinguish cardiomyocytes from non-failing hearts or hearts affected by hypertrophic or dilated cardiomyopathy. Accuracy: 90%, precision: 82%, recall 87%. (Training data: non-failing n=9, hypertrophic n=11, dilated n=9, total 93,589 cells; out-of-sample data: non-failing n=4, hypertrophic n=4, dilated n=2, total 39,006 cells). c, Hierarchical clustering of fine-tuned Geneformer cardiomyocyte cell embeddings. d, Overlap of genes whose in silico deletion in cardiomyocytes from non-failing hearts significantly shifted the fine-tuned Geneformer cell embeddings towards the hypertrophic or dilated cardiomyopathy states and Gene Ontology terms enriched for each state. e, Distribution of mean embedding shift in response to in silico deletion of candidate therapeutic targets in cardiomyocytes from hypertrophic cardiomyopathy (n=104 genes). f, Contractile force of cardiac microtissues derived from WT iPSCs or iPSCs with a TTN truncating mutation modeling dilated cardiomyopathy (WT n=11, TTN+/− n=12, *p<0.05 Wilcoxon). g, Contractile stress (force per unit area) of cardiac microtissues derived from TTN+/− iPSCs exposed to either control treatment or guides promoting CRISPR-mediated knockout of Geneformer-predicted therapeutic targets. (TTN+/− +control treatment n=22, TTN+/− +CRISPR guides targeting knockout of PLN n=22, GSN n=7, ESRRG n=9, or HMGB1 n=11; p<0.05 Wilcoxon, FDR-corrected). In (f-g): center line=median, box limits=upper and lower quartiles, whiskers=1.5x interquartile range, points=experimental replicates.
Then, we performed in silico treatment analysis in cardiomyocytes from hypertrophic or dilated cardiomyopathy patients to determine whether inhibition or activation of specific pathways would shift the cell embeddings back towards the non-failing heart state (Fig. 6e, Extended Data Fig. 10d, Supplementary Table 12–15). Top enriched pathways for hypertrophic cardiomyopathy pointed to candidate cardiomyocyte-specific therapeutic targets including ADCY5, disruption of which is associated with longevity and protection against cardiomyopathy in mouse models40, as well as druggable targets41 including SRPK3, a downstream effector of MEF242 which is known to play a critical role in myocardial cell hypertrophy43.
We then performed experimental validation to determine whether inhibition of Geneformer-predicted therapeutic candidates for dilated cardiomyopathy could improve cardiomyocyte function in an experimental model of the disease. Titin (TTN) truncating mutations are the leading cause of dilated cardiomyopathy in humans and are found in ~20% of affected patients36. iPSC-derived cardiac microtissues harboring a truncating variant (TTN+/−) in the A-band are known to exhibit reduced contractile stress compared to isogenic TTN+/+ controls36. Strikingly, CRISPR-mediated knockout of both Geneformer-predicted targets GSN and PLN in the TTN+/− cells significantly improved the contractile stress of the TTN+/− cardiac microtissues, validating these genes as promising candidate therapeutic targets for this disease (Fig. 6f–g, Extended Data Fig. 10e). These findings provide experimental validation in support of the utility of Geneformer as a tool for discovery of candidate therapeutic targets in human disease.
Discussion
In sum, we developed a context-aware deep learning model, Geneformer, pretrained on large-scale transcriptomic data to enable predictions in settings with limited data. Through the observation of a vast number of cell states during the pretraining process, Geneformer gained a fundamental understanding of network dynamics, encoding network hierarchy in the model’s attention weights in a completely self-supervised manner. Geneformer’s ability to predict dosage-sensitive disease genes through the context-aware in silico deletion approach represents a valuable asset for interpretation of genetic variants, including prioritization of GWAS hits driving complex traits, and the specific tissues they are expected to affect. Experimental validation of a novel dosage-sensitive gene candidate in fetal cardiomyocytes, TEAD4, supports the utility of Geneformer for driving novel biological insights in human development. Applied to disease modeling of cardiomyopathy using a limited number of patient samples, Geneformer predicted candidate therapeutic targets whose experimental targeting in an iPSC disease model led to significant functional improvement. In silico treatment analysis using limited data may thus enable therapeutic discovery in innumerable diseases that have been previously impeded by limited data due to being rare or affecting clinically inaccessible tissue.
Furthermore, we found that pretraining with larger and more diverse corpuses consistently improved Geneformer’s predictive power, consistent with observations that large-scale pretraining allows training of deeper models that ultimately have greater predictive potential in fields including NLU, computer vision, and mathematical problem-solving44. Additionally, exposure to hundreds of experimental datasets during pretraining also appeared to promote robustness to batch-dependent technical artifacts and individual variability that commonly impact single cell analyses in biology. These findings suggest that as the amount of publicly available transcriptomic data continues to expand, future models pretrained on even larger-scale corpuses may open opportunities to achieve meaningful predictions in even more elusive tasks with increasingly limited task-specific data. Overall, Geneformer represents a pretrained deep learning model whose fundamental understanding of network dynamics can now be democratized to a broad range of downstream applications to accelerate discovery of key network regulators and candidate therapeutic targets in settings with limited data.
Methods
Assembly and rank value encoding of transcriptomes in Genecorpus-30M
Assembly and uniform processing of single cell transcriptomes
We assembled a large-scale pretraining corpus, Genecorpus-30M, comprised of 29.9 million (29,900,531) human single cell transcriptomes from a broad range of tissues from publicly available data (Fig. 1b, Supplementary Table 1). We excluded cells with high mutational burdens (e.g. malignant cells and immortalized cell lines) that could lead to substantial network rewiring without companion genome sequencing to facilitate interpretation. We only included droplet-based sequencing platforms to assure expression value unit comparability. Overall, 561 datasets were included and stored as uniform files in the .loom HDF5 format including metadata from the original studies as row (feature) and column (cell) attributes described below.
Publicly available datasets containing raw counts were collected from National Center for Biotechnology Information (NCBI) Gene Expression Omnibus (GEO), NCBI Sequence Read Archive (SRA), Human Cell Atlas, European Molecular Biology Laboratory-European Bioinformatics Institute (EMBL-EBI) Single Cell Expression Atlas, Broad Institute Single Cell Portal, Brotman Baty Institute (BBI)-Allen Single Cell Atlases, Tumor Immune Single-cell Hub (TISCH) (excluding malignant cells), Panglao Database, 10x Genomics, University of California, Santa Cruz Cell Browser, European Genome-phenome Archive, Synapse, Riken, Zenodo, National Institutes of Health (NIH) Figshare Archive, NCBI dbGap, Refine.bio, China National GeneBank Sequence Archive, Mendeley Data, and individual communication with authors of the original studies11,23,29,32,45,47–153. Additional resources for collecting information about suitable studies included Entrez Direct tools and the dataset summary from Svensson et al., Database 2020154. Tools utilized in conversion of data to uniform .loom HDF5 files included loompy, scanpy155, anndata, scipy, numpy, pandas, Cellranger, and LoomExperiment.
Row feature attributes included Ensembl annotations for the gene ID, ID version (if provided by original study), name, and type (e.g. protein coding, miRNA, mitochondrial, etc). Annotation data was retrieved from Ensembl and MyGene156. Column cell attributes included a unique Genecorpus-30M cell ID comprised of the dataset name, sample name, and cell barcode from that dataset. The dataset and sample names were also included as separate individual attributes such that the cell barcode can be derived by subtracting these from the unique Genecorpus-30M cell ID if needed. Column cell attributes also included the major organ included in the dataset, which we annotated as one of the following categories: adipose, adrenal, airway, bladder, bone, bone_marrow, brain, breast, cord_blood, decidua, ear, embryo, endothelial, esophagus, eye, heart, immune, intestine_unspecified, kidney, large_intestine, liver, lung, lymph_node, lymphatic, muscle, nasal, pancreas, placenta, pluripotent_stem_cell, prostate, skin, small_intestine, spleen, stomach, testis, thymus, tonsil, various, yolk_sac. Column cell attributes also included the specific organ(s) included in the dataset based on metadata provided by the original study. If the original study included cell type annotations, we included these as a cell type column attribute for each cell as well. We also included the sequencing platform used.
Column cell attributes also included several calculated measurements for each cell: the total number of read counts, the percentage of mitochondrial reads, the number of genes Ensembl-annotated as protein-coding or miRNA genes, and whether the cell passed the quality control metrics we established for scalable filtering of the cells to exclude possible doublets and/or damaged cells. Only cells that passed these filtering metrics were used for downstream analyses in this work. Specifically, datasets were filtered to retain cells with total read counts within three standard deviations of the mean within that dataset and mitochondrial reads within three standard deviations of the mean within that dataset. Ensembl-annotated protein-coding and miRNA genes were used for downstream analysis. Cells with less than seven detected Ensembl-annotated protein-coding or miRNA genes were excluded as the 15% masking used for the pretraining learning objective would not reliably mask a gene in cells with fewer detected genes. Ultimately, 27.4 million (27,406,217) cells passed the defined quality filters.
Rank value encoding of single cell transcriptomes
We developed a novel rank value encoding method that provides a nonparametric representation of each single cell’s transcriptome, ranking genes by their expression within that cell normalized by their expression across the entire Genecorpus-30M (Fig. 1c). This method takes advantage of the many observations of each gene’s expression across Genecorpus-30M to prioritize genes that distinguish cell state. Specifically, this method will deprioritize ubiquitously highly-expressed housekeeping genes by normalizing them to a lower rank. Conversely, genes such as transcription factors that may be lowly expressed when they are expressed but highly distinguish cell state will move to a higher rank within the encoding (Extended Data Fig. 1c). Furthermore, this rank-based approach may be more robust against technical artifacts that may systematically bias the absolute transcript counts value while the overall relative ranking of genes within each cell remains more stable.
To accomplish this, we first calculated the nonzero median value of expression of each detected gene across all cells passing quality filtering from the entire Genecorpus-30M. We aggregated the transcript count distribution for each gene in a memory-efficient manner by scanning through chunks of .loom data using loompy, normalizing the gene transcript counts in each cell by the total transcript count of that cell to account for varying sequencing depth, and updating the gene’s normalized count distribution within the t-digest157 data structure developed for accurate online accumulation of rank-based statistics. We then normalized the genes in each single cell transcriptome by that gene’s nonzero median value of expression across Genecorpus-30M and ordered the genes by the rank of their normalized expression in that specific cell. Of note, we opted to use the nonzero median value of expression rather than include zeros in the distribution so as not to weight the value by tissue representation within Genecorpus-30M, assuming that a representative range of transcript values would be observed within the cells in which each gene was detected. This normalization factor for each gene is calculated once from the pretraining corpus and is used for all future datasets presented to the model. The provided tokenizer code includes this normalization procedure and should be used for tokenizing new datasets presented to Geneformer to ensure consistency of the normalization factor used for each gene.
The rank value encodings for each single cell transcriptome were then tokenized based on a total vocabulary of 25,424 protein-coding or miRNA genes detected in a median of 173,152 cells within Genecorpus-30M. The vocabulary also included two additional special tokens for padding and masking. The tokenized data was stored within the Huggingface Datasets158 structure, which is based on the Apache Arrow format that allows processing of large datasets with zero-copy reads without memory constraints. Of note, this strategy is also space-efficient as the genes are stored as ranked tokens as opposed to the exact transcript values, and we only store genes detected within each cell rather than the full sparse dataset that includes all of the undetected genes.
Geneformer architecture and pretraining
Geneformer architecture
Geneformer is composed of six transformer encoder units1,2, each composed of a self-attention layer and feed forward neural network layer with the following parameters: input size of 2048 (fully represents 93% of rank value encodings in Genecorpus-30M), 256 embedding dimensions, 4 attention heads per layer, and feed forward size of 512 (Fig. 1c). Geneformer employs full dense self-attention across the input size of 2048. Depth was chosen based on the maximum depth for which there was sufficient data to pretrain as it has been established that this approach yields the greatest predictive potential in other informational fields including NLU, computer vision, and mathematical problem-solving44. Additionally, we maximized the amount of context (input size) considered by the model with full attention based on the number of genes standardly detected in each cell within the pretraining corpus. Additional parameters were as follows: non-linear activation function: rectified linear unit (ReLU); dropout probability for all fully connected layers: 0.02; dropout ratio for attention probabilities: 0.02; standard deviation of the initializer for weight matrices: 0.02; epsilon for layer normalization layers: 1e-12. Modeling was implemented in pytorch and using the Huggingface Transformers library159 for model configuration, data loading, and training.
Geneformer pretraining and performance optimization
Pretraining was accomplished using a masked learning objective, which has been shown in other informational fields1,2 to improve generalizability of the foundational knowledge learned during pretraining for a wide range of downstream fine-tuning objectives. During pretraining, 15% of the genes within each transcriptome were masked, and the model was trained to predict which gene should be within each masked position in that specific cell state using the context of the remaining unmasked genes. A major strength of this approach is that it is entirely self-supervised and can be accomplished on completely unlabeled data, which allows the inclusion of large amounts of training data without being restricted to samples with accompanying labels. Pretraining hyperparameters were optimized to the following final values: max learning rate: 1e-3; learning scheduler: linear with warmup; optimizer: Adam with weight decay fix160; warmup steps: 10,000; weight decay: 0.001; batch size: 12. Tensorboard was used for experimentation tracking, and the model was pretrained for 3 epochs.
As the input size of 2048 is considerably large for a full dense self-attention model (for example, BERT1,2 input size is 512) and transformers have a quadratic memory and time complexity with respect to input size, we implemented measures to optimize efficiency of large-scale pretraining. The trainer from the Huggingface Transformers library159 was used for pretraining with the substitution of a custom tokenizer to implement dynamic, length-grouped padding, which minimized computation on padding and achieved a 29.4x speedup in pretraining. This process takes a randomly sampled megabatch and then orders minibatches by their length in descending order (to ensure that any memory constraints are encountered earlier). Minibatches are then dynamically padded, minimizing the computation wasted on padding due to being length-grouped. We also implemented recent advances in distributed GPU training9,10 to allow efficient pretraining on the large-scale dataset using Deepspeed, which partitions parameters, gradients, and optimizer states across available GPUs, offloads processing/memory as possible to CPU to allow more to fit on GPU, and reduces memory fragmentation by ensuring long and short term memory allocations do not mix. Overall, pretraining was achieved in approximately 3 days distributed across 3 nodes each with 4 Nvidia V100 32GB GPUs (total 12 GPUs).
Geneformer fine-tuning
Fine-tuning of Geneformer was accomplished by initializing the model with the pretrained Geneformer weights and adding a final task-specific transformer layer. The fine-tuning objective was either gene classification or cell classification as indicated in Supplementary Table 2. The trainer from the Huggingface Transformers library159 was used for pretraining with the substitution of a custom tokenizer as described above and a custom data collator for dynamically labeling gene or cell classes as indicated in Supplementary Table 2. To demonstrate the efficacy of the pretrained Geneformer in boosting predictive potential of downstream fine-tuning applications, we intentionally used the same fine-tuning hyperparameters for all applications. It should be noted that hyperparameter tuning for deep learning applications generally significantly enhances learning and so it is likely that the maximum predictive potential of Geneformer in these downstream applications is significantly underestimated. Hyperparameters utilized for fine-tuning were as follows: max learning rate: 5e-5; learning scheduler: linear with warmup; optimizer: Adam with weight decay fix160; warmup steps: 500; weight decay: 0.001; batch size: 12. All fine-tuning in Supplementary Table 2 was performed with a single training epoch to avoid overfitting.
The number of layers frozen from fine-tuning are indicated in Supplementary Table 2. Generally, in our experience, applications that are more relevant to the pretraining objective benefit from more layers being frozen to prevent overfitting to the limited task-specific data, whereas applications that are more distant from the pretraining objective benefit from fine-tuning of more layers to optimize performance on the new task. Fine-tuning results for gene classification applications were reported as AUCs +/− standard deviation and F1 score calculated based on a 5-fold cross-validation strategy where training was performed on 80% of the gene training labels and performance was tested on the 20% held-out gene training labels, repeating for 5 folds. Of note, because the fine-tuning applications are trained on classification objectives that are completely separate from the masked learning objective, whether or not task-specific data was included in the pretraining corpus is not relevant to the classification predictions, as demonstrated in Extended Data Fig. 1f.
We then fully fine-tuned the dosage sensitivity and bivalency classification models using all gene training labels in order to test their ability to generalize to out-of-sample data. We tested whether, without any further training, the model fine-tuned to distinguish dosage sensitive versus insensitive genes could predict dosage sensitivity of a recently reported set of disease genes from Collins et al., which analyzed CNVs from 753,994 individuals to define genes whose deletion was associated with primarily neurodevelopmental disease with either high (>0.85 score) or moderate (0.15–0.85 score) confidence22. Predicted dosage sensitivity of these gene sets was tested in the context of 10,000 randomly sampled cells from Genecorpus-30M, neurons across any adult or developmental timepoint defined as TUBB3-marked cells from Genecorpus-30M, or fetal cerebral cells from the Fetal Cell Atlas23. We also tested whether, without any further training, the model fine-tuned to distinguish bivalent versus single Lys4-marked genes by training on the 56 highly-conserved loci would generalize to the genome-wide setting30.
Geneformer gene embeddings, cell embeddings, and attention weights
Gene embeddings
For each single cell transcriptome presented to Geneformer, the model embeds each gene into a 256-dimensional space that encodes the gene’s characteristics specific to the context of that cell. Contextual Geneformer gene embeddings are extracted as the hidden state weights for the 256 embedding dimensions for each gene within the given single cell transcriptome evaluated by forward pass through the Geneformer model. Gene embeddings analyzed in this study were extracted from the second to last layer of the models as the final layer is known to encompass features more directly related to the learning objective prediction while the second to last layer is a more generalizable representation.
Cell embeddings
Geneformer cell embeddings, which encode characteristics of that single cell’s state, are generated by averaging the embeddings of each gene detected in that cell, resulting in a 256-dimensional embedding. We utilized the second to last layer embeddings as discussed above (except for the disease modeling application as discussed in the Supplementary Information Methods).
Attention weights
Each of Geneformer’s six layers has four attention heads that are meant to learn in an unsupervised manner to pay attention to distinct classes of genes to jointly improve predictions without prior knowledge of any gene’s biological function. Contextual Geneformer attention weights are extracted for each attention head within each self-attention layer for each gene within the given single cell transcriptome evaluated by forward pass through the Geneformer model.
In silico perturbation
We designed an in silico perturbation approach where the rank of given genes is perturbed to model their inhibition or activation. The effects of the in silico perturbation are measured at the cell and gene embedding level, modeling how the perturbation affects the cell’s state and the regulation of downstream genes within the gene network, respectively. In silico deletion was modeled by removing the given gene from the rank value encoding of the given single cell transcriptome and quantifying the cosine similarity between the original and perturbed 1) cell embeddings to determine the predicted deleterious impact of deleting that gene in that cell context, or 2) gene embeddings of the remaining genes in the single cell transcriptome to determine which genes were predicted to be most sensitive to in silico deletion of the given gene. In silico deletion can be performed with a single gene or multiple genes being deleted. In silico activation was modeled by moving a given gene(s) to the front of the rank value encoding (similarly to the in silico reprogramming strategy discussed in the Supplementary Information Methods where genes were artificially added to the front of the rank value encoding to model cellular reprogramming by these factors). In theory, more subtle downregulation and activation could be modeled by shifting genes up or down within the rank value encoding to a subtler degree.
Please refer to the Supplementary Information Methods for complete methods including analysis of context dependence and robustness to batch-dependent technical artifacts, attention weight analysis, in silico perturbation analysis, alternative modeling approaches, cell type annotation fine-tuning application, disease modeling approach, scRNA-seq sample collection and preprocessing, and experimental testing of Geneformer-predicted targets in engineered cardiac microtissues.
Extended Data
Extended Data Fig. 1 |. Geneformer transfer learning strategy.
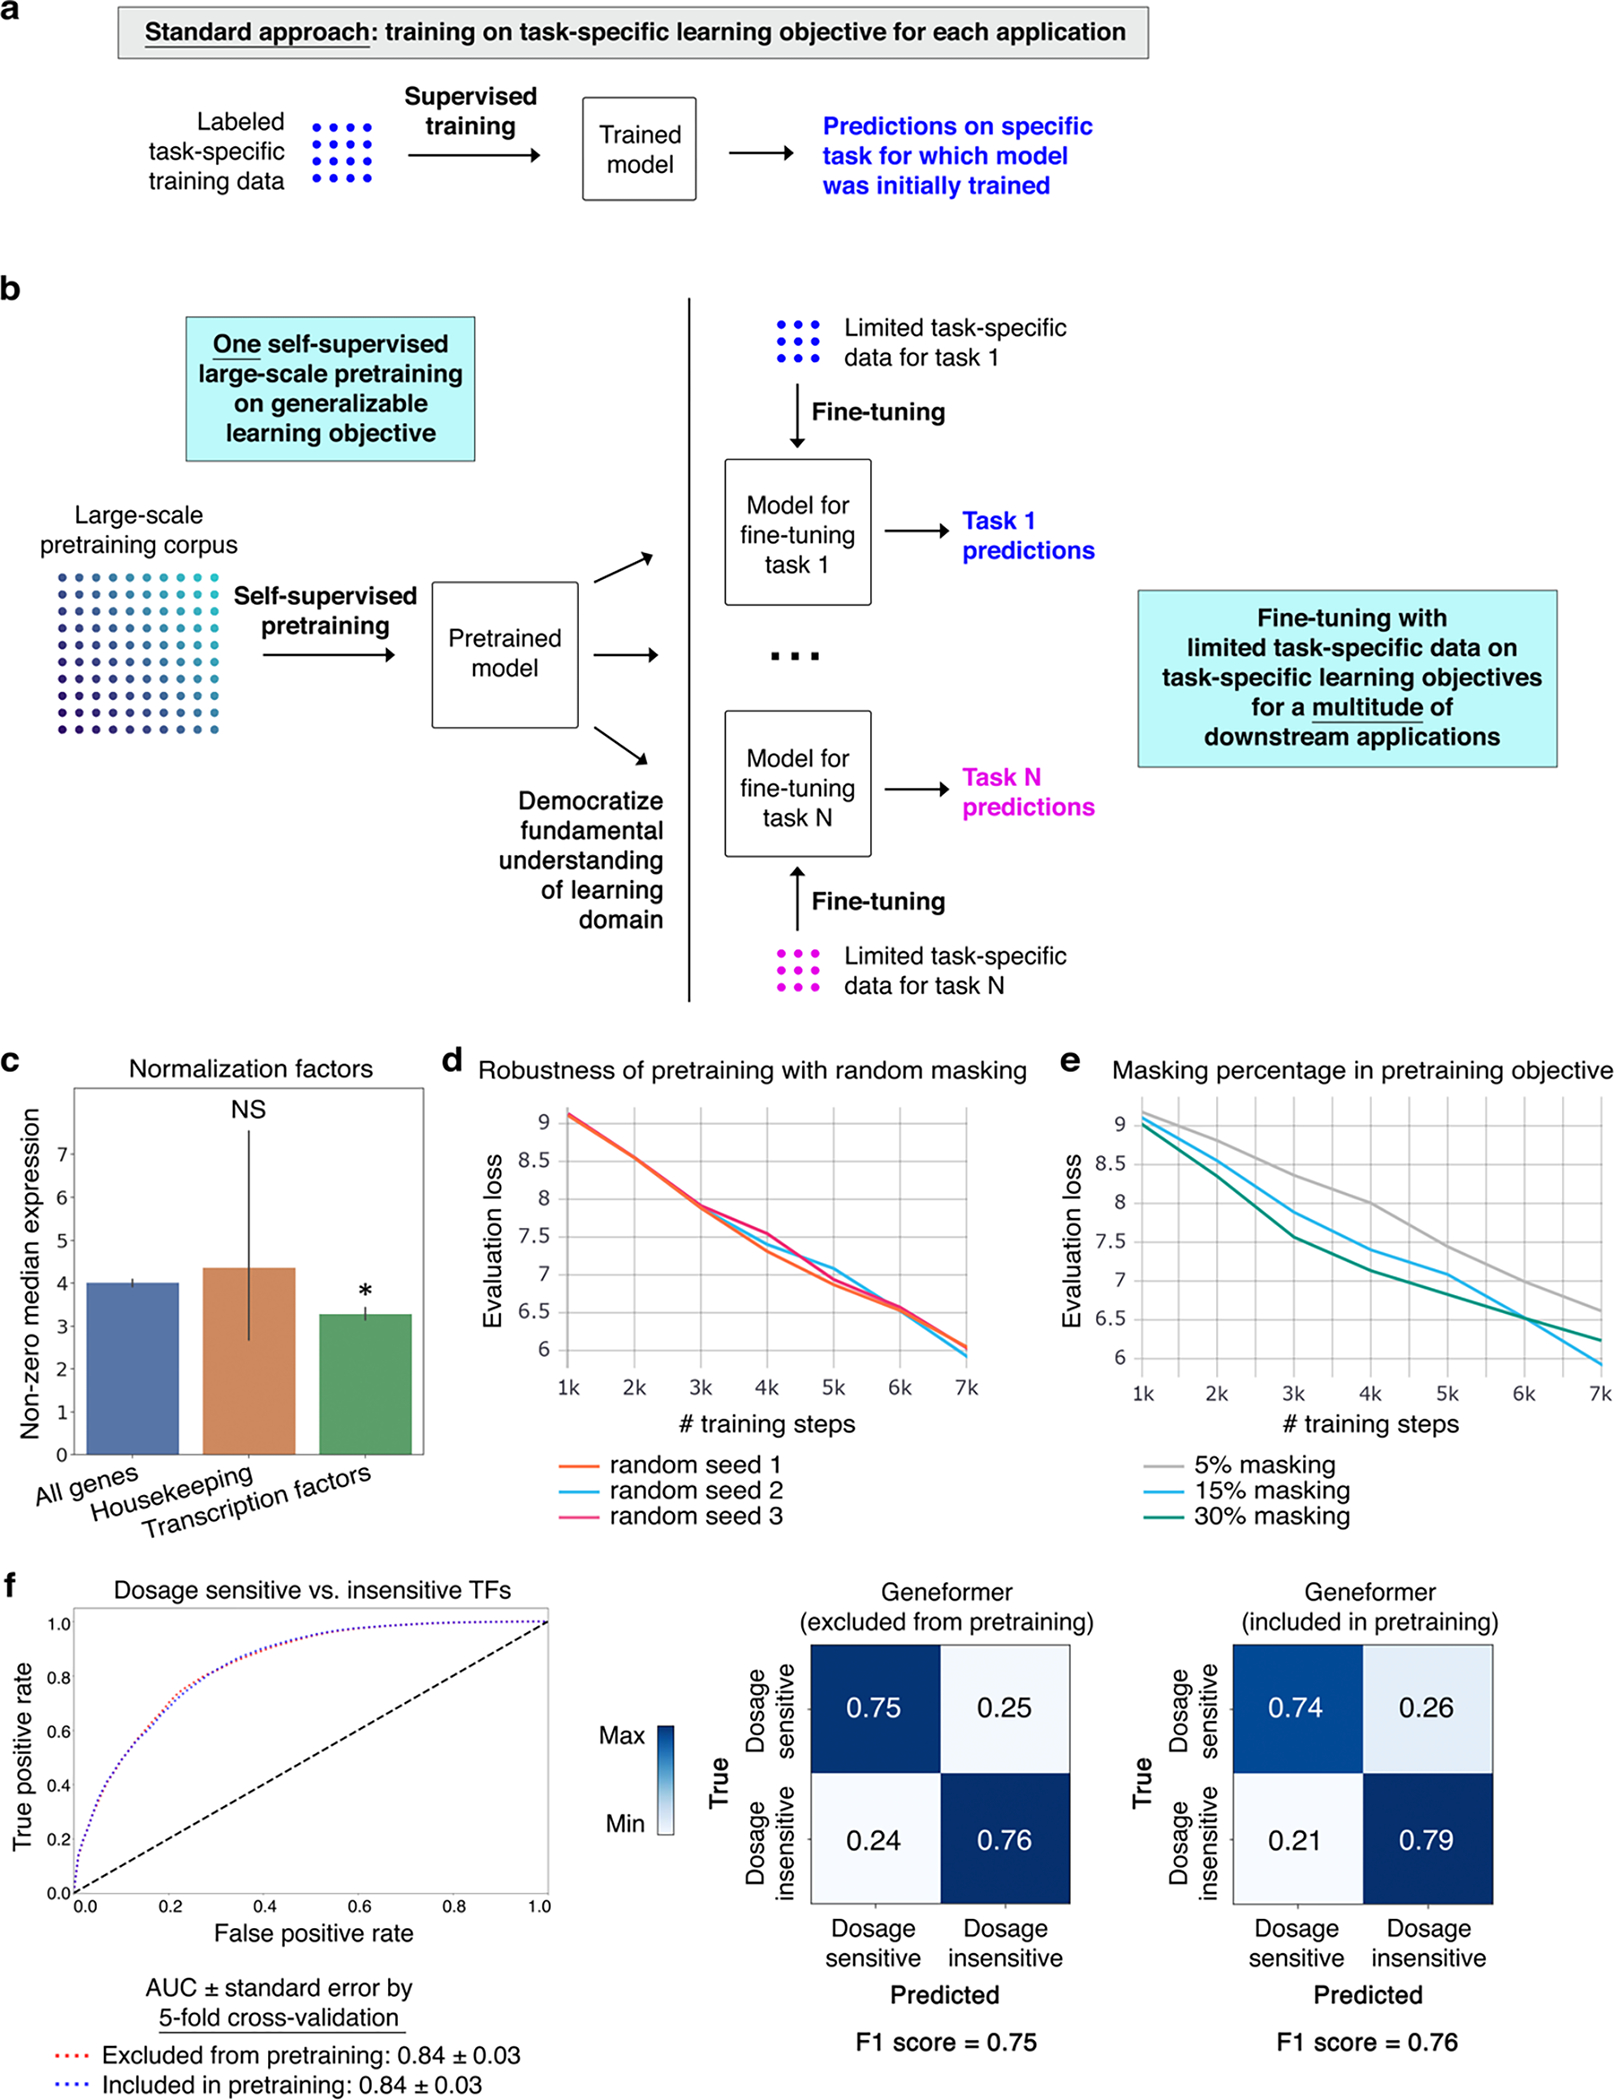
a, Schematic of standard modelling approach, which necessitates retraining a new model from scratch for each new task. b, Schematic of transfer learning strategy. Through a single initial self-supervised large-scale pretraining on a generalizable learning objective, the model gains fundamental knowledge of the learning domain that is then democratized to a multitude of downstream applications distinct from the pretraining learning objective, transferring knowledge to new tasks. c, Transcription factors are normalized by a statistically significantly lower factor (resulting in higher prioritization in the rank value encoding) compared to all genes. Housekeeping genes on average show a trend of a higher normalization factor (resulting in deprioritization in the rank value encoding) compared to all genes (*p<0.05 by Wilcoxon, FDR-corrected; all genes n=17,903, housekeeping genes n=11, transcription factors n=1,384; error bars=standard deviation). d, Pretraining was performed with a randomly subsampled corpus of 100,000 cells, holding out 10,000 cells for evaluation, with 3 different random seeds. Evaluation loss was essentially equivalent in the 3 trials, indicating robustness to the set of genes randomly masked for each cell during the pretraining. e, Pretraining was performed with a randomly subsampled corpus of 100,000 cells, holding out 10,000 cells for evaluation, with 3 different masking percentages. 15% masking had marginally lower evaluation loss compared to 5% or 30% masking. f, Pretraining was performed with a randomly subsampled corpus of 90,000 cells and the model was then fine-tuned to distinguish dosage-sensitive vs. -insensitive transcription factors using 10,000 cells that were either included in or excluded from the 90,000 cell pretraining corpus. Predictive potential on the downstream fine-tuning task was measured by 5-fold cross-validation with these 10,000 cells, demonstrating essentially equivalent results by AUC, confusion matrices, and F1 score. Because the fine-tuning applications are trained on classification objectives that are completely separate from the masked learning objective, whether or not task-specific data was included in the pretraining corpus is not relevant to the downstream classification predictions.
Extended Data Fig. 2 |. Geneformer was context-aware and robust to batch-dependent technical artifacts.
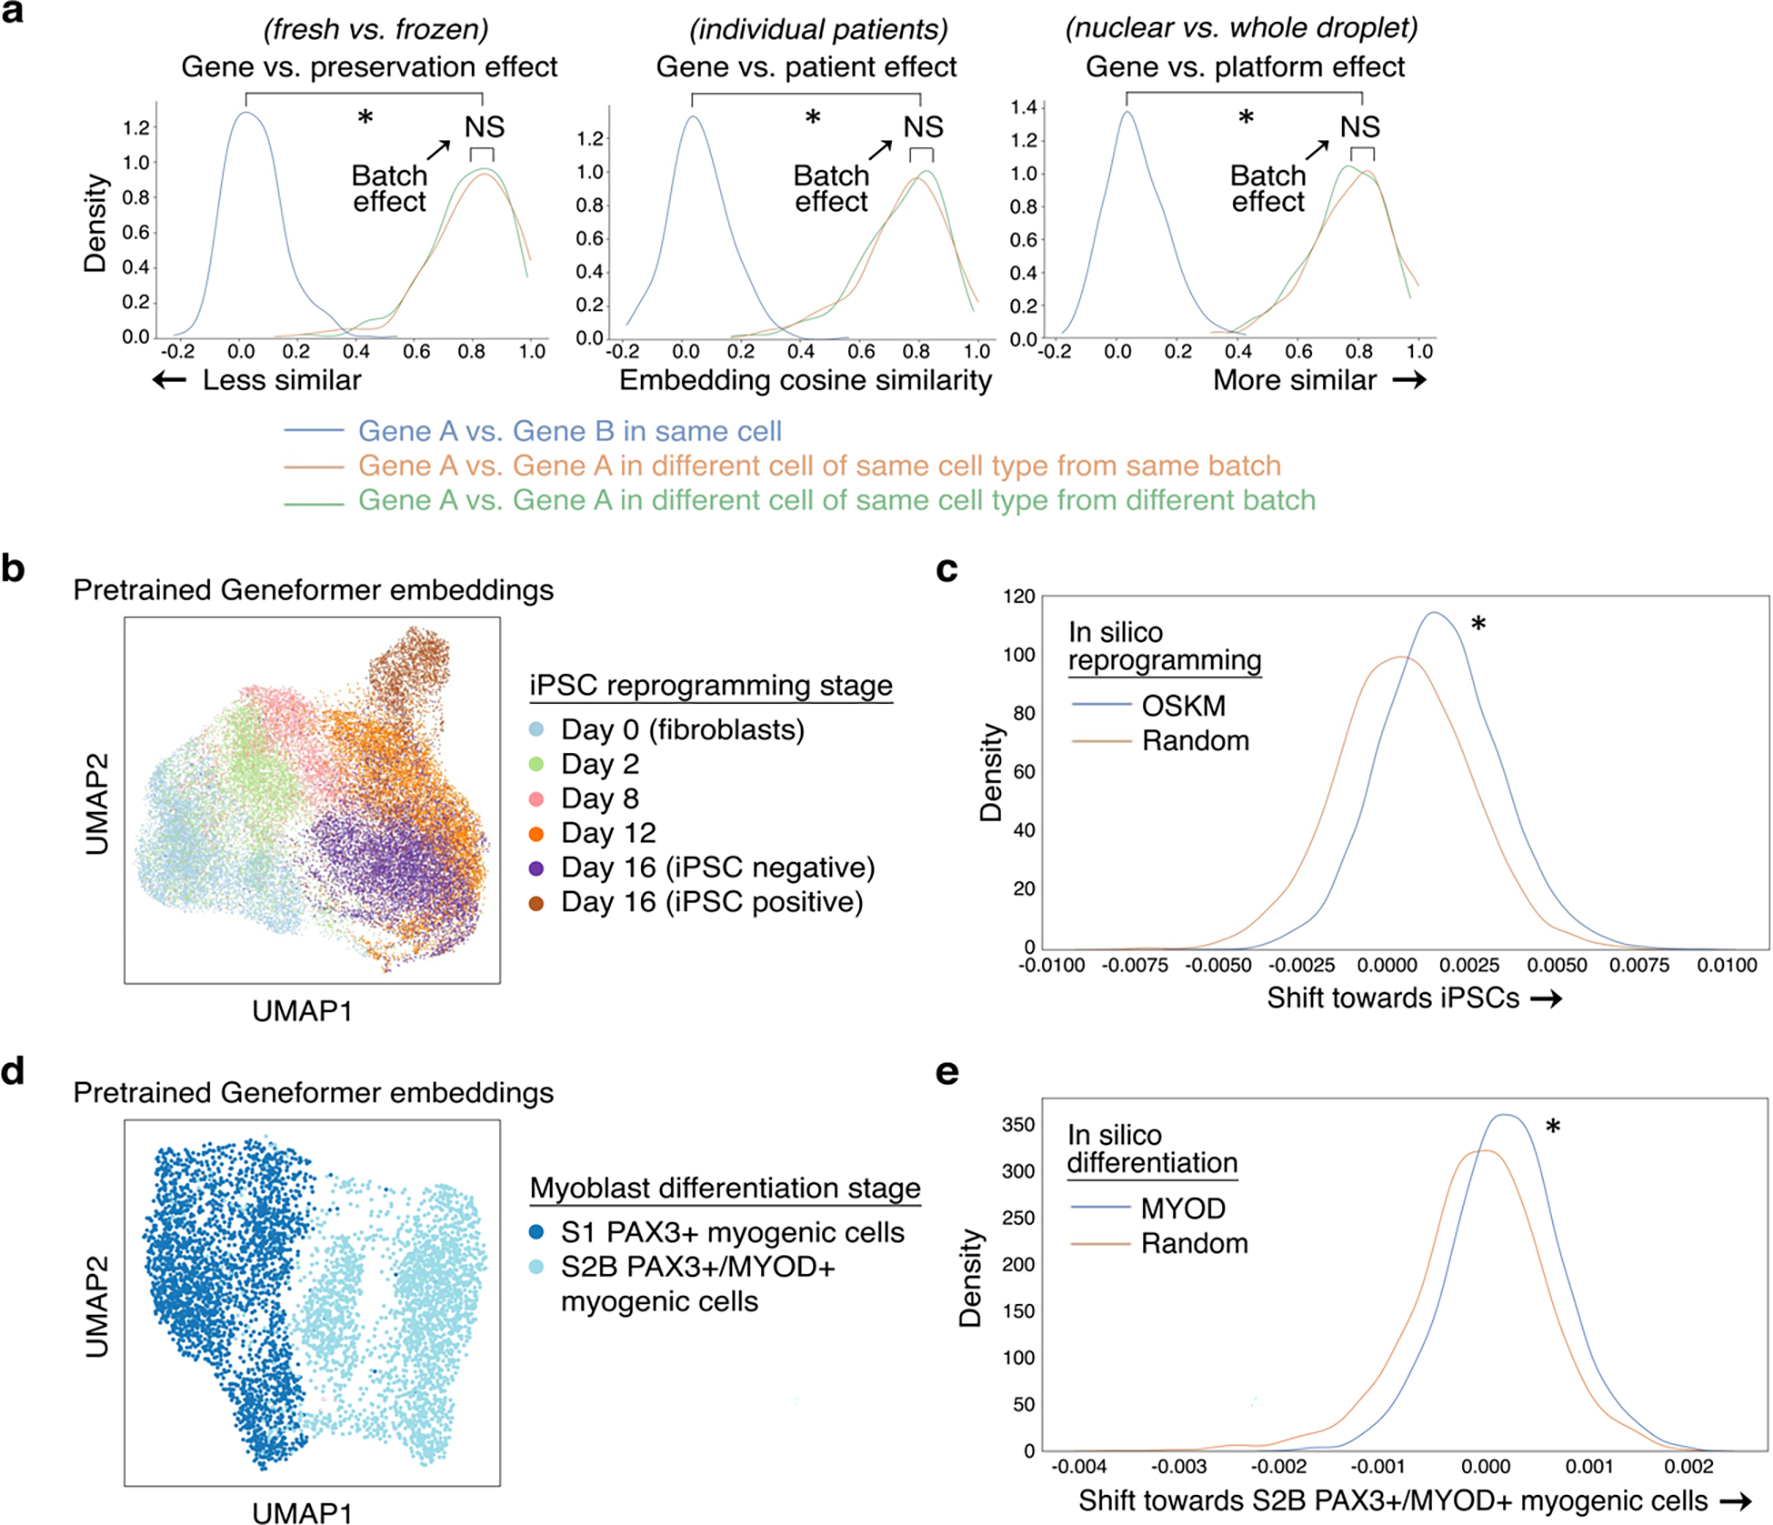
a, Effect of gene versus the indicated batch-dependent technical artifact on pretrained Geneformer gene embeddings (*p<0.05 by Wilcoxon, FDR-corrected; NS: non-significant). We found that the gene embeddings were robust to sequencing platformM11, preservation method13,12, and individual patient variability14. b, UMAP of pretrained Geneformer cell embeddings of cells undergoing iPSC reprogramming appropriately captured temporal trajectory of reprogramming (cell types as annotated by original study15; iPSC negative or positive refers to expression of marker TRA-1–60). Cell embeddings suggested that cells which do not progress to the iPSC state bifurcate into an alternative fate compared to cells that progress to the iPSC state after the day 12 stage. c, Compared to in silico reprogramming with random genes, in silico reprogramming of fibroblasts by artificially adding OCT4, SOX2, KLF4, and MYC (OSKM) to the front of their rank value encodings significantly shifted the gene embeddings from their initial fibroblast state to the embedding of that gene in the iPSC state (*p<0.05 by Wilcoxon). d, UMAP of pretrained Geneformer cell embeddings of cells undergoing iPSC to myoblast differentiation at the earlier S1 (PAX3+) and later S2B (PAX3+/MYOD+) stages (cell types as annotated by original study16). e, Compared to in silico differentiation with random genes, in silico differentiation of the early-stage myogenic cells by artificially adding MYOD to the front of their rank value encodings significantly shifted the gene embeddings from their earlier state to the embedding of that gene in the later MYOD+ myogenic state (*p<0.05 by Wilcoxon).
Extended Data Fig. 3 |. Geneformer encoded context-specificity of key NOTCH pathway genes.
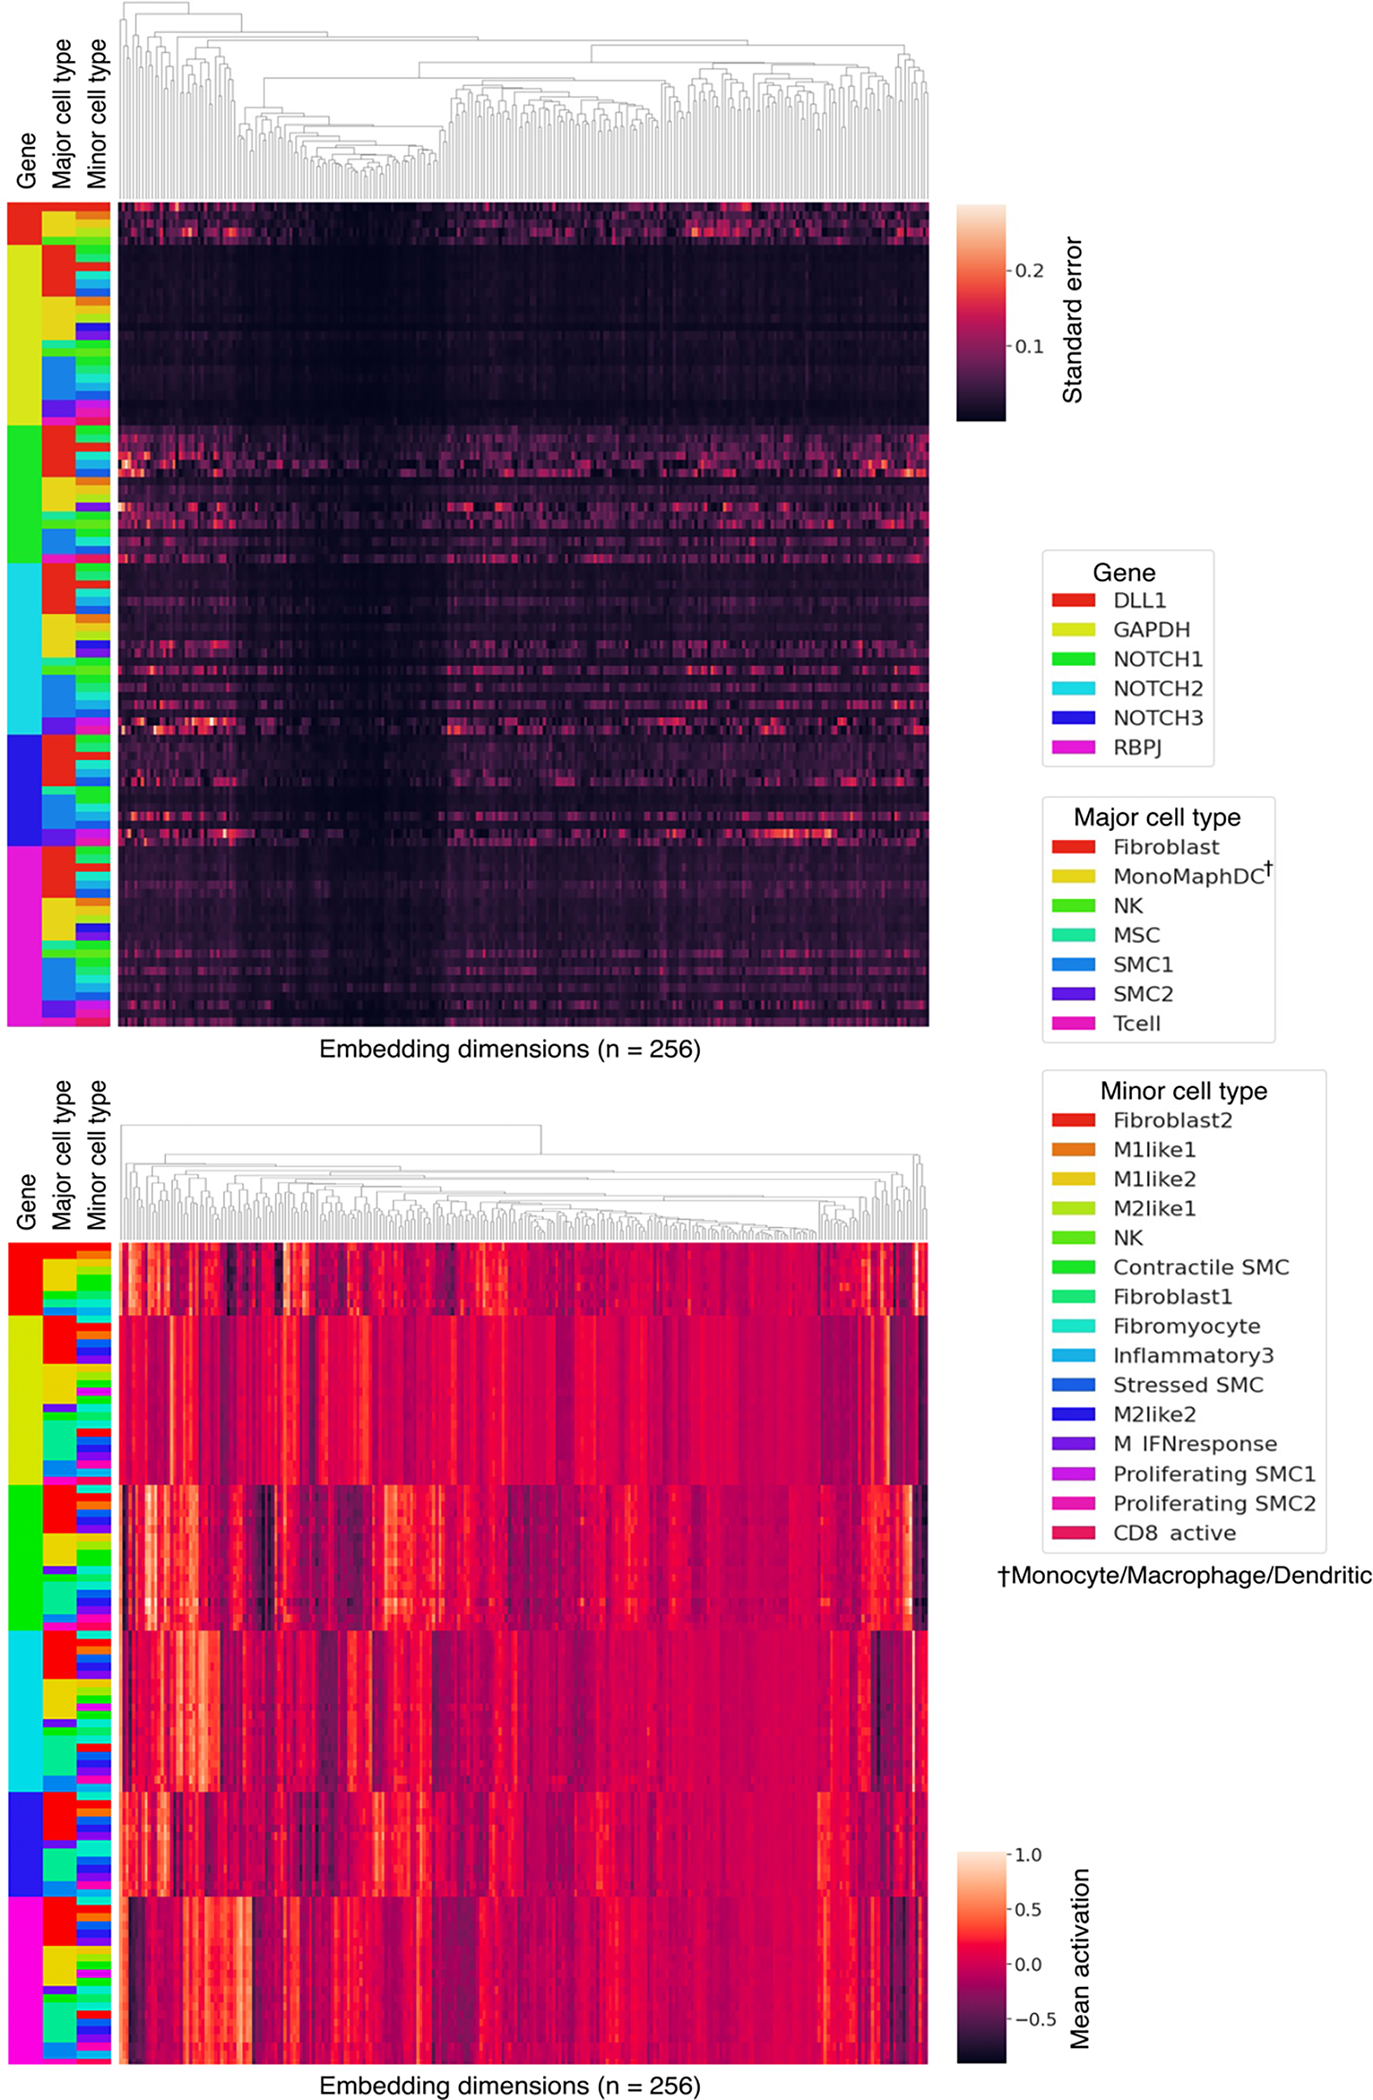
Known context-dependent NOTCH genes showed higher variance in their contextual embeddings across variable aortic cell types compared to housekeeping gene GAPDH.
Extended Data Fig. 4 |. Geneformer pretrained and fine-tuned cell embeddings were robust to batch-dependent technical artifacts.
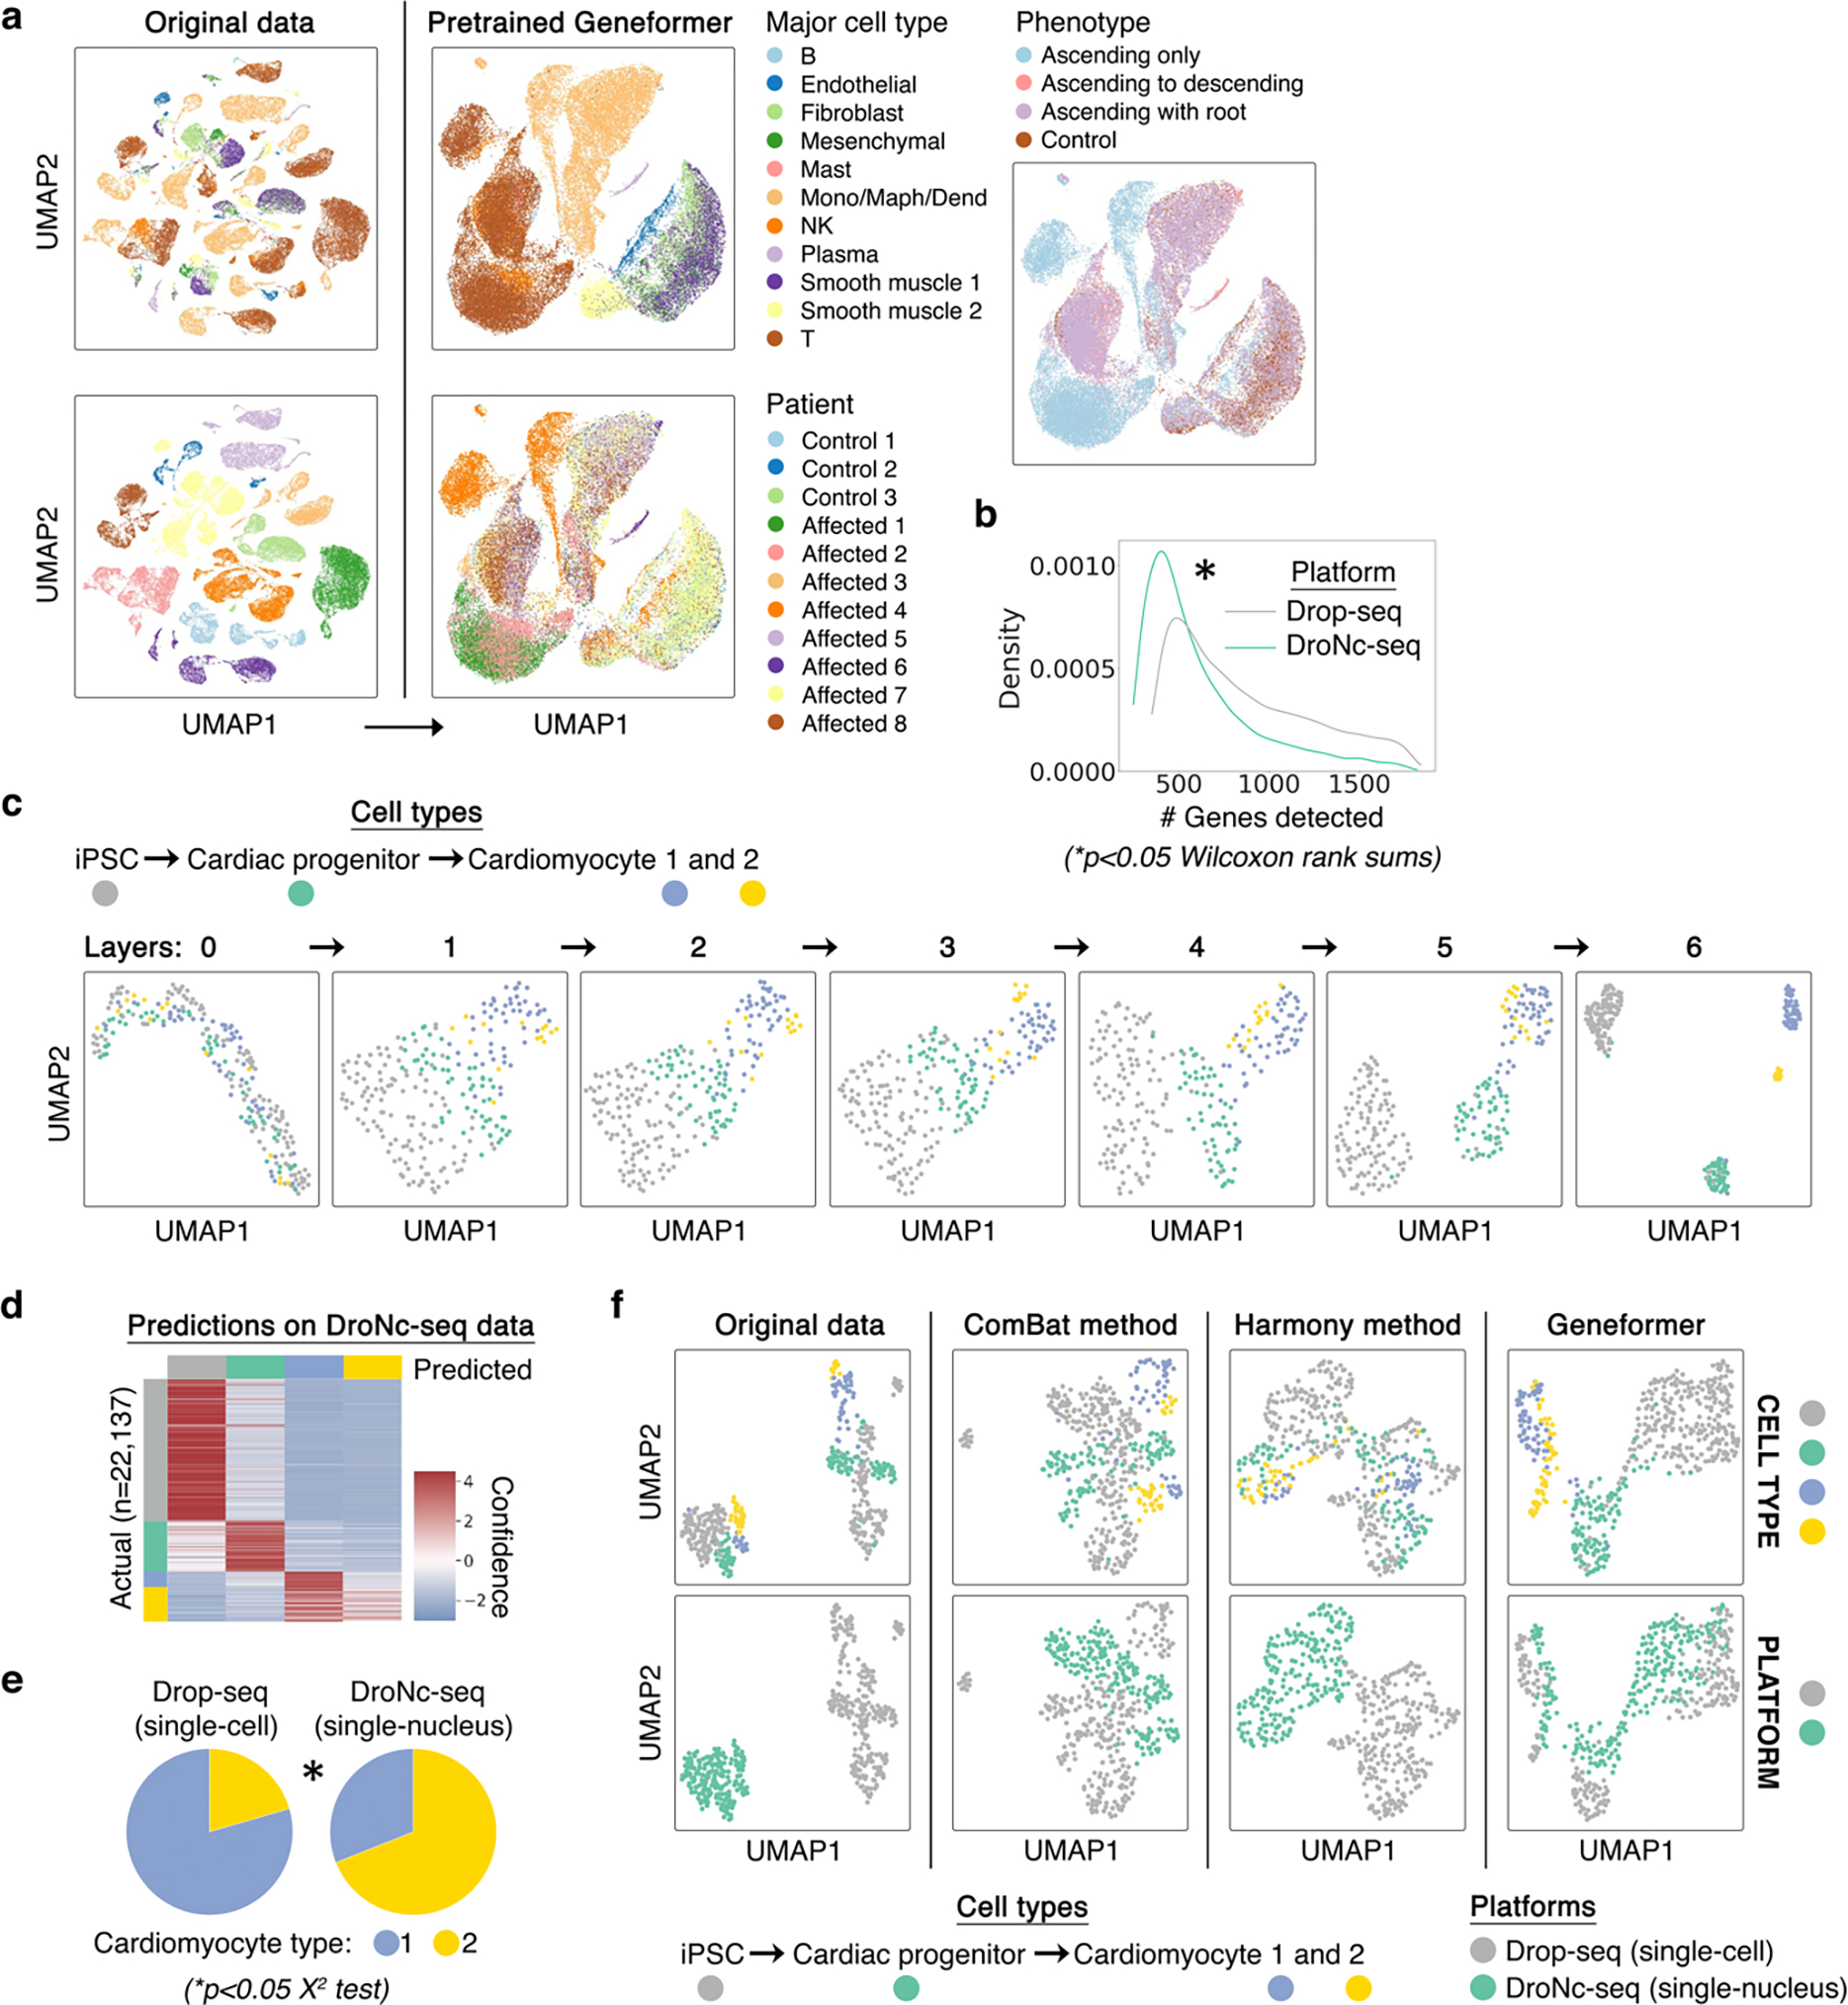
a, While original data (left) was highly affected by patient batch effect, cell embeddings generated by pretrained Geneformer (right) (without fine-tuning) clustered primarily by cell type and phenotype. Of note, affected individuals 1, 2, and 4 had the phenotype of ascending only aortic aneurysm, which is a different phenotype than aortic aneurysm that includes the root. b, Imbalance in the number of genes detected in each of the two platforms (single-cell Drop-seq versus single-nucleus DroNc-seq), which may result in batch-dependent technical artifacts. c, Cell embeddings from each layer of the Geneformer model fine-tuned to distinguish the indicated cell types (as annotated by original study11) using only the Drop-seq data. As the cells pass through each layer, the model successively extrudes them from each other to derive separable embeddings that distinguish the cell types. d, Cell type predictions on the DroNc-seq data by the model fine-tuned only on the Drop-seq data (out of sample accuracy 84%). Of note, inaccurate predictions were predominantly in predicting that cardiomyocyte type 2 was type 1, as expected given the minimal examples of cardiomyocyte type 2 in the Drop-seq data. e, The imbalance of cardiomyocyte type 1 and 2 between the platforms also suggests that these cellular subtypes may be an artifact of variable gene detection between the two platforms. f, Geneformer fine-tuned with only Drop-seq data automatically integrated DroNc-seq data such that the fine-tuned Geneformer cell embeddings primarily clustered by cell types and showed improved integration of platforms compared to the original data even after batch effect removal using the ComBat17 or Harmony18 methods.
Extended Data Fig. 5 |. Geneformer boosted predictions in multiclass cell type annotation.
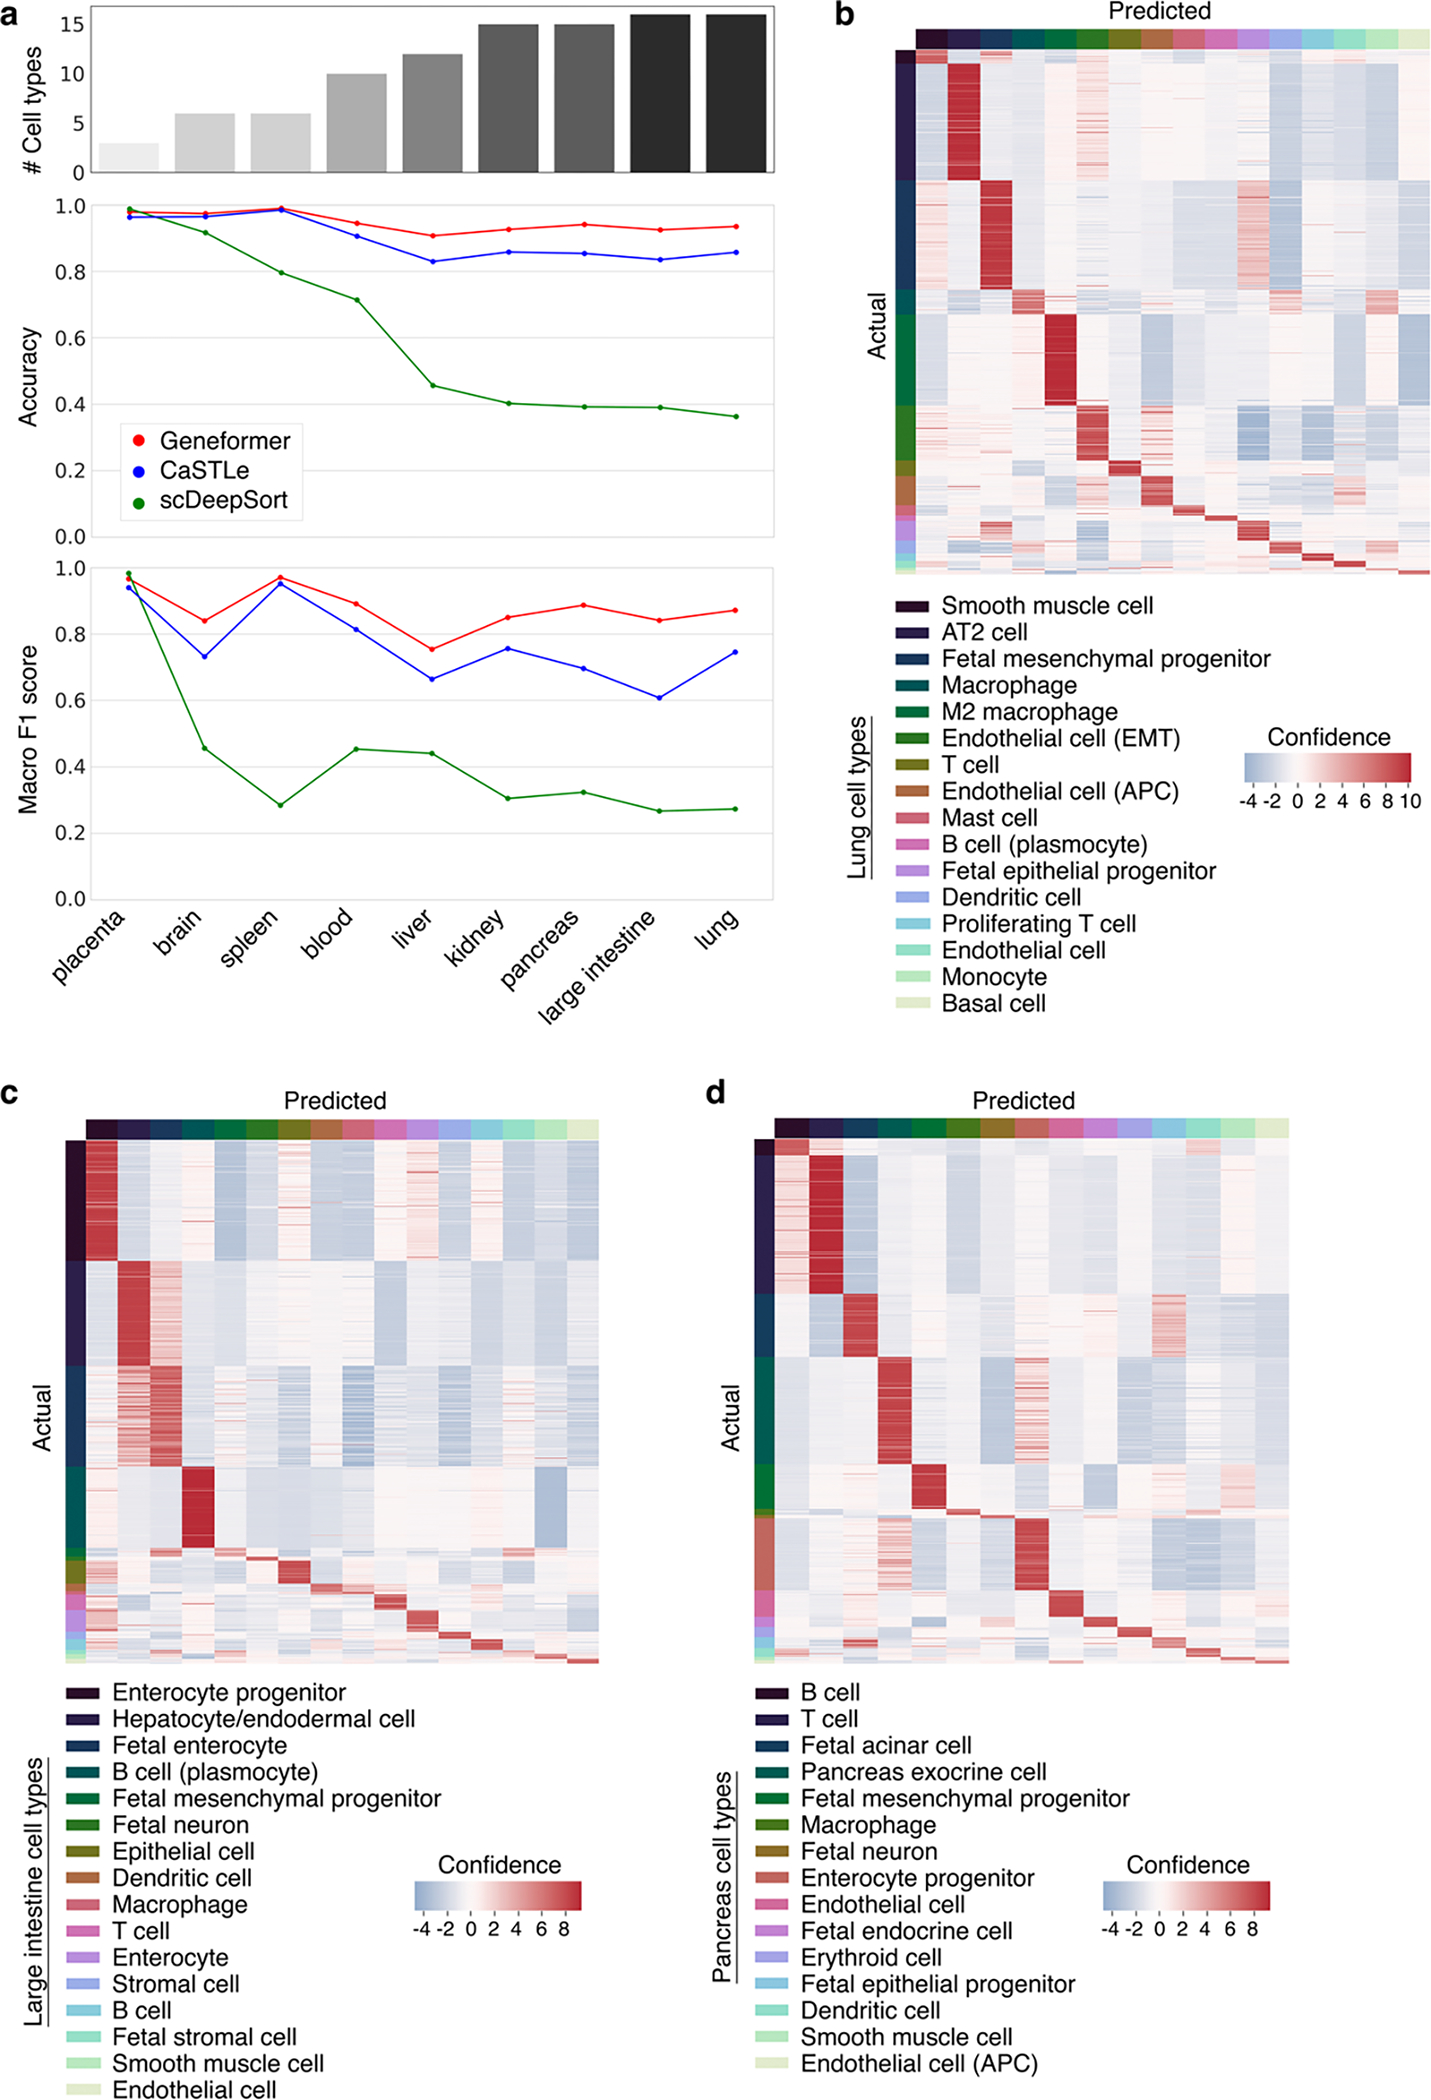
a, Predictive potential (as measured by accuracy and macro F1 score) of Geneformer fine-tuned for cell type annotation in the indicated human tissues as compared to XGBoost (CaSTLe) and deep neural network-based (scDeepSort) methods. The top bar graph indicates the number of cell type classes for each tissue; the gap in performance of Geneformer compared to alternatives increased as the number of cell type classes increased, indicating that Geneformer was robust in even increasingly complex multiclass prediction applications. b, Lung, c, large intestine, or d, pancreas out of sample predictions by Geneformer fine-tuned to distinguish cell types in each tissue (training on 80% of cells, predictions on held-out 20% of cells).
Extended Data Fig. 6 |. Embedding dimension activations distinguish cell types in fine-tuned Geneformer model.
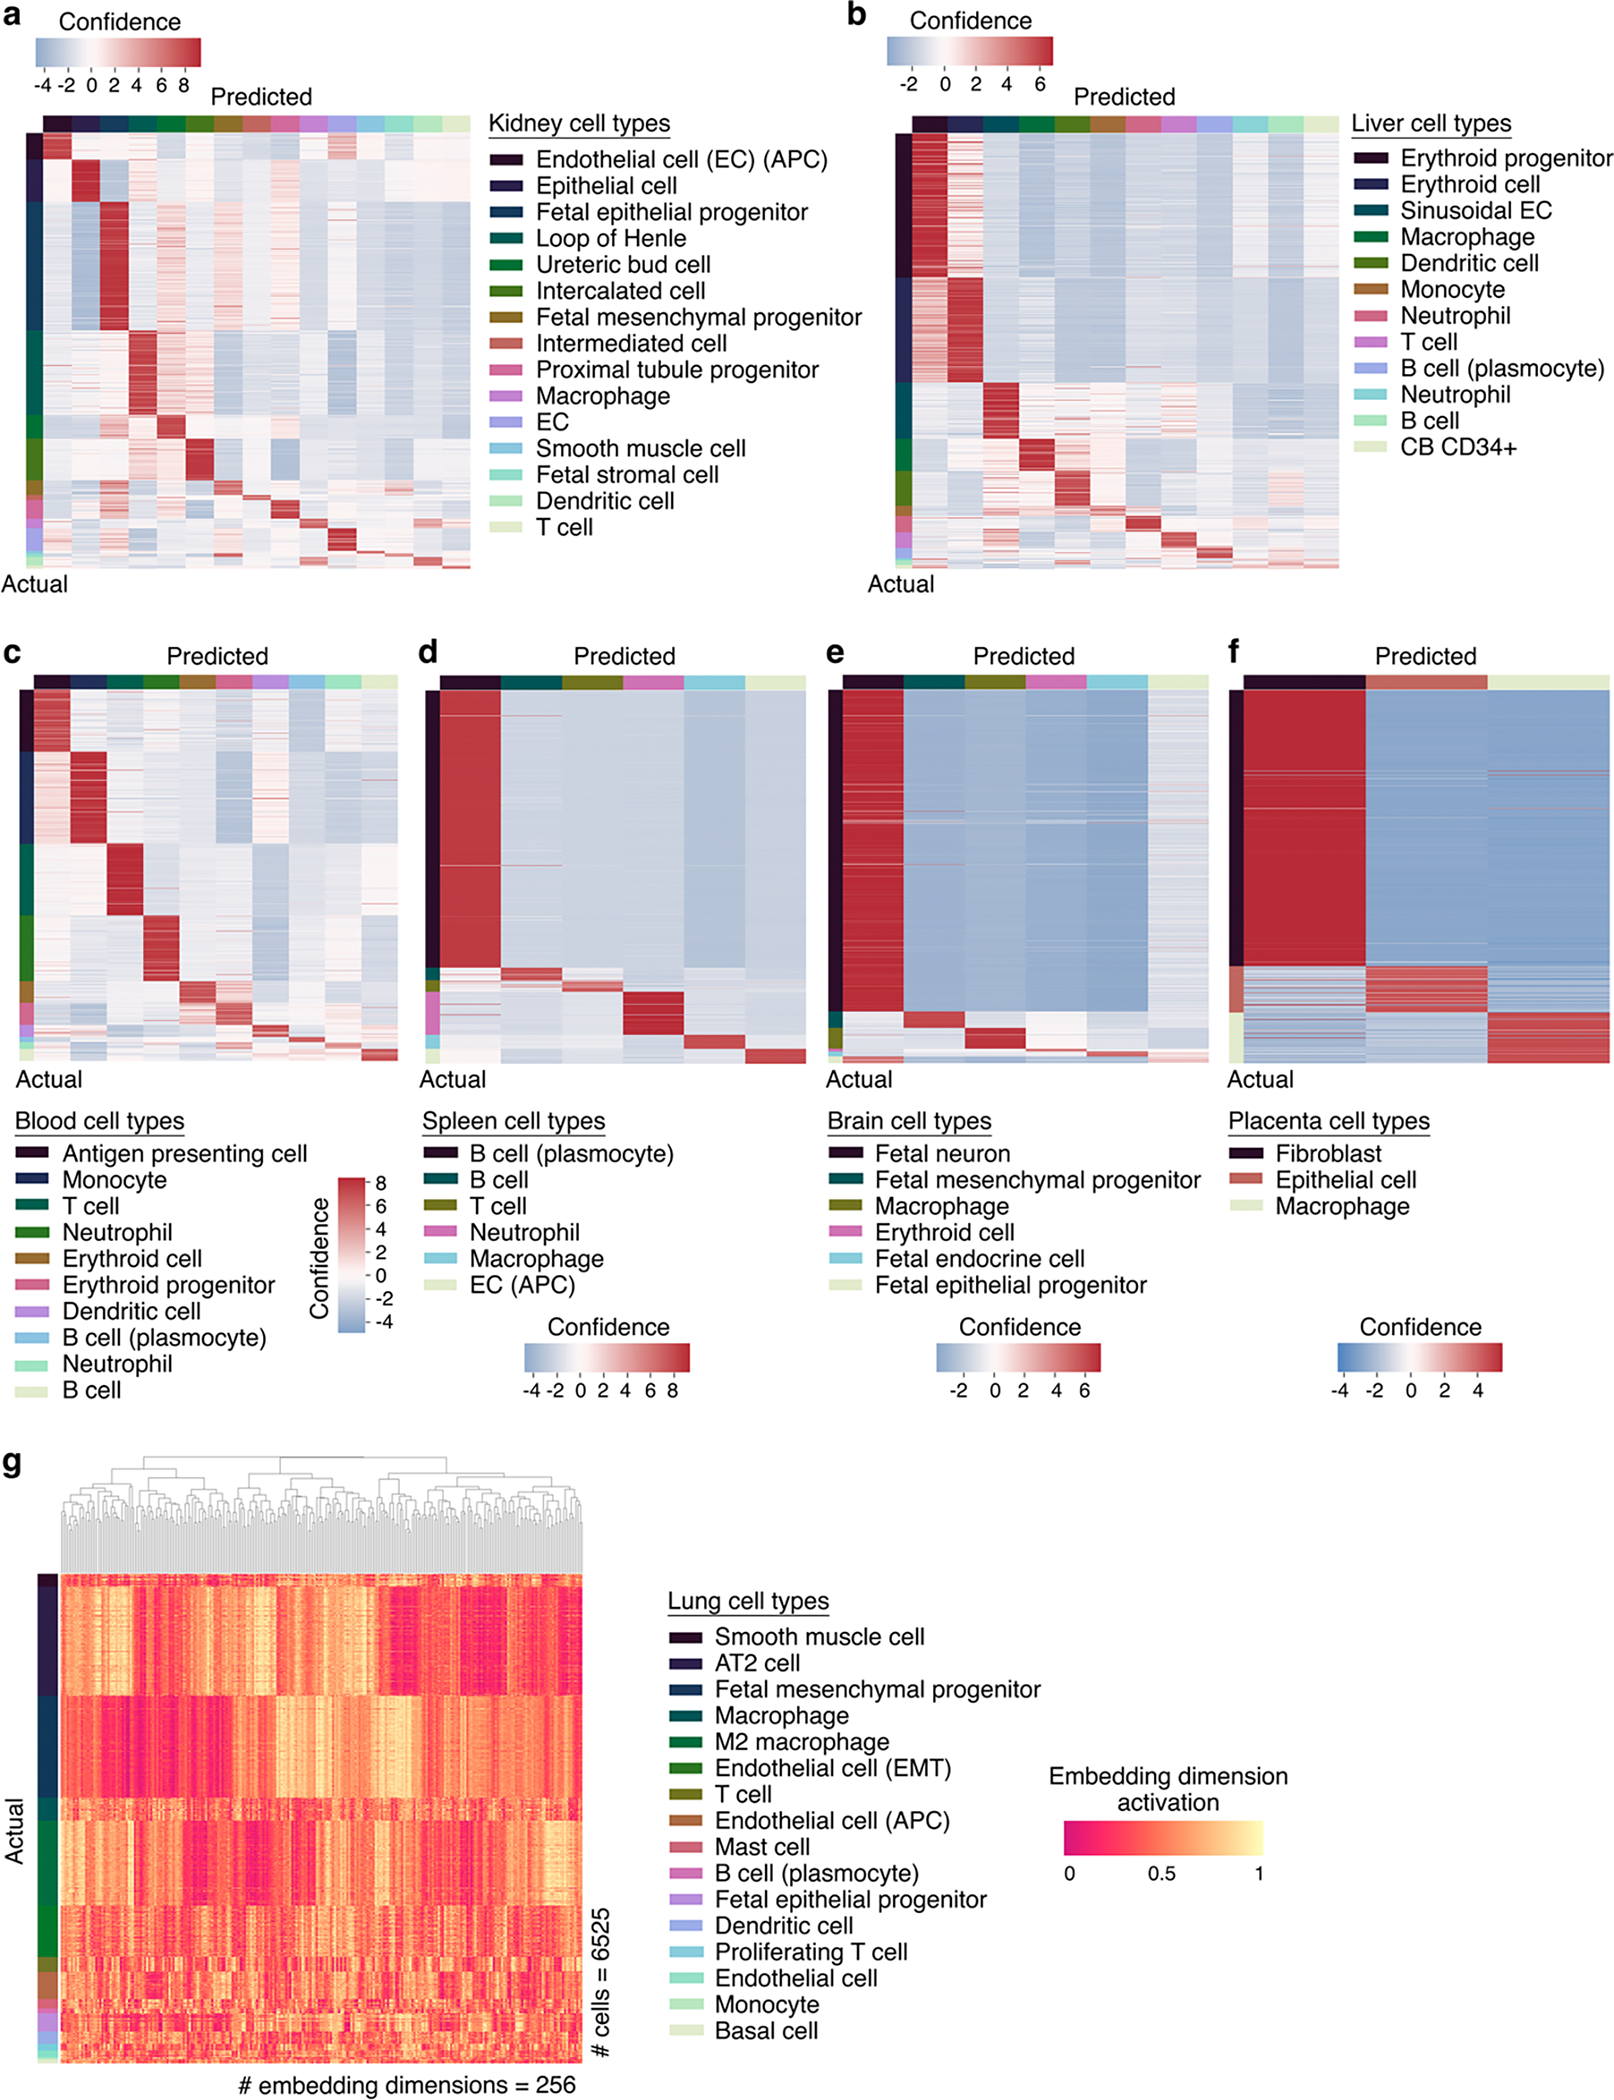
a, Kidney, b, liver, c, blood, d, spleen, e, brain, or f, placenta out of sample predictions by Geneformer fine-tuned to distinguish cell types in each tissue (training on 80% of cells, predictions on held-out 20% of cells). g, Specific embedding dimension activations distinguish each lung cell type in the fine-tuned model.
Extended Data Fig. 7 |. Geneformer boosted predictions in a diverse panel of downstream tasks.
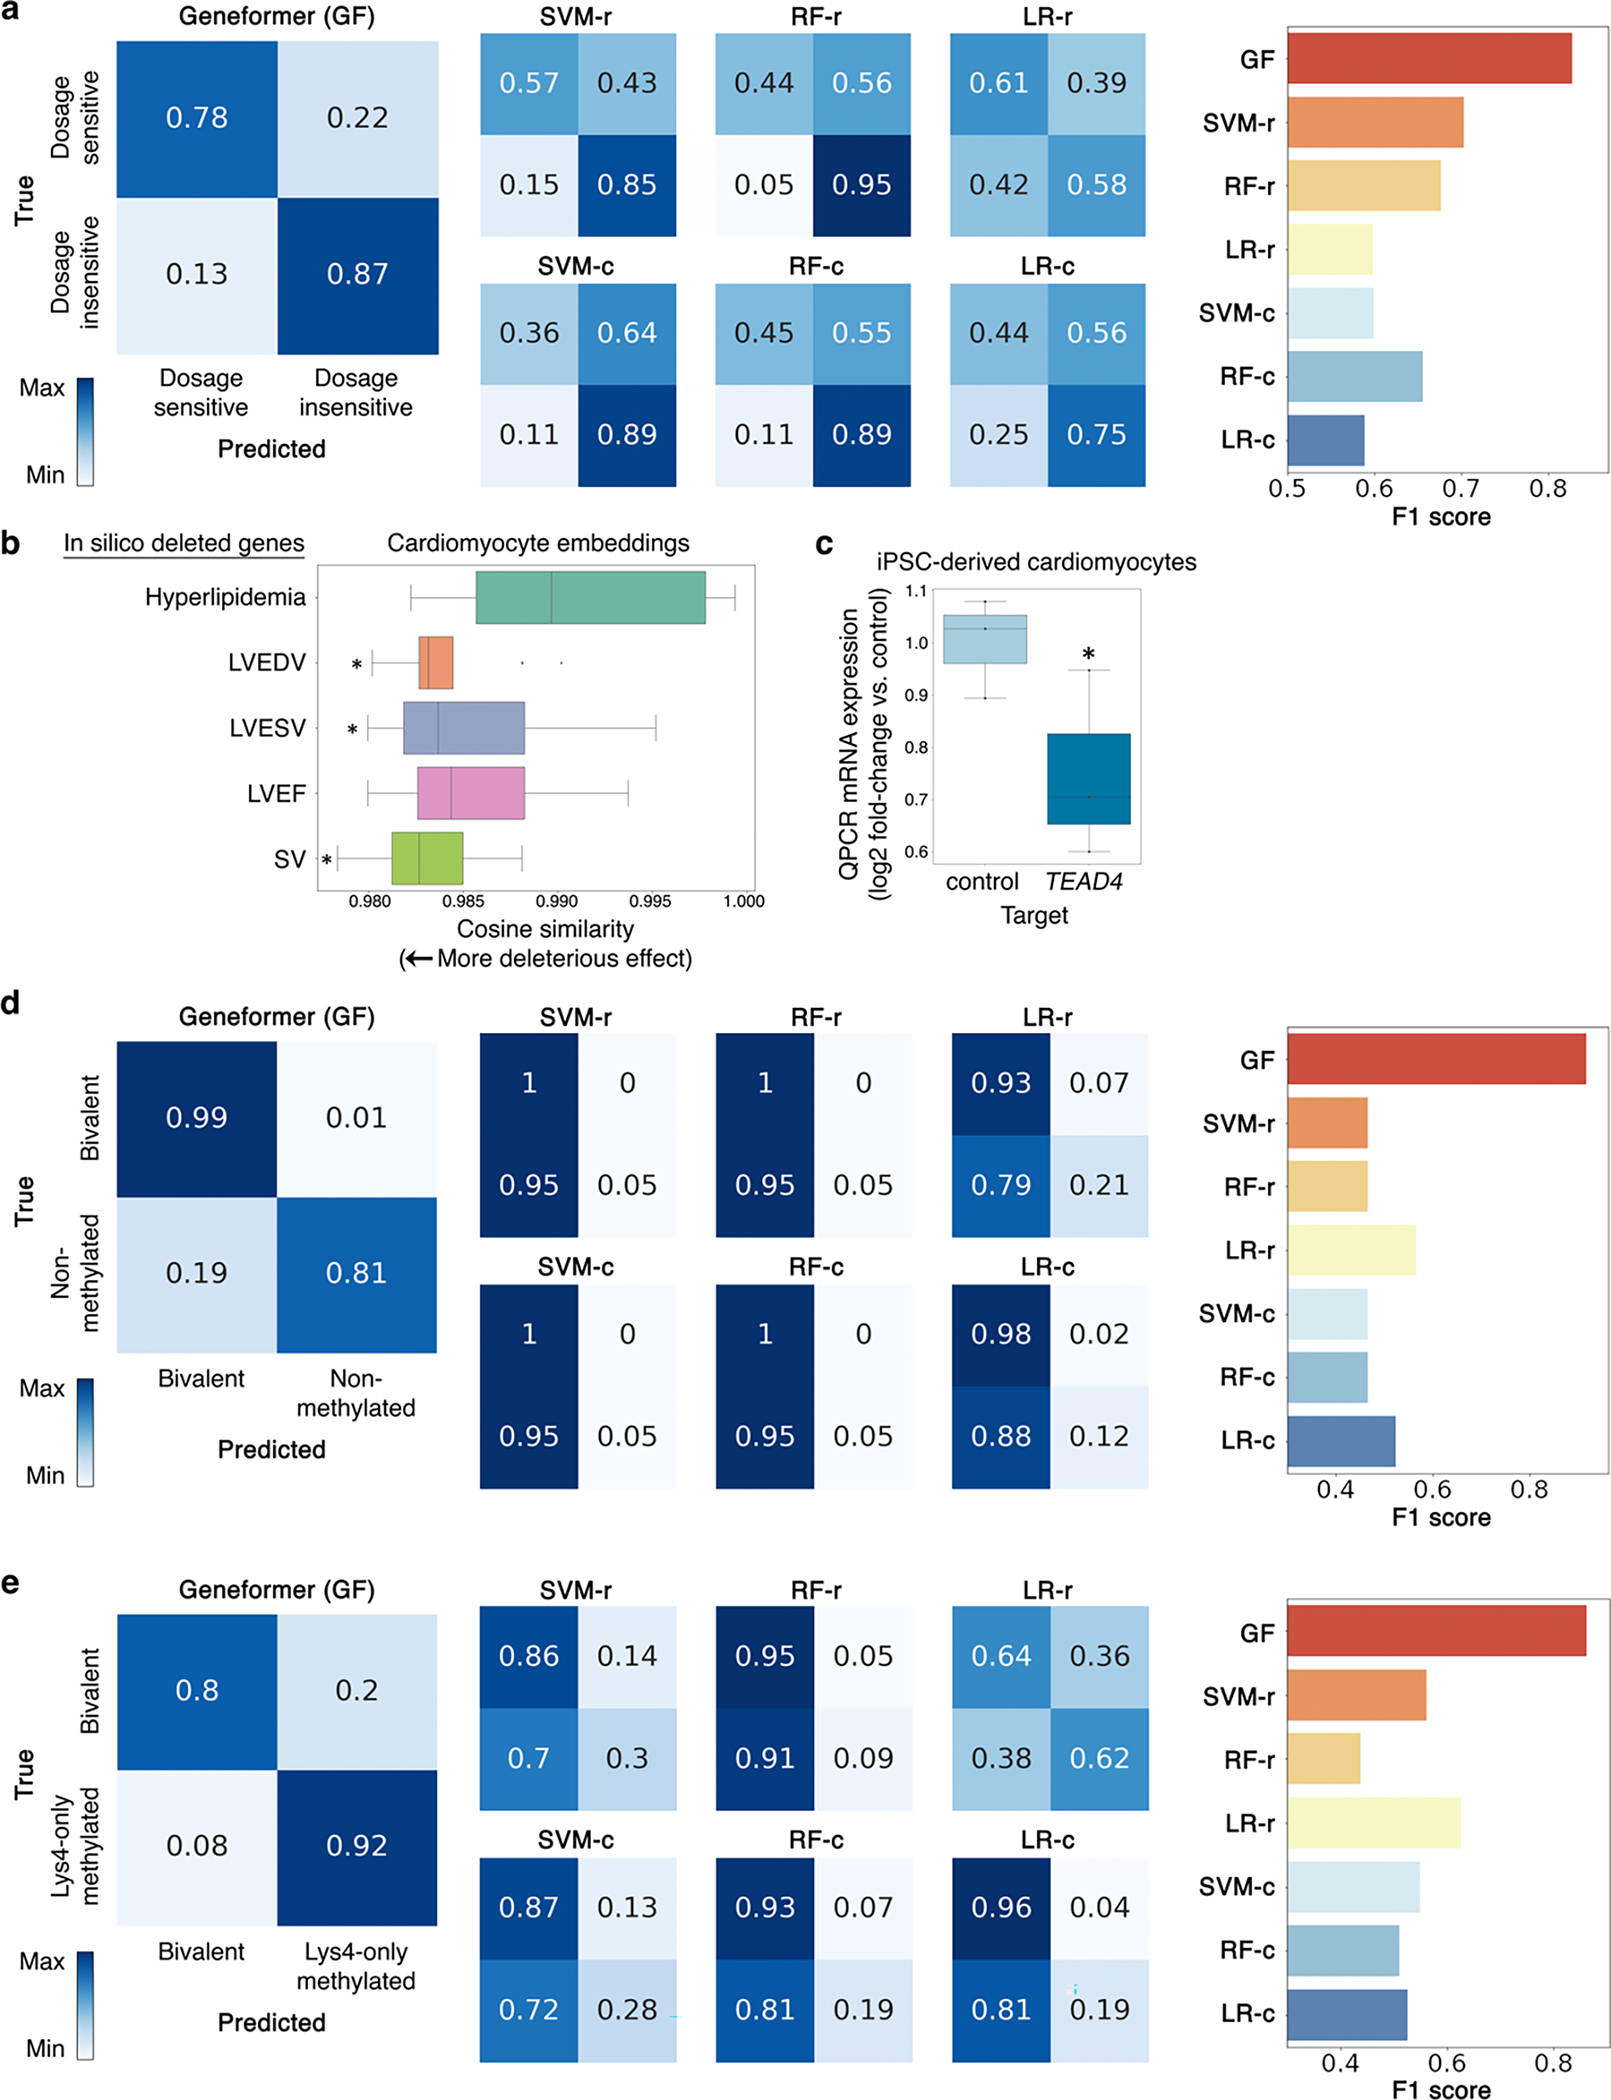
a, Confusion matrices and F1 score for Geneformer predictions vs. alternative methods (as described in Fig. 2a) for downstream task of distinguishing dosage-sensitive vs. insensitive transcription factors. b, Effect on cardiomyocyte embeddings from in silico deletion of genes linked by prior transcriptome-wide association study (TWAS)-prioritized GWAS24 to cardiac MRI traits relevant to cardiac pathology (left ventricular (LV) end diastolic volume (EDV), LV end systolic volume (LVESV), LV ejection fraction (LVEF), and stroke volume (SV)) compared to in silico deletion of control cardiac disease genes expressed in cardiomyocytes but whose pathology occurs in non-cardiomyocyte cell types (hyperlipidemia). (*p<0.05 by Wilcoxon, FDR-corrected; center line=median, box limits=upper and lower quartiles, whiskers=1.5x interquartile range, points=outliers). c, Quantitative PCR (QPCR) data of CRISPR-mediated knockout of TEAD4 in iPSC-derived cardiomyocytes (n=3, *p<0.05 by t-test; center line=median, box limits=upper and lower quartiles, whiskers=1.5x interquartile range, points=experimental replicates). d, Confusion matrices and F1 score for Geneformer predictions vs. alternative methods for downstream task of distinguishing bivalent vs. non-methylated genes (56 highly conserved loci28). e, Confusion matrices and F1 score for Geneformer predictions vs. alternative methods for downstream task of distinguishing bivalent vs. Lys4-only methylated genes (56 highly conserved loci28).
Extended Data Fig. 8 |. Geneformer boosted predictions in a diverse panel of downstream tasks.
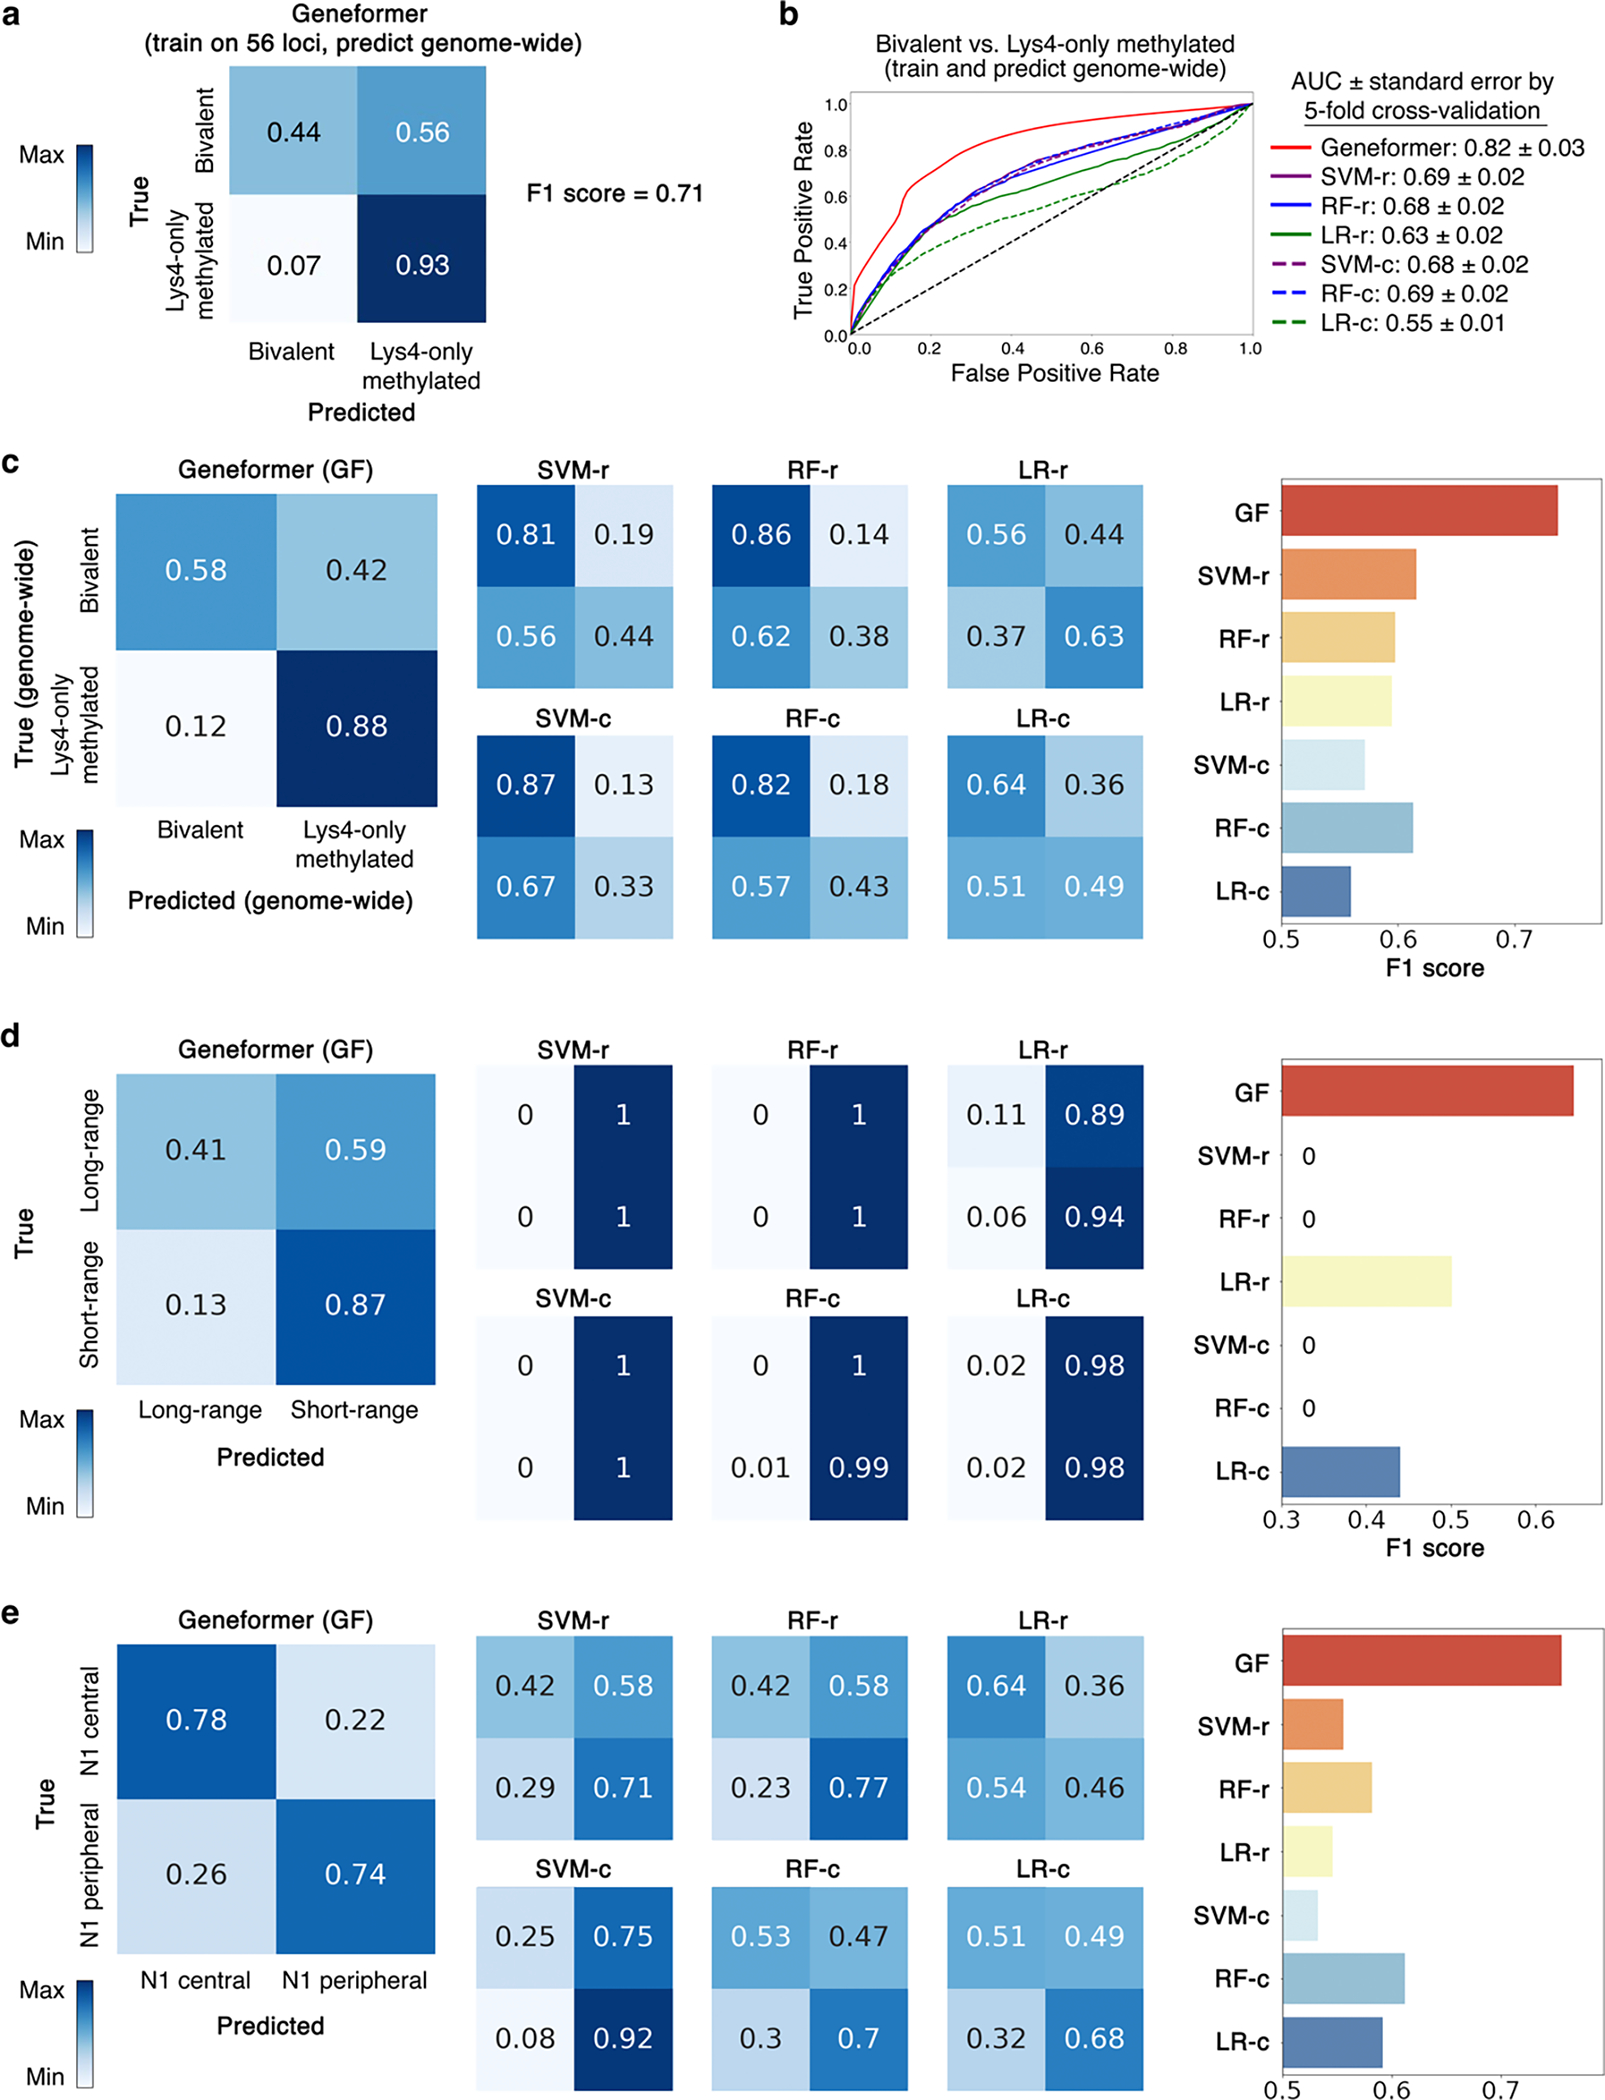
a, Confusion matrix and F1 score for Geneformer predictions vs. alternative methods (as described in Fig. 2a) for downstream task of distinguishing genome-wide30 bivalent vs. Lys4-only methylated genes with model fine-tuned only on 56 highly conserved loci28. b, ROC curve of Geneformer fine-tuned to distinguish genome-wide bivalent vs. Lys4-only-methylated genes using limited data (~15K ESCs), compared to alternative methods. c, Confusion matrices and F1 score for Geneformer predictions vs. alternative methods for downstream task of distinguishing genome-wide bivalent vs. non-methylated genes with model fine-tuned on 80% of genome-wide loci and predicting on 20% of out of sample loci. d, Confusion matrices and F1 score for Geneformer predictions vs. alternative methods for downstream task of distinguishing long- vs. short-range transcription factors. e, Confusion matrices and F1 score for Geneformer predictions vs. alternative methods for downstream task of distinguishing central vs. peripheral genes within the N1-dependent network in endothelial cells.
Extended Data Fig. 9 |. In silico deletion strategy revealed network connectivity.
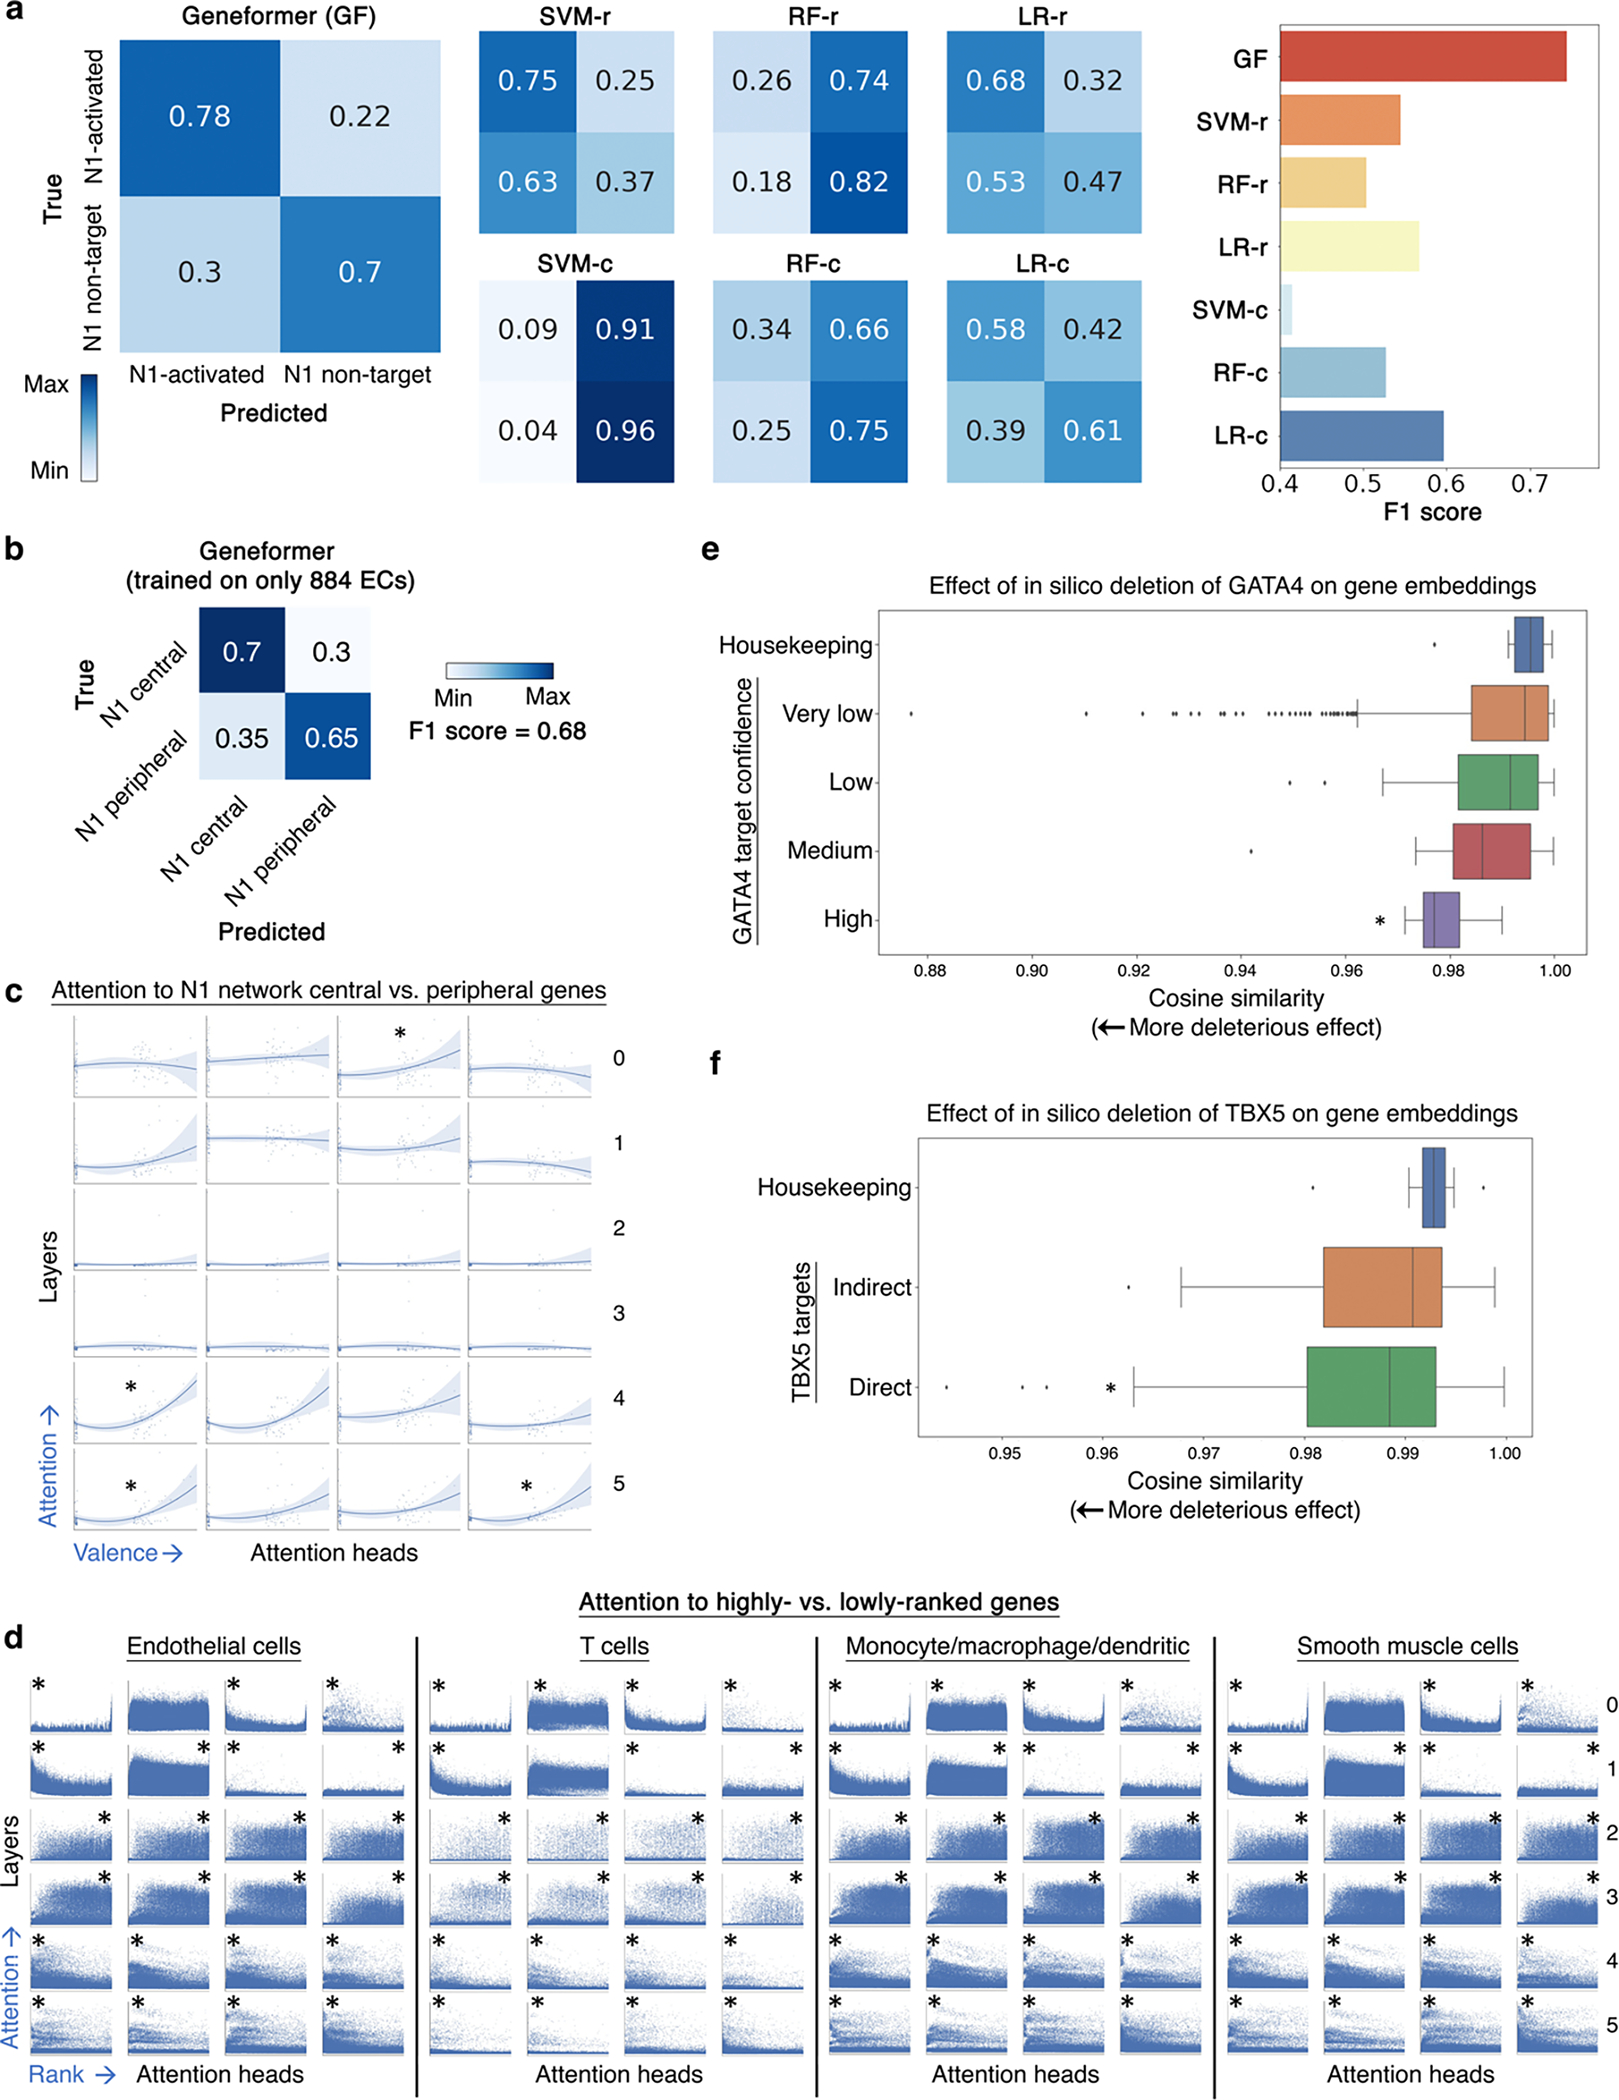
a, Confusion matrices and F1 score for Geneformer predictions vs. alternative methods (as described in Fig. 2a) for downstream task of distinguishing N1-activated vs. non-targets. b, Confusion matrix and F1 score of Geneformer predictions of central vs. peripheral genes within the N1-dependent network in endothelial cells (ECs) with model fine-tuned only on 884 ECs from healthy or dilated aortas14. c, Pretrained Geneformer attention weights in aortic ECs demonstrated that specific attention heads learned in a completely self-supervised way the relative centrality of the top most central versus most peripheral genes in the N1-dependent gene network (higher valence=more central) (*p<0.05 Wilcoxon, FDR-corrected). d, Pretrained Geneformer contextual attention versus gene rank in rank value encoding in the indicated aortic cell types, which each have different sets of highest ranked genes based on cell type context (higher rank is leftward on x axis) (*p<0.05 by Wilcoxon, FDR-corrected, * position = side with higher attention). All cells used for analysis had the same number of genes so that the rank values would be comparable. e, In silico deletion of GATA4 was significantly more deleterious to the previously reported highest confidence GATA4 targets33 than to housekeeping genes. f, In silico deletion of TBX5 was significantly more deleterious to previously reported TBX5 direct targets34 than to housekeeping genes or TBX5 indirect targets. In (d-e): *p<0.05 by Wilcoxon, FDR-corrected; center line=median, box limits=upper and lower quartiles, whiskers=1.5x interquartile range, points=outliers.
Extended Data Fig. 10 |. Geneformer fine-tuned cardiomyocyte embeddings clustered by phenotype.
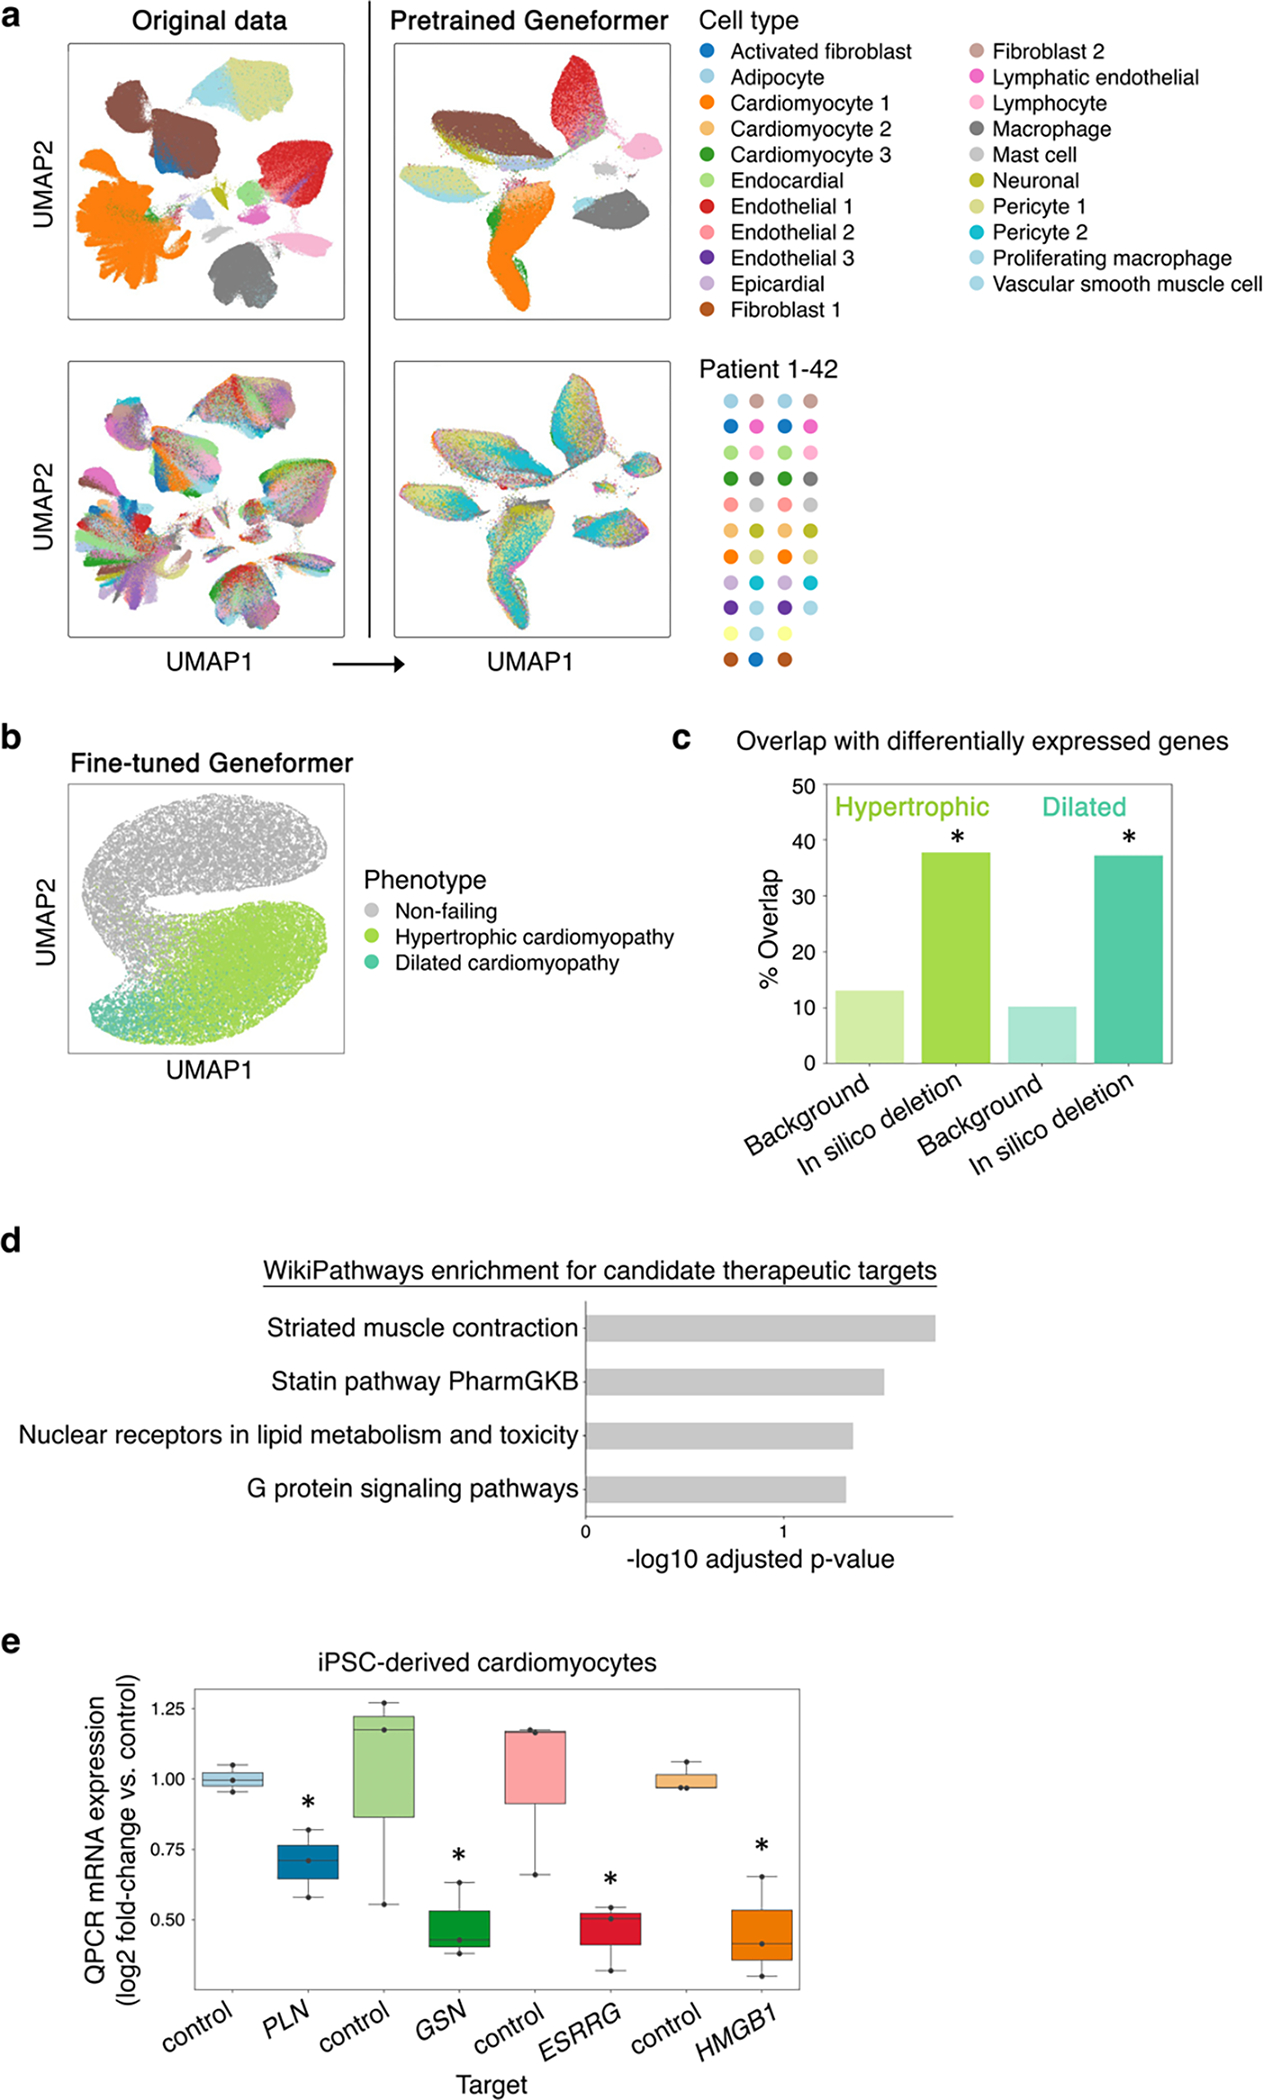
a, While original data (left) was highly affected by patient batch effect, cell embeddings generated by pretrained Geneformer (right) (without fine-tuning) clustered primarily by cell type. b, UMAP of cardiomyocyte embeddings from the model fine-tuned to distinguish cardiomyocytes in non-failing hearts from cardiomyocytes in patients with hypertrophic or dilated cardiomyopathy. c, Gene sets significantly associated with hypertrophic or dilated cardiomyopathy states by Geneformer in silico deletion disease modeling significantly overlapped with genes differentially expressed in those respective disease states (differentially expressed vs. non-failing) compared to the overlap of those differentially expressed genes with background genes (the remainder of the genes detected in cardiomyocytes that were not significantly associated with hypertrophic or dilated cardiomyopathy by Geneformer disease modeling) (*p<0.05 by X2 test, FDR-corrected). d, Pathway enrichment for genes whose in silico deletion in cardiomyocytes from hypertrophic cardiomyopathy patients significantly shifted embeddings towards the non-failing state and away from the dilated cardiomyopathy state, suggesting candidate therapeutic targets. e, QPCR data of CRISPR-mediated knockout of indicated genes in TTN+/− iPSC-derived cardiomyocytes (n=3, *p<0.05 by t-test). Center line=median, box limits=upper and lower quartiles, whiskers=1.5x interquartile range, points=experimental replicates.
Supplementary Material
Acknowledgements
We thank Jack Rae for helpful scientific discussions and Google Research for providing TPU resources for experimentation. PTE was supported by grants from the National Institutes of Health (1R01HL092577, 1R01HL157635, 5R01HL139731), American Heart Association Strategically Focused Research Networks (18SFRN34110082), and European Union (MAESTRIA 965286). CVT was supported by NIH T32GM007748 and the Helen Hay Whitney Foundation Postdoctoral Fellowship. LX was supported by the American Heart Association (20CDA35260081).
Footnotes
Competing Interests
XSL conducted this work while on faculty at Dana-Farber Cancer Institute and is currently a board member and CEO of GV20 Oncotherapy. PTE has received sponsored research support from Bayer AG, IBM Research, Bristol Myers Squibb, and Pfizer. PTE has also served on advisory boards or consulted for Bayer AG, MyoKardia, and Novartis. AC is an employee of Bayer US LLC (a subsidiary of Bayer AG) and may own stock in Bayer AG. EMB was a full-time employee of Bayer when this work was performed.
Code Availability
The pretrained Geneformer model, transcriptome tokenizer, and code for pretraining and fine-tuning the model are available on the Huggingface Model Hub at https://huggingface.co/ctheodoris/Geneformer. All other code used in this study is available upon request from the corresponding authors.
Data Availability
Genecorpus-30M is available on the Huggingface Dataset Hub at https://huggingface.co/datasets/ctheodoris/Genecorpus-30M.
References
- 1.Vaswani A Attention Is All You Need arXiv:1706.03762v5. Adv Neural Inf Process Syst 2017-Decem, (2017). [Google Scholar]
- 2.Devlin J, Chang MW, Lee K & Toutanova K BERT: Pre-training of deep bidirectional transformers for language understanding. in NAACL HLT 2019 – 2019 Conference of the North American Chapter of the Association for Computational Linguistics: Human Language Technologies - Proceedings of the Conference vol. 1 4174–4186 (2019). [Google Scholar]
- 3.He K, Zhang X, Ren S & Sun J Deep residual learning for image recognition. in Proceedings of the IEEE Computer Society Conference on Computer Vision and Pattern Recognition vols 2016-December 770–778 (2016). [Google Scholar]
- 4.Theodoris CV et al. Human disease modeling reveals integrated transcriptional and epigenetic mechanisms of NOTCH1 haploinsufficiency. Cell 160, 1072–1086 (2015). [DOI] [PMC free article] [PubMed] [Google Scholar]
- 5.Theodoris CV et al. Network-based screen in iPSC-derived cells reveals therapeutic candidate for heart valve disease. Science (1979) 371, (2021). [DOI] [PMC free article] [PubMed] [Google Scholar]
- 6.Shao X et al. ScDeepSort: A pre-trained cell-type annotation method for single-cell transcriptomics using deep learning with a weighted graph neural network. Nucleic Acids Res 49, e122 (2021). [DOI] [PMC free article] [PubMed] [Google Scholar]
- 7.Lieberman Y, Rokach L & Shay T CaSTLe - Classification of single cells by transfer learning: Harnessing the power of publicly available single cell RNA sequencing experiments to annotate new experiments. PLoS One 13, (2018). [DOI] [PMC free article] [PubMed] [Google Scholar]
- 8.Lin T, Wang Y, Liu X & Qiu X A Survey of Transformers. ArXiv (2021). [Google Scholar]
- 9.Ren J et al. ZeRO-offload: Democratizing billion-scale model training. in 2021 USENIX Annual Technical Conference (2021). [Google Scholar]
- 10.Rajbhandari S, Rasley J, Ruwase O & He Y Zero: Memory optimizations toward training trillion parameter models. in International Conference for High Performance Computing, Networking, Storage and Analysis, SC vols 2020-November (2020). [Google Scholar]
- 11.Selewa A et al. Systematic Comparison of High-throughput Single-Cell and Single-Nucleus Transcriptomes during Cardiomyocyte Differentiation. Sci Rep 10, 1535 (2020). [DOI] [PMC free article] [PubMed] [Google Scholar]
- 12.10x Genomics Datasets. https://www.10xgenomics.com/resources/datasets/frozen-pbm-cs-donor-a-1-standard-1-1-0.
- 13.10X Genomics Datasets. https://www.10xgenomics.com/resources/datasets/fresh-68-k-pbm-cs-donor-a-1-standard-1-1-0.
- 14.Li Y et al. Single-Cell Transcriptome Analysis Reveals Dynamic Cell Populations and Differential Gene Expression Patterns in Control and Aneurysmal Human Aortic Tissue. Circulation 142, 1374–1388 (2020). [DOI] [PMC free article] [PubMed] [Google Scholar]
- 15.Xing QR et al. Diversification of reprogramming trajectories revealed by parallel single-cell transcriptome and chromatin accessibility sequencing. Sci Adv 6, 463–474 (2020). [DOI] [PMC free article] [PubMed] [Google Scholar]
- 16.Guo D et al. iMyoblasts for ex vivo and in vivo investigations of human myogenesis and disease modeling. Elife 11, e70341 (2022). [DOI] [PMC free article] [PubMed] [Google Scholar]
- 17.Zhang Y, Parmigiani G & Johnson WE ComBat-seq: Batch effect adjustment for RNA-seq count data. NAR Genom Bioinform 2, (2020). [DOI] [PMC free article] [PubMed] [Google Scholar]
- 18.Korsunsky I et al. Fast, sensitive and accurate integration of single-cell data with Harmony. Nat Methods 16, 1289–1296 (2019). [DOI] [PMC free article] [PubMed] [Google Scholar]
- 19.Lek M et al. Analysis of protein-coding genetic variation in 60,706 humans. Nature 536, 285–291 (2016). [DOI] [PMC free article] [PubMed] [Google Scholar]
- 20.Shihab HA, Rogers MF, Campbell C & Gaunt TR HIPred: An integrative approach to predicting haploinsufficient genes. Bioinformatics 33, 1751–1757 (2017). [DOI] [PMC free article] [PubMed] [Google Scholar]
- 21.Ni Z, Zhou XY, Aslam S & Niu DK Characterization of Human Dosage-Sensitive Transcription Factor Genes. Front Genet 10, 1208 (2019). [DOI] [PMC free article] [PubMed] [Google Scholar]
- 22.Collins RL et al. A cross-disorder dosage sensitivity map of the human genome. Cell 185, 3041–3055.e25 (2022). [DOI] [PMC free article] [PubMed] [Google Scholar]
- 23.Cao J et al. A human cell atlas of fetal gene expression. Science (1979) 370, 808 (2020). [DOI] [PMC free article] [PubMed] [Google Scholar]
- 24.Pirruccello JP et al. Analysis of cardiac magnetic resonance imaging in 36,000 individuals yields genetic insights into dilated cardiomyopathy. Nat Commun 11, 2254 (2020). [DOI] [PMC free article] [PubMed] [Google Scholar]
- 25.Bolte C et al. Expression of Foxm1 transcription factor in cardiomyocytes is required for myocardial development. PLoS One 6, e22217 (2011). [DOI] [PMC free article] [PubMed] [Google Scholar]
- 26.Bolte C et al. Postnatal Ablation of Foxm1 from Cardiomyocytes Causes Late Onset Cardiac Hypertrophy and Fibrosis without Exacerbating Pressure Overload-Induced Cardiac Remodeling. PLoS One 7, e48713 (2012). [DOI] [PMC free article] [PubMed] [Google Scholar]
- 27.Currey L, Thor S & Piper M TEAD family transcription factors in development and disease. Development (Cambridge) 148, (2021). [DOI] [PubMed] [Google Scholar]
- 28.Bernstein BE et al. A Bivalent Chromatin Structure Marks Key Developmental Genes in Embryonic Stem Cells. Cell 125, 315–356 (2006). [DOI] [PubMed] [Google Scholar]
- 29.Franzén O, Gan L-M & Björkegren JLM PanglaoDB: a web server for exploration of mouse and human single-cell RNA sequencing data. Database (Oxford) 2019, baz406 (2019). [DOI] [PMC free article] [PubMed] [Google Scholar]
- 30.Pan G et al. Whole-Genome Analysis of Histone H3 Lysine 4 and Lysine 27 Methylation in Human Embryonic Stem Cells. Cell Stem Cell 1, 299–312 (2007). [DOI] [PubMed] [Google Scholar]
- 31.Chen CH et al. Determinants of transcription factor regulatory range. Nat Commun 11, 2472 (2020). [DOI] [PMC free article] [PubMed] [Google Scholar]
- 32.Litviňuková M et al. Cells of the adult human heart. Nature 588, 455–472 (2020). [DOI] [PMC free article] [PubMed] [Google Scholar]
- 33.Ang YS et al. Disease Model of GATA4 Mutation Reveals Transcription Factor Cooperativity in Human Cardiogenesis. Cell 167, 1734–1749 (2016). [DOI] [PMC free article] [PubMed] [Google Scholar]
- 34.Kathiriya IS et al. Modeling Human TBX5 Haploinsufficiency Predicts Regulatory Networks for Congenital Heart Disease. Dev Cell 56, 292–309 (2021). [DOI] [PMC free article] [PubMed] [Google Scholar]
- 35.Chaffin M et al. Single-nucleus profiling of human dilated and hypertrophic cardiomyopathy. Nature 608, 174–180 (2022). [DOI] [PubMed] [Google Scholar]
- 36.Hinson JT et al. Titin mutations in iPS cells define sarcomere insufficiency as a cause of dilated cardiomyopathy. Science (1979) 349, 982–986 (2015). [DOI] [PMC free article] [PubMed] [Google Scholar]
- 37.Seidman CE & Seidman JG Identifying sarcomere gene mutations in hypertrophic cardiomyopathy: A personal history. Circ Res 108, 743–750 (2011). [DOI] [PMC free article] [PubMed] [Google Scholar]
- 38.Kamisago M et al. Mutations in Sarcomere Protein Genes as a Cause of Dilated Cardiomyopathy. New England Journal of Medicine 343, 1688–1696 (2000). [DOI] [PubMed] [Google Scholar]
- 39.Ramaccini D et al. Mitochondrial Function and Dysfunction in Dilated Cardiomyopathy. Frontiers in Cell and Developmental Biology vol. 8 Preprint at 10.3389/fcell.2020.624216 (2021). [DOI] [PMC free article] [PubMed] [Google Scholar]
- 40.Ho D, Yan L, Iwatsubo K, Vatner DE & Vatner SF Modulation of β-adrenergic receptor signaling in heart failure and longevity: targeting adenylyl cyclase type 5. Heart Fail Rev 15, 495–512 (2010). [DOI] [PMC free article] [PubMed] [Google Scholar]
- 41.Wagner AH et al. DGIdb 2.0: Mining clinically relevant drug-gene interactions. Nucleic Acids Res 44, D1036–D1044 (2016). [DOI] [PMC free article] [PubMed] [Google Scholar]
- 42.Nakagawa O et al. Centronuclear myopathy in mice lacking a novel muscle-specific protein kinase transcriptionally regulated by MEF2. Genes Dev 19, 2066–2077 (2005). [DOI] [PMC free article] [PubMed] [Google Scholar]
- 43.Akazawa H & Komuro I Roles of cardiac transcription factors in cardiac hypertrophy. Circulation Research vol. 92 1079–1088 Preprint at 10.1161/01.RES.0000072977.86706.23 (2003). [DOI] [PubMed] [Google Scholar]
- 44.Henighan T et al. Scaling Laws for Autoregressive Generative Modeling. CoRR abs/2010.14701, (2020). [Google Scholar]
- 45.Madissoon E et al. ScRNA-seq assessment of the human lung, spleen, and esophagus tissue stability after cold preservation. Genome Biol 21, (2019). [DOI] [PMC free article] [PubMed] [Google Scholar]
- 46.Anderson DJ et al. NKX2–5 regulates human cardiomyogenesis via a HEY2 dependent transcriptional network. Nat Commun 9, 1373 (2018). [DOI] [PMC free article] [PubMed] [Google Scholar]
- 47.Smillie CS et al. Intra- and Inter-cellular Rewiring of the Human Colon during Ulcerative Colitis. Cell 178, (2019). [DOI] [PMC free article] [PubMed] [Google Scholar]
- 48.Lee JS et al. Immunophenotyping of covid-19 and influenza highlights the role of type i interferons in development of severe covid-19. Sci Immunol 5, (2020). [DOI] [PMC free article] [PubMed] [Google Scholar]
- 49.Baron M et al. A Single-Cell Transcriptomic Map of the Human and Mouse Pancreas Reveals Inter- and Intra-cell Population Structure. Cell Syst 3, 346–360.e4 (2016). [DOI] [PMC free article] [PubMed] [Google Scholar]
- 50.Fang Z et al. Single-Cell Heterogeneity Analysis and CRISPR Screen Identify Key β-Cell-Specific Disease Genes. Cell Rep 26, 3132–3144.e7 (2019). [DOI] [PMC free article] [PubMed] [Google Scholar]
- 51.Agarwal D et al. A single-cell atlas of the human substantia nigra reveals cell-specific pathways associated with neurological disorders. Nat Commun 11, 4183 (2020). [DOI] [PMC free article] [PubMed] [Google Scholar]
- 52.Rasouli J et al. A distinct GM-CSF+ T helper cell subset requires T-bet to adopt a TH1 phenotype and promote neuroinflammation. Sci Immunol 5, (2020). [DOI] [PubMed] [Google Scholar]
- 53.Park J-E et al. A cell atlas of human thymic development defines T cell repertoire formation. Science 367, (2020). [DOI] [PMC free article] [PubMed] [Google Scholar]
- 54.Mende N et al. Quantitative and molecular differences distinguish adult human medullary and extramedullary haematopoietic stem and progenitor cell landscapes. (2020) doi: 10.1101/2020.01.26.919753. [DOI] [Google Scholar]
- 55.Setty M et al. Characterization of cell fate probabilities in single-cell data with Palantir. Nat Biotechnol 37, 451–460 (2019). [DOI] [PMC free article] [PubMed] [Google Scholar]
- 56.Popescu D-M et al. Decoding human fetal liver haematopoiesis. Nature 574, 365–371 (2019). [DOI] [PMC free article] [PubMed] [Google Scholar]
- 57.Vento-Tormo R et al. Single-cell reconstruction of the early maternal-fetal interface in humans. Nature 563, 347–353 (2018). [DOI] [PMC free article] [PubMed] [Google Scholar]
- 58.Ramachandran P et al. Resolving the fibrotic niche of human liver cirrhosis at single-cell level. Nature 575, 512–518 (2019). [DOI] [PMC free article] [PubMed] [Google Scholar]
- 59.Kinchen J et al. Structural Remodeling of the Human Colonic Mesenchyme in Inflammatory Bowel Disease. Cell 175, 372–386.e17 (2018). [DOI] [PMC free article] [PubMed] [Google Scholar]
- 60.James KR et al. Distinct microbial and immune niches of the human colon. Nat Immunol 21, 343–353 (2020). [DOI] [PMC free article] [PubMed] [Google Scholar]
- 61.Zhou L et al. Single-Cell RNA-Seq Analysis Uncovers Distinct Functional Human NKT Cell Sub-Populations in Peripheral Blood. Front Cell Dev Biol 8, 384 (2020). [DOI] [PMC free article] [PubMed] [Google Scholar]
- 62.Liao J et al. Single-cell RNA sequencing of human kidney. Sci Data 7, 4 (2020). [DOI] [PMC free article] [PubMed] [Google Scholar]
- 63.Jäkel S et al. Altered human oligodendrocyte heterogeneity in multiple sclerosis. Nature 566, 543–547 (2019). [DOI] [PMC free article] [PubMed] [Google Scholar]
- 64.Merrick D et al. Identification of a mesenchymal progenitor cell hierarchy in adipose tissue. Science 364, (2019). [DOI] [PMC free article] [PubMed] [Google Scholar]
- 65.Habermann AC et al. Single-cell RNA sequencing reveals profibrotic roles of distinct epithelial and mesenchymal lineages in pulmonary fibrosis. Sci Adv 6, eaba1972 (2020). [DOI] [PMC free article] [PubMed] [Google Scholar]
- 66.Rosa FF et al. Direct reprogramming of fibroblasts into antigen-presenting dendritic cells. Sci Immunol 3, (2018). [DOI] [PubMed] [Google Scholar]
- 67.Stewart BJ et al. Spatiotemporal immune zonation of the human kidney. Science 365, 1461–1466 (2019). [DOI] [PMC free article] [PubMed] [Google Scholar]
- 68.MacParland SA et al. Single cell RNA sequencing of human liver reveals distinct intrahepatic macrophage populations. Nat Commun 9, 4383 (2018). [DOI] [PMC free article] [PubMed] [Google Scholar]
- 69.Welch J et al. Integrative inference of brain cell similarities and differences from single-cell genomics. (2018) doi: 10.1101/459891. [DOI] [Google Scholar]
- 70.Ledergor G et al. Single cell dissection of plasma cell heterogeneity in symptomatic and asymptomatic myeloma. Nat Med 24, 1867–1876 (2018). [DOI] [PubMed] [Google Scholar]
- 71.Lukowski SW et al. A single-cell transcriptome atlas of the adult human retina. EMBO J 38, e100811 (2019). [DOI] [PMC free article] [PubMed] [Google Scholar]
- 72.Kang HM et al. Multiplexed droplet single-cell RNA-sequencing using natural genetic variation. Nat Biotechnol 36, 89–94 (2018). [DOI] [PMC free article] [PubMed] [Google Scholar]
- 73.Zirkel A et al. HMGB2 Loss upon Senescence Entry Disrupts Genomic Organization and Induces CTCF Clustering across Cell Types. Mol Cell 70, 730–744.e6 (2018). [DOI] [PubMed] [Google Scholar]
- 74.Goudot C et al. Aryl Hydrocarbon Receptor Controls Monocyte Differentiation into Dendritic Cells versus Macrophages. Immunity 47, 582–596.e6 (2017). [DOI] [PubMed] [Google Scholar]
- 75.McCauley KB et al. Single-Cell Transcriptomic Profiling of Pluripotent Stem Cell-Derived SCGB3A2+ Airway Epithelium. Stem Cell Reports 10, 1579–1595 (2018). [DOI] [PMC free article] [PubMed] [Google Scholar]
- 76.Das R et al. Early B cell changes predict autoimmunity following combination immune checkpoint blockade. J Clin Invest 128, 715–720 (2018). [DOI] [PMC free article] [PubMed] [Google Scholar]
- 77.Kini Bailur J et al. Changes in bone marrow innate lymphoid cell subsets in monoclonal gammopathy: target for IMiD therapy. Blood Adv 1, 2343–2347 (2017). [DOI] [PMC free article] [PubMed] [Google Scholar]
- 78.Patil VS et al. Precursors of human CD4+ cytotoxic T lymphocytes identified by single-cell transcriptome analysis. Sci Immunol 3, (2018). [DOI] [PMC free article] [PubMed] [Google Scholar]
- 79.Wang C et al. Expansion of hedgehog disrupts mesenchymal identity and induces emphysema phenotype. J Clin Invest 128, 4343–4358 (2018). [DOI] [PMC free article] [PubMed] [Google Scholar]
- 80.Hermann BP et al. The Mammalian Spermatogenesis Single-Cell Transcriptome, from Spermatogonial Stem Cells to Spermatids. Cell Rep 25, 1650–1667.e8 (2018). [DOI] [PMC free article] [PubMed] [Google Scholar]
- 81.Menon R et al. Single-cell analysis of progenitor cell dynamics and lineage specification in the human fetal kidney. Development 145, (2018). [DOI] [PMC free article] [PubMed] [Google Scholar]
- 82.Czerniecki SM et al. High-Throughput Screening Enhances Kidney Organoid Differentiation from Human Pluripotent Stem Cells and Enables Automated Multidimensional Phenotyping. Cell Stem Cell 22, 929–940.e4 (2018). [DOI] [PMC free article] [PubMed] [Google Scholar]
- 83.Papa L et al. Ex vivo human HSC expansion requires coordination of cellular reprogramming with mitochondrial remodeling and p53 activation. Blood Adv 2, 2766–2779 (2018). [DOI] [PMC free article] [PubMed] [Google Scholar]
- 84.Schulthess J et al. The Short Chain Fatty Acid Butyrate Imprints an Antimicrobial Program in Macrophages. Immunity 50, 432–445.e7 (2019). [DOI] [PMC free article] [PubMed] [Google Scholar]
- 85.Guo J et al. The adult human testis transcriptional cell atlas. Cell Res 28, 1141–1157 (2018). [DOI] [PMC free article] [PubMed] [Google Scholar]
- 86.Karow M et al. Direct pericyte-to-neuron reprogramming via unfolding of a neural stem cell-like program. Nat Neurosci 21, 932–940 (2018). [DOI] [PMC free article] [PubMed] [Google Scholar]
- 87.Xin Y et al. Pseudotime Ordering of Single Human β-Cells Reveals States of Insulin Production and Unfolded Protein Response. Diabetes 67, 1783–1794 (2018). [DOI] [PubMed] [Google Scholar]
- 88.Phipson B et al. Evaluation of variability in human kidney organoids. Nat Methods 16, 79–87 (2019). [DOI] [PMC free article] [PubMed] [Google Scholar]
- 89.Balan S et al. Large-Scale Human Dendritic Cell Differentiation Revealing Notch-Dependent Lineage Bifurcation and Heterogeneity. Cell Rep 24, 1902–1915.e6 (2018). [DOI] [PMC free article] [PubMed] [Google Scholar]
- 90.Milpied P et al. Human germinal center transcriptional programs are de-synchronized in B cell lymphoma. Nat Immunol 19, 1013–1024 (2018). [DOI] [PubMed] [Google Scholar]
- 91.Parikh K et al. Colonic epithelial cell diversity in health and inflammatory bowel disease. Nature 567, 49–55 (2019). [DOI] [PubMed] [Google Scholar]
- 92.Habiel DM et al. CCR10+ epithelial cells from idiopathic pulmonary fibrosis lungs drive remodeling. JCI Insight 3, (2018). [DOI] [PMC free article] [PubMed] [Google Scholar]
- 93.Paik DT et al. Large-Scale Single-Cell RNA-Seq Reveals Molecular Signatures of Heterogeneous Populations of Human Induced Pluripotent Stem Cell-Derived Endothelial Cells. Circ Res 123, 443–450 (2018). [DOI] [PMC free article] [PubMed] [Google Scholar]
- 94.Martin JC et al. Single-Cell Analysis of Crohn’s Disease Lesions Identifies a Pathogenic Cellular Module Associated with Resistance to Anti-TNF Therapy. Cell 178, 1493–1508.e20 (2019). [DOI] [PMC free article] [PubMed] [Google Scholar]
- 95.Zheng Y et al. A human circulating immune cell landscape in aging and COVID-19. Protein Cell 11, 740–770 (2020). [DOI] [PMC free article] [PubMed] [Google Scholar]
- 96.Hochane M et al. Single-cell transcriptomics reveals gene expression dynamics of human fetal kidney development. PLoS Biol 17, e3000152 (2019). [DOI] [PMC free article] [PubMed] [Google Scholar]
- 97.Sohni A et al. The Neonatal and Adult Human Testis Defined at the Single-Cell Level. Cell Rep 26, 1501–1517.e4 (2019). [DOI] [PMC free article] [PubMed] [Google Scholar]
- 98.Tran T et al. In Vivo Developmental Trajectories of Human Podocyte Inform In Vitro Differentiation of Pluripotent Stem Cell-Derived Podocytes. Dev Cell 50, 102–116.e6 (2019). [DOI] [PMC free article] [PubMed] [Google Scholar]
- 99.Wang Y et al. Single-cell transcriptome analysis reveals differential nutrient absorption functions in human intestine. J Exp Med 217, (2020). [DOI] [PMC free article] [PubMed] [Google Scholar]
- 100.Vieira Braga FA et al. A cellular census of human lungs identifies novel cell states in health and in asthma. Nat Med 25, 1153–1163 (2019). [DOI] [PubMed] [Google Scholar]
- 101.Guo J et al. The Dynamic Transcriptional Cell Atlas of Testis Development during Human Puberty. Cell Stem Cell 26, 262–276.e4 (2020). [DOI] [PMC free article] [PubMed] [Google Scholar]
- 102.Voigt AP et al. Single-cell transcriptomics of the human retinal pigment epithelium and choroid in health and macular degeneration. Proc Natl Acad Sci U S A 116, 24100–24107 (2019). [DOI] [PMC free article] [PubMed] [Google Scholar]
- 103.Menon M et al. Single-cell transcriptomic atlas of the human retina identifies cell types associated with age-related macular degeneration. Nat Commun 10, 4902 (2019). [DOI] [PMC free article] [PubMed] [Google Scholar]
- 104.Wilk AJ et al. A single-cell atlas of the peripheral immune response in patients with severe COVID-19. Nat Med 26, 1070–1076 (2020). [DOI] [PMC free article] [PubMed] [Google Scholar]
- 105.Li B et al. Cumulus provides cloud-based data analysis for large-scale single-cell and single-nucleus RNA-seq. Nat Methods 17, 793–798 (2020). [DOI] [PMC free article] [PubMed] [Google Scholar]
- 106.Daniszewski M et al. Single cell RNA sequencing of stem cell-derived retinal ganglion cells. Sci Data 5, 180013 (2018). [DOI] [PMC free article] [PubMed] [Google Scholar]
- 107.Goveia J et al. An Integrated Gene Expression Landscape Profiling Approach to Identify Lung Tumor Endothelial Cell Heterogeneity and Angiogenic Candidates. Cancer Cell 37, 21–36.e13 (2020). [DOI] [PubMed] [Google Scholar]
- 108.Norelli M et al. Monocyte-derived IL-1 and IL-6 are differentially required for cytokine-release syndrome and neurotoxicity due to CAR T cells. Nat Med 24, 739–748 (2018). [DOI] [PubMed] [Google Scholar]
- 109.Daniszewski M et al. Single-Cell Profiling Identifies Key Pathways Expressed by iPSCs Cultured in Different Commercial Media. iScience 7, 30–39 (2018). [DOI] [PMC free article] [PubMed] [Google Scholar]
- 110.Miller AJ et al. In Vitro and In Vivo Development of the Human Airway at Single-Cell Resolution. Dev Cell 53, 117–128.e6 (2020). [DOI] [PMC free article] [PubMed] [Google Scholar]
- 111.Silvin A et al. Elevated Calprotectin and Abnormal Myeloid Cell Subsets Discriminate Severe from Mild COVID-19. Cell 182, 1401–1418.e18 (2020). [DOI] [PMC free article] [PubMed] [Google Scholar]
- 112.Deprez M et al. A Single-Cell Atlas of the Human Healthy Airways. Am J Respir Crit Care Med 202, 1636–1645 (2020). [DOI] [PubMed] [Google Scholar]
- 113.Sridhar A et al. Single-Cell Transcriptomic Comparison of Human Fetal Retina, hPSC-Derived Retinal Organoids, and Long-Term Retinal Cultures. Cell Rep 30, 1644–1659.e4 (2020). [DOI] [PMC free article] [PubMed] [Google Scholar]
- 114.Wu H et al. Comparative Analysis and Refinement of Human PSC-Derived Kidney Organoid Differentiation with Single-Cell Transcriptomics. Cell Stem Cell 23, 869–881.e8 (2018). [DOI] [PMC free article] [PubMed] [Google Scholar]
- 115.Vijay J et al. Single-cell analysis of human adipose tissue identifies depot and disease specific cell types. Nat Metab 2, 97–109 (2020). [DOI] [PMC free article] [PubMed] [Google Scholar]
- 116.Solé-Boldo L et al. Single-cell transcriptomes of the human skin reveal age-related loss of fibroblast priming. Commun Biol 3, 188 (2020). [DOI] [PMC free article] [PubMed] [Google Scholar]
- 117.Adams TS et al. Single-cell RNA-seq reveals ectopic and aberrant lung-resident cell populations in idiopathic pulmonary fibrosis. Sci Adv 6, eaba1983 (2020). [DOI] [PMC free article] [PubMed] [Google Scholar]
- 118.Moreira LM et al. Paracrine signalling by cardiac calcitonin controls atrial fibrogenesis and arrhythmia. Nature 587, 460–465 (2020). [DOI] [PubMed] [Google Scholar]
- 119.Ren X et al. COVID-19 immune features revealed by a large-scale single-cell transcriptome atlas. Cell 184, 1895–1913.e19 (2021). [DOI] [PMC free article] [PubMed] [Google Scholar]
- 120.Bunis DG et al. Single-Cell Mapping of Progressive Fetal-to-Adult Transition in Human Naive T Cells. Cell Rep 34, 108573 (2021). [DOI] [PMC free article] [PubMed] [Google Scholar]
- 121.Plasschaert LW et al. A single-cell atlas of the airway epithelium reveals the CFTR-rich pulmonary ionocyte. Nature 560, 377–381 (2018). [DOI] [PMC free article] [PubMed] [Google Scholar]
- 122.Takeda A et al. Single-Cell Survey of Human Lymphatics Unveils Marked Endothelial Cell Heterogeneity and Mechanisms of Homing for Neutrophils. Immunity 51, 561–572.e5 (2019). [DOI] [PubMed] [Google Scholar]
- 123.Frumm SM et al. A Hierarchy of Proliferative and Migratory Keratinocytes Maintains the Tympanic Membrane. Cell Stem Cell 28, 315–330.e5 (2021). [DOI] [PMC free article] [PubMed] [Google Scholar]
- 124.Yu Z et al. Single-Cell Transcriptomic Map of the Human and Mouse Bladders. J Am Soc Nephrol 30, 2159–2176 (2019). [DOI] [PMC free article] [PubMed] [Google Scholar]
- 125.Rubenstein AB et al. Single-cell transcriptional profiles in human skeletal muscle. Sci Rep 10, 229 (2020). [DOI] [PMC free article] [PubMed] [Google Scholar]
- 126.McCracken IR et al. Transcriptional dynamics of pluripotent stem cell-derived endothelial cell differentiation revealed by single-cell RNA sequencing. Eur Heart J 41, 1024–1036 (2020). [DOI] [PMC free article] [PubMed] [Google Scholar]
- 127.Hua P et al. Single-cell analysis of bone marrow-derived CD34+ cells from children with sickle cell disease and thalassemia. Blood 134, 2111–2115 (2019). [DOI] [PMC free article] [PubMed] [Google Scholar]
- 128.Orozco LD et al. Integration of eQTL and a Single-Cell Atlas in the Human Eye Identifies Causal Genes for Age-Related Macular Degeneration. Cell Rep 30, 1246–1259.e6 (2020). [DOI] [PubMed] [Google Scholar]
- 129.Hurley K et al. Reconstructed Single-Cell Fate Trajectories Define Lineage Plasticity Windows during Differentiation of Human PSC-Derived Distal Lung Progenitors. Cell Stem Cell 26, 593–608.e8 (2020). [DOI] [PMC free article] [PubMed] [Google Scholar]
- 130.Schafflick D et al. Integrated single cell analysis of blood and cerebrospinal fluid leukocytes in multiple sclerosis. Nat Commun 11, 247 (2020). [DOI] [PMC free article] [PubMed] [Google Scholar]
- 131.Su C et al. Single-Cell RNA Sequencing in Multiple Pathologic Types of Renal Cell Carcinoma Revealed Novel Potential Tumor-Specific Markers. Front Oncol 11, 719564 (2021). [DOI] [PMC free article] [PubMed] [Google Scholar]
- 132.He J et al. Dissecting human embryonic skeletal stem cell ontogeny by single-cell transcriptomic and functional analyses. Cell Res 31, 742–757 (2021). [DOI] [PMC free article] [PubMed] [Google Scholar]
- 133.Liao M et al. Single-cell landscape of bronchoalveolar immune cells in patients with COVID-19. Nat Med 26, 842–844 (2020). [DOI] [PubMed] [Google Scholar]
- 134.Liu X et al. Reprogramming roadmap reveals route to human induced trophoblast stem cells. Nature 586, 101–107 (2020). [DOI] [PubMed] [Google Scholar]
- 135.He S et al. Single-cell transcriptome profiling of an adult human cell atlas of 15 major organs. Genome Biol 21, 294 (2020). [DOI] [PMC free article] [PubMed] [Google Scholar]
- 136.Wu C-L et al. Single cell transcriptomic analysis of human pluripotent stem cell chondrogenesis. Nat Commun 12, 362 (2021). [DOI] [PMC free article] [PubMed] [Google Scholar]
- 137.Cowan CS et al. Cell Types of the Human Retina and Its Organoids at Single-Cell Resolution. Cell 182, 1623–1640.e34 (2020). [DOI] [PMC free article] [PubMed] [Google Scholar]
- 138.Savas P et al. Single-cell profiling of breast cancer T cells reveals a tissue-resident memory subset associated with improved prognosis. Nat Med 24, 986–993 (2018). [DOI] [PubMed] [Google Scholar]
- 139.Wang L et al. Single-Cell Map of Diverse Immune Phenotypes in the Metastatic Brain Tumor Microenvironment of Non Small Cell Lung Cancer. (2019) doi: 10.1101/2019.12.30.890517. [DOI] [PubMed] [Google Scholar]
- 140.Lu Y-C et al. Single-Cell Transcriptome Analysis Reveals Gene Signatures Associated with T-cell Persistence Following Adoptive Cell Therapy. Cancer Immunol Res 7, 1824–1836 (2019). [DOI] [PMC free article] [PubMed] [Google Scholar]
- 141.Wang L et al. The Phenotypes of Proliferating Glioblastoma Cells Reside on a Single Axis of Variation. Cancer Discov 9, 1708–1719 (2019). [DOI] [PMC free article] [PubMed] [Google Scholar]
- 142.Wang R et al. Adult Human Glioblastomas Harbor Radial Glia-like Cells. Stem Cell Reports 14, 338–350 (2020). [DOI] [PMC free article] [PubMed] [Google Scholar]
- 143.Wang L, Catalan F, Shamardani K, Babikir H & Diaz A Ensemble learning for classifying single-cell data and projection across reference atlases. Bioinformatics 36, 3585–3587 (2020). [DOI] [PMC free article] [PubMed] [Google Scholar]
- 144.Ruffin AT et al. B cell signatures and tertiary lymphoid structures contribute to outcome in head and neck squamous cell carcinoma. Nat Commun 12, 3349 (2021). [DOI] [PMC free article] [PubMed] [Google Scholar]
- 145.Zhang Q et al. Landscape and Dynamics of Single Immune Cells in Hepatocellular Carcinoma. Cell 179, 829–845.e20 (2019). [DOI] [PubMed] [Google Scholar]
- 146.Song Q et al. Dissecting intratumoral myeloid cell plasticity by single cell RNA-seq. Cancer Med 8, 3072–3085 (2019). [DOI] [PMC free article] [PubMed] [Google Scholar]
- 147.Kim N et al. Single-cell RNA sequencing demonstrates the molecular and cellular reprogramming of metastatic lung adenocarcinoma. Nat Commun 11, 2285 (2020). [DOI] [PMC free article] [PubMed] [Google Scholar]
- 148.Tang-Huau T-L et al. Human in vivo-generated monocyte-derived dendritic cells and macrophages cross-present antigens through a vacuolar pathway. Nat Commun 9, 2570 (2018). [DOI] [PMC free article] [PubMed] [Google Scholar]
- 149.Peng J et al. Single-cell RNA-seq highlights intra-tumoral heterogeneity and malignant progression in pancreatic ductal adenocarcinoma. Cell Res 29, 725–738 (2019). [DOI] [PMC free article] [PubMed] [Google Scholar]
- 150.10x Genomics Datasets. https://www.10xgenomics.com/resources/datasets?menu%5Bproducts.name%5D=Single%20Cell%20Gene%20Expression&query=&page=1&configure%5Bfacets%5D%5B0%5D=chemistryVersionAndThroughput&configure%5Bfacets%5D%5B1%5D=pipeline.version&configure%5BhitsPerPage%5D=500.
- 151.de Andrade LF et al. Discovery of specialized NK cell populations infiltrating human melanoma metastases. JCI Insight 4, (2019). [DOI] [PMC free article] [PubMed] [Google Scholar]
- 152.Zhang P et al. Dissecting the Single-Cell Transcriptome Network Underlying Gastric Premalignant Lesions and Early Gastric Cancer. Cell Rep 27, 1934–1947.e5 (2019). [DOI] [PubMed] [Google Scholar]
- 153.Durante MA et al. Single-cell analysis reveals new evolutionary complexity in uveal melanoma. Nat Commun 11, 496 (2020). [DOI] [PMC free article] [PubMed] [Google Scholar]
- 154.Svensson V, da Veiga Beltrame E & Pachter L A curated database reveals trends in single-cell transcriptomics. Database (Oxford) 2020, (2020). [DOI] [PMC free article] [PubMed] [Google Scholar]
- 155.Wolf FA, Angerer P & Theis FJ SCANPY: large-scale single-cell gene expression data analysis. Genome Biol 19, 15 (2018). [DOI] [PMC free article] [PubMed] [Google Scholar]
- 156.Xin J et al. High-performance web services for querying gene and variant annotation. Genome Biol 17, 91 (2016). [DOI] [PMC free article] [PubMed] [Google Scholar]
- 157.Dunning T The t-digest: Efficient estimates of distributions. Software Impacts 7, 100049 (2021). [Google Scholar]
- 158.Lhoest Q et al. Datasets: A Community Library for Natural Language Processing. (2021).
- 159.Wolf T et al. HuggingFace’s Transformers: State-of-the-art Natural Language Processing. (2019).
- 160.Loshchilov I & Hutter F Decoupled Weight Decay Regularization. (2017).
Associated Data
This section collects any data citations, data availability statements, or supplementary materials included in this article.
Supplementary Materials
Data Availability Statement
Genecorpus-30M is available on the Huggingface Dataset Hub at https://huggingface.co/datasets/ctheodoris/Genecorpus-30M.


