Abstract
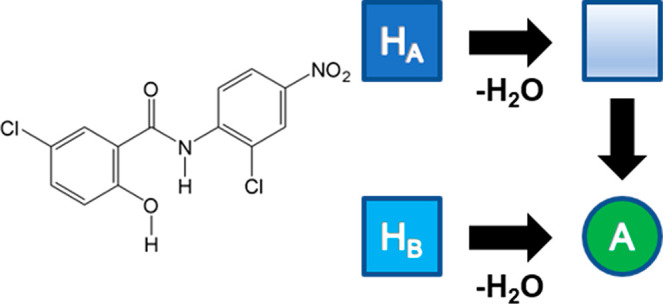
Many active pharmaceutical ingredients (APIs) can crystallize as hydrates or anhydrates, the relative stability of which depends on their internal structures as well as the external environment. Hydrates may dehydrate unexpectedly or intentionally, though the molecular-level mechanisms by which such transformations occur are difficult to predict a priori. Niclosamide is an anthelmintic drug on the World Health Organization’s “List of Essential Medicines” that crystallizes in two monohydrate forms: HA and HB. Through complementary time-resolved synchrotron powder X-ray diffraction and thermogravimetric kinetic studies, we demonstrate that the two monohydrates dehydrate via distinctly different solid state pathways yet yield the same final anhydrate phase. Water loss from HA via diffusion yields an isomorphous desolvate intermediate which can rearrange to at least two different polymorphs, only one of which exhibits long-term stability. In contrast, dehydration of HB proceeds via a surface nucleation process where simultaneous water loss and product formation occur with no detectable crystalline intermediates. Comparative analysis of the two systems serves to highlight the complex relationship between lattice structure and solid state dehydration processes.
Short abstract
The dehydration of two niclosamide monohydrates follows different mechanistic pathways. Through a combination of time-resolved synchrotron powder X-ray diffraction and thermogravimetric studies, water loss and structure rearrangement proceed stepwise in one hydrate and concurrently in the other. Comparison of the two hydrates highlights the complex relationship between lattice structure and solid state dehydration processes.
Introduction
Many small molecule active pharmaceutical ingredients (APIs) can exist in multiple solid-state forms (e.g., polymorphs, hydrates, solvates, salts, and amorphous phases)1−3 which exhibit different physical properties. Solid form screening is an important step in the development of orally administered pharmaceuticals.4,5 Hydrates require special consideration, since their relative stabilities with respect to water-free forms depends not only on their internal structure but on the environmental conditions to which they are exposed. Unanticipated conversion to less hydrated forms during manufacturing or under long-term storage can create both product efficacy concerns and intellectual property issues. On the other hand, there is growing recognition that hydrates and other solvates can serve as unique precursors, from which process-induced desolvation may yield novel solvent-free forms that may not be obtainable by conventional crystallization processes.6−11
Comparative studies of different API hydrates can provide valuable insight into how structural factors influence the kinetics, mechanisms and products of solid state dehydration reactions. Niclosamide, N-(2′-chloro-4′-nitrophenyl)-5-chlorosalicylamide (NCL, Figure 1), is an anthelmintic drug on the World Health Organization’s “List of Essential Medicines”12 for its efficacy in treating tapeworm infections. First developed by Bayer,13 it was in use as early as 1961 and gained FDA approval in 1982. Several more recent studies have shown that niclosamide exhibits multifunctional activity. Drug repurposing screens have investigated its potential in treating a range of human diseases14 including various types of cancer,15−17 metabolic disorders,18 tuberculosis,19,20 and viruses21−23 including COVID-19.24,25
Figure 1.
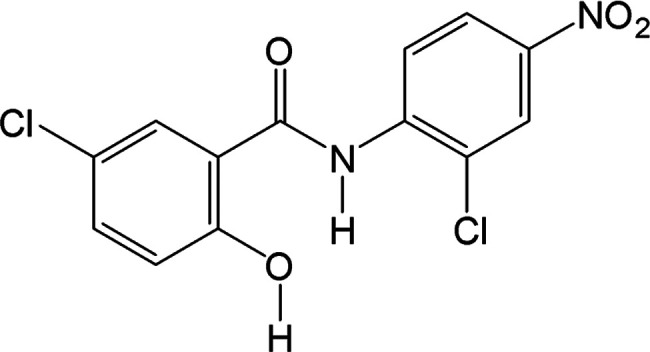
Molecular structure of niclosamide (NCL).
NCL is known to adopt multiple solid forms, including two solvent-free (single component) polymorphs,26,27 two monohydrates,28,29 multiple solvates,28−30 as well as cocrystals,27,31 cocrystal salts,32 and an amorphous solid dispersion.33 In the present work, we investigate the solid state dehydration of two NCL monohydrates (HA and HB) and show that under identical process-induced conditions the two follow entirely different mechanistic pathways to the same final anhydrous product. Using a combination of time-resolved synchrotron powder X-ray diffraction (sPXRD) and thermogravimetry (TGA), the divergent mechanistic pathways are rationalized based on the hydrate lattice topologies and the accessibility of cooperative motions that can facilitate the transformation to the stable anhydrate form.
Experimental Methods
Materials
Niclosamide (NCL) was purchased from Sigma-Aldrich (≥98%) and used as received. Ethyl acetate and acetone were obtained from Fisher Scientific and were reagent grade or higher. Water was acquired from a Milli-Q Integral Water Purification System at 18.2 MΩ.
Preparation of NCL Monohydrates
Monohydrate A (HA)
HA was obtained by recrystallization from acetone. NCL (150 mg) was added to 50 mL of 18 MΩ ultrapure water and heated with stirring for 15 min. Upon cooling to room temperature, the solid product was vacuum filtered and allowed to dry under ambient conditions. The dry material was placed in 50 mL of acetone, heated in a water bath, and stirred to effect complete dissolution. The growth solution was then transferred to Petri dishes (90 mm diameter) covered with punctured parafilm and maintained at room temperature. Crystals appeared within 5–7 days.
Monohydrate B (HB)
HB was prepared by recrystallization from ethyl acetate. NCL (150 mg) was dissolved in 50 mL of ethyl acetate through heating in a hot water bath with stirring. The growth solution was then transferred to Petri dishes covered with punctured parafilm and maintained at room temperature. Crystals appeared after 11–14 days.
Images of each hydrated form were collected on an Olympus BX-50 polarizing microscope fitted with a Lumenera Xfinity 2.0 camera.
Thermal Analysis
The thermal transitions in each of the phases were assessed with differential scanning calorimetry (DSC) and thermogravimetric analysis (TGA). DSC data were collected on a TA Instruments Discovery DSC 25. Samples of phase pure HA or HB (2–5 mg), either as grown and unground or ground with a mortar and pestle, were placed in aluminum pans with unsealed lids. Samples were heated at 5 °C/min from room temperature to 250 °C. The reported thermal transition temperatures are an average of at least triplicate measurements.
Weight loss from each sample was determined using a TA Instruments SDT_Q600 simultaneous TGA-DSC analyzer (New Castle, DE). All samples (2–5 mg) were ground with a mortar and pestle before being placed in open ceramic pans and heated at a rate of 5 °C/min to a maximum temperature of 210 °C. Reported weight losses are an average of at least triplicate measurements. Ground samples of each monohydrate were also heated isothermally at 40, 45, and 50 °C until dehydration was complete. Isothermal experiments at each temperature were performed in triplicate. The calculated water content in the monohydrate is 5.2%.
Solid State Dehydration Kinetics
Solid state dehydration kinetics were determined from isothermal TGA data at 40, 45, and 50 °C. The fraction dehydrated at each time point (α) was determined from the percent weight loss at each data point relative to the starting experimental mass, as shown in eq 1.
| 1 |
Data in the linear regions of the TGA curves (0.1 < α < 0.9 or 0.1 < α < 0.8) were used in established model-based and model-free analyses. In model-based analyses, data were fit to each of the 17 different solid state reaction models in Table 1. All reaction models have the form
| 2 |
where the rate constant (k) is calculated from the frequency factor (A), the activation energy (Ea), the gas constant (R = 8.314 J K–1 mol–1), and the temperature in K (T). Each model in differential form is represented as f(α) and in general form as g(α). The dehydration rate at each temperature was calculated, and the slope of an Arrhenius plot of −ln(k) vs 1/T was used to calculate the activation energy (Ea) associated with the reaction. The quality of fit for each reaction model was assessed based on the correlation coefficient (R2). Model-free Friedman and standard analyses34−37 were also used to determine the Ea at select time points throughout the reaction.
Table 1. Solid State Reaction Models and Integral Expressions Used for Kinetic Analyses38−40.
| dehydration models | integral equation g(α) = kt |
|---|---|
| nucleation and growth | |
| 1D growth of nucleia (A2) | (−ln(1 – α))0.5 |
| 2D growth of nucleia (A3) | (−ln(1 – α))1/3 |
| 3D growth of nucleia (A4) | (−ln(1 – α))1/4 |
| random nucleationb (B1) | ln(α/(1 – α)) + eα |
| Power law (n = 1/2; P2) | α1/2 |
| Power law (n = 1/3; P3) | α1/3 |
| Power law (n = 1/4; P4) | α1/4 |
| geometrical contraction | |
| 2D phase boundary (R2) | 1 – (1 – α)1/2 |
| 3D phase boundary (R3) | 1 – (1 – α)1/3 |
| diffusion | |
| 1D diffusion (D1) | α2 |
| 2D diffusion (D2) | (1 – α)*(ln(1 – α)) + α |
| 3D diffusionc (D3) | (1 – (1 – α)1/3)2 |
| 3D diffusiond (D4) | (1 – (2/3)α) – (1 – α)2/3 |
| reaction order | |
| zero-order (R1) | α |
| first-order (F1) | –ln(1 – α) |
| second-order (F2) | (1/(1 – α)) – 1 |
| third-order (F3) | (1/2)*(((1 – α)−2) – 1) |
Avrami–Erofeyev equation.
Prout–Tompkins equation.
Jander equation.
Ginstling–Brounshtein equation.
Powder X-ray Diffraction (PXRD)
PXRD data of ground samples were collected at room temperature on a Rigaku Ultima IV diffractometer (Cu Kα radiation, 40 kV tube voltage, 30 mA current) in order to confirm the identity and phase purity of all materials. Data were collected over 2θ = 3–40° at a scan speed of 2.0°/min and analyzed with X’pert Highscore Plus v2.2 software. Experimental PXRD data were compared against simulated powder patterns from CIF files available in the CSD.16 These include HA (refcode: OBEQAN0126), HB (OBEQAN28), and the two anhydrate polymorphs: form 1 (HEBFUR27) and form 2 (HEBFUR0126).
Time-Resolved Synchrotron Powder X-ray Diffraction (sPXRD)
Time-resolved synchrotron powder X-ray diffraction data were collected at the Advanced Photon Source (APS) beamline 17-BM-B. The beamline is equipped with a Si (311) monochromator, a PerkinElmer a-Si Flat Panel PE1621 area detector, and an Oxford Cryosystems Cryostream 700+. Data were collected over three trips with X-ray beam energies of 27.3 keV (λ = 0.45390 Å), 27.4 keV (λ = 0.45256 Å), and 51.5 keV (λ = 0.24087 Å). Variable temperature experiments were performed to a maximum temperature of 210 °C using a heating rate of 6–10 °C/min. In all HA experiments and one HB variable temperature experiment, samples were hand ground in a small amount of growth solution, then loaded into a 1.1 mm Kapton capillary (Cole-Parmer) and stoppered with glass wool at each end. In HB isothermal experiments and one additional variable temperature experiment, samples were hand ground in a minimal amount of growth solution to create a semidry paste, which was then loaded into a 1.1 mm OD quartz capillary and stoppered with glass wool at each end. Capillaries were then mounted in a flow cell,41 and in situ experiments were performed under a flowing He atmosphere (5 mL/min) with continuous rocking of the sample at 10–15° throughout the experiment. High Q-range sPXRD patterns were collected every ∼20 s by summing over 10 images each with an exposure time of 2.0 s. GSAS-II42 software was used to process the images and perform integration. TOPAS-V643 was used for sPXRD pattern refinement.
Results and Discussion
In any solid state dehydration reaction, there are three general potential outcomes. Upon water loss, the hydrate can (a) retain the same crystal lattice (isomorphous desolvates44), (b) transform to a structure with a different lattice, or (c) become amorphous. Dehydration may yield a single anhydrous product or a mixture of phases, and the pathway to the final dehydration product(s) may or may not include other crystalline intermediates. Our incomplete understanding of solid state dehydration mechanisms on the molecular level is due at least in part to the limited experimental methods capable of tracking structural changes on a sufficiently fast time scale. Here, we take advantage of the high resolution and rapid data acquisition times afforded by time-resolved synchrotron powder X-ray diffraction and complementary thermogravimetric kinetic measurements to compare the solid state dehydration of two niclosamide monohydrate polymorphs, HA and HB, under the same conditions.
HA and HB Structures
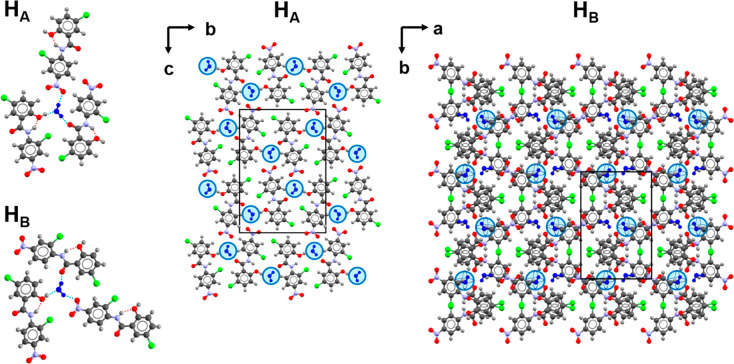
Like all of the NCL forms known to date, NCL molecules in HA and HB adopt an essentially planar conformation which is stabilized by an intramolecular hydrogen bond between the central amide N–H and the oxygen of the chlorophenol ring (graph set S(6)). Water molecules in room temperature structures of both HA (P21/c: a = 3.813 Å, b = 16.143 Å, c = 23.065 Å, b = 92.87°)26 and HB (P21/c: a = 7.346 Å, b = 11.332 Å, c = 16.964 Å, b = 98.28°)28 hydrogen bond to three neighboring NCL molecules through three different functional groups: (1) a hydroxy group OW···H–O, (2) a carbonyl group OW–HW···O=C, and (3) a nitro group OW–HW···O(NO) (Figure 2). The O···O distances in HA and HB are similar, with HA distances of 2.66, 2.74, and 3.00 Å, and HB distances of 2.60, 2.85, and 2.93 Å for 1, 2, and 3, respectively.
Figure 2.
Molecular structures of HA (OBEQAN01) and HB (OBEQAN). Water molecules are colored blue for clarity. (Left) Each water molecule is hydrogen bonded to three NCL molecules shown with blue dotted lines. Intramolecular hydrogen bonds are indicated with orange dotted lines. (Middle) HA viewed down the π-stacking axis (a axis). The (100) planes in HA are centrosymmetric, with face-to-face π-stacked molecules related by translation. Water channels are indicated with blue circles. (Right) HB viewed down the π-stacking axis (c axis). The (001) planes in HB are polar, with adjacent layers related by a two-fold rotation. This creates face-to-face π stacks of phenols with water molecules in isolated cavities (blue spheres) separated by nitroaromatic rings.
Despite the similar hydrogen bond types, the water environments in HA and HB differ significantly. Expanded views of the crystal packing make the differences in the local water environment and π-stacking more apparent. In HA, (100) layers are nonpolar and related by translation, creating homogeneous face-to-face aromatic π stacks of nitrophenyl rings and phenol rings along the a axis (center-to-center distance = 3.81 Å). Between these stacks are one-dimensional channels occupied by water molecules, though neighboring water molecules within a channel are too far apart to bond to one another.
In contrast, the (001) layers in HB are polar, and adjacent layers are related by a 2-fold rotation. This packing motif creates π-stacks of phenol rings along the c axis (average center-to-center distance = 3.67 Å) and places water molecules farther away from one another and into isolated cavities separated by nitrophenyl rings.
Crystal Growth of HA and HB
Previously reported growth methods yielded monohydrate, though not always in phase pure form. In general, HA was favored from acetone solutions and HB from ethyl acetate, though under some conditions concomitant mixtures of hydrates were obtained (Figure 3). The solution evaporation rate proved to be a significant factor in the outcome. HA could be obtained in phase pure form under fast evaporation conditions from acetone in Petri dishes. Phase pure HB was reliably obtained from ethyl acetate after extended time periods in Petri dishes (≥11 days) or 2 dram vials (∼4 weeks). Phase-pure HB could also be obtained from acetone solutions maintained at 4 °C in 2 dram vials. Both HA and HB adopt needle-like morphologies but can usually be visually distinguished by their different aspect ratios (Figure S1).
Figure 3.
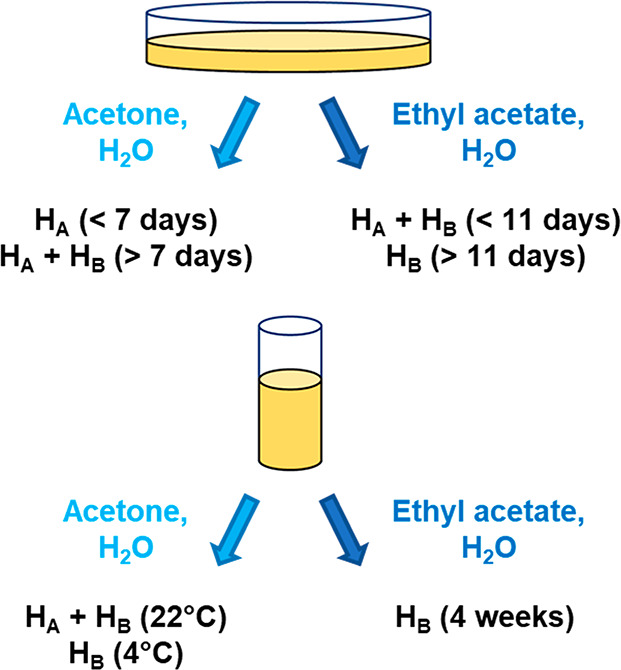
Results of crystal growth from evaporation of wet acetone and ethyl acetate in Petri dishes and glass vials.
Dehydration of HA
Previous reports on the solid state properties of NCL monohydrates have appeared in the literature.28,45−50 Using typical DSC and/or TGA heating conditions, these earlier studies consistently showed that HA dehydrates at temperatures below 100 °C in what appeared to be a one-step process. Manek and Kolling45 reported the PXRD of the final dehydration product, which is a good match for the form 1 (F1) anhydrate structure determined several years later (HEBFUR, P21/c: a = 13.485 Å, b = 7.067 Å, c = 13.510 Å, β = 98.34°).27 Our analyses of HA were in good agreement with these previous reports. DSC thermograms (unsealed pans) of as-grown material have two endothermic transitions (Figure S2). The first, with a Tmax = 91.4 ± 0.2 °C, can be attributed to dehydration and the higher one at 230.3 ± 0.1 °C, to melting of the anhydrate. Ground samples heated under the same conditions had a comparable dehydration Tmax = 88.7 ± 2.7 °C. TGA weight loss for HA was 5.1 ± 0.1% (calcd. = 5.2%), with rapid water loss between approximately 55 and 85 °C when heated at a standard rate of 5 °C/min (Figure 4B).
Figure 4.
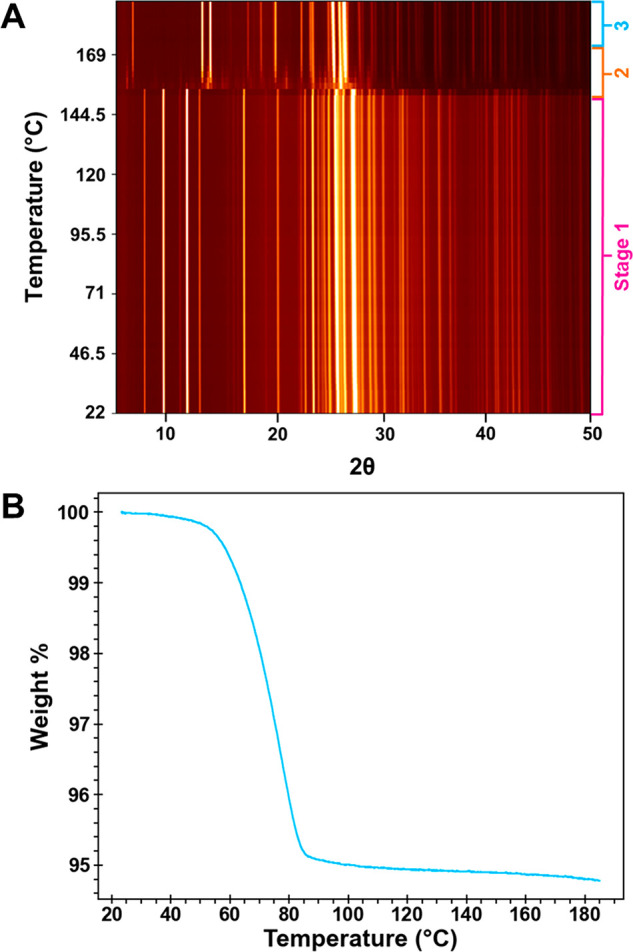
(A) Time-resolved sPXRD of ground HA heated at 6 °C/min from room temperature to 192 °C. The 2θ scale is normalized to Cu Kα. Three different regions are identified as stages 1, 2, and 3. (B) TGA of ground HA heated at 5 °C/min in open pans.
The mechanism and kinetics of the solid state transformation from HA to F1 anhydrate were investigated using complementary sPXRD and isothermal TGA methods (both RH% = 0). All time-resolved in situ sPXRD experiments were performed on phase-pure HA using a controlled atmosphere flow cell and a data acquisition method that enabled high resolution patterns to be collected every ∼20 s. A representative contour plot tracking the structural changes that occur when HA was heated at 6 °C/min from room temperature to ∼190 °C is shown in Figure 4A. For discussion purposes, we will consider the structural changes in three distinct temperature regions: below 155 °C (stage 1), between 155–165 °C (stage 2), and above 165 °C (stage 3).
In stage 1, both the absence of major changes in the PXRD pattern between 22 and 155 °C and the subtle changes in this temperature region are instructive. TGA indicated that dehydration of HA is essentially complete by 100 °C, yet the HA lattice persists to at least 150 °C. Dehydration of HA must therefore initially yield an isomorphous desolvate (H*). Water loss from the HA lattice is also evidenced by changes in the relative intensities of select PXRD diffraction lines over time and as the temperature increases (Figures 5a, S3). Comparison of the simulated PXRD patterns of HA (OBEQAN01) and a modified CIF file with the water molecules removed predicted a significant decrease in the intensity of (112) due to the change in electron density in that plane. Experimental data confirmed that the intensity of this peak decreased by 18.5% between 22 and 75 °C. Additional diffraction lines such as (113), (042), and (130) also showed decreases of 6.4%, 6.1%, and 5.0%, respectively. Temperature changes can also contribute to slight changes in peak intensities, though it is difficult to distinguish between the two effects.
Figure 5.
Stage 1 of the HA dehydration process involves water loss and the formation of isomorphous desolvate H*. (A) Comparison of the sPXRD patterns at 22 and 150 °C shows the change in intensity for select (hkl) reflections. Inset images are close up views of (042), (112), (113), and (130) diffraction lines at 22, 75, 125, and 150 °C. All show a decrease in intensity due to water loss and a shift to slightly lower 2θ values due to thermal expansion. (B) Change in lattice cell axes determined from Pawley refinement of sPXRD data.
Peak positions also shift slightly due to thermal expansion effects. Sequential Pawley refinement of sPXRD patterns collected between 22 and 150 °C showed no abrupt changes indicative of a phase change (Figures 5b, S4). From this, we conclude that water loss occurs gradually over a broad temperature range. The thermal expansion was notably anisotropic with a much larger increase along the a axis (0.7%), the π-stacking direction, relative to the b axis (0.34%) or c axis (0.22%). The cell volume increase over this temperature range was ∼2.0%.
With continued heating, H* undergoes a dramatic structural change in stage 2. In the experiment shown in Figure 4, all diffraction lines in the 158 °C sPXRD pattern can be attributed to H*. Yet by 160 °C (20 s later), only small amounts of H* remained, and several new diffraction lines appeared. Several of the new low-intensity peaks have 2θ values that match anhydrate F1, though the most intense peaks do not. At least eight diffraction lines in the 160 °C pattern do not correspond to H* or F1 (Figure 6). The unassignable peaks at 2θ = 6.045°, 10.988°, 13.518°, 14.837°, 20.784°, 24.418°, 25.862°, and 30.776° are indicated with an asterisk. We refer to this phase as A*. Attempts to fit these peaks to a unit cell were not successful, possibly because A* is a mixture of two or more phases. The two most intense A* diffraction lines have 2θ values close to those expected for the most intense peaks of the form 2 (F2) anhydrate, but there are insufficient data to make a confident phase assignment.
Figure 6.
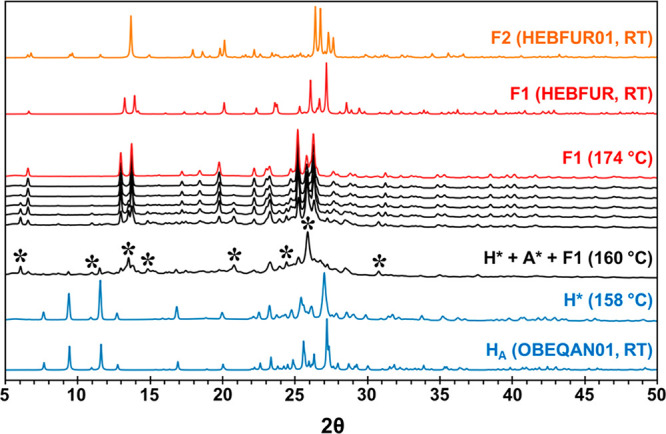
Stage 2 sPXRD patterns between 158 and 174 °C. All diffraction lines at 158 °C correspond to H*. The sPXRD pattern at 160 °C has diffraction lines corresponding to H*, F1, and at least eight other diffraction lines (asterisked) associated with A*, which is likely a mixture of two or more phases. By 174 °C, all diffraction lines correspond to F1.
Some variability in the onset temperature for the transformation of H* was observed in experiments performed under similar conditions, but H* was always stable to at least ∼140 °C. In one experiment, HA was heated to 150 °C, and the H* lattice remained stable at that isothermal temperature for at least 30 min. In another experiment, H* began to convert to F1 below 150 °C but without any apparent A* (Figure S5). This suggests that H* can also convert directly to F1. It is difficult to pinpoint exactly what instability factors trigger the transformation of H* in a given experiment; however, once F1 appears it quickly becomes the dominant phase.
In stage 3, all peaks correspond to F1. For the experiment shown in Figure 4, all of the A* peaks have disappeared by 174 °C. Continued heating of phase pure F1 to a maximum temperature of 192 °C did not reveal any further changes in the PXRD pattern.
HA Dehydration Kinetics and Mechanism
As a complement to sPXRD studies, isothermal TGA kinetics experiments on HA were carried out at 40, 45, and 50 °C. Experiments were run in triplicate, and a representative plot of the fraction dehydrated (α) vs time is shown in Figure 7. The reaction conversion data in the linear region 0.1 < α < 0.9 at each isothermal temperature were fit to each of the 17 different solid state reaction models in Table 1. Fitting the kinetic data often yields one model with a much higher correlation coefficient (R2) than the others, and this can be informative as to the rate limiting step in the reaction. However, the HA data fit equally well (R2 values > 0.99) to four very different models: A2 (1D nucleation), R2 and R3 (2D and 3D geometrical contraction), and D1 (1D diffusion; Table S1). While TGA data on their own would be inconclusive, the sPXRD established that dehydration of HA creates isomorphic desolvate H*. Since the measured TGA weight loss corresponds to the H to H* transition, 1D diffusion is the only feasible mechanism of the four.
Figure 7.
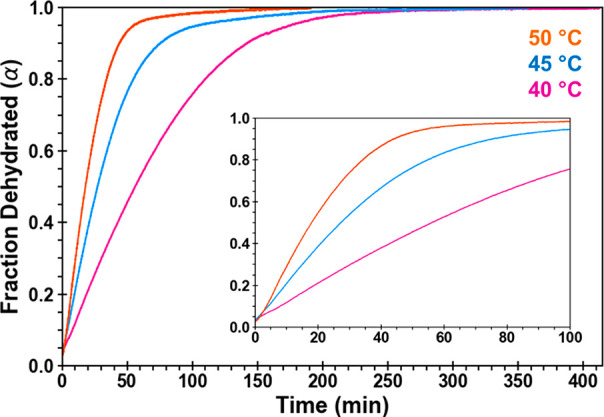
Fraction dehydrated (α) vs time plots for HA based on triplicate isothermal TGA data collected at 40, 45, and 50 °C. Inset plot is an expanded view of the data from 0 to 100 min. All samples were ground and heated at 5 °C/min.
At 40, 45, and 50 °C, the rate constants for the dehydration reaction were 0.004, 0.008, and 0.012 min–1, respectively. These measurements fit to an Arrhenius plot yielded an Ea = 92.3 ± 24 kJ/mol. The Ea at different time points throughout the reaction were also calculated using model-free Friedman and standard analysis methods. Both methods indicated a consistent activation energy throughout the dehydration process, which would be expected for a diffusion process (Figure S6). Notably, the measured Ea corresponds only to the H to H* transformation since the polymorph conversion from H* to F1 has no associated weight loss. Even in the DSC, there was no observable thermal transition above 100 °C prior to melting to suggest an intermediate phase. It is only from the combination of sPXRD and TGA that HA dehydration can be recognized as a two-step process.
The H* to F1 Polymorph Transformation
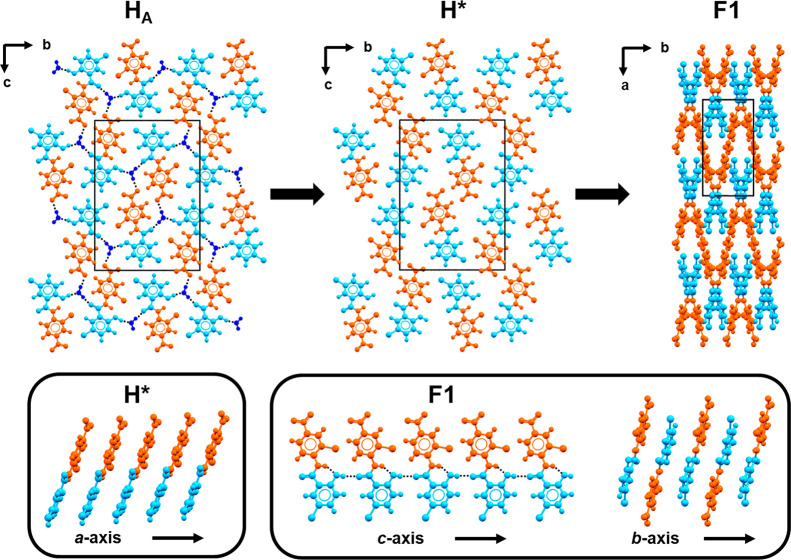
With knowledge that water loss precedes lattice rearrangement, it becomes possible to propose a molecular-level model to rationalize the H* to F1 transformation pathway that considers the topology in both the π-stacking and hydrogen bonding motifs in the two anhydrous forms. In Figure 8, NCL nitrophenyl rings are colored orange, and the phenol rings are light blue. In HA (and H*), NCL molecules exist in homogeneous face-to-face π-stacks along the a axis. The a axis is also the direction of highest thermal expansion, such that upon heating, the repeat distance within the stack increases from 3.81 Å (at 22 °C) to 4.07 Å (at 145 °C). Water loss from HA also ruptures the hydrogen bonding interactions, leaving NCL donor (hydroxyl) and acceptor (carbonyl) groups unsatisfied.
Figure 8.
Schematic of the dehydration pathway of HA to F1. Each NCL molecule is colored so that the nitrophenyl ring is orange and the phenol ring is light blue. Water molecules in HA are dark blue.
In F1, molecules assemble into one-dimensional hydrogen bonded chains (graph set C(6)) of hydroxyl and carbonyl groups along the c axis. Molecules along the chain twist by 30.5° presumably to avoid steric interactions, though nitrophenyl and phenol rings are on opposite sides of the hydrogen bonded chain. Assuming that the least motion arguments apply here, as the distance between π-stacked rings increases in H*, it seems likely that eventually it becomes possible for molecules to rotate and hydrogen bond to the neighboring molecule in the stack, thereby initiating the cooperative formation of the C(6) chain. Such a model would effectively mean the a axis of H* becomes the c axis of F1. This type of cooperative motion is also consistent with the formation of heterogeneous π-stacks in F1 where molecules are related by a 2-fold rotation along the b axis. The proposed transformation pathway requires a considerable amount of molecular motion and a volume change. However, all other alternatives such as formation of the C(6) chain from molecules in adjacent stacks would require a significantly greater net reorganization since neighboring stacks in H* are related by a glide plane or 2-fold rotation.
Dehydration of HB
The structure of HB has been known since 1998; however, literature reports on its thermal stability vary greatly. Van Tonder et al.46 reported that TGA weight loss due to dehydration occurs in two distinct stages at 173 ± 5 °C and 201 ± 5 °C, while the thermogram presented in Manek and Kolling45 shows more gradual weight loss in a lower temperature range between approximately 100 and 175 °C. In our own characterization of HB, we observed significant differences in the thermal properties depending on the sample preparation.
DSC analyses of as-grown (unground) HB had two endotherms, the first with a Tmax = 178.5 ± 0.7 °C corresponding to dehydration and the second at 231 ± 0.2 °C to melting of the anhydrate (Figure 9). If the same HB sample was ground, the first endothermic transition occurred at a dramatically lower temperature, Tmax = 88.7 ± 2.7 °C. TGA analysis of ground HB showed that weight loss begins around 50 °C, declines steeply between 55 and 80 °C, and is complete around 100 °C (Figure S7). Total weight loss for ground HB was 4.8% ± 0.1% (theoretical = 5.2%). The DSC and TGA results clearly show that grinding induces a dramatic decrease in the thermal stability of HB.
Figure 9.
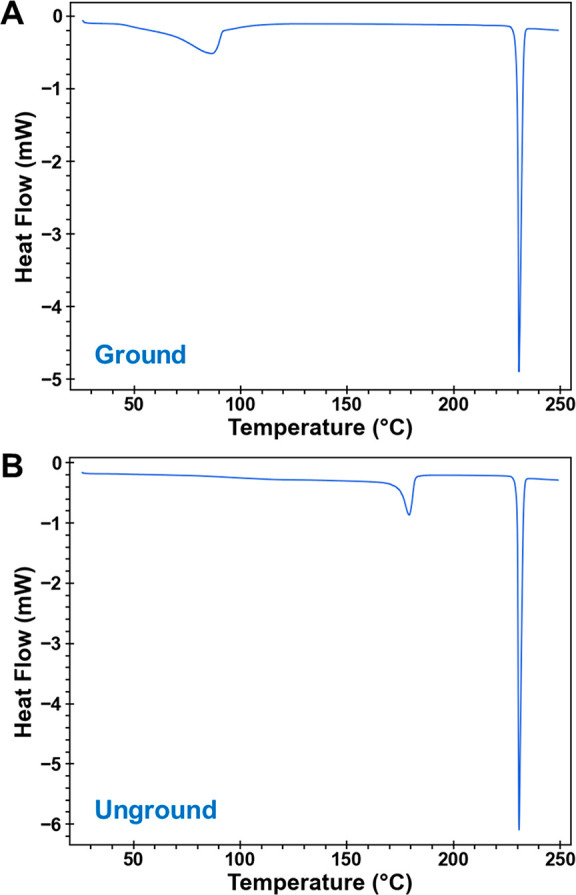
DSC curves of heat flow vs temperature for HB samples (A) ground with a mortar and pestle and (B) unground. Samples were heated at 5 °C/min to 250 °C with unsealed lids.
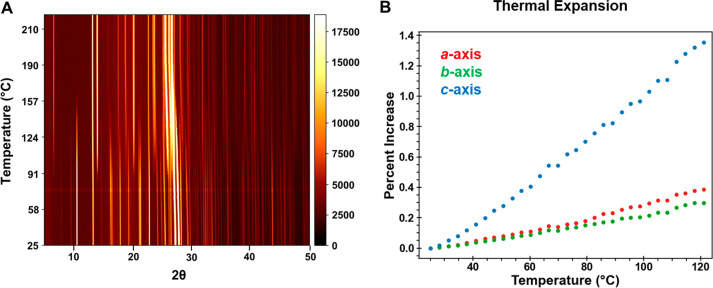
A time-resolved in situ synchrotron PXRD was used to track the structural changes that occur when HB was dehydrated at a heating rate of 10 °C/min. A representative contour plot is shown in Figure 10. Peaks corresponding to F1 are first observed at approximately 76 °C. Over the next ∼10 min, the F1 peaks gradually increase in intensity while the HB peaks correspondingly decrease and completely disappear by 174 °C. Notably, there was no evidence of any other intermediate crystalline phases in the transformation process. HB thermal expansion in the 25–120 °C range was highly anisotropic, with a significantly greater increase along the π-stacking c-axis direction (∼1.35%) compared to the a and b axes, which both expanded by <0.4%. The cell volume increase over this temperature range was ∼2.15%.
Figure 10.
(A) Time-resolved sPXRD of ground HB heated at 10 °C/min from 25 to 210 °C. The 2θ scale is normalized to Cu Kα. F1 first appears at 76 °C and gradually increases in intensity over the next 10 min until the transformation is complete. (B) Thermal expansion of cell axes in HB determined from sequential Pawley refinement of sPXRD patterns.
In isothermal sPXRD experiments, when HB was held at temperatures from 30 to 40 °C, the transformation to F1 also occurred gradually, albeit over much longer time periods. At 35 °C, small amounts of HB persisted in the sample even after 8 h. At 40 °C, conversion to F1 was complete in about 3 h. For more accurate kinetics, isothermal TGA experiments were performed on ground HB at 40, 45, and 50 °C (Figure S9). The fraction dehydrated (α) vs time was determined based on weight change, and the data from the linear region 0.1 < α < 0.8 were fit to each of the 17 different solid state reaction models (Table S2). With an R2 > 0.999, the geometrical contraction models R3 and R2 were the top fits at 40 °C. R3 and F1 were the best fits at 45 and 50 °C (R2 > 0.996). Geometrical contraction models mathematically describe a reaction mechanism where the nucleation of the product on the surface(s) of the reacting particles is the rate limiting step. R2 and R3 models simply differ in how they approximate particle shape, with the former assuming a cylinder and the latter a sphere.
When the kinetic data were fit to the R3 model, the calculated Ea = 77.9 ± 8.2 kJ/mol. Ea values calculated with R2 and F1 models were similar. Both Friedman and standard model-free analysis methods indicated that the Ea decreases over the course of the reaction (Figure S10). This is consistent with a surface-limited reaction model, because the area of the reacting front progressively decreases as HB transforms.
With knowledge that the transformation of HB to F1 proceeds via a surface-mediated mechanism, we return to the question of why ground and unground materials have such vastly different DSC dehydration temperatures (Figure 9). Several possible explanations were considered. We initially hypothesized that grinding may create small amounts of F1, which might seed the transformation. However, careful analysis of the sPXRD patterns from three different ground batches of HB revealed no crystalline phase impurities in the samples (Figure S11). Similarly, while grinding of any organic material may yield small amounts of amorphous material, there was also no appreciable amorphous content in the sPXRD patterns. While it is possible that grinding creates uniquely reactive defect sites, it is less clear how such sites can be identified or characterized.
Having excluded phase impurities, we considered the surfaces that are created during particle breakage. Particle size effects51 are often used to explain a decrease in the dehydration temperature of a few degrees; however, manual grinding lowered the Tmax of HB by nearly 90 °C. We are not aware of any literature precedent for a decrease of this magnitude. Hot stage microscopy of unground HB showed that all crystal surfaces appear to darken fairly uniformly, such that there was no obvious anisotropy in the dehydration (Figure S12). Though it was not possible to reliably assign Miller indices to the faces of ground crystals, slip planes calculated using the CSD-Particle module52 essentially all bisect the c axis (needle axis; Figure S13). Assuming particle fracture is most likely to occur along these low rugosity planes, increased mobility of NCL molecules on these higher index surfaces may play a critical role in lowering the nucleation barrier of F1.53 Additional experiments beyond the scope of this study would be needed to confirm this hypothesis.
Conclusions
HA and HB both dehydrate to the same final dehydration product, F1, but through a combination of time-resolved synchrotron diffraction and thermogravimetric analysis, their dehydration pathways were found to be distinctly different. Diffusional water loss from HA yields a lower density isomorphous desolvate, H*, an intermediate which exhibits remarkable stability to temperatures at least 40−50 °C above water’s boiling point. A H* to F1 model was proposed to account for the transformation pathway wherein molecules within a π-stack direction rotate to form one-dimensional hydrogen bonded chains along an axis orthogonal to the original π-stacking direction. The least-motion transformation model is supported by thermal expansion data which indicated the largest increase along the π-stacking direction.
Unlike HA, the lattice topologies and symmetry within the π-stacks in HB and F1 are quite different, such that there is no obvious least-motion pathway to convert between the two (Figure S14). The absence of crystalline intermediates in the time-resolved sPXRD dehydration experiments and the thermogravimetric kinetic analyses point to a mechanism wherein surface recrystallization is the rate-limiting step in the transformation of HB to F1. The decrease in the thermal stability of HB upon manual grinding is quite remarkable. While a definitive molecular-level explanation for this phenomenon remains elusive, it seems probable that grinding creates low-rugosity faces which help to facilitate the surface-mediated transformation of HB to F1.
Acknowledgments
The authors gratefully acknowledge financial support from the National Science Foundation (DMR 2004435) and the Henry Luce Foundation (JEM Predoctoral Fellowship). We thank Andrey Yakovenko and Wenqian Xu for their assistance at 17-BM-B. This research used resources of the Advanced Photon Source, a U.S. Department of Energy (DOE) Office of Science User Facility operated for the DOE Office of Science by Argonne National Laboratory under Contract No. DE-AC02-06CH11357.
Supporting Information Available
The Supporting Information is available free of charge at https://pubs.acs.org/doi/10.1021/acs.cgd.3c00322.
Micrographs, TGA, DSC, synchrotron PXRD, kinetics tables (PDF)
The authors declare no competing financial interest.
Special Issue
Published as part of the Crystal Growth & Designvirtual special issue “Lattice Dynamics”.
Supplementary Material
References
- Vippagunta S. R.; Brittain H. G.; Grant D. J. W. Crystalline solids. Adv. Drug Delivery Rev. 2001, 48 (1), 3–26. 10.1016/S0169-409X(01)00097-7. [DOI] [PubMed] [Google Scholar]
- Byrn S. R.Solid-State Chemistry of Drugs; Academic Press: New York, 1982; p 149–188. [Google Scholar]
- Bernstein J.Polymorphism in Molecular Crystals; Oxford University Press: New York, 2002. [Google Scholar]
- Miller J. M.; Collman B. M.; Greene L. R.; Grant D. J. W.; Blackburn A. C. Identifying the Stable Polymorph Early in the Drug Discover-Development Process. Pharm. Dev. Technol. 2005, 10, 291–297. 10.1081/PDT-54467. [DOI] [PubMed] [Google Scholar]
- Brittain H. G. Polymorphism and Solvatomorphism 2010. J. Pharm. Sci. 2012, 101 (2), 464–484. 10.1002/jps.22788. [DOI] [PubMed] [Google Scholar]
- Be̅rziņš A.; Trimdale A.; Kons A.; Zvaniņa D. On the Formation and Desolvation Mechanism of Organic Molecule Solvates: A Structural Study of Methyl Cholate Solvates. Cryst. Growth Des. 2017, 17 (11), 5712–5724. 10.1021/acs.cgd.7b00657. [DOI] [Google Scholar]
- Mahieux J.; Sanselme M.; Coquerel G. Access to Several Polymorphic Forms of (±)-Modafinil by Using Various Solvation-Desolvation Processes. Cryst. Growth Des. 2016, 16 (1), 396–405. 10.1021/acs.cgd.5b01384. [DOI] [Google Scholar]
- Zhang Q.; Mei X. Two New Polymorphs of Huperzine A Obtained from Different Dehydration Processes of One Monohydrate. Cryst. Growth Des. 2016, 16 (6), 3535–3542. 10.1021/acs.cgd.6b00493. [DOI] [Google Scholar]
- Bhardwaj R. M.; McMahon J. A.; Nyman J.; Price L. S.; Konar S.; Oswald I. D. H.; Pulham C. R.; Price S. L.; Reutzel-Edens S. M. A Prolific Solvate Former, Galunisertib, under the Pressure of Crystal Structure Prediction, Produces Ten Diverse Polymorphs. J. Am. Chem. Soc. 2019, 141 (35), 13887–13897. 10.1021/jacs.9b06634. [DOI] [PubMed] [Google Scholar]
- Liu Y.; Jia L.; Wu S.; Xu S.; Zhang X.; Jiang S.; Gong J. Polymorphism and molecular conformations of nicosulfuron: structure, properties and desolvation process. CrystEngComm 2019, 21 (17), 2790–2798. 10.1039/C8CE02074D. [DOI] [Google Scholar]
- Martins D.; Sanselme M.; Houssin O.; Dupray V.; Petit M. N.; Pasquier D.; Diolez C.; Coquerel G. Physical transformations of the active pharmaceutical ingredient BN83495: enantiotropic and monotropic relationships. Access to several polymorphic forms by using various solvation-desolvation processes. CrystEngComm 2012, 14 (7), 2507–2519. 10.1039/c2ce06537a. [DOI] [Google Scholar]
- World Health Organization . WHO Model List of Essential Medicines - 21st list, 2019. https://www.who.int/publications/i/item/WHOMVPEMPIAU2019.06 (accessed Dec 20, 2022).
- Pearson R. D.; Hewlett E. L. Niclosamide Therapy for Tapeworm Infections. Ann. Int. Med. 1985, 102 (4), 550–551. 10.7326/0003-4819-102-4-550. [DOI] [PubMed] [Google Scholar]
- Chen W.; Mook R. A.; Premont R. T.; Wang J. Niclosamide: Beyond an antihelminthic drug. Cell. Signal. 2018, 41, 89–96. 10.1016/j.cellsig.2017.04.001. [DOI] [PMC free article] [PubMed] [Google Scholar]
- Chen H.; Yang Z.; Ding C.; Chu L.; Zhang Y.; Terry K.; Liu H.; Shen Q.; Zhou J. Discovery of O-Alkylamino-Tethered Niclosamide Derivatives as Potent and Orally Bioavailable Anticancer Agents. ACS Med. Chem. Lett. 2013, 4 (2), 180–185. 10.1021/ml3003082. [DOI] [PMC free article] [PubMed] [Google Scholar]
- Osada T.; Chen M.; Yang X. Y.; Spasojevic I.; Vandeusen J. B.; Hsu D.; Clary B. M.; Clay T. M.; Chen W.; Morse M. A.; Lyerly H. K. Antihelminth compound niclosamide downregulates Wnt signaling and elicits antitumor responses in tumors with activating APC mutations. Cancer Res. 2011, 71 (12), 4172–82. 10.1158/0008-5472.CAN-10-3978. [DOI] [PMC free article] [PubMed] [Google Scholar]
- Satoh K.; Zhang L.; Zhang Y.; Chelluri R.; Boufraqech M.; Nilubol N.; Patel D.; Shen M.; Kebebew E. Identification of Niclosamide as a Novel Anticancer Agent for Adrenocortical Carcinoma. Clin. Cancer Res. 2016, 22 (14), 3458–66. 10.1158/1078-0432.CCR-15-2256. [DOI] [PMC free article] [PubMed] [Google Scholar]
- Tao H.; Zhang Y.; Zeng X.; Shulman G. I.; Jin S. Niclosamide ethanolamine-induced mild mitochondrial uncoupling improves diabetic symptoms in mice. Nature Medicine 2014, 20 (11), 1263–1269. 10.1038/nm.3699. [DOI] [PMC free article] [PubMed] [Google Scholar]
- Sun Z.; Zhang Y. Antituberculosis activity of certain antifungal and antihelmintic drugs. Tubercle Lung Dis. 1999, 79 (5), 319–320. 10.1054/tuld.1999.0212. [DOI] [PubMed] [Google Scholar]
- Fan X.; Xu J.; Files M.; Cirillo J. D.; Endsley J. J.; Zhou J.; Endsley M. A. Dual activity of niclosamide to suppress replication of integrated HIV-1 and Mycobacterium tuberculosis (Beijing). Tuberculosis (Edinburgh, Scotland) 2019, 116s, S28–s33. 10.1016/j.tube.2019.04.008. [DOI] [PMC free article] [PubMed] [Google Scholar]
- Xu M.; Lee E. M.; Wen Z.; Cheng Y.; Huang W.-K.; Qian X.; Tcw J.; Kouznetsova J.; Ogden S. C.; Hammack C.; Jacob F.; Nguyen H. N.; Itkin M.; Hanna C.; Shinn P.; Allen C.; Michael S. G.; Simeonov A.; Huang W.; Christian K. M.; Goate A.; Brennand K. J.; Huang R.; Xia M.; Ming G.-l.; Zheng W.; Song H.; Tang H. Identification of small-molecule inhibitors of Zika virus infection and induced neural cell death via a drug repurposing screen. Nature Medicine 2016, 22 (10), 1101–1107. 10.1038/nm.4184. [DOI] [PMC free article] [PubMed] [Google Scholar]
- Wu C.-J.; Jan J.-T.; Chen C.-M.; Hsieh H.-P.; Hwang D.-R.; Liu H.-W.; Liu C.-Y.; Huang H.-W.; Chen S.-C.; Hong C.-F.; Lin R.-K.; Chao Y.-S.; Hsu J. T. A. Inhibition of Severe Acute Respiratory Syndrome Coronavirus Replication by Niclosamide. Antimicrob. Agents Ch. 2004, 48 (7), 2693–2696. 10.1128/AAC.48.7.2693-2696.2004. [DOI] [PMC free article] [PubMed] [Google Scholar]
- Jurgeit A.; McDowell R.; Moese S.; Meldrum E.; Schwendener R.; Greber U. F. Niclosamide is a proton carrier and targets acidic endosomes with broad antiviral effects. PLoS Pathog 2012, 8 (10), e1002976 10.1371/journal.ppat.1002976. [DOI] [PMC free article] [PubMed] [Google Scholar]
- Pindiprolu S. K. S. S.; Pindiprolu S. H. Plausible mechanisms of Niclosamide as an antiviral agent against COVID-19. Med. Hypotheses 2020, 140, 109765. 10.1016/j.mehy.2020.109765. [DOI] [PMC free article] [PubMed] [Google Scholar]
- Xu J.; Shi P.-Y.; Li H.; Zhou J. Broad Spectrum Antiviral Agent Niclosamide and Its Therapeutic Potential. ACS Infect. Dis. 2020, 6 (5), 909–915. 10.1021/acsinfecdis.0c00052. [DOI] [PMC free article] [PubMed] [Google Scholar]
- Sovago I.; Bond A. D. Expanding the structural landscape of niclosamide: a high Z’ polymorph, two new solvates and monohydrate HA. Acta Crystallogr. C 2015, 71 (5), 394–401. 10.1107/S2053229615005847. [DOI] [PubMed] [Google Scholar]
- Sanphui P.; Kumar S. S.; Nangia A. Pharmaceutical Cocrystals of Niclosamide. Cryst. Growth Des. 2012, 12 (9), 4588–4599. 10.1021/cg300784v. [DOI] [Google Scholar]
- Caira M. R.; Van Tonder E. C.; De Villiers M. M.; Lotter A. P. Diverse modes of solvent inclusion in crystalline pseudopolymorphs of the anthelmintic drug niclosamide. J. Incl. Phenom. 1998, 31 (1), 1–16. 10.1023/A:1007931314609. [DOI] [Google Scholar]
- Harriss B. I.; Wilson C.; Radosavljevic Evans I. Niclosamide methanol solvate and niclosamide hydrate: structure, solvent inclusion mode and implications for properties. Acta Crystallogr. C 2014, 70 (8), 758–763. 10.1107/S2053229614015496. [DOI] [PubMed] [Google Scholar]
- van Tonder E. C.; Mahlatji M. D.; Malan S. F.; Liebenberg W.; Caira M. R.; Song M.; de Villiers M. M. Preparation and physicochemical characterization of 5 niclosamide solvates and 1 hemisolvate. AAPS PharmSciTech 2004, 5 (1), 86. 10.1208/pt050112. [DOI] [PMC free article] [PubMed] [Google Scholar]
- Luedeker D.; Gossmann R.; Langer K.; Brunklaus G. Crystal Engineering of Pharmaceutical Co-crystals: “NMR Crystallography” of Niclosamide Co-crystals. Cryst. Growth Des. 2016, 16 (6), 3087–3100. 10.1021/acs.cgd.5b01619. [DOI] [Google Scholar]
- Grifasi F.; Chierotti M. R.; Gaglioti K.; Gobetto R.; Maini L.; Braga D.; Dichiarante E.; Curzi M. Using Salt Cocrystals to Improve the Solubility of Niclosamide. Cryst. Growth Des. 2015, 15 (4), 1939–1948. 10.1021/acs.cgd.5b00106. [DOI] [Google Scholar]
- Jara M. O.; Warnken Z. N.; Williams R. O. Amorphous Solid Dispersions and the Contribution of Nanoparticles to In Vitro Dissolution and In Vivo Testing: Niclosamide as a Case Study. Pharmaceutics 2021, 13 (1), 97. 10.3390/pharmaceutics13010097. [DOI] [PMC free article] [PubMed] [Google Scholar]
- Friedman H. L. New methods for evaluating kinetic parameters from thermal analysis data. J. Polym. Sci. Polym. Lett. 1969, 7 (1), 41–46. 10.1002/pol.1969.110070109. [DOI] [Google Scholar]
- Zhou D.; Schmitt E. A.; Zhang G. G.; Law D.; Wight C. A.; Vyazovkin S.; Grant D. J. Model-free treatment of the dehydration kinetics of nedocromil sodium trihydrate. J. Pharm. Sci. 2003, 92 (7), 1367–1376. 10.1002/jps.10400. [DOI] [PubMed] [Google Scholar]
- Khawam A.; Flanagan D. R. Role of isoconversional methods in varying activation energies of solid-state kinetics: I. isothermal kinetic studies. Thermochim. Acta 2005, 429 (1), 93–102. 10.1016/j.tca.2004.11.030. [DOI] [Google Scholar]
- Koradia V.; de Diego H. L.; Elema M. R.; Rantanen J. Integrated Approach to Study the Dehydration Kinetics of Nitrofurantoin Monohydrate. J. Pharm. Sci. 2010, 99 (9), 3966–3976. 10.1002/jps.22244. [DOI] [PubMed] [Google Scholar]
- Khawam A.; Flanagan D. R. Basics and Applications of Solid-State Kinetics: A Pharmaceutical Perspective. J. Pharm. Sci. 2006, 95 (3), 472–498. 10.1002/jps.20559. [DOI] [PubMed] [Google Scholar]
- Khawam A.; Flanagan D. R. Solid-State Kinetic Models: Basics and Mathematical Fundamentals. J. Phys. Chem. B 2006, 110 (35), 17315–17328. 10.1021/jp062746a. [DOI] [PubMed] [Google Scholar]
- Galwey A. K. Structure and order in thermal dehydrations of crystalline solids. Thermochim. Acta 2000, 355, 181–238. 10.1016/S0040-6031(00)00448-2. [DOI] [Google Scholar]
- Chupas P. J.; Chapman K. W.; Kurtz C.; Hanson J. C.; Lee P. L.; Grey C. P. A versatile sample-environment cell for nonambient X-ray scattering experiments. J. Appl. Crystallogr. 2008, 41, 822–824. 10.1107/S0021889808020165. [DOI] [Google Scholar]
- Toby B. H.; Von Dreele R. B. GSAS-II: the genesis of a modern open-source all purpose crystallography software package. J. Appl. Crystallogr. 2013, 46 (2), 544–549. 10.1107/S0021889813003531. [DOI] [Google Scholar]
- Coelho A. TOPAS and TOPAS-Academic: an optimization program integrating computer algebra and crystallographic objects written in C++. J. Appl. Crystallogr. 2018, 51 (1), 210–218. 10.1107/S1600576718000183. [DOI] [Google Scholar]
- Stephenson G. A.; Groleau E. G.; Kleemann R. L.; Xu W.; Rigsbee D. R. Formation of Isomorphic Desolvates: Creating a Molecular Vacuum. J. Pharm. Sci. 1998, 87 (5), 536–542. 10.1021/js970449z. [DOI] [PubMed] [Google Scholar]
- Manek R. V.; Kolling W. M. Influence of moisture on the crystal forms of niclosamide obtained from acetone and ethyl acetate. AAPS PharmSciTech 2004, 5 (1), 101–108. 10.1208/pt050114. [DOI] [PMC free article] [PubMed] [Google Scholar]
- van Tonder E. C.; Maleka T. S. P.; Liebenberg W.; Song M.; Wurster D. E.; de Villiers M. M. Preparation and physicochemical properties of niclosamide anhydrate and two monohydrates. Int. J. Pharm. 2004, 269 (2), 417–432. 10.1016/j.ijpharm.2003.09.035. [DOI] [PubMed] [Google Scholar]
- de Villiers M. M.; Mahlatji M. D.; van Tonder E. C.; Malan S. F.; Lotter A. P.; Liebenberg W. Comparison of the physical and chemical stability of niclosamide crystal forms in aqueous versus noanqueous suspensions. Drug Dev. Ind. Pharm. 2004, 30 (6), 581–592. 10.1081/DDC-120037489. [DOI] [PubMed] [Google Scholar]
- Sardo M.; Amado A. M.; Ribeiro-Claro P. J. A. Pseudopolymorphic transitions of niclosamide monitored by Raman spectroscopy. J. Raman Spectrosc. 2008, 39, 1915–1924. 10.1002/jrs.2058. [DOI] [Google Scholar]
- Yamauchi M.; Lee E. H.; Otte A.; Byrn S. R.; Carvajal M. T. Contrasting the Surface and Bulk Properties of Anhydrate and Dehydrated Hydrate Materials. Cryst. Growth Des. 2011, 11 (3), 692–698. 10.1021/cg101098v. [DOI] [Google Scholar]
- Tian F.; Qu H.; Louhi-Kultanen M.; Rantanen J. Insight into Crystallization Mechanisms of Polymorphic Hydrate Systems. Chem. Eng. Technol. 2010, 33 (5), 833–838. 10.1002/ceat.200900572. [DOI] [Google Scholar]
- Taylor L. S.; York P. Effect of particle size and temperature on the dehydration kinetics of trehalose dihydrate. Int. J. Pharm. 1998, 167, 215–21. 10.1016/S0378-5173(98)00065-9. [DOI] [Google Scholar]
- Bryant M. J.; Maloney A. G. P.; Sykes R. A. Predicting mechanical properties of crystalline materials through topological analysis. CrystEngComm 2018, 20 (19), 2698–2704. 10.1039/C8CE00454D. [DOI] [Google Scholar]
- Montis R.; Davey R. J.; Wright S. E.; Woollam G. R.; Cruz-Cabeza A. J. Transforming Computed Energy Landscapes into Experimental Realities: The Role of Structural Rugosity. Angew. Chem., Int. Ed. Engl. 2020, 59 (46), 20357–20360. 10.1002/anie.202006939. [DOI] [PMC free article] [PubMed] [Google Scholar]
Associated Data
This section collects any data citations, data availability statements, or supplementary materials included in this article.


