Abstract
Dysfunctional autophagy has been implicated in the pathogenesis of Alzheimer’s disease (AD). Previous evidence suggested disruptions of multiple stages of the autophagy-lysosomal pathway in affected neurons. However, whether and how deregulated autophagy in microglia, a cell type with an important link to AD, contributes to AD progression remains elusive. Here we report that autophagy is activated in microglia, particularly of disease-associated microglia surrounding amyloid plaques in AD mouse models. Inhibition of microglial autophagy causes disengagement of microglia from amyloid plaques, suppression of disease-associated microglia, and aggravation of neuropathology in AD mice. Mechanistically, autophagy deficiency promotes senescence-associated microglia as evidenced by reduced proliferation, increased Cdkn1a/p21Cip1, dystrophic morphologies and senescence-associated secretory phenotype. Pharmacological treatment removes autophagy-deficient senescent microglia and alleviates neuropathology in AD mice. Our study demonstrates the protective role of microglial autophagy in regulating the homeostasis of amyloid plaques and preventing senescence; removal of senescent microglia is a promising therapeutic strategy.
The autophagy-lysosomal pathway plays a critical role in removing aggregated proteins, damaged organelles and invading bacteria. Autophagy entails a highly coordinated process of autophagosome synthesis and degradation, which can be activated in response to tissue injuries and cellular stresses1. Impairment of autophagy-lysosomal function has been linked to major neurodegenerative diseases including Alzheimer’s disease (AD). Several genetic risk variants for late-onset AD (LOAD) are associated with autophagy2. Reduced expression of autophagy genes for autophagosome formation, such as BECN1 and NRBF2, was shown in the susceptible brain regions of LOAD; suppression of these genes worsened amyloid plaque load and cognitive functions in AD mouse models3,4. Furthermore, the evidence for the accumulation of immature autophagosomes in dystrophic neurites in AD brains demonstrates dysfunctional autophagosome clearance in neurons5–7. Thus, disruption of multiple steps of autophagy may occur in neurons during AD pathogenesis.
Several reports have demonstrated the neuroprotective functions of microglial autophagy in mice. Loss of microglial autophagy exacerbates tau spreading and pathology in a tauopathy model8. We showed that microglia degrade neuron-released human α-synuclein through autophagy in a transgenic model for Parkinson’s disease9. Autophagy regulates the degradation of amyloid-beta (Aβ) fibrils and Aβ-induced inflammasome in cultured microglia10. Moreover, Trem2 knockout (KO) microglia exhibit altered autophagy flux and energy metabolism11. Other reports showed that microglia clear neurotoxic Aβ and myelin through LC3-associated endocytosis or LC3-associated phagocytosis12,13. However, the precise role of canonical autophagy in microglia that controls Aβ pathology remains unclear.
While molecular profiling of human AD brains revealed a remarkable heterogeneity of microglia14–18, microglia in AD animal models surrounding amyloid plaques display distinct gene expression patterns for ribosomes, lysosomes and phagocytic receptors19,20. These microglia, termed disease-associated microglia (DAM) or microglial neurodegenerative phenotype (MGnD), protect neurons against amyloid plaques19,20, but the detailed mechanism of DAM functions remains elusive.
In this Article, we report heightened autophagy in DAM that engage amyloid plaques. Microglial autophagy is required for DAM development and microglial proliferation in response to amyloid plaques in the AD mouse model. We show that autophagy deficiency leads to senescence-associated microglia (SAM) as evidenced by reduced proliferation, increased Cdkn1a/p21Cip1, dystrophic morphologies and senescence-associated secretory phenotype (SASP). Our study thus demonstrates the protective role of microglial autophagy in regulating the homeostasis of amyloid plaques and restricting senescence; elimination of senescent microglia is a promising therapeutic strategy.
Results
Activation of microglial autophagy associated with DAM
We sought to understand the role of autophagy in microglia in AD by investigating 5xFAD mice—an animal model recapitulating amyloid plaque pathology of human AD21. Microglia from 5xFAD mice showed increased levels of lipidated LC3 (LC3II) and phosphorylation of serine 555 (pS555) of Unc-51-like kinase 1 (ULK1), a 5′AMP-activated protein kinase (AMPK) target that signals autophagy activation22, while p62 levels are unaltered (Fig. 1a and Extended Data Fig. 1). We observed AMPK activation, evidenced by an elevated level of phosphorylation of acetyl-CoA carboxylase in microglia associated with amyloid plaques (Extended Data Fig. 2a). To assay microglial autophagy in vivo, we crossed 5xFAD mice with an autophagy reporter line expressing green fluorescence protein LC3 fusion (GFP-LC3) (ref. 23). We found increased intensity of GFP-LC3 signal around amyloid plaques particularly in Iba-1+ microglia of 5xFAD mice (Fig. 1b). To directly test the autophagic activity of DAM, we collected microglia positive (+) or negative (−) for Clec7a, a marker for DAM19, from 5xFAD mice (Fig. 1c). We found that the number of LC3+ puncta is greater in Clec7a+ microglia than that of Clec7a− microglia (Fig. 1d). Further, we performed ultrastructural analysis through electronic microscopy and observed that Clec7a+ microglia have increased number of double-membraned autophagosomes compared with Clec7a− cells (Fig. 1e). Quantitative analysis of messenger RNA levels for several autophagy-related genes through RT-qPCR showed higher Becn1 mRNA levels in Clec7a+ than Clec7a− cells (Extended Data Fig. 2b). Re-analysis of the previously published data showed increased expression of several autophagy genes, such as Becn1, Nrbf2, Sqstm1 and Map1lc3a, in Clec7a+ microglia compared with Clec7a− cells from APP/PS1 model19 (Extended Data Fig. 2c). Taken together, these results demonstrate the activation of canonical autophagy in DAM.
Fig. 1 |. Analysis of microglial autophagy associated with DAM in AD mouse models.
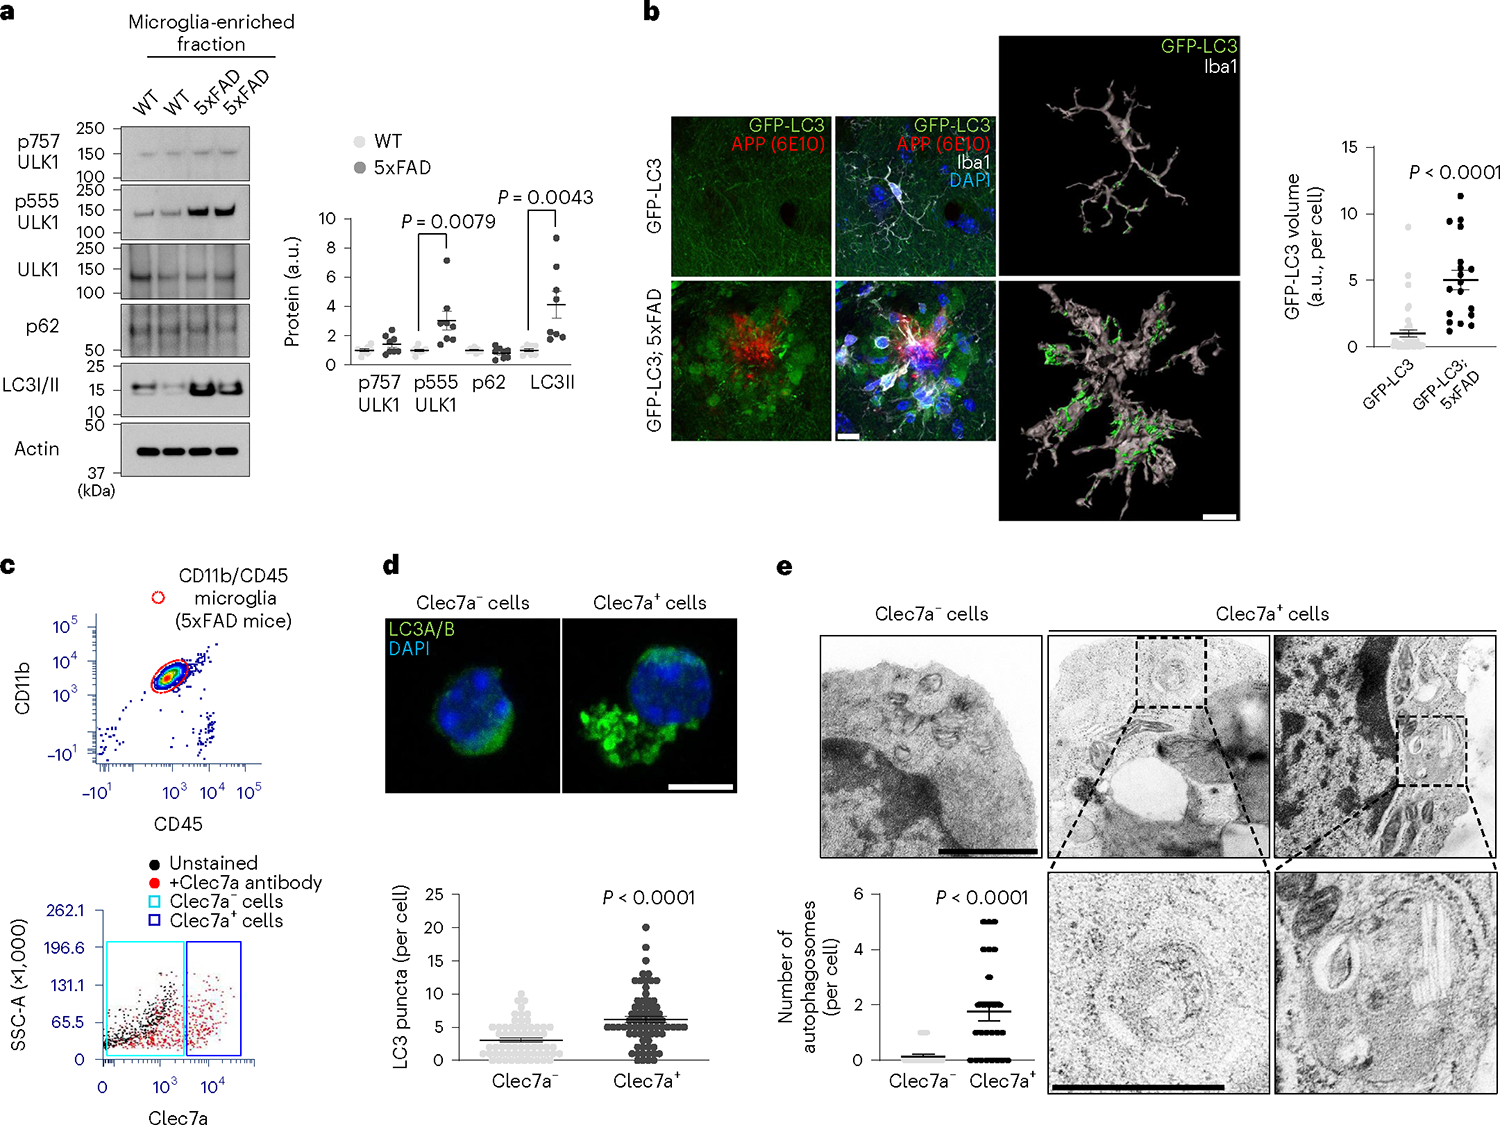
a, Percoll-enriched fractions of microglia from 5xFAD mice and littermate controls (four male and four female mice for each group) were processed for western blot using antibodies against pS757-ULK1, pS555-ULK1, ULK1, p62, LC3B and Actin. The purity of microglia was evaluated in Extended Data Fig. 1. P = 0.0079 for pS555-ULK1; P = 0.0043 for LC3II. b, Brain sections from GFP-LC3 or GFP-LC3; 5xFAD mice (two male and two female mice) were stained using antibodies against GFP/EYFP, APP(6E10) and Iba-1. Representative 3D reconstruction image of Iba-1+ microglia containing GFP-LC3 structures and the volumes of GFP-LC3 in microglia (45 cells for GFP-LC3 mice and 127 cells for GFP-LC3;5xFAD mice (18 amyloid plaques) were obtained using ‘surface’ plug-in in Imaris software (Methods). P < 0.0001. Scale bar, 10 μm. c, Clec7a+ and Clec7a− cells from microglia (CD11b+ and CD45Low) were collected by fluorescence-activated cell sorting (FACS) from 5xFAD mice. d, FACS-sorted Clec7a+ and Clec7a− microglia (72 cells for Clec7a+ and 69 cells for Clec7a−) from 5xFAD mice (three male mice) were stained with anti-LC3A/B antibody. P < 0.0001. Scale bar, 10 μm. e, Ultrastructural analysis of autophagosomes from FACS-sorted Clec7a+ and Clec7a− microglia (26 cells for each group) from 5xFAD mice (three female mice) through electron microscopy. P < 0.0001. Scale bar, 1 μm for upper panels and 500 nm for lower panels. P values were calculated by unpaired two-tailed Student’s t-test (a) or two-tailed Mann–Whitney U test (b, d and e). All values are reported as mean ± s.e.m. Source numerical data and unprocessed blots are available in source data.
Worsened AD neuropathology in autophagy-deficient microglia
To assess the roles of microglial autophagy in amyloid plaque pathology, we deleted the autophagy gene Atg7, encoding an E1-like enzyme in the autophagy-ubiquitin-like conjugation system24, specifically in microglia from 5xFAD mice by crossing Atg7f/f; Cx3cr1CreER mice (tamoxifen-inducible) to 5xFAD mice. Deletion of Atg7 causes defective autophagy flux in microglia from Atg7f/f; Cx3cr1CreER (Atg7cKO) mice after tamoxifen treatment9. Of note, there were no changes in microglial cell numbers or activation up to 7 months after tamoxifen injection in Atg7cKO mice compared with controls9. At 6 months post tamoxifen administration, we observed a distinct morphology of amyloid plaques in Atg7cKO; 5xFAD mice. For instance, X-34+ amyloid plaques appeared diffuse as evidenced by a reduction in the circularities of amyloid plaques in Atg7cKO; 5xFAD mice compared with 5xFAD mice, while the sizes of amyloid plaques changed little (Fig. 2a and Extended Data Fig. 3a). Previous evidence has shown that diffuse amyloid plaques elicit increased neurotoxicity25,26. Indeed, Lamp1+ dystrophic neurites, indicative of neurotoxicity around amyloid plaques, were more prominent in Atg7cKO; 5xFAD mice compared with 5xFAD mice (Fig. 2a). However, the number of X-34+ amyloid plaques showed no difference in the cortex and hippocampus between Atg7cKO; 5xFAD and 5xFAD mice (Extended Data Fig. 3b). Western blot analysis indicated an increased level of oligomeric form of Aβ (***, 10–15 kDa, likely trimer)27 in Triton-soluble fraction of Atg7cKO; 5xFAD brains compared with 5xFAD brains (Fig. 2b and Extended Data Fig. 3c), while the levels of APP and C-terminal fragments, including C83, C89 and C99, are not changed (Extended Data Fig. 3d), indicating that APP processing in neurons is unaffected. Furthermore, the number of anti-pSer202/pThr205-tau (AT8) reactive structures around amyloid plaques28 was increased in Atg7cKO; 5xFAD brain compared with 5xFAD brain (Fig. 2c). The increase in p-tau levels was confirmed by western blot analysis (Extended Data Fig. 3e). We next examined potential synaptic pathologies by assaying the levels of synaptic proteins, such as SV2A, SV2B, VGLUT1, VGLUT2, Synaptophysin and Synaptogyrin, in mutant mice brains. The immunoblot results showed that SV2B and VGLUT2 are reduced while VGLUT1 is slightly increased in 5xFAD brain compared with controls (Extended Data Fig. 4a), indicating altered synaptic proteins in 5xFAD brain. Interestingly, we found that VGLUT2 is further reduced in Atg7cKO; 5xFAD brain (Extended Data Fig. 4b), while no difference was found in Atg7cKO brain compared with controls (Extended Data Fig. 4c), suggesting the synergistic effect of microglial autophagy deficiency and amyloid plaque burden in reducing VGLUT2 level. Immunofluorescence co-staining of VGLUT2 and Lamp1 showed enlarged VGLUT2+ structures around amyloid plaques, distinct from Lamp1+ dystrophic neurites (Extended Data Fig. 4d). Remarkably, the enlarged VGLUT2+ structures were more prominent in Atg7cKO; 5xFAD brain than 5xFAD brain (Fig. 2d). Evidence has indicated the neuroprotective functions of microglia against amyloid plaques by surrounding and minimizing the diffuse of amyloid plaques25,26,28. Importantly, we found that the number of microglia associated with amyloid plaques is markedly reduced in Atg7cKO; 5xFAD mice than 5xFAD mice (Fig. 2e). We also observed a reduced number of microglia containing Ki67, a marker of proliferating cells, around amyloid plaques in Atg7cKO; 5xFAD mice (Fig. 2f). Together, our results demonstrate that loss of microglial autophagy compromises proliferation and impairs the ability of microglia to engage amyloid plaques, resulting in enhanced neurotoxicity25,26,28.
Fig. 2 |. Examination of neuropathology and microglia associated with amyloid plaques in AD mice lacking microglial autophagy.
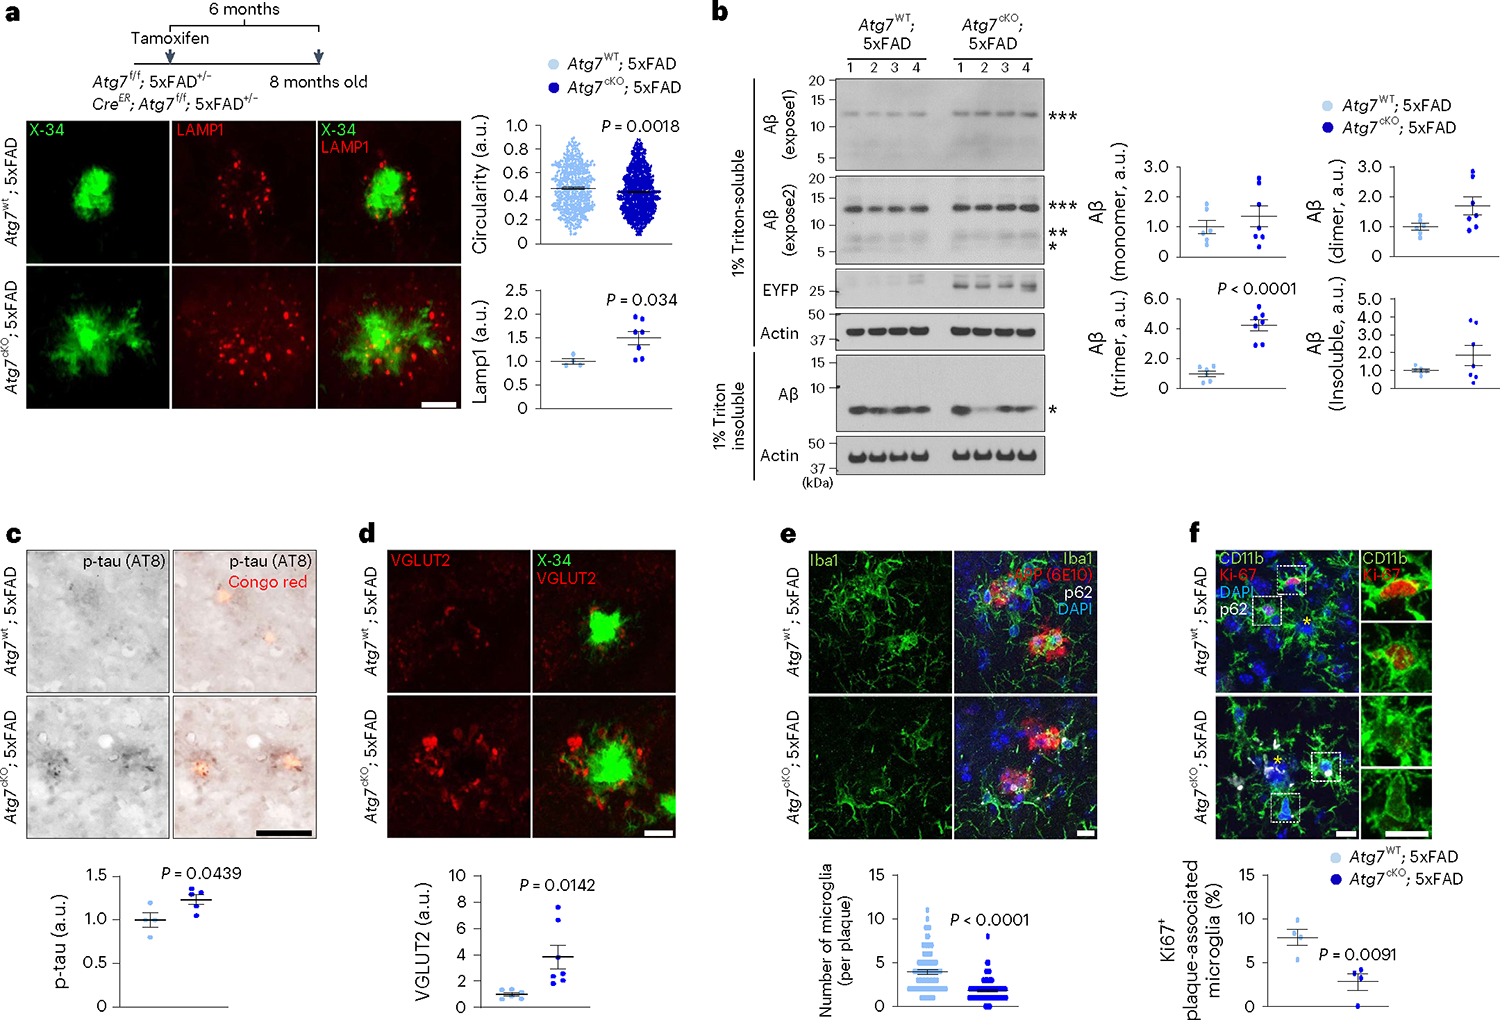
a, The circularities of X-34+ amyloid plaques and the number of Lamp1+ dystrophic neurites around X-34+ amyloid plaques were quantified from Atg7cKO; 5xFAD (7 male mice, 763 plaques) and Atg7WT; 5xFAD (4 male mice, 489 plaques). P = 0.0018 for the circularities; P = 0.034 for Lamp1+ structures. Scale bar, 10 μm. b, Brains from Atg7cKO; 5xFAD (seven male mice) and Atg7WT; 5xFAD mice (six male mice) were homogenized and fractionated into 1% Triton X-100 soluble and insoluble fractions. Levels of Aβ were examined through western blot. EYFP indicates the presence of Cx3crCreER in the mice that co-express EYFP and CreER. P < 0.0001 for Aβ trimer. c, The number of p-tau+ (AT8 clone) structures around Congo Red+ amyloid plaques were measured in Atg7cKO; 5xFAD (five male mice) and Atg7WT; 5xFAD (four male mice) mice. P = 0.0439. Scale bar, 10 μm. d, The areas of enlarged VGLUT2+ structures around X-34+ amyloid plaques were measured in Atg7cKO; 5xFAD (seven male mice) and Atg7WT; 5xFAD (six male mice) mice. P = 0.0142. Scale bar, 10 μm. e, The number of Iba-1+ microglia was counted around amyloid plaques (within 15 μm radius) stained with anti-APP antibody (6E10) from Atg7cKO; 5xFAD mice (4 male mice, 118 plaques) and Atg7WT; 5xFAD mice (7 male mice, 87 plaques). Accumulated p62 puncta indicate autophagy deficiency. P < 0.0001. Scale bar, 10 μm. f, The number of CD11b+ microglia positive with Ki67, a marker of proliferation, was counted around amyloid plaques from Atg7cKO; 5xFAD (two male and two female mice) and Atg7WT; 5xFAD mice (two male and two female mice). Yellow asterisks indicate DAPI-stained amyloid plaques. P = 0.0091. Scale bar, 10 μm. P values were calculated by unpaired two-tailed Student’s t-test (lower part of a–d and f) or two-tailed Mann–Whitney U test (upper parts of a and e). All values are reported as mean ± s.e.m. Source numerical data and unprocessed blots are available in source data.
Molecular profiling of autophagy-deficient microglia
To investigate the mechanism of action for microglial autophagy, we performed single-cell RNA sequencing (scRNA-seq) of Atg7cKO microglia and controls (Extended Data Fig. 5). After filtering out low-quality cells, we obtained 11 clusters (Fig. 3a) and specific marker genes for each cluster using the Seurat package (Extended Data Fig. 6 and Supplementary Tables 1 and 2). Typical markers for excitatory neurons (Slc17a7), astrocytes (Aqp4) and oligodendrocytes (Mog) were rarely detected in all clusters (Extended Data Fig. 7a). Clusters 10 and 11 showed a reduction of microglial genes, such as P2ry12 and Hexb, while expressing some endothelial cell genes including Ttr and Pcp4l1 (Extended Data Fig. 7a and Supplementary Table 1). Cluster 8 showed an increase in border-associated macrophage genes, Ifitm3 and Irf7 (ref. 29) (Extended Data Fig. 7a). Thus, we excluded clusters 8, 10 and 11 from further analysis. By performing gene set enrichment analysis using HALLMARK 50 gene sets30 (Supplementary Table 3), we found that clusters 2 and 5 are highly associated with hypoxia, mTORC1 signalling and unfolded protein responses, while cluster 7 is enriched with cell proliferation as indicated by Mki67 and Mcm6 (Extended Data Figs. 6 and 7b). In contrast, cluster 9 was enriched in oxidative phosphorylation, reactive oxygen species (ROS) pathway and p53 pathway (Extended Data Fig. 7b). Interestingly, clusters 2 and 5 were composed of the cells primarily from the control mice, whereas clusters 4 and 9 were presented predominantly by Atg7cKO cells (Fig. 3b). Several homeostasis-related genes, such as Cx3cr1 and Cst3, were expressed at higher levels in cluster 2 and 5 compared with other clusters (Extended Data Fig. 7c), indicative of homeostatic microglia. In contrast, cluster 9 exhibited an increased expression of Cdkn1a (encoding p21Cip1), a cyclin-dependent kinase inhibitor (CDKI) that causes cellular senescence, along with chemokines such as Ccl3, Ccl6 and Ccl9 (Fig. 3c). Interestingly, cluster 9 genes were largely shared with mouse microglial clusters (OA2 and OA3) emerged in aged mouse brain31 (Fig. 3d and Supplementary Table 4). Noticeably, the OA2 cluster exhibited an increased level of Cdkn1a (Supplementary Table 2). We validated the increase of p21Cip1 in Atg7cKO microglia by immunostaining (Fig. 3e) and western blot analysis (Extended Data Fig. 8a). We confirmed the increase of p16Ink4a, another senescence-associated CDKI, in Atg7cKO microglia (Extended Data Fig. 8b). In addition to OA2, cluster 9 showed a substantial overlap with aged human microglial genes (HuMi_Aged gene set)32 and age-dependent human microglial clusters (for example, clusters 6 and 7) (ref. 33) (Fig. 3d and Supplementary Table 4). Several reports have shown that dystrophic/senescent microglia highly express ferritin light chain (FTL) and ferritin heavy chain 1 (FTH1) in the human brain with AD17,34. We found increased levels of Ftl1 and Fth1 in cluster 9 and notable overlap between cluster 9 and dystrophic microglia signature of human AD brain17 (Extended Data Fig. 7d,e, Supplementary Table 5). Lastly, we compared our clusters with cellular senescence-related datasets: (1) aggregated senescence network (aggreNet) that is established by Multiscale Embedded Gene Co-expression Network Analysis (MEGENA) using bulk RNA-seq data from 50 non-diseased human tissues (GTEx database)35, (2) human gene sets in response to senescence treatment (transcriptome_up or transcriptome_down)36 and (3) manually annotated senescence-associated genes based on experimental studies (CellAge database; experiment_inducer or experiment_inhibitor)37. We found that cluster 9, OA2 and OA3 microglial clusters31 show an overlap with aggreNet and transcriptome_up (Extended Data Fig. 7f and Supplementary Table 6). The above data collectively demonstrate that cluster 9 represents senescent microglia. From cluster 9 and OA2 cluster31, we identified a consensus signature for SAM, which consisted of 20 genes including Ccl3, Ccl4, Ccl6, Cd52, Apoe and Fth1 in addition to Cdkn1a (Fig. 3f). To validate senescent microglia, we stained S100a4, a cluster-9-specific marker (Extended Data Fig. 6), through RNAscope in situ hybridization assay. We found an increased number of S100a4+ microglia in Atg7cKO brain compared with the control (Fig. 3g). We further showed that the levels of Cdkn1a are higher in S100a4+ microglia than S100a4− microglia in Atg7cKO brain (Fig. 3h), suggesting that the S100a4+ population are senescent microglia.
Fig. 3 |. Molecular profiling of microglia from Atg7cKO mice.
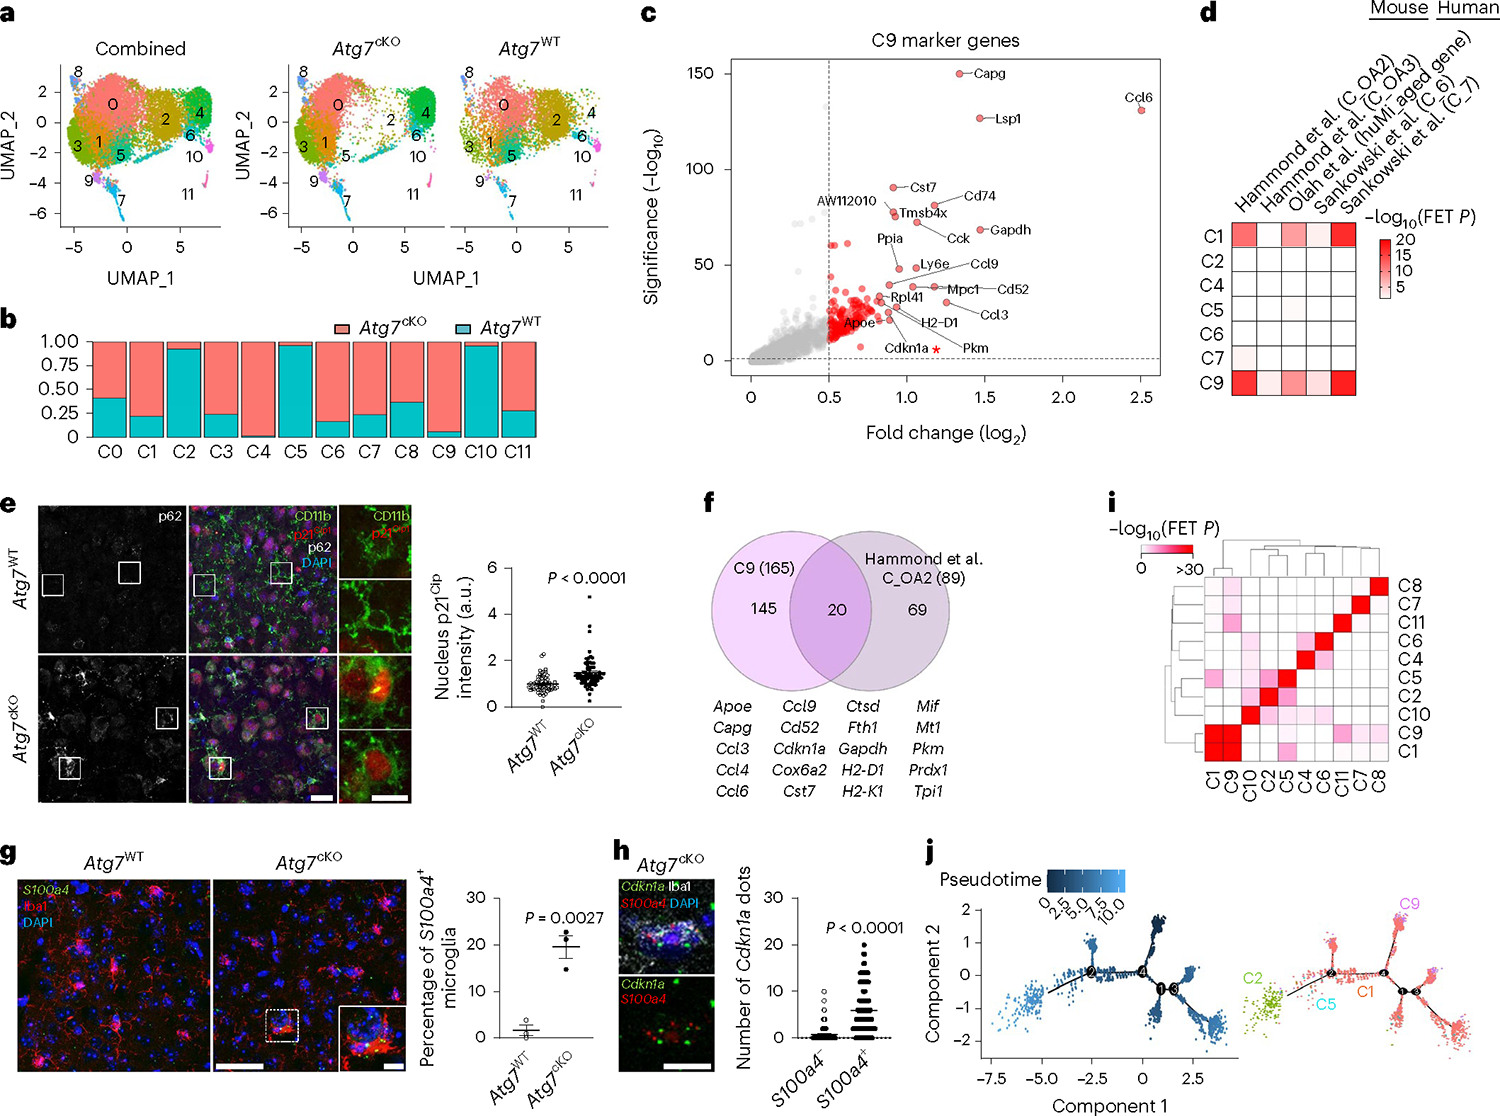
a, UMAP plots of the cells combining Atg7cKO cells and Atg7WT cells (combined, left), Atg7cKO cells (middle) and Atg7WT cells (right). b, Distribution of Atg7cKO cells and Atg7WT cells in each cluster. c, Volcano plot of upregulated genes of cluster 9 (C9 versus other clusters; adjusted P values <0.05, log2FC >0.5). d, Heat map for enrichment test between upregulated DEGs (adjusted P values <0.05, log2FC >0.5) in microglial clusters and previously reported dataset. e, The intensity of p21Cip1 in the nucleus of CD11b+ microglia from Atg7cKO or Atg7WT brains (two male and one female mice, 65 cells for each genotype) was determined by Imaris software (Methods). P < 0.0001. Scale bar, 20 μm (left) and 10 μm (right). f, Venn diagram of the commonly upregulated genes between cluster 9 (adjusted P values <0.05, log2FC >0.5) and OA2 cluster. g, S100a4+ Iba-1+ microglia were examined through RNA scope in situ hybridization assay combined with immunostaining in Atg7WT and Atg7cKO brain (two males and one female mice). P = 0.0027. Scale bar, 50 μm and 10 μm (magnified image). h, The number of Cdkn1a+ dots was counted in S100a4+ or S100a4− microglia in Atg7cKO brain (two males and one female mice). P < 0.0001. Scale bar, 10 μm. i, Comparison among upregulated marker genes (adjusted P values <0.05, log2FC >0.5) of each cluster. j, UMAP for trajectory analysis coloured by pseudotime (left) and subclusters (cluster 1, 2, 5 and 9). P values were calculated by unpaired two-tailed Student’s t-test (g), two-tailed Mann–Whitney U test (e and h), Wilcox rank-sum test (c and f) or one-sided Fisher’s exact test (FET; d and i). Values are reported as mean ± s.e.m. Source numerical data are available in source data.
We found a remarkable overlap of gene expression between cluster 1 and cluster 9 (Fig. 3i and Supplementary Table 7). Like cluster 9, cluster 1 resembled microglial gene clusters associated with ageing (Fig. 3d) and dystrophic microglia with increased levels of Ftl1 and Fth1 (Extended Data Fig. 7d,e), but it lacked the increase of Cdkn1a (Supplementary Table 1). Of note, cluster 1 was found primarily from Atg7cKO microglia than the control (Fig. 3b). Trajectory analysis showed the starting point of homeostatic cluster 2, which is linked to homeostatic microglia (cluster 5), diverges into branches of cluster 1 (Fig. 3j). Cluster 9 microglia were detected at the endpoint of cluster 1 in branches 3 and 4 (Fig. 3j), suggesting that cluster 1 represents a population of the intermediate stage transitioning from the homeostatic microglia (clusters 2 and 5) to senescent microglia (cluster 9).
Gene Ontology (GO) analysis showed that marker genes of cluster 4 are associated with the upregulation of RNA splicing and RAC1 GTPase cycle (Extended Data Fig. 8c,d). Interestingly, the majority of differentially expressed genes (DEGs) between Atg7cKO microglia and control within cluster 4 were downregulated, which include many homeostatic markers such as Tmem119 and Cst3 (Extended Data Fig. 8e and Supplementary Table 8). Furthermore, downregulated DEGs in Atg7cKO microglia were associated with immune cell functions (for example, antigen processing and presentation of peptide antigen and neutrophil degranulation) (Extended Data Fig. 8f). Of note, cluster 4 did not show increased CDKIs levels (for example, Cdkn1a) (Supplementary Table 1). Thus, we posited that cluster 4 is a distinct microglia subtype exhibiting defective homeostatic functions. Collectively, our molecular profiling shows the heterogeneity of microglia and identified SAM signatures in Atg7cKO microglia.
Senescence phenotypes in autophagy-deficient microglia
To validate autophagy-deficient, senescent microglia in vivo, we first checked microglia proliferation in Atg7cKO mice. Due to the slow turnover of microglia38, we administered mice with ethynyl deoxyuridine (EdU), a thymidine analogue, at 6 months after tamoxifen injection. The portion of EdU+ Iba1+ microglia is reduced in Atg7cKO mice (Fig. 4a). The number of microglia became lower in Atg7cKO mice than the control at 1 year after tamoxifen injection (Extended Data Fig. 9a). We also assessed lipofuscin, which is known to be increased in senescent cells39. The volumes of lipofuscin are increased in Atg7cKO microglia (Fig. 4b). Multiple groups have reported senescent/dystrophic microglia in human AD exhibiting spheroid swelling, beading, process-fragmenting and atrophy, associated with losing morphological complexity34,40. We found that Atg7cKO microglia have shortened branches and reduced number of terminal branch points (Fig. 4c), indicative of compromised branch complexity. Further more, Atg7cKO brains contained more microglia with senescent/dystrophic microglial morphologies than the control (Fig. 4d). Additional markers of cellular senescence, such as LaminB1 (nuclear membrane protein), γH2A.X (a marker for DNA damage) and HMGB, were also altered in Atg7cKO microglia (Extended Data Fig. 9b–d).
Fig. 4 |. Characterization of cellular senescence in Atg7-deficient microglia in vivo.
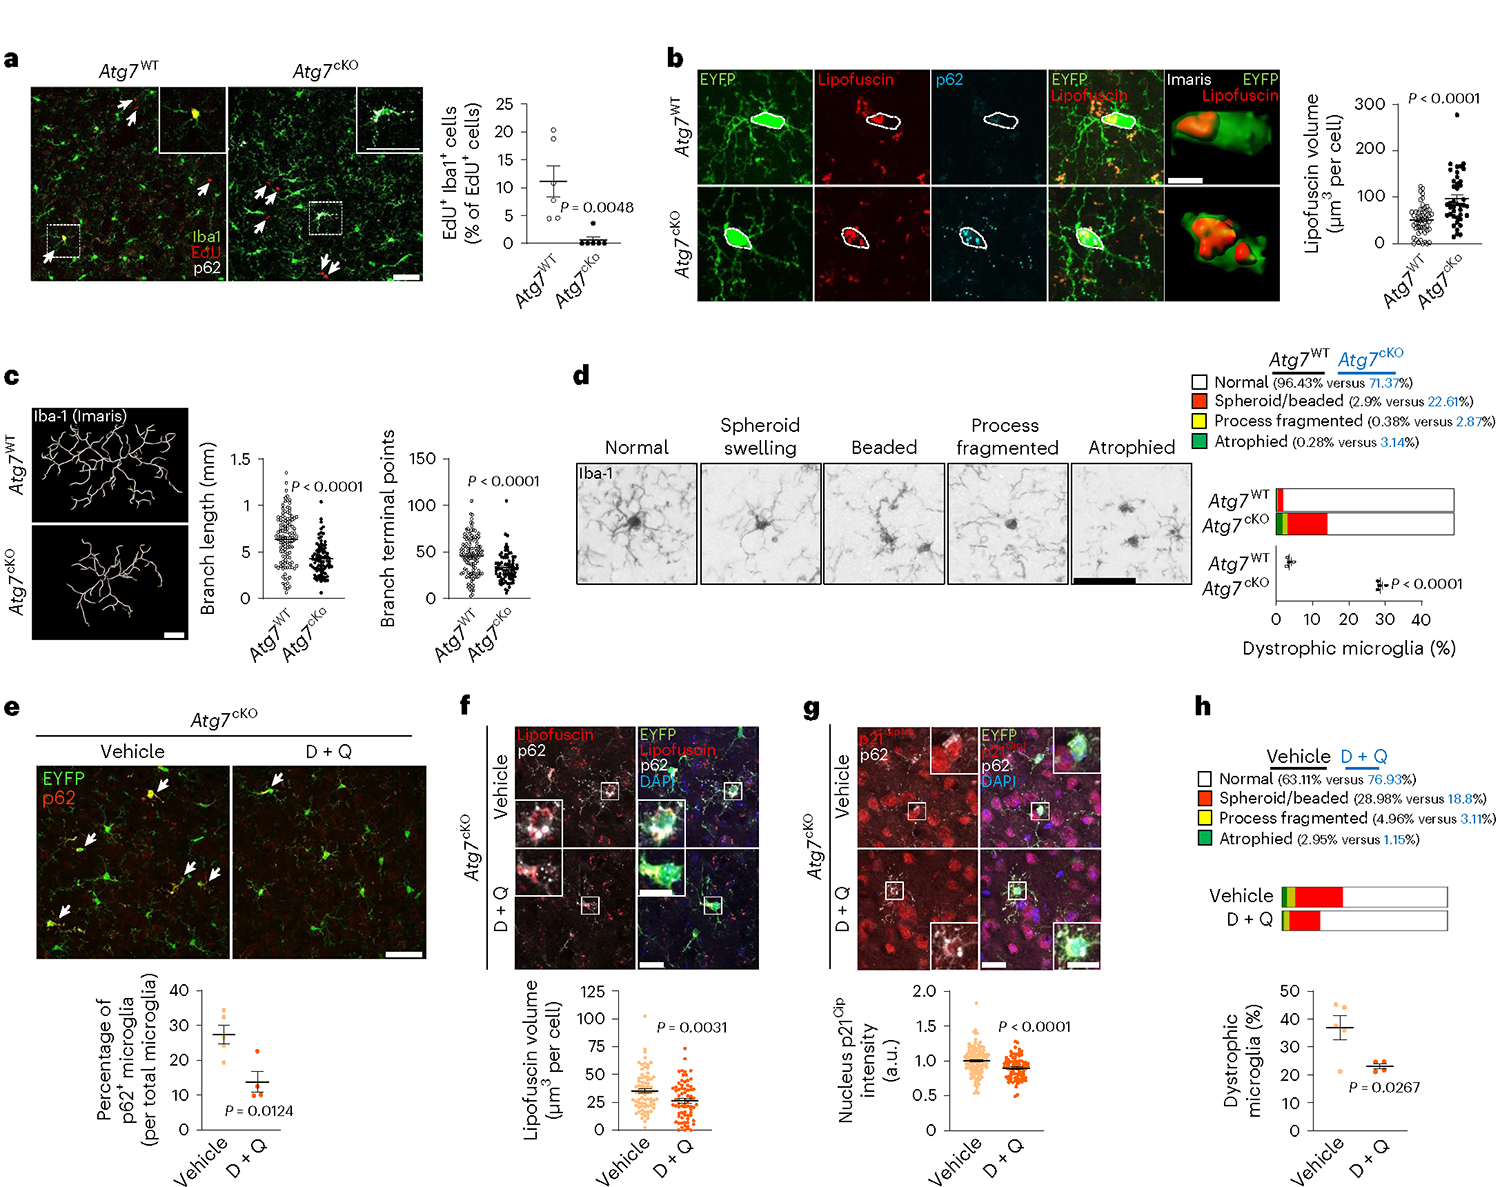
a, EdU assay in Atg7cKO and Atg7WT (five male and two female mice per genotype) mice was performed at 6 months post tamoxifen injection (Methods). Arrows indicate EdU+ cells. P = 0.0048. Scale bar, 50 μm. b, The volumes of Lipofuscin in EYFP+ microglia (CreER mice constitutively express Eyfp under Cx3cr1 promoter) were determined by ‘surface’ plug-in in Imaris software (Methods) from Atg7cKO (2 male and 2 female mice, 41 cells) and Atg7WT (2 male and 2 female mice, 54 cells) brains. P < 0.0001. Scale bar, 20 μm; 5 μm for a magnified image. c, Branch lengths and terminal points numbers of Iba-1+ microglia from Atg7cKO (2 male and 2 female mice, 82 cells) and Atg7WT (2 male and 2 female mice, 120 cells) brains were measured by ‘filament’ plug-in in Imaris software. P < 0.0001. Scale bar, 20 μm. d, Iba-1+ microglia with dystrophic morphologies were counted from Atg7cKO and Atg7WT (four female mice for each genotype) brains. P < 0.0001. Scale bar, 20 μm. e, Following D + Q (two male and two female mice) or vehicle treatment (two male and three female mice) to Atg7cKO mice for 9 days, the number of EYFP+ microglia with p62 accumulation (arrows), indicative of autophagy deficiency, was counted. P = 0.0124. Scale bar, 50 μm. f, After D + Q (72 cells) or vehicle (75 cells), the volumes of Lipofuscin in EYFP+ microglia were measured by ‘surface’ plug-in in Imaris software number. P = 0.0031. Scale bar, 20 μm; 10 μm for magnified images. g, After D + Q (83 cells) or vehicle (123 cells), the staining intensities of nucleus p21Cip1 in EYFP+ microglia were determined by Imaris software (Methods). P < 0.0001. Scale bar, 20 μm; 10 μm for magnified images. h, Iba-1+ microglia with dystrophic morphologies were counted from Atg7cKO mice after treating with either D + Q or vehicle. P = 0.0267. P values were calculated by unpaired two-tailed Student’s t-test (a, d, e and h) or two-tailed Mann–Whitney U test (b, c, f and g). All values are reported as mean ± s.e.m. Source numerical data are available in source data.
To validate functionally the senescent Atg7cKO microglia, we treated Atg7cKO mice with dasatinib and quercetin (D + Q), a senolytic drug combination that selectively removes senescent cells in multiple tissues including the brain41. D + Q reduced the fraction of microglia containing aggregates of p62 (p62+), indicative of autophagy deficiency upon Atg7 depletion9,42,43, compared with the vehicle (Fig. 4e). D + Q also reduced the levels of lipofuscin and p21Cip1 and lowered the number of microglia with dystrophic morphologies in Atg7cKO brains (Fig. 4f–h).
We next characterized senescent phenotypes in autophagy-deficient microglia in culture. To ensure the autophagy-specific effect, we used microglia-specific Atg14-KO mice (Atg14f/f; Cx3cr1Cre), which exhibit defective autophagy as we reported9. ATG14 is a subunit of class III PI3K lipid kinase (VPS34) complex required for autophagy initiation44,45. We found that the numbers of Atg7cKO or Atg14cKO microglia are lower than their respective littermate controls (Fig. 5a,b). The levels of CDKI p21Cip1, but not p16Ink4a and p27Kip1, were markedly elevated in Atg7cKO and Atg14cKO microglia along with increased p62 (Fig. 5c,d). Senescence-associated β-galactosidase activities were also increased (Fig. 5e) and the cell sizes of microglia were larger in Atg7cKO and Atg14cKO mice than their respective controls (Fig. 5f). SASP is a hallmark of cellular senescence but is heterogeneous depending on senescence inducers and cell types46. To determine the possible SASP of autophagy-deficient senescent microglia, we collected the medium after incubating the mutant cells with serum-free medium for 24 h and analysed secreted proteins by multiplexed tandem-mass-tag mass spectrometry47. We examined secretory proteins that are commonly upregulated or downregulated in Atg7cKO and Atg14cKO microglia (Fig. 5g,h and Supplementary Table 9). We observed that Catalase (Cat), Colony-Stimulating Factor 1 (Csf1), Hydroxysteroid 17-β Dehydrogenase 4 (Hsd17b4), Complement C3 (C3), Extended Synaptotagmin 1 (Esyt1) and Colony-Stimulating Factor 2 (Csf2) are increased in the medium from Atg7cKO and Atg14cKO microglia compared with the controls (Fig. 5i). We validated the increase of C3 in the medium from Atg7cKO microglia culture by western blot (Fig. 5j). Interestingly, C3 was present only in the medium, not in cell lysates (Fig. 5j), indicating a rapid secretion of C3 from microglia after synthesis. Moreover, many lysosome-related proteins, including Hexosaminidase Subunit Alpha (Hexa), Gamma-Glutamyl Hydrolase (Ggh), Napsin A Aspartic Peptidase (Napsa), Cathepsin L (Ctsl), Cathepsin F (Ctsf) and Cathepsin O (Ctso), were reduced in Atg7cKO and Atg14cKO microglia (Fig. 5i). Taken together, our data demonstrate that autophagy deficiency promotes microglial senescence both in vivo and in vitro.
Fig. 5 |. Characterization of autophagy-deficient microglia and cellular senescence in vitro.
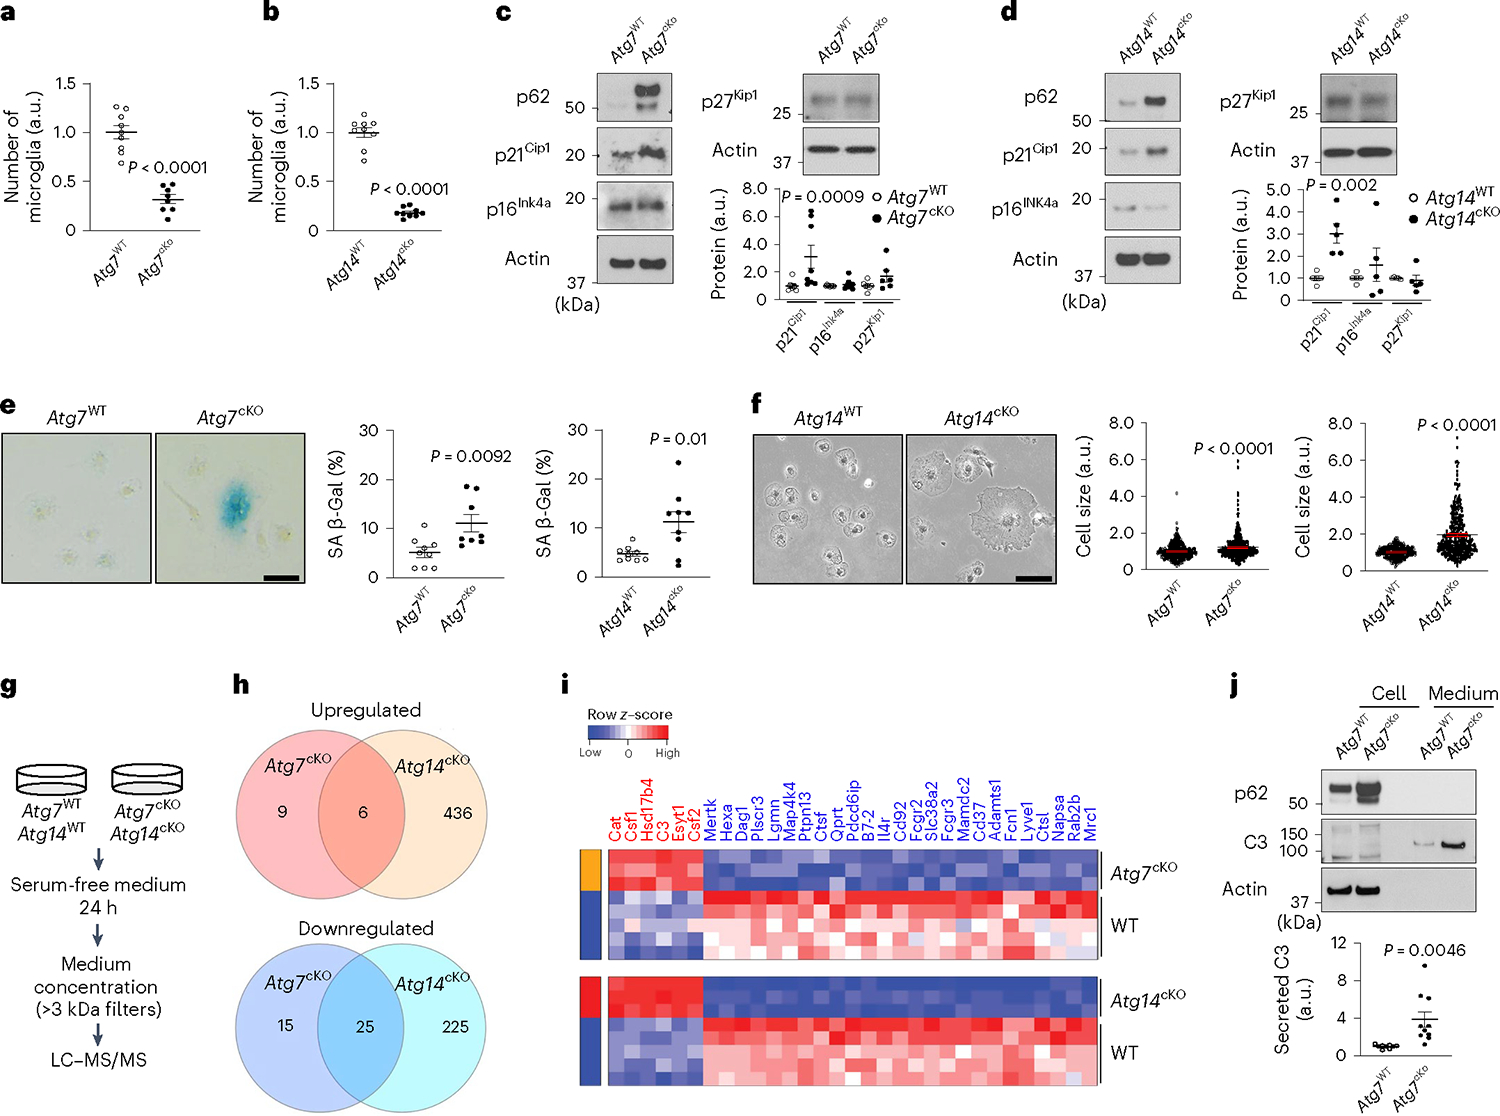
a,b, Primary microglia were cultured from Atg7cKO microglia (n = 8, littermate control n = 9) or Atg14cKO microglia (n = 9, littermate control n = 9). The number of microglia was counted. P < 0.0001 for both genotypes. c,d, The levels of CDKIs, p21Cip1, p16Ink4a and p27Kip1, were measured by western blot from Atg7cKO microglia (n = 8 for p21Cip1 and p16Ink4a; n = 6 for p27Kip1) and littermate controls (n = 9 for p21Cip1 and p16Ink4a; n = 7 for p27Kip1) or Atg14cKO microglia (n = 5, littermate controls n = 5, for all CDKIs). Actin was used as loading controls. For p21Cip1, P = 0.0009 for Atg7cKO; P = 0.002 for Atg14cKO. e, Senescence-associated β-galactosidase activity (SA-β-Gal) was measured from Atg7cKO microglia (n = 8, littermate controls n = 9) or Atg14cKO microglia (n = 9, littermate controls n = 9). P = 0.0092 for Atg7cKO; P = 0.01 for Atg14cKO. Scale bar, 20 μm. f, Cell sizes were measured from Atg7cKO microglia (340 cells, n = 3; littermate controls 369 cells, n = 3) or Atg14cKO microglia (306 cells, n = 6; littermate controls 332 cells, n = 4). P < 0.0001 for genotypes. Scale bar, 20 μm. g, Experimental scheme for SASP analysis. h,i, Venn diagram (h) and heat map (i) showing commonly upregulated (top) or downregulated (bottom) secreted proteins from Atg7cKO (P < 0.05, FC >1.25 or <0.8) and Atg14cKO microglia (FDR <0.05, FC >1.25 or <0.8) compared with controls. j, The levels of C3 protein in cell lysate (lanes 1 and 2) and medium (lanes 3 and 4) from Atg7cKO microglia (n = 10) and littermate controls (n = 9) were measured through western blot and quantified. P = 0.0046. P values were calculated by unpaired two-tailed Student’s t-test (a–e and j) or two-tailed Mann–Whitney U test (f). All values are reported as mean ± s.e.m. Source numerical data and unprocessed blots are available in source data.
Suppression of DAM by autophagy deficiency
As the disruption of autophagy compromises microglial proliferation and prevents microglia from engaging amyloid plaques in the 5xFAD mice (Fig. 2e,f), we hypothesized that autophagy deficiency inhibits DAM development. To test this idea, we performed transcriptomics analysis of Atg7cKO; 5xFAD brains and 5xFAD brains through bulk RNA sequencing. We found that the majority of DEGs are downregulated in Atg7cKO; 5xFAD brain compared with the 5xFAD brain (Fig. 6a and Supplementary Table 10). These downregulated DEGs were associated with immune cell proliferation, activation and migration (Fig. 6b). To examine the specific changes of DAM in Atg7cKO microglia, we compared the gene signature of DAM from the previously reported Clec7a+ microglia19 and all DEGs detected from Atg7cKO; 5xFAD brain. We found 19 overlapping genes (AU020206, C1qb, Ccl3, Ccl6, Cd180, Clec7a, Cst7, Ctss, Fcgr2b, Fcgr3, Fcrls, Itgax, Laptm5, Ly86, Rnase4, Slc15a3, Tent5c, Trem2 and Tyrobp). Notably, all these genes were found in downregulated DEGs of Atg7cKO; 5xFAD brain (Fig. 6c), indicating the suppression of DAM genes caused by autophagy deficiency. Furthermore, microglia surrounding amyloid plaques displayed diminished expression of Clec7a in Atg7cKO; 5xFAD brains as compared with 5xFAD brains (Fig. 6d). We also observed that the levels of Mmp-12, one of the well-known SASPs, are increased from Atg7cKO; 5xFAD brains (Fig. 6a). Consistently, immunofluorescence staining showed that MMP12 signals are elevated and co-localized with accumulated p62 puncta in Atg7cKO microglia (arrows, Fig. 6e). Atg7cKO; 5xFAD microglia also showed increased levels of p21Cip1 and lipofuscin around amyloid plaques (Extended Data Fig. 8g,h). Through in situ hybridization assay, we found that S100a4+ microglia have reduced association with amyloid plaques in Atg7cKO; 5xFAD brain, in contrast to Clec7a+ microglia in 5xFAD brain (Fig. 6f). These results demonstrate that loss of microglial autophagy dampens DAM but promotes SAM in AD mice, resulting in the disengagement of microglia from amyloid plaques.
Fig. 6 |. Examination of DAM and cellular senescence in autophagy-deficient microglia from Atg7cKO; 5xFAD mouse brains.
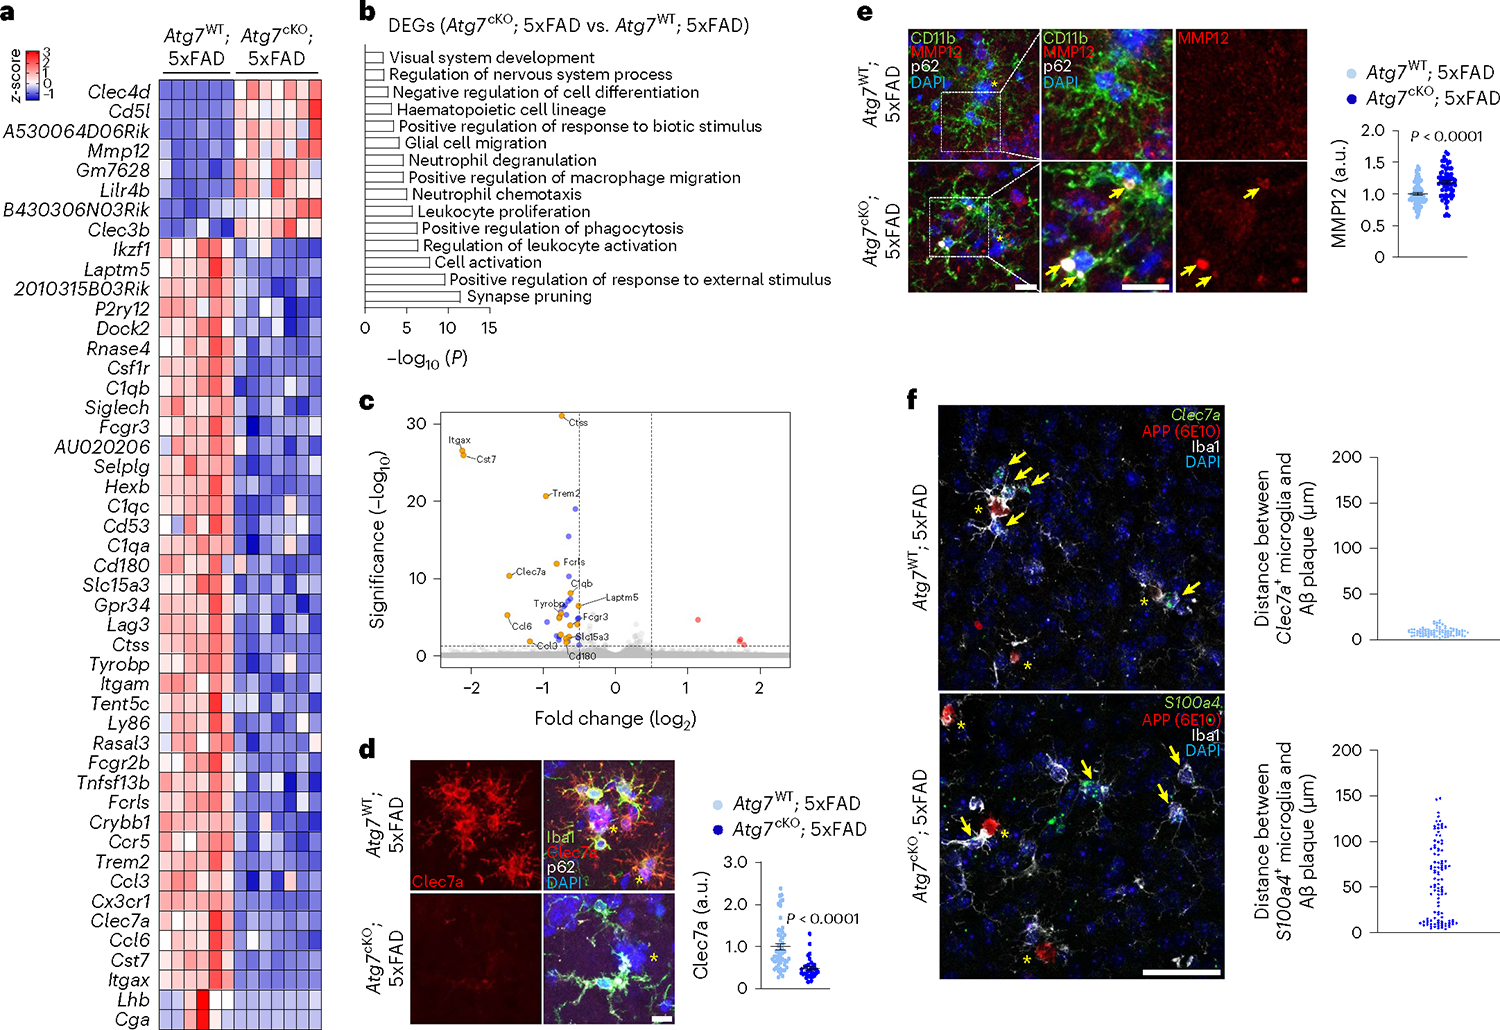
a, Heat map for DEGs (adjusted P values <0.05, log2FC >0.5 or log2FC <−0.5) in Atg7cKO; 5xFAD brains (seven male mice) compared with Atg7WT; 5xFAD brains (six male mice). b, GO term analysis for downregulated DEGs from a. c, Volcano plot of DEGs (up-DEGs in red, down-DEGs in blue) and the projection of overlapping genes from Clec7+ gene signature (orange dots). d, The staining intensity of Clec7a in Iba-1 microglia was quantified using Imaris software (Methods) from Atg7cKO; 5xFAD mice (4 male mice, 33 plaques, 94 cells) and Atg7WT; 5xFAD mice (4 male mice, 51 plaques, 124 cells). P < 0.0001. Scale bar, 10 μm. e, The staining intensity of MMP-12 in CD11b+ microglia was quantified using Imaris software (Methods) from Atg7cKO; 5xFAD mice (4 male mice, 65 cells) and Atg7WT; 5xFAD mice (4 male mice, 81 cells). Arrows indicate the co-localization of p62+ puncta and MMP-12. P < 0.0001. Scale bar, 10 μm. f, The distances between amyloid plaques and Clec7a+ microglia (top, 3 male mice, 86 cells, Atg7WT; 5xFAD mice) or S100a4+ microglia (bottom, 3 male mice, 107 cells, Atg7cKO; 5xFAD mice) were measured. Scale bar, 50 μm. Arrows indicate Clec7a+ microglia (top) or S100a4+ microglia (bottom). Yellow asterisks (d–f) indicate DAPI-stained amyloid plaques. P values were calculated by a two-tailed Mann–Whitney U test (d and e). All values are reported as mean ± s.e.m. Source numerical data are available in source data.
Neuroprotection by removal of senescent microglia
Finally, we examined the impact of the removal of senescent microglia in AD model with senolytic drugs. We delivered D + Q or vehicle into Atg7cKO; 5xFAD mice once a week for 11 weeks41 and assessed microglial phenotypes and amyloid plaque pathologies. We observed that D + Q treatment efficiently lowers the number of p62+ microglia fraction (autophagy deficient), indicative of senolytic effect (Fig. 7a). In contrast, D + Q increased the number of microglia associated with amyloid plaques and the intensity of Clec7a in Atg7cKO; 5xFAD brains compared with vehicle treatment (Fig. 7b,c), suggesting that the removal of senescent microglia rescues microglial response to amyloid plaques. Strikingly, D + Q treatment reduced the number of X-34+ plaques in the cortex and the hippocampus of Atg7cKO; 5xFAD brains (Fig. 7d). Furthermore, the sizes and circularities of X-34+ plaques were increased by D + Q treatment in Atg7cKO; 5xFAD brains (Fig. 7e), suggesting that diffuse amyloid plaques in Atg7cKO; 5xFAD brains are converted into the compact amyloid plaques. Importantly, D + Q treatment reduced Lamp1+ dystrophic neurites in Atg7cKO; 5xFAD mice than vehicle treatment (Fig. 7e). In contrast, D + Q treatment did not substantially affect the number, sizes, and circularities of X-34+ amyloid plaques in 5xFAD mice (Extended Data Fig. 10a,b). Also, D + Q did not alter the number of microglia associated with amyloid plaques while modestly increasing the level of Clec7a intensity in microglia compared with controls (Extended Data Fig. 10c), confirming the robust effect of D + Q on Atg7cKO; 5xFAD brains. These results suggest that the removal of autophagy-deficient senescent microglia ameliorates AD-related pathology.
Fig. 7 |. The effect of senolytic drug treatment in altering neuropathology of Atg7cKO; 5xFAD mice.
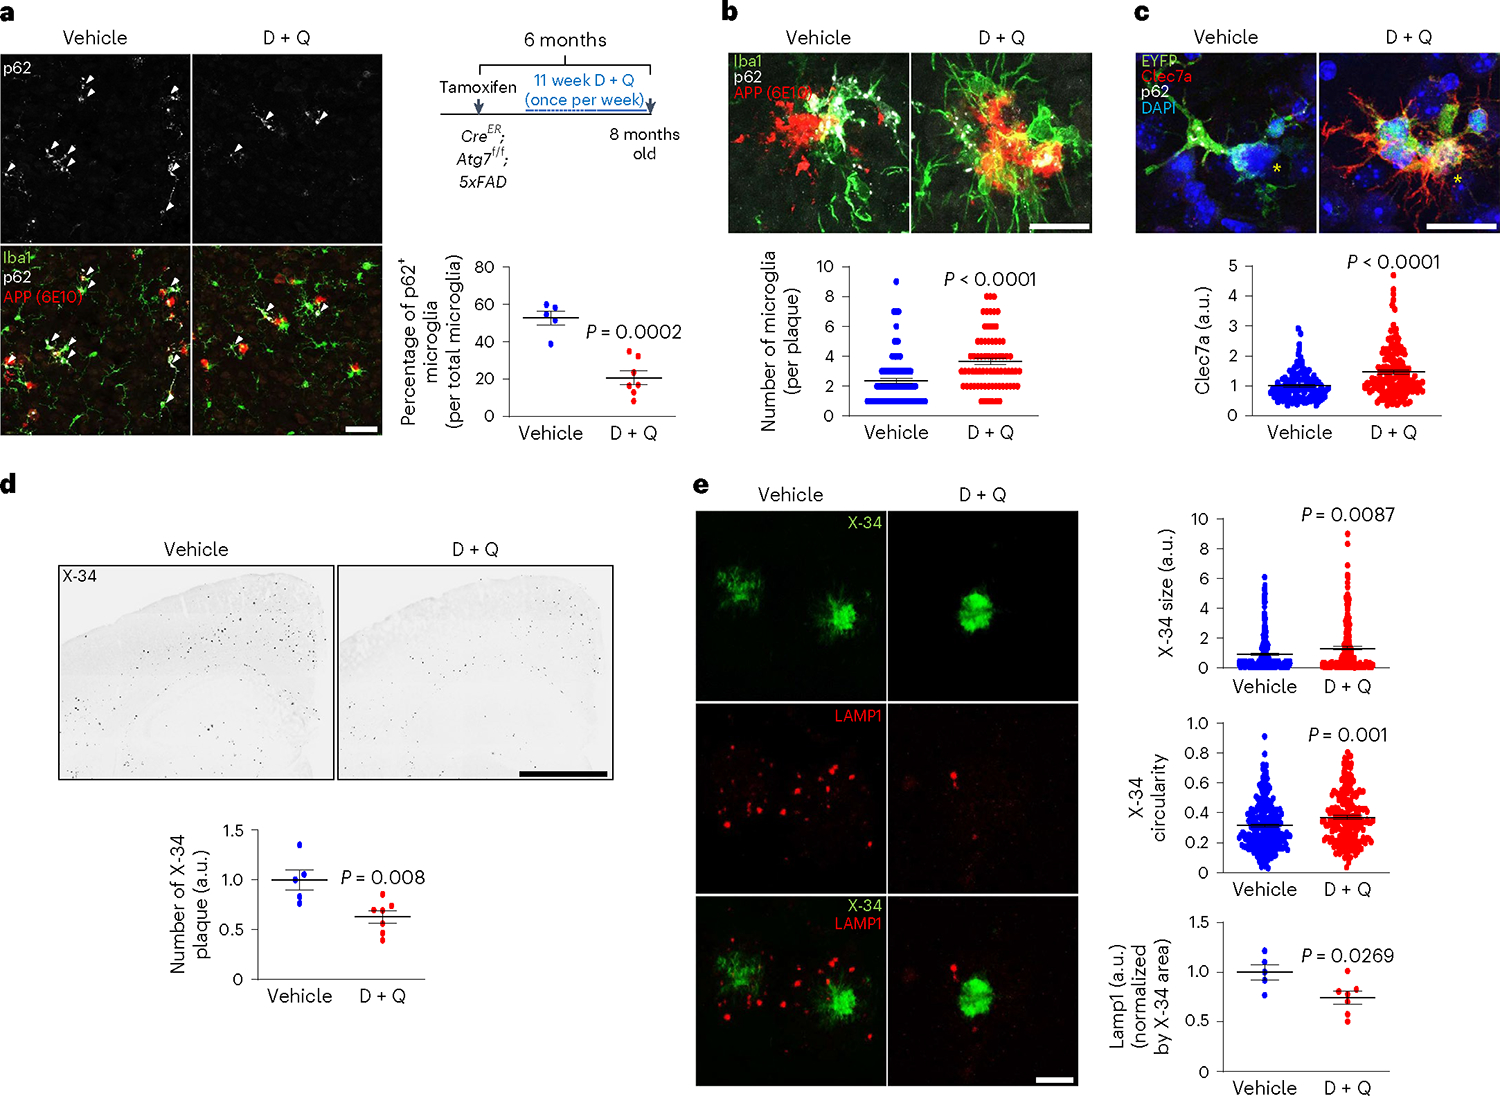
a, Following chronic D + Q (seven male mice, once a week, 11 weeks) or vehicle treatment (five male mice) of Atg7cKO; 5xFAD mice, the number of Iba-1+ microglia with p62 accumulation (arrows), indicative of autophagy deficiency, was counted. P < 0.0002. Scale bar, 50 μm. b, The number of Iba-1+ microglia around amyloid plaques was counted (15 μm radius of amyloid plaques) from Atg7cKO; 5xFAD mice treated with either vehicle (96 plaques) or D + Q (71 plaques). P < 0.0001. Scale bar, 20 μm. c, The staining intensity of Clec7a in microglia was calculated using Imaris software (Methods) from Atg7cKO; 5xFAD mice treated with either vehicle (123 plaques) or D + Q (161 plaques). Yellow asterisks indicate DAPI-stained amyloid plaques. P < 0.0001. Scale bar, 20 μm. d, The number of X-34+ amyloid plaques was quantified from vehicle or D + Q-treated mice. P < 0.008. Scale bar, 1 mm. e, The size, circularities and the number of Lamp1+ dystrophic neurites were quantified from mice treated with either vehicle (234 plaques) or D + Q (210 plaques). P = 0.0087 for sizes of X-34+; P = 0.001 for circularities of X-34+; P = 0.0269 for Lamp1+ structures. Scale bar, 10 μm. P values were calculated by unpaired two-tailed Student’s t-test (a, d and bottom panel of e) or two-tailed Mann–Whitney U test (b, c and top two panels of e). All values are reported as mean ± s.e.m. Source numerical data are available in source data.
Discussion
Herein we report heightened autophagic activity in the DAM of AD models. We demonstrate the critical role of microglial autophagy in DAM development, mobilization of microglia to engage amyloid plaques, and neuroprotection. Mechanistically, we show that autophagy deficiency promotes SAM development. By integration of the published dataset31, our study uncovers a consensus of SAM signature. Treatment of senolytic drugs removes autophagy-deficient senescent microglia and alleviates neuropathology in AD mice (Extended Data Fig. 10d).
In fact, DAM were rarely detected in human LOAD brains14–18, and so far, have been found only in rodent models of AD19,20. While the results may indicate the difference in microglia between the two species, the relatively young or healthy microglia in animals may explain the vigorous response of gene expression against amyloid pathologies. In contrast, in aged human brains, such a response of DAM may be largely compromised14–18. Rather, loss of homeostatic genes in microglia was correlated with the severity of neuronal loss in AD brains18. Autophagic degradation declines with age48. Also, dysregulation of the autophagy-lysosomal degradation pathway has been linked to LOAD2,49. It is conceivable that age-related reduction or gene perturbation of autophagy in microglia could result in senescence and suppression of DAM, contributing to the acceleration of Aβ-linked pathology in AD. Our mouse model combining 5xFAD and microglia-specific disruption of autophagy provides an opportunity for testing the neuroprotective function of microglial autophagy through the prevention of senescence. Given the link of Trem2 and Apoe to autophagy regulation11,50, it would be interesting to examine how these AD-risk genes affect cellular senescence in microglia in resting and disease conditions.
Cellular senescence is a central hallmark of ageing, the major risk factor for AD41,51; however, the cause of cellular senescence in microglia and whether microglial senescence is a cause or effect of the disease remains enigmatic52. The hallmark of cellular senescence is cell-cycle arrest due to increased expression of CDKIs52, which are often associated with morphological alteration and SASP. Indeed, dystrophic microglia, characterized by loss of branch complexity and increased expression level of FTL, have been observed in the human brain with AD, dementia with Lewy bodies, and frontotemporal lobar degeneration34,40,53,54. Our study reveals that suppression of autophagy is sufficient to drive microglial senescence as evidenced by reduced proliferation, increased SA-β-Gal activity, elevated expression of Cdkn1a/p21Cip1, accumulation of lipofuscin, and abnormal morphologies resembling human dystrophic microglia and characteristic of SASP such as MMP12.
The roles of autophagy in cellular senescence could be complex with conflicting evidence and in a cell context-dependent manner55–58. We found that cluster 9 is associated with oxidative phosphorylation and ROS as well as p53 pathway, an upstream regulator of p21Cip1. Thus, we posit that autophagy deficiency triggers excessive ROS generation57,58 or causes the accumulation of autophagy substrates that promote cellular senescence. Moreover, previous reports showed that LC3-associated phagocytosis and LC3-associated endocytosis in microglia confer neuroprotection12,13, raising the question of whether the non-canonical autophagy pathways could also contribute to the regulation of microglial senescence. Our observation of the robust cellular senescence phenotypes of microglia deficient in Atg14, which is not required for LAP59, provides support for the role of canonical autophagy in regulating cellular senescence in microglia.
Finally, by using Atg7cKO; 5xFAD mice, which combine microglial senescence and amyloid plaque AD model, we showed that the treatment of senolytic drugs, dasatinib and quercetin, effectively removes autophagy-deficient senescent microglia and alleviates AD-related pathologies, providing a proof of the concept that targeting microglial senescence is a potential therapeutic strategy. Previous works showed that specific removal of senescent glial cells from tauopathy mice prevents the abnormal accumulation of p-tau and cognitive deficit51; riddance of senescent oligodendrocyte precursor cells reduced levels of Aβ and prevented cognitive impairment in APP/PS1 mice41. In fact, senolytic drugs (dasatinib + quercetin) have entered clinical trials for the treatment of AD60. However, given that senolytic drugs exhibit anti-inflammatory functions61–63, their beneficial actions may be complex.
In summary, our study reveals autophagy as a key regulator of microglial response to amyloid plaques in DAM and microglial senescence. Our report shows that targeting microglial senescence and autophagy is a promising therapeutic strategy for AD.
Online content
Any methods, additional references, Nature Portfolio reporting summaries, source data, extended data, supplementary information, acknowledgements, peer review information; details of author contributions and competing interests; and statements of data and code availability are available at https://doi.org/10.1038/s41556-023-01158-0.
Methods
Animals
B6J.B6N(Cg)-Cx3cr1tm1.1(cre)Jung/J mice (used for primary cultured microglia, Jax025524), B6.129P2(Cg)-Cx3cr1tm2.1(cre/ERT2)Litt/WganJ mice (used for in vivo microglia study, Jax021160), B6.Cg-Tg (APPSwFlLon,PSEN1*M146L*L286V)6799Vas/Mmjax mice (5xFAD, Jax034848) were purchased from Jackson Laboratory. Atg7flox/flox mice were kindly gifted by Dr Masaaki Komatsu (Tokyo, Japan). Atg14flox/flox mice were provided by Dr Herbert W. Virgin (Washington University School of Medicine, St. Louis, MO). GFP-LC3 transgenic mice (C57BL/6J) were described previously23. For generating microglia-specific Atg7-deficient mice, Atg7flox/flox mice were bred to Cx3cr1CreER mice. Cx3cr1CreER/−; Atg7flox/flox or Atg7flox/flox mice (with or without 5xFAD+/−) were injected with tamoxifen (intraperitoneal injection, 5 continuous days, 1.5 mg per mouse). In some experiments, Cx3cr1CreER; Atg7flox/flox mice were injected with either tamoxifen or corn oil. Both male and female mice were used throughout the experiments, and the littermate controls were prepared for each cohort. Differences in amyloid plaque-related pathologies between Atg7WT;5xFAD brain and Atg7cKO;5xFAD brain were assessed in male mice at 8 months of age due to the known difference in disease progression between genders of 5xFAD-AD animal model. The cortex and hippocampus areas, including the dentate gyrus, were used to assess amyloid plaques and microglial behaviours21. Mice were maintained under a 12 h light/12 h dark cycle room with accessible water. All animal procedures were approved by the Icahn School of Medicine at Mount Sinai Animal Care and Use Committee (IACUC-2021–00031).
Senolytic drug treatment
Dasatinib (#S1021, Selleckchem) and quercetin (#S2391, Selleckchem) were prepared in dimethyl sulfoxide with 100 mg ml−1 and 60 mg ml−1 concentrations, respectively, aliquoted and stored at −80 °C. On the treatment day, dasatinib (12 mg kg−1) and quercetin (50 mg kg−1) were prepared in 30% PEG300 (#S6704, Selleckchem) and 5% Tween 80 (#S6702, Selleckchem) and delivered to mice through the oral gavage. The concentrations of dasatinib and quercetin and the application scheme for targeting brain cells were adopted from the previous publication41.
Primary microglia culture
Primary microglia were obtained from mixed glial culture from the forebrain of 1-day-old postnatal pups. Briefly, forebrains were isolated on ice and homogenized into single-cell suspensions by triturating with fire-polished Pasteur pipettes in Dulbecco’s modified Eagle’s medium (DMEM, #11965–092, Gibco, Thermo Fisher Scientific) containing penicillin–streptomycin (#15080–063, Gibco), GlutaMAX (#35050061, GibcoTM) and heat-inactivated 20% foetal bovine serum (FBS, # SH30396.03HI, HyClone). Cells were plated on a 75 cm2 T-flask (BD Bioscience) for 2 weeks. Floating microglia over the astrocytes layer were detached from flasks by mild tapping and then filtered through a 40 μm cell strainer to remove cell clumps or debris. Microglia were plated onto culture dishes at an appropriate density.
Adult microglia isolation
For adult microglia isolation, we adopted the established protocol64,65. Briefly, forebrains were isolated from mice after whole-body intracardial perfusion with ice-cold Dulbecco’s phosphate-buffered saline (D-PBS, Gibco) and homogenized using 15 ml size Dounce homogenizers in 5 ml ice-cold D-PBS with ten strokes. Homogenized tissues were filtered through a 70 μm cell strainer to remove any debris and centrifuged with 1,000g for 10 min at 4 °C. Cell pellets were resuspended in 5 ml of 70% Percoll (P1644, Sigma-Aldrich) in 10% FBS-containing DMEM. Then, 7 ml of 30% Percoll in D-PBS were laid on the top of 70% Percoll layer gently in a 15 ml tube (Falcon). After centrifugation with 800g for 30 min at room temperature, the top layer enriched with myelin was removed and the middle layer (~10 ml) was mixed with ice-cold D-PBS (~40 ml), and centrifuged with 1,400g for 5 min at 4 °C. The microglia-enriched collection was further used for flow cytometry or western blotting.
Flow cytometry
Microglia-enriched pellets were resuspended in 500 μl of FACS buffer (1% FBS in ice-cold D-PBS), and incubated with 10 μg ml−1 of anti-mouse CD16/CD32 antibody (#14-0161-82, Invitrogen) for 15 min on the ice to block Fc-receptor expressed on microglia followed by 5 μg ml−1 of CD45 monoclonal antibody (I3/2.3) conjugated with APC-Cyanine7 (#A15395, Invitrogen) and 2 μg ml−1 of CD11b monoclonal antibody (M1/70) conjugated with PerCP-Cyanine5.5 (#45-0112-82, Invitrogen) for 30 min. For labelling DAM, 20 μg ml−1 of Clec7a antibody conjugated with PE (#144304, BioLegend) was applied. After washing, microglia (CD11bHigh/CD45Low) were collected using FACSDiva v8.0.1 (BD Biosciences). The entire process is described in Extended Fig. 5. FCS Expression (v7) was used for Fig. 1c.
scRNA-seq
Viability of sorted single cells was assessed using Trypan Blue staining, and debris-free suspensions of >70% viability were deemed suitable for scRNA-seq. scRNA-seq was performed on these samples using the Chromium platform (10x Genomics) with the 3′ gene expression (3′ GEX) V3 kit, using an input of ~10,000 cells. In short, Gel-Bead in Emulsions (GEMs) were generated on the sample chip in the Chromium controller, then barcoded complementary DNA was extracted from the GEMs by Post-GEM RT-cleanup and amplified for 12 cycles. Amplified cDNA was fragmented and subjected to end-repair, poly A-tailing, adapter ligation and 10x-specific sample indexing following the manufacturer’s protocol. Libraries were quantified using Bioanalyzer (Agilent) and QuBit (ThermoFisher) analysis and then sequenced in paired-end mode on a NovaSeq instrument (Illumina) targeting a depth of 50,000–100,000 reads per cell.
scRNA-seq data analysis
Starting from Cell Ranger derived unique molecular identifier (UMI) count matrices, we first performed quality control on cells and genes. Briefly, we removed low-quality cells with either too few genes (<200), an excessive number (>4,000) of genes or more than 5% mitochondrion reads detected, retaining 15,909 cells after filtering. Meanwhile, we removed insufficiently detected genes by keeping 17,913 genes expressed in more than one cell. After quality control, we further identified and characterized cell subpopulations using a well-established workflow based on the Seurat package66. Briefly, the UMI data were first normalized by the sequencing depth and log-transformed using the LogNormalize method implemented in Seurat. The 2,000 most variable gene features were identified within each sample. Then samples were combined by anchors identified by the canonical correlation analysis with Seurat66. The combined data were centred and scaled using Seurat’s ScaleData function. Next, the dimensional reduction was performed using principal component analysis. The significant principal components that accounted for 90% of the total variance were selected for cell clustering using Seurat’s graph-based clustering approach66. For each cluster, we calculated de novo cluster signatures by comparing the cells in this cluster against the cells of the rest clusters using the Wilcox rank-sum test in Seurat. The multiple-test P values were adjusted by Bonferroni correction. We projected the normalized dataset onto a 2D space using the uniform manifold approximation and projection for dimension reduction (UMAP) applied to the significant principal components. Differential expressions between autophagy deficient sample and wild-type control were performed using Wilcox rank-sum test for each cell cluster. Genes showing Bonferroni-adjusted P value ≤0.05 and ≥20% fold change (FC) were called DEGs.
Comparison among our cluster-specific signatures and other datasets
We compiled a set of established human and mouse microglia cluster signatures from previous reports (Supplementary Table 2). HuMi_Aged gene set was previously reported by comparing microglial gene expression between middle-aged and old-aged individuals through bulk RNA sequencing32, while age-dependent human microglial clusters were predominantly detected in aged human brains by scRNA-seq33. The human senescence signatures were retrieved from the previous publication35 and the CellAge database (https://genomics.senescence.info/cells/)37. HALLMARK gene sets were obtained from MSigDB databases (version 7.1) (ref. 30). For human microglia cluster signatures, human gene symbols were converted to mouse orthologues using biomaRt. Fisher’s exact test was performed to compare clusters and calculated the enrichment significance.
Trajectory inference
The pseudotime trajectory inference was performed using a modified script previously described67. In brief, normalized gene expression data were extracted from Seurat Object. Cells in microglia subclusters c1, c2, c5 and c9 were selected. Genes with expression in more than 20% of the selected cells were chosen as features for trajectory inference. After reducing dimension of the data with the method DDRTree, cells were ordered according to pseudotime inferred by Monocle68.
GO term analysis
Gene enrichment analysis was performed using the Metascape application with default parameters (http://metascape.org/).
Volcano plot and Venn diagram
Volcano plots were generated with VolcaNoseR application69 by setting a threshold (−log10-adjusted P value >1.3, log2FC >0.5 or <−0.5) and labelling gene names for the top 20 or 30 genes. Venn diagrams were drawn using InteractiVenn (http://www.interactivenn.net/).
RNA sequencing analysis
After removing the cerebellum, forebrains (hemispheres) were put into RNase-free RINO tubes (#PINKR1-RNA, Next Advance) filled with 1 ml of RLT lysis buffer (RNeasy mini kit, Qiagen) and homogenized with Bullet Blender (Next Advance). After a brief centrifuge, 100 μl of homogenates were diluted into 400 μl of RLT buffer. After mixing with 500 μl of 70% EtOH, total RNA was isolated according to the manufacturer’s protocol (RNeasy mini kit, Qiagen). The library was prepared with a NEBNext Ultra II RNA library preparation kit for Illumina sequencing (NovaSeq 6000). After pre-processing, sequencing reads were aligned and mapped to the mm10 mouse reference genome with HISAT2 (ref. 70). Raw read counts were generated with FeatureCount71 and DEGs were calculated with Deseq2 (ref. 72). For GSE101689 (Clec7a− or Clec7a+ from APP/PS1 mice)19, FASTQ files were downloaded and processed through the Galaxy framework (https://usegalaxy.org). The normalized count table was transformed into a z-score table.
Proteomic analysis of microglia culture medium by in-gel digestion, TMT labelling and LC–MS/MS
Cultured primary microglia were seeded on 100 mm dishes for 1 h and the medium was replaced by 6 ml of serum-free DMEM. After 24 h incubation, the medium was collected, centrifuged at 300g for 5 min to remove the debris, and concentrated with centrifugal filters (Amicon Ultra-4, #UFC800324, Millipore). The remainder of the experiment was performed according to a previously reported protocol73. We chose the in-gel digestion method for the samples. Approximately 10 μg of protein per sample was resolved on a short SDS gel (10% pre-cast polyacrylamide gel, Bio-Rad #5671034) and stained with Coomassie blue. Each gel lane was excised into gel bands, followed by protein reduction (dithiothreitol, 5 mM, 30 min), cysteine alkylation (iodoacetamide, 10 mM, 20 min) and quenching (dithiothreitol, 30 mM, 15 min). Trypsin (Promega, 1:20 w/w) was used for digestion in a TMT-compatible buffer (50 mM HEPES buffer, pH 8.5). The resulting peptides were labelled by TMT 11-plex reagents, pooled equally and desalted before liquid chromatography with tandem mass spectrometry (LC–MS/MS). The pooled samples were fractionated by offline basic reversed-phase liquid chromatography with an XBridge C18 column (3.5 μm particle size, 4.6 mm × 25 cm, Waters; buffer A: 10 mM ammonium formate in H2O, pH 8.0; buffer B: 10 mM ammonium formate in 90% acetonitrile, pH 8.0). A total of 20 fractions were concatenated and collected in a gradient of 15–42% buffer B. Each fraction was then analysed by Q-Exactive HF Orbitrap MS (Thermo Fisher Scientific) in a 95 min nano-LC gradient of 15–48% buffer B (buffer A: 0.2% formic acid, 5% dimethyl sulfoxide; buffer B: buffer A plus 65% acetonitrile). MS1 scan settings were 60,000 resolution, 400–1,600 m/z scan range, 1 × 10⁶ AGC and 50 ms maximal ion time. MS2 settings were 20 data-dependent MS2 scans, 60,000 resolutions, starting from 120 m/z, 1 × 10⁵ AGC, 150 maximal ion time, 1.0 m/z isolation window with 0.2 offset, Higher-energy C-trap dissociation, 32% specified normalized collision energy and 15 s dynamic exclusion.
Protein identification and quantitation
All MS data were analysed by the JUMP software suite, which combines de novo tag scoring and pattern matching to improve peptide identification. The MS data were searched against the protein database merged from Swiss-Prot, TrEMBL (from Uniprot) and UCSC databases (mouse: 59,423 entries). To evaluate the false discovery rate (FDR), the decoys were generated by reversing the target protein sequence. Search parameters included 15 p.p.m. for precursor and product ions, full trypticity, two maximal miss cleavage sites, static modification of Cys carbamidomethylation (+57.02146 Da) and TMT-11 labelling of Lys and N-terminal of peptides (+229.16293 Da) and dynamic modification of Met oxidation (+15.99491 Da). Peptide-spectrum matches were filtered by matching scores and mass accuracy to keep protein FDR below 1%. The protein quantitation was performed using the TMT reporter ion based on a published method. The peptide shared by multiple homologous proteins was assigned by the software to the protein with maximal peptide-spectrum match number based on the rule of parsimony. The protein quantification was calculated on the basis of TMT reporter ion intensities.
Proteomics data analysis
Proteomics profiles were log2 transformed first, and differentially expressed proteins were determined between WT versus Atg7cKO and WT versus Atg14cKO samples. The P values were calculated by moderated t-test and FDR values were generated by the Benjamini–Hochberg procedure in the LIMMA R package. With cut-offs (FC >1.5 or <0.66 and P < 0.01), 15 upregulated and 40 downregulated proteins were significantly changed by Atg7cKO. With more stringent cut-offs (FC >1.5 or <0.66 and FDR <0.01) applied, 442 and 250 proteins were up- and downregulated by Atg14cKO, respectively. Then heat maps were plotted on the basis of the common differentially expressed proteins both by Atg7cKO and Atg14cKO microglia.
qRT–PCR
cDNA was synthesized from the total RNA with AffinityScript Multi-Temp RT (Stratagene) with oligo dT18 as a primer. For real-time PCR, PlatinumTaq DNA polymerase (Invitrogen) and a SYBR green (Molecular Probes) containing buffer were used. The real-time PCRs were performed using a thermocycler (ABI7900HT; Applied Biosystems). The PCR conditions used were: 95 °C for 2 min, 40 cycles of 95 °C for 15 s, 55 °C for 15 s, and 72 °C for 30 s using the following primer pairs (Eurofins MWG Operon):
Actin, 5′-AGGTGACAGCATTGCTTCTC-3′ (sense), 5′-GCTGCC TCAACACCTCAAC-3′ (antisense);
ApoE, 5′-AACCGCTTCTGGGATTACCTG-3′ (sense), 5′-CTCTCCCT CGGCTAGGCAT-3′ (antisense);
Atg13, 5′-ACACACATAGATCGCCCCAC-3′ (sense), 5′-CCAGCTCT TCTCCTATGCACC-3′ (antisense);
Becn1, 5′- CCAGTGTCTTCAATCTTGCC-3′ (sense), 5′- AATCTAAGGA GTTGCCGTTATAC-3′ (antisense);
Calcoco2, 5′-CTTGTTCCCCGGACTAAACCA-3′ (sense), 5′- GCTCC CTTGCCAAAAGACCAA-3′ (antisense);
Fip200, 5′-GGTGCTCTCTCCTGATATGCCTA-3′ (sense), 5′-CCCTA AGTTCTTTGCCACGTT-3′ (antisense);
Gabarap, 5′- CCCCACAGAGTCCCTAAATG-3′ (sense), 5′- TCCCTGC TGCAGTCTCTTG-3′ (antisense)
Map1lc3a, 5′-CAACTCAACCCCACGCAGG-3′ (sense), 5′- CCTCTTGA CTCAGAAGCCGAA-3′ (antisense);
Map1lc3b, 5′- CCAGCCACACCCTTTCACTC-3′ (sense), 5′- GAAAC AGCTCTCCAGTCGCTT-3′ (antisense);
Nbr1, 5′-CAAGTATTCCGCTCCTCGTCT-3′ (sense), 5′- TGTTTCT TCTCAGCCCGCAAC-3′ (antisense);
Nrbf2, 5′- CCATGAAGCTGACCGAGTCT-3′ (sense), 5′- CGCTCCT CTCGCTTTGCTC-3′ (antisense);
Optn 5′- CAGCCTGGACACATTCACC-3′ (sense), 5′- CAAATCGC CCTTTCATAGCTTG-3′ (antisense);
Pik3c3, 5′-TCACCAAGGCTCATCGGCAAG-3′ (sense), 5′-TGACA CAGCGAAACTCAACCA-3′ (antisense);
Pik3r4, 5′-CGCCACGGAGACATCAAGACA-3′ (sense), 5′-AACATCC CACCGTCAACGAA-3′ (antisense);
Sqstm1 5′-GAAGCTGCCCTATACCCACA-3′ (sense), 5′-CCCGATG TCGTAATTCTTGGTC-3′ (antisense);
Tax1bp1, 5′- TGCCATTACACCTTAACTCCGTA-3′ (sense), 5′- ATAGT CACGAGCAGTACTCCA-3′ (antisense);
Ulk1, 5′-GTGGAGGTGTGGGTGAAGAA-3′ (sense), 5′-CAGAACA GAGCCGTGACAA-3′ (antisense).
The cycle threshold (Ct) for the gene transcript was normalized to the average Ct for transcripts of the housekeeping gene, Actin, amplified in each reaction. The relative quantitation of normalized transcript abundance was determined using the comparative Ct method (ΔΔCt).
Brain fractionation
Frozen forebrain brains (one hemisphere) were homogenized with a 15 ml size Dounce homogenizer in 5 ml ice-cold D-PBS with ten strokes. Brain homogenates were mixed with protease and phosphatase inhibitors and 10% Triton X-100 to make 1% Triton X-100. After vigorous vertexing, homogenates were centrifuged with 16,000g for 10 min at 4 °C. The supernatants (1% Triton X-100 soluble fraction) were collected and transferred to a new tube. The remaining pellets were washed with 1% Triton X-100 twice to remove any soluble proteins and solubilized in 6 M guanidine–HCl solution by applying sonication with the probe-tip sonicator in level ‘2’ for 10 s (Fisher Scientific 550 Sonic Dismembrator). After spin-down for 16,000g for 10 min at 4 °C, the supernatants (1% Triton X-100 insoluble fraction) were collected. Protein concentration was determined by Pierce BCA Protein Assay Kit (#23225, Thermo Fisher Scientific).
Western blot analysis
Cultured microglia were lysed in lysis buffer (1% Triton X-100 in PBS) containing Halt Protease and Phosphatase Inhibitor Single-Use Cocktail (#1861281, Thermo Fisher Scientific). For FACS-sorted microglia, cells were lysed in 1% Triton/8 M urea/PBS buffer to maximize the yield and sonicated with the probe-tip sonicator in level ‘2’ for 10 s (Fisher Scientific 550 Sonic Dismembrator). Proteins were separated by NuPAGE Precast Gel System (Thermo Fisher Scientific). Membranes were incubated with primary antibodies, including Aβ (#8243, Cell Signaling Technology, 1:2,000), Actin (#3700, Cell Signaling Technology, 1:50,000), C3 (#21337–1-AP, Proteintech, 1:1,000), GFP/YFP (MA5–15256, Thermo Fisher Scientific, 1:2,000), LC3B (#2775S, Cell Signaling Technology, 1:1,000), p62 (PM066, MBL, 1:50,000), p16Ink4a (ab211542, Abcam, 1:1,000), p21Cip1 (ab188224, Abcam, 1:1,000), p27Kip1 (sc-1641, Santa Cruz Biotechnology, 1:2,000), SV2A (#119002, Synaptic system, 1:5,000), SV2B (#119102, Synaptic system, 1:5,000), Synaptogyrin (#103002, Synaptic system, 1:5,000), Synaptophysin (#101011, Synaptic System), pSer202/Thr205-tau (AT8 clone, biotin-conjugated, #MN1020B, Thermo Fisher Scientific, 1:2,000), total tau (tau46 clone, sc-32274, Santa Cruz Biotechnology, 1:5,000), ULK1(#8054, Cell Signaling Technology, 1:1,000), Ser757-ULK1 (#6866, Cell Signaling Technology, 1:1,000), Ser555-ULK1 (#5869, Cell Signaling Technology, 1:1,000), VGLUT1 (#ZRB2374, Sigma, 1:5,000), and VGLUT2 (#ZMS1026, Sigma, 1:5,000). After washing, secondary antibodies conjugated with horseradish peroxidase (#7074, Cell Signaling Technology, 1:2,000 for primary antibodies raised from rabbit; #7076, Cell Signaling Technology, 1:2,000 for primary antibodies raised from mouse; #A-18769, ThermoFisher, 1:2,000 for p62 antibody) were applied. For biotin-conjugated pSer202/Thr205-tau antibody, horseradish peroxidase-conjugated streptavidin (#N100, Thermo Fisher Scientific). The signals were visualized with SuperSignal West Pico Chemiluminescent Substrate (#34580, Thermo Fisher Scientific).
Electron microscope
Sorted microglia were attached to Permanox slides (Electron Microscopy Sciences (EMS)) by incubating for 15 min at 37 °C incubator. Then, cells were fixed with 2% glutaraldehyde (EMS) and 2% paraformaldehyde (EMS)/0.1 M sodium cacodylate buffer (EMS) for a minimum of 2 h at 4 °C. Cells were washed, fixed in 1% aqueous osmium tetroxide at room temperature for 1 h, washed and transferred to 2% aqueous uranyl acetate at room temperature for 1 h. Slides were washed with distilled water, dehydrated in an ascending aqueous ethanol series and then embedded in Epon resin (EMS). Inverted BEEM capsules (#3, EMS) were placed directly over regions of interest, filled with fresh resin and transferred to a vacuum oven for heat polymerization at 60 °C for 12–24 h. To separate the cells from the slides, a hot plate was heated to 60 °C, and the slides were placed directly on a pre-heated hot plate for exactly 3 min and 30 s. The capsules were removed from the hot plate and carefully dislodged free from the slide using a plier. Ultrathin (85 nm) sections were collected onto 300 mesh copper grids (EMS) using a Leica UC7 ultramicrotome (Leica Biosystems), contrast stained with uranyl acetate and lead citrate, and imaged on a Hitachi 7700 transmission electron microscope (Hitachi High Technologies America) equipped with an AMT 2K × 2K digital camera (Advanced Microscopy Techniques).
Immunostaining
For brain tissue immunofluorescence staining, mice were anaesthetized and transcardially perfused with ice-cold PBS, and brains were obtained. Then, the brains were fixed overnight at 4 °C in 4% paraformaldehyde. Fixed brains were stored at 4 °C in a 30% sucrose solution until they sank. A series of coronal sections (30 μm) were obtained with a cryostat (Leica). Coronal sections were incubated with blocking/permeabilization buffer (5% goat serum and 0.25% Triton X-100 in PBS) at room temperature for 60 min and incubated with antibodies including p-ACC (#3661, Cell Signaling Technology, 1:100), APP-Alexa594 (6E10 clone, #803019, BioLegend, 1:250), CD11b (MCA711, Bio-Rad, 1:200), Clec7a (R1–8g7 clone, #mabg-mdect, InvivoGen, 1:10), GFP/EYFP-FITC (NB100–1771, Novus Biologicals, 1:250), γH2A.X (ab81299, Abcam, 1:250), HMGB1 (ab79823, Abcam, 1:250), Iba-1 (#019–19741, Wako, Japan, 1:500), Ki67 (MA5–14520, ThermoFisher, 1:100), Lamin B1 (ab16048, Abcam, 1:100), LAMP1 (ab24170, Abcam, 1:100), MMP-12 (#22989–1-AP, Proteintech, 1:100), p16Ink4a (ab211542, Abcam, 1:100), p21Cip1 (ab188224, Abcam, 1:100), p62 (#GP62-C, Progen, 1:250) and VGLUT2 (#135–404, Synaptic System) at 4 °C overnight followed by secondary antibodies conjugated with Alexa-fluorescein if necessary. For sorted microglia, cells were fixed with 4% paraformaldehyde at 4 °C for 15 min, incubated with blocking/permeabilization buffer (1% bovine serum albumin and 0.1% Triton X-100 in PBS) at room temperature for 30 min, and incubated with LC3A/B (#12741, Cell Signaling Technology, 1:100) at 4 °C overnight followed by secondary antibodies conjugated with fluorescein (#A-11070, #A-11072 and #A-21245 for primary antibodies raised from rabbit; #A-11007 and #A-11006 for primary antibodies raised from rat, ThermoFisher, 1:500; #A-11076 and #A-21450 for p62 antibody). In some experiments, at the end of staining, brain slices were incubated with 10 μM of X-34 (SML1954, Sigma) solution made in 40% EtOH in PBS for 5 min, washed with PBS and mounted. In brain slice staining, autofluorescence signals were masked with TrueBlack Lipofuscin Autofluorescence Quencher (#23007, Biotum) except in the case to measure volumes of lipofuscin. Images were obtained using a confocal microscope (LSM 780) with Zen v2.6 software (Zeiss LSM 780, Carl Zeiss). For 3,3′-diaminobenzidine (DAB) staining, brain sections were incubated with 3% H2O2 for 3 min to quench the endogenous peroxidase activity. After incubating in blocking solution (10% goat serum and 0.25% Triton X-100 in PBS), sections were incubated overnight at room temperature with primary antibodies against Iba-1 (#019–19741, Wako, 1:500) or pSer202/Thr205-tau (AT8 clone, biotin-conjugated, #MN1020B, Thermo Fisher Scientific, 1:10). After washing, sections were incubated with biotinylated secondary antibodies (#BA-1000, 1:300, Vector Laboratories) for 1 h and the avidin/biotin system (#PK6100, Vector Laboratories) for 30 min and visualized using a DAB solution (Vector Laboratories). For AT8 antibody-conjugated with biotin, sections were directly incubated to the avidin/biotin system for 30 min and visualized using a DAB solution. Sequentially, sections were stained with Congo Red to visualize amyloid plaques. Sections were then mounted on gelatin-coated slides and examined under bright-field mode by microscope (NIS Elements (v5.10), ECLIPSE Ts2R, Nikon).
EdU proliferation assay
EdU (#20518, Cayman Chemical) was dissolved in PBS (10 mg ml−1) and stored at −80 °C. At 6 months after tamoxifen injection, EdU (80 mg kg−1, intraperitoneal injection) was administered to the mice for seven consecutive days. The next day, the mice’s brains were processed the same as for immunostaining purposes. Brain slices were first stained with Click-iT EdU Cell Proliferation Kit for Imaging (Alexa Fluor 594 dye, #C10339, ThermoFisher) to detect EdU-incorporated cells. Then, slices were stained with Iba-1 antibody and p62 antibody to label autophagy-deficient microglia. Images were obtained using a confocal microscope with Zen 2011 software (Zeiss LSM 780, Carl Zeiss).
Senescence β-galactosidase staining
Cells were fixed with 4% paraformaldehyde and stained with Senescence β-Galactosidase Staining Kit (#9860, Cell Signaling Technology). Bright-field images were taken with bright-field mode by microscope (ECLIPSE Ts2R, Nikon).
RNAscope in situ hybridization
Brains were fixed overnight at 4 °C in 4% paraformaldehyde. Fixed brains were stored at 4 °C in a 30% sucrose solution until they sank. A series of coronal sections (15 μm) were obtained with a cryostat (Leica). Probes for S100a4 (cat. no. 412971) and Cdkn1a (cat. no. 408551, Advanced Cell Diagnostics) were applied and visualized according to the manual for RNAscope Multiplex Fluorescent V2 Assay. After probe staining, brain slices were incubated with 10% goat serum (in 0.005% Tween-PBS) for 30 min. Then, slices were incubated with Iba-1 antibody (#019–19741, Wako, 1:500) for an hour followed by a secondary antibody conjugated with Alexa fluorescein. Autofluorescence signals were briefly masked with TrueBlack Lipofuscin Autofluorescence Quencher (#23007, Biotum) for 30 s.
Image analysis
For counting microglial cell numbers, z-stack images were obtained with 20× magnification at the cortex area using a confocal microscope (Zeiss LSM 780, Carl Zeiss) from Iba-1 or GFP/EYFP stained brain slices. Then, microglial cell number was counted from z-stack projected pictures using ‘cell counter’ plug-in in Fiji software (National Institutes of Health (NIH)). For amyloid plaques-associated microglia, Iba-1+ microglia within 15 μm radius of amyloid plaques were counted. For microglial morphological analysis, the length of processes and terminal points of branches were measured in a semi-automated way using the ‘filament’ plug-in in Imaris 3D interactive visualization software (Bitplane). To measure the volumes of lipofuscin or GFP-LC3 in microglia, signals outside of EYFP or Iba-1-positive area were masked using ‘surface’ and ‘mask’ plug-in in the Imaris software. Then the lipofuscin or GFP-LC3 signals were made into 3D surface structures, and the volumes were measured automatically. For representative images, 3D rendering surface images were generated by combining each protein surface. To measure the intensities of p21Cip1, p16Ink4a, LaminB1, HMGB1 and γH2A.X in microglial nuclei, 4′,6-diamidino-2-phenylindole (DAPI) areas of microglia (CD11b+ or EYFP+) were generated into 3D using surface plug-in (Imaris) and the signal intensities of target proteins in 3D DAPI structures were automatically measured. To measure the intensities of Clec7a or p-ACC, Iba-1 or EYFP signals were converted into 3D and the signal intensities of Clec7a in 3D Iba-1 structures (surface plug-in) were automatically measured. To count the number of amyloid plaques, X-34-stained brain slices were imaged with 20× magnification and tile scan mode/z-stack through a confocal microscope to capture the cortex and hippocampal area (coronal section, around bregma −1.82 mm). After generating z-stack projected images, the number of X-34+ amyloid plaques was automatically counted by ‘Find Maxima’ Plug-in in Fiji software (NIH). To determine the sizes and circularities of amyloid plaques and the number of dystrophic neurites, z-stack images were taken with 40× magnification after staining brain slices with X-34 and Lamp1. Using z-stack projected images, the size and circularities of X-34+ amyloid plaques were automatically calculated by ‘particle analysis’ following ‘threshold’ Plug-in in Fiji software (NIH) and the number of Lamp1+ dystrophic neurites were counted by ‘Find Maxima’ Plug-in in Fiji software (NIH). The number of Lamp1+ dystrophic neurites was normalized by the size of X-34+ amyloid plaques in each image. The average values per animal were obtained and normalized to control. From z-stack projected images of 40× confocal imaging, VGLUT2+ structures were calculated by ‘particle analysis’ following ‘threshold’. In ‘particle analysis’, we put the threshold on the size of particle to selectively capture abnormally enlarged VGLUT2 structures around plaques. Further, the areas of VGLUT2 structures were normalized by the size of X-34+ plaques. The average values per animal were obtained and normalized to control. To determine the number of AT8+ structures around amyloid plaques, bright field (for AT8) and immunofluorescence (for Congo Red) images were taken with 40× magnification. The number of AT8+ structures was counted by ‘Find Maxima’ plug-in in Fiji software and the sizes of Cogo Red+ amyloid plaques were measured by Fiji software (NIH) after setting the same threshold for all images. The number of AT8+ structures was normalized by the size of the plaques in each image. The average values per animal were obtained and normalized to control. In all imaging analyses, at least two brain slices per animal were used. Senescence-associated β-galactosidase (SA-β-Gal)+ microglia were counted from bright-field images (at least six different locations) and calculated as percentage per total microglia. In western blot experiments, the band intensities were measured by Fiji software (NIH) from scanned images of each blot and normalized by the intensity of actin, a loading control. All images for each experiment were processed equally. In the animal study, we analysed images throughout the cortex and hippocampus areas containing dentate gyrus21.
Statistics and reproducibility
The statistical significance of the difference between the two groups was determined using the unpaired two-tailed Student’s t-test or Mann–Whitney U test based on the normality test. The latest version of GraphPad Prism 9 (GraphPad Software) was used for statistics and graph images. No statistical method was used to pre-determine the sample size. No data were excluded from the analyses. All values are reported as mean ± standard error of the mean (s.e.m.).
Extended Data
Extended Data Fig. 1 |. Purity test for microglia in Percoll-enriched fraction from the brain.
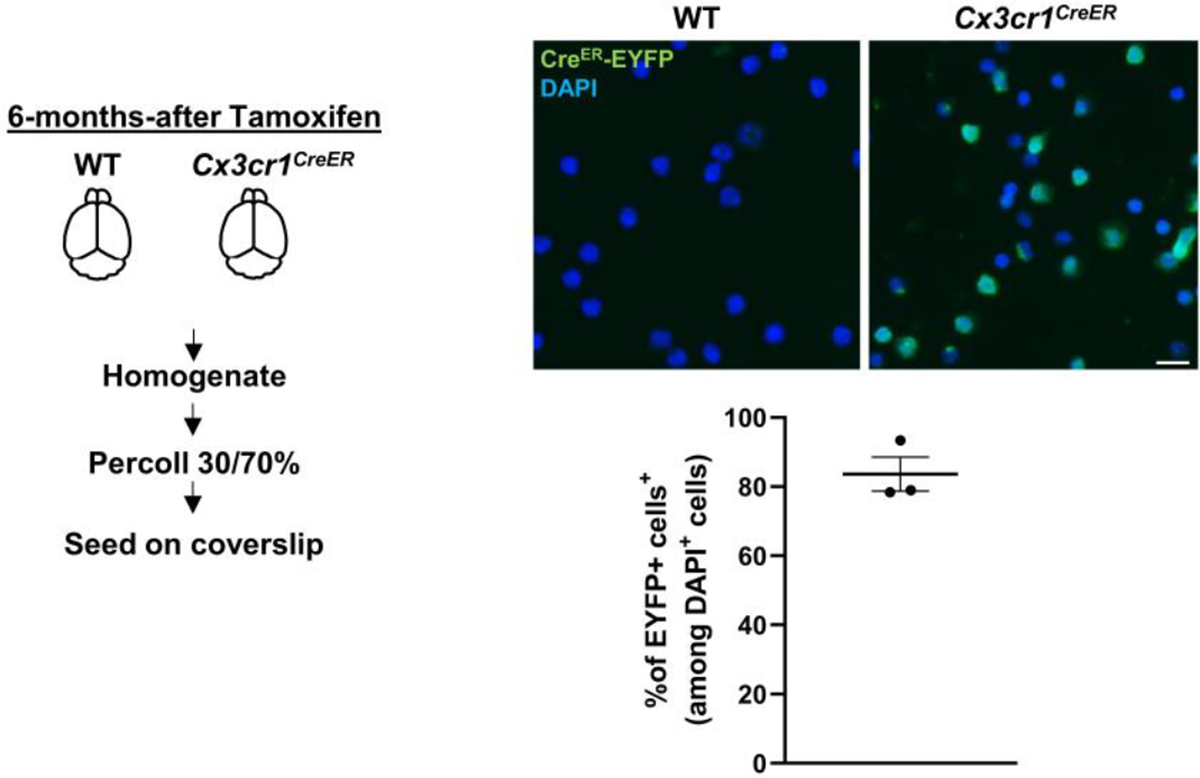
Brains from Cx3cr1CreER mice (constitutively express EYFP, 3 female mice) and WT mice (negative control for EYFP signals) were processed to obtain microglia-enriched fraction (see in method). ~80% of cells were EYFP+ microglia. Scale bar, 10 μm. Values are reported as mean ± SEM. Source numerical data are available in source data.
Extended Data Fig. 2 |. Altered p-ACC and autophagy gene expression in the DAM of 5xFAD mice.
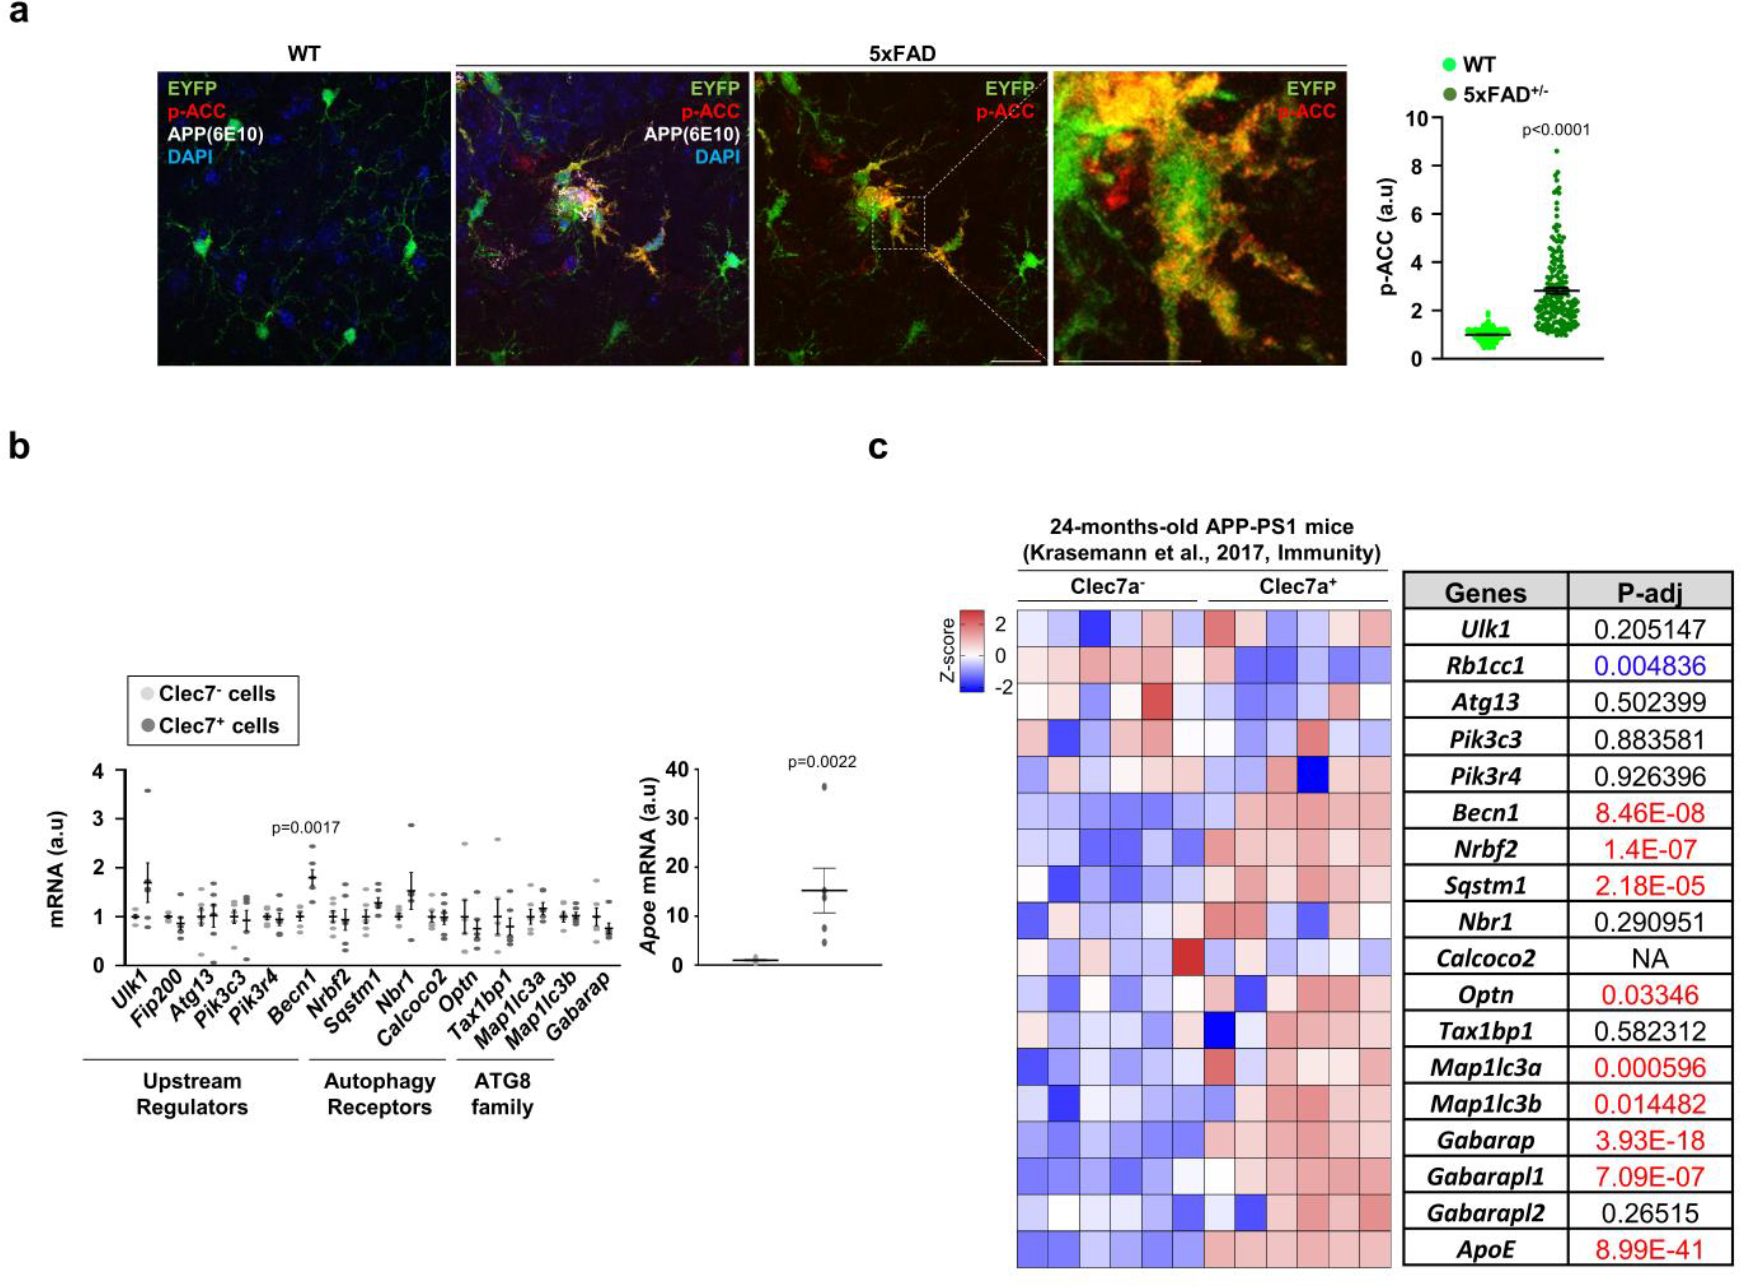
(a) The staining intensities of p-ACC in EYFP+ microglia were determined using Imaris software (see method) from Cx3cr1CreER; 5xFAD brains (3 female mice, 178 cells) and Cx3cr1CreER brains (3 female mice, 268 cells). No tamoxifen injection. p < 0.0001. Scale bar, 20 μm. (b) Clec7a+ and Clec7a−microglia (CD11b+ and CD45Low) from 5xFAD mice (2 male and 4 female mice) were collected and processed for RT-qPCR using primers detecting autophagy-essential genes. The level of Apoe was used for validating Clec7a+ and Clec7a−microglia populations. p = 0.0017 for Becn1; p = 0.0017 for Apoe. p-values were calculated by unpaired two-tailed Student’s t-test. All values are reported as mean ± SEM. (c) Heatmap showing the expression of essential autophagy genes through re-analysis of bulk-RNA sequencing data of Clec7a+ and Clec7a−microglia collected at 24-months-old APP/PS1 mice. p-values were calculated by unpaired two-tailed Student’s t-test (b) or two-tailed Mann-Whitney U test (a). p-values were calculated from Deseq2 analysis pipeline (c). All values are reported as mean ± SEM. Source numerical data are available in source data.
Extended Data Fig. 3 |. Analysis of levels of full-length APP, C-terminal fragments (CTF), and Aβ, tau, and the number and size of amyloid plaques.
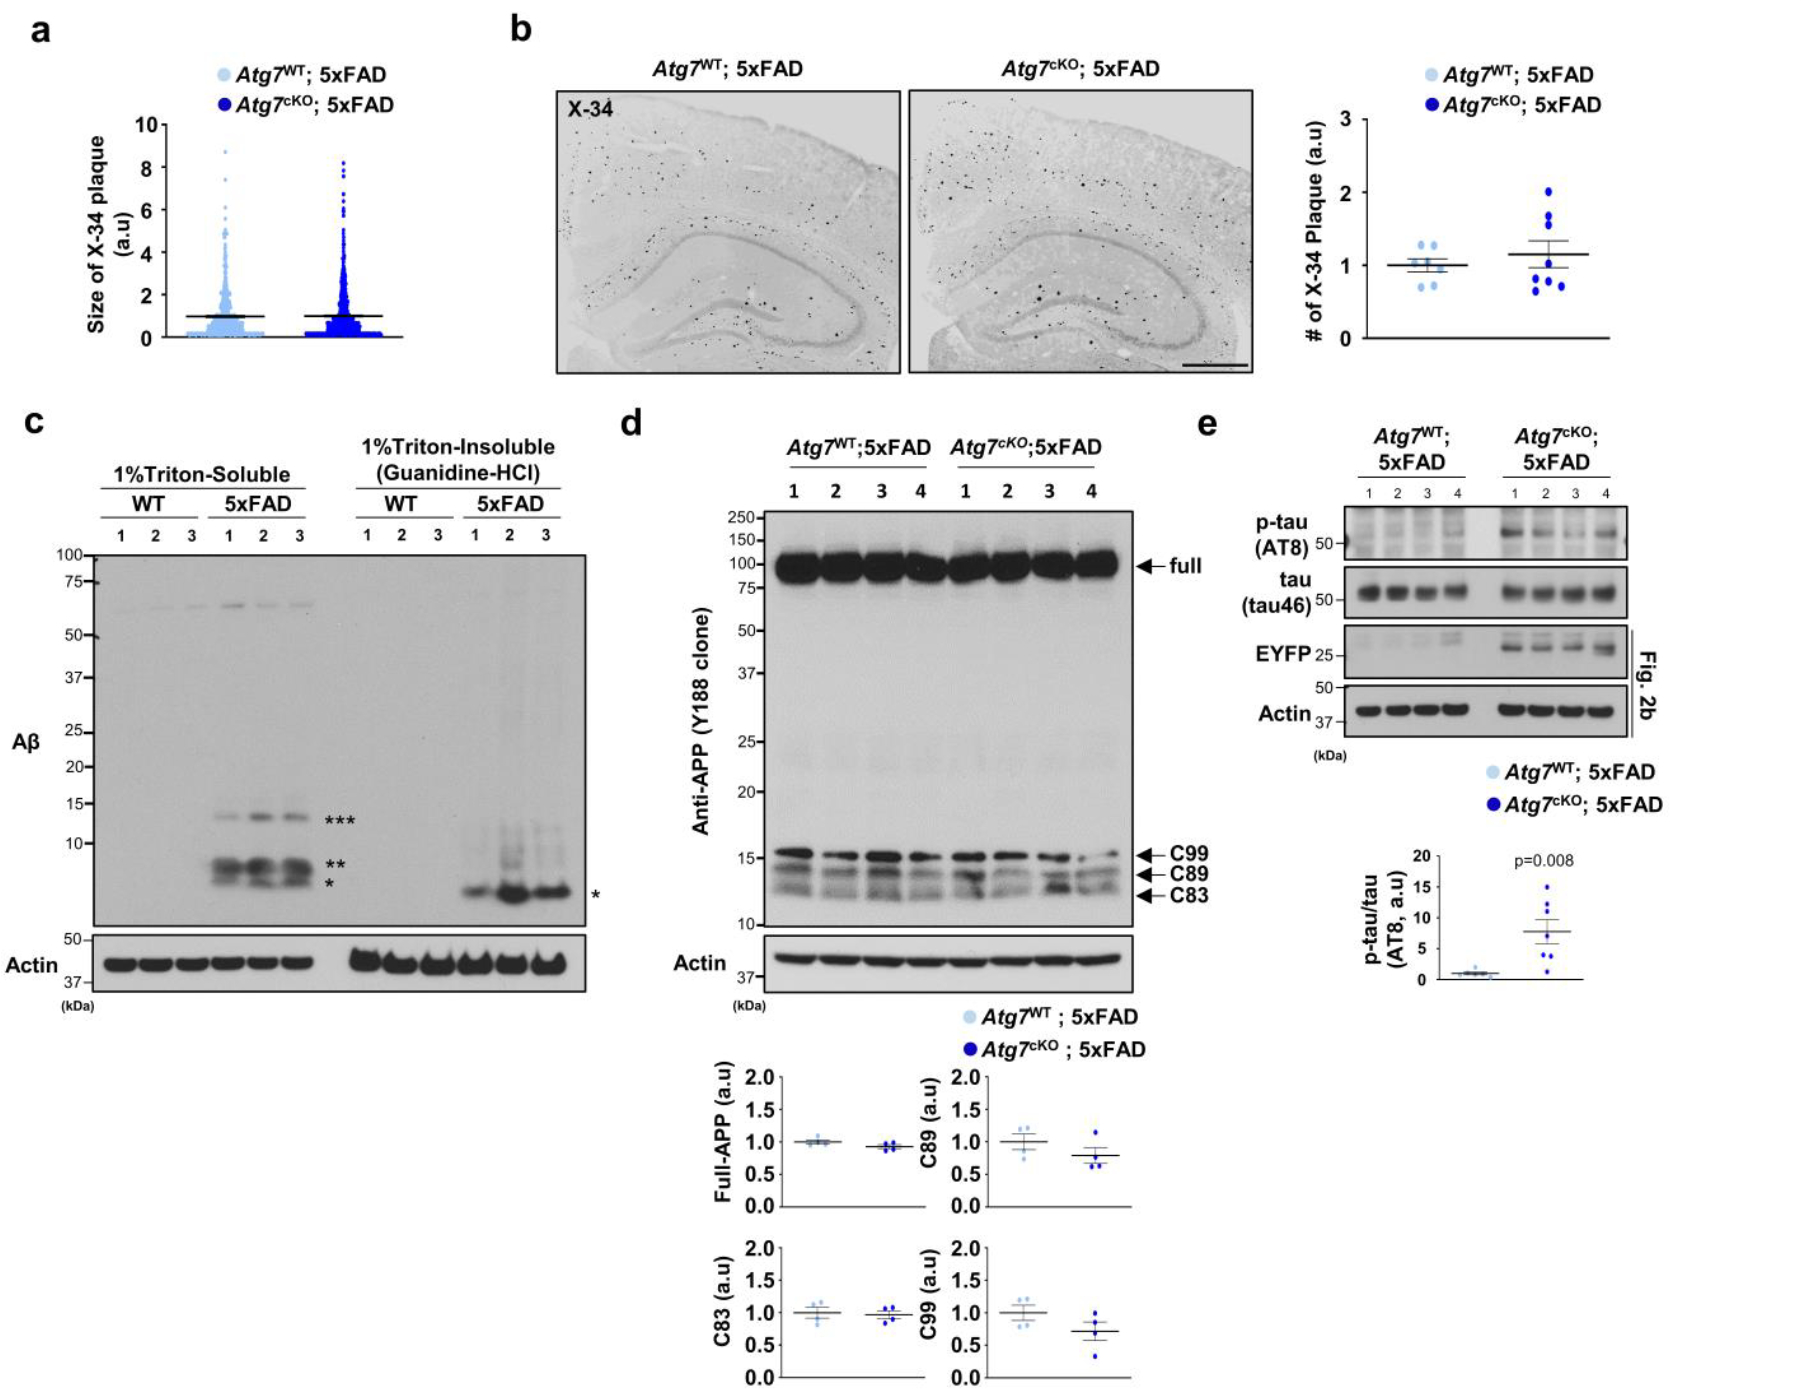
(a) The size of X-34+ amyloid plaques was quantified from 489 plaques for Atg7cKO; 5xFAD (7 male mice) and 763 plaques for Atg7WT; 5xFAD (4 male mice). Scale bar, 10 μm. (b) The number of X-34+ amyloid plaques was quantified from Atg7cKO; 5xFAD (8 male mice) and Atg7WT; 5xFAD (7 male mice). Scale bar, 500 μm. (c, d) Brains from 5xFAD mice (3 female, c) and littermate controls (3 female) or Atg7cKO; 5xFAD mice (4 male mice, d) and Atg7WT; 5xFAD mice (4 male mice) were homogenized, fractionated into 1% Triton x-100 soluble and insoluble fractions, and processed for Western blot using antibodies against amyloid-beta (c) and APP (Y188 clone) (d). (e) Brains from Atg7cKO; 5xFAD (7 male mice) and Atg7WT; 5xFAD mice (6 male mice) were homogenized in 1% Triton x-100. Levels of amyloid-beta, p-tau (AT8), and tau were examined through Western blot. EYFP indicates the presence of Cx3crCreER in the mice that co-express EYFP and CreER. Actin was used as a loading control. p = 0.008. p-values were calculated by unpaired two-tailed Student’s t-test. All values are reported as mean ± SEM. Source numerical data and unprocessed blots are available in source data.
Extended Data Fig. 4 |. Alteration of presynaptic markers.
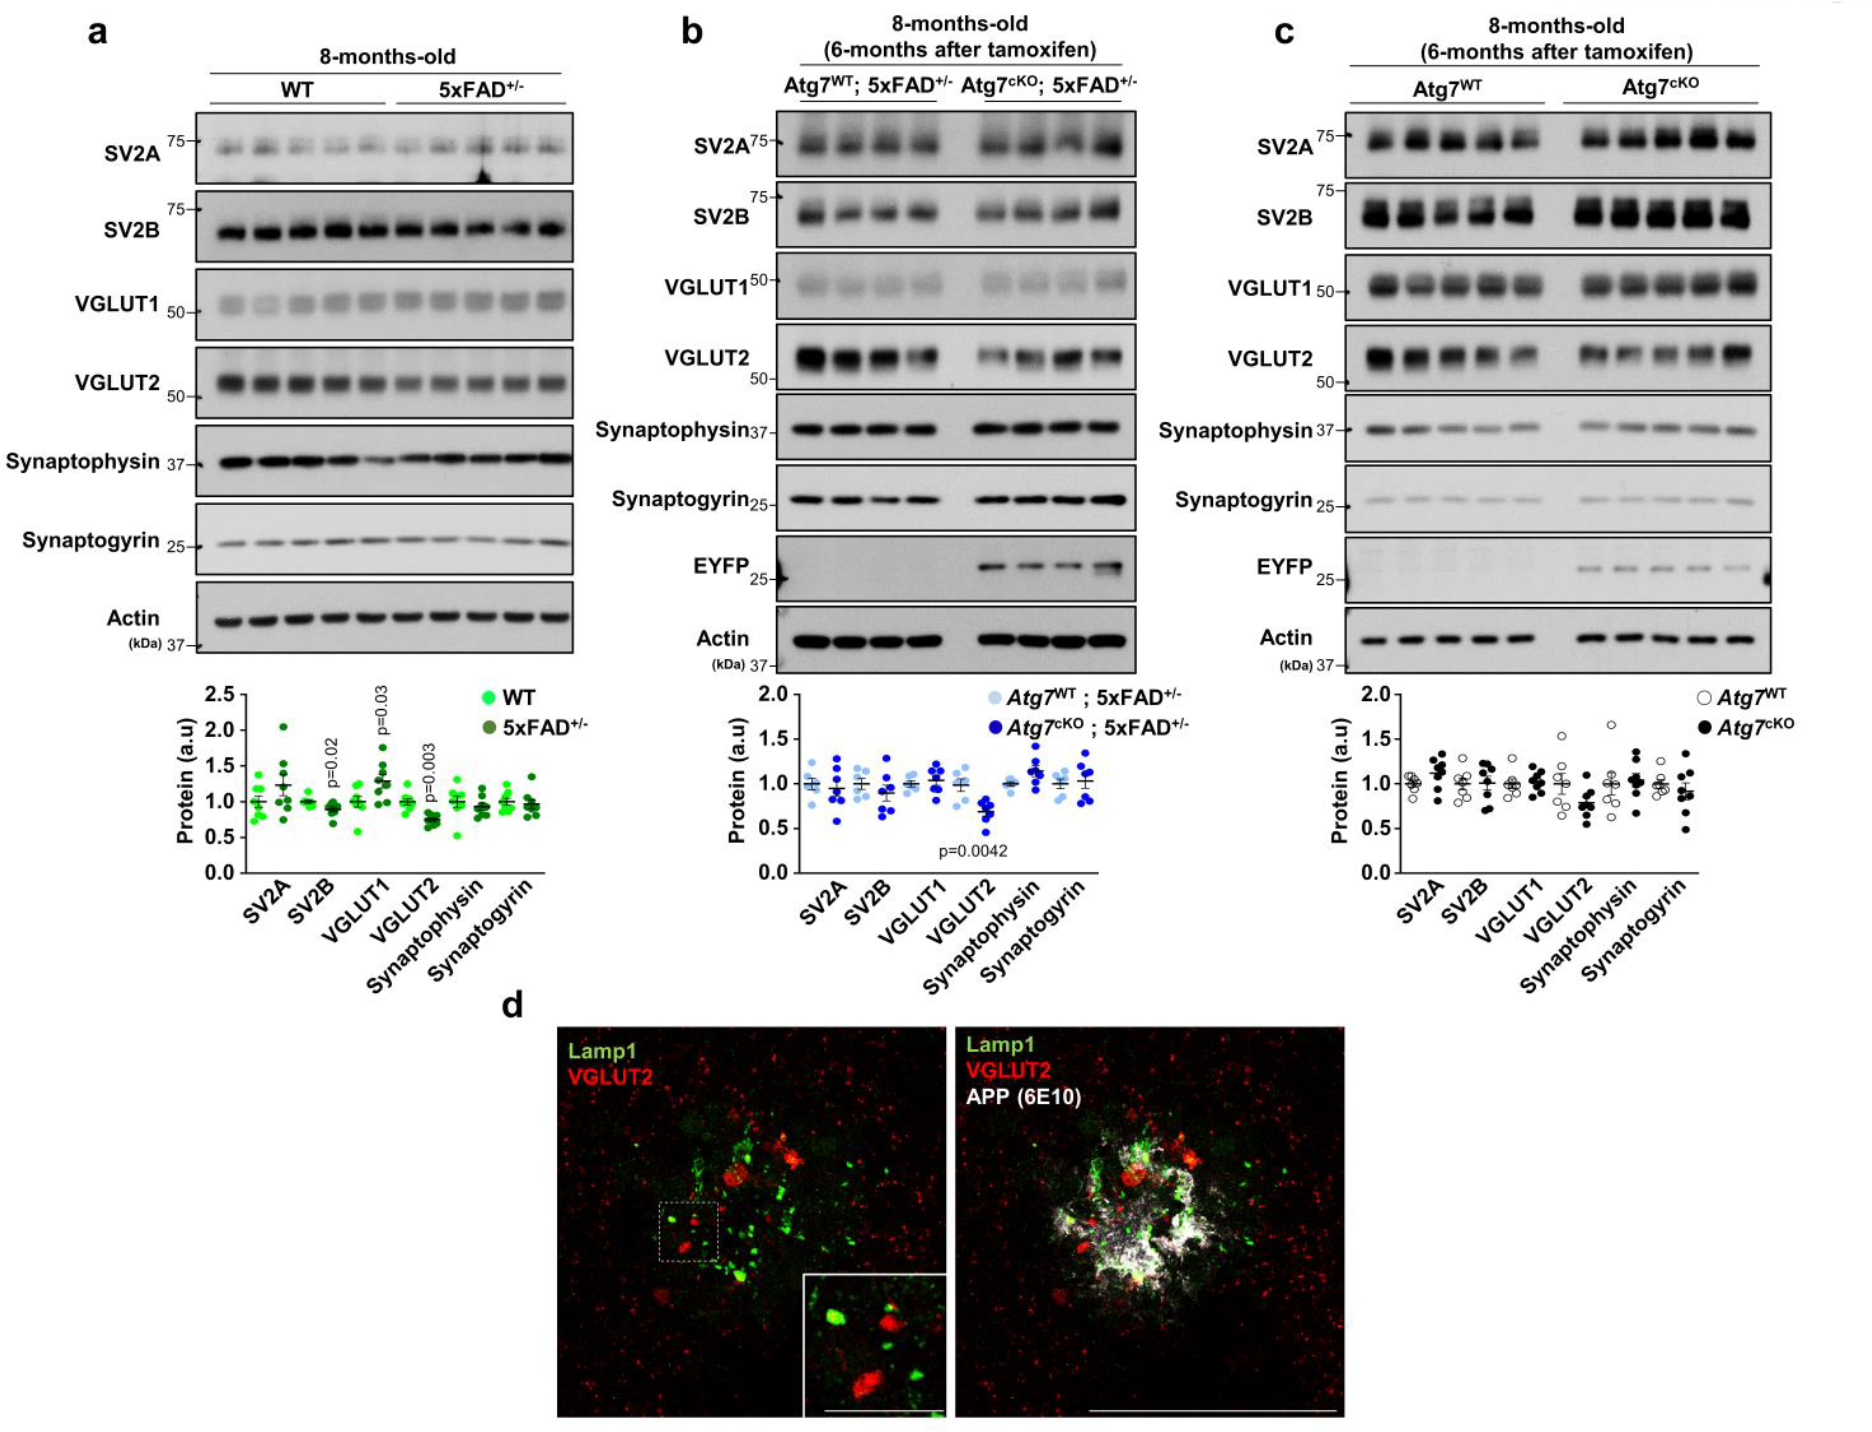
Levels of several presynaptic markers, including SV2A, SV2B, VGLUT1, VGLUT2, Synaptophysin, and Synaptogyrin, were determined in 8-months-old mice brains from 5xFAD and WT (a, 5 male and 3 female mice per group), Atg7cKO; 5xFAD (7 male mice) and Atg7WT; 5xFAD (b, 6 male mice), and Atg7cKO (4 male and 4 female mice) and Atg7WT (c, 4 male and 3 female mice). (d) Immunostaining of Lamp1 and VGLUT2 along with APP. Representative image from at least 3 different experiments. Scale bar, 50 μm. p = 0.02 for SV2B (a); p = 0.03 for VGLUT1 (a); p = 0.003 for VGLUT2 (a); p = 0.0042 for VGLUT2 (b). p-values were calculated by unpaired two-tailed Student’s t-test. All values are reported as mean ± SEM. Source numerical data and unprocessed blots are available in source data.
Extended Data Fig. 5 |. The whole flow of single-cell RNA sequencing.
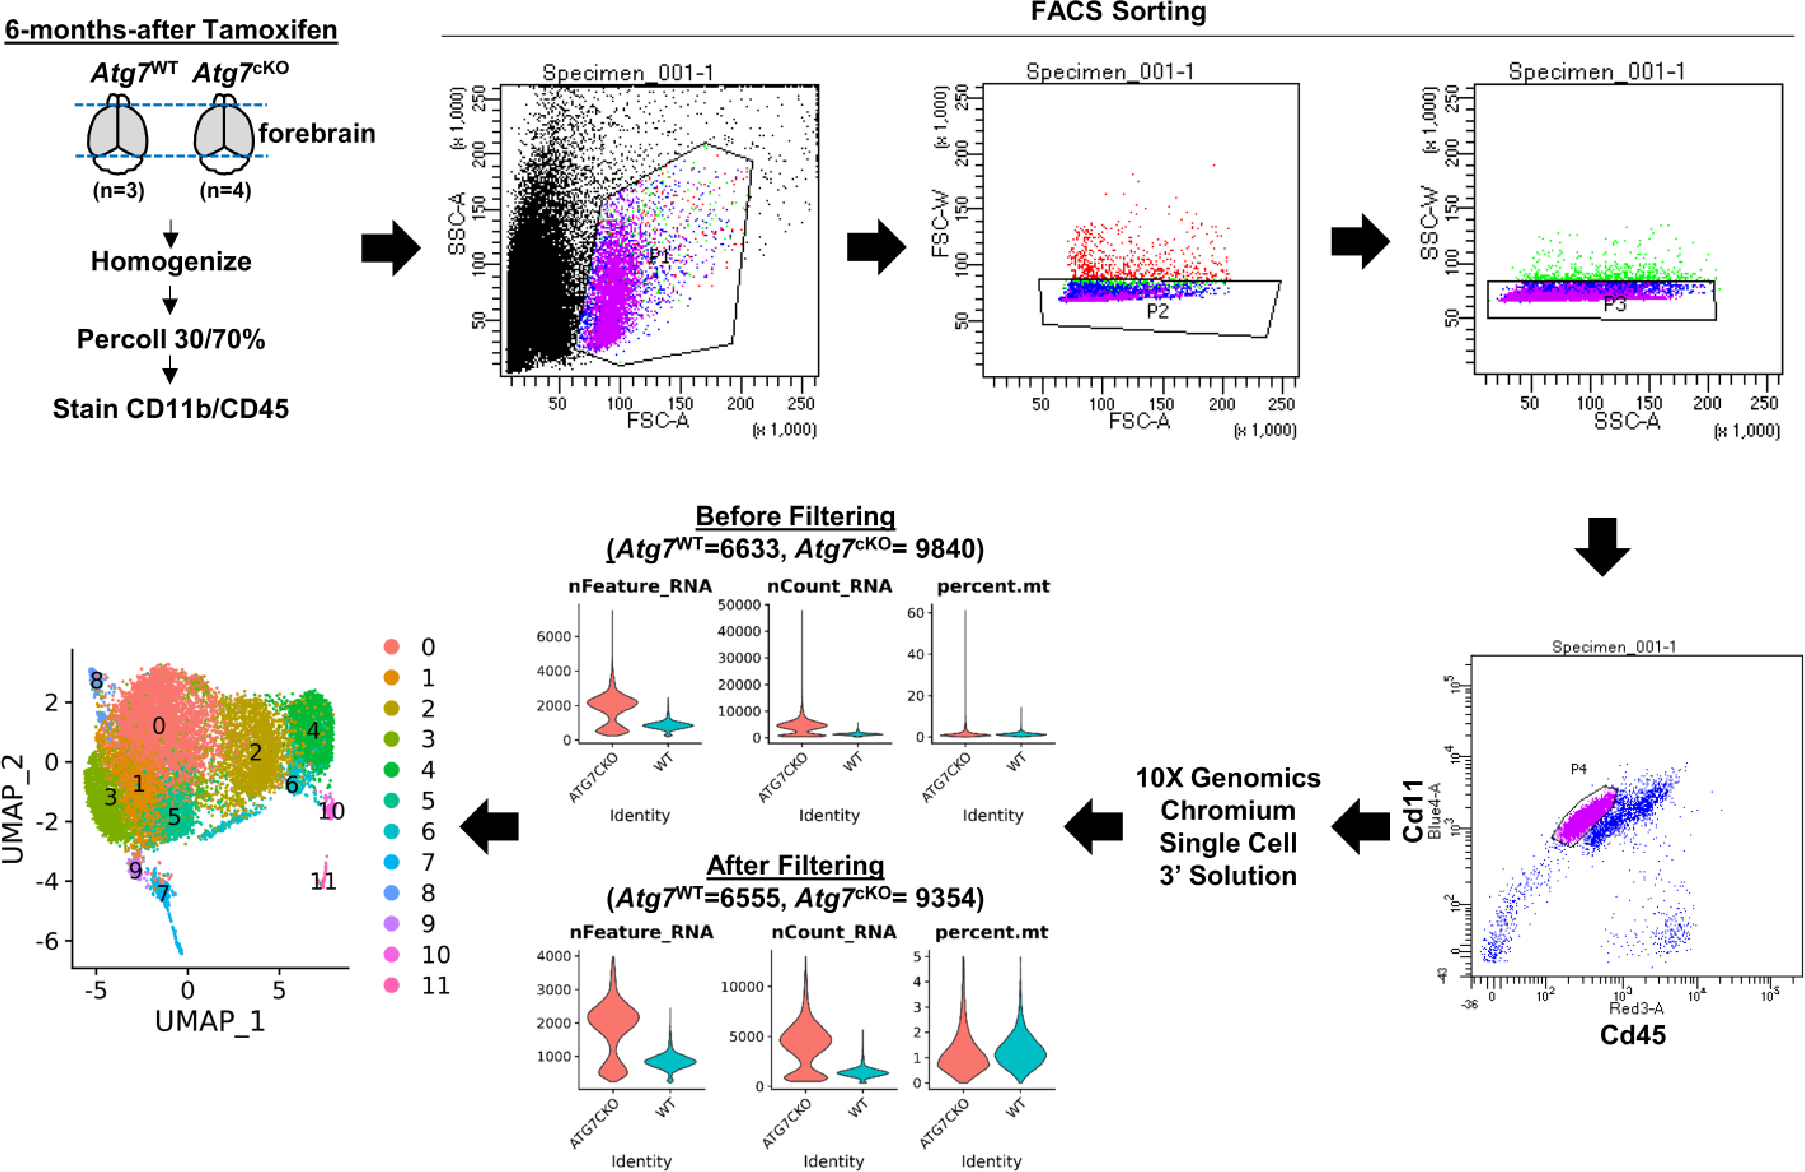
CD11b+/CD45Low microglia were collected and processed for single-cell RNA sequencing through the 10X Genomics pipeline. The detailed process is described in the Method.
Extended Data Fig. 6 |. Representative cluster marker genes.
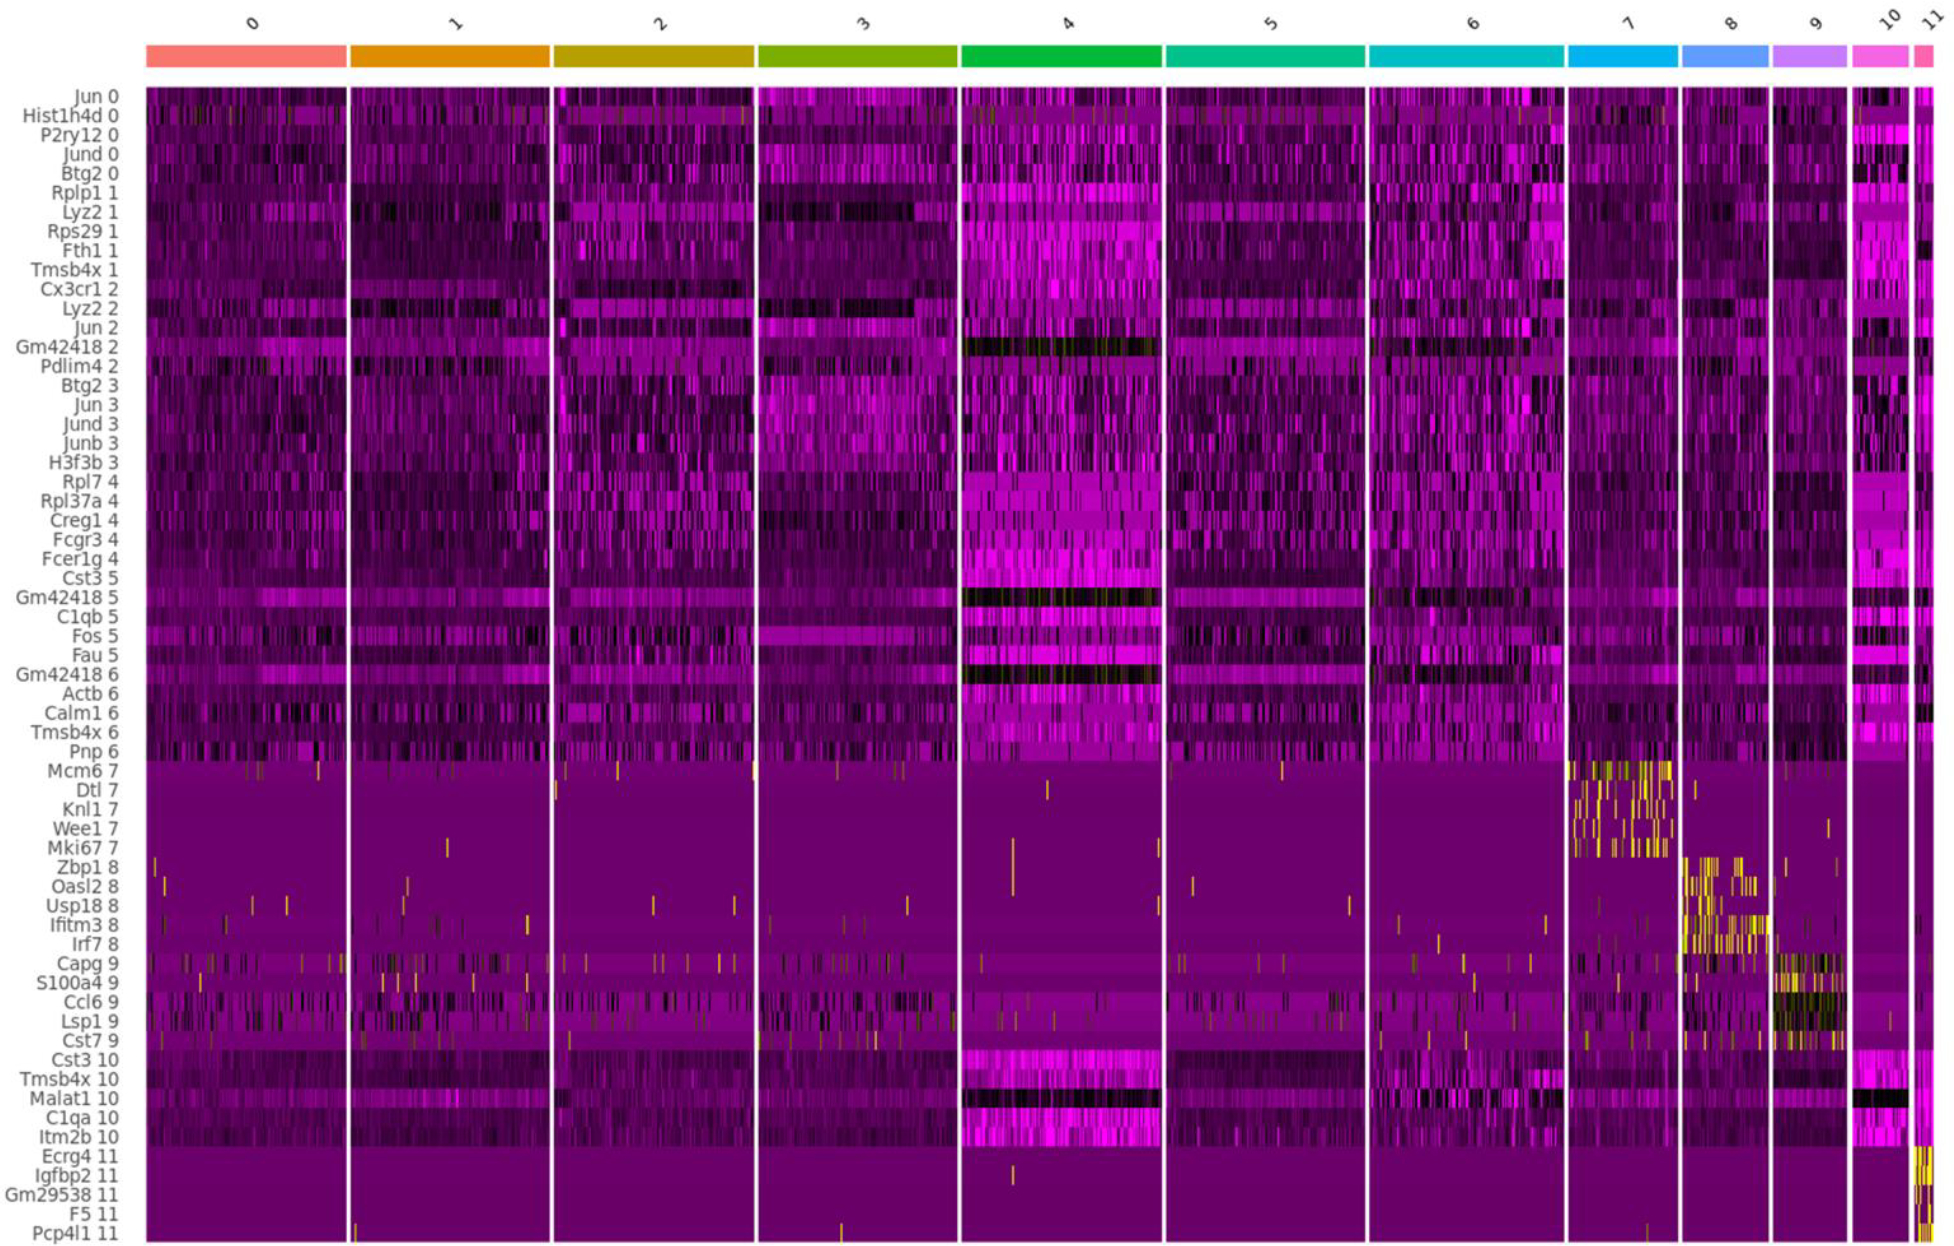
Marker genes from each cluster were shown.
Extended Data Fig. 7 |. Analysis of single-cell RNA sequencing.
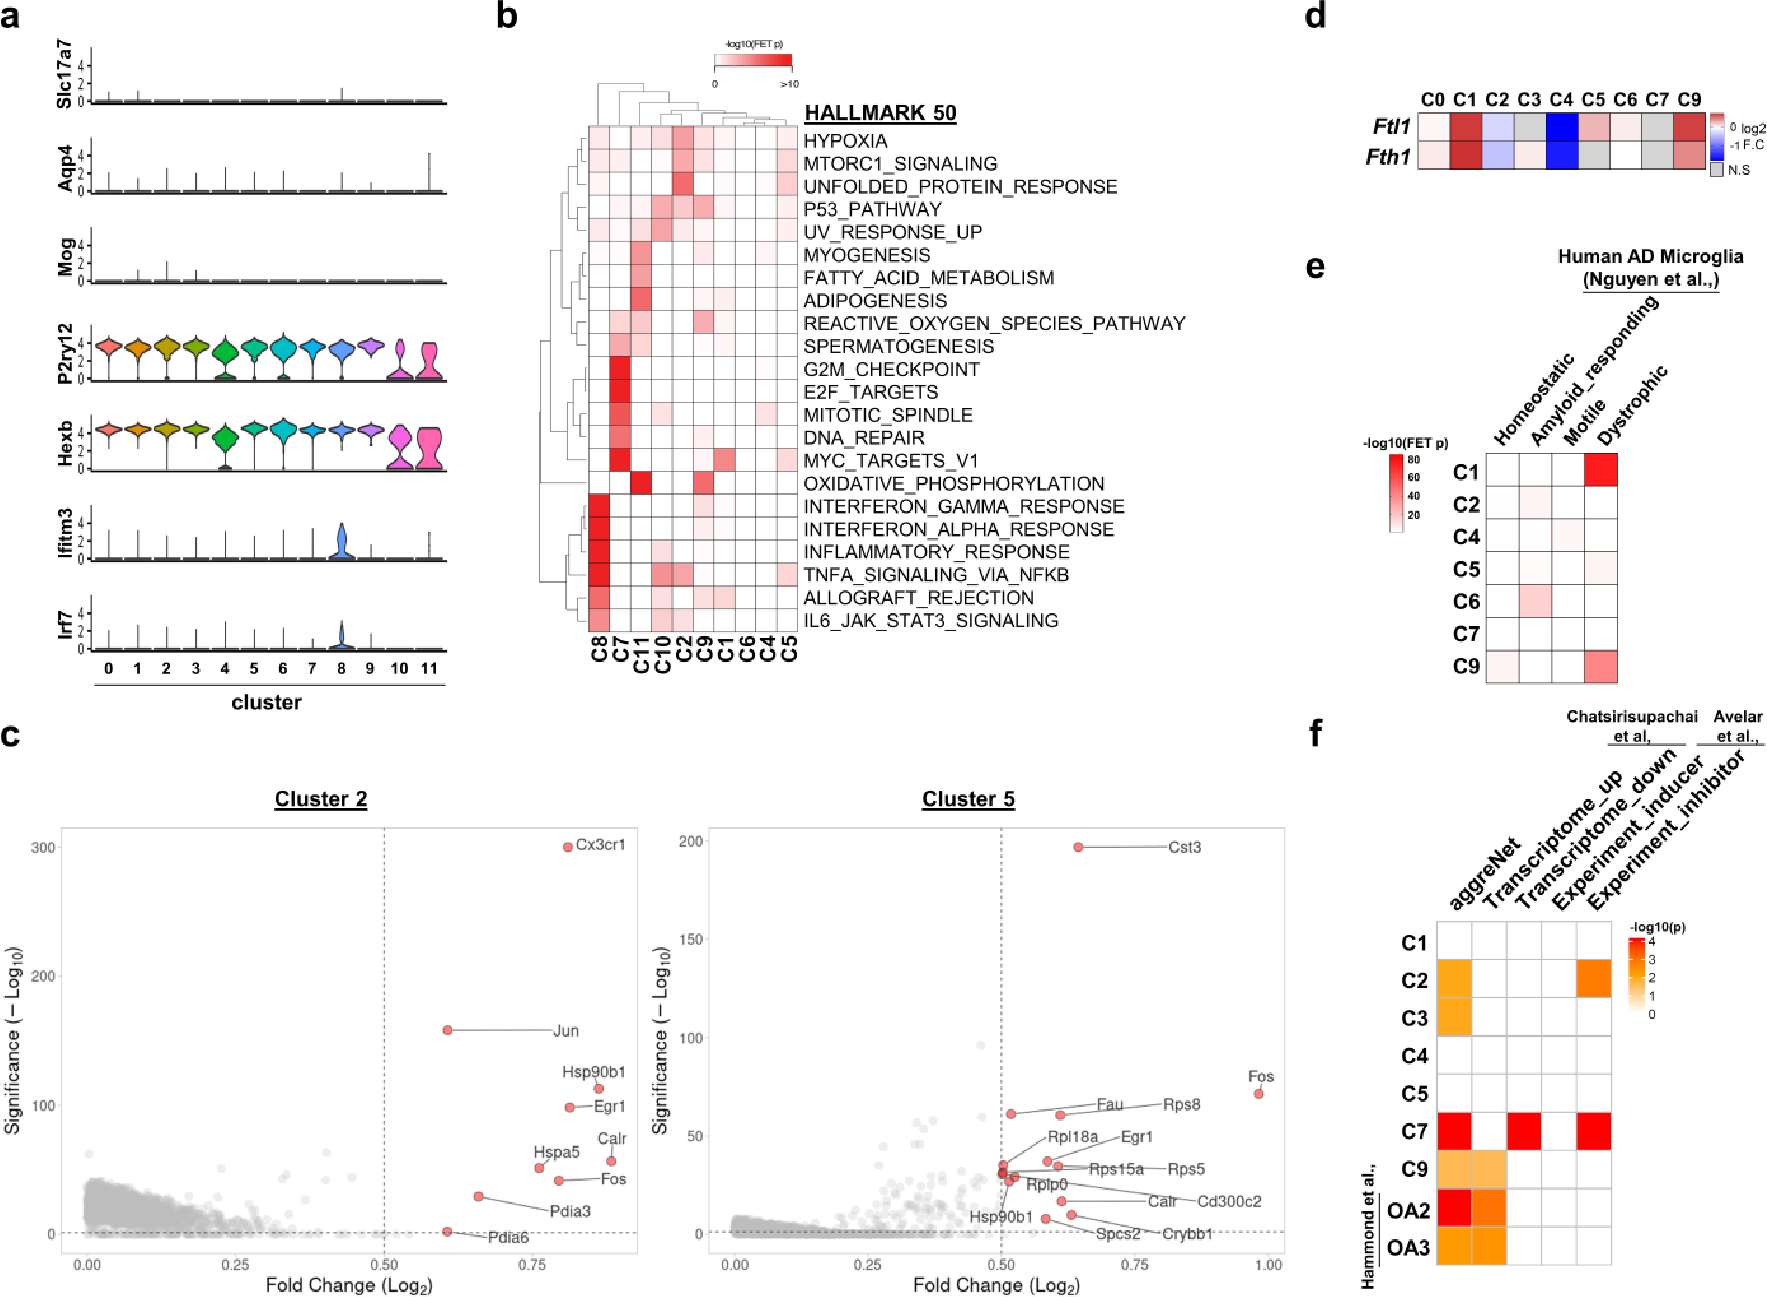
(a) Violin plot for well-known cell-specific markers including Slc17a7 (excitatory neurons), Aqp4 (astrocytes), Mog (oligodendrocytes), Flt1 (endothelial cells), P2ry12 (microglia) and Hexb (microglia), and Ifitm3 and Irf7 (border-associated macrophages). (b) Heatmap for gene set enrichment analysis using HALLMARK 50 database and upregulated genes (adjusted p-values < 0.05, Log2FC > 0.5) of each cluster. (c) Volcano plot for showing upregulated DEGs (adjusted p-values < 0.05, Log2FC > 0.5) of cluster 2 and 5. (d) Heatmap for the expression of Ftl1 and Fth1, markers for dystrophic microglia. (e) Heatmap for gene enrichment test between each cluster DEGs (adjusted p-values < 0.05, Log2FC > 0.5) and human AD microglia clusters. (f) Heatmap for mouse microglia clusters enriched for canonical senescence signatures. p-values (e, f) were calculated by one-sided Fisher’s exact test.
Extended Data Fig. 8 |. Examination of heterogenous microglial populations in Atg7cKO brain.
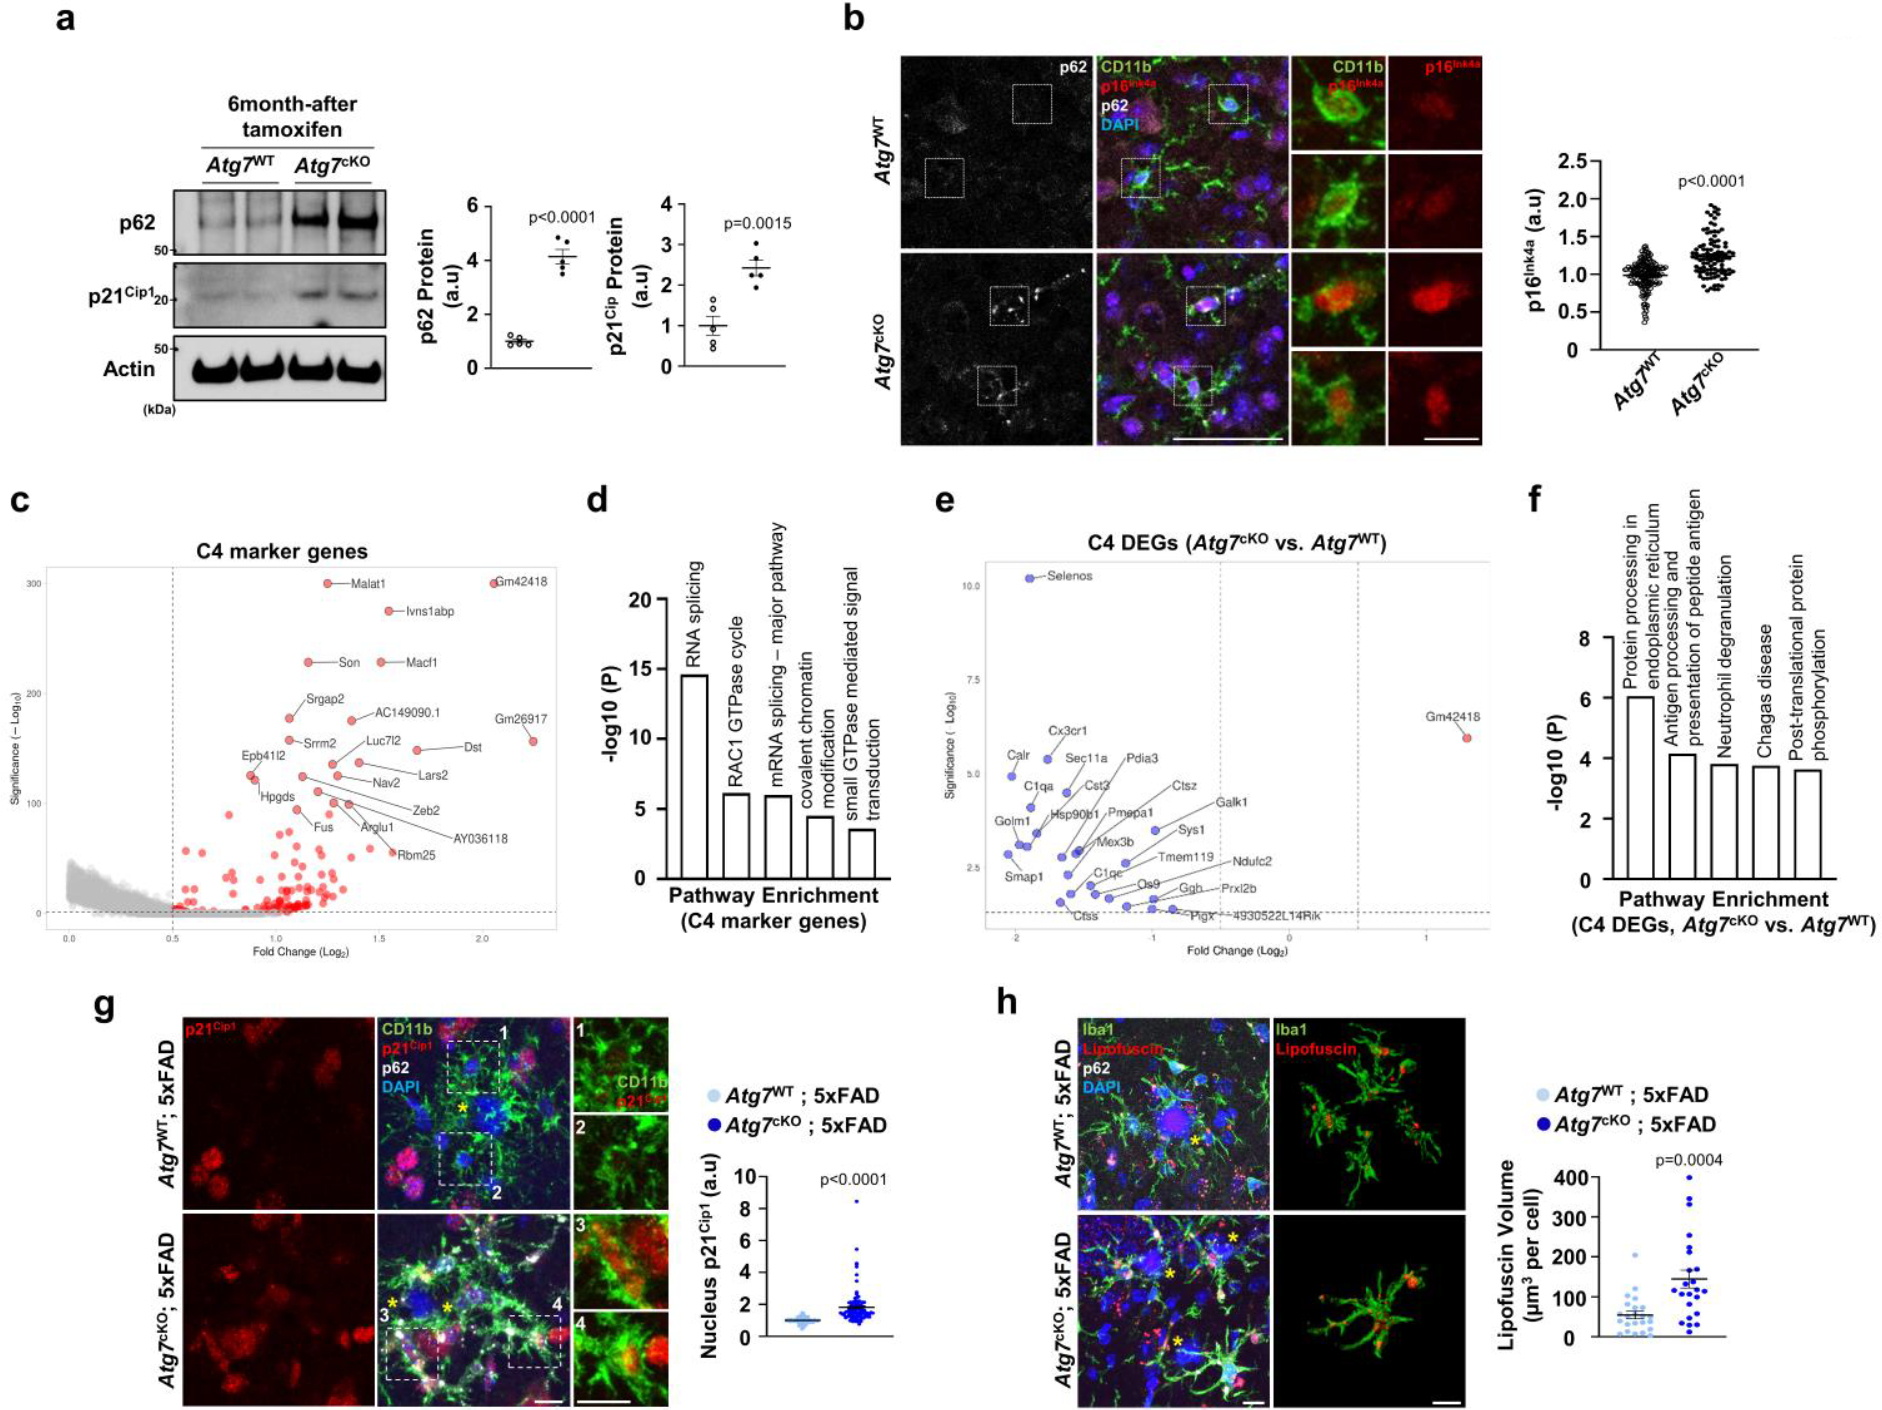
(a) Percoll-enriched fractions of microglia from Atg7cKO (2 male and 3 female mice) and Atg7WT (2 male and 3 female mice) mice brains were processed for Western blot using antibodies against p62 and p21Cip1. Actin was used as a loading control. p < 0.0001 for p62; p = 0.0015 for p21Cip1. (b) The staining intensities of p16Ink4a (149 cells for Atg7WT, 97 cells for Atg7cKO) were determined by Imaris software (see method). 2 male and 2 female mice for each genotype. p < 0.0001. Scale bar, 50 μm; 10 μm for magnified images. (c) Volcano plot of upregulated genes of cluster 4 (C4 vs. other clusters; adjusted p-values < 0.05, Log2FC > 0.5). (d) GO term analysis for upregulated genes of cluster 4. (e) Volcano plot of DEGs of cluster 4 (Atg7cKO vs. Atg7WT; adjusted p-values < 0.05, Log2FC > 0.5 and <−0.5). (f) GO term analysis for downregulated DEGs in Atg7cKO compared to Atg7WT of cluster 4. (g) The staining intensity of p21Cip1 in nuclei of CD11b+ microglia was quantified from Atg7cKO; 5xFAD mice (2 male and 2 female mice, 96 cells) and Atg7WT; 5xFAD mice (2 male and 2 female mice, 111 cells). p < 0.0001. Scale bar, 10 μm. (h) The volumes of Lipofuscin were measured from Atg7cKO; 5xFAD mice (2 male and 1 female mice, 50 cells) and Atg7WT; 5xFAD mice (2 male and 1 female mice, 25cells) were analysed. Yellow asterisks (g, h) indicate DAPI-stained amyloid plaques. p < 0.0001. Scale bar, 10 μm. p-values were calculated by unpaired two-tailed Student’s t-test (a), two-tailed Mann-Whitney U test (b, g, h), or Wilcox rank-sum test (c, e). p-values (d, f) were provided by Metascape (default setting, see method). All values are reported as mean ± SEM. Source numerical data and unprocessed blots are available in source data.
Extended Data Fig. 9 |. Additional cellular senescence phenotypes in Atg7cKO microglia.
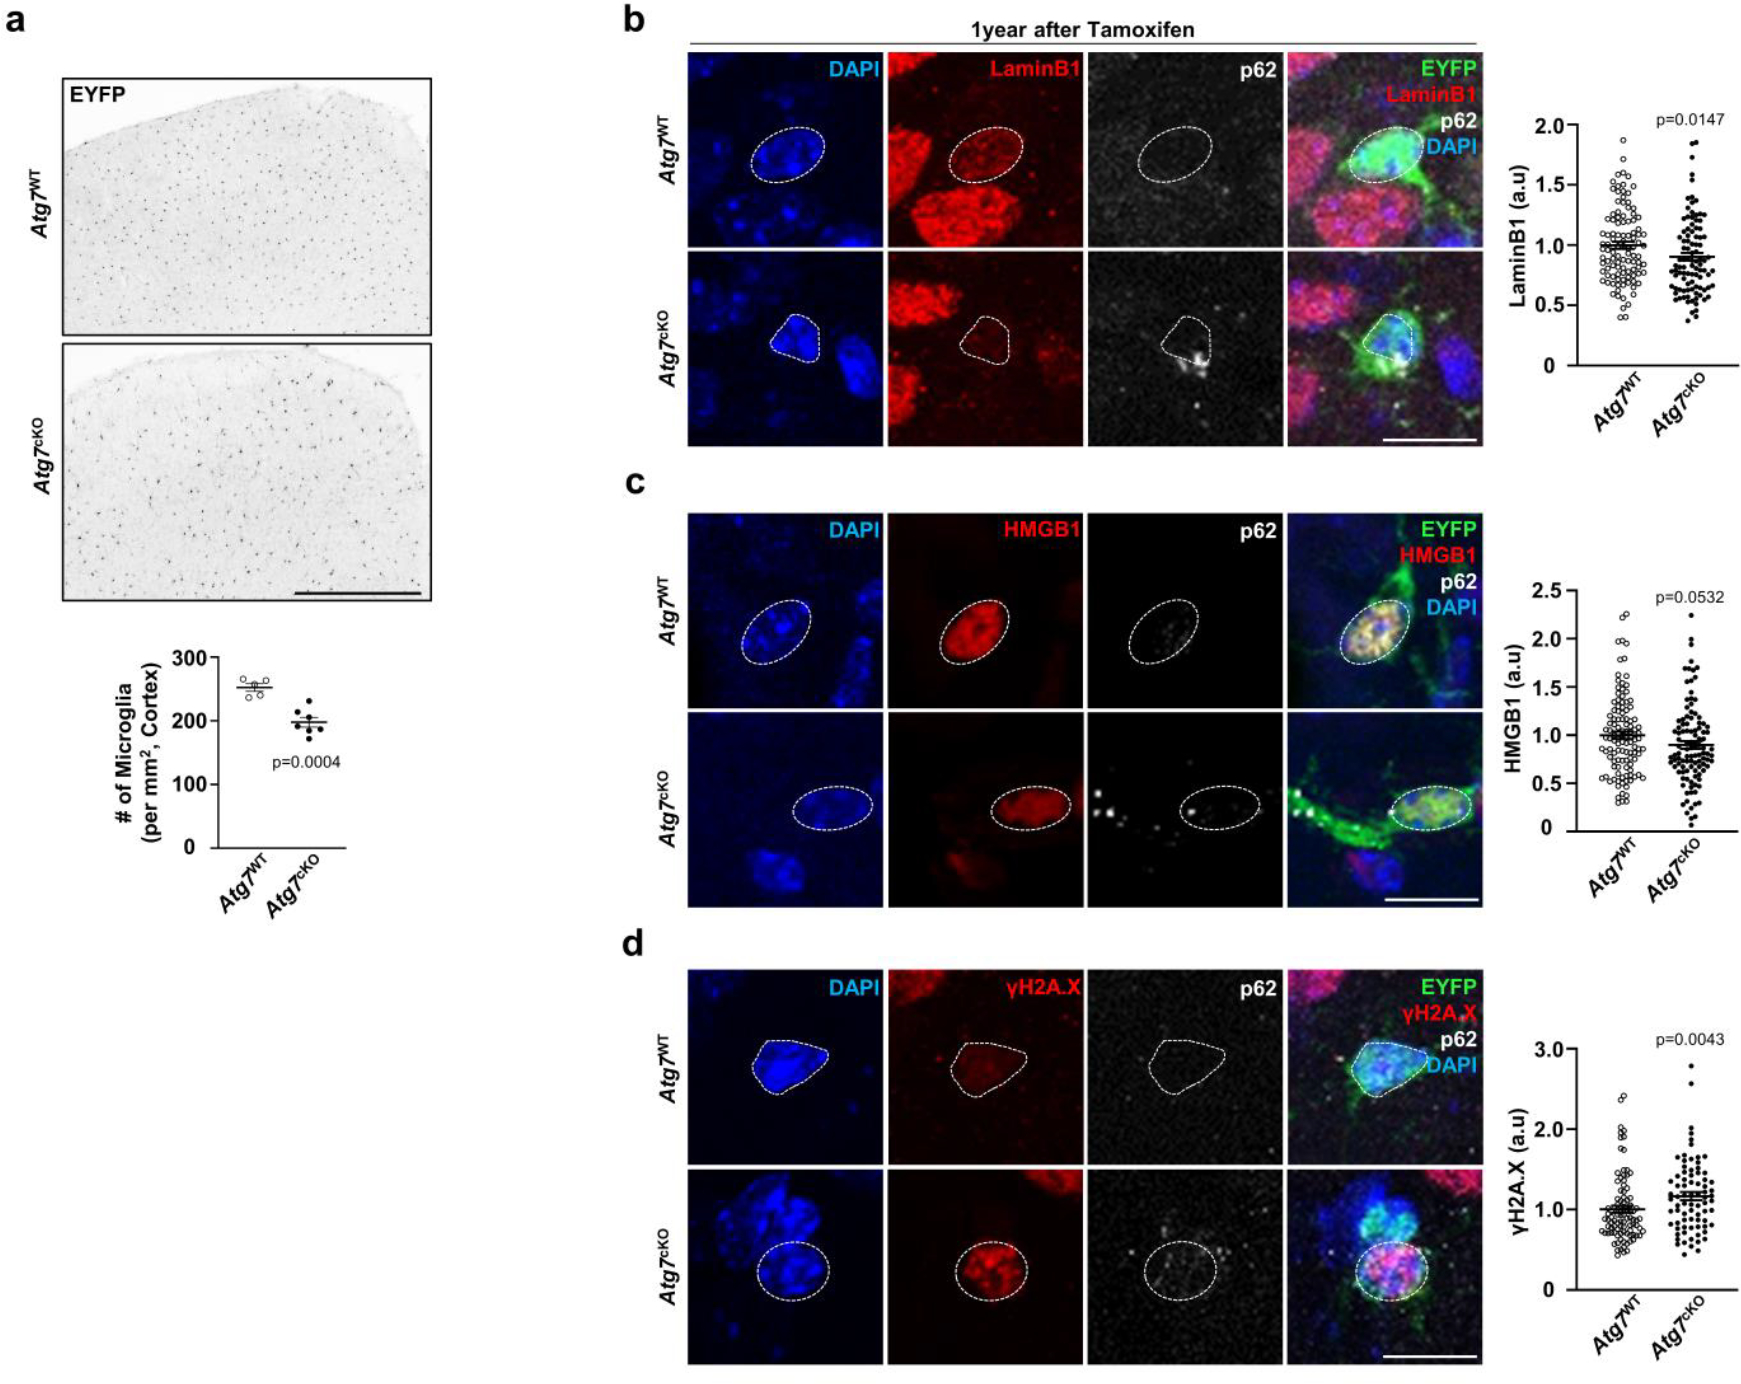
(a) At 1-year post-tamoxifen or corn-oil injection, the number of EYFP+ microglia was quantified from Atg7cKO (tamoxifen, 3 male and 4 female mice, Cx3cr1CreER; Atg7f/f) and Atg7WT (corn-oil, 2 male and 3 female mice, Cx3cr1CreER; Atg7f/f) brain slices. The number of microglia was quantified. p = 0.0004. Scale bar, 500 μm. (b-d) The staining intensities of LaminB1 (b, 106 cells for Atg7WT, 97 cells for Atg7cKO), HMGB1 (c, 113 cells for Atg7WT, 108 cells for Atg7cKO), and γH2A.X (d, 95 cells for Atg7WT, 78 cells for Atg7cKO) were measured in microglia using Imaris software (see method). p = 0.0147 for LaminB1; p = 0.0532 for HMGB1; p = 0.0043 for γH2A.X. Scale bar, 10 μm. p-values were calculated by unpaired two-tailed Student’s t-test (a) or two-tailed Mann-Whitney U test (b, c, d). All values are reported as mean ± SEM. Source numerical data are available in source data.
Extended Data Fig. 10 |. The effect of senolytic drug treatment in 5xFAD mice.
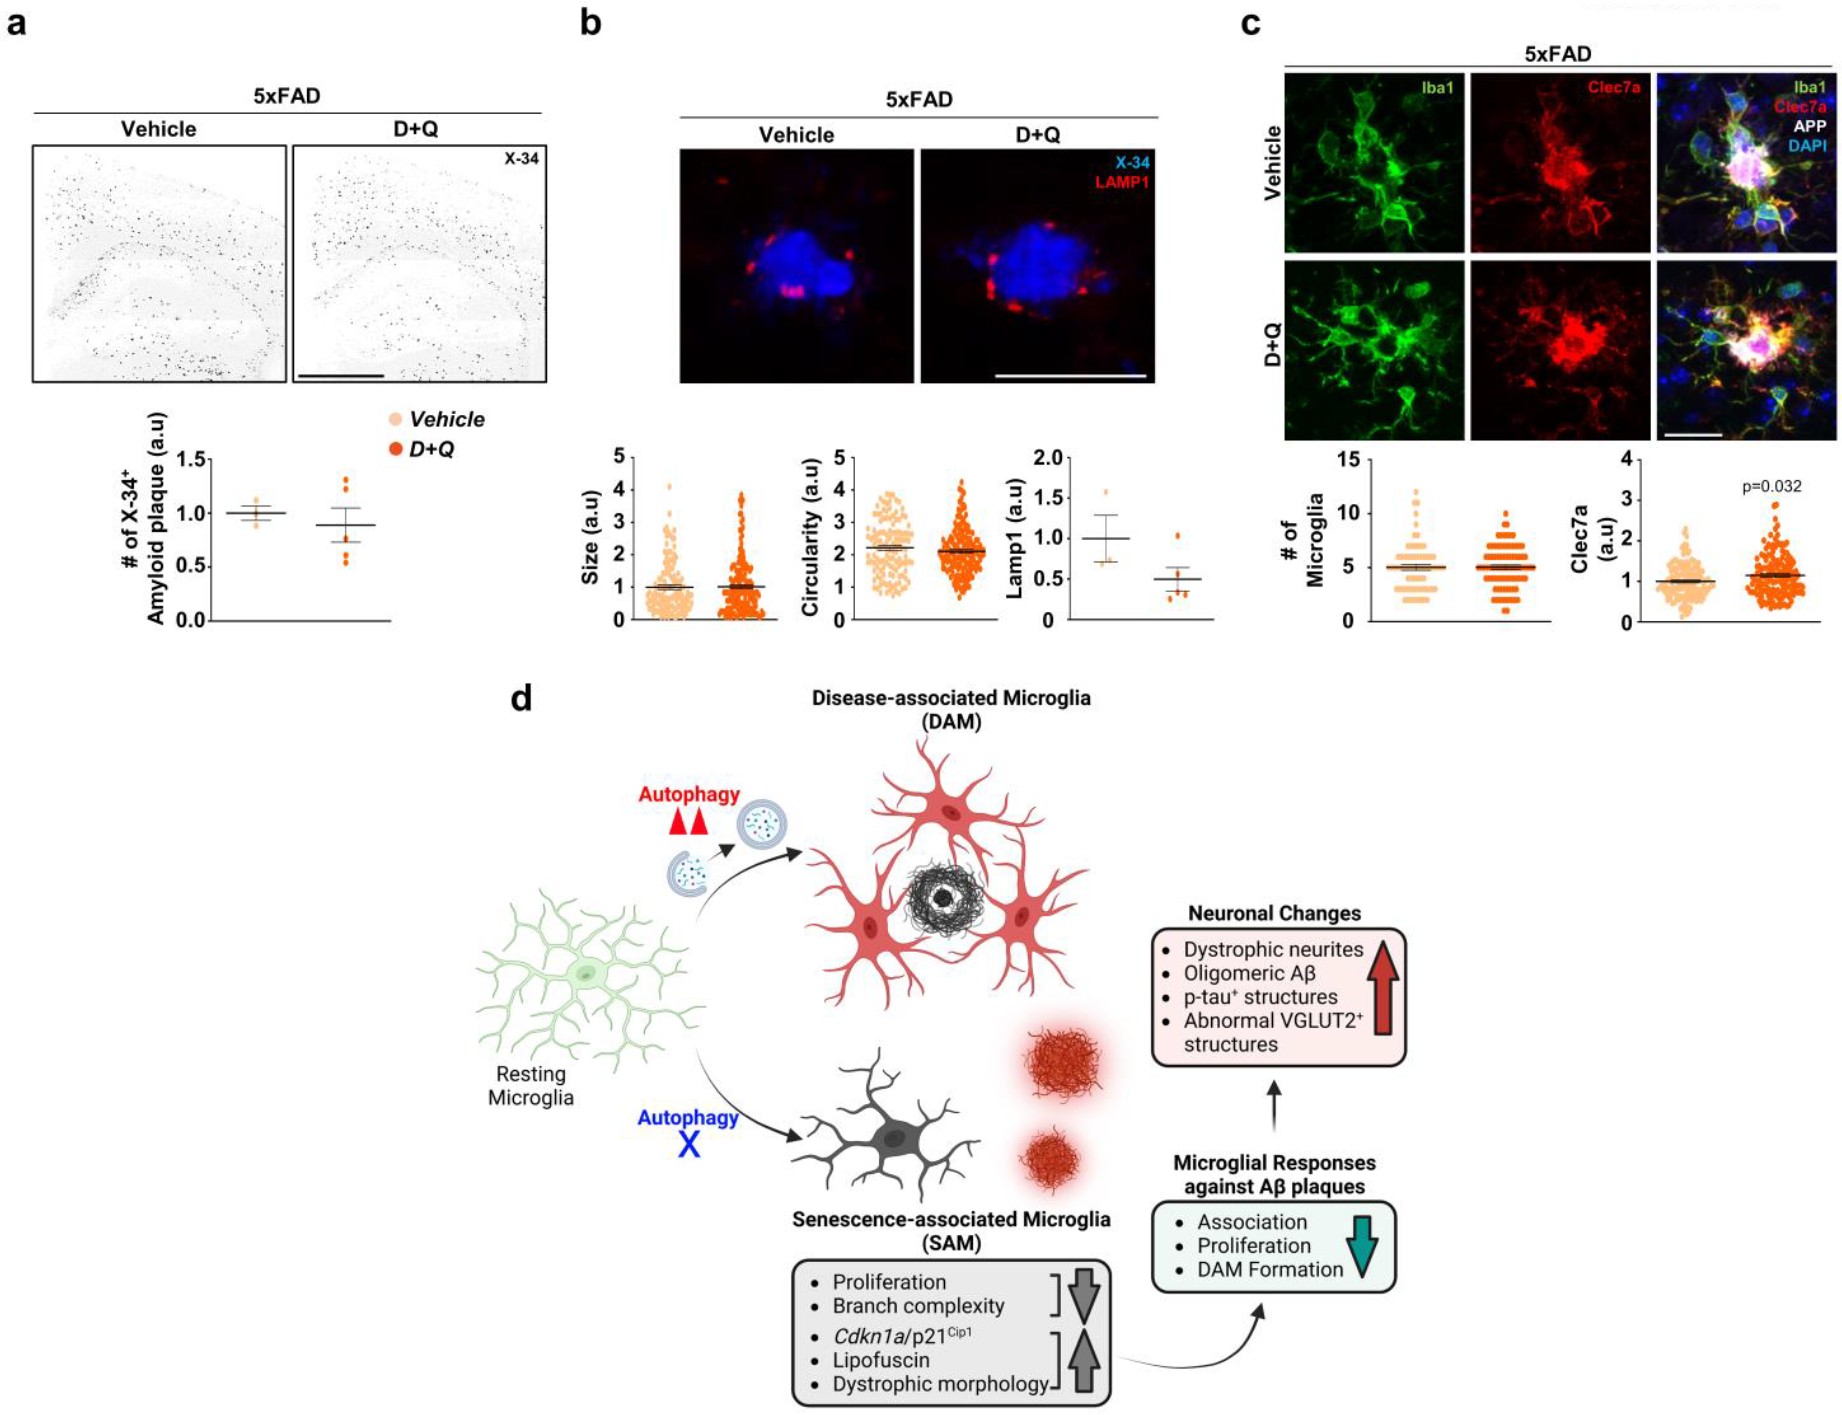
(a) Following chronic D + Q (5 female, once a week, 11-weeks) or vehicle treatment (3 female) of 5xFAD mice, the number of X-34+ amyloid plaques was quantified from the vehicle or D + Q-treated mice. Scale bar, 1 mm. (b) The size, circularities, and the number of Lamp1+ dystrophic neurites were quantified from mice treated with either vehicle (128 plaques) or D + Q (169 plaques). Scale bar, 20 μm. (c) The number of Iba-1+ microglia around amyloid plaques (15 μm radius of amyloid plaques) from 5xFAD mice treated with either vehicle (70 plaques) or D + Q (87 plaques) and the staining intensity of Clec7a in microglia from 5xFAD mice treated with either vehicle (139 plaques) or D + Q (149 plaques) were measured. p = 0.0032 for Clec7a. p-values were calculated by two-tailed Mann-Whitney U test. Scale bar, 20 μm. (d) A proposed model for roles of autophagy-deficient senescent microglia in AD pathophysiology. Source numerical data are available in source data.
Supplementary Material
Acknowledgements
This work was supported by R01AG072520 (Z.Y.), U01AG046170 and R01AG057907 (B.Z.), RF1AG068581 (J.P.) and a Research Education Component (I.C.) of Alzheimer’s Disease Research Center (P30AG066514) of NIH. We thank the assistance of members in the core facilities for Flow Cytometry, Microscopy and Genomics at the Icahn School of Medicine at Mount Sinai. We thank G. Heaton for critical reading and editing.
Footnotes
Competing interests
S.Y. is an employee of Sema4, a for-profit organization that promotes personalized patient care through information-driven insights. All other authors declare no competing interests.
Reporting summary
Further information on research design is available in the Nature Portfolio Reporting Summary linked to this article.
Code availability
All custom code used for analysis in this paper is available from the corresponding author upon request.
Additional information
Extended data is available for this paper at https://doi.org/10.1038/s41556-023-01158-0.
Supplementary information The online version contains supplementary material available at https://doi.org/10.1038/s41556-023-01158-0.
Peer review information Nature Cell Biology thanks Hui Zheng, Li Gan and the other, anonymous, reviewer(s) for their contribution to the peer review of this work.
Reprints and permissions information is available at www.nature.com/reprints.
Data availability
The RNA sequencing data used in this publication have been deposited in NCBI’s Gene Expression Omnibus74 and are accessible through GEO Series accession number GSE192964. The proteomics data have been deposited in PRIDE (https://proteomecentral.proteomexchange.org/cgi/GetDataset?ID=PXD041588). Source data are provided with this paper. All other data supporting the findings of this study are available from the corresponding author on reasonable request.
References
- 1.Yamamoto A & Yue Z Autophagy and its normal and pathogenic states in the brain. Annu. Rev. Neurosci. 37, 55–78 (2014). [DOI] [PubMed] [Google Scholar]
- 2.Van Acker ZP, Bretou M & Annaert W Endo-lysosomal dysregulations and late-onset Alzheimer’s disease: impact of genetic risk factors. Mol. Neurodegener. 14, 20 (2019). [DOI] [PMC free article] [PubMed] [Google Scholar]
- 3.Pickford F et al. The autophagy-related protein beclin 1 shows reduced expression in early Alzheimer disease and regulates amyloid β accumulation in mice. J. Clin. Invest. 118, 2190–2199 (2008). [DOI] [PMC free article] [PubMed] [Google Scholar]
- 4.Lachance V et al. Autophagy protein NRBF2 has reduced expression in Alzheimer’s brains and modulates memory and amyloid-β homeostasis in mice. Mol. Neurodegener. 14, 43 (2019). [DOI] [PMC free article] [PubMed] [Google Scholar]
- 5.Nixon RA et al. Extensive involvement of autophagy in Alzheimer disease: an immuno-electron microscopy study. J. Neuropathol. Exp. Neurol. 64, 113–122 (2005). [DOI] [PubMed] [Google Scholar]
- 6.Lee JH et al. Faulty autolysosome acidification in Alzheimer’s disease mouse models induces autophagic build-up of Aβ in neurons, yielding senile plaques. Nat. Neurosci. 25, 688–701 (2022). [DOI] [PMC free article] [PubMed] [Google Scholar]
- 7.Tammineni P, Ye X, Feng T, Aikal D & Cai Q Impaired retrograde transport of axonal autophagosomes contributes to autophagic stress in Alzheimer’s disease neurons. eLife 6, e21776 (2017). [DOI] [PMC free article] [PubMed] [Google Scholar]
- 8.Xu Y, Propson NE, Du S, Xiong W & Zheng H Autophagy deficiency modulates microglial lipid homeostasis and aggravates tau pathology and spreading. Proc. Natl Acad. Sci. USA 118, e2023418118 (2021). [DOI] [PMC free article] [PubMed] [Google Scholar]
- 9.Choi I et al. Microglia clear neuron-released alpha-synuclein via selective autophagy and prevent neurodegeneration. Nat. Commun. 11, 1386 (2020). [DOI] [PMC free article] [PubMed] [Google Scholar]
- 10.Cho MH et al. Autophagy in microglia degrades extracellular beta-amyloid fibrils and regulates the NLRP3 inflammasome. Autophagy 10, 1761–1775 (2014). [DOI] [PMC free article] [PubMed] [Google Scholar]
- 11.Ulland TK et al. TREM2 maintains microglial metabolic fitness in Alzheimer’s disease. Cell 170, 649–663 (2017). [DOI] [PMC free article] [PubMed] [Google Scholar]
- 12.Heckmann BL et al. LC3-associated endocytosis facilitates beta-amyloid clearance and mitigates neurodegeneration in murine alzheimer’s disease. Cell 178, 536–551 (2019). [DOI] [PMC free article] [PubMed] [Google Scholar]
- 13.Berglund R et al. Microglial autophagy-associated phagocytosis is essential for recovery from neuroinflammation. Sci. Immunol. 5, eabb5077 (2020). [DOI] [PubMed] [Google Scholar]
- 14.Srinivasan K et al. Alzheimer’s patient microglia exhibit enhanced aging and unique transcriptional activation. Cell Rep. 31, 107843 (2020). [DOI] [PMC free article] [PubMed] [Google Scholar]
- 15.Olah M et al. Single cell RNA sequencing of human microglia uncovers a subset associated with Alzheimer’s disease. Nat. Commun. 11, 6129 (2020). [DOI] [PMC free article] [PubMed] [Google Scholar]
- 16.Gerrits E et al. Distinct amyloid-beta and tau-associated microglia profiles in Alzheimer’s disease. Acta Neuropathol. 141, 681–696 (2021). [DOI] [PMC free article] [PubMed] [Google Scholar]
- 17.Nguyen AT et al. APOE and TREM2 regulate amyloid-responsive microglia in Alzheimer’s disease. Acta Neuropathol. 140, 477–493 (2020). [DOI] [PMC free article] [PubMed] [Google Scholar]
- 18.Sobue A et al. Microglial gene signature reveals loss of homeostatic microglia associated with neurodegeneration of Alzheimer’s disease. Acta Neuropathol. Commun. 9, 1 (2021). [DOI] [PMC free article] [PubMed] [Google Scholar]
- 19.Krasemann S et al. The TREM2-APOE pathway drives the transcriptional phenotype of dysfunctional microglia in neurodegenerative diseases. Immunity 47, 566–581 (2017). [DOI] [PMC free article] [PubMed] [Google Scholar]
- 20.Keren-Shaul H et al. A Unique microglia type associated with restricting development of alzheimer’s disease. Cell 169, 1276–1290 (2017). [DOI] [PubMed] [Google Scholar]
- 21.Oakley H et al. Intraneuronal beta-amyloid aggregates, neurodegeneration, and neuron loss in transgenic mice with five familial Alzheimer’s disease mutations: potential factors in amyloid plaque formation. J. Neurosci. 26, 10129–10140 (2006). [DOI] [PMC free article] [PubMed] [Google Scholar]
- 22.Kim J, Kundu M, Viollet B & Guan KL AMPK and mTOR regulate autophagy through direct phosphorylation of Ulk1. Nat. Cell Biol. 13, 132–141 (2011). [DOI] [PMC free article] [PubMed] [Google Scholar]
- 23.Mizushima N, Yamamoto A, Matsui M, Yoshimori T & Ohsumi Y In vivo analysis of autophagy in response to nutrient starvation using transgenic mice expressing a fluorescent autophagosome marker. Mol. Biol. Cell 15, 1101–1111 (2004). [DOI] [PMC free article] [PubMed] [Google Scholar]
- 24.Mizushima N et al. A protein conjugation system essential for autophagy. Nature 395, 395–398 (1998). [DOI] [PubMed] [Google Scholar]
- 25.Yuan P et al. TREM2 haplodeficiency in mice and humans impairs the microglia barrier function leading to decreased amyloid compaction and severe axonal dystrophy. Neuron 90, 724–739 (2016). [DOI] [PMC free article] [PubMed] [Google Scholar]
- 26.Spangenberg E et al. Sustained microglial depletion with CSF1R inhibitor impairs parenchymal plaque development in an Alzheimer’s disease model. Nat. Commun. 10, 3758 (2019). [DOI] [PMC free article] [PubMed] [Google Scholar]
- 27.Shankar GM et al. Amyloid-β protein dimers isolated directly from Alzheimer’s brains impair synaptic plasticity and memory. Nat. Med. 14, 837–842 (2008). [DOI] [PMC free article] [PubMed] [Google Scholar]
- 28.Wang Y et al. TREM2-mediated early microglial response limits diffusion and toxicity of amyloid plaques. J. Exp. Med. 213, 667–675 (2016). [DOI] [PMC free article] [PubMed] [Google Scholar]
- 29.Van Hove H et al. A single-cell atlas of mouse brain macrophages reveals unique transcriptional identities shaped by ontogeny and tissue environment. Nat. Neurosci. 22, 1021–1035 (2019). [DOI] [PubMed] [Google Scholar]
- 30.Liberzon A et al. The molecular signatures database (MSigDB) hallmark gene set collection. Cell Syst. 1, 417–425 (2015). [DOI] [PMC free article] [PubMed] [Google Scholar]
- 31.Hammond TR et al. Single-cell RNA sequencing of microglia throughout the mouse lifespan and in the injured brain reveals complex cell-state changes. Immunity 50, 253–271 (2019). [DOI] [PMC free article] [PubMed] [Google Scholar]
- 32.Olah M et al. A transcriptomic atlas of aged human microglia. Nat. Commun. 9, 539 (2018). [DOI] [PMC free article] [PubMed] [Google Scholar]
- 33.Sankowski R et al. Mapping microglia states in the human brain through the integration of high-dimensional techniques. Nat. Neurosci. 22, 2098–2110 (2019). [DOI] [PubMed] [Google Scholar]
- 34.Shahidehpour RK et al. Dystrophic microglia are associated with neurodegenerative disease and not healthy aging in the human brain. Neurobiol. Aging 99, 19–27 (2021). [DOI] [PMC free article] [PubMed] [Google Scholar]
- 35.Xu P et al. The landscape of human tissue and cell type specific expression and co-regulation of senescence genes. Mol. Neurodegener. 17, 5 (2022). [DOI] [PMC free article] [PubMed] [Google Scholar]
- 36.Chatsirisupachai K, Palmer D, Ferreira S & de Magalhaes JP A human tissue-specific transcriptomic analysis reveals a complex relationship between aging, cancer, and cellular senescence. Aging Cell 18, e13041 (2019). [DOI] [PMC free article] [PubMed] [Google Scholar]
- 37.Avelar RA et al. A multidimensional systems biology analysis of cellular senescence in aging and disease. Genome Biol. 21, 91 (2020). [DOI] [PMC free article] [PubMed] [Google Scholar]
- 38.Fuger P et al. Microglia turnover with aging and in an Alzheimer’s model via long-term in vivo single-cell imaging. Nat. Neurosci. 20, 1371–1376 (2017). [DOI] [PubMed] [Google Scholar]
- 39.Bertolo A, Baur M, Guerrero J, Potzel T & Stoyanov J Autofluorescence is a reliable in vitro marker of cellular senescence in human mesenchymal stromal cells. Sci. Rep. 9, 2074 (2019). [DOI] [PMC free article] [PubMed] [Google Scholar]
- 40.Streit WJ, Xue QS, Tischer J & Bechmann I Microglial pathology. Acta Neuropathol. Commun. 2, 142 (2014). [DOI] [PMC free article] [PubMed] [Google Scholar]
- 41.Zhang P et al. Senolytic therapy alleviates Aβ-associated oligodendrocyte progenitor cell senescence and cognitive deficits in an Alzheimer’s disease model. Nat. Neurosci. 22, 719–728 (2019). [DOI] [PMC free article] [PubMed] [Google Scholar]
- 42.Bjorkoy G et al. p62/SQSTM1 forms protein aggregates degraded by autophagy and has a protective effect on huntingtin-induced cell death. J. Cell Biol. 171, 603–614 (2005). [DOI] [PMC free article] [PubMed] [Google Scholar]
- 43.Pankiv S et al. p62/SQSTM1 binds directly to Atg8/LC3 to facilitate degradation of ubiquitinated protein aggregates by autophagy. J. Biol. Chem. 282, 24131–24145 (2007). [DOI] [PubMed] [Google Scholar]
- 44.Itakura E, Kishi C, Inoue K & Mizushima N Beclin 1 forms two distinct phosphatidylinositol 3-kinase complexes with mammalian Atg14 and UVRAG. Mol. Biol. Cell 19, 5360–5372 (2008). [DOI] [PMC free article] [PubMed] [Google Scholar]
- 45.Zhong Y et al. Distinct regulation of autophagic activity by Atg14L and Rubicon associated with Beclin 1-phosphatidylinositol-3-kinase complex. Nat. Cell Biol. 11, 468–476 (2009). [DOI] [PMC free article] [PubMed] [Google Scholar]
- 46.Basisty N et al. A proteomic atlas of senescence-associated secretomes for aging biomarker development. PLoS Biol. 18, e3000599 (2020). [DOI] [PMC free article] [PubMed] [Google Scholar]
- 47.Bai B et al. Proteomic landscape of Alzheimer’s disease: novel insights into pathogenesis and biomarker discovery. Mol. Neurodegener. 16, 55 (2021). [DOI] [PMC free article] [PubMed] [Google Scholar]
- 48.Aman Y et al. Autophagy in healthy aging and disease. Nat. Aging 1, 634–650 (2021). [DOI] [PMC free article] [PubMed] [Google Scholar]
- 49.Gao S, Casey AE, Sargeant TJ & Makinen VP Genetic variation within endolysosomal system is associated with late-onset Alzheimer’s disease. Brain 141, 2711–2720 (2018). [DOI] [PubMed] [Google Scholar]
- 50.Chen H et al. A review of APOE genotype-dependent autophagic flux regulation in alzheimer’s disease. J. Alzheimers Dis. 84, 535–555 (2021). [DOI] [PubMed] [Google Scholar]
- 51.Bussian TJ et al. Clearance of senescent glial cells prevents tau-dependent pathology and cognitive decline. Nature 562, 578–582 (2018). [DOI] [PMC free article] [PubMed] [Google Scholar]
- 52.Saez-Atienzar S & Masliah E Cellular senescence and Alzheimer disease: the egg and the chicken scenario. Nat. Rev. Neurosci. 21, 433–444 (2020). [DOI] [PMC free article] [PubMed] [Google Scholar]
- 53.Kenkhuis B et al. Iron loading is a prominent feature of activated microglia in Alzheimer’s disease patients. Acta Neuropathol. Commun. 9, 27 (2021). [DOI] [PMC free article] [PubMed] [Google Scholar]
- 54.Streit WJ, Braak H, Xue QS & Bechmann I Dystrophic (senescent) rather than activated microglial cells are associated with tau pathology and likely precede neurodegeneration in Alzheimer’s disease. Acta Neuropathol. 118, 475–485 (2009). [DOI] [PMC free article] [PubMed] [Google Scholar]
- 55.Xu C et al. SIRT1 is downregulated by autophagy in senescence and ageing. Nat. Cell Biol. 22, 1170–1179 (2020). [DOI] [PMC free article] [PubMed] [Google Scholar]
- 56.Dou Z et al. Autophagy mediates degradation of nuclear lamina. Nature 527, 105–109 (2015). [DOI] [PMC free article] [PubMed] [Google Scholar]
- 57.Garcia-Prat L et al. Autophagy maintains stemness by preventing senescence. Nature 529, 37–42 (2016). [DOI] [PubMed] [Google Scholar]
- 58.Kang HT, Lee KB, Kim SY, Choi HR & Park SC Autophagy impairment induces premature senescence in primary human fibroblasts. PLoS ONE 6, e23367 (2011). [DOI] [PMC free article] [PubMed] [Google Scholar]
- 59.Martinez J et al. Molecular characterization of LC3-associated phagocytosis reveals distinct roles for Rubicon, NOX2 and autophagy proteins. Nat. Cell Biol. 17, 893–906 (2015). [DOI] [PMC free article] [PubMed] [Google Scholar] [Retracted]
- 60.Gonzales MM et al. Senolytic therapy to modulate the progression of Alzheimer’s disease (SToMP-AD): a pilot clinical trial. J. Prev. Alzheimers Dis. 9, 22–29 (2022). [DOI] [PMC free article] [PubMed] [Google Scholar]
- 61.Hernandez-Silva D et al. Senescence-independent anti-inflammatory activity of the senolytic drugs dasatinib, navitoclax, and venetoclax in zebrafish models of chronic inflammation. Int. J. Mol. Sci. 23, 10468 (2022). [DOI] [PMC free article] [PubMed] [Google Scholar]
- 62.Khan A et al. Neuroprotective effect of quercetin against the detrimental effects of LPS in the adult mouse brain. Front. Pharm. 9, 1383 (2018). [DOI] [PMC free article] [PubMed] [Google Scholar]
- 63.Ryu KY et al. Dasatinib regulates LPS-induced microglial and astrocytic neuroinflammatory responses by inhibiting AKT/STAT3 signaling. J. Neuroinflamm. 16, 190 (2019). [DOI] [PMC free article] [PubMed] [Google Scholar]
References
- 64.Veremeyko T, Starossom SC, Weiner HL & Ponomarev ED Detection of microRNAs in microglia by real-time PCR in normal CNS and during neuroinflammation. J. Vis. Exp. 23, 4097 (2012). [DOI] [PMC free article] [PubMed] [Google Scholar]
- 65.Butovsky O et al. Identification of a unique TGF-beta-dependent molecular and functional signature in microglia. Nat. Neurosci. 17, 131–143 (2014). [DOI] [PMC free article] [PubMed] [Google Scholar]
- 66.Butler A, Hoffman P, Smibert P, Papalexi E & Satija R Integrating single-cell transcriptomic data across different conditions, technologies, and species. Nat. Biotechnol. 36, 411 (2018). [DOI] [PMC free article] [PubMed] [Google Scholar]
- 67.Mukherjee S et al. Molecular estimation of neurodegeneration pseudotime in older brains. Nat. Commun. 11, 5781 (2020). [DOI] [PMC free article] [PubMed] [Google Scholar]
- 68.Trapnell C et al. The dynamics and regulators of cell fate decisions are revealed by pseudotemporal ordering of single cells. Nat. Biotechnol. 32, 381–386 (2014). [DOI] [PMC free article] [PubMed] [Google Scholar]
- 69.Goedhart J & Luijsterburg MS VolcaNoseR is a web app for creating, exploring, labeling and sharing volcano plots. Sci. Rep. 10, 20560 (2020). [DOI] [PMC free article] [PubMed] [Google Scholar]
- 70.Kim D, Paggi JM, Park C, Bennett C & Salzberg SL Graph-based genome alignment and genotyping with HISAT2 and HISAT-genotype. Nat. Biotechnol. 37, 907–915 (2019). [DOI] [PMC free article] [PubMed] [Google Scholar]
- 71.Liao Y, Smyth GK & Shi W featureCounts: an efficient general purpose program for assigning sequence reads to genomic features. Bioinformatics 30, 923–930 (2014). [DOI] [PubMed] [Google Scholar]
- 72.Love MI, Huber W & Anders S Moderated estimation of fold change and dispersion for RNA-seq data with DESeq2. Genome Biol. 15, 550 (2014). [DOI] [PMC free article] [PubMed] [Google Scholar]
- 73.Pagala VR et al. Quantitative protein analysis by mass spectrometry. Methods Mol. Biol. 1278, 281–305 (2015). [DOI] [PubMed] [Google Scholar]
- 74.Edgar R, Domrachev M & Lash AE Gene Expression Omnibus: NCBI gene expression and hybridization array data repository. Nucleic Acids Res. 30, 207–210 (2002). [DOI] [PMC free article] [PubMed] [Google Scholar]
Associated Data
This section collects any data citations, data availability statements, or supplementary materials included in this article.
Supplementary Materials
Data Availability Statement
The RNA sequencing data used in this publication have been deposited in NCBI’s Gene Expression Omnibus74 and are accessible through GEO Series accession number GSE192964. The proteomics data have been deposited in PRIDE (https://proteomecentral.proteomexchange.org/cgi/GetDataset?ID=PXD041588). Source data are provided with this paper. All other data supporting the findings of this study are available from the corresponding author on reasonable request.


