

Abstract
Endometriosis is a common condition in women that causes chronic pain and infertility and is associated with an elevated risk of ovarian cancer. We profiled transcriptomes of >370,000 individual cells from endometriomas (n = 8), endometriosis (n = 28), eutopic endometrium (n = 10), unaffected ovary (n = 4) and endometriosis-free peritoneum (n = 4), generating a cellular atlas of endometrial-type epithelial cells, stromal cells and microenvironmental cell populations across tissue sites. Cellular and molecular signatures of endometrial-type epithelium and stroma differed across tissue types, suggesting a role for cellular restructuring and transcriptional reprogramming in the disease. Epithelium, stroma and proximal mesothelial cells of endometriomas showed dysregulation of pro-inflammatory pathways and upregulation of complement proteins. Somatic ARID1A mutation in epithelial cells was associated with upregulation of pro-angiogenic and pro-lymphangiogenic factors and remodeling of the endothelial cell compartment, with enrichment of lymphatic endothelial cells. Finally, signatures of ciliated epithelial cells were enriched in ovarian cancers, reinforcing epidemiologic associations between these two diseases.
Reporting summary
Further information on research design is available in the Nature Portfolio Reporting Summary linked to this article.
Endometriosis is characterized by endometrial-like tissue growing outside of the uterine cavity, causing chronic pain, dysmenorrhea and infertility. Endometriosis occurs in around 10% of reproductive-aged females, globally impacting around 175 million women. In addition to pain and infertility, endometriosis is associated with increased risk of epithelial ovarian cancer, particularly the clear cell and endometrioid subtypes1–4. Endometriosis can be broadly categorized into ovarian endometriosis (endometrioma), superficial peritoneal endometriosis and deep infiltrating endometriosis (defined clinically as lesions that infiltrate >5 mm under the peritoneal surface). Lesions are often microscopic, rendering traditional bulk genomic characterization approaches challenging as they are best suited to specimens with more homogenous cellular composition. In addition, endometriosis is often treated with ablation, which destroys the tissue. We applied single-cell RNA sequencing (scRNA-seq) to create a cellular atlas of endometriosis and to identify the molecular hallmarks of endometrial-type epithelial and stromal cells in the context of eutopic endometrium (in the correct location within the uterus), endometrioma or peritoneal endometriosis, leveraging these profiles to identify hallmarks of common somatic mutations in endometriosis, and to deconvolute bulk expression profiles of clear cell and endometrioid carcinomas.
Results
Surgical and pathologic characterization of human endometriosis
From a cohort of 17 patients with endometriosis and 4 patients without endometriosis, 54 specimens were collected—32 peritoneal endometriosis specimens from 12 patients, 8 ovarian endometriomas from 7 patients, 10 eutopic endometrium samples (7 from patients with endometriosis and 3 from patients without endometriosis) and 4 uninvolved ovary tissues (2 from patients with endometriosis and 2 from controls) (Supplementary Table 1, Fig. 1a,b and Supplementary Fig. 1). Six patients were taking exogenous hormones at the time of surgery (Supplementary Table 2). In pathology review, all endometriomas had endometrial-type epithelium and stroma, plus hemosiderin present. In the peritoneal endometriosis specimens, the number of diagnostic endometriosis foci ranged from 0 to 24. Four of 32 peritoneal specimens were suspicious for endometriosis during surgery but had no endometriosis detected (patient 8: anterior cul-de-sac and rectal serosa; patient 10: bladder and left uterosacral ligament), including in five deeper sections cut at 50-μm intervals (Supplementary Tables 3 and 4).
Fig. 1 |. A cellular atlas of human endometriosis.
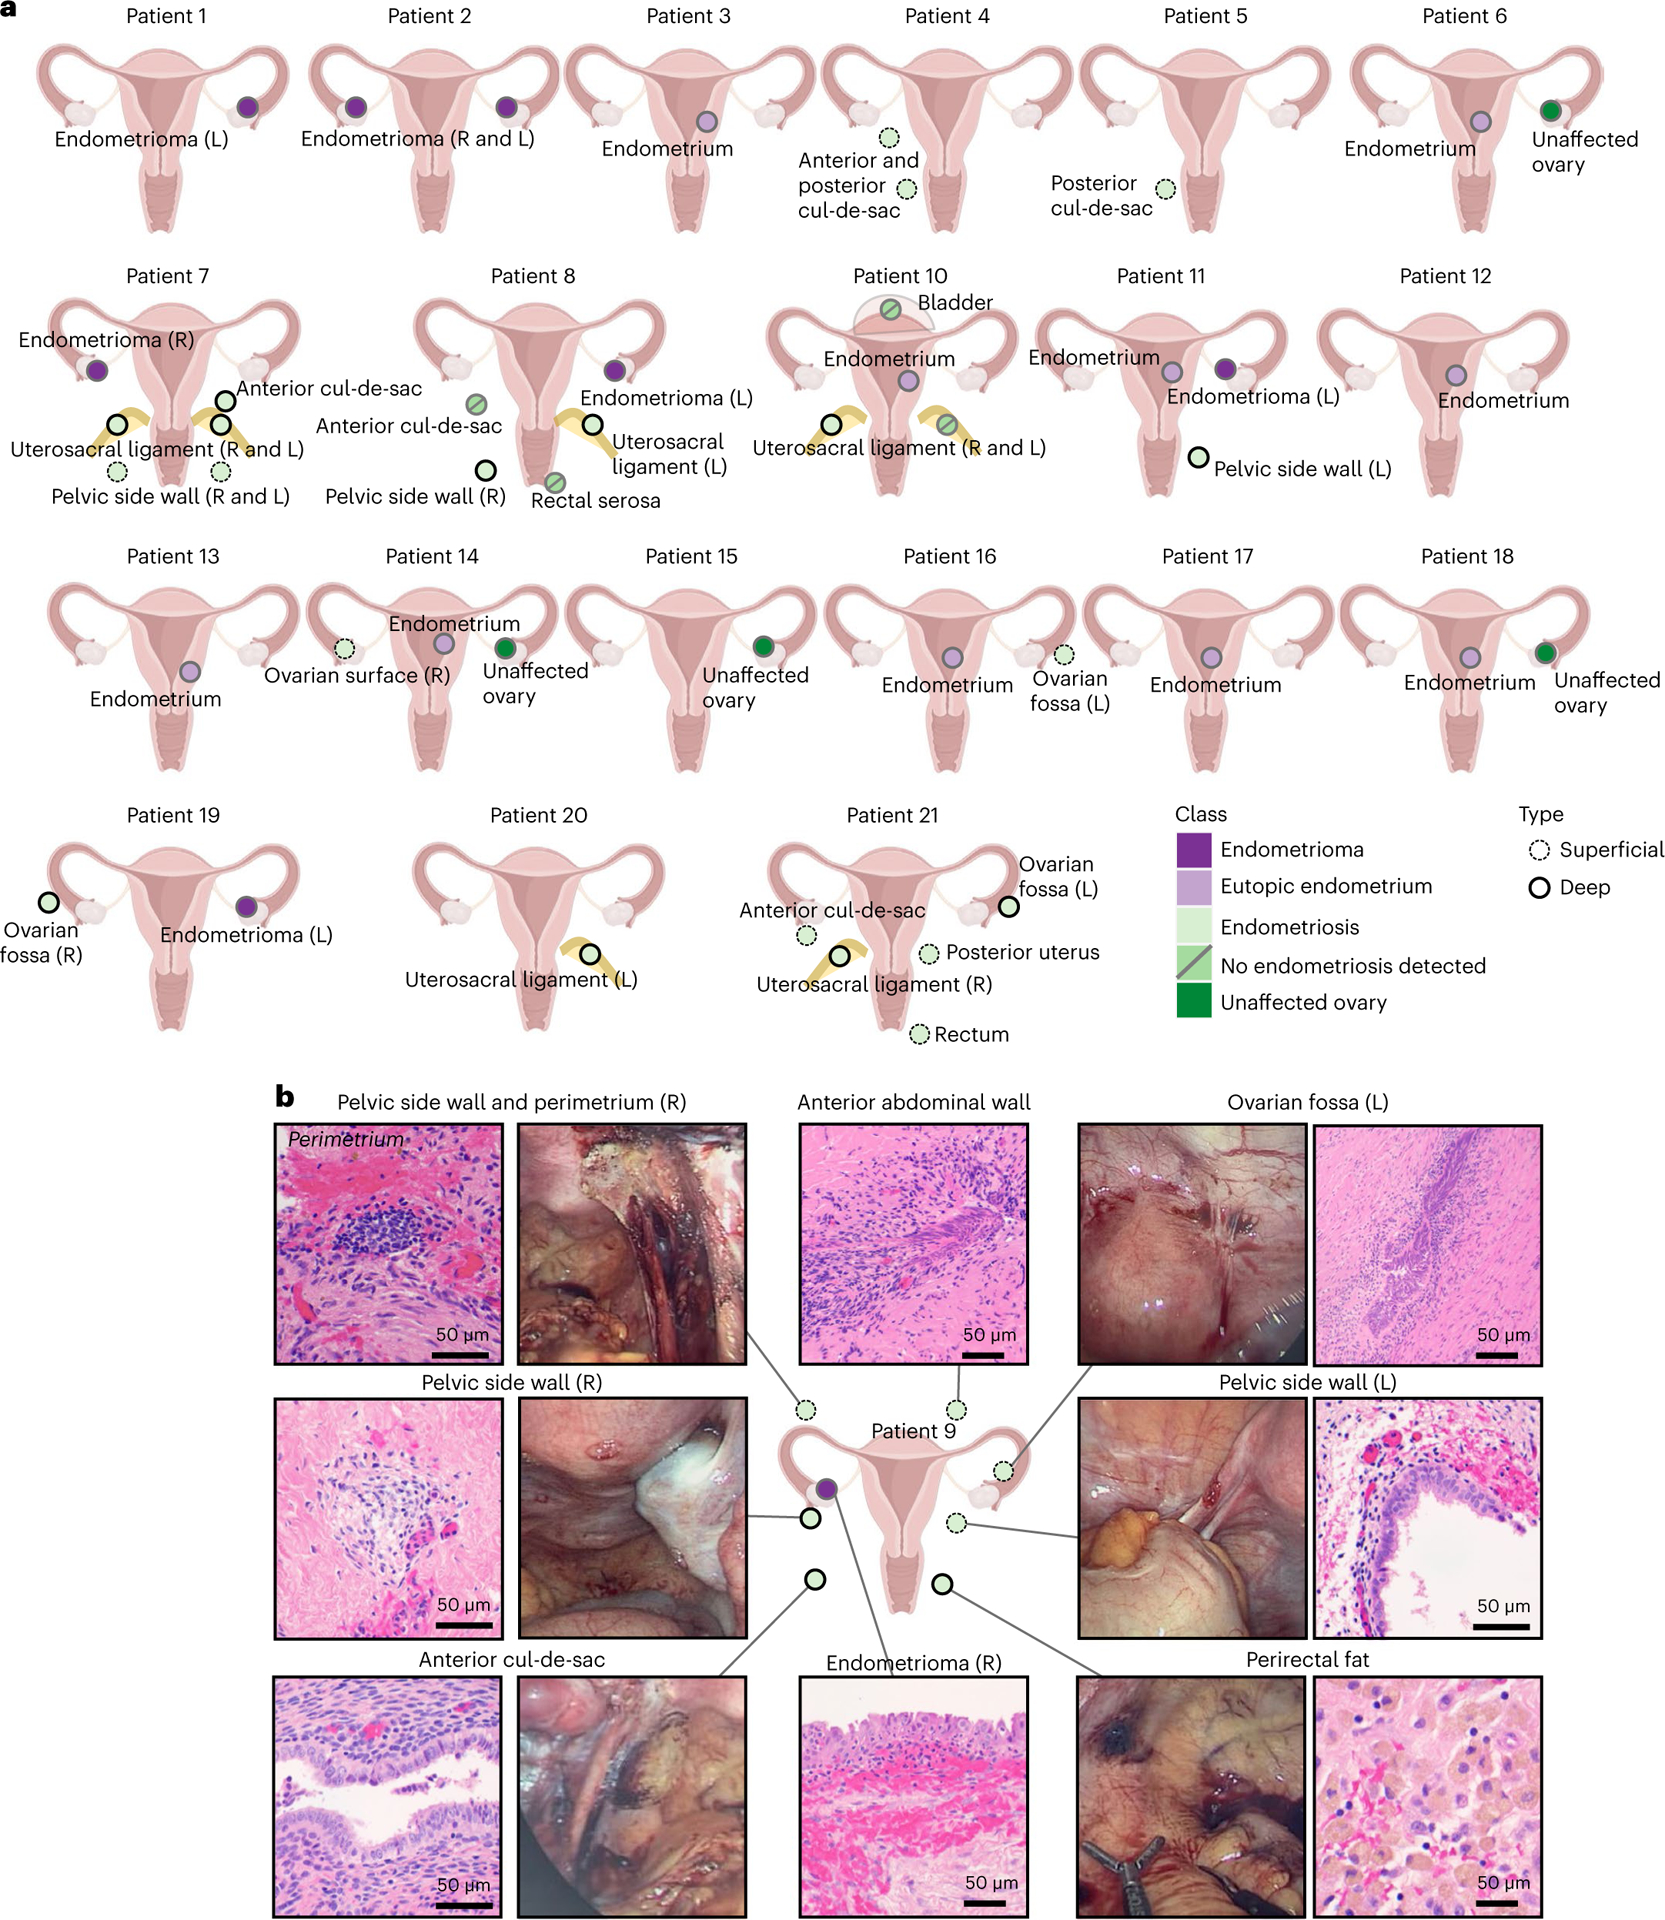
a, Patient cohort and specimens profiled. Only samples that passed quality control after single-cell profiling are shown (Supplementary Table 4). b, Histologic and macroscopic features of specimens from patient 9. Uterus graphic from BioRender.com. L, left; R, right.
A single-cell atlas of endometriosis
All these specimens were profiled using droplet-based scRNA-seq. In five instances, specimens with low cell yields (under 100,000 cells) were combined with specimens from similar anatomic locations in the same patient; 3 samples failed quality control and were excluded from the analyses (Methods) to yield a total of 49 samples sequenced—8 endometriomas, 27 peritoneal endometriosis tissues (23 with endometriosis, 4 with no endometriosis detected), 10 eutopic endometrium specimens and 4 uninvolved ovary tissues. In total, 432,751 individual cells were profiled, with over 9.2 billion reads sequenced (Fig. 2a and Supplementary Table 5). After quality control (Methods), 373,851 cells remained for analysis. The median number of captured cells was 12,990 for eutopic endometrium (range = 5,621–26,320), 7,697 for endometrioma (range = 1,171–27,369), 3,315 for peritoneal endometriosis (range = 498–16,747), 6,460 for endometriosis-negative peritoneum (range = 2,197–13,179) and 13,166 for unaffected ovary tissue (range = 10,719–23,011) (Fig. 2a). Observed cell number correlated with the targeted cell number (P = 2.6 × 10⁻¹⁰, Spearman’s r = 0.76) and the number of genes cataloged per cell was not significantly different between groups (Extended Data Fig. 1a–d).
Fig. 2 |. The cellular landscapes of endometrioma, peritoneal endometriosis, unaffected peritoneum, eutopic endometrium and unaffected ovary.
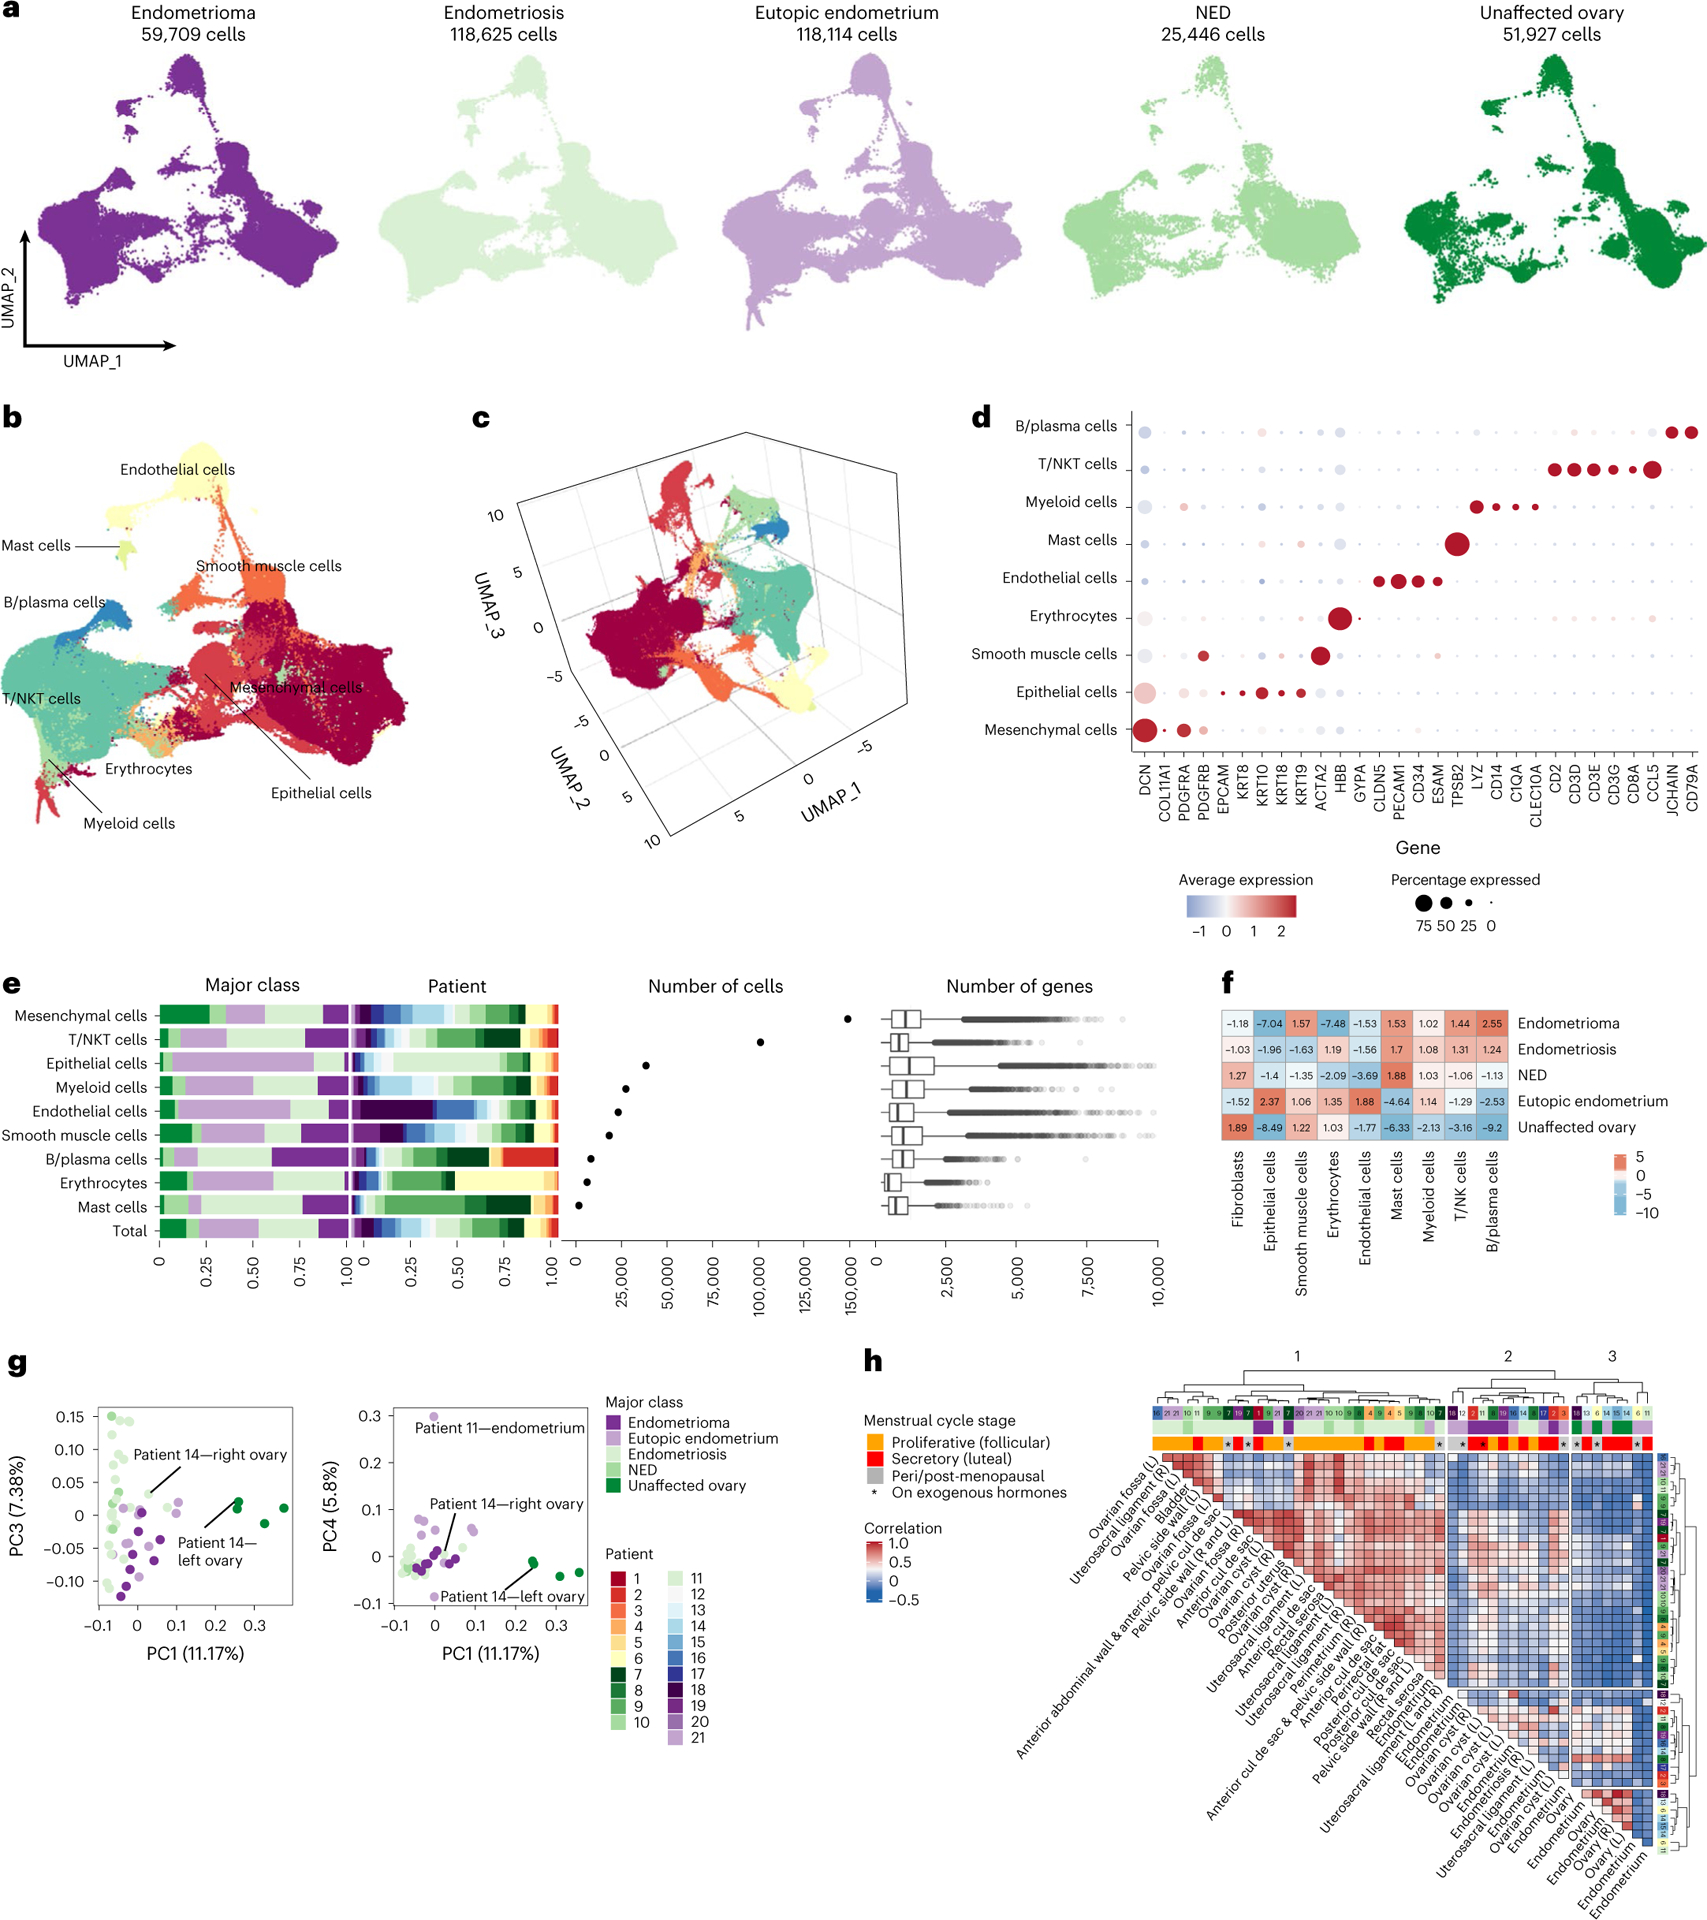
a, UMAP visualization of all sequenced cells (after filtering for quality) from 49 samples representing five major tissue-type classes. b, Major cell types identified, UMAP representation. c, Three-dimensional UMAP representation. d, Expression of representative markers across nine major cell types. e, Representation of each major class within each major cell-type group, contribution of each patient to each group, frequencies of each cell type and number of genes detected in each cell type. ‘Total’ column represents the proportion of each patient or class in the major cell type overall, under the null hypothesis of no enrichment of any tissue class. The color key for tissue class is shared across a, e, g and h. Box and whisker plots, boxes denote the interquartile range, bar denotes median number of genes detected per cell. The limits of the whiskers represent 1.5 × IQR (interquartile range) and outlier cells are indicated with individual dots. f, Fold enrichment and depletion of each cell type across the five classes. g, Principal component analysis. h, Correlation, based on cluster frequencies, across all specimens profiled by scRNA-seq (Pearson correlation, no threshold for significance applied). Agglomeration method ‘ward.D2’ and ‘canberra’ distance were used as clustering parameters. NED, no endometriosis detected; NK, natural killer; NKT, natural killer T-cells.
Normalized scRNA-seq data were integrated using Harmony5. In total, 114 clusters were identified, and cell types were annotated using a systematic pipeline for semi-supervised cell-type assignment (Methods and Extended Data Fig. 1). First, genes overexpressed in each cluster were identified (log2 fold change (FC) = 0.2; P < 0.05) and a set of rules were defined for cell-type identification based on expression of canonical cell-type-specific markers, taking into consideration known hierarchies between markers, for example, ACTA2 in the absence of other fibroblast markers denotes smooth muscle cells, but when coexpressed with fibroblast markers denotes activated fibroblasts (Methods). For 108 of 114 clusters it was possible to assign cell identities using this approach (Extended Data Fig. 1h and Fig. 2b–e). For the six clusters that did not overexpress canonical marker genes for any cell type, pairwise correlations between all clusters were calculated and cell identities assigned based on the most correlated cluster (Extended Data Fig. 1j and Supplementary Table 6). Correlation values for cell-type assignment ranged from 0.55 to 0.89 (Pearson correlations) and were significantly higher compared with random pairwise correlations (average random correlation r = 0.007; P < 0.001; Extended Data Fig. 1i), providing confidence that cell-type assignment can be achieved using this approach. Gene expression within each cell type was highly correlated when fresh and cryopreserved specimens were compared (Extended Data Fig. 1k).
Mesenchymal cells, identified by expression of FAP, COL1A1 and PDGFRA/B, were the most abundant cell type present (n = 149,051 cells, 39.9% of cells remaining after filtering) (Fig. 2d,e). T cells/natural killer T cells were the second most prevalent cell type present, comprising 101,217 cells (27.1% of cells). Keratin (KRT7, KRT8, KRT10, KRT18, KRT19) or EPCAM-positive epithelial cells (n = 38,456 cells) represented 10.3% of the total population (Fig. 2d,e). Other less common cell types included myeloid cells (n = 27,436 cells, 7.3% of the total population), smooth muscle cells (n = 18,314 cells, 4.9% of cells), endothelial cells (n = 23,226 cells, 6.2% of cells), B lymphocytes and plasma cells (n = 8,278 cells, 2.2% of cells), and mast cells (n = 1,687 cells, 0.4% of cells). Mesenchymal and smooth muscle cells had the greatest number of genes detected per cell (average = 1,209 and 1,285 genes per cell), and as expected, erythrocytes had the lowest number of genes detected per cell (687 genes per cell). Overall, each class of tissue type had a significantly different composition of cell types compared with the other four classes (P = 2.2 × 10⁻¹⁶, chi-squared test). As expected from pathologic examination of the tissues, eutopic endometrium tissues were enriched 2.4-fold and 1.9-fold for epithelial cells and endothelial cells, respectively (P = 2.2 × 10⁻¹⁶ and P = 2.2 × 10⁻¹⁶, chi-squared test). Endometrioma tissues were depleted 7.0-fold for epithelial cells but enriched 2.6-fold for B and plasma cells (P = 2.2 × 10⁻¹⁶ and P = 2.2 × 10⁻¹⁶, chi-squared test). Endometriosis was enriched 1.7-fold for mast cells and 1.3-fold for T/natural killer T-cells (P = 2.2 × 10⁻¹⁶ and P = 2.2 × 10⁻¹⁶, chi-squared test; Fig. 2f).
In principal component (PC) analysis, unaffected ovaries were clearly separated by PC1 (11.2% variance explained) with separation of eutopic endometrium from endometriomas and endometriosis also evident in PC4 (5.8% of variance explained) (Fig. 2g and Extended Data Fig. 1l). PC1 was significantly associated with endometriosis (P = 0.009), and unaffected ovaries (P = 1.9 × 10⁻¹⁵, logistic regression model), with a modest association with endometriosis-free samples (P = 0.02). Eutopic endometrium was associated with PC2 (P = 0.005) and PC4 (P = 0.004). An endometriosis lesion of the surface of the right ovary from patient 14 clustered together with endometriosis and endometriomas and not with the unaffected ovary tissues, whereas the left endometriosis-free ovary specimen from the same patient clustered with other unaffected ovary tissues, illustrating the extensive impact of endometriosis on reshaping the local microenvironment (Fig. 2g). In unsupervised clustering of the correlation values for pairwise comparisons of cell-type compositions of each specimen, samples separated into three major clusters (Fig. 2h). Cluster 1 was predominantly composed of endometriosis. Cluster 2 contained five of the eight endometrioma specimens and five of the ten eutopic endometrium samples. Cluster 3 contained only control tissues—all of the unaffected ovary specimens and four of the ten eutopic endometrium specimens were found in this cluster. Specimens from patients that were postmenopausal and patients in the luteal phase of the menstrual cycle at the time of surgery tended to be found in Clusters 2 and 3, whereas most of the specimens from women in the follicular phase of the menstrual cycle tended to be in Cluster 1, illustrating the profound impact of female reproductive hormones on the cellular composition of these tissues (Fig. 2h).
Epithelial heterogeneity and hormone responses
Epithelial and stromal cells are the two major structural cell types present in endometriosis lesions. First, we re-clustered the keratin-positive cells, removing any keratin-negative clusters and clusters where ≥90% of the cells came from a single patient. The 11 clusters formed from the 13,771 remaining cells expressed cell-type-defining genes and genes associated with either the follicular (proliferative) or luteal (secretory) phases of the menstrual cycle (Fig. 3a–d). Eight of these were clusters of epithelial cells that exhibited heterogenous expression of keratins characteristic of ductal and simple epithelium (KRT7, KRT8 and KRT18), EPCAM and/or hormone receptors ESR1 and PGR. Three clusters of mesothelial cells expressed WT1, PDPN, DES and/or CALB2 (Supplementary Table 7 and Supplementary Note).
Fig. 3 |. Keratin-positive components of eutopic endometrium, endometriomas and endometriosis.
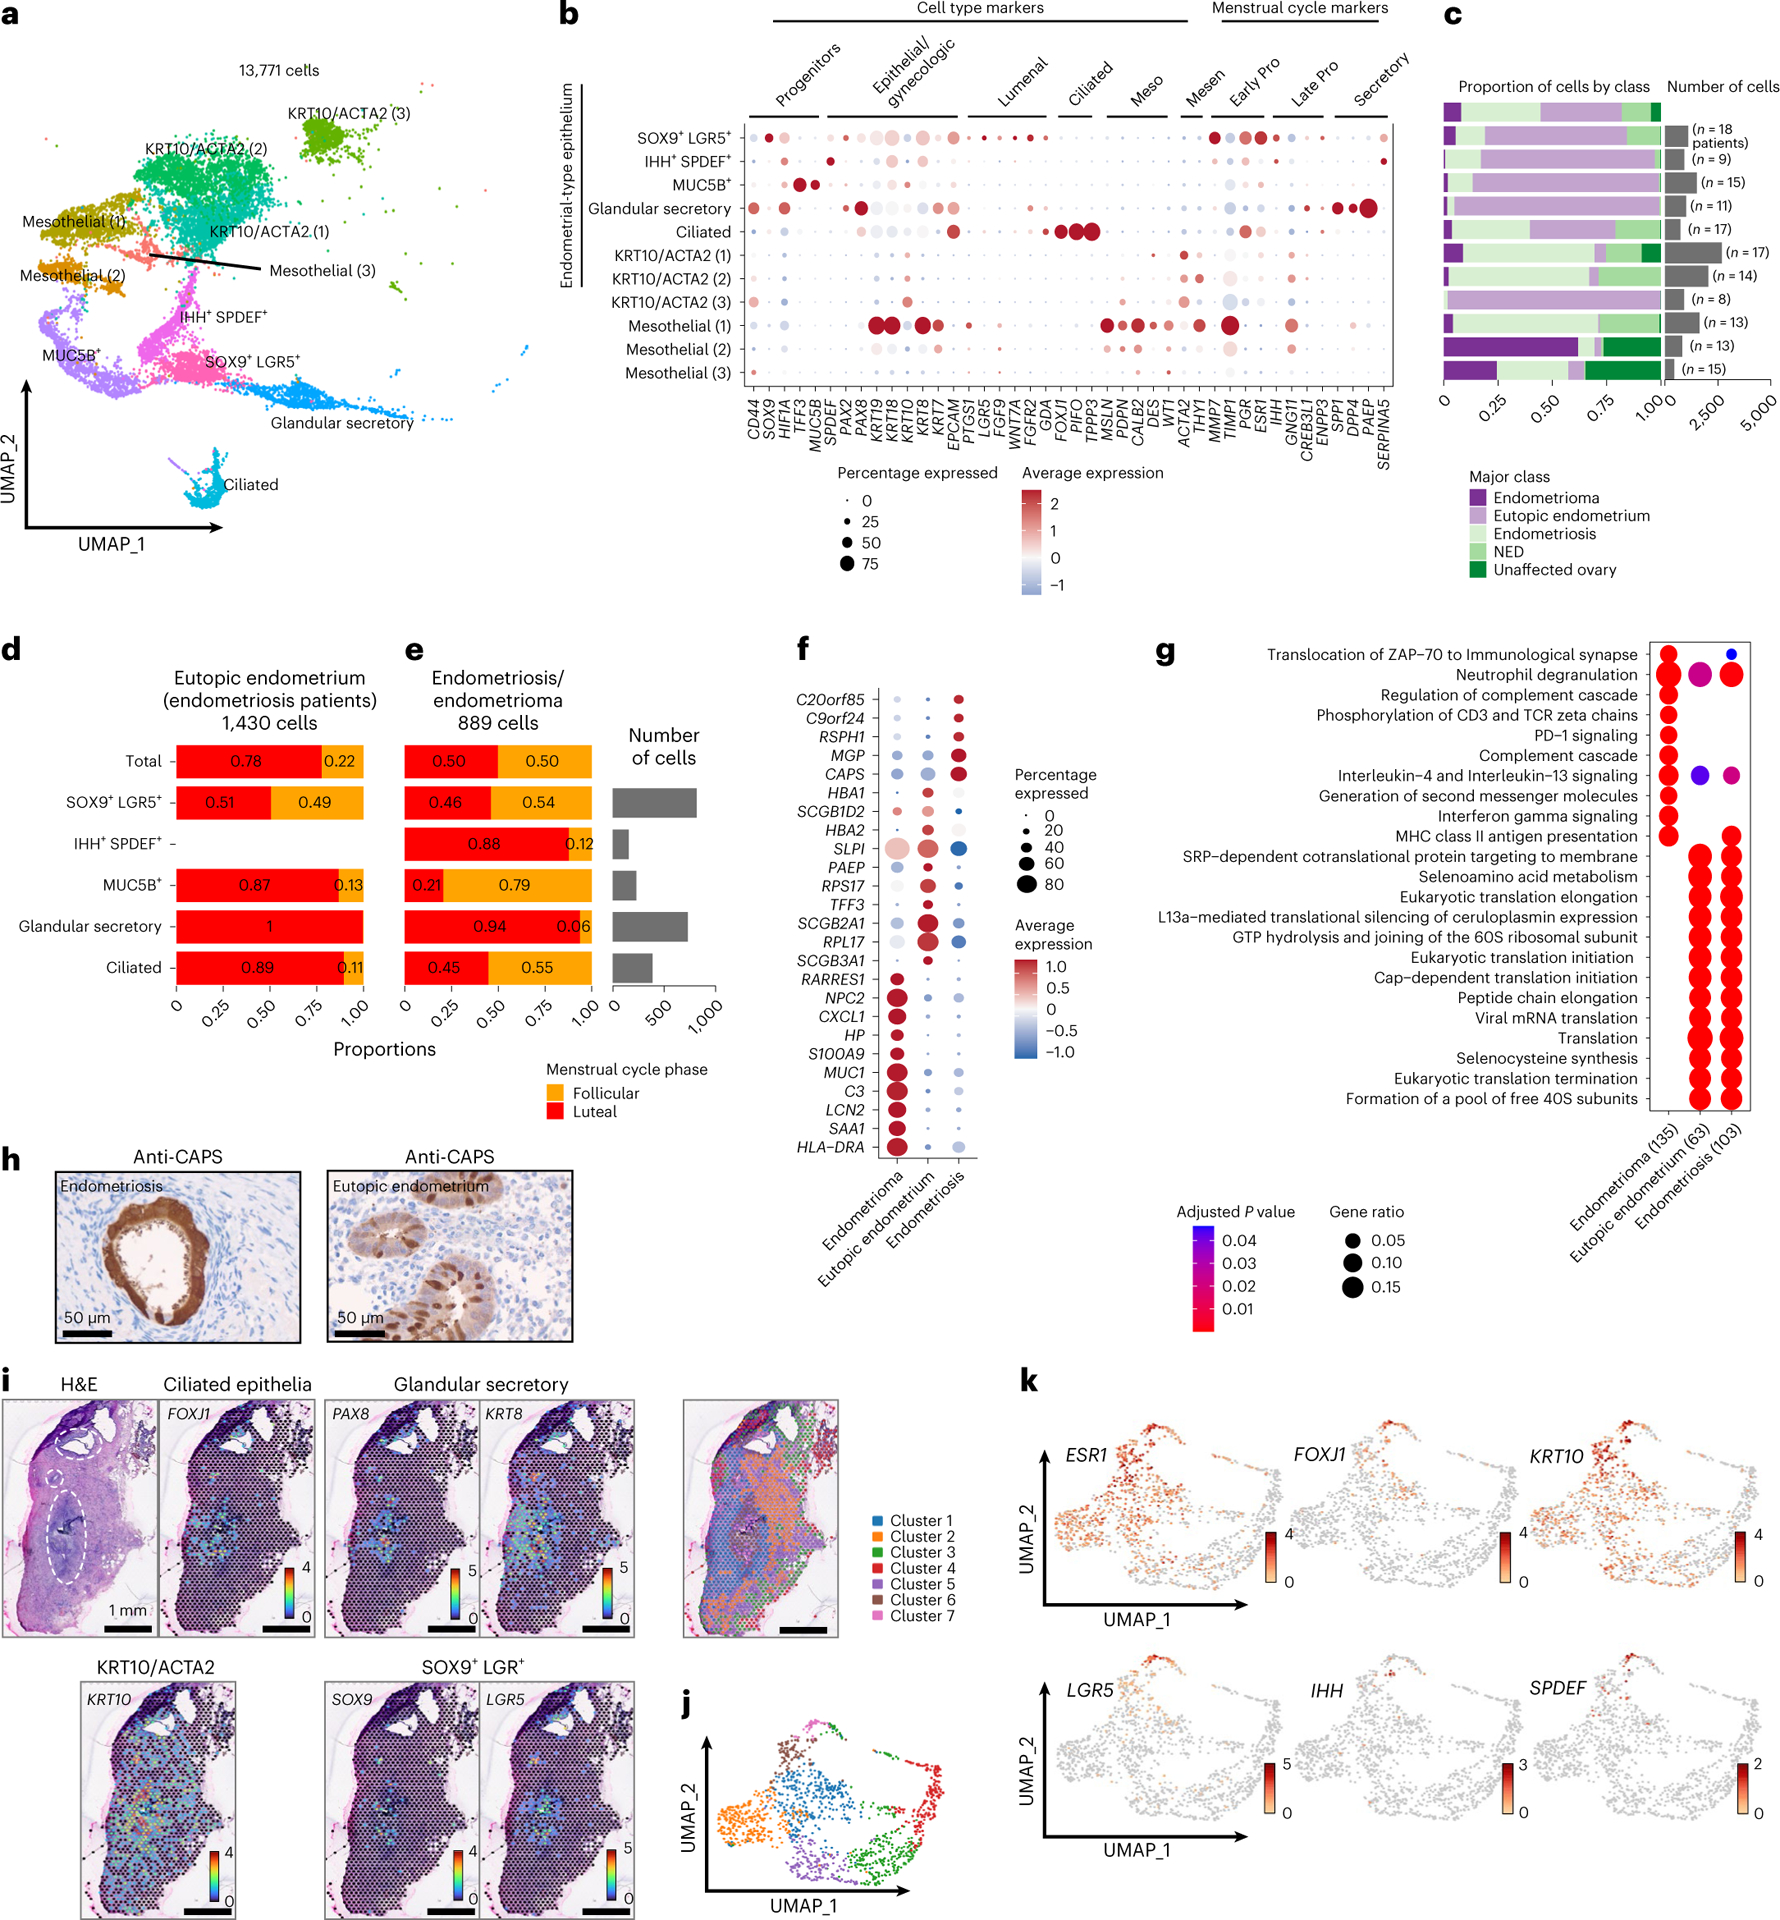
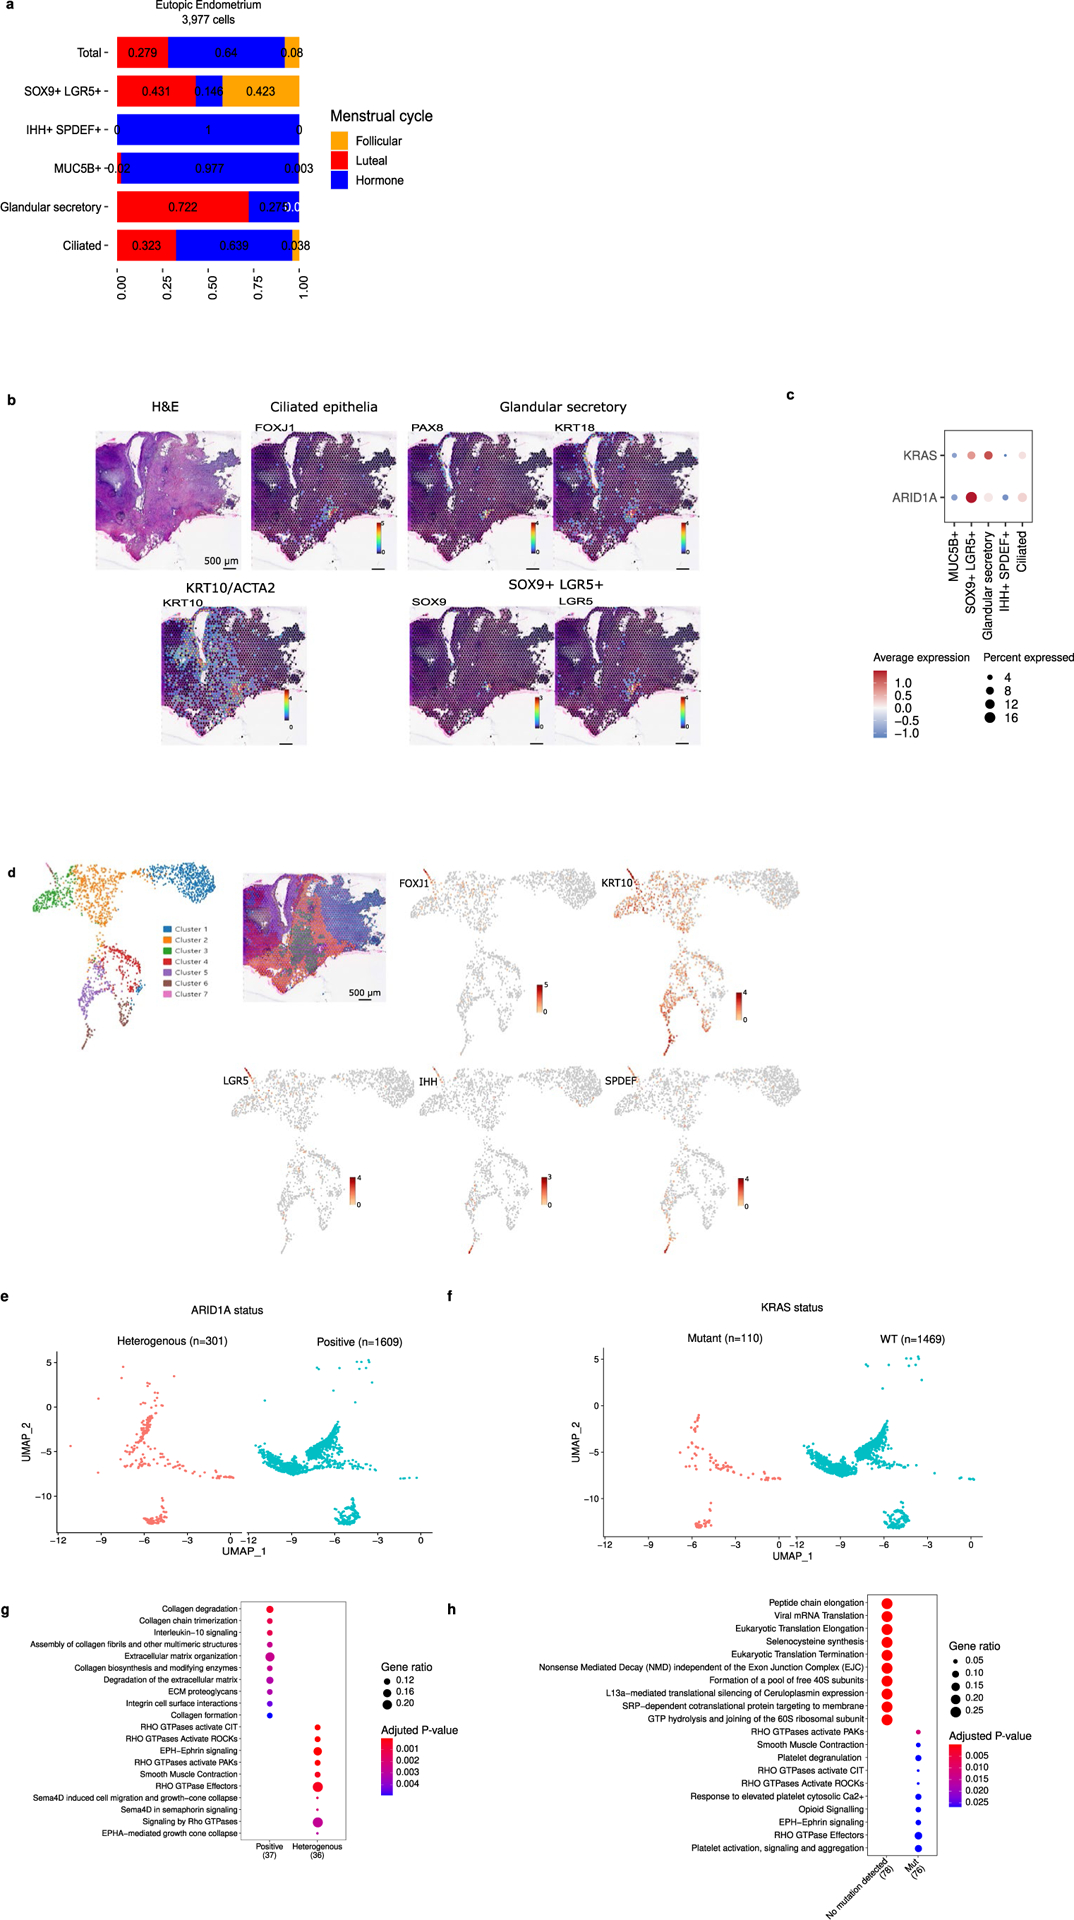
a, UMAP of all keratin-positive cells. b, Marker gene expression. Meso, mesothelial cell markers; Mesen, mesenchymal markers. c, Frequency of each cluster by class; the total column represents the distribution of each class in the entire epithelial compartment. Absolute number of cells per cluster and number of patients contributing to each cluster are indicated on the histogram. Proliferative, XXX. d,e, Proportional bar plot of endometrial-type epithelial clusters in eutopic endometrium samples (d) and in endometriosis/endometrioma (e) in the follicular or luteal phase of the menstrual cycle. f, Differential gene expression in endometrial-type epithelium (the first five rows in panel b) in the context of endometrioma, eutopic endometrium or extra-ovarian endometriosis (P < 0.05 and log2 FC > 1). Two-sided differential expression analyses were performed using MAST, with P values adjusted using the Benjamini–Hochberg method. g, Pathway analysis, endometrial-type epithelium in the context of endometrioma, eutopic endometrium or extra-ovarian endometriosis. Pathway analyses were performed using the Reactome R package, with P values calculated based on a hypergeometric model and a Bonferroni correction applied. h, CAPS expression, immunohistochemical staining of eutopic endometrium and endometriosis. i, Spatial transcriptomic analysis of a peritoneal endometriosis lesion (BEME346) showing spatial distribution of cluster-specific genes. Each spot represents 1–10 cells. Three foci of endometriosis are indicated by white dashed circles on the image of the H&E-stained slide. j, k-means clustering identified seven clusters based on gene expression. k, Feature UMAPs for epithelial cluster-specific genes.
Endometrial-type epithelium is abundant in eutopic endometrium and is one of three diagnostic features of endometriosis. We observed five clusters of endometrial-type epithelium expressing gynecologic keratins, genes that dictate secretory or ciliated differentiation, and/or hormone receptors (4,885 cells) (Fig. 3b,c). All were enriched for cells derived from eutopic endometrium, but also comprised cells from peritoneal endometriosis and endometrioma specimens (Fig. 3c). A cluster characterized by expression of SOX9, LGR5 and EPCAM, a MUC5B+/TFF3+-expressing subset and differentiated glandular/secretory epithelial cells with elevated expression of PAX8, IDO, KRT7 and EPCAM, were concordant with subpopulations described in recent reports6,7. We also identified a population of partially differentiated (inferred by lower KRT8/KRT18 expression) epithelial cells expressing Indian Hedgehog Signaling Molecule (IHH) and SAM Pointed Domain Containing ETS Transcription Factor (SPDEF) which were enriched for secretory pathways and highly expressed WFDC2 (which encodes HE4), STX18 and secretoglobin family members SCGB1D2 and SCGB2A1 (Supplementary Table 7). A population of differentiated ciliated epithelial cells coexpressed FOXJ1, PIFO, TPPP3 and EPCAM (refs. 6–8) and was enriched for the ‘cilium assembly’ pathway (adjusted P = 1.4 × 10⁻²⁸) (Supplementary Table 8 and Fig. 3b). We note that 28–248 endometrial-type epithelial cells were detected in the four endometriosis-negative specimens from patients 8 and 10, suggesting that the portions of tissue used for scRNA-seq contained microscopic endometriosis lesions which evaded even the most comprehensive pathologic examination.
Endometrial tissues undergo extensive remodeling in response to hormonal fluctuations throughout the menstrual cycle8,9. Within eutopic endometrium tissues, SOX9+/LGR5+ progenitors were enriched in samples representing the follicular phase of the menstrual cycle, whereas the MUC5B/TFF3-expressing subset and ciliated and differentiated glandular/secretory epithelial cells were enriched in luteal phase tissues (Fig. 3d). By contrast, the distribution of epithelial subsets was skewed in endometriosis/endometrioma, with the ciliated cells no longer enriched during the luteal phase and the MUC5B/TFF3-subset now enriched in follicular phase specimens, rather than depleted (Fig. 3e). IHH+/SPDEF+ cells were detected in eutopic endometrium from women on exogenous hormones but were absent from eutopic endometrium of women not taking hormones (Extended Data Fig. 2a). By contrast, IHH+/SPDEF+ cells were detected in endometriosis lesions, particularly during the luteal phase of the menstrual cycle. To further explore differences in the endometrial-type epithelium between eutopic endometrium, endometrioma and peritoneal endometriosis, we performed differential gene expression analysis across the three anatomic sites. Genes upregulated in endometrioma (log2 FC > 1 and adjusted P < 0.05) included serum amyloid A1 (SAA1, log2 FC = 2.8, adjusted P = 3.3 × 10−75) and were enriched in pathways associated with immune cell interactions, including regulation of the complement cascade (adjusted P = 8.6 × 10⁻⁷) and PD-1 signaling (P = 9.8 × 10⁻⁷) (Fig. 3f,g and Supplementary Tables 9 and 10). Endometrial-type epithelium in endometriosis and eutopic endometrium was enriched for secretory pathways (Fig. 3g). Although similar at a pathway level, endometrial-type epithelium overexpressed a handful of genes associated with cilia in endometriosis compared with eutopic endometrium (CAPS, RSPH1)10, plus poorly characterized genes C20orf85 and C9orf24. In addition, three functionally diverse EPCAM-negative clusters coexpressed low levels of keratin 10 (KRT10) and smooth muscle actin (ACTA2) (5,632 cells) and are described in the Supplementary Note (Supplementary Tables 11 and 12). Immunohistochemical staining of eutopic endometrium and endometriosis verified CAPS-positive ciliated cells in both tissue types and, in spatial transcriptomic analysis of two endometriosis tissues, foci of endometrial-type epithelium contained FOXJ1+ ciliated cells and LGR5+ and SOX9+ cells surrounded by KRT10+ cells both within and outside of the lesion proper (Fig. 3h–k and Extended Data Fig. 2b–d).
Consequences of somatic mutation in endometriosis epithelium
Somatic mutations in cancer driver genes including ARID1A and KRAS occur in endometriosis11–13 and so we sought to determine the in vivo transcriptional consequences of mutations in these genes. Twenty-one specimens had sufficient epithelial content to quantify ARID1A expression using immunohistochemistry as a mutation surrogate; ten specimens had sufficient epithelial content to identify KRAS mutations by droplet digital PCR (ddPCR) (Fig. 4a). The two endometrium specimens profiled were wild type for both genes. Two endometriomas and four peritoneal lesions exhibited heterogenous ARID1A expression indicative of heterozygous ARID1A loss-of-function mutations. Two of the five endometriomas and two of the five peritoneal lesions harbored KRAS mutations at codon 12. ARID1A and KRAS expression were highest in SOX9+/LGR5+ and glandular secretory clusters, respectively (Extended Data Fig. 2c). When we compared expression by mutation status, ARID1A messenger RNA expression was 2.1-fold lower in epithelium with heterogenous protein staining compared with cases with strong ARID1A staining (Fig. 4b,c). By contrast, KRAS gene expression was only marginally elevated (by around 5%) in mutant compared with wild-type cells (Fig. 4b). We performed differential expression analysis to identify genes and pathways associated with mutation of KRAS or ARID1A (Fig. 4d,e and Extended Data Fig. 2g,h). KRAS mutation was associated with 302 differentially expressed genes (DEGs) (log2 FC > 0, adjusted P < 0.05) including known KRAS target gene S100 calcium-binding protein A1 (ref. 14) (S100A1; log2 FC = 0.61, adjusted P = 9.16 × 10⁻³³) and transcriptional regulator nuclear protein 1 (NUPR1; log2 FC = 0.70, adjusted P = 2.05 × 10⁻²⁹) (Fig. 4d and Supplementary Table 13). In total, 118 genes were differentially expressed in endometrial-type epithelium with ARID1A loss compared with those with homogenous positive staining (log2 FC > 0, adjusted P < 0.05) (Fig. 4e and Supplementary Table 14). The most upregulated gene was known ARID1A target gene IGFBP2 (log2 FC = 0.62, adjusted P = 2.24 × 10−68)15 and SRY-box 17 (SOX17; log2 FC = 0.50, adjusted P = 1.51 × 10⁻³³; Fig. 4e). SOX17 protein expression was validated in the same tissues using immunohistochemistry. Heterogeneous ARID1A staining was associated with moderate/strong SOX17 staining and a higher proportion of epithelial cells expressing SOX17 compared with lesions with positive ARID1A staining (Fig. 4f,g). We have recently identified SOX17 as a positive regulator of angiogenesis in high-grade serous ovarian cancer16–18. We therefore interrogated the endothelial cell compartment associated with ARID1A mutation status. Two endothelial clusters enriched in ARID1A mutant tissues expressed lymphatic endothelial cell markers (PDPN, LYVE1) (Fig. 4h,i). ARID1A loss was also associated with increased epithelial expression of pro-lymphangiogenic factors VEGFC, CCBE1 and FGF2 plus lower expression of VEGFA, which has a weaker effect on lymphangiogenesis and can inhibit lymphangiogenesis in certain contexts19 (Fig. 4k). Together, these data suggest that epithelial ARID1A mutations may promote growth of local lymphatic endothelial cells through altered paracrine signaling.
Fig. 4 |. Gene expression signatures associated with somatic mutation of ARID1A or KRAS.
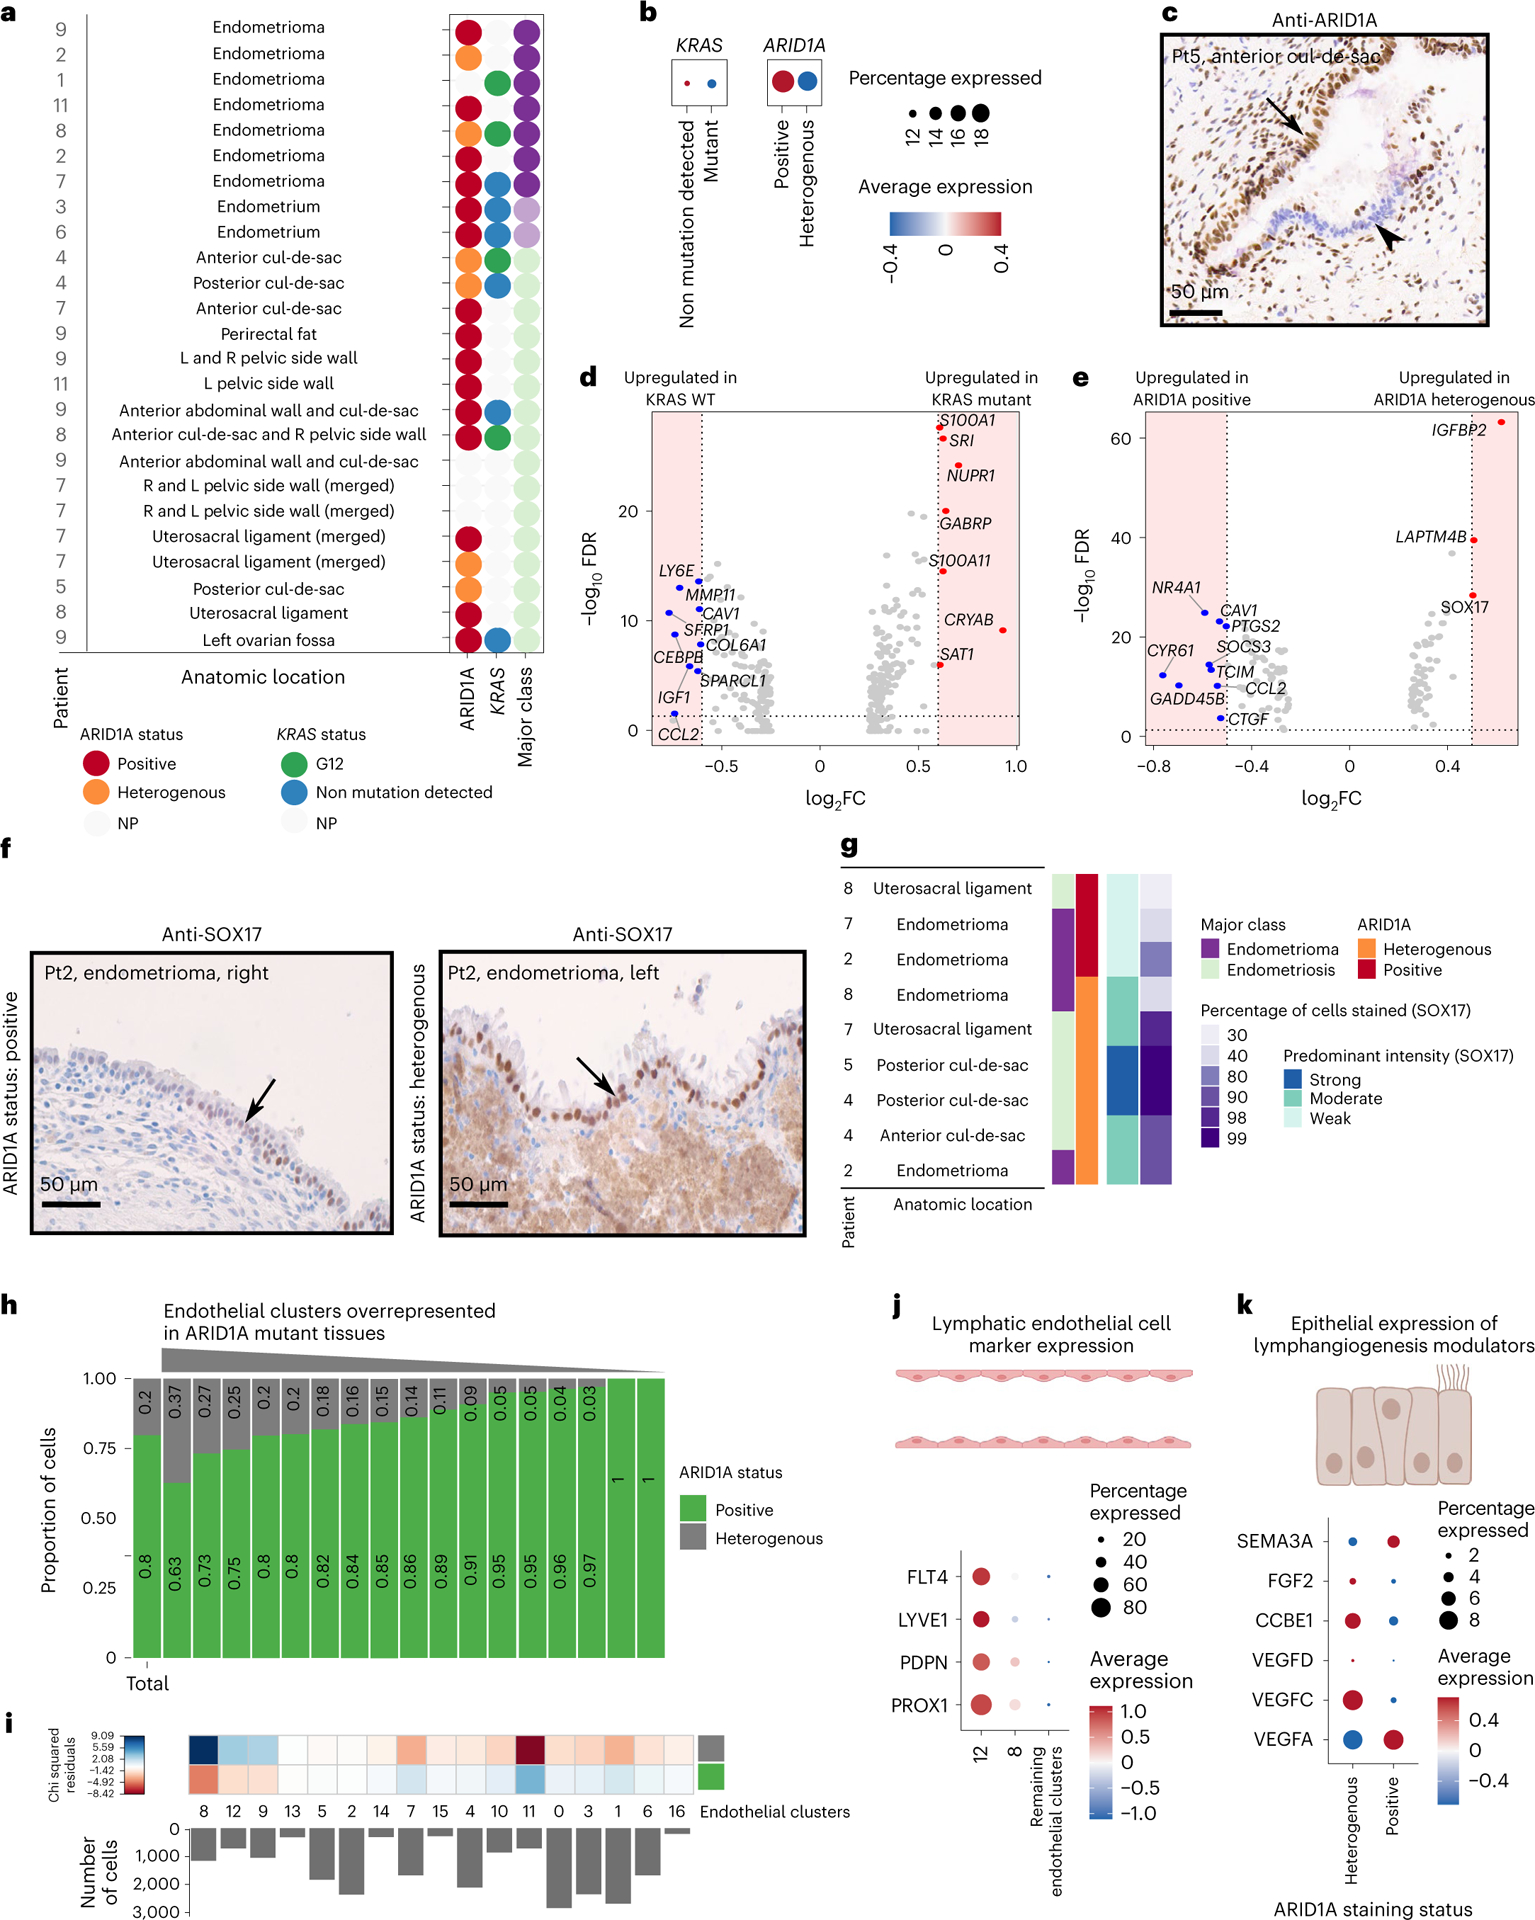
a, Summary of ARID1A staining status and KRAS mutations detected in each lesion. NP, not profiled due to insufficient epithelial material available in the specimen. b, Expression of ARID1A and KRAS mRNA by mutation state. c, ARID1A immunostaining in a representative endometriosis lesion with heterogenous staining; positive staining for ARID1A is shown with the black arrow and negative epithelium is shown with the arrowhead. Posterior cul-de-sac lesion from patient 5 is shown. d, Differential gene expression in KRAS mutant versus wild-type endometrial-type epithelium (P < 0.05 and log2 FC = 0.6, dashed line and shaded area). Two-sided differential expression analyses were performed using MAST, with P values adjusted using the Benjamini–Hochberg method. e, Differential gene expression in ARID1A heterogeneously staining versus positive endometrial-type epithelium (P < 0.05 and log2 FC = 0.5, dashed line and shaded area). Two-sided differential expression analyses were performed using MAST, with P values adjusted using the Benjamini–Hochberg method. f, SOX17 staining in ARID1A-positive and ARID1A heterogenous staining endometriomas from patient 2. g, Summary of SOX17 staining by ARID1A staining status. h, Cluster frequencies for endothelial cells in lesions with positive or heterogenous ARID1A staining. Histogram of number of cells in each cluster. One cluster was removed as it contained only 19 cells. i, Chi-squared residuals, tests of differences in cluster frequencies compared with the null distribution (total column). j, Expression of lymphatic endothelial cell markers, contrasted in clusters enriched in ARID1A mutant tissues compared with nonenriched clusters. k, Expression of lymphangiogenic factors in wild-type and ARID1A mutant endometrial-type epithelium. The color keys for tissue class and ARID1A expression status are shared across a and g, h FDR, false-discovery rate; Pt, patient.
Gene expression in endometrial-type stroma
After removal of patient-specific clusters, subclustering of the 82,735 mesenchymal cells identified 13 distinct clusters which could be stratified into four major groups—MME-positive endometrial-type stroma (EnS; 2 clusters; 4,290 cells), fibroblasts (9 clusters; 66,711 cells), smooth muscle cells (1 cluster; 1,735 cells) and bland cells expressing the growth arrest specific 5 long noncoding RNA (GAS5+ cells; 1 cluster; 9,999 cells) (Fig. 5a,b, Supplementary Tables 17 and 18, Supplementary Fig. 4a and Supplementary Note). MME+ EnS clusters could be stratified into proliferative cells expressing MMP11, CRABP2, ECM1, ESR1, PGR and IGF1 and secretory cells expressing PAEP, FOXO1 and IL15 (Fig. 5b,c). EnS and epithelium showed evidence of coordinated gene expression in eutopic endometrium, endometriosis and endometrioma tissues (Supplementary Fig. 4 and Supplementary Note). Pathways activated in EnS associated with endometriosis and endometrioma included extracellular matrix reorganization, with upregulated expression of multiple collagen genes, interleukin-4 and −13, and genes involved in the complement cascade, with the latter particularly enriched in endometrioma (Fig. 5d,e and Supplementary Tables 19 and 20). Secretory-associated genes and pathways were enriched in eutopic EnS, reflecting the enrichment of secretory-type EnS observed in this tissue type. In eutopic endometrium, proliferative EnS cells dominated during the follicular phase of the menstrual cycle, and secretory EnS cells during the luteal phase (Fig. 5f). The KRT10/ACTA2 (1) and (2) clusters with a weak signature of proliferative EnS were also enriched in follicular phase endometrial tissues. In contrast, in endometriosis/endometrioma tissues, the distribution of proliferative and secretory EnS populations did not show the expected associations with menstrual cycle phases, mirroring the dysregulated relationship with hormones seen in endometrial-type epithelium (Figs. 3d,e and 5g). In spatial transcriptomic analyses, ECM1- and MMP11- (proliferative EnS marker) positive cells were detected in the endometriosis lesions. CFD+ peritoneal fibroblasts were separated from the lesions by a region of C7-positive fibroblasts scattered with FAP-positive cells (Fig. 5h,i).
Fig. 5 |. Signatures of EnS and mesenchymal cells associated with endometriosis.
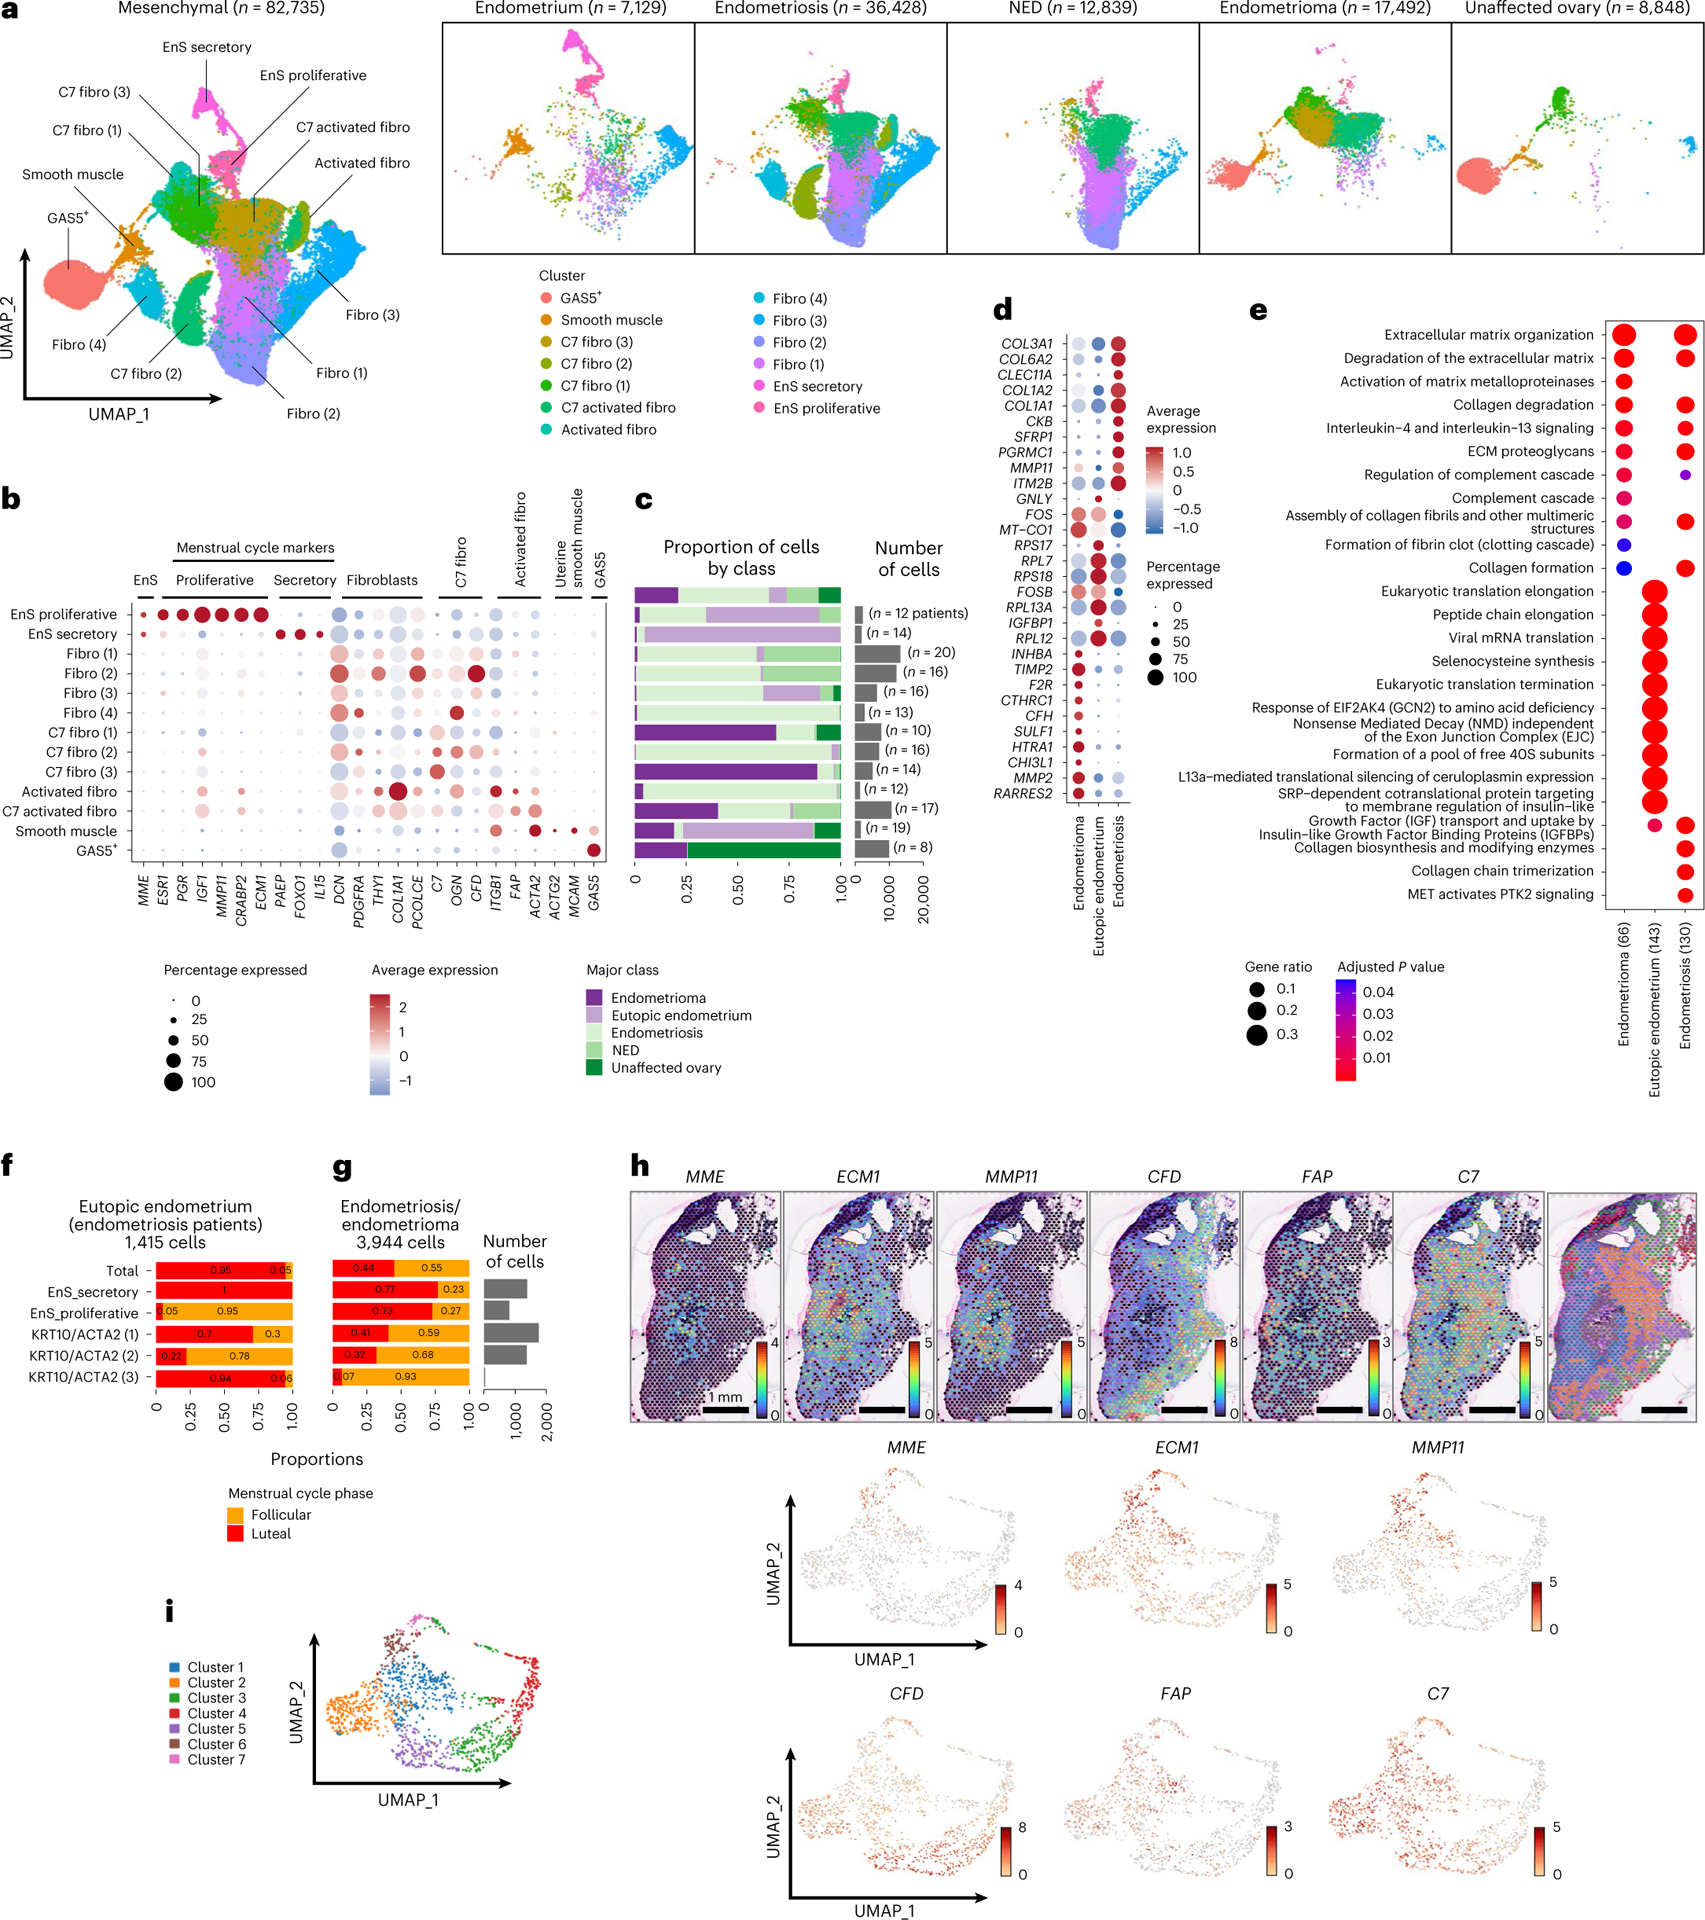
a, UMAP of mesenchymal cell types in the entire dataset and across the five major classes of tissue type. b,c, Marker gene expression (b) and cluster frequencies, number of cells per cluster and number of patients contributing to each cluster (c). d, Differential gene expression in EnS in the context of endometrioma, eutopic endometrium or endometriosis (log2 FC ≥ 0.8, P < 0.05). Two-sided differential expression analyses were performed using MAST, with P values adjusted using the Benjamini–Hochberg method. e, Pathway analysis, EnS in the context of endometrioma, eutopic endometrium or endometriosis. Pathway analyses were performed using the Reactome R package, with P values calculated based on a hypergeometric model and a Bonferroni correction applied. f,g, Frequencies of proliferative and secretory EnS during the menstrual cycle in eutopic (f) and ectopic (g) endometrium. h, Spatial transcriptomic analysis, expression of marker genes from mesenchymal subpopulations across a peritoneal specimen containing three foci of endometriosis (see Fig. 3). i, Heterogenous expression of mesenchymal markers across clusters derived from spatial transcriptomic analyses of endometriosis-positive peritoneum. Fibroblast, XXX.
Signatures of deep and superficial peritoneal endometriosis
Peritoneal lesions were categorized as deep infiltrating (n = 11) and superficial (n = 12) endometriosis, respectively. There was no evidence that cellular composition differed by subtype (Supplementary Note), but within superficial lesions, endometrial-type epithelium (627 cells) overexpressed CRIP1 and IGFBP7 and was enriched for translation-associated pathways that likely reflect a secretory phenotype. Within deep lesions, the same cell type overexpressed imprinted gene KCNQ1OT1, keratins 17 and 18, Interferon Alpha Inducible Protein 27 (IFI27) and mitochondrial genes (MT-ND4, MT-CO1), and was enriched for nerve growth factor, neurotrophic tyrosine receptor kinase and estrogen signaling pathways (Fig. 6a,b and Supplementary Tables 21 and 22). EnS associated with deep endometriosis overexpressed C3, apolipoprotein D (APOD), complement factor H (CFH) and angiopoietin-like 7 (ANGPTL7) (Fig. 6c). EnS of deep lesions was enriched for pathways associated with complement signaling and glycosaminoglycan metabolism, the latter likely reflecting mechanisms of enhanced fibrosis in deep lesions (Fig. 6d and Supplementary Tables 23 and 24).
Fig. 6 |. Molecular signatures of deep and superficial peritoneal endometriosis.
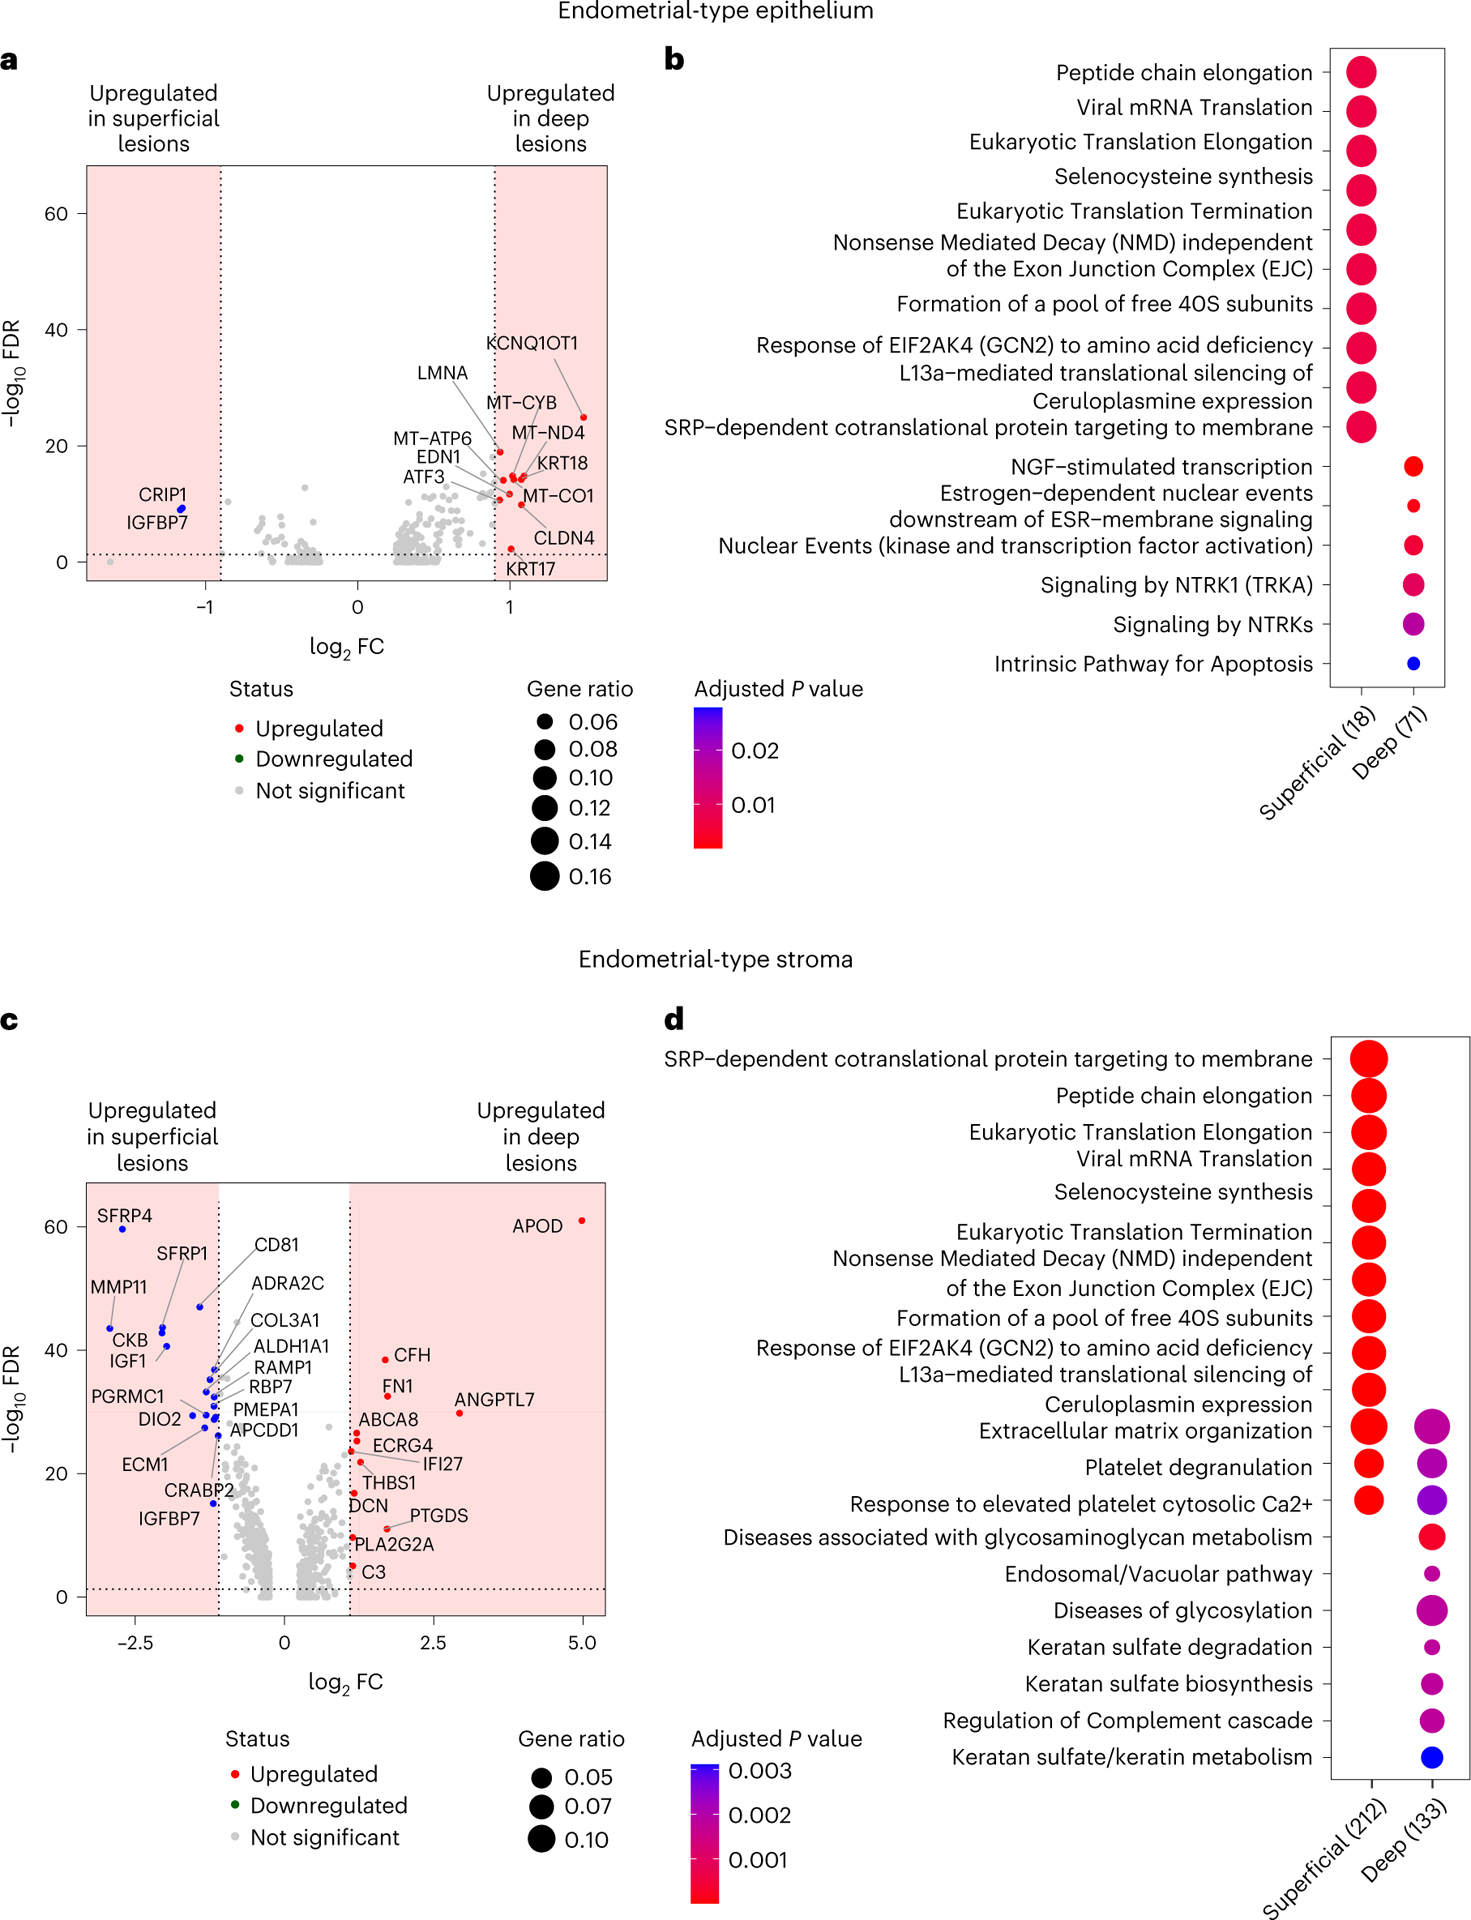
a,b, DEGs (log2 FC ≥ 0.9, P < 0.05, dashed line and shaded area) (a) and pathway enrichment (b) in endometrial-type epithelial cells associated with deep or superficial endometriosis. c,d, DEGs (log2 FC ≥ 1.1, P < 0.05, dashed line and shaded area) (c) and pathway enrichment (d) in EnS associated with deep or superficial endometriosis. Two-sided differential expression analyses were performed using MAST, with P values adjusted using the Benjamini–Hochberg method. Pathway analyses were performed using the Reactome R package, with P values calculated based on a hypergeometric model and a Bonferroni correction applied.
Endometriosis signatures in endometriosis-associated OCs
Endometrioid and clear cell ovarian carcinomas arise in association with endometriosis, suggesting that endometrial-type epithelial cells may be precursors for these tumors. We implemented multi-subject single-cell deconvolution (MuSiC)20 to test whether cluster-specific signatures of endometrial-type epithelium were enriched in these tumor types. Across three independent datasets, clear cell and endometrioid ovarian cancers21–23 consistently showed a strong enrichment of signatures for ciliated endometrial-type epithelial cells compared with the other keratin-positive clusters (Fig. 7a–c). By contrast, high-grade serous ovarian cancers, an epithelial ovarian tumor type which is not thought to primarily originate from endometriosis epithelial cells24,25, showed no pattern for preferential enrichment of any epithelial cluster (Fig. 7d).
Fig. 7 |. Deconvoluting endometriosis-associated ovarian cancers with singlecell endometriosis signatures.
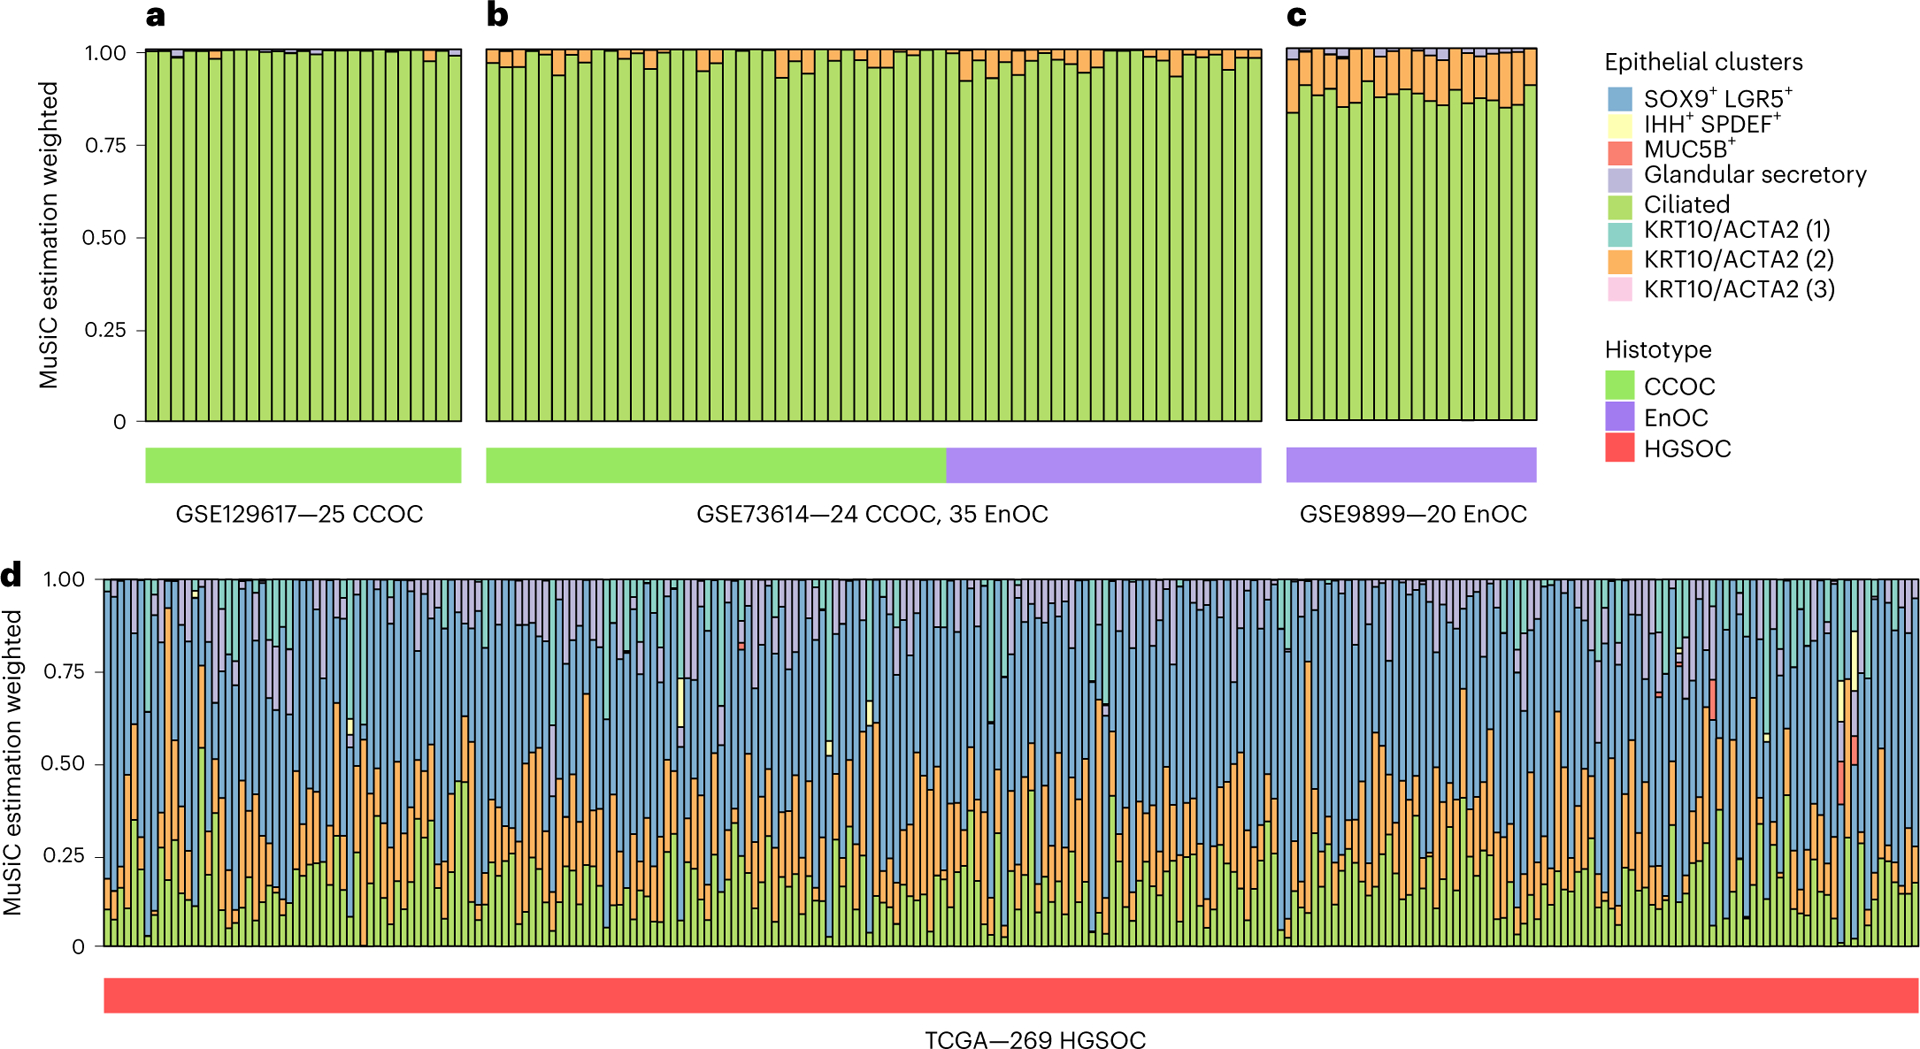
a–c, Deconvolution of 25 clear cell ovarian cancers (CCOCs) (24 primary tumor specimens, 1 ascites sample) (a), 24 CCOC and 35 endometrioid ovarian cancer (EnOC) tumors (b) and 14 EnOCs (c) based on signatures of 8 epithelial subclusters. d, Deconvolution of 269 high-grade serous ovarian cancers using the same epithelial subclusters. The color keys for epithelial clusters are shared across all panels. HGSOC, high-grade serous ovarian cancer; TCGA, The Cancer Genome Atlas.
Discussion
Endometriosis is a common but poorly studied condition. We generated a cellular atlas of endometriosis, altogether analyzing over 400,000 individual cells from 21 patients and cataloging the epithelial component plus the microenvironmental stromal cells and immune cells that play active roles in endometriosis pathogenesis. First, we asked whether the molecular profiles of endometrial-type epithelium and stroma differ by site and observed striking differences in gene expression by context, adding to a growing body of literature to support that endometriomas and peritoneal lesions are two distinct disease entities. Genes specifically upregulated by endometrial-type epithelium or stroma included cell surface and/or secreted proteins such as MUC1, MGP and ITM2B which may potentially be useful as biomarkers, should they be quantifiable in the blood. We also noted convergent expression of genes and pathways in endometrial-type epithelium and stroma in the context of endometrioma or extra-ovarian endometriosis and also in comparisons of deep and superficial peritoneal lesions, consistent with a recent multi-organ analysis of structural cells that highlighted pervasive organ-specific patterns of gene expression26. In some patients, not only was epithelial and stromal gene expression coordinated, but also cellular composition of lesions was highly correlated across sites, potentially reflecting clonal expansion of endometriosis epithelium, which has also been observed through DNA-based analyses27–29.
Both endometrial-type epithelium and stroma exhibited greater activation of complement signaling in the context of endometriomas, with complement proteins C3 and C7 expressed by both cell types, indicative of dysregulated innate immunity. This may be due to elevated apoptosis in the hypoxic microenvironment in an endometrioma, since cells undergoing apoptosis can activate the complement pathway, where dying cells opsonized by complement components help phagocytic cells such as macrophages dispose of the apoptotic debris. Levels of C3 pathway components are known to be altered in serum and peritoneal fluid from women with endometriosis compared with controls30–32, which may result in augmented signaling through the B cell receptor33. High expression of critical B-cell signaling molecules BST2/CD317 and CXCL12 on EnS associated with endometrioma may contribute to altered innate immunity in this context specifically.
Superficial peritoneal disease and deep infiltrating endometriosis are proposed to represent two disease subtypes, and these categories are widely used in endometriosis research34. We asked whether these subtypes were supported by the cellular and molecular profiles of peritoneal endometriosis categorized as deeply infiltrating or superficial. The overall cellular landscape of endometriosis was not significantly associated with deep/superficial status, fibrosis or hemorrhage, although we were powered only to detect very strong effects. We also note that other factors, such as lesion age, are challenging to determine but could impact lesion composition independently of subtype. Both endometrial-type epithelial cells and fibroblasts exhibited marked differential gene expression associated with deep or superficial status. These results are consistent with recent genomic analyses28 which suggest that deep and superficial disease are parts of the same disease continuum; transcriptional plasticity potentially enables endometrial-type epithelium and stroma to transition between these two disease states. Within deeply infiltrative lesions, epithelial cells upregulated nerve growth factor signaling pathways, supporting a role for epithelial cells in promoting innervation of deep lesions, and highlighting this population as critical for therapeutic targeting35,36.
There are caveats to this study. With an overall cohort size of 21 patients, we were underpowered to test for confounding effects of age or to identify associations between molecular features and clinical symptoms or outcomes. While we were able to characterize responses to endogenous and exogenous steroid hormones on the most hormone responsive cell types, endometrial-type epithelium and stroma, larger studies in the future will be needed to fully dissect the impact of the hormonal milieu on all the cell types present within lesions. In addition, the diagnostic components of endometriosis were a minor population in most samples, in some samples composing under 1% of cells profiled. Nonetheless, the majority of the key findings from this analysis were stable across iterations of the analysis with increasing sample size, and we observed that endometrial-type epithelium, stromal and fibroblast populations in this study were consistent with other recent analyses of eutopic endometrium and endometriosis6,8,37–39. Representative ‘normal’ tissue from women with and without endometriosis is challenging to obtain and therefore underrepresented in this study, particularly uninvolved peritoneum. We were able to include four samples from two endometriosis patients where no endometriosis was detected upon pathologic review; however, in these specimens we detected endometrial-type epithelium and stroma, plus activation of stress response and heme degradation pathways in the mesothelial cells, suggesting the portion of the tissue used for scRNA-seq did indeed contain endometriosis tissue. While scRNA-seq is unlikely to have utility as a diagnostic tool, this illustrates the challenge of obtaining a pathologic confirmation of endometriosis, particularly in cases with only a few small lesions suspected at laparoscopy which may be ‘missed’ upon pathologic review due to intrinsic limitations of the embedding and sectioning processes.
Endometriosis research has been substantially hindered by challenges in generating global molecular profiles of tissues. This single-cell atlas of endometriosis therefore represents a valuable and timely resource for the endometriosis research community, as well as for the study of endometriosis-associated ovarian cancers. Continued large-scale somatic profiling efforts are clearly warranted, as these data indicate that endometrioma and peritoneal endometriosis represent different subtypes which will likely require different approaches to treatment and diagnosis.
Methods
Resource availability
This study did not generate new unique reagents.
This project was performed with approval of the Institutional Review Board at Cedars-Sinai Medical Center. All 21 patients provided informed consent. Patients did not receive any financial compensation for participating in this research.
Surgical and pathologic review
Patients were evaluated by the surgeon, with a detailed history and physical taken as well as all imaging reviewed, resulting in indication for surgical management. Surgery was performed either laparoscopically or robotically, with identification and excision of any obvious or suspected lesions, using either ultrasonic or monopolar energy. Wide margins were attempted for each excision. For example, a lesion in the ovarian fossa would lead to the full peritoneum in the ovarian fossa being removed. Deep infiltrating endometriosis resections were performed until normal anatomy was restored, leaving the endometriosis lesion intact. Ureterolysis and mobilization of the rectosigmoid colon were performed when necessary. Each area of excision was individually labeled and sent to the pathology laboratory for routine processing and collection of tissue for research. All patients were born with gynecologic reproductive organs. Tissues were bisected, with half processed into individual viable cells, and half formalin-fixed and paraffin-embedded (FFPE). Sections of FFPE tissues were stained by hematoxylin and eosin (H&E) for pathology review. Examination of five deeper H&E sections cut at 50-μm intervals was performed in all cases in which endometriosis was not identified in the first H&E section. Additional information on pathology protocols can be found in the Supplementary Note.
Tissue processing
Human endometriosis, endometrial or ovarian tissues were placed in sterile serum-free MEM at 4 °C and transferred to the tissue culture laboratory. Tissues were minced into ~1–2-mm pieces and digested with 1× Collagenase/Hyaluronidase (STEMCELL Technologies) and 100 μg ml−1 DNase I (Sigma Aldrich) in 7 ml of serum-free MEM. The sample was incubated at 37 °C with constant rotation for 90 min. The supernatant was collected, and the cell suspension was spun at 300g for 10 min at 4 °C. To lyse red blood cells, the cell pellet was resuspended in a red blood cell lysis buffer (0.8% NH4Cl, 0.1% KHCO3, pH 7.2) and incubated for 10 min at room temperature. Cell suspensions were spun again at 300g for 10 min at 4 °C and the cell pellet was resuspended in PBS, or, if >5% dead cells were observed by trypan blue staining, cells were resuspended in dead cell removal buffer (Miltenyi Biotech) and dead cell removal was performed according to the manufacturer’s instructions.
Remaining cells were used directly for scRNA-seq or were frozen in 90% fetal bovine serum with 10% dimethylsulfoxide in a Mr. Frosty container placed at −80 °C. Frozen cell vials were placed in LN2 for long-term storage. Cells were thawed and transferred into a conical tube with 7 ml of serum-free medium and then spun at 300g for 10 min at 4 °C. The cell pellet was resuspended in 100 μl of PBS. Cells were counted using a hemocytometer and the sample volume adjusted to achieve a cell concentration between 100 per μl and 2,000 per μl.
Single-cell capture, library preparation and next-generation sequencing
Single cells were captured and barcoded using the 10X Chromium platform (10X Genomics). scRNA-seq libraries were prepared following the instructions from the Chromium Single Cell 3ʹ Reagent Kits User Guide (v2 or v3). Briefly, Gel Bead-In EMulsions (GEMs) were generated using single-cell preparations. After GEM-RT and cleanup, the complementary DNA from barcoded single-cell RNAs was amplified before quantification using Agilent Bioanalyzer High Sensitivity DNA chips. The single-cell 3′ gene expression libraries were constructed and cDNA corresponding to an insertion size of around 350 bp selected. Libraries were quantified using Agilent Bioanalyzer High Sensitivity DNA chips and pooled together to get similar numbers of reads from each single cell before sequencing on the NovaSeq S4 (Novogene).
Single-cell data processing and filtering
Raw reads were aligned to the hg38 reference genome, and UMI (unique molecular identifier) counting was performed using the Cell Ranger v.3.1.0 (10X Genomics) pipeline with default parameters. In addition to the 49 samples described in this study, 3 more specimens were also profiled but failed quality control—a normal ovary specimen from patient 3 was excluded due to a low fraction of reads in cells (sample proportion: 35.3%; ideal fraction: >70%); a left pelvic side wall specimen from patient 10 was removed due to a low fraction of reads mapped to the transcriptome (sample proportion: 17.0%; ideal fraction: >30%) and a low fraction of reads in cells (sample proportion: 38.7%; ideal fraction: >70%); and a right uterosacral ligament specimen from patient 20 was removed due to low fraction of reads mapped to the transcriptome (sample proportion: 12.5%; ideal fraction: >30%). For each individual sample we removed cells with high mitochondrial content (>20%) and cells with less than 200 genes. This reduced the number of cells in the dataset from 432,751 to 382,624. We then applied a conservative approach to doublet removal, selecting the best performing tools from a recent study that benchmarked the performance of multiple doublet removal40. We identified doublets using three tools: (1) DoubletFinder v.2.0.3 (ref. 41), following the expected percentage of doublets for each sample (0.8% per 1,000 cells); (2) scrublet v.0.2.2 (ref. 42), considering an expected_doublet_rate of 0.08; and (3) DoubletDetection v.3.0 (ref. 43). This resulted in 373,851 single cells for analysis. Combined Seurat v.3.2 objects were adjusted for bias, aiming to remove confounding factors which are potential sources of variation. We considered: sequencing batch, number of reads, mitochondrial mapping percentage and sample as parameters for Seurat SCTransform function. We applied the CellCycleScoring Seurat procedure to check whether genes related to cell cycle were guiding the PCs and found that none of the 20 first PCs had cell cycle genes within the top 20 positive and negative genes, and so cell cycle regression was not performed. To integrate the samples we used Harmony v.0.1.0 (ref. 5), with lambda = 0.2, to reduce technical batch effects. We then used the reduced Seurat object to define an initial cluster considering Seurat’s FindNeighbors (using 25 dimensions as parameter) and FindClusters function with a resolution of 3. Differential expression analysis was performed using MAST v.1.22.0. Pathway analysis was performed using Cluster profiler R package v.4.4.2.
Visium spatial transcriptomics
Two peritoneal endometriosis samples were collected and frozen in an isopentane bath in liquid nitrogen. BEME346 is a peritoneal lesion from a 34-yr-old patient who underwent laparoscopic surgery for endometriosis 28 d after the last menstrual period; BEME355 is a peritoneal lesion from a 51-yr-old patient who underwent surgery 57 d after her last menstrual period. Neither patient was taking exogenous hormones at the time of surgery. H&E-stained slides were made and reviewed to confirm the presence of endometriosis lesions. Tissue sections were cut by pathology intraoperative consult staff onto Visium slides according to the 10X Genomics Visium spatial tissue preparation guide. Slides were processed by Cedars-Sinai Applied Genomics, Computation and Translational Core. Alignment and quality control were performed using Space Ranger (v.1.2.1). Loupe browser was used for uniform manifold approximation and projection (UMAP) and to generate images.
Identification of major cell types and epithelial subgroups
To define the major cell type for each cluster we divided our procedures in two steps. In step one we performed differential expression analysis (one versus all) using MAST44, implemented in the FindAllMarker and FindMarker functions in Seurat. Then, we checked the presence of the following marker genes for global annotation of cell types that were differentially expressed at log2 FC 0.2 and adjusted P value 0.05: epithelial cells (EPCAM, KRT8, KRT18, KRT19, KRT7, KRT10), mesenchymal cells (DCN, COL11A2, FAP, PDGFRA, COL11A1, COL1A1, PDGFRB), myeloid cells (LYZ, CD14, MME, C1QA, CLEC10A), endothelial cells (CLDN5, PECAM1, CD34, ESAM), plasma cells (JCHAIN plus CD79A), B cells (JCHAIN), smooth muscle cells (ACTA2), mast cells (TPSB2), erythrocytes (HBB, GYPA), T cells (CD2, CD3D, CD3E, CD3G, CD8A, CCL5) and natural killer cells (TYROBP, FCGR3A). For each cluster we build a matrix of DEGs by normalizing each count with the total markers in each cell type (Extended Data Fig. 1). To assign the cell type based on the matrix of DEG counts we applied the following rules. First, clusters that only had cell-type-specific genes for one cell type contained within the DEG list were assigned to the corresponding cell type. If the cluster i had >35% of the cells expressing at least one keratin gene and the average of scaled expression was greater than 1, then the epithelial cell type was assigned to cluster i. If the cluster i had multiple cell-type markers contained within the DEG list, we first checked whether ACTA2 was expressed, and if so we checked whether the proportion of mesenchymal markers was greater than 25%, and then assigned the cluster i as mesenchymal cells or otherwise as smooth muscle cells. In instances where we had multiple markers but no ACTA2, we then checked which marker had the maximum proportion and assigned the correspondent cell type to cluster i, or if the multiple markers had the same proportion, we skipped the assignment for cluster i. Clusters with no counts for marker genes were also not assigned a cell type with this decision tree.
The next step aimed to identify cell types for the clusters that did not express canonical patterns of expression of known cell-type-specific genes. We used the 108 clusters for which we could successfully assign a cell type in step one as a reference panel. We selected up to 100 of the top-ranked DEGs (log2 FC > 0; P < 0.05) for each cluster to calculate pairwise Pearson correlations across all clusters (to create a union set of 2,146 genes). Six clusters with no cell markers were assigned the identity associated with the most correlated cell type with known identity. Cellular transcriptomes of cells in C1 (Cluster 1) correlated with cells in C2—mesenchymal cells (r = 0.89, Pearson correlation); C9 correlated with C63—epithelial cells (r = 0.83); C15 correlated with C22—T/natural killer cells (r = 0.81); C46 correlated with C51—smooth muscle cells (r = 0.55); C101 correlated with C1—mesenchymal cells (r = 0.71); C113 correlated with C48—mesenchymal cells (r = 0.79) (Extended Data Fig. 1 and Supplementary Table 6). UMAP45 was used for visualizing cell types and clusters with representative markers. Cryopreservation did not have a significant impact on gene expression (Extended Data Fig. 1k).
Epithelial and mesenchymal subgroup analyses
Epithelial and fibroblast clusters were identified from the parent clusters and analyzed in isolation. For each major cell type, we excluded clusters if >90% of cells in that cluster came from a single patient. We defined the cell clusters considering Seurat’s FindNeighbors (using 20 dimensions as parameter) and FindClusters function with a resolution of 0.5. Any clusters that did not express canonical marker genes (keratins for epithelial cells; DCN and or COL1A1 for mesenchymal cells) were excluded from the relevant analyses. This removed 11 clusters (23,543 cells) from the epithelial analysis and 1 cluster (383 cells) from the mesenchymal analysis. Pathway analyses were performed with Reactome. Test P values were adjusted for multiple testing using the Benjamini–Hochberg method for false-discovery rate estimation46. For analysis of genes associated with somatic mutations, genes associated with class were removed to minimize the impact of this confounding variable. For mesenchymal analyses by menstrual cycle status, the KRT10/ACTA2 clusters defined as EnS were also included.
Immunohistochemistry for ARID1A, CAPS and SOX17
Immunohistochemistry assays for ARID1A were performed on 5-μm tissue sections on Superfrostplus slides and used as a surrogate for somatic loss-of-function alterations following established standards for staining and scoring47. ARID1A staining was performed on a Leica Bond Rx (Leica Biosystems) using rabbit monoclonal antibody EPR13501 (Abcam) at 1:3,000 dilution. Slides were scored by pathologist A.E.-N., and assessed for (loss of) nuclear staining in epithelium with retained stromal nuclear staining serving as an obligate internal control. CAPS staining was performed using HPA043520 (Sigma Aldrich) at a 1:5,000 dilution and SOX17 staining was performed using goat polyclonal antibody AF1924 (R&D Systems). SOX17 and CAPS staining was performed on a Ventana Discovery Ultra autostainer (Roche Ventana). CAPS- and SOX17-stained slides were scored by pathologist F.M. For SOX17 the proportion of positively stained epithelium was estimated, and the predominant straining intensity categorized as negative, weak, moderate or strong.
KRAS mutation testing by ddPCR
Endometrial glands and stroma were enriched from 10% dilute H&E-stained, 5–7-μm sections by needle macrodissection with a 20-gauge needle. DNA was then extracted using the Arcturus PicoPure DNA Extraction Kit (Thermo) and quantified using the Qubit 2.0 Fluorometer (Thermo). Then, 2 ng of DNA was preamplified from the KRAS G12 codon region in a 20-μl reaction volume with TaqMan Genotyping Mastermix (Thermo); forward and reverse KRAS primers (IDT; Supplementary Table 25). The following preamplification conditions were used: 95 °C for 10 min; 10 cycles of 94 °C for 30 s, 60 °C for 4 min, on an AC4 thermal cycler (FroggaBio). Fivefold diluted preamplified DNA was used in multiplex ddPCR and subsequently individual-variant ddPCR for validation (if positive). All ddPCR reactions used the same flanking primers and ddPCR Supermix for Probes (no dUTP; Biorad) in a 25-μl reaction volume, with cycling parameters: 95 °C for 10 min, followed by 40 cycles of 94 °C for 30 s, 60 °C for 90 s, on an AC4 thermal cycler (FroggaBio). Droplets were generated on the BioRad QX200 Automated Droplet Generator and read on the Biorad QX200 Droplet Reader. Multiplex ddPCR included an equimolar mix of probes for KRAS G12C/D/R and was used for detection of KRAS G12C/D/R/V/A/S based on counts and cluster position of fluorescence signal. Any positive multiplex assay was then validated with individual-variant ddPCR reactions (see Supplementary Table 25 for probes).
The following limits of detection thresholds were applied in the multiplex assay: variant allele frequency threshold for KRAS G12C/D/R/A/S allele needed to be 3× average of negative control reactions for the given allele. For KRAS G12V, variant allele frequency was required to be 1× average of negative controls. For individual allele variants, ddPCR 3× average of negative control reactions was used universally as the minimum detection threshold.
Deconvolution analysis using MuSiC
To compare the profile of bulk tumor tissues and the histologic components present in each specimen of this study, we used the MuSiC method20. First, we selected all epithelial cells present in endometrioma, endometriosis and eutopic endometrium specimens. The gene signature was based on the 15,557 common genes expressed in both scRNA-seq and bulk RNA datasets. We downloaded datasets from GEO: GSE129617: 24 primary tumors and 1 ascites sample; GSE73614: 24 clear cell and 35 endometrioid tumors; GSE9899 (n = 285): we selected 20 endometrioid samples. In addition, 269 high-grade serous ovarian cancer samples were downloaded from The Cancer Genome Atlas consortium.
Statistics and reproducibility
No statistical method was used to predetermine sample size and investigators were not blinded to the sample annotation. Samples were only excluded from the analysis if they failed to pass quality control, as detailed above. Review of H&E and immunohistochemical stains was performed by one expert gynecologic pathologist, with consultation with two other specialist pathologists. Each specimen was stained once, alongside internal negative and positive control tissues.
Extended Data
Extended Data Fig. 1 |.
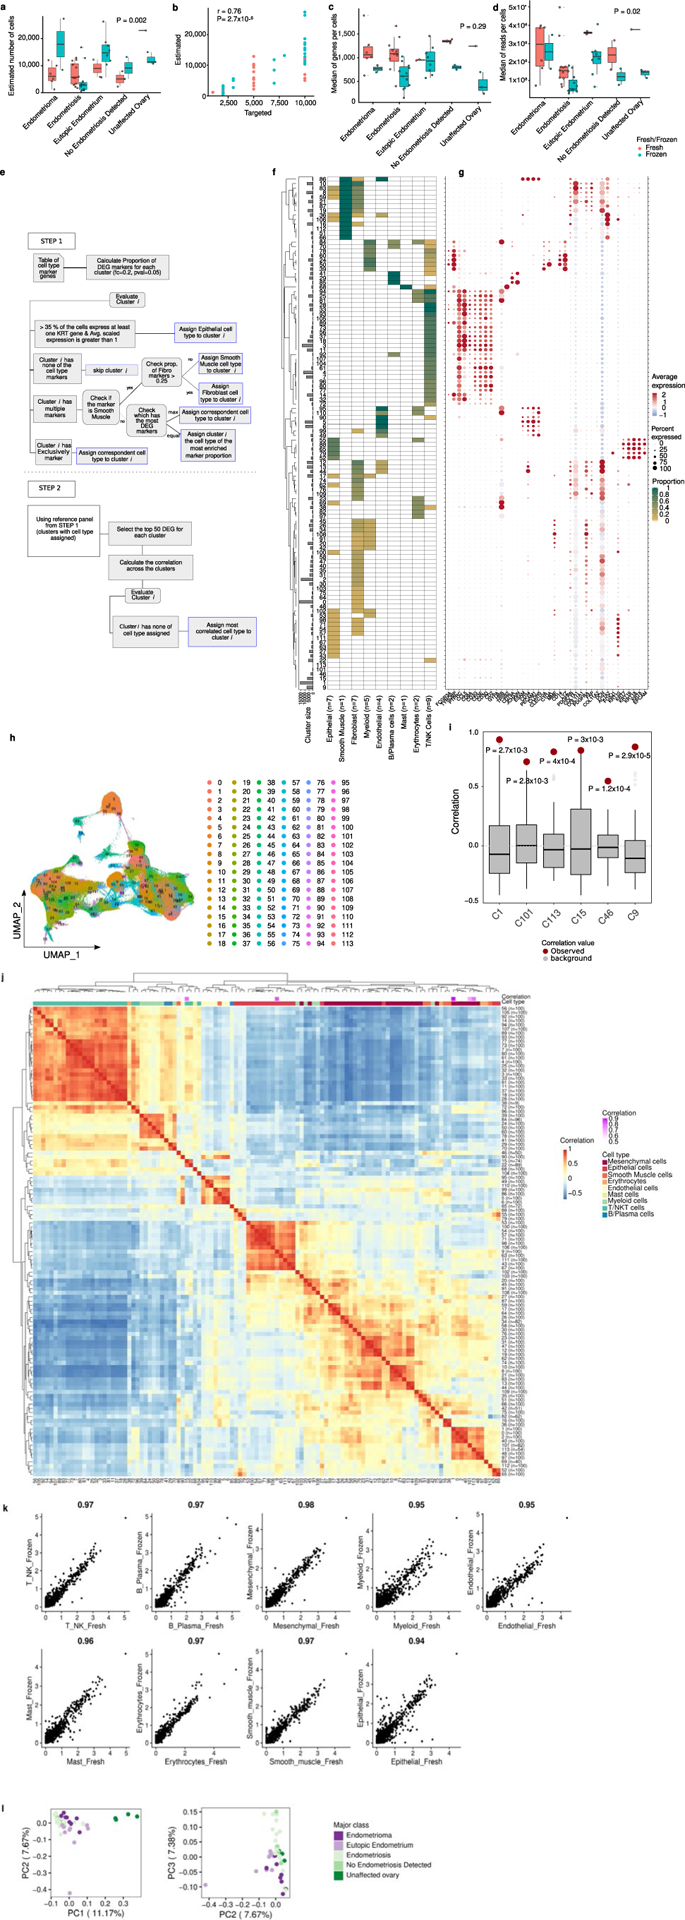
Quality control metrics and cell annotation procedures. (a) The number of genes detected per cell is not significantly different across the major classes of study, nor by fresh/frozen status. (b) Observed cell number is positively correlated with observed cell number (Pearson correlation and Analysis of Variance). (c) The number of cells passing QC filters and (d) the number of reads per cell is not significantly different across the major classes of study, nor by fresh/frozen status. Coral color denotes samples that were processed immediately - ‘Fresh’; teal denotes samples that were processed into single cells and viably cryopreserved and thawed before capture - ‘Frozen’. Number of samples in (a, b and d) – endometrioma, fresh = 6, frozen = 2; endometriosis, fresh = 12, frozen = 11; eutopic endometrium, fresh = 2, frozen = 8; no endometriosis detected, fresh = 2, frozen = 2; unaffected ovary, fresh = 1, frozen = 3. (e) Decision tree showing workflow for cell type assignment. Black boxes indicate action/processes, blue boxes indicate cell-type assignment endpoints. (f) Heatmap showing expression of cell-type specific markers, by cluster. Expression is scaled between 0–1. Possible cell type assignments are indicated by column labels with the number of cell-type specific genes for each cell type indicated in brackets. For a list of marker genes see Methods and panel (g). (g) Expression of cell-type specific markers across the 96 clusters. (h) UMAP plot with 114 clusters (using Seurat shared nearest neighbor (SNN) for cluster identification considering resolution parameter of 3). (i) Correlation values for pair-wise comparisons of the 6 unassigned clusters compared to a background distribution of correlation values for 100 pairs of clusters selected at random, red dots indicate the correlation value used for cell type assignment. ( j) Pearson’s correlation between clusters, based on expression of a union set of 1,960 genes differentially expressed by one or more cluster (log2 FC > 0; p <0.05). Clusters with no cell markers were assigned the identity associated with the most correlated cell type with known identity (see Methods). (k) Correlation of gene expression across major cell types, comparing fresh and cryopreserved specimens. Correlation values shown above each plot, Pearson’s correlation. (l) Principal component analysis based on cell-type composition of endometriosis and control tissues. In the box and whisker plots shown in (a,c,d,i), boxes denote the interquartile range, bar denotes median. The limits of the whiskers represent 1.5 * IQR (interquartile range) and outlier values are indicated with individual dots. Red dots denote the correlation value for expression in the given cluster compared to the cluster used to assign identity.
Extended Data Fig. 2 |. Additional results, analysis of epithelial subgroups by ARID1A and KRAS mutation status.
(a) Cluster frequency for eutopic endometrial epithelial clusters with inclusion of patients taking exogenous hormones. (b) Visium analysis of an endometriosis lesion from patient BEME355. (c) ARID1A and KRAS expression across epithelial subtypes. (d) Clusters present in BEME355 and expression of key genes. (e) UMAP of endometrial-type epithelial cells by ARID1A protein expression status, (f) UMAP of cells by KRAS mutation status. UMAP structure from 3A. (g) Pathways enriched in lesions with endometrial-type epithelium exhibiting heterogeneous and homogenous positive staining for ARID1A. (h) Pathways enriched in KRAS mutant and wildtype endometrial-type epithelium. Pathway analyses were performed using the Reactome R package, with p-values calculated based on a hypergeometric model and a Bonferroni correction applied.
Supplementary Material
Acknowledgements
Some of the specimens were collected as part of the Biologic and Epidemiologic Markers of Endometriosis (BEME) study. We thank all the patients who donated the specimens used in this study, and the team at the Biobank and Translational Research Laboratory who supported tissue procurement and histologic analyses, plus the Cedars-Sinai Applied Genomics, Computation and Translational core. We thank C. Chow and M. Ta at the Genetic Pathology Evaluation Centre (GPEC) for technical support for the mutation analyses. This study was supported in large part by a Leon Fine Translational Science Award from Cedars-Sinai Medical Center. K.L. is supported by a Liz Tilberis Early Career Award (grant no. 599175) and a Program Project Development grant (no. 373356) from the Ovarian Cancer Research Alliance, plus a Research Scholar’s Grant from the American Society (grant no. 134005). The research described was supported in part by the National Institutes of Health (NIH)/National Center for Advancing Translational Science (NCATS) UCLA CTSI Grant no. UL1TR001881 and in part by Cedars-Sinai Cancer, a Canadian Cancer Society Research Institute Impact grant (no. 705647, to D.G.H.) and a Canadian Institutes of Health Research Foundation grant (to D.G.H.). M.S.A. receives funds through the Canadian Institutes of Health Research (Early Career Investigator Grant in Maternal, Reproductive, Child & Youth Health), a Michael Smith Foundation for Health Research Scholar Award and the Janet D. Cottrelle Foundation Scholars program (managed by the BC Cancer Foundation). The GPEC receives core support from BC’s Gynecological Cancer Research team (OVCARE), and The VGH + UBC Hospital Foundation. Y.W. is a recipient of the North Family Health Research Award (administered by the VGH + UBC Hospital Foundation). M.D.P. is a recipient of grants from the NIH/National Institute of Biomedical Imaging and Bioengineering (NIBIB; grant no. U01NIBIB12482404) and NIH/National Institute of Allergy and Infectious Diseases (NIAID) (grant no. R01AI154535). The content of the manuscript is solely the responsibility of the authors and does not necessarily represent the official views of the NIH.
Footnotes
Online content
Any methods, additional references, Nature Portfolio reporting summaries, source data, extended data, supplementary information, acknowledgements, peer review information; details of author contributions and competing interests; and statements of data and code availability are available at https://doi.org/10.1038/s41588-022-01254-1.
Code availability
Scripts for the downstream analysis of the single-cell data are available on GitHub (https://github.com/lawrenson-lab/AtlasEndometriosis) and through Zenodo https://doi.org/10.5281/zenodo.6974609.
Competing interests
The authors declare no competing interests.
Extended data is available for this paper at https://doi.org/10.1038/s41588-022-01254-1.
Supplementary information The online version contains supplementary material available at https://doi.org/10.1038/s41588-022-01254-1.
Data availability
The data generated during this study are available at NCBI GEO under accession number GSE213216 and can also be accessed through https://github.com/lawrenson-lab/AtlasEndometriosis.
References
- 1.Sainz de la Cuesta R et al. Histologic transformation of benign endometriosis to early epithelial ovarian cancer. Gynecol. Oncol 60, 238–244 (1996). [DOI] [PubMed] [Google Scholar]
- 2.Lee AW et al. Evidence of a genetic link between endometriosis and ovarian cancer. Fertil. Steril 105, 35–43.e1 (2016). [DOI] [PMC free article] [PubMed] [Google Scholar]
- 3.Pearce CL et al. Association between endometriosis and risk of histological subtypes of ovarian cancer: a pooled analysis of case-control studies. Lancet Oncol. 13, 385–394 (2012). [DOI] [PMC free article] [PubMed] [Google Scholar]
- 4.Lu Y et al. Shared genetics underlying epidemiological association between endometriosis and ovarian cancer. Hum. Mol. Genet 24, 5955–5964 (2015). [DOI] [PMC free article] [PubMed] [Google Scholar]
- 5.Korsunsky I et al. Fast, sensitive and accurate integration of single-cell data with Harmony. Nat. Methods 16, 1289–1296 (2019). [DOI] [PMC free article] [PubMed] [Google Scholar]
- 6.Tan Y et al. Single-cell analysis of endometriosis reveals a coordinated transcriptional programme driving immunotolerance and angiogenesis across eutopic and ectopic tissues. Nat. Cell Biol 24, 1306–1318 (2022). [DOI] [PMC free article] [PubMed] [Google Scholar]
- 7.Xu C et al. Modeling the temporal dynamics of master regulators and CtrA proteolysis in Caulobacter crescentus cell cycle. PLoS Comput. Biol 18, e1009847 (2022). [DOI] [PMC free article] [PubMed] [Google Scholar]
- 8.Wang W et al. Single-cell transcriptomic atlas of the human endometrium during the menstrual cycle. Nat. Med 26, 1644–1653 (2020). [DOI] [PubMed] [Google Scholar]
- 9.Garcia-Alonso L et al. Mapping the temporal and spatial dynamics of the human endometrium in vivo and in vitro. Nat. Genet 53, 1698–1711 (2021). [DOI] [PMC free article] [PubMed] [Google Scholar]
- 10.Cindrova-Davies T et al. Menstrual flow as a non-invasive source of endometrial organoids. Commun. Biol 4, 651 (2021). [DOI] [PMC free article] [PubMed] [Google Scholar]
- 11.Anglesio MS et al. Cancer-associated mutations in endometriosis without cancer. N. Engl. J. Med 376, 1835–1848 (2017). [DOI] [PMC free article] [PubMed] [Google Scholar]
- 12.Suda K et al. Clonal lineage from normal endometrium to ovarian clear cell carcinoma through ovarian endometriosis. Cancer Sci. 10.1111/cas.14507 (2020). [DOI] [PMC free article] [PubMed] [Google Scholar]
- 13.Lac V et al. Iatrogenic endometriosis harbors somatic cancer-driver mutations. Hum. Reprod 34, 69–78 (2019). [DOI] [PMC free article] [PubMed] [Google Scholar]
- 14.Sweet-Cordero A et al. An oncogenic KRAS2 expression signature identified by cross-species gene-expression analysis. Nat. Genet 37, 48–55 (2005). [DOI] [PubMed] [Google Scholar]
- 15.Suryo Rahmanto Y et al. Inactivation of Arid1a in the endometrium is associated with endometrioid tumorigenesis through transcriptional reprogramming. Nat. Commun 11, 2717 (2020). [DOI] [PMC free article] [PubMed] [Google Scholar]
- 16.Reddy J et al. Predicting master transcription factors from pan-cancer expression data. Sci. Adv 7, eabf6123 (2021). [DOI] [PMC free article] [PubMed] [Google Scholar]
- 17.Chaves-Moreira D et al. The transcription factor PAX8 promotes angiogenesis in ovarian cancer through interaction with SOX17. Sci. Signal 15, eabm2496 (2022). [DOI] [PMC free article] [PubMed] [Google Scholar]
- 18.Dinh HQ et al. Single-cell transcriptomics identifies gene expression networks driving differentiation and tumorigenesis in the human fallopian tube. Cell Rep. 35, 108978 (2021). [DOI] [PMC free article] [PubMed] [Google Scholar]
- 19.Zheng W, Aspelund A & Alitalo K Lymphangiogenic factors, mechanisms, and applications. J. Clin. Invest 124, 878–887 (2014). [DOI] [PMC free article] [PubMed] [Google Scholar]
- 20.Wang X, Park J, Susztak K, Zhang NR & Li M Bulk tissue cell type deconvolution with multi-subject single-cell expression reference. Nat. Commun 10, 380 (2019). [DOI] [PMC free article] [PubMed] [Google Scholar]
- 21.Tan TZ et al. Analysis of gene expression signatures identifies prognostic and functionally distinct ovarian clear cell carcinoma subtypes. EBioMedicine 50, 203–210 (2019). [DOI] [PMC free article] [PubMed] [Google Scholar]
- 22.Tothill RW et al. Novel molecular subtypes of serous and endometrioid ovarian cancer linked to clinical outcome. Clin. Cancer Res 14, 5198–5208 (2008). [DOI] [PubMed] [Google Scholar]
- 23.Winterhoff B et al. Molecular classification of high grade endometrioid and clear cell ovarian cancer using TCGA gene expression signatures. Gynecol. Oncol 141, 95–100 (2016). [DOI] [PMC free article] [PubMed] [Google Scholar]
- 24.Saavalainen L et al. Risk of gynecologic cancer according to the type of endometriosis. Obstet. Gynecol 131, 1095–1102 (2018). [DOI] [PubMed] [Google Scholar]
- 25.Viganó P, Somigliana E, Chiodo I, Abbiati A & Vercellini P Molecular mechanisms and biological plausibility underlying the malignant transformation of endometriosis: a critical analysis. Hum. Reprod. Update 12, 77–89 (2006). [DOI] [PubMed] [Google Scholar]
- 26.Krausgruber T et al. Structural cells are key regulators of organ-specific immune responses. Nature 583, 296–302 (2020). [DOI] [PMC free article] [PubMed] [Google Scholar]
- 27.Suda K et al. Clonal expansion and diversification of cancer-associated mutations in endometriosis and normal endometrium. Cell Rep. 24, 1777–1789 (2018). [DOI] [PubMed] [Google Scholar]
- 28.Praetorius TH et al. Is endometriosis metastasizing? Shared somatic alterations suggest common origins across endometriotic lesions. Preprint at medRxiv 10.1101/2021.04.12.21255355 (2021). [DOI] [Google Scholar]
- 29.Moore L et al. The mutational landscape of normal human endometrial epithelium. Nature 580, 640–646 (2020). [DOI] [PubMed] [Google Scholar]
- 30.Hasan A et al. Serum albumin and C3 complement levels in endometriosis. J. Coll. Physicians Surg. Pak 29, 702–705 (2019). [DOI] [PubMed] [Google Scholar]
- 31.Kabut J, Kondera-Anasz Z, Sikora J & Mielczarek-Palacz A Levels of complement components iC3b, C3c, C4, and SC5b-9 in peritoneal fluid and serum of infertile women with endometriosis. Fertil. Steril 88, 1298–1303 (2007). [DOI] [PubMed] [Google Scholar]
- 32.Rahal D, Andrade F & Nisihara R Insights into the role of complement system in the pathophysiology of endometriosis. Immunol. Lett 231, 43–48 (2021). [DOI] [PubMed] [Google Scholar]
- 33.Ricklin D, Reis ES, Mastellos DC, Gros P & Lambris JD Complement component C3—the ‘Swiss Army Knife’ of innate immunity and host defense. Immunol. Rev 274, 33–58 (2016). [DOI] [PMC free article] [PubMed] [Google Scholar]
- 34.Brosens I, Donnez J & Benagiano G Improving the classification of endometriosis. Hum. Reprod 8, 1792–1795 (1993). [DOI] [PubMed] [Google Scholar]
- 35.García-Solares J, Dolmans M-M, Squifflet J-L, Donnez J & Donnez O Invasion of human deep nodular endometriotic lesions is associated with collective cell migration and nerve development. Fertil. Steril 110, 1318–1327 (2018). [DOI] [PubMed] [Google Scholar]
- 36.Mita S et al. Dienogest inhibits nerve growth factor expression induced by tumor necrosis factor-α or interleukin-1β. Fertil. Steril 101, 595–601 (2014). [DOI] [PubMed] [Google Scholar]
- 37.Queckbörner S et al. Stromal heterogeneity in the human proliferative endometrium—a single-cell RNA sequencing study. J. Pers. Med 11, 448 (2021). [DOI] [PMC free article] [PubMed] [Google Scholar]
- 38.Vento-Tormo R et al. Single-cell reconstruction of the early maternal-fetal interface in humans. Nature 563, 347–353 (2018). [DOI] [PMC free article] [PubMed] [Google Scholar]
- 39.Garcia-Alonso L et al. Mapping the temporal and spatial dynamics of the human endometrium in vivo and in vitro. Preprint at bioRxiv 10.1101/2021.01.02.425073 (2021). [DOI] [PMC free article] [PubMed] [Google Scholar]
- 40.Xi NM & Li JJ Benchmarking computational doublet-detection methods for single-cell RNA sequencing data. Cell Syst. 12, 176–194.e6 (2021). [DOI] [PMC free article] [PubMed] [Google Scholar]
- 41.McGinnis CS, Murrow LM & Gartner ZJ DoubletFinder: doublet detection in single-cell RNA sequencing data using artificial nearest neighbors. Cell Syst. 8, 329–337.e4 (2019). [DOI] [PMC free article] [PubMed] [Google Scholar]
- 42.Wolock SL, Lopez R & Klein AM Scrublet: computational identification of cell doublets in single-cell transcriptomic data. Cell Syst. 8, 281–291.e9 (2019). [DOI] [PMC free article] [PubMed] [Google Scholar]
- 43.Gayoso A, Shor J, Carr AJ, Sharma R & Pe’er D JonathanShor/DoubletDetection: HOTFIX: Correct setup.py installation. Zenodo 10.5281/zenodo.2678041 (2019). [DOI] [Google Scholar]
- 44.Finak G et al. MAST: a flexible statistical framework for assessing transcriptional changes and characterizing heterogeneity in single-cell RNA sequencing data. Genome Biol. 16, 278 (2015). [DOI] [PMC free article] [PubMed] [Google Scholar]
- 45.Becht E et al. Dimensionality reduction for visualizing single-cell data using UMAP. Nat. Biotechnol 37, 38–44 (2018). [DOI] [PubMed] [Google Scholar]
- 46.Yu G & He Q-Y ReactomePA: an R/Bioconductor package for reactome pathway analysis and visualization. Mol. Biosyst 12, 477–479 (2016). [DOI] [PubMed] [Google Scholar]
- 47.Khalique S et al. Optimised ARID1A immunohistochemistry is an accurate predictor of ARID1A mutational status in gynaecological cancers. J. Pathol. Clin. Res 4, 154–166 (2018). [DOI] [PMC free article] [PubMed] [Google Scholar]
Associated Data
This section collects any data citations, data availability statements, or supplementary materials included in this article.
Supplementary Materials
Data Availability Statement
The data generated during this study are available at NCBI GEO under accession number GSE213216 and can also be accessed through https://github.com/lawrenson-lab/AtlasEndometriosis.