Abstract
Triple-negative breast cancer (TNBC) is a subtype of breast cancer with a poor prognosis and limited effective treatment options. Notably, immunotherapy is a potential therapeutic approach for TNBC. This study performed single-cell RNA sequencing on TNBC and found highly expressed CXCL9 in M1 macrophages. An intercellular communication network was found between M1 macrophages and M2 macrophages, and M1 macrophages could differentiate into M2 macrophages over time. Meanwhile, CXCL9 expression started to decrease in association with cell differentiation from M1 macrophages to M2 macrophages. Additionally, the M1 macrophage had strong connections to the M2 macrophage in the MHC-II signaling network. Through GSVA analysis, the MHC-II pathway activity of the M1 macrophages was significantly stronger than that of the M2 macrophages. Furthermore, CXCL9 was enriched in the MHC-II signaling pathway. CXCL9 was significantly enriched in the JAK/STAT signaling pathway. Western blot revealed that CXCL9 overexpression promotes JAK1/STAT2 expression in MDA-MB-231 cells. These findings indicate that CXCL9 is a potential clinical biomarker of prognosis and immunotherapy efficacy for TNBC patients. Also, it stimulates JAK/STAT activity, which in turn modifies the tumor microenvironment.
Supplementary Information
The online version contains supplementary material available at 10.1007/s00262-022-03343-w.
Keywords: Triple-negative breast cancer, CXCL9, Single-cell RNA sequencing, Macrophages, Immunotherapy
Introduction
Triple-negative breast cancer (TNBC) is characterized by the absence of estrogen and progesterone receptors and poor or lack of expression of human epidermal growth factor-2 (HER-2) [1]. TNBC has a worse 5-year prognosis than other breast cancer subtypes due to its high recurrence rate. Currently, primary treatment options include chemotherapy or radiotherapy, which yield unsatisfactory outcomes. The recent approval of PD-1/PD-L1 immunotherapy has improved the treatment of TNBC expressing PD-L1 in 1% of the tumor area [2].
PD-L1 modulates immune responses in cancer cells and provides a mechanism by which cancerous cells evade the immune system [3]. Several studies have investigated PD-L1 protein expression in many tumors. It has been found that PD-L1 protein may serve as a predictive biomarker for responses to anti-PD-1/PD-L1 immunotherapy [4, 5]. Previous studies have shown that PD-L1-positive tumors have a higher objective response rate for immunotherapy than PD-L1-negative tumors [6]. Another study found that PD-L1 expression is higher in TNBC than in other breast cancer types [7]. This suggests that PD-1/PD-L1 antibody treatment may be effective for TNBC patients. However, specific mechanisms driving the effect of PD-L1 on the efficacy of immunotherapy are unknown.
The tumor microenvironment (TME) modulates the response to immunotherapy in cancer patients. The TME primarily consists of tumor cells and tumor-infiltrating immune cells (TIICs). Tumor-associated macrophages (TAMs) are a major component of the TIICs and are classified into two subsets, i.e., M1 and M2 subtypes [8]. The M1 macrophages enhance tumor regression, whereas the M2 macrophages promote tumor progression. The polarization of TAMs from the M2 to the M1 phenotype may enhance cancer immunotherapy. A high M1/M2 macrophage ratio inhibits cancer susceptibility. In addition, disruption of the M1/M2 ratio may provide immunotherapy benefits [9]. M1 macrophages express higher levels of PD-L1 than M2 macrophages, which may influence the efficacy of immunotherapy [10, 11]. However, the underlying mechanisms remain unclear.
CXC motif chemokine ligand 9 (CXCL9) plays a role in immune responses. Recent studies have demonstrated that CXCL9 predicts favorable prognosis in patients with tumors and a good response to anti-PD-1 therapy [12, 13]. However, the precise role of CXCL9 and its association with current immune-related targets in TNBC remains not quite clear.
The results of this work suggest that CXCL9 is a potential diagnostic marker for TNBC, and CXCL9 relied on the PD-L1 expression status is highly expressed in TNBC. Moreover, the expression of CXCL9 was correlated with M1 macrophages in TNBC. In addition, CXCL9 could stimulate MHC-II activity by signaling through JAK/STAT, which in turn modifies the tumor microenvironment. These results showed that CXCL9 is a promising diagnostic biomarker and could predict response to immunotherapy in patients with TNBC.
Methods and materials
Cell culture
MDA-MB-231 triple-negative breast cancer cells were purchased from Procell (Procell Life Science & Technology Co., Ltd., Wuhan, China). By STR identification, the cell line was authenticated. Cells were cultured in L15 medium (Gibco, Thermo Fisher Scientific), supplemented with 10% fetal bovine serum (Sijiqing, Hangzhou, China), and then maintained at 37 °C without CO2.
Plasmid transfection
The pENTER vector was used to construct the CXCL9 overexpression plasmid and control the overexpression plasmid. The plasmids were constructed by WZ Biosciences Inc. (Shandong, China). Subsequently, exponentially growing untreated cells were cultured for 24 h before transfection. pENTER-CXCL9 was transiently transfected with MDA-MB-231 cells using Lipofectamine 3000 (Invitrogen, USA). The cells were cultured for 48 h. Finally, proteins were extracted from these cells for Western blot analysis.
Immunohistochemistry analysis
For IHC analysis, all of the pathology slides came from the Central Hospital Affiliated to Shandong First Medical University. The TNBC and adjacent tissue paraffin-embedded slides were deparaffinized and rehydrated using xylene and a graded series of ethanol (100%, 95%, 80%, 75%), and then washed with PBS three times for 5 min each time. Subsequently, EDTA antigen restore solution was used to repair antigens on slices in a microwave oven at the condition of high heat for 5 min, heat preservation for 10 min, and high heat for 5 min followed by natural cooling, and washed with PBS three times for 5 min each time. It was then immersed in 3% H2O2 solution at room temperature to eliminate endogenous peroxidase activity. The slides were incubated in 5% BSA to block non-specific binding of antibody for 1 h and then incubated in a humidified chamber overnight at 4 °C with the primary antibodies anti-CXCL9 (1:100 dilution; Proteintech, China). This was followed by washing with PBS and incubation with a secondary antibody for 60 min at room temperature. The slices were washed with PBS after incubation. For a color reaction, slides were incubated with the DAB solution. Subsequently, the slides were then counterstained with hematoxylin, dehydrated with graded alcohol series, and covered-slipped with neutral balsam.
Western blotting
Total protein was extracted from the MDA-MB-231 cells using the RIPA buffer (Beyotime, China). Total proteins were separated in SDS-PAGE and then transferred onto PVDF membranes. After blocking with 5% non-fat milk for 2 h at room temperature, the membranes were incubated overnight with the primary antibodies CXCL9 (1:500, Proteintech, China), JAK1 (1:1000), and STAT2 (1:1000) at 4 °C. Subsequently, the membranes were incubated with the corresponding secondary antibodies and observed under enhanced chemiluminescence (ECL, Thermo Fisher Scientific).
Data acquisition and selection
The TNBC datasets, including GSE37751, GSE38959, GSE53752, GSE76250, and GSE115275, were normalized and merged using the R packages “limma” and “sva.” The data were derived from the GEO database and divided into training cohorts (GSE37751, GSE38959, GSE53752, and GSE76250) and validation cohort (GSE115275). To reduce batch effects between these datasets, the merged dataset was normalized using the ComBat function in the “sva” package. The GSE157284 dataset contained 82 TNBC samples, including 58 PD-L1-negative samples and 24 PD-L1-positive samples. |logFC|> 1 and an adjusted P value < 0.05 were considered as thresholds. We collected single-cell RNA sequencing (scRNA-seq) data of TNBC samples (GSM4909281, GSM4909283, and GSM4909284) with a reading depth of 10 × genomics.
Functional analysis
Disease Ontology (DO) enrichment and GSEA were employed to predict the general effects of the DEGs. The analyses were conducted using the R package with “clusterProfiler” and “org.Hs.eg.db.” For the DO enrichment and GSEA analysis, an adjusted P value < 0.05 was used as the selection cutoff. To evaluate the biological functions of CXCL9, we employed the protocol prescribed in the CAMOIP (v1.1) [14].
Selection of diagnostic genes based on machine learning
In the training cohort, the LASSO regression [15] and SVM‐RFE [16] algorithms were employed to select diagnostic genes and prevent overfitting in cases of many genes. Notably, five genes were selected using both algorithms.
Construction of WGCNA
The raw GSE157284 data were normalized and processed using the R software to identify genes associated with the PD-L1 expression profile in TNBC. The genes were ranked based on their SD values, and the top 25% of genes were used to perform WGCNA via the R package “WGCNA” and a β = 3 as the soft thresholding. The minimum number of genes in the module was set to 20, resulting in 5 modules. The correlation coefficient was calculated to measure the relationship between PD-L1 expression status and module. A module with the first absolute correlation coefficient was considered a candidate associated with clinical traits. Finally, 51 genes significantly relevant to PD-L1 expression status in the yellow module were used for further analysis.
Analysis of immune cell infiltration
CIBERSORT package, a bioinformatics tool that analyzes immune cell infiltration [17], was applied to analyze the proportion of 22 immune cell types in the training set and GSE157284 dataset. The CIBERSORT algorithm was run on 1000 permutations, followed by quantile normalization. We assessed the relationships among CXCL9, PD-L1 expression status, and the proportion of various immune cells.
Processing of scRNA-seq data
ScRNA-seq data were extracted from human TNBC. The data were organized and analyzed using the Seurat package in the R software. GSM4909281, GSM4909283, and GSM4909284 datasets were used for analysis. We excluded genes expressed in < 3 cells and cells expressing < 250 unique gene counts. The top 2000 highly variable genes were selected using “vst” in Seurat. Furthermore, the uniform manifold approximation and projection (UMAP) algorithm was used to minimize the dimensions of scRNA-seq data [18]. The cutoff values for identifying marker genes were adjusted to logFC = 0.5 and minpct = 0.3. Many cell clusters were annotated using the SingleR algorithm [19]. Subsequently, the CellMarker database was used for manual verification and correction [20].
Statistical analysis
The diagnostic accuracy of the genes was assessed based on the AUC. The AUC was graded as follows: 0.5 < AUC < 0.7, poor discrimination; 0.7 ≤ AUC < 0.8, acceptable discrimination; 0.8 ≤ AUC < 0.9, excellent discrimination; and AUC ≥ 0.9, outstanding discrimination [21]. Statistical analysis was conducted in the R software (Version 4.1.3).
Results
Identification and functional enrichment analysis of DEGs in the training set
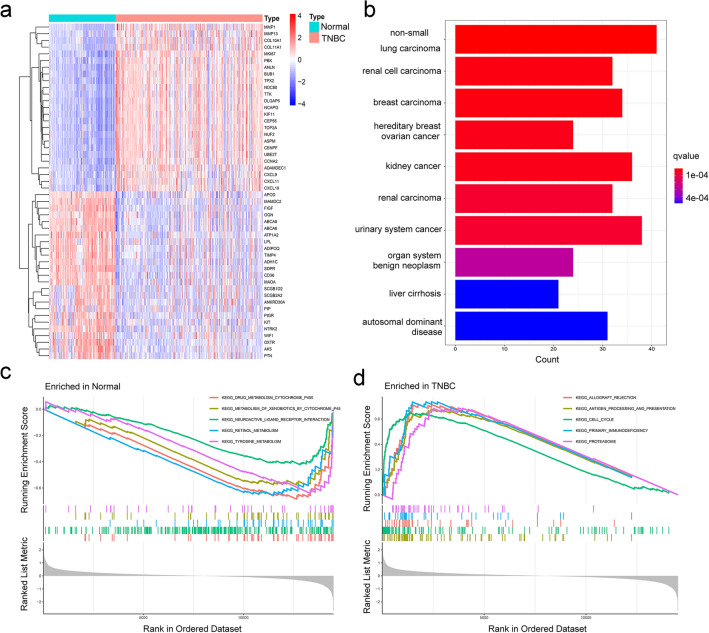
The flowchart of the study is represented in Supplementary Fig. 1. A total of 367 DEGs were identified from the training datasets (GSE37751, GSE38959, GSE53752, and GSE76250). The DEGs included 141 upregulated and 226 downregulated genes (Fig. 1a and Supplementary Tab. 1). DO enrichment analysis showed that the DEGs were enriched in hereditary breast–ovarian cancer (Fig. 1b). In the GSEA pathway analysis, the top 5 enriched terms, i.e., “drug-metabolism-cytochrome-P450,” “metabolism-of-xenobiotics-by-cytochrome-P450,” “neuroactive-ligand-receptor-interaction,” “retinol-metabolism,” and “tyrosine-metabolism,” were remarkably expressed in the normal group (Fig. 1c). In contrast, the other 5 terms, i.e., “allograft-rejection,” “antigen-processing-and-presentation,” “cell-cycle,” “primary-immunodeficiency,” and “proteasome,” were robustly expressed in the TNBC group (Fig. 1d).
Fig. 1.
Identification and functional enrichment analysis of the DEGs in the training set. a Heatmap of the top 50 DEGs in the training set. The DO b and GSEA c-d analyses of the DEGs
Screening of diagnostic genes in the training set
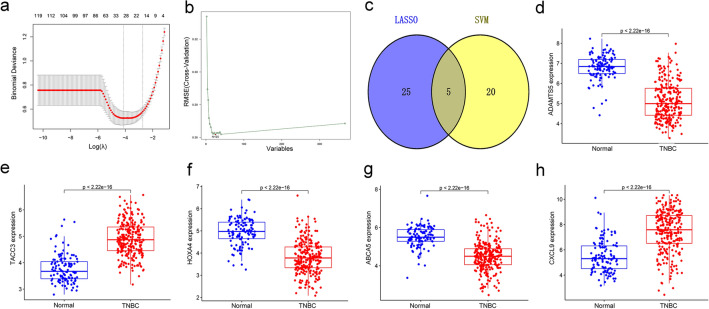
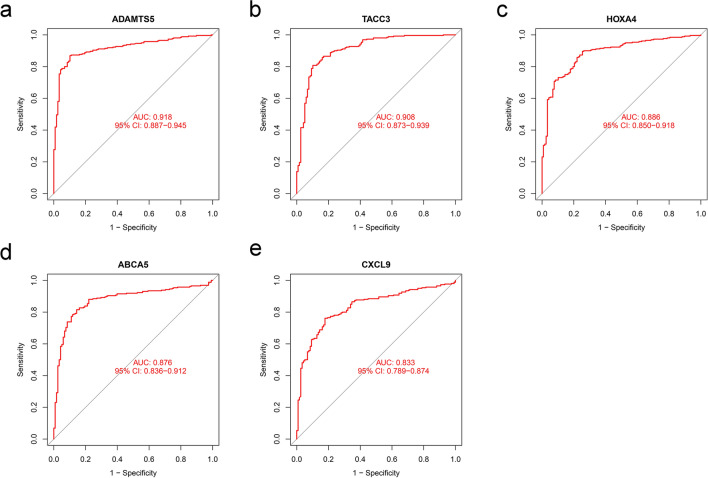
To further identify genes with diagnostic potential in TNBC, the 367 DEGs were analyzed by LASSO and SVM analyses (Fig. 2a and 2b). The LASSO and SVM regression analyses demonstrated that 5 DEGs, i.e., ADAMTS5, TACC3, HOXA4, ABCA5, and CXCL9, were potential diagnostic genes (Fig. 2c). Moreover, these 5 genes were significantly and differentially expressed between the tumor group and normal group. TACC3 and CXCL9 genes were upregulated in the TNBC group, whereas other genes were suppressed (Fig. 2d-2h). ROC curve showed the diagnostic performance of ADAMTS5, TACC3, HOXA4, ABCA5, and CXCL9 in TNBC with AUC values of 0.918, 0.908, 0.886, 0.876, and 0.833, respectively (Fig. 3).
Fig. 2.
Identification of the diagnostic genes in the training set. a and b The LASSO and SVM methods used to select diagnostic genes in the training set; c the Venn diagram showing the intersecting genes of the LASSO and SVM regression; d-h a comparison of 5 key genes between the normal and tumor groups
Fig. 3.
ROC curves of the a ADAMTS5, b TACC3, c HOXA4, d ABCA5, and e CXCL9 in the training dataset
Re-validation of the diagnostic genes in the validation set
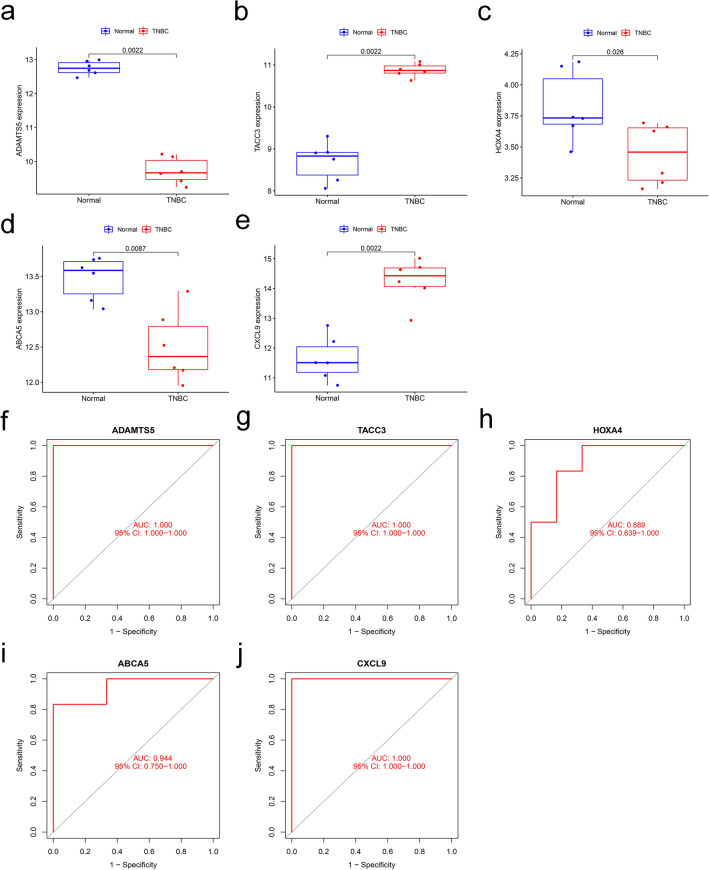
To assess the diagnostic value of the 5 genes, the GSE115275 was used as a validation set. Our analysis showed similar results to the training set. TACC3 and CXCL9 were upregulated in the TNBC group, whereas the other three genes were downregulated (Fig. 4a-4e). The ROC curves for ADAMTS5, TACC3, HOXA4, ABCA5, and CXCL9 showed AUC values of 1.000, 1.000, 0.889, 0.944, and 1.000, respectively (Fig. 4f-4j).
Fig. 4.
Re-validation of the diagnostic genes in the validation set (GSE115275). a-e Expression of the 5 diagnostic genes between the normal and TNBC in the validation dataset; f-j ROC curves showing genes with diagnostic value in the validation set
WGCNA analysis
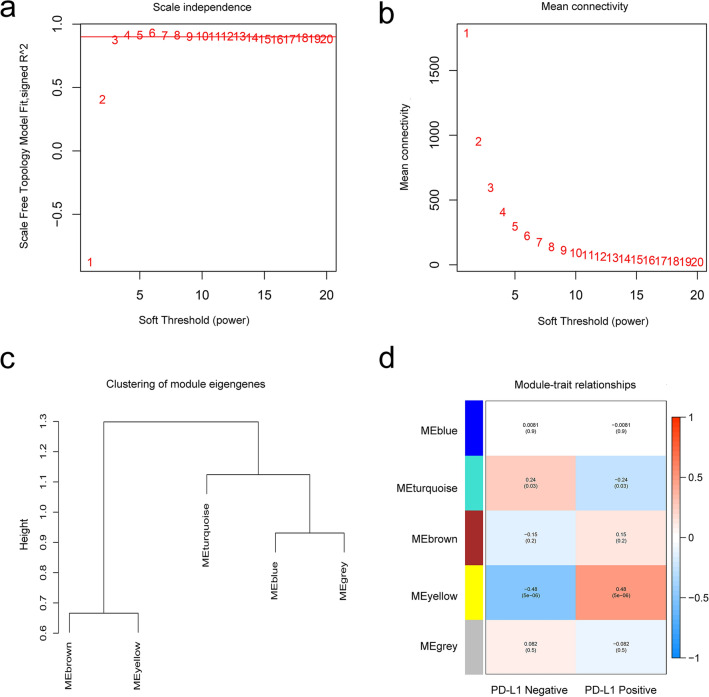
Data from the GSE157284 dataset were preprocessed using R, and 21,654 genes were used to perform the WGCNA. A total of 5,414 genes were used for cluster analysis using the WGCNA package; β = 3 was set as the soft threshold power (Fig. 5a and 5b). We constructed the cluster dendrogram based on the selected threshold. We identified five color modules (Fig. 5c). A total of 509 genes were in the blue module, 4,112 genes in the turquoise module, 210 genes in the brown module, 51 genes in the yellow, and 1 gene in the grey module. Finally, genes in the 5 color modules were used to explore the relationship between the modules and traits (PD-L1 expression status). Compared with other modules, the yellow module exhibited the highest correlation with the PD-L1 expression status (Fig. 5d and Supplementary Tab. 2), demonstrating that genes in the yellow module play significant roles in the PD-1/PD-L1 immunotherapy of TNBC patients.
Fig. 5.
WGCNA showing the module genes. a and b The fit soft thresholding power of the WGCNA was 3; c hierarchical clustering tree showing co-expression modules; d yellow module exhibited the greatest correlation with PD-L1 expression status (P = 5 × 10⁻⁶, R = 0.48)
Identification of key diagnostic genes and functional enrichment analysis
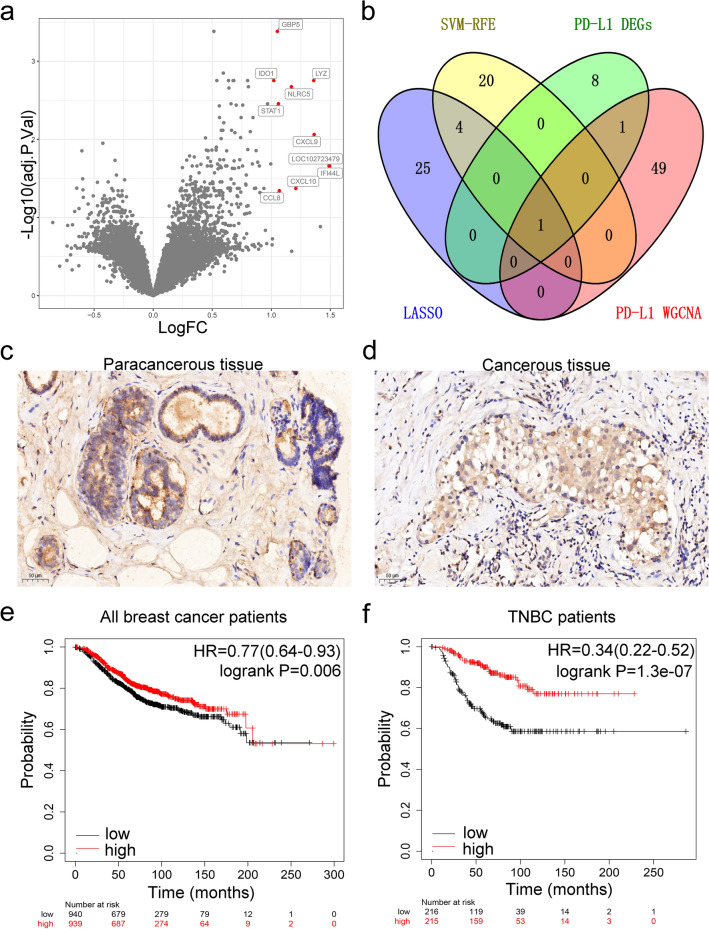
Our analysis showed 10 DEGs (GBP5, IDO1, LYZ, NLRC5, STAT1, CXCL9, IFI44L, LOC102723479, CXCL10, and CCL8) in GSE157284 (PD-L1 positive versus PD-L1 negative, Fig. 6a). The WGCNA-yellow module, LASSO, and SVM were intersected with the 10 DEGs. Comprehensive analysis of the four datasets only identified CXCL9 (Fig. 6b). Meanwhile, TNBC tissues expressed stronger CXCL9 than para-cancerous breast tissues based on immunohistochemistry (Fig. 6c and d). Kaplan–Meier survival curves were constructed to examine the relationship between the expression level of CXCL9 and the overall survival of breast cancer patients. The results revealed that the CXCL9 high-expression group had a better prognosis (log-rank P = 0.006, HR = 0.77, Fig. 6e). In contrast with all breast cancer, the effect was striking in the TNBC subgroup (log-rank P = 1.3e-07, HR = 0.34, Fig. 6f).
Fig. 6.
Overlapping genes and enrichment analysis. a Red dots indicate high expression of the DEGs in the GSE157284 volcano plot; b a Venn diagram showing overlapping genes between the PD-L1 expression status-DEGs, WGCNA-yellow genes, LASSO, and SVM; c and d expression of CXCL9 in TNBC para-cancerous and TNBC cancerous tissues determined with immunohistochemistry staining; e log-rank test with Kaplan–Meier survival curves was performed to compare overall survival (OS) between breast cancer patients with high and low CXCL9 expression; f log-rank test with Kaplan–Meier survival curves was performed to compare overall survival (OS) between TNBC patients with high and low CXCL9 expression groups
Distribution of TIICs in TNBC with PD-L1 positive or PD-L1 negative
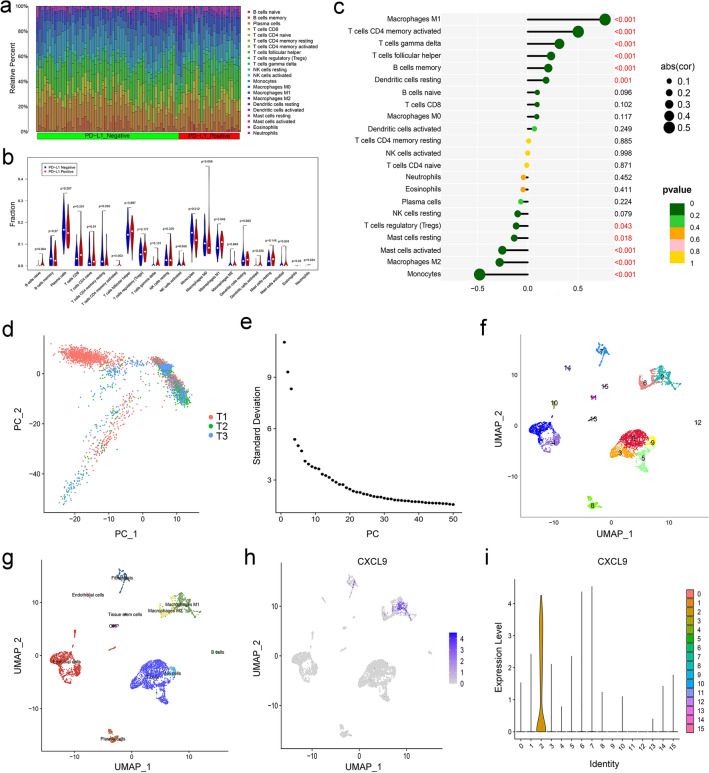
The CIBERSORT algorithm was used to evaluate differential immune infiltration of 22 subpopulations of immune cells between the PD-L1-positive and PD-L1-negative TNBC. As a consequence, the proportion of immune cells significantly varied between and within groups (Fig. 7a). Compared with the PD-L1-negative TNBC, PD-L1-positive samples showed a higher proportion of M1 macrophages (P = 0.045, Fig. 7b). Figure 7c shows that CXCL9 was positively correlated with the M1 macrophages (R = 0.77, P<0.001) and negatively correlated with the M2 macrophages (R = -0.28, P<0.001). The results showed that there was the strongest correlation between the CXCL9 expression and macrophage infiltration in TNBC.
Fig. 7.
Identification of different cell clusters in TNBC by single-cell sequencing analysis. a Distribution of immune cell-type fractions in the PD‐L1 expression status in TNBC; b the proportions of 22 TIICs in the PD-L1-positive (red) and PD-L1-negative (blue) TNBC; c correlation between the expression of CXCL9 and the infiltration of immune cells from TNBC; d comparison of batch effects between the groups; e PCA data showing the 50 PCs with a P value < 0.05; f the 16 cell clusters classified using the UMAP algorithm; g the 16 cell clusters annotated into major types using SingleR and CellMarker; h and i UMAP and violin plots showing high expression of CXCL9 gene in M1 macrophages
ScRNA-seq profiling of the TNBC
scRNA-seq data were analyzed to characterize cell subsets in TNBC. After quality control (Supplementary Fig. 2), 4,636 cell samples were identified from the scRNA-seq data. The cells were mapped into two dimensions based on PC_1 and PC_2 components. The principal component analysis (PCA) revealed that the three correct independent subpopulations had optimal clustering efficiency (Fig. 7d). A total of 50 principal components (PCs) were selected for subsequent analysis (Fig. 7e). Thereafter, cells were classified into 16 different clusters using UMAP algorithm (Fig. 7f); log2 FC > 0.5, pct 1 ≥ 0.5, and pct 2 < 0.5 were considered the cutoff criteria for further screening to identify relevant marker genes. Ultimately, 3,069 marker genes (1,980 unique genes) were identified for further annotation. SingleR and CellMarker tools were used to annotate the clusters based on their expression patterns. Clusters 0, 3, and 5, with 1,733 cells, were annotated as T cells; clusters 1, 4, 10, and 13, which contained 1,180 cells, were annotated as epithelial cells; cluster 2, which had 506 cells, was annotated as M1 macrophages; cluster 6, containing 347 cells, was annotated as M2 macrophages; cluster 7, containing 273 cells, was annotated as fibroblasts; cluster 8, with 245 cells, was annotated as plasma cells; cluster 9, containing 159 cells, was annotated as NK cells; cluster 11, containing 60 cells, was annotated as CMP; cluster 12, containing 58 cells, was annotated as B cells; cluster 14, containing 44 cells, was annotated as endothelial cells; cluster 15, containing 31 cells, was annotated as tissue stem cells (Fig. 7g). Finally, we examined the expression of CXCL9 in 16 different cell types. As illustrated in Fig. 7h-i, CXCL9 was highly expressed in M1 macrophages (cluster 2).
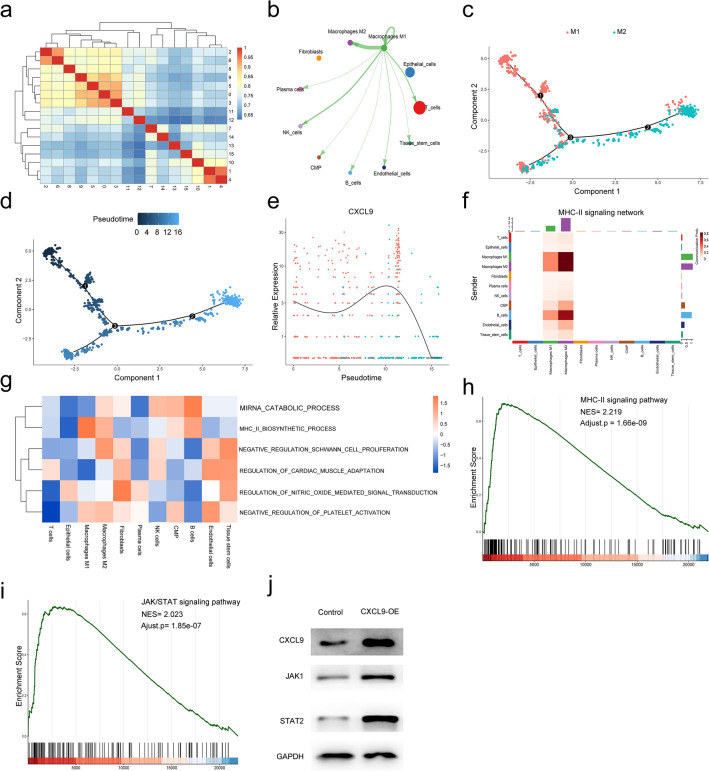
Afterward, cluster analysis was carried out including all cell populations (0–15 cluster). As shown in Fig. 8a, strong and significant correlation was found between cluster 2 (M1 macrophages) and cluster 6 (M2 macrophages). Further, the cell–cell interaction weights between M1 macrophages and other cell types showed tight relationships by CellChat, and the strongest cell interaction was found between M1 and M2 macrophages among different kinds of cells (Fig. 8b). Thereafter, we used pseudotime analysis to generate trajectory plots. As shown in Fig. 8c-d, M1 macrophages were more upstream compared to the location of M2 macrophages, and two cell populations revealed a partial overlap in the differentiation trajectory. These findings demonstrated that M1 macrophages differentiate into M2 macrophages over time. Moreover, CXCL9 expression was significant in the M1 macrophages and experienced a downfall from M1 macrophages to M2 macrophages (Fig. 8e). In addition, M1 macrophage had strong connections to M2 macrophage in the MHC-II signaling network (Fig. 8f). Through GSVA analysis, MHC-II pathway activity of the M1 macrophages was stronger than that of the M2 macrophages (Fig. 8g). Furthermore, we performed the GSEA to assess the CXCL9-related pathways. As shown in Fig. 8h, CXCL9 was significantly enriched in the MHC-II signaling pathway (NES = 2.219, adjusted p = 1.66e-09). Against this background, we suggest that as a marker gene of M1 macrophages, CXCL9 acts via the MHC-II signaling pathway and promotes immunotherapy in breast cancer. Moreover, studies have shown that JAK/STAT signaling pathway-related factors improve MHC class II immunoreactivity. Also, CXCL9 was significantly enriched in the JAK/STAT signaling pathway (NES = 2.023, adjusted p = 1.85e-07, Fig. 8i). Therefore, CXCL9 expression was upregulated using pENTER-CXCL9 transfection into MDA-MB-231 cells to validate the results. As shown in Fig. 8j, CXCL9 (CXCL9-OE) overexpression promotes JAK1/STAT2 expression in MDA-MB-231 cells.
Fig. 8.
Cell cluster trajectory and CellChat analysis. a Heatmap of different cell clusters interaction correlation; b the cellular interaction weights of interactions between M1 macrophages and M2 macrophages; c the differentiation pseudotime trajectory of M1 macrophages and M2 macrophages; d pseudotime was colored in a gradient from dark blue to light blue; e the expression intensity of CXCL9 along the pseudotime axis; f the MHC-II signaling pathway network was significantly detected between the interactions of M1 macrophage and M2 macrophage; g differences in pathway activities scored by GSVA between all types of cell types; h and i GSEA analysis revealed a significant enrichment of MHC-II (hsa 04,514) and JAK/STAT signaling pathways. NES, normalized enrichment score; j CXCL9 was upregulated in the pENTER-CXCL9 group. JAK1 and STAT2 expressions were higher in the pENTER-CXCL9 group than in the control group
Discussion
TNBC is a subtype of breast cancer with a poor survival rate [22]. Recently, the emergence of PD-1/PD-L1 immunotherapy has revolutionized the treatment of TNBC patients. Although immunotherapy has been proven to be effective in TNBC with PD-L1-positive patients, some of the patients are still insensitive to anti-PD-1/PD-L1 immunotherapy [2]. It is therefore essential to define the mechanisms underlying immunotherapy efficacy and identify more reliable biomarkers for early diagnosis and treatment of TNBC patients.
Machine learning tools, including SVM and LASSO regression, have been extensively used to screen diagnostic-related markers. We intersected and integrated the two algorithms and identified 5 DEGs (ADAMTS5, TACC3, HOXA4, ABCA5, and CXCL9). Among them, TACC3 and CXCL9 were significantly upregulated in the tumor group. ROC analyses for the identified DEGs showed the training and validation groups. Our results suggest that the DEGs had significant predictive capacity. (AUC values were in the range of 0.8–1.)
One previous study reported that PD-L1 is a marker that evaluates response to tumor immunotherapy, specifically in TNBC patients [23]. The objective response rates of PD-1/PD-L1 inhibitors in TNBC were 20% in high PD-L1-expressed ( +) tumors but less than 5% in lowly expressed or negative PD-L1(-) tumors [24]. We first performed WGCNA to identify the pivotal genes related to PD-L1 expression status in TNBC. We identified 51 genes in the yellow module that were robustly correlated with the PD-L1 expression status (P = 5 × 10⁻⁶, R = 0.48). We obtained 10 differentially expressed PD-L1 expression status-related genes, which were upregulated in PD-L1-positive samples compared to the PD-L1-negative samples. Further, the WGCNA-yellow module, LASSO, and SVM-RFE intersected with the 10 DEGs, and only CXCL9 gene was identified from the four datasets.
With recent technological advances, research has evolved from tumor cells to tumor immune microenvironments, improving the understanding of immunotherapy. Notably, TIICs promote tumor immune microenvironment [25]. Tumor tissues are infiltrated by a heterogeneous collection of TIICs, including T cells, B cells, or macrophages; the type and density of TIICs within the tumor significantly influence the sensitivity to immunotherapy [26, 27]. TAMs are the major immune cells in the tumor stroma in orchestrating cancer-related inflammation [28]. TAMs are divided into M1 and M2 subtypes, with diametrically opposite sensitivity to current immunotherapy [29]. M1 macrophages inhibit tumor growth and improve immunotherapeutic outcomes in patients, whereas M2 macrophages drive tumor enhancement and immune suppression [30]. We compared immune infiltration between PD-L1-negative and PD-L1-positive TNBC in 22 subpopulations of immune cells by the CIBERSORT algorithm. In contrast with the PD-L1-negative TNBC, PD-L1-positive samples had a significantly higher proportion of M1 Macrophages. These findings indicated that high expression of PD-L1 may enhance the efficacy of immunotherapy by increasing the infiltration of M1 macrophages in TNBC. CIBERSORT analysis showed that CXCL9 was positively associated with M1 macrophages but negatively associated with M2 macrophages. The single-cell RNA sequencing results showed that CXCL9 was highly expressed in M1 macrophages. M1 macrophages could differentiate into M2 macrophages over time. Meanwhile, CXCL9 expression started to decrease in association with cell differentiation from M1 macrophages to M2 macrophages. In the MHC-II signaling network, the M1 macrophage had strong connections to the M2 macrophage. Through GSVA analysis, the MHC-II pathway activity of the M1 macrophages was stronger than the M2 macrophages. Furthermore, CXCL9 was enriched in the MHC-II signaling pathway. Based on the GSEA analysis, CXCL9 was found to be significantly enriched in the MHC-II signaling pathway (NES = 2.219, adjusted p = 1.66e-09). We suggest that as a marker gene of M1 macrophages, CXCL9 acts via the MHC-II signaling pathway and facilitates immunotherapy in breast cancer.
Janus kinase–signal transducer and activator of transcription (JAK/STAT) signaling participates in nearly all immune regulatory processes, including those implicated in tumor-driven immune escape [31]. Previous studies showed that the JAK/STAT pathway regulates macrophage polarization [32, 33]. IFN-γ is a potent macrophage-activating factor that primarily activates STAT and induces polarization of M1 macrophages via the IFN-γ/JAK/STAT pathway [34]. Furthermore, studies indicate that JAK/STAT signaling pathway-related factors improve the MHC class II immunoreactivity [35–37]. Our GSEA analysis revealed that CXCL9 is significantly enriched in the JAK/STAT pathway (NES = 2.023, adjusted p = 1.85e-07). Eventually, Western blot assay revealed that CXCL9 overexpression promotes JAK1/STAT2 expression in MDA-MB-231 cells. The results suggested that the CXCL9 could affect the tumor immune microenvironment through PI3K/AKT signaling pathway.
Conclusion
This study found that CXCL9 was highly expressed in TNBC tissues and is a promising diagnostic and survival prognostic marker. In addition, CXCL9 could stimulate MHC-II activity by signaling through JAK/STAT, which in turn modifies the tumor microenvironment. Therefore, the present findings are expected to improve the diagnosis and prediction of responses to immunotherapy in TNBC.
Supplementary Information
Below is the link to the electronic supplementary material.
Author Contributions
LW and SS conceived the study and drafted the manuscript. FQ performed the immunohistochemistry analysis. MS, XL, and QS critically revised the manuscript. LC performed statistical analysis. YZ and GS performed technical support. All authors commented on previous versions of the manuscript. All authors read and approved the final manuscript.
Funding
This work was supported by the Scientific Research Foundation for the Introduced Talents of Jinan Central Hospital (YJRC2021011, YJRC2022003), Shandong Provincial Natural Science Foundation (ZR2021MH019), Internationally Standardized Tumor Immunotherapy and Key Technology Platform Construction for Clinical Trials of Drug-Induced Heart Injury (2020ZX09201025), and Shandong Provincial Natural Science Foundation (ZR2022QH245).
Data Availability statement
The datasets generated during and/or analyzed during the current study are available from the corresponding author on reasonable request.
Declarations
Coflict of interests
The authors have no relevant financial or non-financial interests to disclose.
Ethics approval
This study was performed in line with the principles of the Declaration of Helsinki. The study was approved by the Ethics Committee of Central Hospital Affiliated to Shandong First Medical University.
Footnotes
Publisher's Note
Springer Nature remains neutral with regard to jurisdictional claims in published maps and institutional affiliations.
Lei Wu, Shengnan Sun have contributed equally to this work and share first authorship.
Contributor Information
Yan Zheng, Email: 8793822@qq.com.
Guohai Su, Email: gttstg@163.com.
References
- 1.Malhotra MK, Emens LA. The evolving management of metastatic triple negative breast cancer. Semin Oncol. 2020;47:229–237. doi: 10.1053/j.seminoncol.2020.05.005. [DOI] [PubMed] [Google Scholar]
- 2.Schmid P, Rugo HS, Adams S, Schneeweiss A, Barrios CH, Iwata H, Diéras V, Henschel V, Molinero L, Chui SY, Maiya V, Husain A, Winer EP, Loi S, Emens LA. Atezolizumab plus nab-paclitaxel as first-line treatment for unresectable, locally advanced or metastatic triple-negative breast cancer (IMpassion130): updated efficacy results from a randomised, double-blind, placebo-controlled, phase 3 trial. Lancet Oncol. 2020;21:44–59. doi: 10.1016/S1470-2045(19)30689-8. [DOI] [PubMed] [Google Scholar]
- 3.Akinleye A, Rasool Z. Immune checkpoint inhibitors of PD-L1 as cancer therapeutics. J Hematol Oncol. 2019;12:92. doi: 10.1186/s13045-019-0779-5. [DOI] [PMC free article] [PubMed] [Google Scholar]
- 4.Motzer RJ, Rini BI, McDermott DF, Redman BG, Kuzel TM, Harrison MR, Vaishampayan UN, Drabkin HA, George S, Logan TF, Margolin KA, Plimack ER, Lambert AM, Waxman IM, Hammers HJ. Nivolumab for metastatic renal cell carcinoma: results of a randomized phase II Trial. J Clin Oncol. 2015;33:1430–1437. doi: 10.1200/JCO.2014.59.0703. [DOI] [PMC free article] [PubMed] [Google Scholar]
- 5.Robert C, Long GV, Brady B, Dutriaux C, Maio M, Mortier L, Hassel JC, Rutkowski P, McNeil C, Kalinka-Warzocha E, Savage KJ, Hernberg MM, Lebbé C, Charles J, Mihalcioiu C, Chiarion-Sileni V, Mauch C, Cognetti F, Arance A, Schmidt H, Schadendorf D, Gogas H, Lundgren-Eriksson L, Horak C, Sharkey B, Waxman IM, Atkinson V, Ascierto PA. Nivolumab in previously untreated melanoma without BRAF mutation. N Engl J Med. 2015;372:320–330. doi: 10.1056/NEJMoa1412082. [DOI] [PubMed] [Google Scholar]
- 6.Mahoney KM, Atkins MB. Prognostic and predictive markers for the new immunotherapies. Oncology (Williston Park) 2014;28(Suppl 3):39–48. [PubMed] [Google Scholar]
- 7.Mittendorf EA, Philips AV, Meric-Bernstam F, Qiao N, Wu Y, Harrington S, Su X, Wang Y, Gonzalez-Angulo AM, Akcakanat A, Chawla A, Curran M, Hwu P, Sharma P, Litton JK, Molldrem JJ, Alatrash G. PD-L1 expression in triple-negative breast cancer. Cancer Immunol Res. 2014;2:361–370. doi: 10.1158/2326-6066.CIR-13-0127. [DOI] [PMC free article] [PubMed] [Google Scholar]
- 8.Anderson NR, Minutolo NG, Gill S, Klichinsky M. Macrophage-based approaches for cancer immunotherapy. Cancer Res. 2021;81:1201–1208. doi: 10.1158/0008-5472.CAN-20-2990. [DOI] [PubMed] [Google Scholar]
- 9.Issa NT, Stathias V, Schürer S, Dakshanamurthy S. Machine and deep learning approaches for cancer drug repurposing. Semin Cancer Biol. 2021;68:132–142. doi: 10.1016/j.semcancer.2019.12.011. [DOI] [PMC free article] [PubMed] [Google Scholar]
- 10.Oldenhove G, Boucquey E, Taquin A, Acolty V, Bonetti L, Ryffel B, Le Bert M, Englebert K, Boon L, Moser M. PD-1 Is involved in the Dysregulation of Type 2 Innate Lymphoid cells in a murine model of obesity. Cell Rep. 2018;25:2053–2060.e4. doi: 10.1016/j.celrep.2018.10.091. [DOI] [PubMed] [Google Scholar]
- 11.Sun NY, Chen YL, Wu WY, Lin HW, Chiang YC, Chang CF, Tai YJ, Hsu HC, Chen CA, Sun WZ, Cheng WF. Blockade of PD-L1 enhances cancer immunotherapy by regulating dendritic cell maturation and macrophage polarization. Cancers (Basel) 2019 doi: 10.3390/cancers11091400. [DOI] [PMC free article] [PubMed] [Google Scholar]
- 12.Han X, Wang Y, Sun J, Tan T, Cai X, Lin P, Tan Y, Zheng B, Wang B, Wang J, Xu L, Yu Z, Xu Q, Wu X, Gu Y. Role of CXCR3 signaling in response to anti-PD-1 therapy. EBioMedicine. 2019;48:169–177. doi: 10.1016/j.ebiom.2019.08.067. [DOI] [PMC free article] [PubMed] [Google Scholar]
- 13.Tokunaga R, Zhang W, Naseem M, Puccini A, Berger MD, Soni S, McSkane M, Baba H, Lenz HJ. CXCL9, CXCL10, CXCL11/CXCR3 axis for immune activation-A target for novel cancer therapy. Cancer Treat Rev. 2018;63:40–47. doi: 10.1016/j.ctrv.2017.11.007. [DOI] [PMC free article] [PubMed] [Google Scholar]
- 14.Lin A, Qi C, Wei T, Li M, Cheng Q, Liu Z, Luo P, Zhang J. CAMOIP: a web server for comprehensive analysis on multi-omics of immunotherapy in pan-cancer. Brief Bioinform. 2022 doi: 10.1093/bib/bbac129. [DOI] [PubMed] [Google Scholar]
- 15.Tibshirani R. The lasso method for variable selection in the Cox model. Stat Med. 1997;16:385–395. doi: 10.1002/(SICI)1097-0258(19970228)16:4<385::AID-SIM380>3.0.CO;2-3. [DOI] [PubMed] [Google Scholar]
- 16.Sanz H, Valim C, Vegas E, Oller JM, Reverter F. SVM-RFE: selection and visualization of the most relevant features through non-linear kernels. BMC Bioinformatics. 2018;19:432. doi: 10.1186/s12859-018-2451-4. [DOI] [PMC free article] [PubMed] [Google Scholar]
- 17.Wu K, Zhang X, Li F, Xiao D, Hou Y, Zhu S, Liu D, Ye X, Ye M, Yang J, Shao L, Pan H, Lu N, Yu Y, Liu L, Li J, Huang L, Tang H, Deng Q, Zheng Y, Peng L, Liu G, Gu X, He P, Gu Y, Lin W, He H, Xie G, Liang H, An N, Wang H, Teixeira M, Vieira J, Liang W, Zhao X, Peng Z, Mu F, Zhang X, Xu X, Yang H, Kristiansen K, Wang J, Zhong N, Wang J, Pan-Hammarström Q, He J. Frequent alterations in cytoskeleton remodelling genes in primary and metastatic lung adenocarcinomas. Nat Commun. 2015;6:10131. doi: 10.1038/ncomms10131. [DOI] [PMC free article] [PubMed] [Google Scholar]
- 18.Becht E, McInnes L, Healy J, Dutertre CA, Kwok I, Ng LG, Ginhoux F, Newell EW. Dimensionality reduction for visualizing single-cell data using UMAP. Nat Biotechnol. 2018 doi: 10.1038/nbt.4314. [DOI] [PubMed] [Google Scholar]
- 19.Aran D, Looney AP, Liu L, Wu E, Fong V, Hsu A, Chak S, Naikawadi RP, Wolters PJ, Abate AR, Butte AJ, Bhattacharya M. Reference-based analysis of lung single-cell sequencing reveals a transitional profibrotic macrophage. Nat Immunol. 2019;20:163–172. doi: 10.1038/s41590-018-0276-y. [DOI] [PMC free article] [PubMed] [Google Scholar]
- 20.Zhang X, Lan Y, Xu J, Quan F, Zhao E, Deng C, Luo T, Xu L, Liao G, Yan M, Ping Y, Li F, Shi A, Bai J, Zhao T, Li X, Xiao Y. Cell Marker: a manually curated resource of cell markers in human and mouse. Nucleic Acids Res. 2019;47:D721–D728. doi: 10.1093/nar/gky900. [DOI] [PMC free article] [PubMed] [Google Scholar]
- 21.Linden A. Measuring diagnostic and predictive accuracy in disease management: an introduction to receiver operating characteristic (ROC) analysis. J Eval Clin Pract. 2006;12:132–139. doi: 10.1111/j.1365-2753.2005.00598.x. [DOI] [PubMed] [Google Scholar]
- 22.Paroni G, Zanetti A, Barzago MM, Kurosaki M, Guarrera L, Fratelli M, Troiani M, Ubezio P, Bolis M, Vallerga A, Biancardi F, Terao M, Garattini E. Retinoic acid sensitivity of triple-negative breast cancer cells characterized by constitutive activation of the notch1 pathway: the role of rarβ. Cancers (Basel) 2020 doi: 10.3390/cancers12103027. [DOI] [PMC free article] [PubMed] [Google Scholar]
- 23.Núñez Abad M, Calabuig-Fariñas S, Lobo de Mena M, Torres-Martínez S, García González C, García GJÁ, Iranzo González-Cruz V, Camps Herrero C. Programmed death-ligand 1 (PD-L1) as immunotherapy biomarker in breast cancer. Cancers (Basel) 2022 doi: 10.3390/cancers14020307. [DOI] [PMC free article] [PubMed] [Google Scholar]
- 24.Choi J, Lee HJ, Yoon S, Ryu HM, Lee E, Jo Y, Seo S, Kim D, Lee CH, Kim W, Ha JY, Kim SY, Gong G, Jung KH, Park SR, Kim SW, Park KS, Lee DH. Blockade of CCL2 expression overcomes intrinsic PD-1/PD-L1 inhibitor-resistance in transglutaminase 2-induced PD-L1 positive triple negative breast cancer. Am J Cancer Res. 2020;10:2878–2894. [PMC free article] [PubMed] [Google Scholar]
- 25.Kuan Hu, Zhijie Xu, Yao L, Yan Y, Zhou L, Li J. Integrated analysis of expression, prognostic value and immune infiltration of GSDMs in hepatocellular carcinoma. Aging. 2021;13(21):24117–24135. doi: 10.18632/aging.203669. [DOI] [PMC free article] [PubMed] [Google Scholar]
- 26.Liu R, Hu R, Zeng Y, Zhang W, Zhou HH. Tumour immune cell infiltration and survival after platinum-based chemotherapy in high-grade serous ovarian cancer subtypes: A gene expression-based computational study. EBioMedicine. 2020;51:102602. doi: 10.1016/j.ebiom.2019.102602. [DOI] [PMC free article] [PubMed] [Google Scholar]
- 27.Kang Y, Huang J, Liu Y, Zhang N, Cheng Q, Zhang Y. Integrated analysis of immune infiltration features for cervical carcinoma and their associated immunotherapeutic responses. Front Cell Dev Biol. 2021;9:573497. doi: 10.3389/fcell.2021.573497. [DOI] [PMC free article] [PubMed] [Google Scholar]
- 28.Mantovani A, Marchesi F, Malesci A, Laghi L, Allavena P. Tumour-associated macrophages as treatment targets in oncology. Nat Rev Clin Oncol. 2017;14:399–416. doi: 10.1038/nrclinonc.2016.217. [DOI] [PMC free article] [PubMed] [Google Scholar]
- 29.Gül N, van Egmond M. Antibody-dependent phagocytosis of tumor cells by macrophages: a potent effector mechanism of monoclonal antibody therapy of cancer. Cancer Res. 2015;75:5008–5013. doi: 10.1158/0008-5472.CAN-15-1330. [DOI] [PubMed] [Google Scholar]
- 30.Murray PJ, Allen JE, Biswas SK, Fisher EA, Gilroy DW, Goerdt S, Gordon S, Hamilton JA, Ivashkiv LB, Lawrence T, Locati M, Mantovani A, Martinez FO, Mege JL, Mosser DM, Natoli G, Saeij JP, Schultze JL, Shirey KA, Sica A, Suttles J, Udalova I, van Ginderachter JA, Vogel SN, Wynn TA. Macrophage activation and polarization: nomenclature and experimental guidelines. Immunity. 2014;41:14–20. doi: 10.1016/j.immuni.2014.06.008. [DOI] [PMC free article] [PubMed] [Google Scholar]
- 31.Owen KL, Brockwell NK, Parker BS. JAK-STAT Signaling: A Double-Edged Sword of Immune Regulation and Cancer Progression. Cancers (Basel) 2019 doi: 10.3390/cancers11122002. [DOI] [PMC free article] [PubMed] [Google Scholar]
- 32.Xia Y, Chen S, Zeng S, Zhao Y, Zhu C, Deng B, Zhu G, Yin Y, Wang W, Hardeland R, Ren W. Melatonin in macrophage biology: Current understanding and future perspectives. J Pineal Res. 2019;66:e12547. doi: 10.1111/jpi.12547. [DOI] [PubMed] [Google Scholar]
- 33.Murray PJ. The JAK-STAT signaling pathway: input and output integration. J Immunol. 2007;178(5):2623–2629. doi: 10.4049/jimmunol.178.5.2623. [DOI] [PubMed] [Google Scholar]
- 34.Hu X, Chen J, Wang L, Ivashkiv LB. Crosstalk among Jak-STAT, Toll-like receptor, and ITAM-dependent pathways in macrophage activation. J Leukoc Biol. 2007;82:237–243. doi: 10.1189/jlb.1206763. [DOI] [PubMed] [Google Scholar]
- 35.Pattenden SG, Klose R, Karaskov E, Bremner R. Interferon-gamma-induced chromatin remodeling at the CIITA locus is BRG1 dependent. EMBO J. 2002;21:1978–1986. doi: 10.1093/emboj/21.8.1978. [DOI] [PMC free article] [PubMed] [Google Scholar]
- 36.Tarafdar A, Hopcroft LE, Gallipoli P, Pellicano F, Cassels J, Hair A, Korfi K, Jørgensen HG, Vetrie D, Holyoake TL, Michie AM. CML cells actively evade host immune surveillance through cytokine-mediated downregulation of MHC-II expression. Blood. 2017;129:199–208. doi: 10.1182/blood-2016-09-742049. [DOI] [PMC free article] [PubMed] [Google Scholar]
- 37.Stickel N, Hanke K, Marschner D, Prinz G, Köhler M, Melchinger W, Pfeifer D, Schmitt-Graeff A, Brummer T, Heine A, Brossart P, Wolf D, von Bubnoff N, Finke J, Duyster J, Ferrara J, Salzer U, Zeiser R. MicroRNA-146a reduces MHC-II expression via targeting JAK/STAT signaling in dendritic cells after stem cell transplantation. Leukemia. 2017;31:2732–2741. doi: 10.1038/leu.2017.137. [DOI] [PMC free article] [PubMed] [Google Scholar]
Associated Data
This section collects any data citations, data availability statements, or supplementary materials included in this article.
Supplementary Materials
Data Availability Statement
The datasets generated during and/or analyzed during the current study are available from the corresponding author on reasonable request.


