Abstract
The organic single crystals of Cyclohexylammonium picrate (CHAP) had been grown using the method of slow evaporation solution growth. A determination was made regarding the solubility of the substance. The crystal's lattice cell parameters and morphology were characterized using single-crystal X-ray diffraction and powder X-ray diffraction techniques. The HRXRD techniques were utilized to assess the crystal quality. The functional groups of CHAP material were identified through the use of FT-IR and FT-Raman analysis. A Hirshfeld surface analysis was performed to investigate the formation of hydrogen bonds between N–H⋯O and C–H⋯O molecules. The grown crystals were examined in optical and thermal investigations utilizing UV–visible and TGA, DSC techniques. Mechanical analysis is used to quantify surface properties, such as work hardening coefficient and void volume. Z-scan analysis was utilized to calculate the non-linear refractive index (n2), nonlinear absorption (β), and third-order non-linear susceptibility (χ3).
Keywords: HRXRD, Hirshfeld Surface analysis, Thermal analysis, Vickers hardness, Z-Scan technique
1. Introduction
Organic non-linear optical (NLO) materials have garnered phenomenon interest due to their optical properties, such as ultra-fast response, improved laser damage resistance, and high optical susceptibility, which are considered superior to their inorganic counterparts [1]. Cyclohexylamine's interesting organic base material attracts researchers to developing crystal engineering and molecular crystals. Cyclohexylamine is new to crystal growth empiric and exciting base material for different organic systems. The substantial base of cyclohexylamine reacts efficiently with all acids to produce salts. Therefore, organic compounds containing acid anhydrides are highly reactive with cyclohexylamine. The N2 component that exists in cyclohexylamine is highly active in other organic materials [2]. In cyclohexylammonium picrate (CHAP), Cyclohexylamine, acting as a primary ammonium cation, forms hydrogen bonds with the picric anion through charge-assisted N⁺–H…O interactions. The charge transfer complex molecules are formed with an electron acceptor and several electron donor compounds by hydrogen bonding or electrostatic interactions. Cyclohexylammonium Acetate [3], Cyclohexylammonium Hydrogen Adipate [4], Cyclohexylaminium hydrogen phthalate [5], Cyclohexylammonium sulfanilate [6], Bis (cyclohexylammonium) succinate succinic acid [7], Bis (cyclohexylammonium) terephthalate, cyclohexylammonium para-methoxy benzoate [8], Bis (cyclohexylammonium) dioxalate hydrate [9] and Cyclohexylamine derivative single crystals [10]. In connection, Cyclohexylammonium picrate (CHAP) plays a vital role in the Cyclohexylamine family crystals. Recent reports show only the structural information of cyclohexylammonium picrate (CHAP) (C6H14N+.C6H2N3O7-) crystal exists in the literature. As a monoclinic crystal system with the C2/c space group, CHAP crystallized. In CHAP crystal, the protonated N atom is involved in the specific N–H⋯O hydrogen bond [11]. In a recent search, no other reports related to the bulk growth and physicochemical properties of the CHAP crystals were found.
This manuscript investigates the growth and physicochemical properties of Cyclohexylammonium picrate (CHAP), grown using the slow evaporation solution growth technique with ethanol as the solvent. Single-crystal X-ray diffraction (SXRD), Powder X-ray diffraction (PXRD), High-resolution X-ray diffraction (HRXRD), Fourier-transform infrared spectroscopy (FT-IR), Fourier-transform Raman spectroscopy (FT-Raman), UV–Vis–NIR spectroscopy, Vickers microhardness measurements, thermal analysis, and Z-scan technique were employed to characterize the crystal's physicochemical properties. The results are discussed in detail.
2. Experimental details
2.1. Synthesis of the material
Cyclohexylammonium picrate (CHAP) synthesis combined cyclohexylamine and picric acid in equal proportions (1:1). The initial substances were dissolved in ethanol using a motorized magnetic stirrer for 6 h. The solution that was saturated underwent filtration to evaporate the solvent at 35 °C. After 12 days, the CHAP material undergoes crystallization at the lower part of the container. The material underwent three times of recrystallization, resulting in its purification. The expected reaction scheme is as follows.
2.2. Solubility of the material
Gravimetric measurements were made on the solubility of CHAP synthesized material between 35 and 50 °C. For the study, 100 ml of solvent was taken, and purified material was dissolved at a constant temperature (35 °C) to achieve a saturated solution. The saturation solution was achieved and filtered carefully. The 100 ml was separated and dried from the prepared solution. Temperatures were varied according to the exact process. The solubility curve (Fig. 1) of CHAP shows the positive solubility coefficient and the solubility value was 8.30 g/100 ml at 35 °C.
Fig. 1.
Solubility curve of CHAP crystal.
2.3. Crystal growth
The saturated solution of CHAP is generated by utilizing recrystallized material at 38 °C. The saturated solution was transferred to a clean vessel after filtering the solution. The growth container was positioned in a water bath with a constant temperature of 35 °C, accurate to ±0.01 °C. After 38 days, a yellow color CHAP single crystal was harvested. Fig. 2 shows the CHAP single crystal of dimension 17 × 9 × 5 mm3.
Fig. 2.
Photograph of as-grown single Crystal of CHAP.
2.4. Characterization details
A study was carried out using a Brukeraxs SMART APEXII instrument to conduct Single crystal X-ray diffraction (SCXRD) at 293 K. An experiment was conducted using a CCD detector and graphite monochromatic MoKα radiation. A study was performed using an ISO EBYEFLEX2000 diffractometer with CuKα1 radiation for powder X-ray diffraction (PXRD). We used the Bruker D8 High-Resolution XRD (HRXRD) to analyze the sample's crystallinity. The FTIR spectrum ranging from 4000 to 500 cm−1 was obtained by employing the KBr pellet method with the assistance of an FTIR spectrophotometer. The FT-Raman spectrum was captured in the 4000–500 cm−1 range with a Bruker RFS 100/S FT-Raman Spectrometer. Obtained the spectrum using a Nd: YAG laser that had a wavelength of 1064 nm and an output power of 20 mW. The material's absorption spectrum was measured with a VARIN CARY 5E UV–vis–NIR spectrophotometer, spanning from 200 to 1200 nm. Thermal tests were conducted on a 2.450 mg sample using a STA 409 PL thermal analyzer. The study was carried out in a N2 environment across a temperature span from 30 to 400 °C. The crystal CHAP was subjected to a dielectric analysis with an LCR tester, specifically the HIOKI MODEL 3532. A Z-scan measurement was performed on the crystal. An examination was carried out on the finely polished surface of the CHAP crystal to determine its laser damage threshold. This was done using a Q-switched Nd: YAG laser beam with a pulse width of 10 ns.
3. Results and discussion
3.1. Single crystal X-ray diffraction analysis
An X-ray diffraction analysis of a single crystal of CHAP was conducted in order to analyze its unit cell parameter. C2/c is the space group of the crystal, which belongs to the monoclinic crystal system. The unit cell parameters a = 23.543 Å, b = 8.717 Å, c = 18.6177 Å, and V = 2991.1 Å3 the values were compatible with the reported literature [11]. The morphology of CHAP crystal was determined, and it is depicted in Fig. 3; the most prominent planes of (100), (−100), (11- 2), (10-1), (-1-12) and (−100) were obtained. The powder XRD data solitary peaks reveal that the examined sample is highly anisotropic in nature for CHAP crystal and is presented in Fig. 4.
Fig. 3.
Morphology of CHAP single crystal.
Fig. 4.
Powder XRD pattern of CHAP crystal.
3.2. CHN analysis
The composition percentage of the carbon (C), hydrogen (H), and nitrogen (N) content of CHAP material was analyzed using an ELEMENTAR MODEL VARIOEL III CHN analyzer. The percentage of theoretical and experimental values of the carbon, hydrogen, and nitrogen are given in (Table 1).
Table 1.
Experimental and Theoretical values for C, H, and N.
| ELEMENTS | COMPOSITION |
|
|---|---|---|
| OBSERVED (%) | CALCULATED (%) | |
| CARBON | 43.940 | 43.900 |
| HYDROGEN | 04.881 | 04.912 |
| NITROGEN | 17.450 | 17.066 |
3.3. Hirshfeld analysis
The crystal structure was used as a source to gather data on the bond angle, lattice energies, bond length, and intermolecular interactions. The technique of Hirshfeld surface analysis was utilized to acquire structural data regarding CHAP. The determination of the local shape of the surfaces was based on the examination of CHAP molecules and their intermolecular contacts as represented in Hirshfeld surfaces. The transparent window on their surfaces allowed for visualization of the CHAP molecule moiety. According to the molecule in a similar contribution to the electron density as the surrounding molecules [12]. The computation of the normalized contact distance (dnorm), shape index, and curvedness was performed using CrystalExplorer 17.5 software. Atomic van-der Waals (vdW) radii and de and di can be used to calculate the dnorm. Hirshfeld surfaces are determined by their distance from the closest atom located outside the surface, while internal surfaces are determined by their distance from the closest atom located inside the surface. Hirshfeld surfaces represent intermolecular contacts using colors, such as white, red, and blue, representing the length, width, and height of a van der Waals radius, respectively. Fig. 5(a–d) depicts the calculated dnorm, shape index, curvedness, and fragment patches. The calculation of dnorm relies on the average values derived from di and de. The variable “di" represents the distance to the closest nucleus inside the surface (red), while “de" represents the distance from the point to the nearest nucleus outside the surface (blue). Fig. 6(a–c) depicts a transparent view of dnorm, di, and de. A shape index is a valuable tool for illustrating complementary pairs that only vary by a sign change. It is employed to visually depict their corresponding hollows (highlighted in red) and bumps (highlighted in blue). The root mean square curvature determines a surface's curvature, which can be observed when comparing a large green area (flat) to a dark-blue edge (with noticeable curvature). The molecule's intermolecular interactions were determined using the 2D fingerprint details [13]. Fig. 7 depicts two-dimensional fingerprint plots illustrating the dnorm bonding interactions observed in the CHAP crystal. Fig. 8 illustrates the proportions of different intermolecular contacts contributing to the 2D fingerprint plots in CHAP molecules. The analysis indicates that the contribution of hydrogen-hydrogen (H⋯H) contacts in the CHAP molecule is higher (25.8%) than other contact types. The proportions of intermolecular interactions are as follows: O⋯N (1.2%), N⋯C (0.4%), C⋯C (3.5%), and C⋯H (1.2%).
Fig. 5.
(a) Hirshfeld surfaces mapped with dnorm, (b) shape index, and (c) curvedness (d) fragment patch surface.
Fig. 6.
Hirshfeld surfaces mapped with (a) dnorm (transparent view), (b) di, and (c) de.
Fig. 7.
2D fingerprint plots dnorm bonding interactions of CHAP crystal.
Fig. 8.
The percentages of all contacts in CHAP.
3.4. High-resolution X-ray diffraction (HRXRD) analysis
High-resolution X-ray diffraction analysis is a technique that provides information about the quality of a specimen's crystalline structure. Using a multi-crystal X-ray diffractometer with MoKα radiation, the HRXRD diffraction curve (DC) for the (101) plane of CHAP crystal was recorded. The HRXRD pattern of the CHAP single crystal is shown in Fig. 9. The full-width at half-maximum (FWHM) of the diffraction curves is 14 arcsec, indicating that the crystal is nearly perfect and has excellent crystalline perfection [14]. This suggests that there may be some interstitial-type point defects in the crystal, possibly due to self-interstitials, solvent molecules, or impurities occupying interstitial spaces in the crystalline matrix.
Fig. 9.
HRXRD curve of CHAP crystal.
3.5. FT-IR and FT-Raman analysis
FT-IR and FT-Raman spectroscopy were employed to identify functional groups in the CHAP material (Fig. 10, Fig. 11). C–H stretching vibrations of aromatic compounds typically occur around 3100-3000 cm-1. The CHAP spectrum shows an asymmetric stretching band between 2998 and 3086 cm-1 , consistent with this range. Similarly, in-plane bending vibrations (1000–1300 cm-1) are responsible for the medium and sharp bands observed at 1081, 1161, and 1267 cm-1 in the FT-IR spectrum, with corresponding peaks in the FT-Raman spectrum at 1085, 1163, and 1275 cm-1.
Fig. 10.
FTIR spectrum of CHAP Crystal.
Fig. 11.
FT-Raman spectrum of CHAP Crystal.
C–C stretching vibrations in CHAP are observed at 1331, 1437, 1559, and 1566 cm-1 in the FT-IR spectrum, aligning with literature findings [15]. Strong C C stretching vibrations contribute to the peaks at 1437, 1559, 1566, and 1613 cm-1. Aromatic C–O stretching bands typically appear between 1270 and 1230 cm-1 (FT-IR) and 1210–1310 cm-1 (FT-Raman) [16]. Consistent with this, both spectra show CO stretching vibrations at 1267 cm-1 (FT-IR) and 1275 cm-1 (FT-Raman).
C–N stretching vibrations are assigned to the bands at 1267 and 1331 cm-1 in the FT-IR spectrum [17]. The prominent band at 3184 cm-1 in the FT-IR spectrum indicates the presence of NH3+ stretching vibrations, including both asymmetric and symmetric modes. These vibrations might also contribute to the weak band at 2859 cm-1 [18].
The expected range for NO2 asymmetric stretching in nitro-substituted compounds is 1560-1485 cm-1 [19]. The CHAP molecule exhibits prominent bands at 1559 and 1566 cm-1 (FT-IR) and 1540 cm-1 (FT-Raman) due to these asymmetric stretching modes. Strong bands at 1331 cm-1 (FT-IR) and 1363 cm-1 (FT-Raman) confirm the presence of symmetric NO2 stretching modes [20].
3.6. UV–Vis–NIR spectral study
Single-crystal optics with high transmittance play a vital role in optoelectronics and nonlinear optics, enabling efficient light manipulation for various devices and applications. Suitability of the materials for optical applications based on their optical transmittance and cut-off edge factors. UV–Vis–NIR spectral analysis involved utilizing a wavelength range of 200 nm–1200 nm. The optical transmittance studies run using a 3 mm thickness of CHAP crystal. The optical transmission by energy transfer involves the chemical composition, crystal symmetry, and crystal structure [21]. As shown in Fig. 12, the CHAP single crystal exhibits high optical transmittance. The CHAP crystal exhibits a cut-off wavelength of 461 nm due to an (n→π*) electronic transition. This transition involves the excitation of an electron from a non-bonding lone pair orbital to an anti-bonding π orbital. The crystal's optical transmittance spectrum (85%) showed no notable absorption in the IR and UV–visible regions. According to the conclusions drawn from the optical property analysis, the crystal is appropriate for utilization in non-linear optical devices [22]. The optical absorption coefficients offer in-depth insights into the crystal's electronic band structure by considering the photon energy (hѵ) and material thickness (α). The optical absorption coefficient (α) of CHAP crystal was determined using the following relation.
| (1) |
where α, T, and t represent the optical absorption coefficient, optical transmittance, and crystal thickness, respectively. equation (2) provides the relationship for the optical absorption coefficient (α) near the absorption edge [23].
| (2) |
where A is an arbitrary constant, Eg is the optical band gap, h is Planck's constant, and ν is the frequency of incident photons. The grown crystal's optical band gap (Eg) value was obtained by extrapolating the linear region of Tauc's plot [24], as shown in Fig. 13.
Fig. 12.
Optical transmittance spectrum of CHAP crystal.
Fig. 13.
Tauc's plot of the CHAP crystal.
The CHAP refractive index is evaluated by using relation [25],
| (3) |
While n is the material's refractive index, Eg can be estimated from the relationship between the energy band gap and optical transmittance data. The CHAP crystal refractive index value is 2.51. Moreover, the similar derivative material's optical properties are shown in Table 2.
Table 2.
Optical properties of Cyclohexylamine derivative materials.
The extinction coefficient (k) of the CHAP crystal, a measure of the combined light attenuation due to absorption and scattering per unit distance, is presented in Fig. 14. The extinction coefficient values were calculated using the following formula:
| (4) |
Fig. 14.
Extinction coefficient (K) of CHAP crystal.
The optical absorption coefficient and optical transmittance decide the reflectance (R) of the material; it was calculated for CHAP crystal using the relation,
| (5) |
The pattern of reflectance values decreases with increasing wavelength, which is observed from the result (Fig. 15) of the reflectance of CHAP crystal. The obtained results (high optical transmittance, low optical absorbance, and low reflectance values) show that the grown CHAP crystal is suitable for NLO applications [26]. Fig. 16 reveals a strong negative correlation between wavelength and refractive index (n0) of the CHAP crystal. This data is crucial for calculating its third-order non-linear optical susceptibility (χ3), a key parameter for applications like frequency doubling and optical switching. Notably, the CHAP crystal exhibits a large χ3 value combined with high transparency and a wide bandgap, making it highly promising for various non-linear optical devices.
Fig. 15.
Reflectance spectrum of CHAP crystal.
Fig. 16.
Refractive index of CHAP crystal.
3.7. Laser damage threshold
Laser damage threshold (LDT) analysis is crucial for evaluating optical materials intended for high-power applications like NLO (Non-Linear Optics) devices. NLO devices rely on materials with high optical tolerance to withstand intense laser beams. LDT experiments investigate the interaction of high-power laser beams with materials to determine their damage resistance.
In this study, a Q-switched Nd:YAG laser (1064 nm, 10 Hz repetition rate, 10 ns pulse width) was used to measure the LDT of a (101) plane CHAP crystal. A variable attenuator controlled the laser beam intensity, focused by a 35 cm focal length lens onto the crystal. The laser power density (E/τA) was calculated using the measured pulse energy (E), pulse width (τ), and beam spot size (A). The obtained LDT value for the CHAP crystal was 1.166 GW/cm2. Fig. 17 shows the microscopic image of the irradiated crystal surface.
Fig. 17.
Laser damage threshold image of CHAP crystal.
Visual inspection revealed thermal effects as the primary cause of surface damage, potentially leading to melting or decomposition. The LDT value of the CHAP crystal, compared to other NLO crystals in Table 3, suggests good resistance to laser damage, making it a promising candidate for various NLO applications.
Table 3.
Comparison table for Laser damage threshold value of NLO crystals.
3.8. Thermal analyses
Thermal analyses are valuable tools for finding the material's thermal properties. The characterization was taken for the CHAP material. The TG/DTG and DSC thermograms are depicted in Fig. 18, Fig. 19. The TG plot of the CHAP molecule shows that no weight loss was observed from 30 to 152 °C, which concludes that the CHAP is thermally stable up to 150 °C. The endothermic peak was observed at 152 °C, and the exothermic peak was observed at 262 °C in the DSC curve, which confirms CHAP material as 152 °C. The decomposition of the CHAP molecule takes place in three stages. The first weight loss occurs in the temperature range 152 °C – 250 °C, which earns a weight loss of 28%. In this region, an exothermic peak at 260 °C appears in DTG and DSC measurements. It is due to the removable of the material as a gaseous concoction. The second weight loss is about 43%, which extends from 250 to 700 °C. The quantity of debris at the end measures about 29.23 %, which may be owing to the residual carbon mass.
Fig. 18.
TG/DTG traces of CHAP Crystal.
Fig. 19.
Dsc trace of CHAP crystal.
3.9. Mechanical study
The hardness of the materials measures the plastic deformation and its resistance. The mechanical property of CHAP crystal was determined using Vicker's micro-hardness test. This technique was widely used in industries to find the strength of the materials [29]. The crystal was mounted on the microscope's base, and several loads like 25 g, 50 g, and 100 g were applied on the top surface (101) crystal plane. The measurement was carried out for different loads 25, 50, and 100 g at room temperature.
The CHAP single crystal plane with a flat and smooth face is involved in the Vickers microhardness test. Uniform indentations were performed with a consistent indentation duration of 10 s for all applied loads. The diagonal length (d) was measured for each load, and the average of these measurements was taken into account. The calculation of the Vickers hardness number (Hv) was performed using the below equation (6) [30].
| (6) |
In this equation, the applied load (kg) is given by ‘P' and the diagonal length (mm) is represented by'd’. Fig. 20 illustrates the relationship between the hardness number (Hv) and the applied load (P). The crystal demonstrates a reverse indentation size effect (RISE) as the hardness rises with an increase in applied load [31]. Micro-cracks began to form on the surface of the crystal as the load increased. The plots of ‘Hv' against the indentation diagonal'd’ in Fig. 21 provide a clearer representation of this feature. Meyer's law establishes a correlation between the applied load (P) and the size of indentation (d) [32].
| (7) |
Fig. 20.
Variation of Hv vs. load P CHAP crystal.
Fig. 21.
Variation of Hv vs. diagonal (d) CHAP crystal.
The constant ‘A' represents an arbitrary value specific to the material, while ‘n' denotes the work-hardening coefficient of the CHAP single crystal. To observe typical ISE behavior, the exponent n should be less than 2. Reverse ISE behavior occurs when n is greater than 2. When the value of n is equal to 2, the hardness remains unaffected by the applied load and can be determined using Kick's law. The calculation of the value of ‘n' can be determined by analyzing Meyer's graph of ‘log P′ versus ‘log d'. By using the relevant data and employing the least squares method, straight-line graphs are obtained, as depicted in Fig. 22. The numerical value of ‘n' was determined to be 4.2. The grown CHAP crystal was confirmed to belong to the class soft material category [33]. In this instance, the calculation of the material's yield strength (σy) can be determined based on the hardness value (Hv). Meyer's index, which was determined to be 4.2 (with a range of 2 < n < 3), can be used in the following equation to make this calculation 6.
| (8) |
Fig. 22.
Plot of load (log P) vs. diagonal (log d) CHAP crystal.
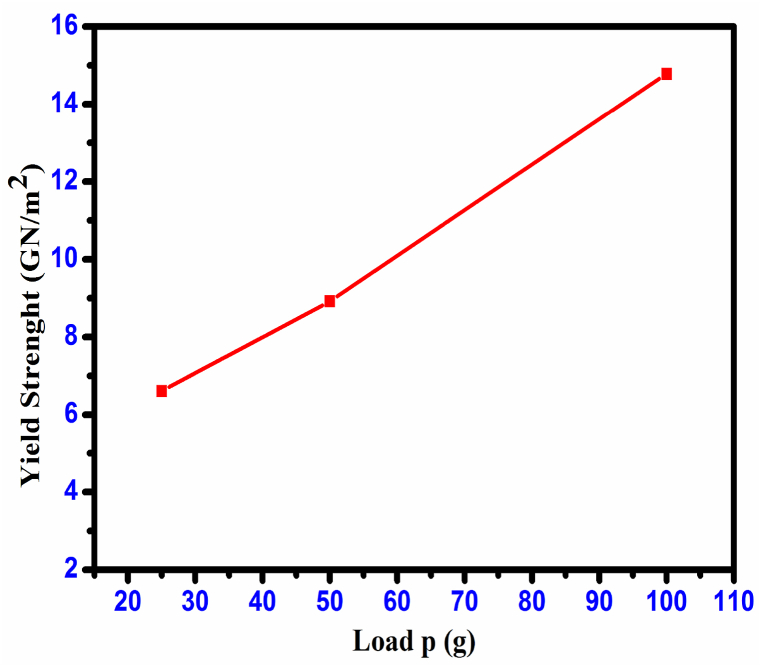
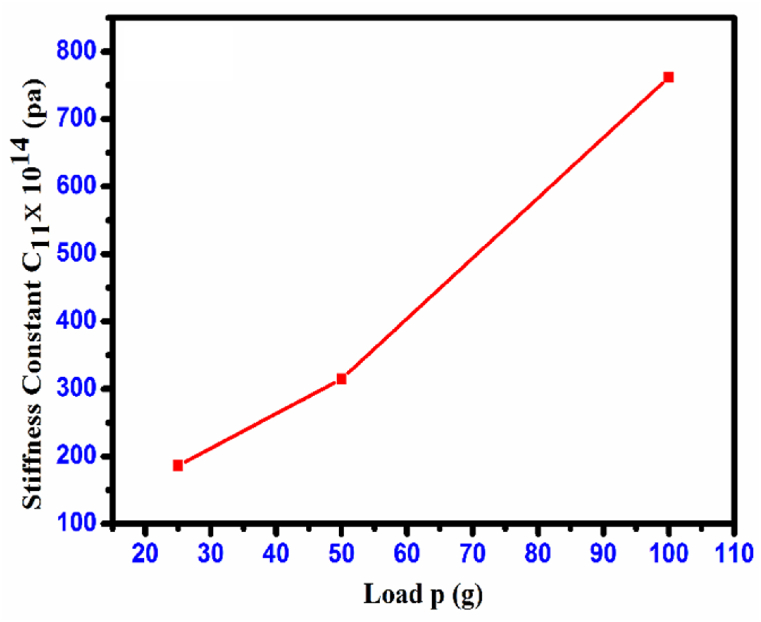
Fig. 23 illustrates a graph representing the relationship between load (P) and yield strength (σy). The determination of the elastic stiffness constant (C11) was carried out using Wooster's empirical relation [34], which offers a general understanding of the strength of the inter-atomic bonding in the materials. Fig. 24 illustrates the relationship between load (P) and stiffness constant (C11) for the CHAP crystal. Table 4 presents the computed Vickers hardness values (Hv), yield strength (σy), stiffness constant (C11), and CHAP crystal values for various loads. The explanation for the non-linear behavior of hardness in the material, as proposed by Hays- Kendall, can be expressed analytically as shown in equation [35].
| (9) |
Fig. 23.
Plot of yield strength (σy) vs. load P CHAP crystal.
Fig. 24.
Variation of stiffness constant (C11) with load P CHAP crystal.
Table 4.
Calculated mechanical parameters of CHAP Crystal.
|
Load P (g) |
Hv (kg mm−2) | σy (GN/m2) | C11 × 1014 (Pa) |
|---|---|---|---|
|
25 |
80.08 |
6.607689 | 186.2297135 |
|
50 |
86.92 |
8.920961 | 314.9071983 |
|
100 |
104.39 |
14.78007 | 761.8964838 |
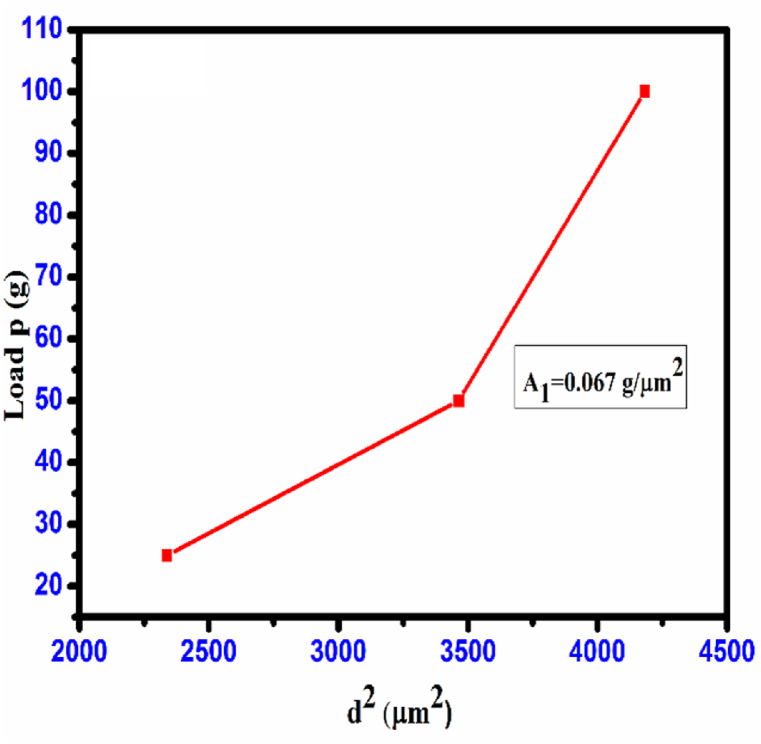
The minimum load required to cause plastic deformation, denoted as ‘W', is measured in grams (g). Additionally, ‘A1' represents a constant that is not dependent on the load. The values of ‘W' and ‘A1' were estimated based on the plots depicting the relationship between loads ‘P' and ‘d2' as illustrated in Fig. 25[36], the value of ‘W' becomes negative, suggesting that the CHAP crystal exhibits RISE behavior during growth. The Proportional Specimen Resistance Model [PSRM] was suggested by multiple researchers [[37], [38], [39], [40]], and its behavior can be described by the following equation:
| (10) |
Fig. 25.
Plot of load P vs. d2 CHAP crystal.
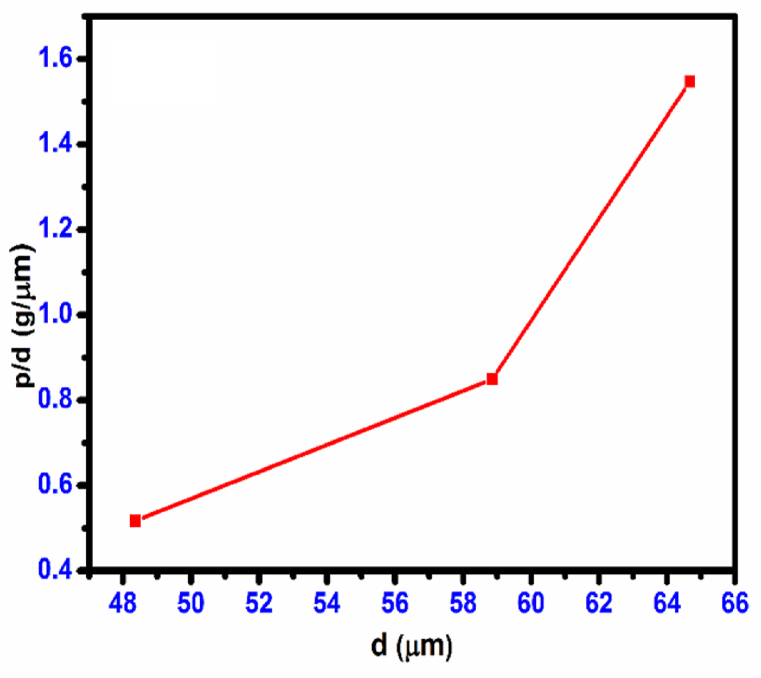
The hardness is characterized by the parameter ‘a', which represents the load dependence, while the constant ‘b' remains independent of the load. Various factors have been associated with the term ‘ad', including specimen surface energy [40,41], the deformed surface layer [42], indenter edges functioning as plastic hinges [40], and proportional specimen resistance [39]. The value of the constant ‘b' can be determined by analyzing the relationship between ‘P/d' and ’d’ as depicted in Fig. 26. The value of ‘a' can be obtained from equation (10) using the following method: It is important to mention that when a value is greater than zero, a typical inverse square law effect occurs where the variable ‘Hv' decreases as the indentation diagonal (d) increases. In the case of reverse ISE behavior, when a value is less than zero, the decrease in ‘Hv' is observed with an increase in the diagonal indentation (d).
Fig. 26.
Plot of P/d vs. d CHAP crystal.
3.10. Crystal void analysis
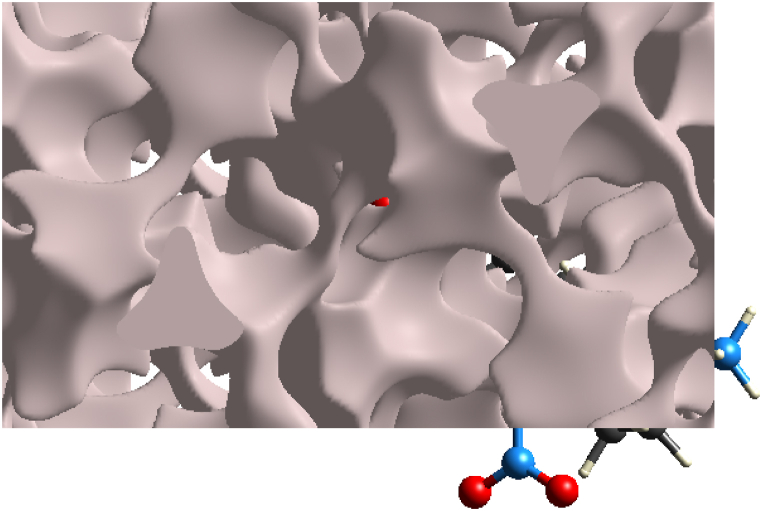
The Crystal Explorer 17.5 software was utilized to determine the volume of voids in the crystal using the (0.002 au)-isosurface of the procrystal electron density. This software is capable of accurately calculating the voids and their volume in the co-crystal. The surface of the voids in the crystal structure is depicted in Fig. 27, providing a visual representation of the voids present in the crystal. The crystal packing is caused by O–H⋯N and N–H⋯O hydrogen bonds, which are strong intermolecular forces that hold the crystal structure together. The void volume is 399.38 Å3 and the surface area is 1187.74 Å2. These values indicate that the voids present in the crystal are relatively small. As a result, the calculated void volume in the CHAP crystal is 2.15%, indicating that there are no significant cavities present in the crystal structure.
Fig. 27.
CHAP unit cell void at (0.002 au)-isosurface.
3.11. Z-scan measurement
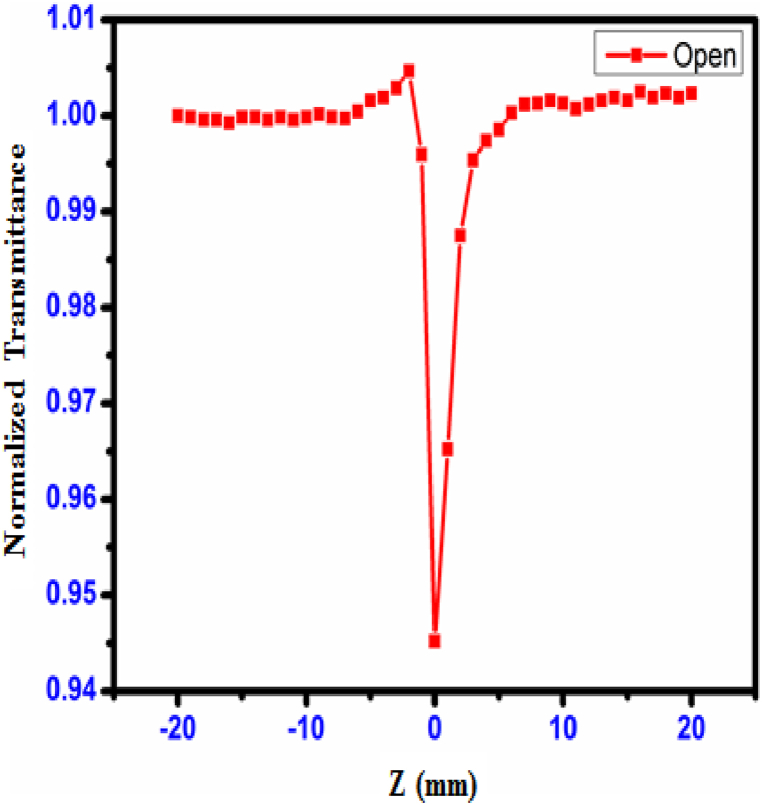
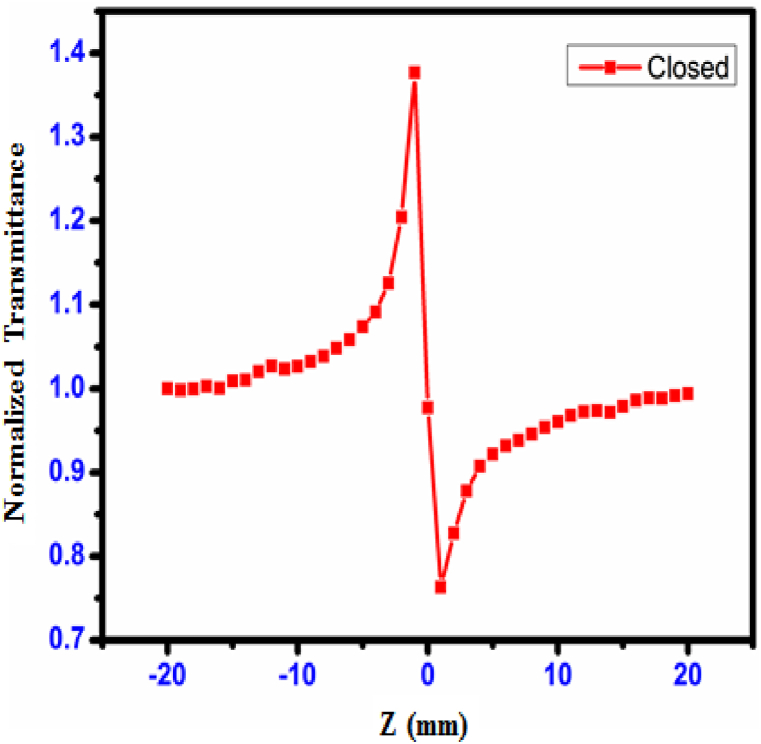
The Z-scan method [43] is a typical approach that is used to assess the crystal's third-order non-linear optical susceptibility. This susceptibility is measured as a percentage. The sign and magnitude of the non-linear refractive index (n2) and the non-linear absorption coefficient (β) were measured using a method called the single-beam method; in comparison to interferometric approaches, this technique possesses a high degree of sensitivity. Fig. 28, Fig. 29 depict, respectively, the open and closed aperture curves produced for the CHAP single crystal. The pre-focal peak to post-focal valley result from the closed aperture was seen to imply a negative third-order non-linear refractive index, which is the reason for the self-defocusing characteristic of the object. Alterations in the temperature and the refractive index both contribute to the formation of the negative refractive index. It was noticed that the non-linear refraction behaved in a way that was insensitive when the aperture was completely open. The minimum transmittance (valley) results were observed due to multi-photon absorption [44]. In an open aperture, two-photon absorption is a reason for peak lie at Z = 0. In Open apeature, the sample is moved along the Z-axis through the focal point of the lens while the laser power is kept constant. Measure the transmitted or reflected intensity as a function of the sample position. Analyze the data to extract the nonlinear absorption coefficient (β). The Closed-aperture Z-Scan: a narrow aperture is placed in front of the detector, allowing only the central portion of the beam to be detected. The sample is scanned through the focal point, and the transmitted or reflected intensity is measured. This technique is used to determine the nonlinear refractive index (n2).
Fig. 28.
Open aperture curve of CHAP crystal.
Fig. 29.
Closed aperture curve of CHAP crystal.
The determination of the real and imaginary components of the third-order non-linear optical susceptibility was computed by,
| (11) |
| (12) |
| (13) |
The refractive index (n2), absorption coefficient (β), and third-order susceptibility of the CHAP crystal were determined to be 7.62 × 10⁻⁹ cm2/W, 8.73 × 10⁻⁵ cm/W, and 2.45 × 10⁻⁶ esu, respectively. Table 5 presents a comparison of the third-order NLO susceptibilities of cyclohexylamine derivatives. The results show that CHAP crystal is a good third-order NLO material in cyclohexylamine derivative.
Table 5.
Comparison table of Third-order NLO values of Cyclohexylamine derivative materials.
4. Conclusion
The growth of Cyclohexylammonium picrate organic single crystals was achieved using the slow evaporation method. The single-crystal XRD techniques were used to verify the lattice cell parameters. The high-resolution X-ray diffraction analysis of the CHAP crystal indicates that it has excellent crystalline perfection with an FWHM of 14 arcsec. The different vibration modes of the CHAP molecule were determined by analyzing the FT-IR and FT-Raman spectra. The detection of NH3+ vibrations supports the confirmation of proton transfer from picric acid to cyclohexylamine. We analyzed the Hirshfeld surfaces and their corresponding 2D fingerprint plots to study the intermolecular interactions in the crystal arrangement. This investigation has confirmed that the main factor responsible for the stability of the crystal structure is the existence of hydrogen bonding interactions. A study was conducted on the CHAP sample to analyze its optical properties, specifically to determine the cut-off wavelength and band gap of the material. Based on the findings of the optical study, it was determined that the cut-off and band gap values were 461 nm and 2.6 eV, respectively. The TG and DSC analysis revealed the thermal stability, melting point, and various stages of decomposition of the material. It was found that the material remains thermally stable up to a temperature of 152 °C. The mechanical strength of the CHAP crystal was evaluated through a Vickers hardness analysis, which indicated that the crystal possesses a low level of hardness. The examination of the empty space within the unit cell, comprising 2.15% of the overall volume, suggests that the resulting crystal is characterized by its hardness. The crystal's electrical behavior was determined through a dielectric study. The Z-scan study revealed that the CHAP crystal has a third-order non-linear optical susceptibility of 2.45 × 10⁻⁶ esu. These findings suggest that the CHAP crystal holds potential for applications in non-linear optics.
CRediT authorship contribution statement
A. Senthil: Writing – review & editing, Supervision, Project administration, Dr. T. Bharanidharan: Writing – review & editing, Writing – original draft, Visualization, Validation, Software, Resources, Methodology, Investigation, Formal analysis, Data curation, Conceptualization. M. Vennila: Writing – review & editing, Visualization, Validation. Elangovan K: Writing – review & editing, Writing – original draft, Formal analysis, Conceptualization, Dr. S. Muthu: Visualization, Validation, Resources.
Declaration of competing interest
The authors declare that they have no known competing financial interests or personal relationships that could have appeared to influence the work reported in this paper.
Acknowledgements
The authors are thankful to VIT University for providing lab and instrument facilities and to Dr. G. Vinitha, VIT University, Chennai for Z scan analysis.
References
- 1.Helen F., Kanchana G. Growth, mechanical, dielectric, thermal and optical studies of a non-linear optical crystal: L-Histidinium dipicrate dihydrate. Mater. Chem. Phys. 2015;151:5–13. [Google Scholar]
- 2.Sathya P., Anantharaja M., Elavarasu N., Gopalakrishnan R. Growth and characterization of non-linear optical single crystal: bis(cyclohexylammonium) terephthalate and cyclohexylammonium para-methoxy benzoate. Bull. Mater. Sci. 2015;38:1291–1299. [Google Scholar]
- 3.Gomathi R., Madeswaran S., Rajan Babu D., Aravindan G. Non-linear optical, optical limiting and dielectric properties of organic cyclohexylammonium acetate single crystal. Mater. Lett. 2017;209:240–243. [Google Scholar]
- 4.Gomathi R., Madeswaran S. Structural, thermal and non-linear optical studies on novel organic cyclohexylammonium hydrogen adipate crystal. Mater. Chem. Phys. 2018;218:189–195. [Google Scholar]
- 5.Gomathi R., Madeswaran S., Rajan Babu D. Growth and characterization of cyclohexylaminium hydrogen phthalate hemihydrate non-linear optical single crystals. J. Mater. Sci. Mater. Electron. 2017;28(15):11374–11382. [Google Scholar]
- 6.Kama, Antoine Blaise, Génois Romain, Massuyeau Florian, Sidibé Mamadou, Cheikh AK Diop, Gautier Romain. Cyclohexylammonium sulfanilate: a simple representative of the chiral materials containing only achiral building units. Mater. Lett. 2019;241:6–9. [Google Scholar]
- 7.Gomathi R., Madeswaran S., Rajan Babu D. Bulk growth, electrical, linear, third order non-linear optical and optical limiting properties on bis (cyclohexylammonium) succinate succinic acid crystal. Materials Chemistry and Physics. 2018;207:84–90. [Google Scholar]
- 8.Sathya P., Anantharaja M., Elavarasu N., Gopalakrishnan R. Growth and characterization of non-linear optical single crystals: bis (cyclohexylammonium) terephthalate and cyclohexylammonium para-methoxy benzoate. Bull. Mater. Sci. 2015;38(5):1291–1299. [Google Scholar]
- 9.Senthil K., Senthil A., Elangovan K. Crystal structure, growth and physiochemical properties of non-linear optical single crystal: bis (cyclohexylammonium) dioxalate hydrate. J. Mol. Struct. 2020 [Google Scholar]
- 10.Senthil K., Elangovan K., Senthil A., Vinitha G. Synthesis, growth, optical, mechanical, thermal, dielectric and third order non-linear optical properties of Cyclohexylamine derivative single crystals. Spectrochim. Acta Mol. Biomol. Spectrosc. 2020 doi: 10.1016/j.saa.2020.119063. [DOI] [PubMed] [Google Scholar]
- 11.Muthamizhchelvan C., Saminathan K., SethuSankar K., Sivakumar K. Cyclohexylammonium picrate. Acta Crystallogr., Sect. E: Struct. Rep. Online. 2005;61(11):o3605–o3607. [Google Scholar]
- 12.Spackman Mark A., Dylan Jayatilaka. Hirshfeld surface analysis. CrystEngComm. 2009;11(1):19–32. [Google Scholar]
- 13.Spackman Mark A., McKinnon Joshua J. Fingerprinting intermolecular interactions in molecular crystals. CrystEngComm. 2002;4(66):378–392. [Google Scholar]
- 14.Batterman Boris W., Henderson Cole. Dynamical diffraction of X rays by perfect crystals. Rev. Mod. Phys. 1964;36(3):681. [Google Scholar]
- 15.Varsanyi G., Szoke S. New York and London; 1969. Vibrational Spectra of Benzene Derivatives. [Google Scholar]
- 16.Abkowicz-Bienko A.J., Bienko D.C., Latajka Z. Density functional studies on the two conformers of 2-fluoro-4, 6-dinitrophenol: vibrational assignment based on potential energy distribution. J. Mol. Struct. 2000;552(1–3):165–175. [Google Scholar]
- 17.Silverstein M., Clayton Basseler G., Moril C. Wiley; New York: 1981. “Spectrometric Identification of Organic Compounds”. [Google Scholar]
- 18.Akalin E., Sevim Akyüz. Force field and IR intensity calculations of aniline and transition metal (II) aniline complexes. Journal of molecular structure. 1999;482:175–181. [Google Scholar]
- 19.Sathyanarayana Dixit N. New Age International; 2015. Vibrational Spectroscopy: Theory and Applications. [Google Scholar]
- 20.Abkowicz-Bieńko, Agnieszka J., Latajka Zdzisław, Bieńko Dariusz C., Danuta Michalska. Theoretical infrared spectrum and revised assignment for para-nitrophenol. Density functional theory studies. Chem. Phys. 1999;250(2):123–129. [Google Scholar]
- 21.Bharanidharan T., Senthil A. Crystal growth, spectroscopic, hirshfeld surface analysis, optical, and non-linear aspects of 2-methylimidazolium nitrate organic single crystal. J. Mol. Struct. 2023;1284 [Google Scholar]
- 22.Mohana J., Ahila G., Divya Bharathi M., Anbalagan G. Growth, spectral, optical, thermal, and mechanical behaviour of an organic single crystal: quinolinium 2- carboxy 6-nitrophthalate monohydrate. J. Cryst. Growth. 2016;450:181–189. [Google Scholar]
- 23.Mott N.F., Davis E.A. second ed. Clarendon Press; Oxford: 1979. Electronic Processes in Non-crystalline Materials. [Google Scholar]
- 24.Tauc J. Plenum Press; New York: 1974. Amorphous and Liquid Semiconductors; pp. 159–220. [Google Scholar]
- 25.Bharanidharan T., Senthil A. Crystal growth, spectral, Hirshfeld surface analysis, and physicochemical properties of third-order non-linear optical single crystal: 2- methylimidazolium hydrogen adipate. J. Mol. Struct. 2023;1272 [Google Scholar]
- 26.Karuppasamy P., Kamalesh T., Mohankumar V., Abdul Kalam S., Pandian Muthu Senthil, Ramasamy P., Verma Sunil, Venugopal Rao S. Synthesis, growth, structural, optical, thermal, laser damage threshold and computational perspectives of 4-nitrophenol 4- aminobenzoic acid monohydrate (4NPABA) single crystal. Journal of Molecular Structure. 2019;1176:254–265. [Google Scholar]
- 27.Daniel D. Joseph, Ramasamy P. Studies on semi-organic non linear optical single crystal: lithium formate monohydrate (HCO2Li⋅ H2O) Opt. Mater. 2014;36(5):971–976. [Google Scholar]
- 28.Pandi P., Peramaiyan G., Bhagavannarayana G., Mohan Kumar R., Jayavel R. Growth, structural, optical and laser damage threshold studies of organic picolinium picrate monohydrate single crystals. Optik. 2013;124(22):5792–5796. [Google Scholar]
- 29.Rajasekaran R., Senthil A., Parthasarathy V., Bharanidharan T. Investigation on the crystal growth, optical, mechanical, and third harmonic generation properties of 2-aminopyridinium adipate monoadipic acid dihydrate single crystal. J. Mater. Sci. Mater. Electron. 2023;34(7):593. [Google Scholar]
- 30.Karan Susmita, Gupta SP Sen. Vickers microhardness studies on solution- grown single crystals of magnesium sulphate hepta-hydrate. Mater. Sci. Eng., A. 2005;398(1–2):198–203. [Google Scholar]
- 31.Sangwal K. On the reverse indentation size effect and microhardness measurement of solids. Mater. Chem. Phys. 2000;63(2):145–152. [Google Scholar]
- 32.Sangwal K., Kłos A. Study of microindentation hardness of different planes of gadolinium calcium oxyborate single crystals. Cryst. Res. Technol.: Journal of Experimental and Industrial Crystallography. 2005;40(4‐ 5):429–438. [Google Scholar]
- 33.Sangwal K. On the reverse indentation size effect and microhardness measurement of solids. Mater. Chem. Phys. 2000;63(2):145–152. [Google Scholar]
- 34.Li Hong, Bradt R.C. The microhardness indentation load/size effect in rutile and cassiterite single crystals. J. Mater. Sci. 1993;28(4):917–926. [Google Scholar]
- 35.Hays C., Kendall E.G. An analysis of Knoop microhardness. Metallography. 1973;6(4):275–282. [Google Scholar]
- 36.Abu El-Fadl A., Soltan A.S., Shaalan N.M. Influence of x-irradiation on indentation size effect and formation of cracks for [Ky (NH4) 1-y] 2ZnCl4 mixed crystals. Cryst. Res. Technol.: Journal of Experimental and Industrial Crystallography. 2007;42(4):364–377. [Google Scholar]
- 37.Ma Qing, Clarke David R. Size dependent hardness of silver single crystals. J. Mater. Res. 1995;10(4):853–863. [Google Scholar]
- 38.Sangwal K., Kłos A. Study of microindentation hardness of different planes of gadolinium calcium oxyborate single crystals. Cryst. Res. Technol.: Journal of Experimental and Industrial Crystallography. 2005;40(4‐ 5):429–438. [Google Scholar]
- 39.Li Hong, Bradt R.C. The microhardness indentation load/size effect in rutile and cassiterite single crystals. J. Mater. Sci. 1993;28(4):917–926. [Google Scholar]
- 40.Bharanidharan T., Senthil A., Ranjith S. Synthesis, crystal growth, structural and physicochemical properties of N-methylurea benzoic acid single crystal for non-linear optical applications. J. Mol. Struct. 2023;1281 [Google Scholar]
- 41.Michels B.D., Frischat G.H. Microhardness of chalcogenide glasses of the system Se-Ge-As. J. Mater. Sci. 1982;17(2):329–334. [Google Scholar]
- 42.Oliver W.C., Hutchings R., Pethica J.B. In: Microindentation Techniques in Materials Science and Engineering. Blau P.J., Lawn B.R., editors. ASTM; Philadelphia PA: 1986. pp. 90–108. [Google Scholar]
- 43.Sheik-Bahae Mansoor, Said Ali A., Van Stryland Eric W. High-sensitivity, single-beam n 2 measurements. Optics letters. 1989;14(17):955–957. doi: 10.1364/ol.14.000955. [DOI] [PubMed] [Google Scholar]
- 44.Dovichi N.J., Harris J.M. Laser induced thermal lens effect for calorimetric trace analysis. Anal. Chem. 1979;51(6):728–731. [Google Scholar]


