

Abstract
Local delivery of immune-activating agents has shown promise in overcoming immunosuppressive tumor microenvironment (TME) and stimulating anti-tumor immune responses in tumors. However, systemic therapy is ultimately needed to treat tumors that are not readily locatable or accessible. To enable systemic delivery of immune-activating agents, we employ poly(lactic-co-glycolide) (PLGA) nanoparticles (NPs) with a track record in systemic application. The surface of PLGA NPs is decorated with adenosine triphosphate (ATP), a damage-associated molecular pattern to recruit antigen-presenting cells (APCs). The ATP-conjugated PLGA NPs (NPpD-ATP) are loaded with paclitaxel (PTX), a chemotherapeutic agent inducing immunogenic cell death to generate tumor antigens in situ. We show that the NPpD-ATP retains ATP activity in hostile TME and provides a stable “find-me” signal to recruit APCs. Therefore, the PTX-loaded NPpD-ATP helps populate anti-tumor immune cells in TME and attenuate the growth of CT26 and B16F10 tumors better than a mixture of PTX-loaded NPpD and ATP. Combined with anti-PD-1 antibody, PTX-loaded NPpD-ATP achieves complete regression of CT26 tumors followed by anti-tumor immune memory. This study demonstrates the feasibility of systemic immunotherapy using a PLGA NP formulation that delivers ICD-inducing chemotherapy and an immunostimulatory signal.
Keywords: Chemoimmunotherapy, systemic delivery, PLGA nanoparticles, adenosine triphosphate, immunogenic cell death, paclitaxel
Immunotherapy is a promising approach to the battle with cancer, recognized as one of the four pillars of cancer treatment.1 However, it only benefits a small subset of patients,2,3 primarily due to various conditions limiting anti-tumor immune responses.4 These conditions include insufficient presence, processing, and presentation of tumor antigens,5 as well as inadequate functions of tumor-specific immune cells.4 Accordingly, tumors have been locally treated to stimulate anti-tumor immune responses in situ. Local immunotherapy employs combinations of agents that induce immunogenic cell death (ICD), recruit and activate antigen-presenting cells (APCs), and/or maintain the activities of tumor-specific cytotoxic T cells.6–9 The rationale behind local therapy is that the treated tumors may serve as an in-situ depot of tumor antigens and elicit anti-tumor immune responses to address primary tumors as well as hard-to-reach distant tumors via circulating immune cells.10 However, most tumors with poor prognoses are not always locatable and accessible and, thus, may not be effectively treated by local therapy.
Given the limitation of local immunotherapy, we envision that systemic delivery of immune-activating combinations is necessary to extend the therapeutic benefit for a broader population of cancer patients. For successful immune-activating therapy by systemic administration, active ingredients stimulating anti-tumor immune responses need to be colocalized in tumors to exert concerted effects on the target. It is also important that immunostimulants maintain the activities until they reach tumors but do not cause systemic side effects. However, the formulations typically used for local immunotherapy, such as hydrogels or microparticles,11 are unsuitable for systemic administration. Moreover, biomaterials tolerated in local delivery, such as cationic polymers12,13 or inorganic compounds, may not be compatible with blood components and thus offer limited utility in systemic application.
To enable systemic delivery of immunotherapy, we have developed adenosine triphosphate (ATP)-modified poly(lactic-co-glycolide) (PLGA) nanoparticles (NPs) as a carrier. We employ PLGA NPs based on the strong track record of the polymer in FDA-approved products14 and its routine use in the systemic delivery of poorly water-soluble drugs.15 The surface of PLGA NPs is further modified with ATP, a nucleotide chemoattractant serving as a “find-me” signal to access and recruit dendritic cells.16–18 The ATP-conjugated NPs (NPpD-ATP) are loaded with a chemotherapy drug inducing ICD to produce tumor antigens and immunostimulatory signals in situ. We expect that NPpD-ATP would co-deliver an ICD inducer and an attractant of APCs to solid tumors by systemic administration, generating an immunoactive tumor microenvironment (TME) conducive to immunotherapy.
Here, we report on the design, production, and characterization of NPpD-ATP delivering paclitaxel (PTX). We evaluate the anti-tumor activity of PTX-loaded NPpD-ATP (PTX@NPpD-ATP) in mouse tumor models and investigate the role of each component. The immune microenvironment of the tumor is analyzed to elucidate the mechanism by which the NPs suppress tumor growth or face resistance. An additional regimen is explored to complement the therapeutic efficacy of PTX@NPpD-ATP and achieve complete tumor regression in most subjects. The results support the potential of systemic immunotherapy via NPs delivering immunostimulatory agents, which can be used in conjunction with standard cancer immunotherapy.
Results
PTX and CFZ are ICD inducers
We first identified chemotherapeutic agents inducing ICD, a form of cell death that produces tumor-associated antigens and damage-associated molecular patterns (DAMPs). ICD induction is judged by the level of DAMPs produced by drug-treated cells, such as calreticulin (CRT), high mobility group B1 (HMGB1), and ATP,16 which alert APCs so they recognize and process the antigens. ICD induction is confirmed in vivo by testing whether the cells treated with the candidate drug at a lethal level can prevent tumor growth upon challenge with live cells.19–21 However, drugs with a common mechanism of action do not always have the same ability to induce ICD. For example, both oxaliplatin and cisplatin are platinum compounds that crosslink DNA strands to inhibit DNA synthesis and function;22 however, oxaliplatin (OXA) induces ICD, but not the latter.23 Therefore, a drug’s potential to induce ICD needs to be experimentally determined.
We tested PTX and carfilzomib (CFZ) following the consensus guidelines to verify ICD induction.24 PTX, an inhibitor of microtubule depolymerization, causes a cell cycle arrest in the G2/M phase by interfering with spindle formation.25 This process induces cell death involving massive endoplasmic reticulum (ER) stress, making PTX a potential ICD inducer. CFZ, a second-generation epoxyketone proteasome inhibitor, establishes an irreversible and covalent interaction with the 20S proteasome of cancer cells,26,27 which leads to the production of unfolded proteins, thereby causing ER stress. PTX and CFZ were tested on CT26 murine carcinoma cells and compared with OXA (known ICD inducer) and gemcitabine (GEM, known non-ICD inducer). OXA, PTX, and CFZ, but not GEM, caused CRT exposure on CT26 cells (Fig. 1a). Likewise, OXA, PTX, and CFZ induced the release of HMGB1 and ATP, but GEM did not. Consistent with the production of DAMPs and tumor-associated antigens, CT26 cells treated with PTX or CFZ for 6 or 24 hours were better taken up by JAWSII dendritic cells than non-treated cells (Fig. 1b). These results support the notion that PTX and CFZ can induce ICD, consistent with earlier reports with the literature.28–30
Fig. 1. PTX and CFZ induce immunogenic cell death.
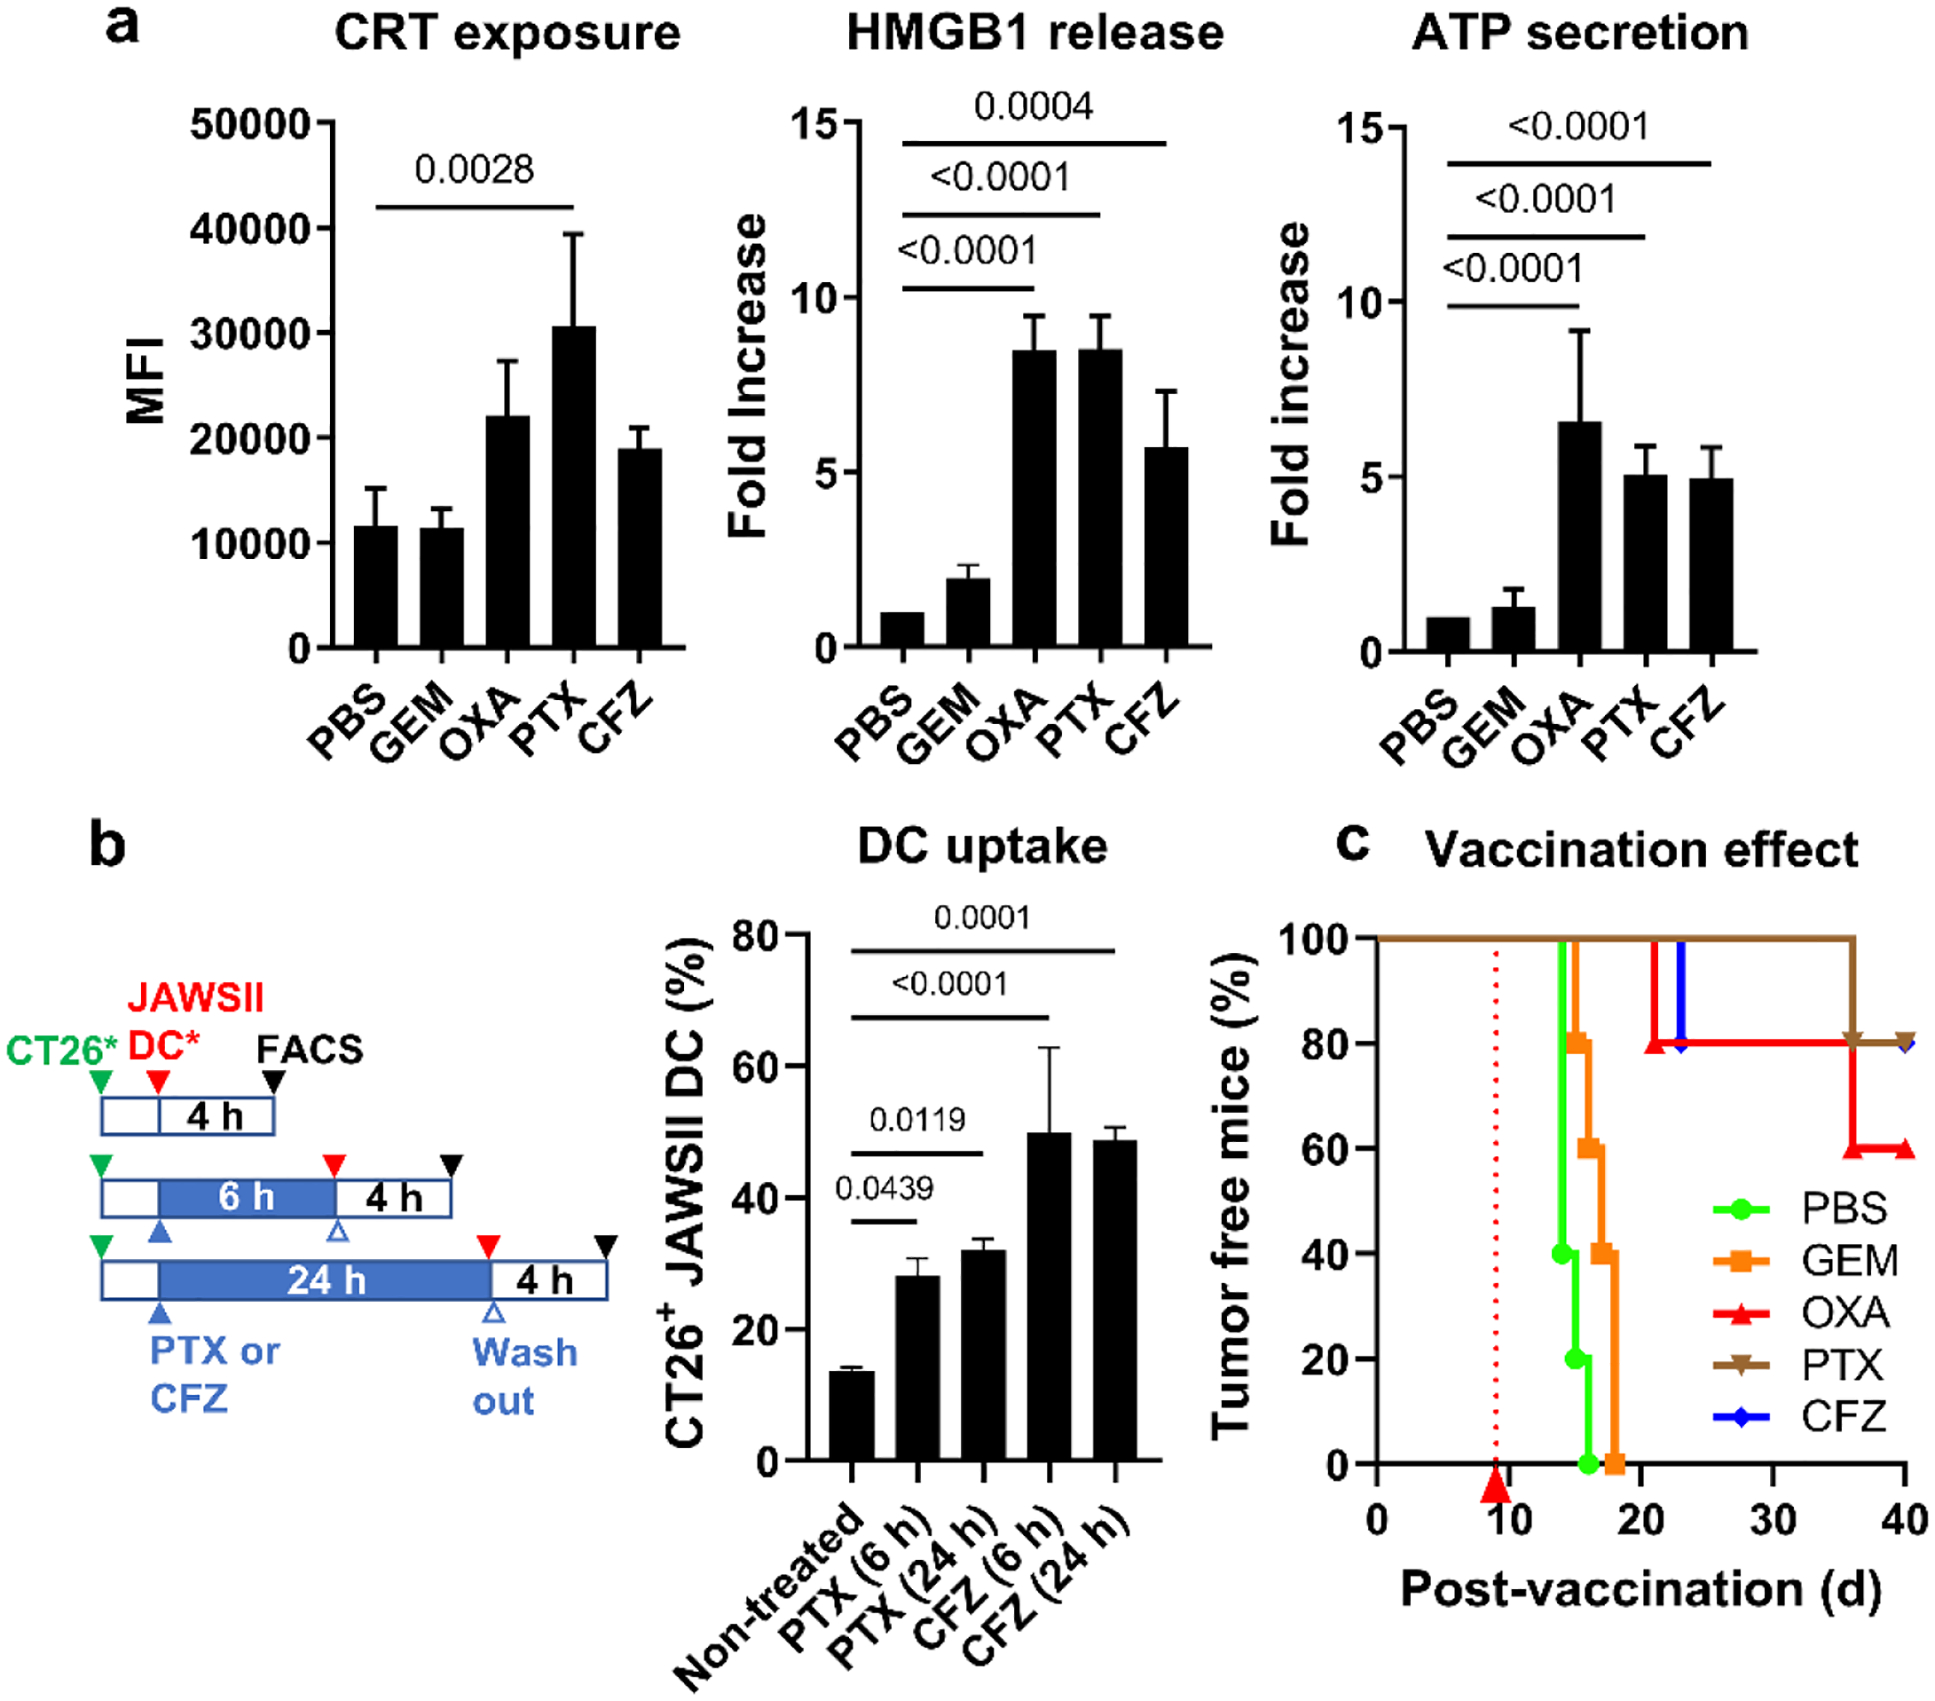
(a) Damage-associated molecular patterns (DAMPs: CRT exposed on the cell surface, HMGB1 in the medium, and ATP in the medium) expressed by CT26 cells after the treatment with cytotoxic agents at IC50. Gemcitabine (GEM): non-ICD inducer, negative control; oxaliplatin (OXA): known ICD inducer, positive control. n=3 replicates of a representative batch, mean ± SD. (b) JAWSII dendritic cell phagocytosis of CT26 cells treated with CFZ or PTX for 6 or 24 hours. n=3 replicates of a representative batch, mean ± SD. (c) Vaccination study with PBS as a negative control, GEM as a known non-ICD inducer, OXA as a known ICD inducer, and PTX and CFZ as candidate ICD inducers. P-values were calculated by one-way ANOVA with Dunnett’s multiple comparisons test.
A vaccination study31 was performed to confirm the ICD induction. CT26 cells were treated with PTX, CFZ, and two reference drugs (OXA and GEM) at 100× IC50 of each drug. After removing the excess drug, the treated cells were subcutaneously injected into immunocompetent BALB/c mice, the syngeneic host of CT26 cells. When the mice were rechallenged with live CT26 cells 9 days later, tumors grew in all animals pre-inoculated with phosphate-buffered saline (PBS, negative control) or GEM-treated cells (Fig. 1c). In contrast, tumors did not grow in 60–80% of animals pre-inoculated with OXA-, PTX-, or CFZ-treated cells, indicating that the cells killed by these drugs induced anti-tumor immunity. The in vitro DAMP screening and in vivo vaccination study collectively show that PTX and CFZ are ICD inducers.
PLGA NPs coated with ATP (NPpD-ATP) provide a stable “find-me” signal
ATP-conjugated NPs were first produced without a drug to examine the immune functionality of the carrier itself. PLGA NPs were produced with a target diameter of < 200 nm for systemic administration. ATP was conjugated on the NP surface via a polydopamine coating, known to accommodate ligands with nucleophilic functional groups via Michael addition and/or Schiff base reaction.32 PLGA NPs were incubated with dopamine under an oxidative condition (pH 8.5) to form a surface layer of polydopamine. The polydopamine-coated PLGA NPs (NPpD) were further incubated with ATP to produce ATP-coated NPs (NPpD-ATP) (Fig. 2a). The FTIR spectrum showed a new peak at 1648 cm−1 (Supporting Fig. 1) corresponding to imine (C=N) stretching,33 which indicated the covalent conjugation of ATP to polydopamine on NP surface. The z-average (intensity average) and the zeta potential of NPpD-ATP, measured by dynamic light scattering, were 206 ± 7.2 nm and −11.1 ± −3.1 mV, respectively. The diameter measured by transmission electron microscopy (TEM) was ~100 nm (Fig. 2b). This difference suggests the presence of minor aggregation, whose contribution is amplified in the intensity-weighted z-average.34 The ATP conjugation increased in proportion to the ATP to NP ratio until it reached the maximum of 12.5 wt% at the ATP to NP w/w ratio of 50:1 (Fig. 2c).
Fig. 2. PLGA NPs coated with ATP (NPpD-ATP) protect ATP and attract dendritic cells.
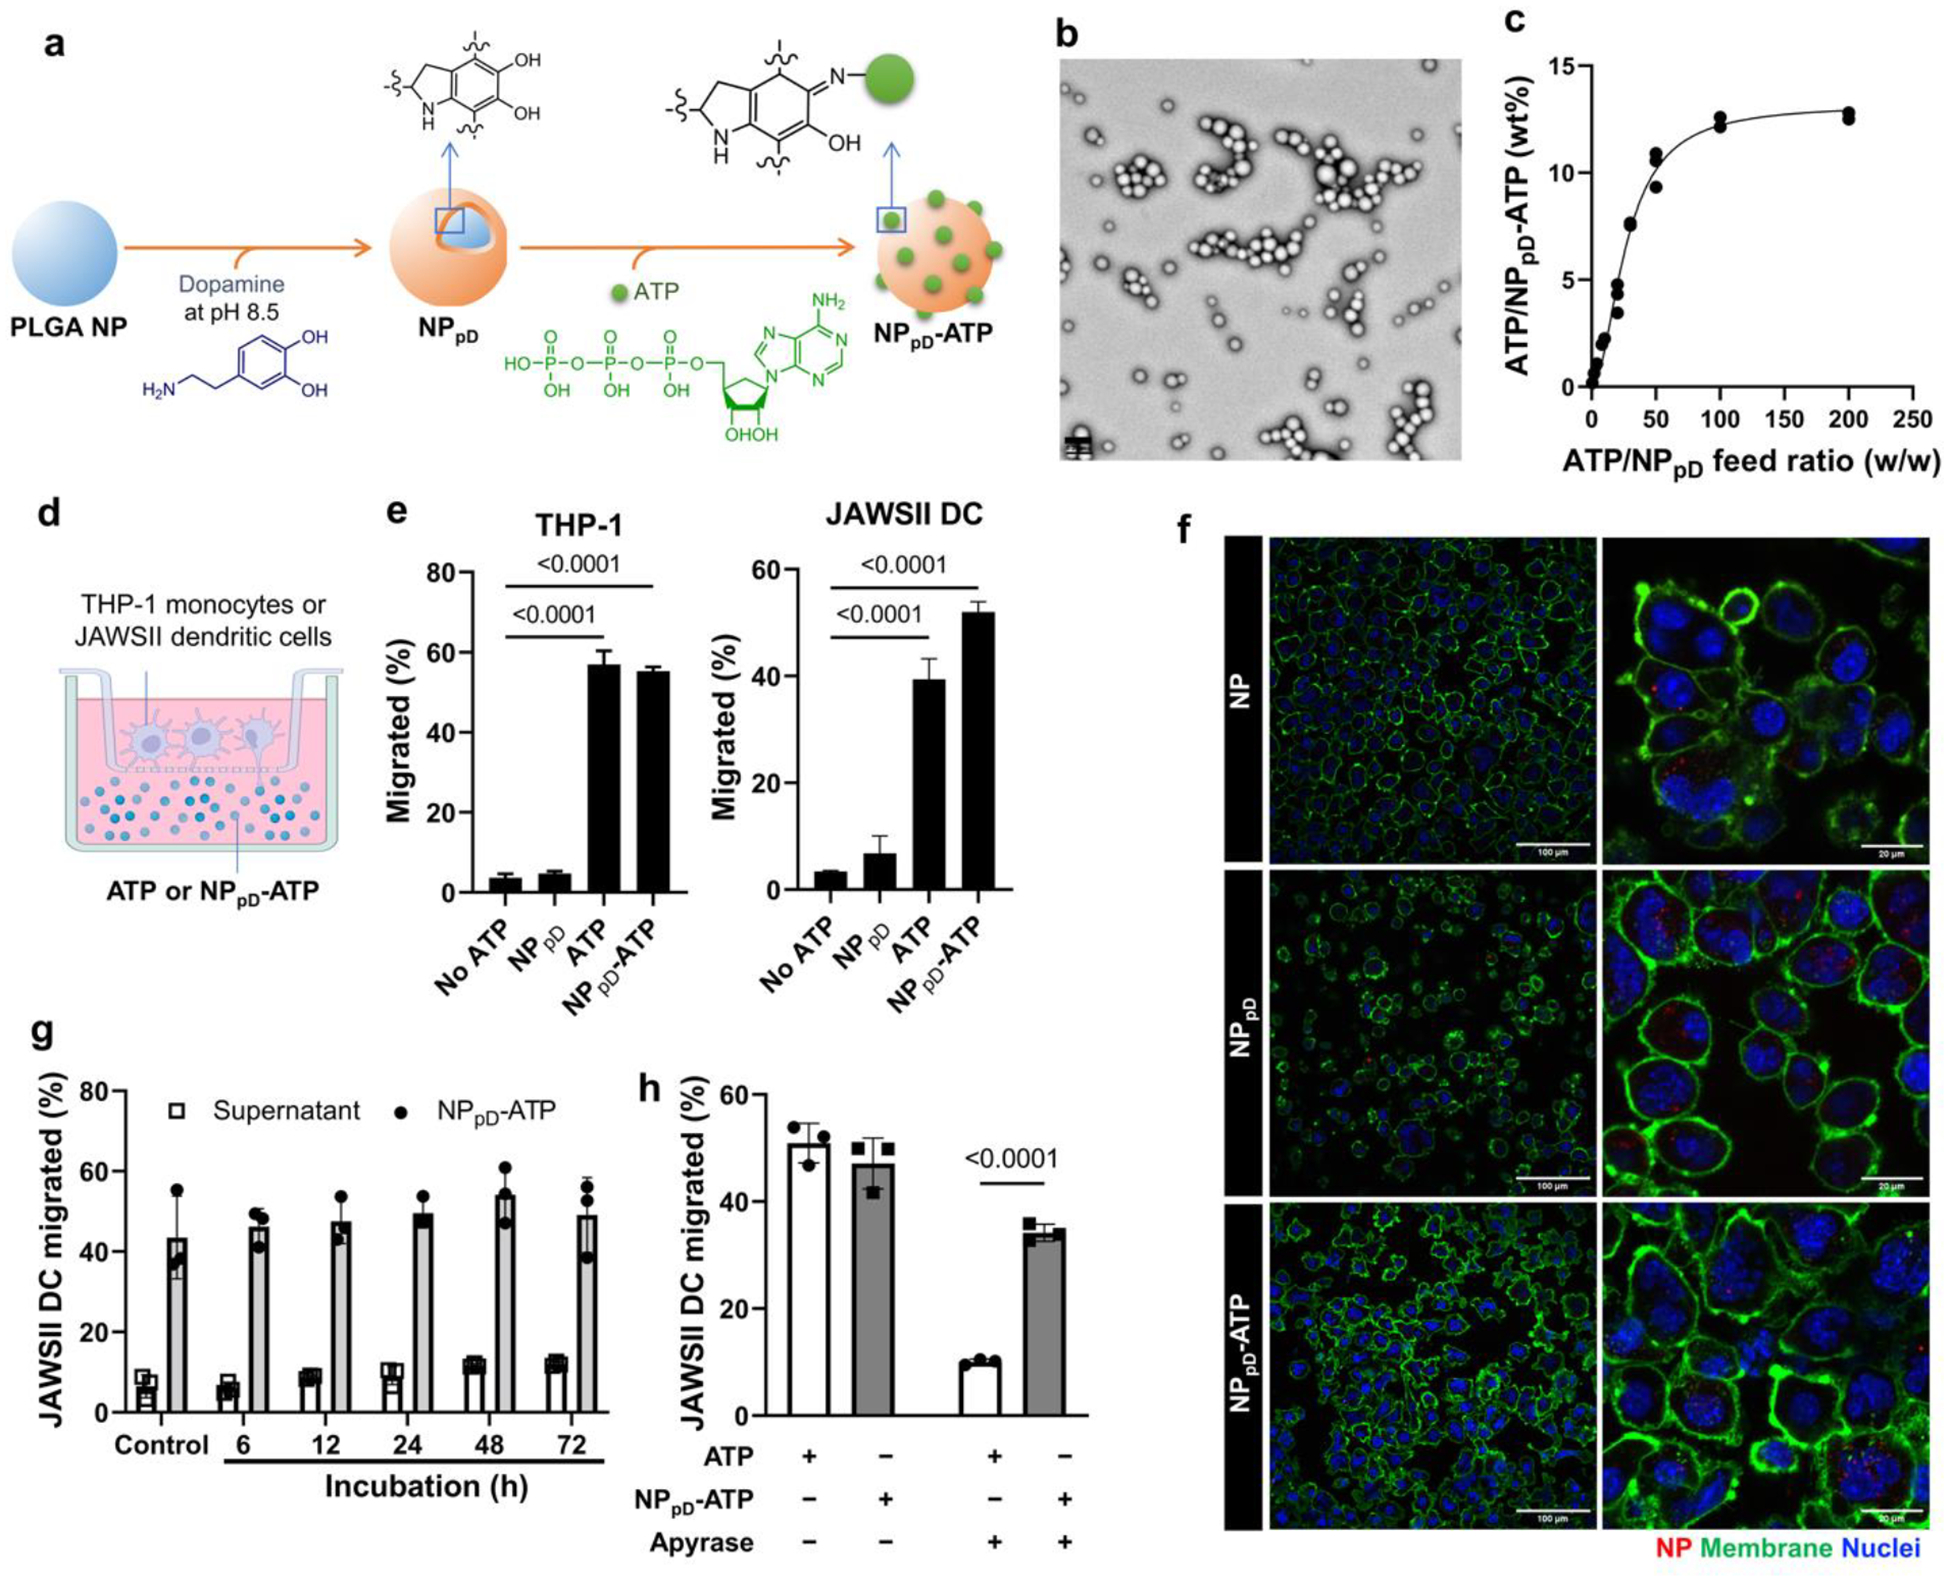
(a) Schematic illustration of ATP conjugation to PLGA NPs. PLGA-NPs were coated with a polydopamine (pD) layer at pH 8.5 to make NPpD. ATP was conjugated to NPpD via Schiff’s base reaction, resulting in NPpD-ATP. (b) Transmission electron micrographs (TEM) of NPpD-ATP. Visualized by negative staining with 1% uranyl acetate. Scale bar: 200 nm. (c) ATP content (wt%) vs. ATP to NP feed ratio (w/w). (d) Boyden chamber assay setup to evaluate cell migration in response to ATP or NPpD-ATP. (e) % THP-1 cells and JAWSII cells migrating to the lower compartment in response to the treatments. n=3 replicates of a representative batch, mean ± SD. (f) Morphology of JAWSII cells treated with NP, NPpD, or NPpD-ATP. Scale bars: 100 μm (left); 20 μm (right). Additional Figures are shown in Supporting Fig. 3. (g) % JAWSII cells migrating to the lower compartment in response to NPpD-ATP that had been pre-incubated in 10% FBS-containing medium or the supernatant (i.e., the conditioned medium). Control is fresh medium and fresh NPpD-ATP. n=3 replicates of a representative batch, mean ± SD. (h) % JAWSII cells migrating to the lower compartment in response to ATP and NPpD-ATP in the presence of apyrase (0.833 units/mL). n=3 replicates of a representative batch, mean ± SD. In e and g, p-values were calculated by one-way ANOVA with Dunnett’s multiple comparisons test. In h, p-values were calculated by two-way ANOVA with Šídák’s multiple comparisons test.
To evaluate the activity of NP-bound ATP, we performed the Boyden chamber assay to test whether NPpD-ATP could attract dendritic cells or monocytes, a precursor of APCs. NPpD-ATP (or free ATP as a reference) was placed in the lower compartment, and THP-1 human monocytes or JAWSII murine dendritic cells were placed in a Transwell insert (Fig. 2d). After incubation for 4 hours, a time frame in which the ATP gradient across the Transwell membrane is maintained (Supporting Fig. 2), the number of cells that migrated to the lower compartment was counted as a measure of the chemoattractant activity. NPpD-ATP was as effective as free ATP in attracting monocytes and dendritic cells (Fig. 2e). We also observed JAWSII cells incubated with NPs by confocal microscopy. Those incubated with NPpD-ATP, but not with NP or NPpD, showed rougher cell surfaces (Fig. 2f, Supporting Fig. 3) typical of mature dendritic cells.35 We suspect that ATP of NPpD-ATP may have activated purinergic receptors to cause actin rearrangement36 and morphological change, consistent with the expected role of ATP. These results indicate that the ATP activity was preserved after the conjugation and the amine group of adenine was dispensable.
We next evaluated whether the conjugated ATP would be stable in circulation or TME. To test the effect of serum on ATP conjugation, NPpD-ATP was incubated in a medium containing 10% FBS for up to 72 hours. The incubated NPpD-ATP, but not the NP-conditioned medium, showed the chemoattractant activity to JAWSII dendritic cells (Fig. 2g), indicating that most ATP remained bound to the NPpD-ATP in the serum-containing medium at least for 72 hours. Since ATP-degrading enzymes such as ectoenzymes (CD39 and CD73) are known to be abundant in the TME,37,38 we tested whether the NP-bound ATP would tolerate enzymatic degradation. We challenged NPpD-ATP with potato apyrase, a recombinant enzyme that catalyzes sequential hydrolysis of ATP to AMP39 thus inactivating ATP (Supporting Fig. 4). NPpD-ATP was significantly more resistant to apyrase than free ATP and induced the migration of dendritic cells across the Transwell membrane despite the enzyme (Fig. 2h, Supporting Fig. 5). These results indicate that the NPpD-ATP protected the surface-bound ATP from enzymatic degradation.
Encapsulation in NPpD-ATP has differential effects on the release and activity of PTX and CFZ
PTX or CFZ was encapsulated in NPpD-ATP with a z-average of 190 nm and a zeta potential of −8 mV (Supporting Table 1), which is considered neutral according to the Nanotechnology Characterization Laboratory protocol.40 The drug loading efficiency of 3.4 wt% (PTX@NPpD-ATP) and 4.4 wt% (CFZ@NPpD-ATP), and the ATP content was 11 wt% for both NPs. Although the physical properties of the two NPs were similar, they showed differential drug release kinetics and effects on drug activities. Incubated in PBS containing 0.2% Tween 80 (PBST), PTX@NPpD-ATP released 69.7% of the total loaded drug in 24 hours and 82.5% in 96 hours (Fig. 3a). CFZ@NPpD-ATP released 38.7% and 46.0% in 24 hours and 96 hours, respectively (Supporting Fig. 6a). This difference is likely attributable to the extremely poor water solubility of CFZ (0.7 μg/mL vs. 8.5 μg/mL of PTX) and was seen in our previous studies with different PLGA NPs.41,42
Fig. 3. Bioactivities of PTX-loaded, ATP-coated PLGA NPs (PTX@NPpD-ATP).
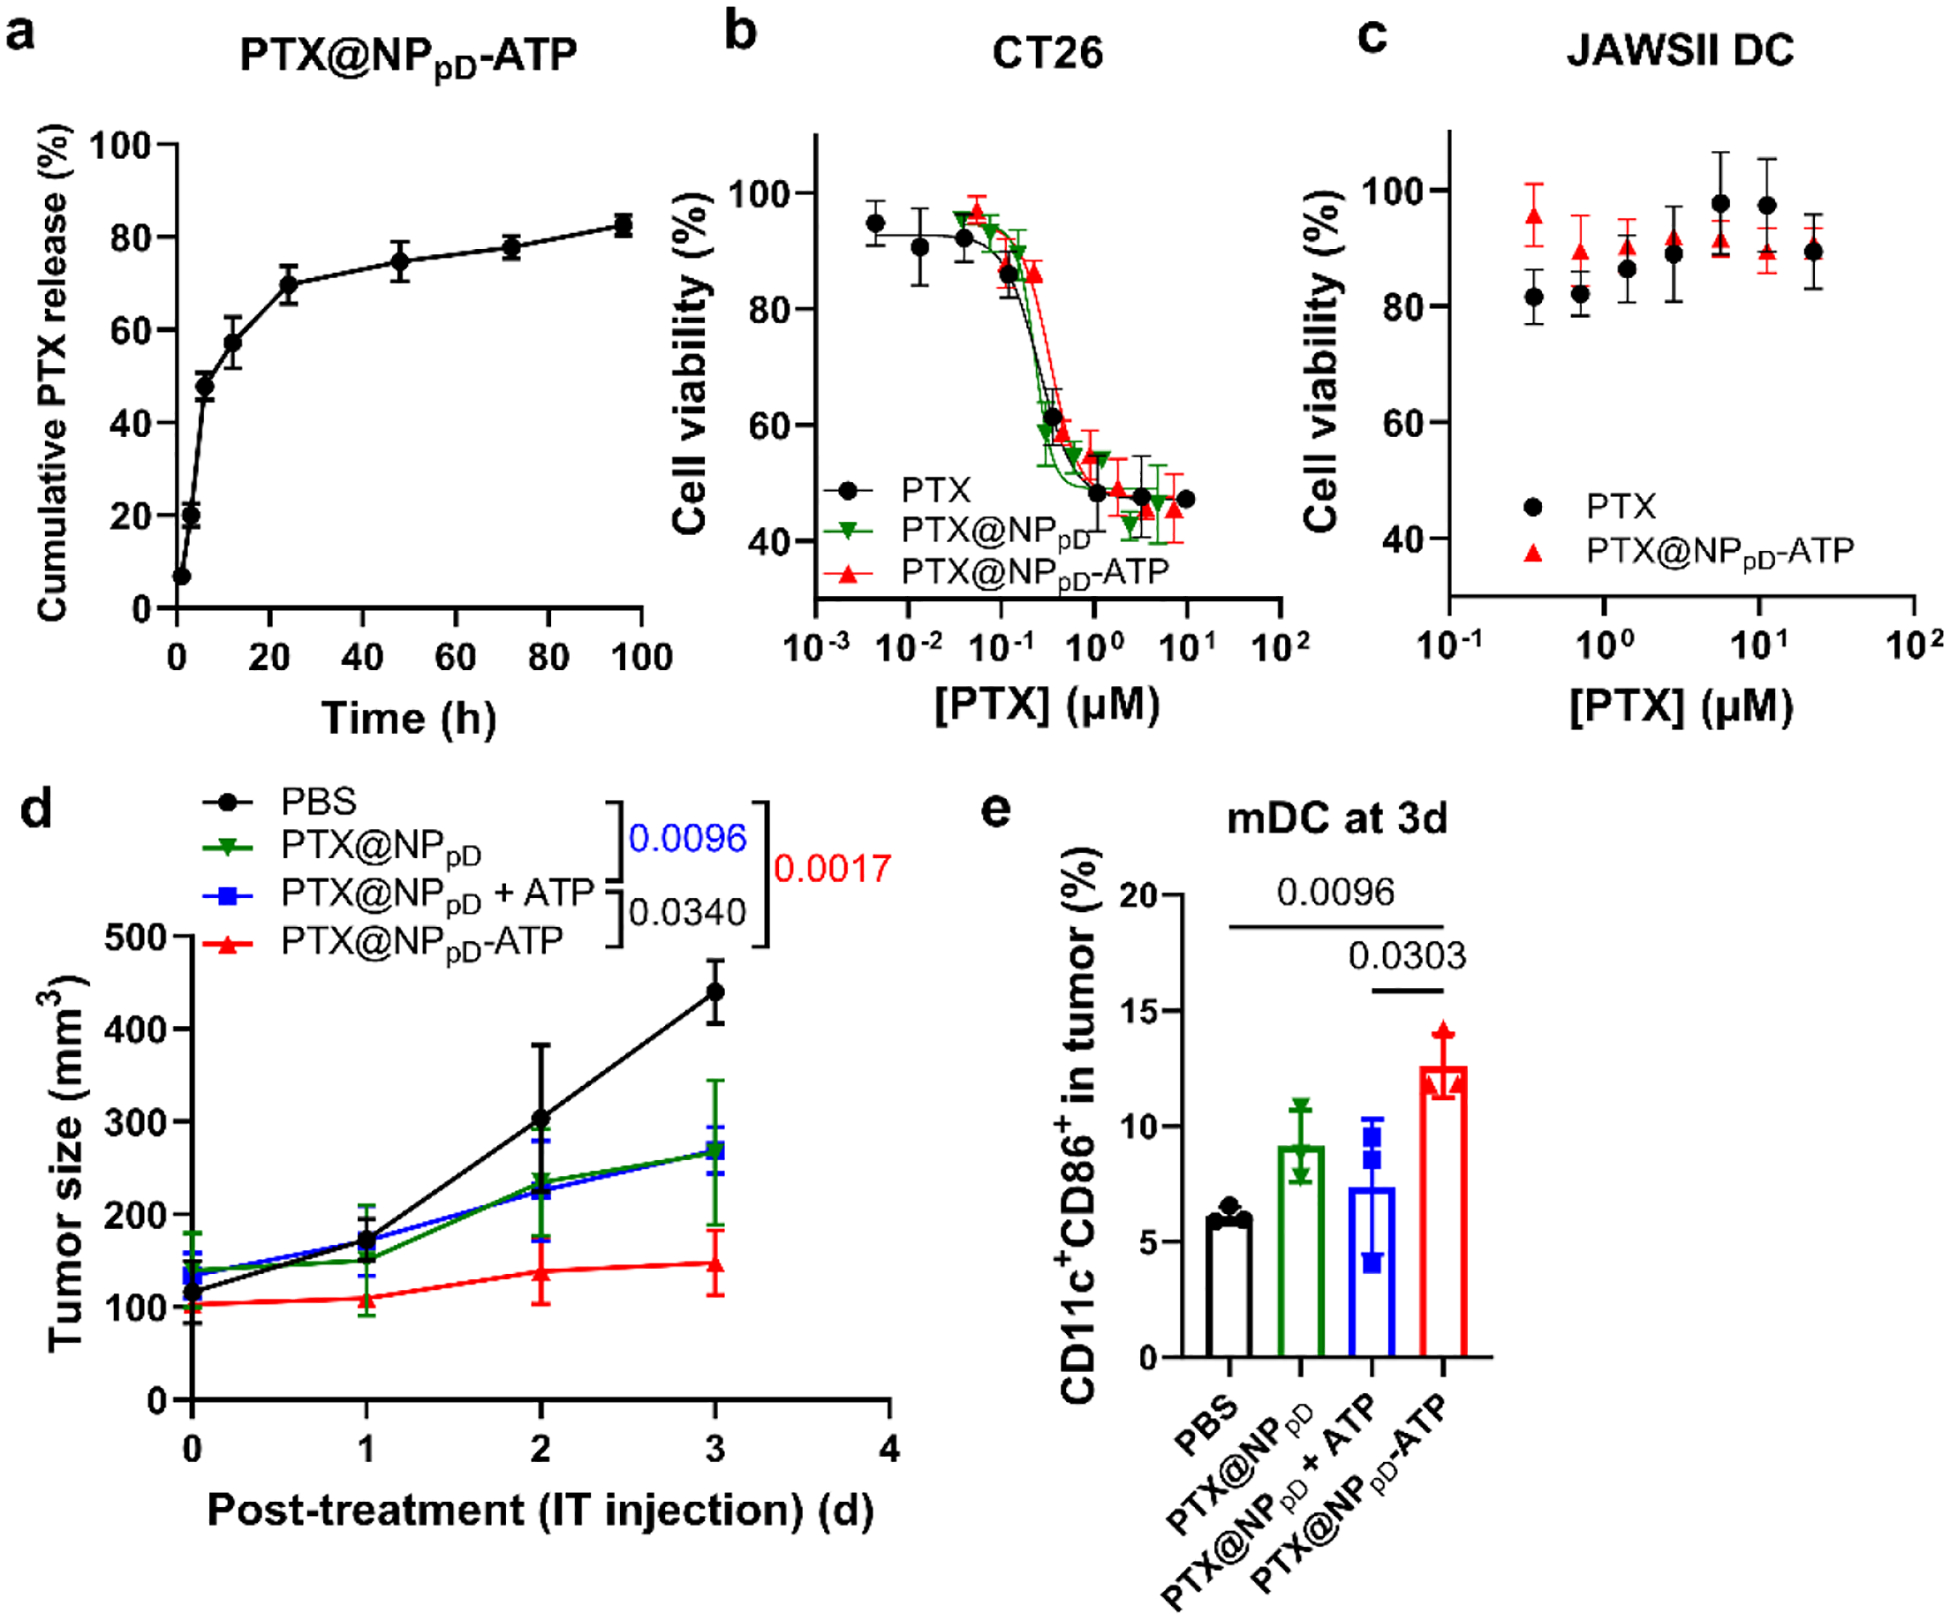
(a) PTX release kinetics from PTX-loaded NPpD-ATP (PTX@NPpD-ATP), performed in PBS containing 0.2% Tween 80 with constant agitation at 37 °C. n=3 replicates of a representative batch, mean ± SD. (b) Viability of CT26 cells treated with unformulated PTX or NP-encapsulated PTX. PTX: unformulated drug (IC50: 255 nM); PTX@NPpD: PTX encapsulated in a pD-coated nanoparticle (IC50: 230 nM); PTX@NPpD-ATP: PTX encapsulated in a pD-coated nanoparticle decorated with ATP (IC50: 336 nM). (c) Viability of JAWSII dendritic cells treated with unformulated PTX or PTX@NPpD-ATP. (d) Changes in CT26 tumor size in immune-competent BALB/c mice after a single intratumoral injection of each treatment (equivalent to PTX 10 mg/kg), n=3 per group, mean ± SD. P-values were calculated with the tumor sizes measured on day 3 post-treatment by Tukey’s multiple comparisons test following two-way ANOVA. (e) % CD11c+CD86+ dendritic cells (mature DC, mDC) in tumor 3 days after each treatment. P-values were calculated by one-way ANOVA with Tukey’s multiple comparisons test.
Reflecting the difference in drug release kinetics, the two NPs showed differential effects on cytotoxicity. PTX@NPpD-ATP (and its precursor PTX@NPpD) showed comparable or slightly higher IC50 values in CT26 cells than unformulated PTX (Fig. 3b) due to the significant drug release in the first 24 hours. Nevertheless, PTX@NPpD-ATP showed minimal toxicity against JAWSII dendritic cells (Fig. 3c). In the absence of long-term control of PTX release, we interpret the resistance of JAWSII dendritic cells to PTX@NPpD-ATP as an intrinsic response of immune cells, which do not proliferate as rapidly as tumor cells.43 The relative resistance to PTX was confirmed with other immune cells such as THP-1 monocytes, J774A.1 macrophages, and bone marrow-derived macrophages (BMDMs) (Supporting Fig. 7). In contrast, CFZ@NPpD-ATP showed significantly higher IC50 values than unformulated CFZ in both CT26 tumor cells and JAWSII dendritic cells (Supporting Figs. 6b, 6c), which can be explained by the incomplete drug release from the NPs. Unlike PTX@NPpD-ATP, CFZ@NPpD-ATP was still toxic to dendritic cells. The sensitivity of dendritic cells to proteasome inhibitors is linked to the mitochondria disruption and subsequent activation of the caspase cascade.44 Since the toxicity to dendritic cells could not be mitigated by the current extent of release control, we excluded CFZ@NPpD-ATP and chose to use PTX@NPpD-ATP in the following studies.
PTX-loaded NPpD-ATP (PTX@NPpD-ATP) manifests the effects of ATP and PTX in vivo
We tested whether PTX@NPpD-ATP had the activity of each component in vivo by injecting it intratumorally into CT26 tumor-bearing mice. The immediate effect on tumor growth was monitored to account for the activity of PTX. The ATP activity was estimated by the number of dendritic cells recruited to the tumor by 3 days after the injection (Fig. 3d). Tumor growth was suppressed by all PTX-encapsulating NPs. PTX@NPpD-ATP was most effective, followed by PTX@NPpD and the mixture of PTX@NPpD and free ATP (at the same dose as ATP included in PTX@NPpD-ATP). There was no difference between PTX@NPpD and PTX@NPpD + free ATP mixture groups, indicating that free ATP had no effect on tumor suppression. PTX@NPpD-ATP significantly increased the fraction of mature dendritic cells in the tumor compared to PBS and the PTX@NPpD + free ATP mixture. The PTX@NPpD group also showed a slight increase in dendritic cells, though statistically insignificant, which may be attributable to the PTX-induced ICD (Fig. 3e). These results demonstrate that PTX and ATP of the PTX@NPpD-ATP had respective effects on tumors. The difference between PTX@NPpD-ATP and PTX@NPpD + free ATP mixture underscores the significance of ATP conjugation to the NPs.
PTX@NPpD-ATP suppresses tumor growth by systemic administration better than the combination of PTX@NPpD and ATP
We evaluated the anti-tumor activity of systemically administered PTX@NPpD-ATP. First, PTX@NPpD-ATP was compared with two other PTX formulations, Taxol® and PTX NC, a nanocrystal (NC) formulation of PTX45 shown to be superior to Abraxane® in anti-tumor efficacy.46 The tumor-bearing mice were treated with one of the treatments intravenously at a dose equivalent to 20 mg/kg PTX, 4 times every 3 days, starting from the day the tumor reached ~50 mm3 in volume. We observed that PTX@NPpD-ATP was superior to Taxol and PTX NC in suppressing CT26 tumor growth (Supporting Fig. 8).
Next, we evaluated PTX@NPpD-ATP in two tumor models, CT26 colon cancer and B16F10 melanoma, which represent immune-hot (with immune-cell infiltrated TME)47 and immune-cold (with few immune cells in TME)48 tumors, respectively, comparing with a mixture of PTX@NPpD and ATP (PTX@NPpD + ATP) at the same dose as ATP included in PTX@NPpD-ATP. The tumor-bearing mice were treated with PTX@NPpD-ATP or the mixture (PTX@NPpD + ATP) intravenously in the same regimen as above (Fig. 4a). In both models, PTX@NPpD-ATP demonstrated better anti-tumor efficacy than those treated with PBS or the mixture group, extending the survival significantly (Fig. 4b, 4c) with no adverse effects on body weights (Supporting Fig. 9). In the CT26 model, the PTX@NPpD-ATP group showed a median survival time of 39 days, whereas the mixture and PBS groups did 18 and 10 days, respectively. In the B16F10 model, the median survival times of PTX@NPpD-ATP, mixture, and PBS groups were 26, 11.5, and 6 days, respectively. The difference between PTX@NPpD-ATP and PTX@NPpD + free ATP mixture was consistent with the early response shown in the CT26 model receiving an intratumoral treatment (Fig. 3d). The consistent difference between the anti-tumor effects of PTX@NPpD-ATP and PTX@NPpD + free ATP mixture (Figs. 3d, 4b, 4c) indicates that the NP-bound ATP played a critical role in enhancing the anti-tumor activity of PTX@NPpD-ATP.
Fig. 4. PTX@NPpD-ATP suppress tumor growth by systemic administration.
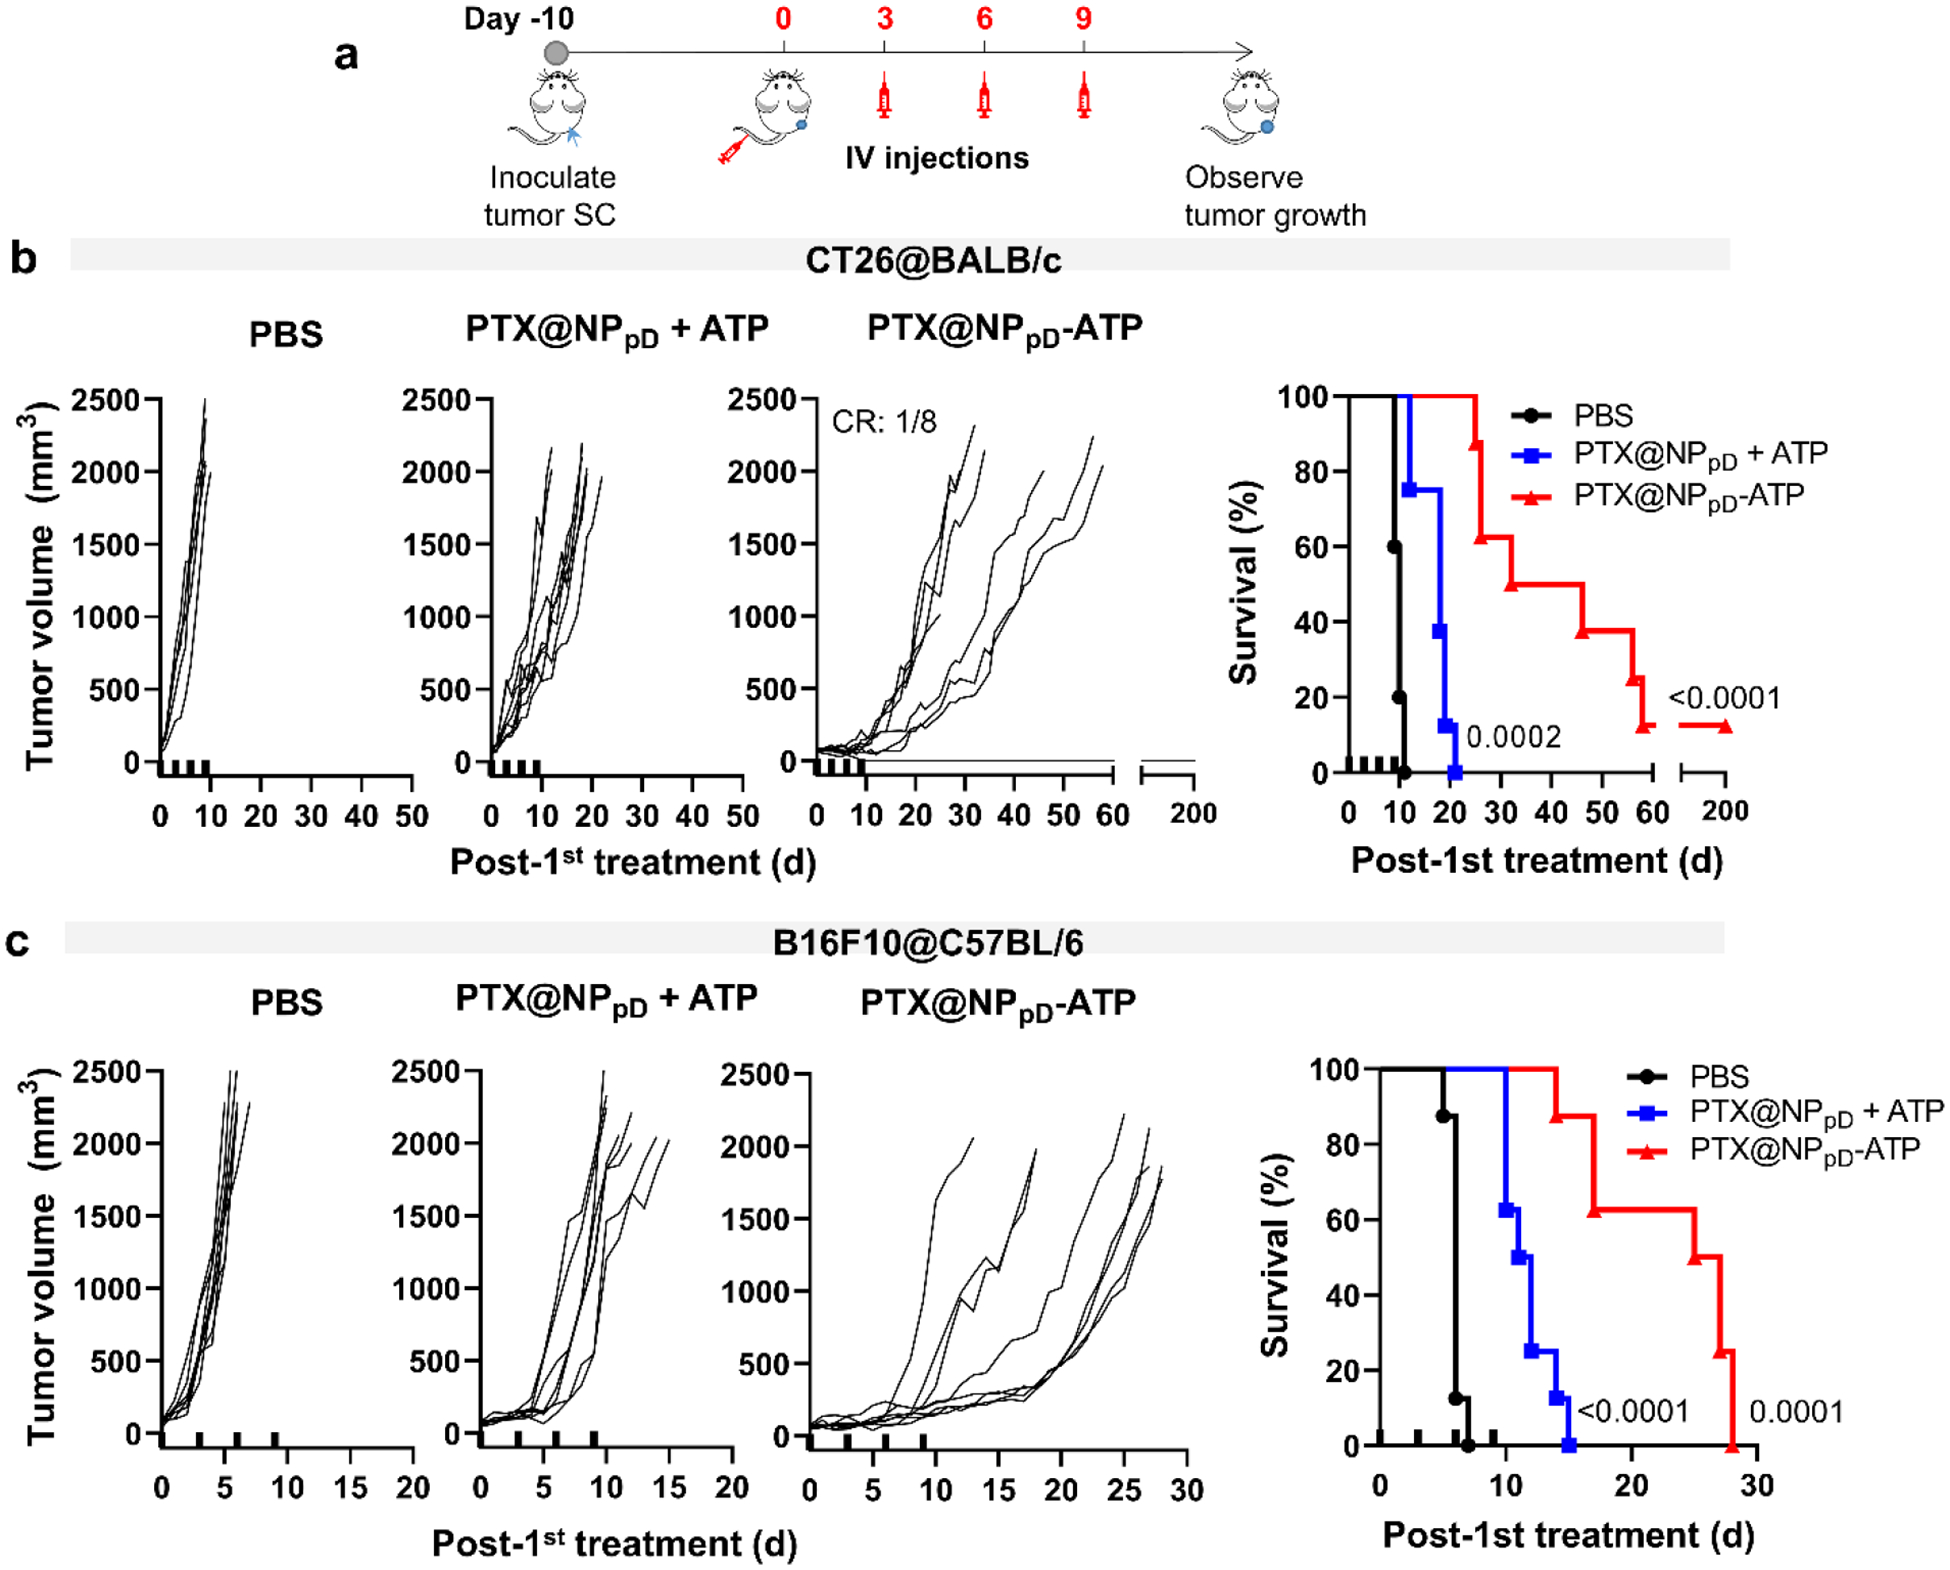
(a) Schedule of CT26 or B16F10 tumor inoculation and treatments in immune-competent syngeneic hosts. SC: subcutaneous. IV: intravenous. Each treatment (PTX@NPpD + ATP and PTX@NPpD-ATP) contained PTX equivalent to 20 mg/kg/injection. (b) Changes in CT26 tumor size and the survival of the mice over time after intravenous injection of each treatment, n=8 per group. CR: Complete regression. (c) Changes in B16F10 tumor size and the survival of the mice over time after intravenous injection of each treatment, n=8 per group. In b and c, thick ticks on the X-axis indicate the time of each injection. P-values in the survival curves were calculated by the log-rank (Mantel-Cox) test vs. the PBS group.
The improved anti-tumor activity of PTX@NPpD-ATP is due to the stability and tumor retention of immunostimulatory ATP
Given the resistance of NP-bound ATP to apyrase challenge (Fig. 2h), we speculated that PTX@NPpD-ATP supplied a persistent find-me signal based on the stability of ATP in TME. It is also possible that the NP-bound ATP was retained better than free ATP in the tumor. Both events would help recruit dendritic cells to the TME and activate anti-tumor immune responses, leveraging the PTX-mediated ICD. We also considered the possibility of the conjugated ATP serving as a ligand targeting the purinergic P2 receptors overexpressed on tumor cells49 and increasing the delivery of PTX@NPpD-ATP to tumors, although this was not the intent of our NP design. We examined each scenario to determine the roles of the NP-bound ATP in enhancing the anti-tumor activity.
First, we repeated the evaluation of anti-tumor activity of systemically administered PTX@NPpD-ATP on CT26 tumor in athymic nude (Foxn1nu) mice, which lack mature T cells (Fig. 5a). Unlike in the immunocompetent models (Fig. 4), PTX@NPpD-ATP showed no difference from the mixture group in the tumor growth rate and the median survival time (Fig. 5a). This result supports that the NP-bound ATP improved the anti-tumor activity of PTX@NPpD-ATP in a T cell-dependent manner.
Fig. 5. The antitumor effect of PTX@NPpD-ATP is mediated by immune system.
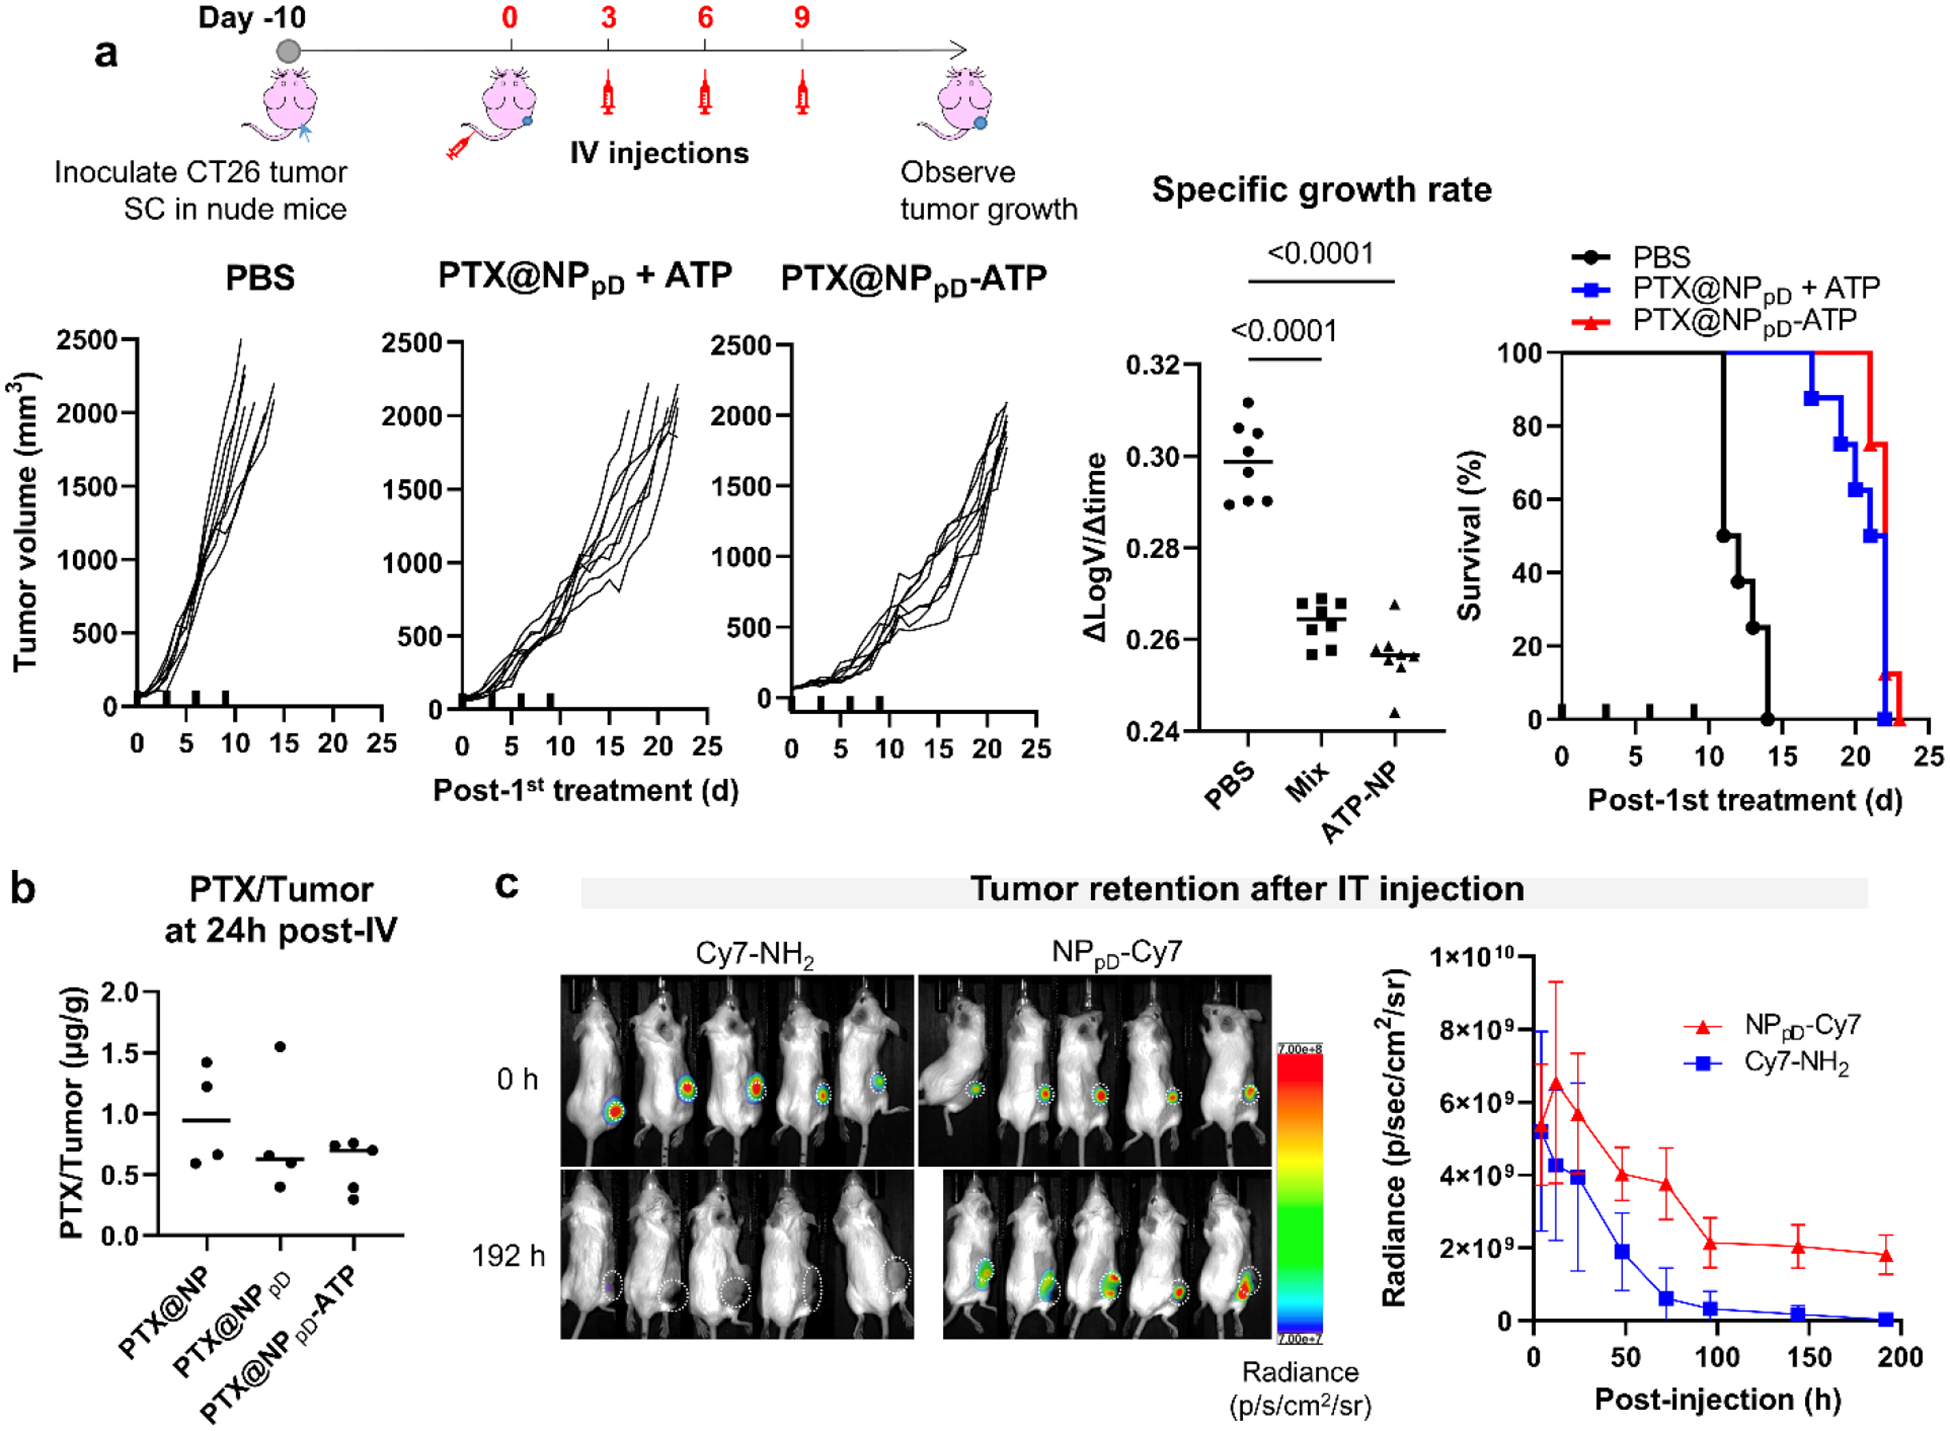
(a) Schedule of CT26 tumor inoculation and treatments in athymic nude mice; changes in CT26 tumor size after intravenous injection of each group in nude mice (PTX: 20 mg/kg/injection); specific growth rates (ΔlogV/Δt) of tumors. Mix: PTX@NPpD + ATP. ATP-NP: PTX@NPpD-ATP. P-values: one-way ANOVA with Tukey’s multiple comparisons test; survival of the mice over time after intravenous injection of each treatment, n=8 per group. Thick ticks in the X-axis indicate the time of each injection. (b) PTX content in CT26 tumors at 24 hours after a single intravenous injection of PTX@NP, PTX@NPpD or PTX@NPpD-ATP (PTX equivalent to 20 mg/kg), n=4 (PTX@NP) or 5 (PTX@NPpD and PTX@NPpD-ATP) per group (no tumor in one of the PTX@NPpD-treated mice). Other organs are shown in Supporting Fig. 10. (c) Radiance (p/sec/cm2/sr) of Cy7 from CT26 tumors immediately or 192 hours after a single intratumoral injection of free dye (Cy7-NH2) or Cy7-conjugated NP (NPpD-Cy7), n=5 per group, mean ± SD. Tumor areas are indicated by white dotted circles. Some of the fluorescence signals may spill over to adjacent region due to the strong intensity.
Next, we examined whether PTX@NPpD-ATP increased tumor distribution of PTX by targeting the purinergic receptors. CT26 tumor-bearing immunocompetent BALB/c mice were treated with PTX@NP, PTX@NPpD, or PTX@NPpD-ATP, and PTX distributions in major organs and the tumor were quantified 24 hours after the treatment. Interestingly, the mice receiving PTX@NPpD or PTX@NPpD-ATP showed relatively low PTX distribution in the liver and spleen compared to PTX@NP (Supporting Fig. 10). Nevertheless, the three groups showed no significant difference in the tumor level of PTX (Fig. 5b), indicating that neither the polydopamine coating (as a pretreatment to ATP modification) nor NP-bound ATP had any contribution to the NP delivery to tumors. We also tested if the NP-bound ATP enhanced the cellular uptake of PTX@NPpD-ATP via the purinergic P2 receptor. NPpD-ATP was fluorescently labeled with rhodamine B-conjugated PLGA. Their uptake by CT26 or B16F10 cells was compared with those of NPpD, NPpD + ATP mixture, and NPpD coated with polyethyleneimine (PEI) (NPpD-PEI with a z-average of 229.8 nm and a zeta potential of +40.8 mV, positive control that enters cells by electrostatic interaction, used to ensure our ability to detect NPs entering the cells). NPpD, NPpD + ATP mixture, and NPpD-ATP showed no significant cellular uptake compared to NPpD-PEI (Supporting Fig. 11). This result indicates that the NP-bound ATP did not enhance the NP uptake by tumor cells. Based on the biodistribution and cellular uptake studies, we ruled out the possibility of the conjugated ATP increasing the NP delivery to tumors on tissue or cell levels.
Finally, we tested if NPpD-ATP helped retain ATP in the tumor. We used an amine-terminated fluorescent dye with a similar water solubility (Cy7-NH2) instead of ATP for three reasons: First, it is difficult to distinguish exogenous ATP (from NPpD-ATP) and endogenous ATP (derived from dying cells). Second, free ATP degrades to ADP or AMP by ectoenzymes; thus, one may not determine whether the observed difference of free ATP from NPpD-ATP, if any, is due to the degradation or poor retention. Third, the fluorescent dye enables continuous monitoring of NP residence in the tumor by non-invasive optical imaging. Cy7-NH2-coated NPs (NPpD-Cy7) were produced in the same manner as NPpD-ATP. Cy7-NH2 conjugation increased with the dye to NPpD feed ratio (Supporting Fig. 12a left). The fluorescent label remained stable with NPpD-Cy7 and was not leached out to water (Supporting Fig. 12b left). A control dye, Cy7 succinimide ester (Cy7-NHS), was not efficiently conjugated to NPpD in the first place (Supporting Fig. 12a right). The small amount of dye adsorbed to the surface did not stay bound to the NPs in water (Supporting Fig. 12b right). This result indicates that the amine group of Cy7-NH2 was critical to its covalent conjugation to NPpD, like ATP. NPpD-Cy7 or the equivalent dose of free Cy7-NH2 was injected intratumorally into the CT26-bearing mice, ensuring comparable initial concentrations in the tumor, and the fluorescence intensity was measured over time by whole-body fluorescence imaging (Fig. 5c). The signal of NPpD-Cy7 in tumor persisted over 8 days, whereas the free Cy7-NH2 signal diminished quickly and was already non-detectable in some of the mice at 3 days after the injection (Supporting Fig. 13). The comparison of NPpD-Cy7 and Cy7-NH2 demonstrates that NPpD-Cy7 retained the fluorescence signal of Cy7 in tumors far longer than the free dye counterpart. Therefore, we infer that ATP would be better retained in tumors as the NP-bound form than free ATP in a similar manner.
Together, these results support that NP-bound ATP contributes to the anti-tumor activity of PTX@NPpD-ATP by enhancing anti-tumor immunity rather than by altering the delivery of NPs to tumors. The increased stability and the retention of the NP-bound ATP in TME account for the superiority of PTX@NPpD-ATP to the PTX@NPpD + ATP mixture.
PTX@NPpD-ATP may function extracellularly
Knowing that the NP-bound ATP did not increase tumor cell uptake of the NPs (Supporting Fig. 11), we asked how APCs would handle the modified NPs. The confocal microscope images of JAWSII dendritic cells incubated with NPpD-ATP showed no apparent increase in NP uptake compared to NP or NPpD despite the morphological change suggesting dendritic cell activation (Fig. 2f, Supporting Fig. 3). We performed flow cytometry analysis of the JAWSII cells and confirmed quantitatively that neither NP-bound ATP nor pD increased dendritic cell uptake of the NPs (Supporting Fig. 14). This result is consistent with no additional toxicity of PTX@NPpD-ATP compared to free PTX in APCs (Fig. 3c, Supporting Fig. 7).
We further treated BALB/c mice bearing CT26 tumors by single intravenous injection of the fluorescently-labeled NPpD-ATP and examined the tumor sampled at 24 hours post-injection by microscopy and flow cytometry. 0.14% (by median) of the total cells were found to be non-immune cells containing NPs (CD45−NP+), and 0.34% (by median) of the total cells were immune cells taking up NPs (CD45+NP+) (Supporting Fig. 15a, 15b), consistent with fluorescence images with few NPs captured in the tissue section (Supporting Fig. 15c, Supporting Fig. 16). These values were not significantly different from those of NP or NPpD. Given the biodistribution and the anti-tumor effect of PTX@NPpD-ATP, we do not suspect the lack of NP distribution in tumors. Instead, these results suggest that the NPs may have been present in the extracellular space of the tumors. The lack of NP signals in the cells is attributable to the difficulty in retaining extracellular NPs during the preparation of tissue sections (microscopy) and single-cell suspensions (flow cytometry).
PTX@NPpD-ATP enhances tumor recruitment of innate immune cells and CD8+ T cells
Given the immunostimulatory activity of PTX@NPpD-ATP, we examined its effects on innate and adaptive immune cells in the system. CT26 tumor-bearing BALB/c mice were intratumorally injected with PTX@NPpD-ATP or other PTX formulations at 5 mg/kg PTX and monitored for tumor progression, survival, and immune cell fraction (% of total cells in the tumor) in selected tissues at 7 days after the injection (Fig. 6a). We used intratumoral injection in evaluating the effects of treatment groups on TME to minimize confounding variability due to the potential difference in PTX delivery.
Fig. 6. The antitumor effect of PTX@NPpD-ATP aligns with the increase of immune cell fraction.
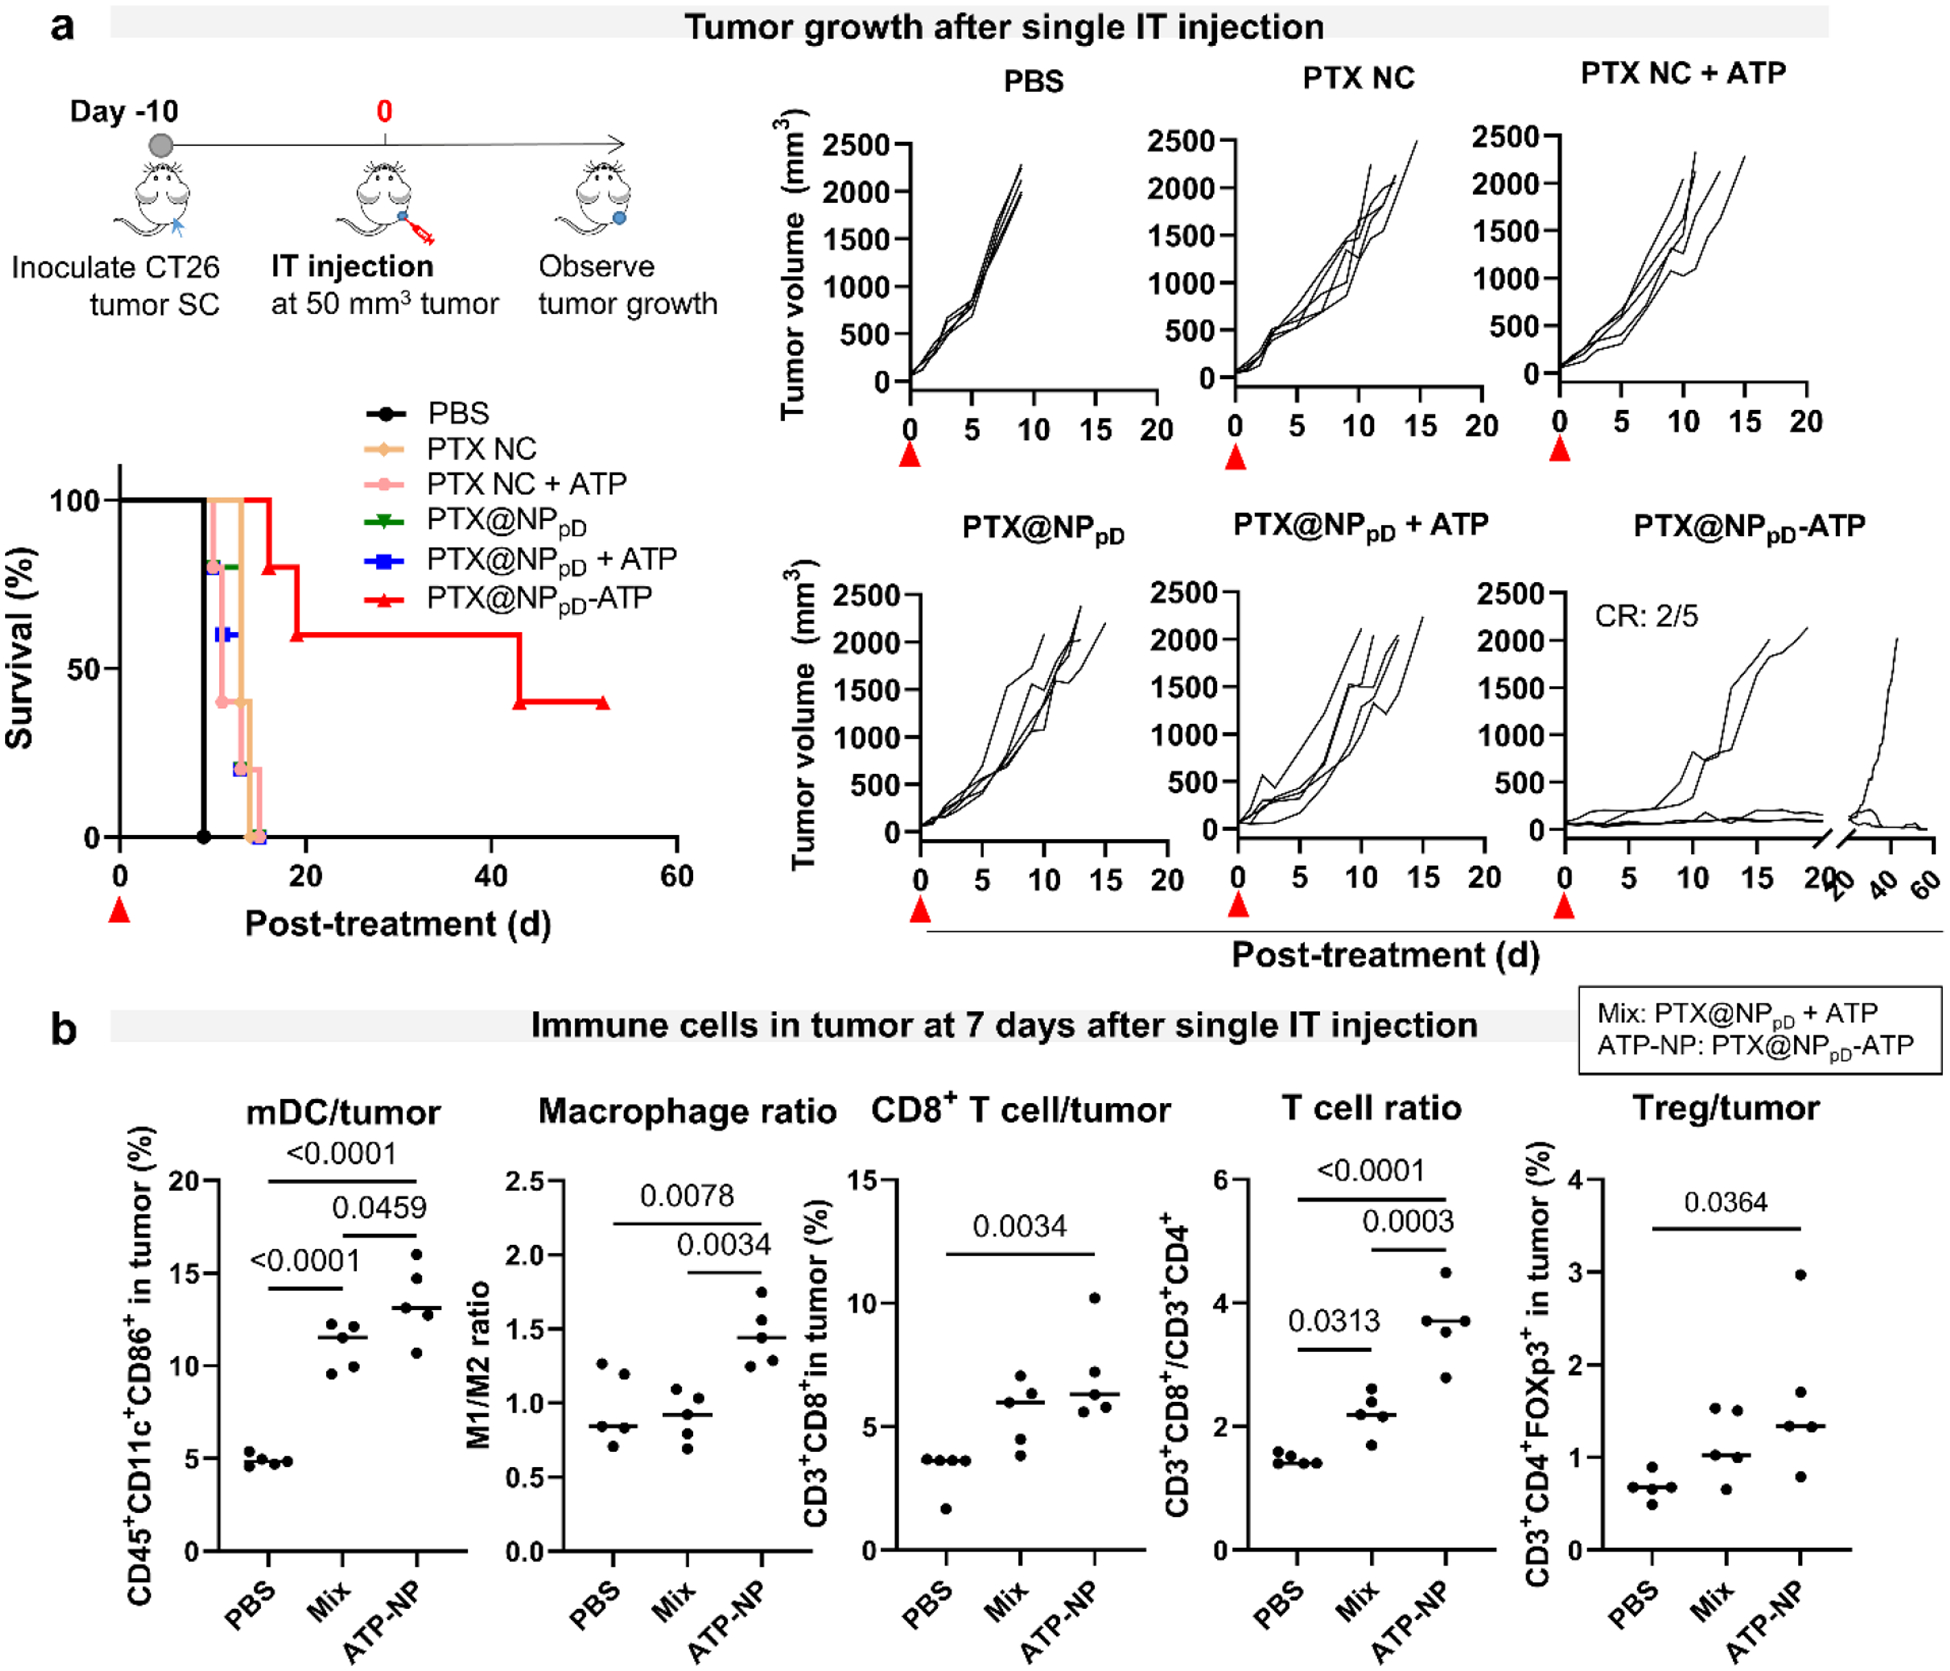
(a) Schedule of CT26 tumor inoculation and treatments in immune-competent BALB/c mice; changes in CT26 tumor size after intratumoral injection of each treatment (PTX: 5 mg/kg); survival of the mice over time after the treatment, n=5 per group. PTX NC: nanocrystal formulation of PTX. (b) Immune cell fraction in CT26 tumors at day 7 after a single intratumoral treatment (PTX: 5 mg/kg), n=5 per group. Horizontal bars indicate median values. See Supporting Fig. 18 for the extended cell fraction profiles. Mix: PTX@NPpD + ATP; ATP-NP: PTX@NPpD-ATP. P-values were calculated by one-way ANOVA with Tukey’s multiple comparisons test.
The anti-tumor activity was consistent with the short-term effect of intratumoral injection (Fig. 3d) and tumor growth profiles after intravenous injection (Fig. 4). Among the tested treatments, PTX@NPpD-ATP demonstrated the best anti-tumor efficacy, resulting in complete regression in 2 out of 5 mice after a single intratumoral injection (Fig. 6a). Other PTX formulations, such as PTX@NPpD, PTX NC, and their mixtures with free ATP, showed no difference from each other and were not as effective as PTX@NPpD-ATP. They led to a slight extension in survival but no complete regression. The same test was repeated with another set of CT26-tumor-bearing BALB/c mice, comparing the effects of PTX@NPpD-ATP and PTX@NPpD + ATP mixture on immune cell fractions (Fig. 6b). Tumors, tumor-draining lymph nodes (TDLNs), and the spleens were collected at 7 days after the intratumoral injection as the time was deemed sufficient for activating both innate and adaptive immune systems.50
In the tumor (Fig. 6b, Supporting Fig. 18), PTX@NPpD-ATP-treated mice showed a significantly higher fraction of dendritic cells than PTX@NPpD + ATP (mixture) group or PBS group. Compared to PBS, the fractions of M1-like macrophages and natural killer (NK) cells increased in both PTX@NPpD-ATP and mixture groups. M2-like macrophages also increased in the mixture group, but not as much in the PTX@NPpD-ATP group, resulting in a favorable M1/M2 ratio in the latter. PTX@NPpD-ATP significantly increased the fraction of CD8+ T cells within the tumor compared to PBS, but it also increased regulatory T (Treg) cells. The mixture group showed a similar trend but to a lesser extent. The myeloid-derived suppressor cell (MDSC) fraction increased in the mixture group compared to the PBS control group. PTX@NPpD-ATP showed an increase in the MDSC fraction, but the difference was insignificant.
Innate immune cells in TDLNs mirrored those of the tumors (Supporting Fig. 20). Dendritic cell and M1-like macrophage fractions increased in the mixture and PTX@NPpD-ATP groups with the latter to a greater extent. However, T cells demonstrated no significant trend, except that Treg cells decreased with the treatment (PTX@NPpD-ATP or mixture). Both PTX@NPpD-ATP and mixture groups showed a significant increase of MDSCs in TDLNs; however, PTX@NPpD-ATP had significantly fewer MDSCs per TDLNs than the mixture group.
The spleen showed a similar trend as tumors or TDLNs (Supporting Fig. 22). Both dendritic cells and M1-like macrophages increased in the PTX@NPpD-ATP- and (to a lesser degree) the mixture-treated groups compared to the PBS group. A significant increase of CD8+ T cells was observed only in the PTX@NPpD-ATP group, along with a slight increase of CD4+ T cells. Unlike in tumors and TDLNs, the MDSC fraction significantly decreased with the treatment of PTX@NPpD-ATP compared to the PBS and mixture groups.
Overall, the mature dendritic cell fraction, irrespective of the sampling location (tumor, TDLN, and spleen), consistently increased with the treatment of PTX@NPpD-ATP and the mixture. However, the extent of the increase was greater with PTX@NPpD-ATP than with the mixture. Likewise, the M1-like macrophage fraction and the M1/M2 macrophage ratio were significantly higher for PTX@NPpD-ATP than for PBS or mixture groups in all three locations. These findings indicate that the outstanding anti-tumor activity of PTX@NPpD-ATP is mediated by immune cells. Dendritic cells and macrophages are attracted to tumors with the PTX treatment, which induced ICD, as well as the find-me signal of the NP-bound ATP, which prevailed in the tumor keeping the activity (Figs. 2g, 2h). Such enhancement of innate immune cell recruitment was accompanied by a higher CD8+ T cell fraction in the tumor and spleen, which suggests the activation of adaptive immune response. A similar trend was shown with the B16F10 model, where PTX@NPpD-ATP increased the fractions of mature dendritic cells, M1 macrophages, and CD8+ T cells in the tumor (Supporting Fig. 24), indicating that the immunomodulatory activity of the NP was effective in immune cold tumors as well.
Collateral recruitment of immunosuppressive immune cells is responsible for the resistance to PTX@NPpD-ATP
PTX@NPpD-ATP suppressed tumor growth better than the mixture group, but the tumors grew in the later phase to varying degrees irrespective of the administration route (Figs. 4, 6a). We replicated the variable responses of CT26 tumors following a single intratumoral injection of PTX@NPpD-ATP and examined the immunophenotype at 25 days after the treatment, when tumor growth showed sufficient variability and the first mouse reached the endpoint by tumor volume (Fig. 7). For identifying immune cells responsible for the resistance to PTX@NPpD-ATP, the tumor volume was correlated with immune cell fractions in the tumor (Fig. 7, Supporting Fig. 27), TDLNs (Supporting Fig. 28), and spleens (Supporting Fig. 29).
Fig. 7. Tumors resistant to PTX@NPpD-ATP have fewer mature dendritic cells, M1 macrophages, CD8+ T cells, and more regulatory T cells.
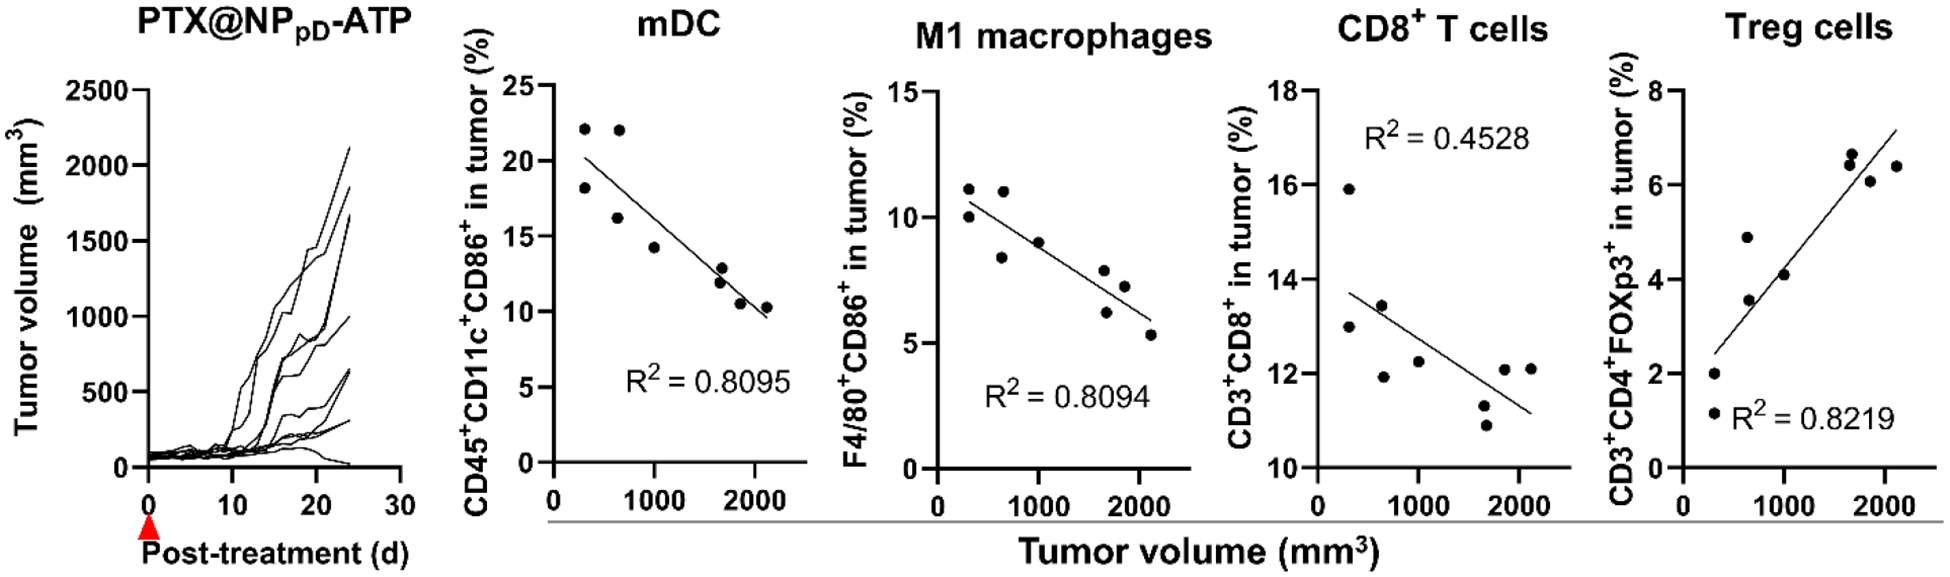
Relationship of tumor size and immune cell fraction in CT26 tumors inoculated in BALB/c mice 25 days after intratumoral injection of PTX@NPpD-ATP (PTX: 5 mg/kg), n=9. See Supporting Fig. 27 for the extended cell fraction profiles.
We observed significant correlations between tumor volume and the fraction of immune cells in all three locations. In general, large tumors had relatively low fractions of mature dendritic cells, M1-like macrophages, and NK cells. TDLNs and spleens of the mice with large tumors also showed fewer dendritic cells but the opposite trend in the M1-macrophage fraction. Larger tumors showed fewer CD8+ T cells and more Treg population per tumor. Spleens showed the same trend in the CD8+ T cell fraction as tumors, and TDLNs did in Treg. Although the correlation was relatively weak, the mice with large tumors had relatively high fractions of MDSCs in all three locations. Overall, the mice with large tumors had lower dendritic cell and CD8+ T cell fractions and higher Treg and MDSC fractions in the three locations with two exceptions (CD8+ T cells in TDLNs and Tregs in spleen).
The increase of immunosuppressive cells, such as Tregs and MDSCs, is likely negative feedback to the T cell activation by the NP-recruited dendritic cells. The increase of Tregs and MDSCs may have started early on, as evident from the immune cell composition in tumors at 7 days after the intratumoral injection of PTX@NPpD-ATP (Fig. 6b, Supporting Fig. 18). PTX is shown to upregulate PD-L1 expression in tumors and TME.51,52 Tumor-infiltrating CD8+ T cells release interferon-γ, which also upregulates PD-L1 expression.53 The PD-1/PD-L1 checkpoint interaction suppresses cytotoxic T-cell functions on tumor cells.54 Tumor-infiltrating MDSCs also overexpress PD-L155 and utilize the PD-1/PD-L1 axis to induce T-cell anergy.56 Moreover, PD-1/PD-L1 interaction is involved in Treg development and function.57 Given the broad roles of PD-1/PD-L1 signaling, we hypothesized that additional anti-PD-1 antibody would restore cytotoxic T-cell activities58 and downregulate MDSC and Treg functions6,59–61 to overcome the resistance to PTX@NPpD-ATP.
PTX@NPpD-ATP combined with anti-PD-1 antibody eliminates CT26 tumors
The anti-tumor efficacy of systemic PTX@NPpD-ATP and anti-PD-1 antibody was assessed in the CT26 model. When an anti-PD-1 antibody is used in combination with other immunostimulatory agents, it is shown to be best to administer a few days after the immunostimulatory agents so that the target immune cells may have infiltrated into tumors.62,63 Accordingly, we administered PTX@NPpD-ATP and anti-PD-1 antibody sequentially with a 7-day interval: the NPs were given in the same regimen as the previous systemic administration (Fig. 4a), and intraperitoneal injections of anti-PD-1 antibody started 7 days after the first NP injection (Fig. 8a).
Fig. 8. PTX@NPpD-ATP combined with anti-PD-1 antibody eliminates CT26 tumors and induces anti-tumor immune memory.
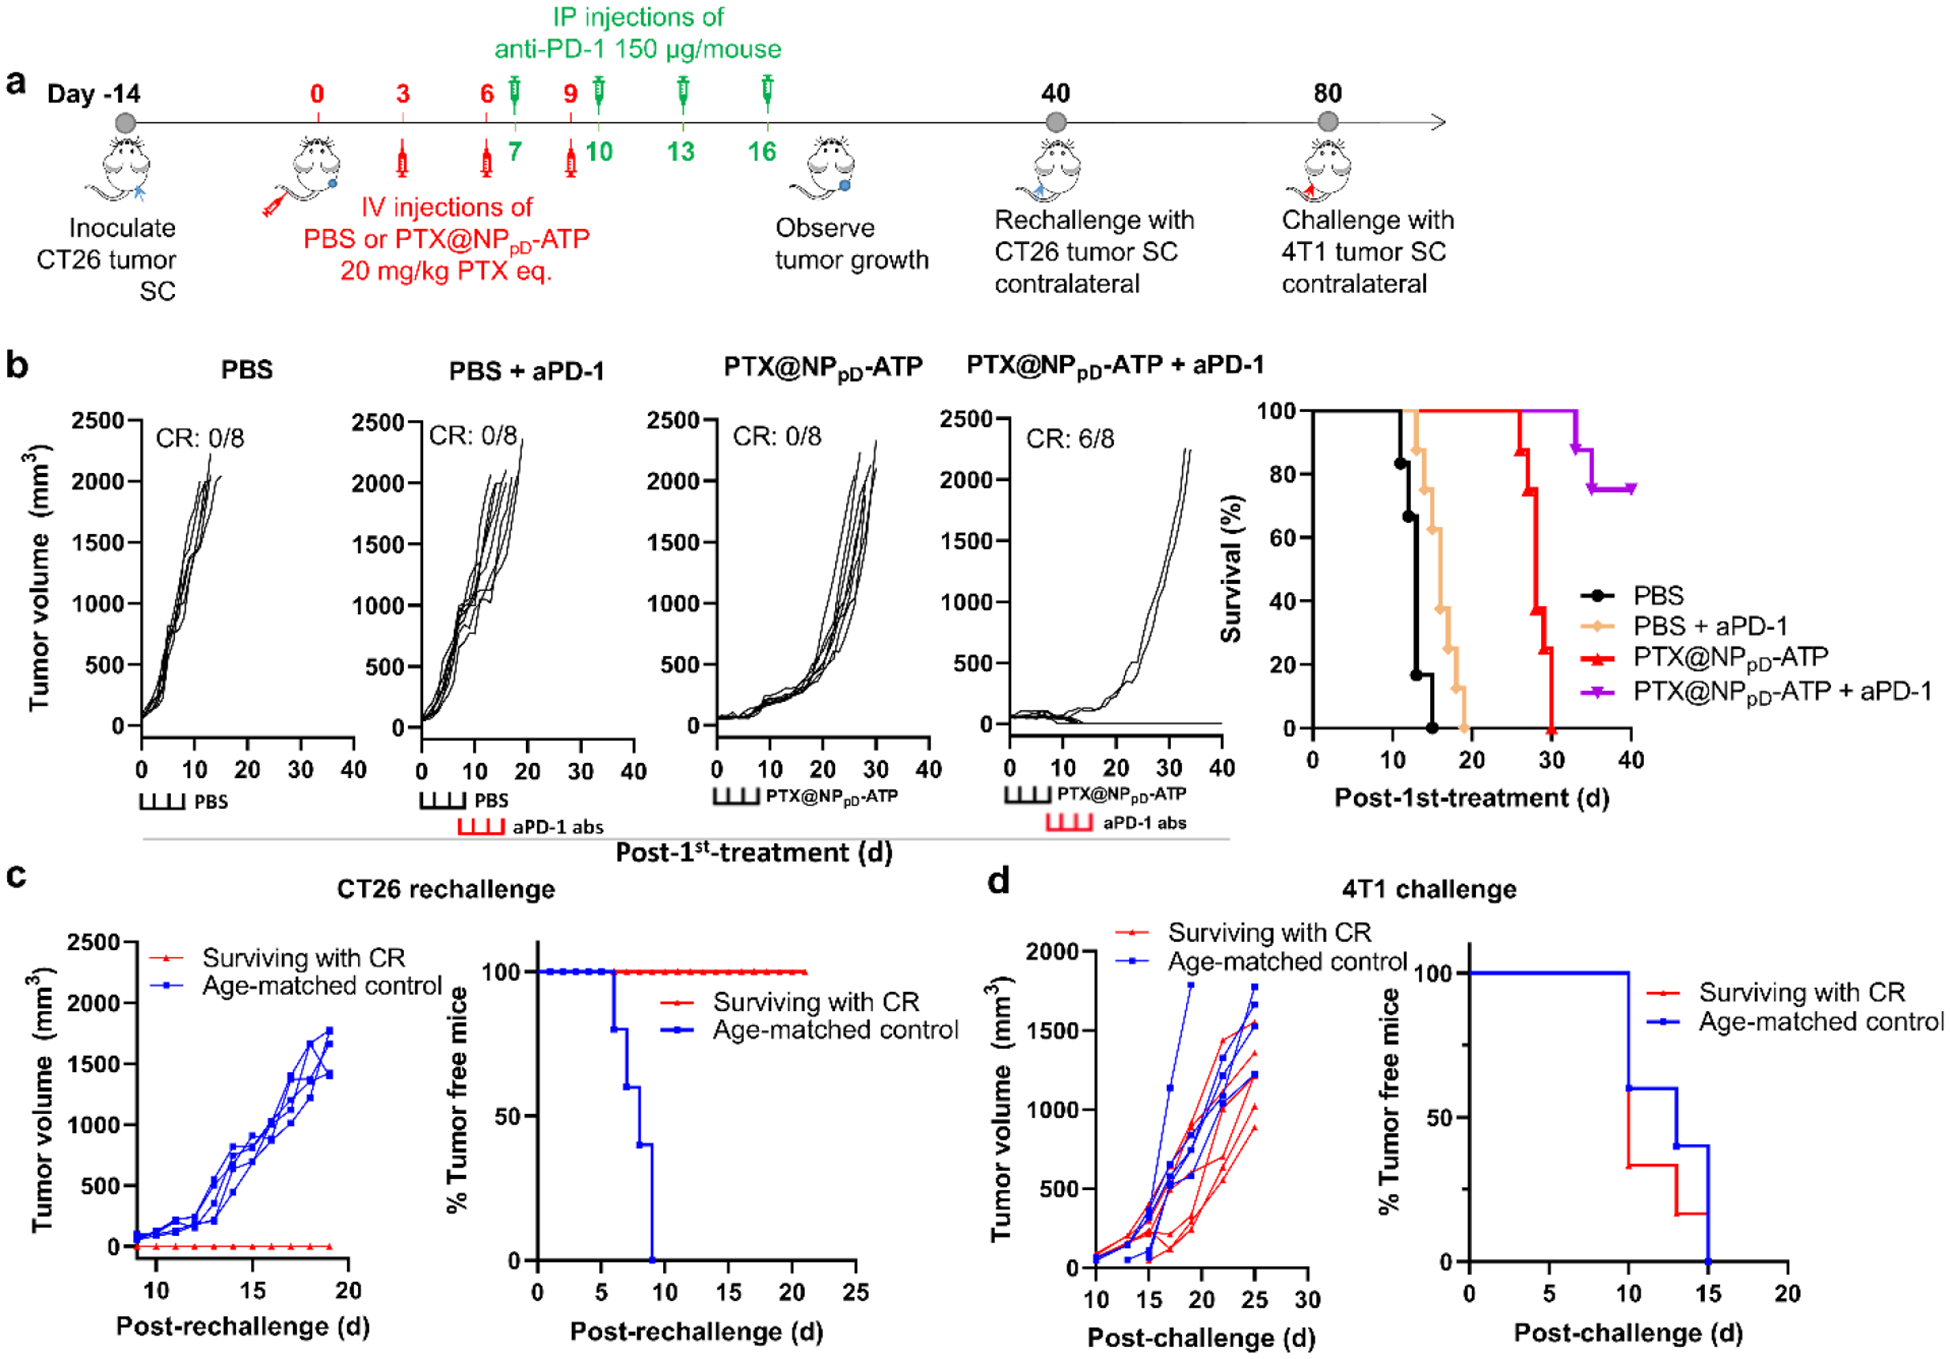
(a) Schedule of CT26 tumor inoculation and treatments in immune-competent BALB/c mice. The first anti-PD-1 antibody were given 7 days after the initial treatment. IP: Intraperitoneal injection. PTX@NPpD-ATP: PTX 20 mg/kg/IV injection; anti-PD-1 antibody: 150 μg/mouse/IP injection. (b) Individual growth curves of tumors and the survival of the mice over time after the treatment, n=8 per group. CR: Complete regression. Brackets at the bottom indicate the time of each treatment. (c) Individual growth curves of tumors and the percentage of tumor-free mice after rechallenge with CT26 tumor cells. Surviving with CR: mice that were treated with PTX@NPpD-ATP and anti-PD-1 antibody and reached complete regression (n=6); Age-matched control: age-matched tumor naïve mice (n=5). (d) Individual growth curves of tumors and the percentage of tumor-free mice after rechallenge with 4T1 tumor cells. Surviving with CR: mice that were treated with PTX@NPpD-ATP and anti-PD-1 antibody reached complete regression, were rechallenged with CT26 tumor cells, and survived with no tumor growth (n=6); Age-matched control: age-matched tumor naïve mice (n=5).
The combination of PTX@NPpD-ATP and anti-PD-1 antibody showed a significant improvement over PTX@NPpD-ATP, resulting in complete tumor regression in 75% (6/8) of the mice as well as delayed tumor growth in the other two mice (Fig. 8b). PTX@NPpD-ATP alone delayed the tumor growth and extended the median survival time, consistent with the previous test (Fig. 4b), but did not achieve a complete regression. Anti-PD-1 antibody alone, either given at the same time as the combination group (when tumors have already grown to > 500 mm3, Fig. 8b) or early (when tumors were 50–100 mm3, Supporting Fig. 31), showed only a marginal effect with no complete regression of tumors.
The surviving mice with complete tumor regression were rechallenged with live CT26 cells to test whether the PTX@NPpD-ATP and anti-PD-1 antibody combination helped them to develop immunological memory of CT26 tumor (Fig. 8c). All surviving tumor-free mice did not show tumor growth, whereas all age-matched naïve mice grew tumors in 9 days after the inoculation. When the tumor-free mice were later challenged with a non-related 4T1 murine breast carcinoma, tumors started to show 10 days after the inoculation, indicating that immune memory was tumor-specific (Fig. 8d). These results collectively support that the systemically administered PTX@NPpD-ATP and anti-PD-1 antibody induced strong anti-tumor immune responses, resulting in complete tumor regression in most mice and anti-tumor immune memory to protect the surviving mice from tumor rechallenge.
Another set of animals were treated with PTX@NPpD-ATP or a combination of PTX@NPpD-ATP and anti-PD-1 antibody by the same regimen (Fig. 8a) and sacrificed at 21 days from the initial treatment for immunophenotyping of tumors. The extent of difference in cell fractions was not as large as those treated with intratumoral injection and sampled at 7 days post-treatment, but the trend remained consistent for mature dendritic cells and M1 macrophages for both PTX@NPpD-ATP and the combination of PTX@NPpD-ATP and anti-PD-1 antibody (Supporting Fig. 32). The combination induced a more prominent trend than PTX@NPpD-ATP alone, suggesting that PD-1/PD-L1 blockade helped maintain APC activities in the tumor. However, there was no significant difference among treatments in Tregs or MDSCs, the cells we expected to downregulate with anti-PD-1 antibody, likely due to the small cell numbers and large variability.
Discussion
Local immunotherapy has shown promise in activating anti-tumor immune responses in tumors, which often suffer from immunosuppressive TME.4,5 However, not all tumors are amenable to local treatment; ultimately, systemic delivery would be necessary to benefit a broad population of cancer patients. To facilitate systemic immunotherapy, we have employed PLGA NPs that are well-established for IV injection, modified the NP surface with ATP to attract APCs, and delivered PTX to induce ICD in tumors. We show that the PTX-loaded NPpD-ATP enhanced the recruitment of immune cells to TME (Fig. 9). Systemically administered, the NPs induced the regression of tumors and extended the survival of animals with the assistance of the host immune system. Combined with the anti-PD-1 antibody, the PTX-loaded NPpD-ATP led to the complete regression of CT26 tumors and the acquisition of anti-tumor immune memory.
Fig. 9. Schematic illustration of the action of PTX@NPpD-ATP, PTX-loaded PLGA nanoparticles coated with ATP.
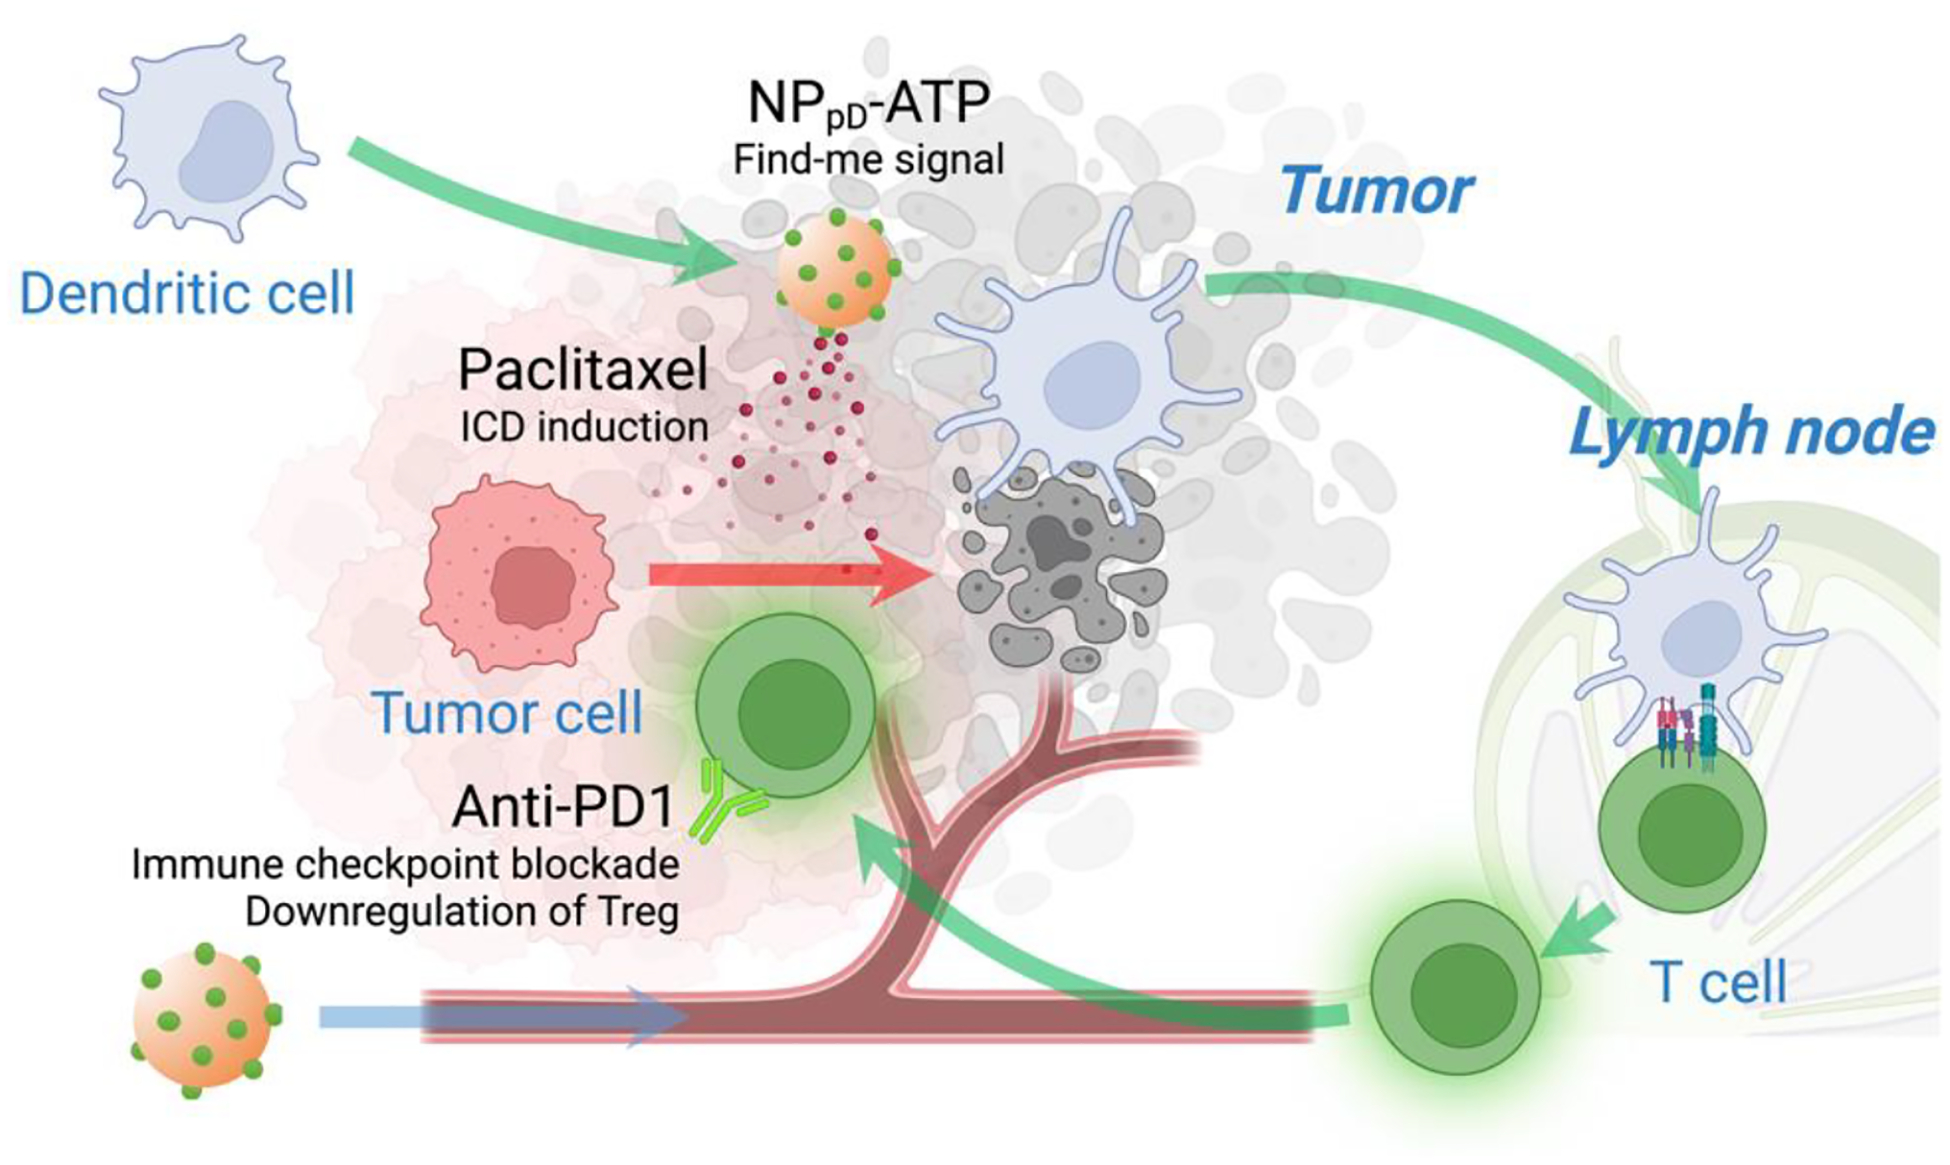
Systemically administered, PTX@NPpD-ATP reaches the tumor through circulation. At the tumor, ATP sends off the “find-me” signal to recruit dendritic cells, and PTX is released from the nanoparticles to generate tumor-associated antigens. Dendritic cells loaded with tumor antigens migrate to lymph nodes to activate anti-tumor T cell immunity. Additional anti-PD1 antibody inhibit the checkpoint interaction between T cells and the cells in the tumor microenvironment, as well as the recruitment of immunosuppressive cells, such as MDSCs and Tregs implicated in the resistance to PTX@NPpD-ATP. Created with BioRender.com.
Here, the contribution of NPs to the delivery of immunotherapeutics is multi-faceted. The comparison of a free dye and dye-conjugated NPs (Fig. 5c) suggests that NPpD-ATP helped retain ATP in the tumor, likely due to the delayed reabsorption and/or impaired lymphatic drainage. In the literature, ATP has been explored as a ligand of purinergic receptors to increase tumor distribution of other NPs.64 However, PTX distribution in tumor (Fig. 5b) and cell uptake of NPs (Supporting Fig. 11) indicate that the surface-bound ATP did not contribute to the NP delivery on tissue or cell levels, at least in the tumor models used here. According to the immune cell fractions (Figs. 3e, 6b, Supporting Figs. 24), ATP instead functioned to enhance the recruitment of APCs, as intended, which translated to the activation of specific anti-tumor immune reactions. NP conjugation helped maintain the stability of ATP, which would otherwise have been degraded by ectoenzymes (CD73 and CD39) commonly expressed in tumor cells.65 The prevention of ATP degradation is significant because the degradation product adenosine induces an immunosuppressive environment by downregulating the functions of infiltrating immune cells.66 Therefore, NPs likely have promoted the local functionality of ATP at least in three ways – by improving its retention in the tumor, protecting the chemoattractant activity, and preventing the generation of immunosuppressive byproducts.
It is noteworthy that the NP-bound ATP, while resisting the enzymatic degradation, still maintained the chemotactic activity. The selective reactivity may be explained by the difference in ATP binding sites. While purinergic P2 receptors inducing chemotaxis recognize ATP at a peripherally accessible site,67,68 apyrase (ATP-degrading enzyme used in this study) accommodates the substrate in the internal binding pocket.69 Bound to NPs via adenine amine group, ATP may remain available for the purinergic receptor but not for apyrase due to the steric hindrance. In other words, the conjugation to PLGA NP surface prevented ATP from enzymatic degradation, without interfering with the desired recognition by dendritic cells. Apyrase shares the structure and function with ectonucleotidases;70 thus, we expect that NPpD-ATP would similarly resist enzymatic attack in TME.
The lack of NP uptake by tumor cells and APCs leads us to suspect that PTX@NPpD-ATP may function extracellularly. The extracellular presence may be beneficial for avoiding the competition between the dual functionalities of PTX@NPpD-ATP - activating dendritic cells via ATP and releasing PTX to induce tumor cell death. This result also indicates that polydopamine modification and ATP conjugation did not increase the uptake by APCs, which is consistent with our previous studies42,71 as well as others.72 It apparently conflicts with an earlier study reporting the increase in Kupffer cell uptake of polydopamine-modified gold NPs (AuNP) via D2 dopamine receptors.73 Of note, AuNP73 and NPpD-ATP are different in size (25 nm vs. 200 nm) and additional PEGylation (~10 PEGs/nm2 vs. no PEG), although we do not know whether these differences have affected the interactions of polydopamine with macrophages. An additional difference is that all our studies were performed in the presence of serum proteins, which were shown to suppress the AuNP-cell interactions via dopamine receptors.73 We infer that serum proteins occupying the exposed polydopamine surface may have attenuated potential interaction with dopamine receptors of phagocytes.
The tumors responded to IV-administered PTX@NPpD-ATP but resumed growth once the treatment ended. The correlation between tumor volume and the number of different immune cells suggests that the response to PTX@NPpD-ATP may be limited by the increased Tregs and MDSCs accompanying the immune activation. The increase of these immunosuppressive immune cells is a common consequence of immunostimulatory therapy.74,75 We used an anti-PD-1 antibody to counteract the negative feedback based on the roles of PD-1/PD-L1 signaling germane to Tregs and MDSC activities and achieved complete tumor regression and specific anti-tumor immune memory in 6 out of 8 mice (Fig. 8b). Alternatively, agents to deplete Tregs or convert them to immune-stimulating cells, such as an anti-CD25 antibody or an EZH2 (enhancer of zeste homolog 2) inhibitor,76 may be used to overcome the resistance to PTX@NPpD-ATP. Others have used ibrutinib to control the MDSC generation and function.74
Conclusions
This study demonstrates the feasibility of using PLGA NPs to systemically deliver ICD-inducing chemotherapy and immunostimulatory signals to tumors to induce anti-tumor immune responses. The NPs helped retain the two compounds in tumors and preserve the activity of the chemoattractant. Still, a couple of limitations remain. First, PTX release needs to be better controlled to minimize premature leakage and allow for timely release in tumors. This may be achieved by employing alternative polymers or biomaterials for the core NPs. Since pD-coating may be performed on virtually all types of materials,32 it would be possible to replace the NP core without affecting the ATP conjugation. Second, current NPs depend on passive transport to tumors via leaky vasculature and impaired lymphatic drainage, a phenomenon called the enhanced permeability and retention effect,77 with no additional means to increase the delivery. We have not observed notable signs of systemic immune-related adverse events through multiple IV injections or adverse effects on body weights throughout the treatments (Supporting Figs. 9, 17, 26, 30). However, to further improve tumor-selective delivery, it will be worthwhile to employ ligands that interact with TME. Our ongoing study exploits the versatility of pD-mediated ligand conjugation78 to incorporate additional ligands to NPpD-ATP. We also acknowledge the size and homogeneity of the NPs remain to be optimized to take full advantage of the leaky vasculature to enter the tumor.
Experimental
Materials
Adenosine triphosphate (ATP) determination kit, Cell Tracker Green, Cell Tracker Deep Red, Transwell (8 μm pore size), ATP, dopamine HCl, 3-(4,5-Dimethylthiazol-2-yl)-2,5-diphenyltetrazolium bromide (MTT), ACK lysis buffer, and potato apyrase were purchased from Thermo Fisher Scientific (Waltham, MA). Poly(lactic-co-glycolic acid) (PLGA, Lactel B6006–1, LA:GA = 85:15, ester end, 0.55–0.75 dL/g) was purchased from Sigma Aldrich (St. Louis, MO). All the other PLGAs were purchased from Akina Inc. (West Lafayette, IN). Paclitaxel (PTX) was a gift of Samyang Biopharm (Seoul, Korea). Carfilzomib (CFZ) was purchased from Shenzhen Chemical Co. LTD. (Shanghai, China). Oxaliplatin (OXA) was purchased from Thermo Fisher Scientific (Waltham, MA). Gemcitabine (GEM) was purchased from LC laboratories (Woburn, MA). Cy7-NH2 was purchased from Lumiprobe (Cockeysville, MD). Cell staining buffer was purchased from BioLegend (San Diego, CA).
Cell lines and media
CT26 murine colon carcinoma cells, B16F10 murine melanoma cells, 4T1 murine breast carcinoma cells, JAWSII murine dendritic cells, J774A.1 murine macrophages, and THP-1 human monocytes were purchased from ATCC (Manassas, VA). Dulbecco’s modified Eagle medium (DMEM), Roswell Park Memorial Institute (RPMI), and Alpha minimum essential medium were purchased from Thermo Fisher Scientific (Waltham, MA). Mouse granulocyte-macrophage colony-stimulating factor (GM-CSF) was purchased from Shenandoah Biotechnology (Warminster, PA).
Cell culture
CT26 cells and J774A.1 macrophages were grown in DMEM supplemented with 10% fetal bovine serum (FBS), 100 units/mL of penicillin, and 100 μg/mL of streptomycin. 4T1 cells were grown in RPMI-1640 supplemented with 10% FBS, 100 units/mL of penicillin, and 100 μg/mL of streptomycin. B16F10 cells were grown in RPMI supplemented with 10% FBS, 100 units/mL of penicillin, and 100 μg/mL of streptomycin. JAWSII cells were grown in alpha minimum essential medium supplemented with 20% FBS, 1 mM sodium pyruvate, 5 ng/mL murine GM-CSF, 100 units/mL of penicillin, and 100 μg/mL of streptomycin. THP-1 cells were grown in RPMI supplemented with 10% FBS, 100 units/mL of penicillin, and 100 μg/mL of streptomycin. Bone marrow-derived macrophages (BMDMs) were grown in alpha minimum essential medium supplemented with 10% FBS, 30 ng/mL murine GM-CSF, 100 units/mL of penicillin, and 100 μg/mL of streptomycin.
Antibodies
Fluorescein Isothiocyanate (FITC)-conjugated anti-CRT antibodies were purchased from Abcam (Cambridge, UK). Anti-HMGB1 antibodies were purchased from Novus Biologicals (Littleton, CO). Collagenase type 4, deoxyribonuclease I, and hyaluronidase were purchased from Worthington (Lakewood, NJ). Anti-mouse CD16/32 (Fc block), FITC-CD45, Phycoerythrin (PE)-CD11c, Allophycocyanin (APC)-CD11c, PE-CD86, APC-CD86, PE-F4/80, Phycoerythrin-Cyanine7 (PE/Cy7)-F4/80, PE-CD80, APC-CD206, FITC-CD206, PE-NKp46, FITC-CD3, PE-CD3, APC-CD4, PE-CD4, PE/Cy7-CD8, APC-CD8, Brilliant Violet™ 421-FOXp3, APC-FOXp3, PE-CD11b and APC-GR1 antibodies were purchased from BioLegend (San Diego, CA). Anti-mouse PD-1 antibody (CD279) was purchased from Bio X Cell (Lebanon, NH).
Animal handling
Female BALB/c mice (5−6 weeks old), male C57BL/6 mice (5−6 weeks old), and female athymic nude (Foxn1nu) mice (5−6 weeks old) were purchased from Envigo (Indianapolis, IN). Mice were acclimatized for a week prior to the procedure. All animal procedures were approved by the Institutional Animal Care and Use Committee of Purdue University in conformity with the NIH guidelines for the care and use of laboratory animals.79
In vitro evaluation of potential immunogenic cell death (ICD) inducers
To evaluate the ICD-inducing potential of PTX and CFZ, cells were treated with the drugs and analyzed for the exposure or production of damage-associated molecular pattern (DAMP) signals, such as calreticulin (CRT), high mobility group B1 (HMGB1), and ATP. For CRT exposure, CT26, B16F10, or 4T1 cells were treated with the drugs at their IC50 concentrations for 6 hours, rinsed with phosphate-buffered saline (PBS), and fixed with 4% paraformaldehyde (PFA). The fixed cells were labeled with FITC-labeled anti-CRT antibodies and analyzed by the BD Accuri C6 flow cytometer (San Jose, CA) to determine the population of CRT-positive cells. For HMGB1 release, CT26, B16F10, or 4T1 cells were treated with the drugs at IC50’s for 24 hours. After 24 hours, supernatants were collected and analyzed by western blot to determine the HMGB1 concentration. For ATP secretion, CT26, B16F10, or 4T1 cells were treated with the drugs at IC50’s for 24 hours. After 24 hours, supernatants were collected and analyzed by the ATP determination kit to determine the ATP concentration.
Dendritic cell uptake of ICD-induced cancer cells
To test the effectiveness of ICD induction, we measured the dendritic cell uptake of ICD inducer-treated cancer cells. First, CT26 cells were stained with Cell Tracker Green for 30 minutes (0.5 μM) and rinsed once with cold serum-free DMEM. CT26 cells were incubated overnight in 10% FBS-supplemented medium to inactivate the unbound dye. CT26 cells were collected, seeded (150,000 cells per well) in a 6-well plate, and incubated for 24 hours. JAWSII cells were stained with Cell Tracker Deep Red for 30 minutes (0.5 μM) and rinsed once with cold serum-free RPMI-1640. JAWSII cells were incubated overnight in 10% FBS medium to inactivate the unbound dye. The labeled CT26 cells were treated with PTX or CFZ at each IC50 (PTX, 250 nM; CFZ, 15 nM) for 6 or 24 hours. After the treatment, CT26 cells were collected by centrifugation at 500 g for 8 minutes. The supernatant was aspirated to remove the remaining drugs. The labeled JAWSII cells (150,000 cells per well) were then added to the drug-treated or non-treated CT26 cells, followed by 24 hours of co-culture. The cells were collected, resuspended in the staining buffer, and analyzed by the Accuri C6 flow cytometer.
Vaccination by ICD-induced cancer cells
For confirmation of the ICD induction by candidate drugs in vivo, animals were inoculated with drug-killed cells and rechallenged with live cells. Briefly, CT26 cells were cultured to 30% confluence in a T150 flask and treated with OXA, GEM, PTX, or CFZ at 100x IC50 for 24 hours to generate an ex vivo vaccine. Dead cells were collected and rinsed with PBS twice to remove excess drugs. Three million dead cells were injected into the right flank of a 6-week-old immunocompetent female BALB/c mouse. Nine days later, 5 × 10⁵ live CT26 cells were inoculated subcutaneously to the left flank, and the tumor growth was monitored.
NPpD-ATP synthesis
ATP-coated PLGA NPs were produced in three steps. First, core PLGA NPs were produced by the single emulsion method. The core NPs were coated with polymerized dopamine (pD) to produce NPpD, which were then incubated with ATP to make ATP-coated PLGA NPs (NPpD-ATP). Core PLGA NPs, NPpD, and NPpD-ATP were collectively called NPs.
PLGA NPs:
100 mg of PLGA (LG 85:15, 0.55–0.75 dL/g, ester end) was dissolved in 1 mL of dichloromethane (DCM). The solution was added to 4 mL of 4% polyvinyl alcohol (PVA). The mixture was emulsified by sonication for 2 minutes by Sonics Vibracell probe sonicator (Newtown, CT), operated by 4 secs on 2 secs off cycle at 40% amplitude. The emulsion was added to 25 mL of deionized (DI) water, stirred for 3 hours, and evaporated by a rotary evaporator for 30 minutes to remove DCM. PLGA NPs were collected by centrifugation at 45000 rcf for 20 minutes. The collected PLGA NPs were resuspended in DI water, sonicated at 20% amplitude for 10 secs, and centrifuged at 45000 rcf for 15 minutes. The washing step was repeated twice. The washed pellet was resuspended in DI water. Part of the suspension was lyophilized to determine the mass, and the rest was stored at 4 °C. For confocal microscopy, 10 wt% of PLGA was replaced with rhodamine B-labeled PLGA (LG 50:50, 25 kDa) to produce the rhodamine B-labeled NPs. For the biodistribution study, DiR-loaded NPs were made by adding DiR (0.25 wt%) to PLGA.
NPpD:
PLGA NPs were incubated in dopamine HCl solution in bicine buffer (10 mM, pH 8.5) for 2 hours at a dopamine HCl-to-NP weight ratio of 0.5/1. When the NPs manifested a dark color of polymerized dopamine, the polymerized dopamine-coated NPs (NPpD) were collected by centrifugation at 45000 rcf for 20 minutes and washed twice with DI water to remove excess dopamine.
NPpD-ATP:
Five milligrams of NPpD were incubated with ATP (100 mg unless specified otherwise) for 1 hour in 10 mL of bicine buffer (10 mM, pH 8.5). The NPs were collected by centrifugation at 45000 rcf for 20 min at 4 °C and washed twice with DI water.
NPpD-Cy7:
Twenty milligrams of NPpD were incubated with 400, 200, 100, or 50 μg of Cy7-NH2 or Cy7-NHS in 5 mL bicine buffer (10 mM, pH 8.5) for 1 h. The NPs were collected by centrifugation at 45000 rcf for 20 min at 4 °C and washed twice with DI water.
Drug-loaded NPpD-ATP:
A hundred milligrams of PLGA (LA:GA= 85:15, 0.55–0.75 dL/g, ester end) and 10 mg of PTX or CFZ were dissolved in 1 mL of DCM. The solution was added to 4 mL of 4% PVA. The mixture was processed in the same manner as blank NPs. The drug-loaded PLGA NPs (PTX@NP or CFZ@NP) were collected by centrifugation at 45000 rcf for 20 minutes. The collected particles were washed with DI water twice. The drug-loaded NP was coated with polymerized dopamine, followed by ATP coating in the same manner as blank NPs.
NP characterization
NPs were prepared as 1 mg/mL suspension in phosphate buffer (10 mM, pH 7.4). The size, polydispersity index, and zeta potential of the NPs were measured by a Malvern Zetasizer Nano ZS90 (Worcestershire, UK). The morphology of NPs was examined by a Phillips CM-100 transmission electron microscope (Hillsboro, OR). Samples were mounted on a 400-mesh Cu grid with Formvar/carbon supporting film and stained with 1% uranyl acetate. Images were captured with a SIA L3-C2megapixel CCD camera (Duluth, GA).
The ATP content in NPpD-ATP was determined by the ATP determination kit. A standard curve was made with ATP solutions with known concentrations. NPpD-ATP was briefly mixed with the ATP determination kit solution for 30 seconds and centrifuged at 16200 rcf and 4 °C for 20 minutes. The supernatant was collected, and its luminescence was measured.
Fourier transform infrared spectroscopy (FTIR)
FTIR spectroscopy was performed to examine the covalent conjugation of ATP on NPpD. ATP, NPpD, a mixture of NPpD and ATP (10:1 weight ratio), and NPpD-ATP were analyzed by Thermo Nicolet Nexus 470 FTIR spectrometer (Madison, WI, USA).
Attraction of dendritic cells by NPpD-ATP (Boyden chamber assay)
2 × 10⁵ JAWSII cells, suspended in 100 μL of complete medium, were added to a Transwell insert (8 μm pore size). Six hundred microliters of medium containing free ATP or NPpD-ATP (both equivalent to 10 μM ATP) was added to the lower compartment. Cells were incubated at 37 °C for 4 hours. The medium in the lower compartment was collected and analyzed by the Accuri C6 flow cytometer to determine the number of cells that migrated across the Transwell.
NPpD-ATP interaction with dendritic cells
Confocal microscopy:
5 × 10⁵ JAWS II cells were seeded in a 35 mm glass-bottomed dish with 4 chambers and a 20 mm microwell (Thermofisher, Waltham, MA). The cells were incubated with rhodamine B-labeled NP, NPpD, and NPpD-ATP in culture medium complemented with 10% FBS for 24 hours, rinsed with PBS 3 times, and fixed in 4% paraformaldehyde/PBS for 10 minutes. The fixed cells were stained with 5 μg/mL wheat germ agglutinin-Alexa Fluor 488 (Thermofisher, Waltham, MA) for 10 minutes, rinsed 3 times with PBS, and stained with 1 μg/mL DAPI for 10 minutes. The stained cells were imaged by the Nikon A1R confocal microscope (Nikon America Inc., Melville, NY).
Flow cytometry:
JAWS II cells were seeded in a 12-well plate at 1.5 × 10⁵ cells per well. The cells were incubated with 200 μg/mL of rhodamine B-labeled NP, NPpD, and NPpD-ATP in culture medium complemented with 10% FBS for 24 hours. The cells were rinsed with PBS 3 times, trypsinized, and collected by centrifugation at 300 rcf for 3 minutes. The collected cells were resuspended in PBS and analyzed by the BD Accuri C6 Flow Cytometer (San Jose, CA).
ATP activity of NPpD-ATP in challenge conditions (serum-containing medium or apyrase)
NPpD-ATP was challenged in a serum-containing medium. NPpD-ATP equivalent to 2 mM ATP were incubated in DMEM containing 10% FBS for 6, 12, 24, 48, or 72 hours. The NPs were then separated from the medium by centrifugation at 16200 rcf for 15 minutes and resuspended in 1 mL of PBS. The FBS-incubated NPpD-ATP (diluted to 10 μM ATP equivalent) or the conditioned medium was added to the lower compartment of the Boyden chamber assay setup. Fresh NPpD-ATP and NP-free medium were used as respective controls. 2 × 10⁵ JAWSII cells were added to the Transwell insert. After 4 hours of incubation, cells that migrated to the lower compartment were counted by the Accuri C6 flow cytometer. To test the stability of the NP-bound ATP in apyrase, 0.833 units/mL of apyrase was added to NPpD-ATP in the lower compartment.
Drug content in drug-loaded NPpD-ATP
PTX and CFZ loading in the drug-loaded NPpD-ATP was determined by HPLC. The NPs with a known mass were dissolved in a 50:50 mixture of acetonitrile (ACN) and water, filtered with 0.45 μm after centrifugation, and analyzed by HPLC. HPLC was performed with an Agilent 1100 HPLC system (Agilent, Palo Alto, CA), equipped with a C18 column (Luna 5 μm column C18(2) 100 Å, LC Column 250 × 4.6 mm). The mobile phase was 50% ACN for PTX and 50% ACN with 0.1% TFA for CFZ, run at 1 mL/min. PTX and CFZ were detected at the wavelength of 227 nm and 210 nm, respectively.
Drug release kinetics from drug-loaded NPpD-ATP
Drug release kinetics of PTX@NPpD-ATP and CFZ@NPpD-ATP were measured in PBS containing 0.2% Tween80 (PBST). The saturation solubility values of PTX and CFZ in PBST were measured to be 13 μg/mL and 9 μg/mL, respectively. PTX@NPpD-ATP and CFZ@NPpD-ATP were dispersed in PBST at concentrations no higher than 13 μg/mL PTX equivalent and 3 μg/mL CFZ equivalent, respectively. The NP suspension was incubated at 37 °C with constant agitation, sampled at each time point, and centrifuged at 45000 rcf for 20 minutes. A hundred and fifty microliters of supernatant was collected per each sampling and analyzed by HPLC. The suspension was replenished with 150 μL of fresh PBST and returned to the NP suspension for continued incubation.
Cytotoxicity of drug-loaded NPpD-ATP
CT26 cells were seeded in 96 wells at 3,000 cells per well and cultured until 30% confluence. The cells were treated with drug solubilized in DMSO (keeping the highest DMSO concentration at < 0.5 v/v%), blank NPpD, drug@NPpD, or drug@NPpD-ATP at a range of concentrations for 24 hours. The medium was replaced with a drug-free complete medium, and the cells were incubated for another 24 hours, followed by the MTT assay. JAWSII cells, THP-1 human monocytes, and J774A.1 macrophages were seeded in 96 wells at 20,000 cells per well. BMDMs were obtained according to the reported procedure6 and seeded in 96 wells at 30,000 cells per well. Cells were cultured until 50% confluence was reached. The JAWSII cells were treated with varying concentrations of drug@NPpD-ATP or free drug counterparts for 96 hours prior to the MTT assay. THP-1, J774A.1, and BMDMs were treated with varying concentrations of PTX or PTX@NPpD-ATP for 24 hours. The medium was replaced with a drug-free complete medium, and the cells were incubated for another 24 hours prior to the MTT assay.
In vivo recruitment of dendritic cells to the tumors by locally administered PTX@NPpD-ATP
Immune-competent female BALB/c mice (5–6 weeks old) were inoculated with 3 × 10⁵ CT26 cells subcutaneously in the upper flank of the right hind limb. When tumors grew to 100 mm3, the mice were randomly assigned to 3 groups and treated with an intratumoral injection of 100 μL of PBS, PTX@NPpD + ATP mixture (free ATP at the same dose as ATP included in PTX@NPpD-ATP), or PTX@NPpD-ATP (all equivalent to PTX 10 mg/kg). Three days after the injection, tumors were collected to quantify the dendritic cell fraction. Tumors were prepared as a single-cell suspension and stained with antibodies for immunophenotyping. The fraction of dendric cells in tumor cell suspension (% CD45+ CD11c+ CD86+) was measured by the Accuri C6 flow cytometer.
Anti-tumor efficacy of systemically administered PTX@NPpD-ATP
Immune-competent female BALB/c mice (5–6 weeks old) were inoculated with 3 × 10⁵ CT26 cells subcutaneously in the upper flank of the right hind limb. Immune-competent Male C57BL/6 mice (5–6 weeks old) were inoculated with 5 × 10⁵ B16F10 cells subcutaneously in the upper flank of the right hind limb. Female athymic nude – Foxn1nu mice (5–6 weeks old) were inoculated with 3 × 10⁵ CT26 cells subcutaneously in the upper flank of the right hind limb. When tumors grew to 50–100 mm3, the mice were randomly assigned to 3 groups and treated with an intravenous injection of 150 μL of PBS, PTX@NPpD, PTX@NP + ATP mixture (free ATP at the same dose as ATP included in PTX@NPpD-ATP), or PTX@NPpD-ATP (all equivalent to PTX 20 mg/kg) every 3 days 4 times. Tumor growth was monitored daily. The length (L) and width (W) of each tumor were measured by a digital caliper, and the volume (V) was calculated by the modified ellipsoid formula: V= (L × W2)/2.
Biodistribution of systemically administered NPpD-ATP in mice with CT26 tumors
Immune-competent female BALB/c mice (5–6-weeks old) were inoculated with 5 × 10⁵ CT26 cells subcutaneously in the upper flank of the right hind limb. When tumors grew to 150–200 mm3, the mice were randomly assigned to three groups and treated with PTX@NP, PTX@NPpD or PTX@NPpD-ATP once (equivalent to PTX 20 mg/kg). After 24 hours, the mice were sacrificed, and major organs (liver, spleen, heart, kidney, lung) and tumors were collected. The collected organs were homogenized in cold PBS (0.25 g tissue/mL PBS) using an Omni Tissue Master 125 homogenizer (Kennesaw, GA). Each homogenate (0.35 mL) was spiked with 600 ng of docetaxel (DTX) as internal standard and mixed with 1.5 mL of methyl tert-butyl ether (tBME). The mixture was vortex-mixed for 5 sec for PTX extraction and rotated for 1.5 hours. After centrifugation at 10,000 rcf for 10 min, 1.3 mL of tBME phase was collected, evaporated, and redissolved in a 60 μL of ACN for LC/MS analysis. Calibration standards were prepared by adding PTX to respective tissue homogenates (0.35 mL) in known quantities (500, 250, 125, 62.5, 31.25, 15.625, 7.8, 3.9 and 1.95 ng) and processed in the same way as samples. PTX quantification was performed with a 6460 QQQ LC/MS/MS mass spectrometer (Agilent Technologies, Santa Clara, CA, USA). Ten microliters of samples or standards were injected onto Xbridge C18 column (2.1mm × 100 mm, particle size 3.5 μm, Waters Corporation, Milford, MA, USA) maintained at 35 °C. A mobile phase consisting of 0.1% formic acid (FA) in water (A) and 0.1 % FA in methanol (B) was run in a gradient for 15 min at a flow rate of 0.3 mL/min. The gradient was set up as follows: 50% A, 50% B by 1 min; 0% A, 100% B by 11 min; and 50% A, 50% B by 15 min. The parent ions, [PTX+H]+ and [DTX+H]+ were monitored at the m/z ratios of 854.2 and 808.3, respectively. Peak ratios of PTX to DTX were plotted against the nominal concentration of PTX to generate a calibration curve from each tissue.
Another set of CT26 tumor-bearing mice was treated with rhodamine B-labeled NP, NPpD or NPpD-ATP. Tumors were collected after 24 hours and split into 2 parts. One part was processed to a single cell suspension, stained with zombie dye, blocked with anti-mouse CD16/32 antibody, labeled with FITC anti-mouse CD45 antibody, and analyzed by for flow cytometry. The other part was prepared for microscopy. Tumor tissues were soaked in 15% and 30% sucrose/PBS solution overnight at 4 °C sequentially, embedded in optimal cutting temperature compound (Tissue-Plus® O.C.T., Fisher Scientific, Pittsburgh, PA) and slowly frozen in isopentane chilled with liquid nitrogen. Cryostat sections were cut 8 μm thick, mounted on glass slides, stained with DAPI, and imaged with the Nikon A1R confocal microscope (Nikon Instruments Inc., Melville, NY).
Tumor retention of NPpD-Cy7
Immune-competent female BALB/c mice (5–6 weeks old) were inoculated with 3 × 10⁵ CT26 cells were subcutaneously inoculated in the upper flank of the right hind limb. When tumors grew to 100 mm3, the mice were intratumorally injected with Cy7-NH2 or NPpD-Cy7 (equivalent to 0.15 μg of Cy7) in 20 μL. The fluorescence intensity of NPpD-Cy7 or Cy7-NH2 was monitored by the Spectral Ami Optical Imaging System (Spectral Instruments, Tucson, AZ) with λEx of 749 nm and λEm of 790 nm.
Anti-tumor efficacy of intratumorally administered PTX@NPpD-ATP
Female BALB/c mice (5–6 weeks old) were inoculated with 3 × 10⁵ CT26 cells subcutaneously in the upper flank of the right hind limb. When tumors grew to 50–100 mm3, the mice were randomly assigned to 5 groups and treated with an intratumoral injection of 100 μL of PBS, PTX nanocrystals (NC),45,46 PTX NC + ATP, PTX@NPpD, PTX@NPpD + ATP (free ATP at the same dose as ATP included in PTX@NPpD-ATP), or PTX@ NPpD -ATP (all equivalent to PTX 5 mg/kg). Tumor growth was monitored as described above.
Immune cell profiling of CT26 tumors treated with intratumoral PTX@NPpD-ATP
Female BALB/c mice (5–6 weeks old) were inoculated with 3 × 10⁵ CT26 cells subcutaneously in the upper flank of the right hind limb. When tumors grew to 50–100 mm3, the mice were randomly assigned to 3 groups and treated with an intratumoral injection of 100 μL of PBS, PTX@NPpD + ATP (free ATP at the same dose as ATP included in PTX@NPpD-ATP), or PTX@NPpD-ATP (all equivalent to PTX 5 mg/kg). Seven or 20 days after the injection, tumors, spleen, and tumor-draining lymph nodes were collected to determine the immune cell fraction by the BD LSRFortessa Flow Cytometer (San Jose, CA).
Anti-tumor efficacy of PTX@NPpD-ATP - anti-PD-1 antibody combination
Female BALB/c mice (5–6 weeks old) were inoculated with 3 × 10⁵ CT26 cells subcutaneously in the upper flank of the right hind limb. When tumors grew to 50–100 mm3, the mice were randomly assigned to 4 groups and treated with PBS, PBS + anti-PD-1 antibody, PTX@NPpD-ATP, or PTX@NPpD-ATP + anti-PD-1 antibody. PBS or PTX@NPpD-ATP (equivalent to PTX 20 mg/kg) were given intravenously every 3 days up to 4 times. Anti-PD-1 antibody (150 μg per mouse) were administered intraperitoneally every 3 days up to 4 times from the 7th day after the initial injection of PBS or PTX@NPpD-ATP. Tumor growth was monitored as described above.
Supplementary Material
Acknowledgements
This work was supported by the National Institutes of Health (R01 CA232419, R01 CA258737). This work was also supported by the Indiana Clinical and Translational Sciences Institute, funded in part by grant UL1 TR002529 from the National Institutes of Health, National Center for Advancing Translational Sciences, Clinical and Translational Sciences Award, and the Purdue University Institute for Cancer Research. The authors acknowledge the help of Yanying He in animal monitoring, Simseok A. Yuk in flow cytometry, Maie Taha and Zhongyue Yuan in study techniques. The authors also acknowledge the use of the Metabolite Profiling Facility of the Bindley Bioscience Center, a core facility of the NIH-funded Indiana Clinical and Translational Sciences Institute.
Footnotes
Supporting Information
The Supporting Information is available free of charge at http://pubs.acs.org.
Supporting Table S1 summarizes properties of drug-loaded NPpD-ATP. Supporting Figures S1–S32 show the FTIR spectra of free ATP, NPpD + ATP, and NPpD-ATP; Boyden chamber assay set up to determine the activity of NP-bound ATP and free ATP; morphology of JAWSII cells treated with NP, NPpD, or NPpD-ATP; drug release kinetics and cytotoxicity of CFZ-loaded NPpD-ATP; cytotoxicity of free PTX and NP-encapsulated PTX on CT26, THP-1, J744A.1 and BMDM; antitumor effects of intravenously-administered PTX@NPpD-ATP, Taxol or PTX NC in CT26 model; biodistribution of PTX in CT26@BALB/c mice at 24 hours after a single intravenous injection of PTX@NP, PTX@NPpD or PTX@NPpD-ATP; tumor cell uptake of NPpD-ATP and control NPs to test the ligand function of NP-bound ATP; characterization of Cy7-labeled NPpD-ATP; full-time profile of tumor retention of free Cy-NH2 and NPpD-Cy7; JAWSII cell uptake of NPpD-ATP and control NPs; flow cytometric analysis and fluorescence images of tumor sections of CT26 tumors 24 hours after intravenous injection of rhodamine B-labeled NP, NPpD or NPpD-ATP; flow cytometric gating strategies and full profiles of immune cell fractions in tumors, TDLN, and spleen of CT26-bearing BALB/c mice at 7 days after a single intratumoral treatment of PTX@NPpD + ATP mixture or PTX@NPpD-ATP; flow cytometric gating strategy and immune cell fractions in tumors B16F10-bearing C57BL/6 mice at 7 days after a single intratumoral treatment of PTX@NPpD-ATP; relationship of CT26 tumor size and immune cell population in the tumor, TDLN, and spleen at 25 days after an intratumoral injection of PTX@NPpD-ATP; and a control group of animals treated with anti-PD-1 antibody when tumors were 50–100 mm3; immune cell fractions in CT26 tumors of BALB/c mice receiving PTX@NPpD-ATP or PTX@NPpD-ATP by intravenous injection and anti-PD-1 antibodies by intraperitoneal injection.
The authors declare no competing financial interest.
References
- 1.Murciano-Goroff YR, Warner AB & Wolchok JD The future of cancer immunotherapy: microenvironment-targeting combinations. Cell Res 30, 507–519 (2020). 10.1038/s41422-020-0337-2 [DOI] [PMC free article] [PubMed] [Google Scholar]
- 2.Garon EB et al. Pembrolizumab for the treatment of non-small-cell lung cancer. N Engl J Med 372, 2018–2028 (2015). 10.1056/NEJMoa1501824 [DOI] [PubMed] [Google Scholar]
- 3.Larkin J, Hodi FS & Wolchok JD Combined Nivolumab and Ipilimumab or Monotherapy in Untreated Melanoma. N Engl J Med 373, 1270–1271 (2015). 10.1056/NEJMc1509660 [DOI] [PubMed] [Google Scholar]
- 4.Jenkins RW, Barbie DA & Flaherty KT Mechanisms of resistance to immune checkpoint inhibitors. Br J Cancer 118, 9–16 (2018). 10.1038/bjc.2017.434 [DOI] [PMC free article] [PubMed] [Google Scholar]
- 5.Peng M et al. Neoantigen vaccine: an emerging tumor immunotherapy. Mol Cancer 18, 128 (2019). 10.1186/s12943-019-1055-6 [DOI] [PMC free article] [PubMed] [Google Scholar]
- 6.Meng F et al. A single local delivery of paclitaxel and nucleic acids via an immunoactive polymer eliminates tumors and induces antitumor immunity. Proc Natl Acad Sci U S A 119, e2122595119 (2022). 10.1073/pnas.2122595119 [DOI] [PMC free article] [PubMed] [Google Scholar]
- 7.Hodge JW et al. Chemotherapy-induced immunogenic modulation of tumor cells enhances killing by cytotoxic T lymphocytes and is distinct from immunogenic cell death. Int J Cancer 133, 624–636 (2013). 10.1002/ijc.28070 [DOI] [PMC free article] [PubMed] [Google Scholar]
- 8.Taha MS et al. Sustained Delivery of Carfilzomib by Tannic Acid-Based Nanocapsules Helps Develop Antitumor Immunity. Nano Lett 19, 8333–8341 (2019). 10.1021/acs.nanolett.9b04147 [DOI] [PMC free article] [PubMed] [Google Scholar]
- 9.Galluzzi L, Buque A, Kepp O, Zitvogel L & Kroemer G Immunogenic cell death in cancer and infectious disease. Nat Rev Immunol 17, 97–111 (2017). 10.1038/nri.2016.107 [DOI] [PubMed] [Google Scholar]
- 10.Aznar MA et al. Intratumoral Delivery of Immunotherapy-Act Locally, Think Globally. J Immunol 198, 31–39 (2017). 10.4049/jimmunol.1601145 [DOI] [PubMed] [Google Scholar]
- 11.Kwon S & Yeo Y Local immunotherapy of cancer and metastasis. In Systemic Drug Delivery Strategies, 1st ed.; Amiji MM & Milane LS, Eds.; Academic Press, Cambridge, MA, 2022; pp 483–528. [Google Scholar]
- 12.Park SH et al. An intratumoral injectable, electrostatic, cross-linkable curcumin depot and synergistic enhancement of anticancer activity. NPG Asia Materials 9, e397–e397 (2017). 10.1038/am.2017.102 [DOI] [Google Scholar]
- 13.Xing Z et al. Intracellular mRNA phase separation induced by cationic polymers for tumor immunotherapy. J Nanobiotechnology 20, 442 (2022). 10.1186/s12951-022-01647-8 [DOI] [PMC free article] [PubMed] [Google Scholar]
- 14.Makadia HK & Siegel SJ Poly Lactic-co-Glycolic Acid (PLGA) as Biodegradable Controlled Drug Delivery Carrier. Polymers (Basel) 3, 1377–1397 (2011). 10.3390/polym3031377 [DOI] [PMC free article] [PubMed] [Google Scholar]
- 15.Rafiei P & Haddadi A Docetaxel-loaded PLGA and PLGA-PEG nanoparticles for intravenous application: pharmacokinetics and biodistribution profile. Int J Nanomedicine 12, 935–947 (2017). 10.2147/IJN.S121881 [DOI] [PMC free article] [PubMed] [Google Scholar]
- 16.Krysko DV et al. Immunogenic cell death and DAMPs in cancer therapy. Nat Rev Cancer 12, 860–875 (2012). 10.1038/nrc3380 [DOI] [PubMed] [Google Scholar]
- 17.Elliott MR et al. Nucleotides released by apoptotic cells act as a find-me signal to promote phagocytic clearance. Nature 461, 282–286 (2009). 10.1038/nature08296 [DOI] [PMC free article] [PubMed] [Google Scholar]
- 18.Tiberio L et al. Chemokine and chemotactic signals in dendritic cell migration. Cell Mol Immunol 15, 346–352 (2018). 10.1038/s41423-018-0005-3 [DOI] [PMC free article] [PubMed] [Google Scholar]
- 19.Terenzi A, Pirker C, Keppler BK & Berger W Anticancer metal drugs and immunogenic cell death. J Inorg Biochem 165, 71–79 (2016). 10.1016/j.jinorgbio.2016.06.021 [DOI] [PubMed] [Google Scholar]
- 20.Serrano-Del Valle A, Anel A, Naval J & Marzo I Immunogenic Cell Death and Immunotherapy of Multiple Myeloma. Front Cell Dev Biol 7, 50 (2019). 10.3389/fcell.2019.00050 [DOI] [PMC free article] [PubMed] [Google Scholar]
- 21.Garg AD et al. Trial watch: Immunogenic cell death induction by anticancer chemotherapeutics. Oncoimmunology 6, e1386829 (2017). 10.1080/2162402X.2017.1386829 [DOI] [PMC free article] [PubMed] [Google Scholar]
- 22.Bardal SK, Waechter JE & Martin DS Neoplasia. In Applied Pharmacology, 1st ed.; Elsevier, St. Louis, MO, 2011; pp 305–324. [Google Scholar]
- 23.Tesniere A et al. Immunogenic death of colon cancer cells treated with oxaliplatin. Oncogene 29, 482–491 (2010). 10.1038/onc.2009.356 [DOI] [PubMed] [Google Scholar]
- 24.Kepp O et al. Consensus guidelines for the detection of immunogenic cell death. Oncoimmunology 3, e955691 (2014). 10.4161/21624011.2014.955691 [DOI] [PMC free article] [PubMed] [Google Scholar]
- 25.Long BH & Fairchild CR Paclitaxel inhibits progression of mitotic cells to G1 phase by interference with spindle formation without affecting other microtubule functions during anaphase and telephase. Cancer Res 54, 4355–4361 (1994). [PubMed] [Google Scholar]
- 26.KYPROLIS®. Package Insert. Onyx Pharmaceuticals Inc. (2012) https://www.accessdata.fda.gov/drugsatfda_docs/label/2012/202714lbl.pdf (accessed: March 20, 2020) [Google Scholar]
- 27.Kortuem KM & Stewart AK Carfilzomib. Blood 121, 893–897 (2013). 10.1182/blood-2012-10-459883 [DOI] [PubMed] [Google Scholar]
- 28.Jarauta V et al. Inhibition of autophagy with chloroquine potentiates carfilzomib-induced apoptosis in myeloma cells in vitro and in vivo. Cancer Lett 382, 1–10 (2016). 10.1016/j.canlet.2016.08.019 [DOI] [PubMed] [Google Scholar]
- 29.Tu K et al. Reshaping Tumor Immune Microenvironment through Acidity-Responsive Nanoparticles Featured with CRISPR/Cas9-Mediated Programmed Death-Ligand 1 Attenuation and Chemotherapeutics-Induced Immunogenic Cell Death. ACS Appl Mater Interfaces 12, 16018–16030 (2020). 10.1021/acsami.9b23084 [DOI] [PubMed] [Google Scholar]
- 30.Pfannenstiel LW, Lam SS, Emens LA, Jaffee EM & Armstrong TD Paclitaxel enhances early dendritic cell maturation and function through TLR4 signaling in mice. Cell Immunol 263, 79–87 (2010). 10.1016/j.cellimm.2010.03.001 [DOI] [PMC free article] [PubMed] [Google Scholar]
- 31.Kroemer G, Galluzzi L, Kepp O & Zitvogel L Immunogenic cell death in cancer therapy. Annu Rev Immunol 31, 51–72 (2013). 10.1146/annurev-immunol-032712-100008 [DOI] [PubMed] [Google Scholar]
- 32.Lee H, Dellatore SM, Miller WM & Messersmith PB Mussel-inspired surface chemistry for multifunctional coatings. Science (New York, N.Y.) 318, 426–430 (2007). 10.1126/science.1147241 [DOI] [PMC free article] [PubMed] [Google Scholar]
- 33.Socrates G Infrared and Raman characteristic group frequencies: tables and charts. 3rd edn, (Wiley, 2001). [Google Scholar]
- 34.Malvern Panalytical. Dynamic Light Scattering in 30 Minutes. (2017). https://www.malvernpanalytical.com/en/learn/events-and-training/webinars/w170523dls30minutes (accessed: November 2023).
- 35.Kim MK & Kim J Properties of immature and mature dendritic cells: phenotype, morphology, phagocytosis, and migration. Rsc Adv 9, 11230–11238 (2019). 10.1039/c9ra00818g [DOI] [PMC free article] [PubMed] [Google Scholar]
- 36.Saez PJ et al. ATP promotes the fast migration of dendritic cells through the activity of pannexin 1 channels and P2X7 receptors. Sci Signal 10 (2017). 10.1126/scisignal.aah7107 [DOI] [PubMed] [Google Scholar]
- 37.Jin D et al. CD73 on tumor cells impairs antitumor T-cell responses: a novel mechanism of tumor-induced immune suppression. Cancer Res 70, 2245–2255 (2010). 10.1158/0008-5472.CAN-09-3109 [DOI] [PMC free article] [PubMed] [Google Scholar]
- 38.Hausler SF et al. Ectonucleotidases CD39 and CD73 on OvCA cells are potent adenosine-generating enzymes responsible for adenosine receptor 2A-dependent suppression of T cell function and NK cell cytotoxicity. Cancer Immunol Immunother 60, 1405–1418 (2011). 10.1007/s00262-011-1040-4 [DOI] [PMC free article] [PubMed] [Google Scholar]
- 39.Cohn M & Meek GA The mechanism of hydrolysis of adenosine di- and tri-phosphate catalysed by potato apyrase. Biochem J 66, 128–130 (1957). 10.1042/bj0660128 [DOI] [PMC free article] [PubMed] [Google Scholar]
- 40.Clogston JD & Vermilya A NCL Method PCC-2: Measuring Zeta Potential of Nanoparticles. April 2020, https://ncl.cancer.gov/resources/assay-cascade-protocols DOI: 10.17917/ZB8P-FB40 (accessed: October 31, 2023). [DOI] [Google Scholar]
- 41.Jun Y et al. Carfilzomib Delivery by Quinic Acid-Conjugated Nanoparticles: Discrepancy Between Tumoral Drug Accumulation and Anticancer Efficacy in a Murine 4T1 Orthotopic Breast Cancer Model. J Pharm Sci 109, 1615–1622 (2020). 10.1016/j.xphs.2020.01.008 [DOI] [PMC free article] [PubMed] [Google Scholar]
- 42.Xu J et al. Quinic Acid-Conjugated Nanoparticles Enhance Drug Delivery to Solid Tumors via Interactions with Endothelial Selectins. Small 14, e1803601 (2018). 10.1002/smll.201803601 [DOI] [PMC free article] [PubMed] [Google Scholar]
- 43.John J et al. Differential effects of Paclitaxel on dendritic cell function. BMC Immunol 11, 14 (2010). 10.1186/1471-2172-11-14 [DOI] [PMC free article] [PubMed] [Google Scholar]
- 44.Nencioni A et al. Proteasome inhibitor-induced apoptosis in human monocyte-derived dendritic cells. Eur J Immunol 36, 681–689 (2006). 10.1002/eji.200535298 [DOI] [PubMed] [Google Scholar]
- 45.Park J, Sun B & Yeo Y Albumin-coated nanocrystals for carrier-free delivery of paclitaxel. Journal of Controlled Release 263, 90–101 (2017). 10.1016/j.jconrel.2016.12.040 [DOI] [PMC free article] [PubMed] [Google Scholar]
- 46.Park J et al. A Comparative In Vivo Study of Albumin-Coated Paclitaxel Nanocrystals and Abraxane. Small 14, e1703670 (2018). 10.1002/smll.201703670 [DOI] [PMC free article] [PubMed] [Google Scholar]
- 47.Yu JW et al. Tumor-immune profiling of murine syngeneic tumor models as a framework to guide mechanistic studies and predict therapy response in distinct tumor microenvironments. PLoS One 13, e0206223 (2018). 10.1371/journal.pone.0206223 [DOI] [PMC free article] [PubMed] [Google Scholar]
- 48.Lechner MG et al. Immunogenicity of murine solid tumor models as a defining feature of in vivo behavior and response to immunotherapy. J Immunother 36, 477–489 (2013). 10.1097/01.cji.0000436722.46675.4a [DOI] [PMC free article] [PubMed] [Google Scholar]
- 49.Kunzli BM et al. Impact of CD39 and purinergic signalling on the growth and metastasis of colorectal cancer. Purinergic Signal 7, 231–241 (2011). 10.1007/s11302-011-9228-9 [DOI] [PMC free article] [PubMed] [Google Scholar]
- 50.Peterfalvi A et al. Much More Than a Pleasant Scent: A Review on Essential Oils Supporting the Immune System. Molecules 24 (2019). 10.3390/molecules24244530 [DOI] [PMC free article] [PubMed] [Google Scholar]
- 51.Peng J et al. Chemotherapy Induces Programmed Cell Death-Ligand 1 Overexpression via the Nuclear Factor-kappaB to Foster an Immunosuppressive Tumor Microenvironment in Ovarian Cancer. Cancer Res 75, 5034–5045 (2015). 10.1158/0008-5472.CAN-14-3098 [DOI] [PubMed] [Google Scholar]
- 52.Roux C et al. Reactive oxygen species modulate macrophage immunosuppressive phenotype through the up-regulation of PD-L1. Proc Natl Acad Sci U S A 116, 4326–4335 (2019). 10.1073/pnas.1819473116 [DOI] [PMC free article] [PubMed] [Google Scholar]
- 53.Mandai M et al. Dual Faces of IFNgamma in Cancer Progression: A Role of PD-L1 Induction in the Determination of Pro- and Antitumor Immunity. Clin Cancer Res 22, 2329–2334 (2016). 10.1158/1078-0432.CCR-16-0224 [DOI] [PubMed] [Google Scholar]
- 54.Zou W & Chen L Inhibitory B7-family molecules in the tumour microenvironment. Nat Rev Immunol 8, 467–477 (2008). 10.1038/nri2326 [DOI] [PubMed] [Google Scholar]
- 55.Lu C, Redd PS, Lee JR, Savage N & Liu K The expression profiles and regulation of PD-L1 in tumor-induced myeloid-derived suppressor cells. Oncoimmunology 5, e1247135 (2016). 10.1080/2162402X.2016.1247135 [DOI] [PMC free article] [PubMed] [Google Scholar]
- 56.Groth C et al. Immunosuppression mediated by myeloid-derived suppressor cells (MDSCs) during tumour progression. Br J Cancer 120, 16–25 (2019). 10.1038/s41416-018-0333-1 [DOI] [PMC free article] [PubMed] [Google Scholar]
- 57.Cai J, Wang D, Zhang G & Guo X The Role Of PD-1/PD-L1 Axis In Treg Development And Function: Implications For Cancer Immunotherapy. Onco Targets Ther 12, 8437–8445 (2019). 10.2147/OTT.S221340 [DOI] [PMC free article] [PubMed] [Google Scholar]
- 58.Pardoll DM The blockade of immune checkpoints in cancer immunotherapy. Nat Rev Cancer 12, 252–264 (2012). 10.1038/nrc3239 [DOI] [PMC free article] [PubMed] [Google Scholar]
- 59.Yoshida K et al. Anti-PD-1 antibody decreases tumour-infiltrating regulatory T cells. BMC Cancer 20, 25 (2020). 10.1186/s12885-019-6499-y [DOI] [PMC free article] [PubMed] [Google Scholar]
- 60.Dyck L et al. Anti-PD-1 inhibits Foxp3(+) Treg cell conversion and unleashes intratumoural effector T cells thereby enhancing the efficacy of a cancer vaccine in a mouse model. Cancer Immunol Immunother 65, 1491–1498 (2016). 10.1007/s00262-016-1906-6 [DOI] [PMC free article] [PubMed] [Google Scholar]
- 61.Yu GT et al. PD-1 blockade attenuates immunosuppressive myeloid cells due to inhibition of CD47/SIRPalpha axis in HPV negative head and neck squamous cell carcinoma. Oncotarget 6, 42067–42080 (2015). 10.18632/oncotarget.5955 [DOI] [PMC free article] [PubMed] [Google Scholar]
- 62.Messenheimer DJ et al. Timing of PD-1 Blockade Is Critical to Effective Combination Immunotherapy with Anti-OX40. Clin Cancer Res 23, 6165–6177 (2017). 10.1158/1078-0432.CCR-16-2677 [DOI] [PMC free article] [PubMed] [Google Scholar]
- 63.Kim Y et al. Sequential and Timely Combination of a Cancer Nanovaccine with Immune Checkpoint Blockade Effectively Inhibits Tumor Growth and Relapse. Angew Chem Int Ed Engl 59, 14628–14638 (2020). 10.1002/anie.202006117 [DOI] [PubMed] [Google Scholar]
- 64.Rajabnia T & Meshkini A Fabrication of adenosine 5′-triphosphate-capped silver nanoparticles: Enhanced cytotoxicity efficacy and targeting effect against tumor cells. Process Biochemistry 65, 186–196 (2018). 10.1016/j.procbio.2017.11.003 [DOI] [Google Scholar]
- 65.Antonioli L, Pacher P, Vizi ES & Hasko G CD39 and CD73 in immunity and inflammation. Trends Mol Med 19, 355–367 (2013). 10.1016/j.molmed.2013.03.005 [DOI] [PMC free article] [PubMed] [Google Scholar]
- 66.Feng LL, Cai YQ, Zhu MC, Xing LJ & Wang X The yin and yang functions of extracellular ATP and adenosine in tumor immunity. Cancer Cell Int 20, 110 (2020). 10.1186/s12935-020-01195-x [DOI] [PMC free article] [PubMed] [Google Scholar]
- 67.Karasawa A & Kawate T Structural basis for subtype-specific inhibition of the P2X7 receptor. Elife 5 (2016). 10.7554/eLife.22153 [DOI] [PMC free article] [PubMed] [Google Scholar]
- 68.Kasuya G et al. Structural Insights into Divalent Cation Modulations of ATP-Gated P2X Receptor Channels. Cell Rep 14, 932–944 (2016). 10.1016/j.celrep.2015.12.087 [DOI] [PubMed] [Google Scholar]
- 69.Kozakiewicz A, Neumann P, Banach M, Komoszyński M & Wojtczak A Modeling studies of potato nucleoside triphosphate diphosphohydrolase NTPDase1: an insight into the catalytic mechanism. Acta Biochimica Polonica 55, 141–150 (2008). 10.18388/abp.2008_3107 [DOI] [PubMed] [Google Scholar]
- 70.Wang T-F & Guidotti G CD39 Is an Ecto-(Ca2+,Mg2+)-apyrase. Journal of Biological Chemistry 271, 9898–9901 (1996). 10.1074/jbc.271.17.9898 [DOI] [PubMed] [Google Scholar]
- 71.Hyun H et al. Surface modification of polymer nanoparticles with native albumin for enhancing drug delivery to solid tumors. Biomaterials 180, 206–224 (2018). 10.1016/j.biomaterials.2018.07.024 [DOI] [PMC free article] [PubMed] [Google Scholar]
- 72.Hong S et al. Attenuation of the in vivo toxicity of biomaterials by polydopamine surface modification. Nanomedicine (Lond) 6, 793–801 (2011). 10.2217/nnm.11.76 [DOI] [PubMed] [Google Scholar]
- 73.Liu Y et al. Dopamine Receptor-Mediated Binding and Cellular Uptake of Polydopamine-Coated Nanoparticles. ACS Nano 15, 13871–13890 (2021). 10.1021/acsnano.1c06081 [DOI] [PubMed] [Google Scholar]
- 74.Conniot J et al. Immunization with mannosylated nanovaccines and inhibition of the immune-suppressing microenvironment sensitizes melanoma to immune checkpoint modulators. Nat Nanotechnol 14, 891–901 (2019). 10.1038/s41565-019-0512-0 [DOI] [PubMed] [Google Scholar]
- 75.Schaue D, Xie MW, Ratikan JA & McBride WH Regulatory T cells in radiotherapeutic responses. Front Oncol 2, 90 (2012). 10.3389/fonc.2012.00090 [DOI] [PMC free article] [PubMed] [Google Scholar]
- 76.Han S, Toker A, Liu ZQ & Ohashi PS Turning the Tide Against Regulatory T Cells. Front Oncol 9, 279 (2019). 10.3389/fonc.2019.00279 [DOI] [PMC free article] [PubMed] [Google Scholar]
- 77.Matsumura Y & Maeda H A new concept for macromolecular therapeutics in cancer chemotherapy: mechanism of tumoritropic accumulation of proteins and the antitumor agent smancs. Cancer Res 46, 6387–6392 (1986). [PubMed] [Google Scholar]
- 78.Park J et al. Polydopamine-based simple and versatile surface modification of polymeric nano drug carriers. ACS Nano 8, 3347–3356 (2014). 10.1021/nn405809c [DOI] [PMC free article] [PubMed] [Google Scholar]
- 79.Council NR Guide for the Care and Use of Laboratory Animals. (National Academies Press (US), National Academy of Sciences., 2011). [Google Scholar]
Associated Data
This section collects any data citations, data availability statements, or supplementary materials included in this article.