Abstract
The aim of this study was to investigate the role of myeloid-derived suppressor cells (MDSC) in the induction of cancer stem-like cells (CSC) and programmed death ligand 1 (PD-L1) expression in ovarian cancer. CSC were defined as tumor cells expressing high levels of aldehyde dehydrogenase 1 (ALDH 1). We inoculated G-CSF-expressing or Mock-expressing ovarian cancer cells into mice, and the frequencies of MDSC and CSC in tumors of these models were compared by flow cytometry. To directly demonstrate the role of MDSC in the induction of CSC and the increase in PD-L1 expression, we performed in vitro co-culture. MDSC and CSC (ALDH-high cells) were more frequently observed in G-CSF-expressing cell-derived tumors than in Mock-expressing cell-derived tumors. Co-culture experiments revealed that MDSC increased the number of CSC via the production of PGE2. Moreover, PGE2 produced by MDSC increased tumor PD-L1 expression via the mammalian target of rapamycin (mTOR) pathway in ovarian cancer cells. In an in vitro experiment in which ovarian cancer cells were co-cultured with MDSC, higher expression of PD-L1 was observed in CSC than in non-CSC (ALDH-low cells). Furthermore, by immunofluorescence staining, we found that PD-L1 was co-expressed with ALDH1 in in vivo mouse models. In conclusion, PGE2 produced by MDSC increases the stem cell-like properties and tumor PD-L1 expression in epithelial ovarian cancer. Depleting MDSC may be therapeutically effective against ovarian cancer by reducing the number of CSC and tumor PD-L1 expression.
Electronic supplementary material
The online version of this article (10.1007/s00262-020-02628-2) contains supplementary material, which is available to authorized users.
Keywords: Ovarian cancer, Myeloid-derived suppressor cells, Cancer stem cell, Programmed death ligand 1
Introduction
Epithelial ovarian cancer is one of the leading causes of cancer-related death among women, accounting for 295,000 new cases and 185,000 deaths annually worldwide [1]. Due to its asymptomatic nature and lack of effective screening tests, the majority of patients are diagnosed at advanced stages [2]. Although most advanced-stage ovarian cancer responds to the initial treatment, including primary debulking surgery and platinum-based chemotherapy, it will ultimately relapse in more than 70% of patients [3]. Therefore, overcoming platinum resistance is one of the important goals of epithelial ovarian cancer treatment.
Tumor-related leukocytosis (TRL) is a paraneoplastic syndrome that occasionally develops in cancer patients. In recent studies, TRL was observed in approximately in 10–15% of epithelial ovarian cancer patients and is associated with a poor prognosis [4, 5]. However, the mechanism responsible for the poor prognosis in TRL patients with ovarian cancer remains unclear.
Intra-tumor heterogeneity represents the phenotypic diversity of neoplastic cells within a tumor [6]. Tumor heterogeneity can arise from cancers that follow a stem cell model containing different subpopulations of tumorigenic and non-tumorigenic cancer cells [7]. Cancer stem-like cells (CSC) are a relatively small subset of cancer cells considered to play a role in tumor initiation, progression, metastasis and chemoresistance [8]. Several markers of CSC, such as CD44, CD133 and aldehyde dehydrogenase-1 (ALDH1), have been identified in different cancers [9]. Ayub et al. reported that increased ALDH1 expression after taxane/platinum-based neoadjuvant chemotherapy was associated with platinum resistance and independently with an unfavorable outcome of ovarian cancer [7]. Therefore, targeting CSC may be therapeutically effective for overcoming platinum resistance in ovarian cancer.
Intra-tumor immunosuppression is another important issue in overcoming the chemoresistance of ovarian cancer [10, 11]. Among all immune checkpoints, the programmed cell death protein 1 (PD-1)—programmed cell death-ligand 1 (PD-L1) pathway has gained attention because of its confirmed value as therapeutic target in numerous malignancies such as melanoma, renal cancer and lung cancer [12–14]. Recently, PD-L1 was reported to be expressed in CSC [15, 16], suggesting that they have the ability to escape from immune surveillance, leading to recurrence or metastasis after existing anti-cancer therapies. However, the mechanism by which CSC evade immune system in tumor is unclear.
Myeloid-derived suppressor cells (MDSC) are a heterogeneous population of immature myeloid cells that exhibit immunosuppressive activity [17]. MDSC suppress anti-tumor immunity via a diverse range of mechanisms [18]. Recently, studies including ours revealed that MDSC may function in the induction of CSC [10, 19–21]. Considering the previous reports suggesting the expression of PD-L1 in CSC, MDSC may suppress anti-tumor immunity via the production of CSC. However, interactions among CSC, MDSC and immune checkpoint molecules within the tumor microenvironment have not been fully examined.
In the current study, using clinical samples, ovarian cancer cell lines and a mouse model of ovarian cancer, we investigated the role of MDSC in the induction of CSC and PD-L1 expression in ovarian cancer.
Materials and methods
Patients and clinical samples
Data acquisition, tumor/blood sample collection and analysis were approved by the institutional review board of Osaka University Hospital. A list of patients who were diagnosed with epithelial ovarian cancer and treated at Osaka University Hospital between April 2007 and March 2016 was generated from our institutional registry. Informed consent was received from all patients and their clinical data were retrospectively reviewed. Progression-free survival (PFS) was defined as the time from the date of treatment to the date of disease progression. Disease-specific survival (DSS) was defined as the time from the date of treatment to the date of cancer-related death. Platinum-sensitive disease was defined as no recurrence or disease progression for more than 6 months after the last platinum exposure. Platinum-resistant disease was defined as disease recurrence or progression within 6 months of the last platinum exposure.
Definition of tumor-related leukocytosis (TRL)
During the period between the initial presentation of the disease and the start day of initial treatment, all patients underwent at least one blood test. The lowest leukocyte count obtained during these tests was used in the current analyses. Pretreatment leukocytosis was defined as a leukocyte count of ≥ 10,000/μL.
Cell culture
The mouse ovarian cancer cell line OV2944-HM-1 (HM-1) was purchased from RIKEN BioResource Center and the human ovarian cancer cell line A2780 was purchased from the American Type Culture Collection. These cell lines were passaged in our laboratory soon after they were received from the cell bank, before being divided and stored in liquid nitrogen vessels. Cells were passaged for less than 3 months after resurrection. Cells were routinely screened for mycoplasma species (EZ-PCR Mycoplasma Test Kit; Biological Industries, #20-700-20). Each experiment was carried out using thawed cells without further authentication. The cells were maintained in DMEM supplemented with 10% FBS (SIGMA, #BCBV4600) and cultured in 5% carbon dioxide at 37 °C. MDSC were maintained in Roswell Park Memorial Institute (RPMI)-1640 (Nacalai Tesque) medium supplemented with 10% FBS.
Clone selection
The expression vector for the mouse G-CSF gene (pCAmG-CSF) and the empty vector (pCAZ 2) used in this study, which were described previously [22], were provided by the RIKEN BRC through the National Bio-Resource Project run by MEXT. The expression of these genes was driven by the CAG promoter, as reported previously [23, 24]. Transfection was performed using Lipofectamine 3000 (Invitrogen, #L3000015) according to the manufacturer’s instructions. Clonal selection was carried out by adding G418 to the medium at a final concentration of 500 mg/mL. HM-1 cell lines stably transfected with the G-CSF expression vector (HM-1-GCSF) or control vector (HM-1-Control) were established. A2780 cell lines stably transfected with the G-CSF expression vector (A2780-GCSF) or control vector (A2780-Control) were established. G418 was kept in the cultures following clone section.
Animal experiments
All procedures involving animals were approved by the animal care and usage committee of Osaka University in accordance with the relevant institutional and National Institutes of Health guidelines (Approved No: 30-099-001). To evaluate the role of MDSC in the ovarian cancer microenvironment, 5- to 7-week-old female B6C3F1 mice were subcutaneously inoculated with either 1 × 10⁶ HM-1-Control or HM-1-GCSF cells in 150 μL of phosphate-buffered saline (PBS) into the right flank, and 5- to 7-week-old BALB/c female nude mice were subcutaneously inoculated with either 1 × 10⁷ A2780-Control or A2780-GCSF cells in 150 μL of PBS into the right flank. This was based on our previous reports demonstrating that tumor-derived G-CSF increases the number of MDSC in mice and that a significant number of MDSC can be obtained from these mice for experimental use [20–22, 25, 26].
The first set of experiments was performed to investigate whether MDSC play a role in the induction of CSC in vivo. HM-1-Control-derived or HM-1-GCSF-derived tumor-bearing mice were injected intraperitoneally with anti-Ly6G-neutralizing antibody or isotype control at a dose of 200 μg/mouse every 2 days starting 1 day after inoculation. The second set of experiments examined the effects of PGE2 inhibition on the induction of CSC in vivo. HM-1-GCSF-derived tumor-bearing mice were treated intraperitoneally with 2.5 mg/kg of daily celecoxib for 3 weeks starting 1 day after inoculation. Celecoxib was dissolved in double-distilled water and polyethylene glycol 400 (v/v = 1:2) just before intraperitoneal infusion. At the end of the experiment, the mice were sacrificed by carbon dioxide asphyxiation, and their tumors were collected for analysis. White blood cells and granulocytes were counted using a VetScanHM2 automatic cell counter (Abaxis).
Isolation of MDSC
MDSC were isolated from single-cell preparations of mouse splenocytes using a Myeloid-Derived Suppressor Cell Isolation Kit and MS column (Miltenyi Biotec, #130-042-201) according to the manufacturer’s instructions. The purity of the isolated cell populations was determined by flow cytometry, and the frequency of CD11b+Ly6G+ cells was > 95%.
Reagents and antibodies
The following labeled monoclonal antibodies were used for the staining experiments: FITC-conjugated anti-human/mouse CD11b antibody (Tonbo Biosciences, #35-0112), APC-conjugated anti-mouse Ly6G antibody (Biolegend, #108411). A neutralizing antibody against mouse Ly6G/Ly6C (Gr-1) (RB6-8C5) was purchased from BioXCell (#BE0075). PGE2 and Rapamycin were obtained from Cayman Chemical (#363-24-6, #53123-88-9). PF-04418948 (a PGE2 receptor [EP2 receptor] antagonist) was obtained from Cayman Chemical (#1078166-57-0). ONO-AE3-208 (an EP4 receptor antagonist) was kindly provided by Ono Pharmaceutical. Celecoxib was purchased from Sigma-Aldrich (#58635). Antibodies against PD-L1 (Proteintech Group, #66248-1-Ig), p70 S6 Kinase (#2708), phospho-p70 S6 Kinase (Thr389) (#9205), AKT (#9272), phospho-AKT (Ser473) (#9271) and β-actin (#4967), and anti-rabbit and anti-mouse secondary antibodies (Cell Signaling Technology) were used for the Western blotting analysis. G-418 was purchased from Life Technology.
Reverse transcriptase PCR
RNA was extracted from MDSC using TRIzol (Life Technologies, #15596018). The resultant total RNA (1 μg) was used to synthesize cDNA with ReverTraAce qPCR RT Master Mix (Toyobo, #FSQ-201). PCR was performed using TaqMan PCR master mix (Qiagen, #201443) and specific primers. Details of PCR primer were shown in Supplementary Table 1. Amplification was performed using a Takara PCR personal-type thermal cycler (Takara).
Quantitative real-time reverse transcription polymerase chain reaction (qRT-PCR)
The qRT-PCR was performed using SYBR Green PCR Master Mix (Applied Biosystems) and TaqMan probes on a StepOnePlus sequence detection system (Applied Biosystems). The following TaqMan probes were used: mouse PD-L1 (Mm00452054_m1), mouse Gapdh (4352932E), human SOX2 (Hs01053049_s1), human NANOG (Hs4399610_g1), human OCT4 (Hs03005111_g1), and human GAPDH (Hs99999905_m1) (Applied Biosystems). Details of qRT-PCR primer were shown in Supplementary Table 1. The gene expression levels were normalized to the expression of the housekeeping gene GAPDH and were expressed as the fold change relative to the expression level in untreated cells. Quantification was performed using the ΔΔCt calculation method.
Flow cytometry
Single cell suspensions were prepared from mouse blood, spleen and tumors. Red blood cells were removed using ammonium chloride lysis buffer. Cells were filtered through 40-μm nylon strainers, incubated with antibodies and analyzed by flow cytometry. Flow cytometric data were acquired on a FACSCanto II flow cytometer and analyzed using FACSDiva software (BD Biosciences, San Jose, CA, USA). Cells that had been incubated with irrelevant isotype-matched antibodies and unstained cells served as controls.
Aldefluor assay
Aldefluor™ Kit (Stem Cell Technologies, #01700) was used to measure the percentage of tumor cells expressing high levels of aldehyde dehydrogenase (ALDH; ALDH-high cells) in accordance with the manufacturer’s instructions. Briefly, 1 × 10⁶ cells were incubated with the Aldefluor substrate for 45 min at 37 °C with or without the ALDH inhibitor diethylaminobenzaldehyde. After incubation, ALDH-high cells were detected in the FITC channel of the flow cytometer using FACS Diva software.
Sphere formation assay
The sphere formation assay was carried out as reported previously [20]. ALDH-high or -low cells were sorted by FACS Aria II and plated on ultra-low attachment surface 6-cm dishes with serum-free medium supplemented with basic fibroblast growth factor (10 ng/mL; ReproCELL, Inc), epithelial growth factor (20 ng/mL; R&D Systems) and B27 supplement. After 2 weeks, the number of spheres in each dish was counted using a phase-contrast microscope.
Colony formation assay
ALDH-high or -low cells were sorted by FACS Aria II. One-hundred cells were seeded per well on 6-cm dishes. After 2 weeks, colonies were fixed with methanol and stained with Giemsa staining solution as reported previously [27]. A colony was defined as consisting of at least 50 cells. The experiments were repeated at least three times, and representative results are shown.
Western blotting analysis
Cells were washed twice with ice-cold PBS and lysed in radioimmunoprecipitation assay lysis buffer. The protein concentrations of the cell lysates were measured using Bio-Rad protein assay reagent. Equal amounts of protein were applied to 10% polyacrylamide gels, and the electrophoresed proteins were transblotted onto nitrocellulose membranes. After the membranes were blocked, they were incubated with primary antibodies. The immunoblots were visualized with horseradish peroxidase-coupled immunoglobulin using an enhanced chemiluminescence Western blotting system (PerkinElmer).
Immunohistochemistry (IHC) and Immunofluorescence staining
Tumor samples were fixed in 10% neutral buffered formalin, embedded in paraffin, and sliced into 4 μm sections. Sections were de-paraffinized in xylene and rehydrated by an ethanol gradient. For antigen retrieval, sections were incubated at 95 °C for 20 min in Target Retrieval Solution pH 6.0 (Dako, #S2368). Endogenous peroxidase activity was blocked by Peroxidase-Blocking Solution (Dako, #S2023) for 5 min at room temperature. Sections were reacted with the following primary antibodies at 4 °C for overnight: anti-G-CSF polyclonal antibody (1:200) (Santa Cruz Biotechnology, #SC-1318), anti-human CD33 antibody (1:100) (Leica Biosystems, # NCL-L-CD33), anti-ALDH1A1 antibody (1:400) (Abcam, #ab52492), and anti-PGE2 antibody (1:1000) (Abcam, #ab2318). Sections were washed in TBS three times and then incubated in a secondary antibody, Histofine Simple Stain Max-PO (MULTI) (Nichirei Bioscience, #424144) for 30 min at room temperature. The signal was developed using 3,3′ -diaminobenzidine tetrahydrochloride (DAB) and slides were counterstained with haematoxylin. The slides were examined using a bright-field microscope. For Immunofluorescence staining, after the incubation with primary and secondary antibodies (Supplementary Table 2), sections were incubated with fluorophore-conjugated tyramide for 10 min at room temperature, followed by washing and staining with diamidino-phenyl-indole (DAPI). The samples were imaged using an FV1000-D Laser Scanning Confocal microscope (Olympus).
The immunoreactivities of ovarian cancer for G-CSF were classified as low or high: “low” indicates no or focal staining (less than 50% of the cells were stained) and “high” indicates clearly positive staining (more than 50% of the cells were stained) or intensely positive staining as described in detail elsewhere [25]. The number of tumor-infiltrating CD33+ cells was scored manually at higher magnification (× 40), as reported previously [19, 21]. The ALDH1 immunoreactivity in tumor cells was assessed using an immunoreactive score according to Remmele and Stegner (IRS) [20]. Optical image capture was performed using a PROVIS AX80 (Olympus).
Enzyme-linked immunosorbent assay (ELISA)
The concentration of PGE2 was measured using a Prostaglandin E2 Express ELISA Kit (Cayman Chemical, #500141). Absorbance values were measured using a microplate reader (iMark Microplate Reader; Bio-Rad Laboratories, Inc.).
Statistical analysis
Continuous data were compared between the groups using the Student’s t test, Welch’s t test or the Wilcoxon rank-sum test. Frequency counts and proportions were compared between groups using two-tailed Fisher’s exact test. We performed univariate analysis by comparing the Kaplan–Meier curves using the log-rank test. p values < 0.05 were considered significant. All analyses were performed using JMP software, version 14.0 (SAS Institute, Cary, NC, USA).
Results
Prognostic significance of systemic leukocytosis in patients with epithelial ovarian cancer
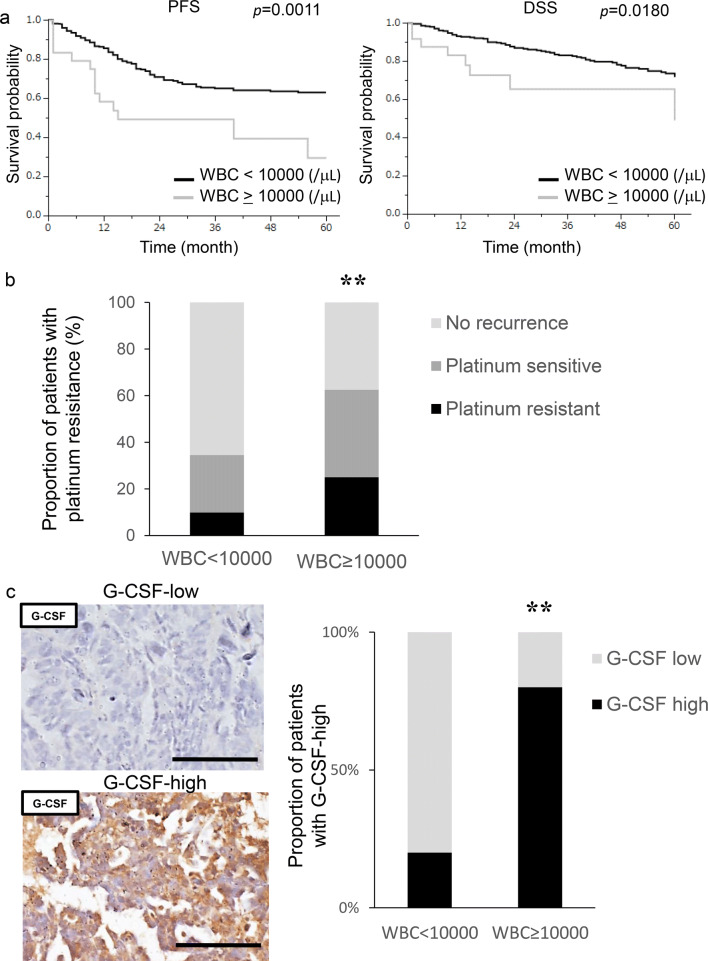
A total of 340 patients with surgically staged epithelial ovarian cancer were included in the current study. Their clinicopathological characteristics are shown in Supplementary Table 3. We first investigated the clinical significance of pretreatment leukocytosis. Of the 340 patients, 24 (7.1%) had leukocyte counts ≥ 10,000/μL prior to the start of initial treatment. As shown in Fig. 1a, patients with leukocytosis had a significantly shorter PFS (p = 0.0011) and DSS (p = 0.0180) than those without. Moreover, as shown in Fig. 1b, 62.5% (15 out of 24) of patients with leukocytosis and 34.5% (109 out of 316) of those without leukocytosis developed recurrent diseases after first-line treatment. In patients with leukocytosis, 33.3% had platinum resistant recurrence, which was greater than the 19.3% in those without leukocytosis. Collectively, these results suggest the aggressive nature of ovarian cancer exhibiting leukocytosis.
Fig. 1.
Prognostic significance of pretreatment leukocyte counts in patients with ovarian cancer. a Kaplan–Meier estimates of progression-free survival and disease-specific survival according to pretreatment leukocyte counts. The log-rank test was used to assess significance. (PFS, WBC < 10,000 vs WBC ≥ 10,000, p = 0.011; DSS, WBC < 10,000 vs WBC ≥ 10,000, p = 0.0180) b Recurrence rates and platinum resistance rates according to pretreatment leukocyte count. **p < 0.01, according to Fisher’s exact test (WBC < 10,000 vs WBC ≥ 10,000, p = 0.004). c G-CSF expression in ovarian cancer patients according to leukocyte counts. Photographs; representative G-CSF-stained primary tumor sections from ovarian cancer patients. Graph; proportion of patients with strong G-CSF immunoreactivity (G-CSF-high). Scale bars, 50 μm. **p < 0.01, according to Fisher’s exact test
Tumor-derived G-CSF as a cause of leukocytosis in epithelial ovarian cancer
To investigate the cause of leukocytosis in epithelial ovarian cancer, immunohistochemical staining was performed using tumor samples obtained from randomly selected patients. As shown, the tumors obtained from patients with leukocytosis exhibited significantly stronger G-CSF expression than those without leukocytosis (Fig. 1c).
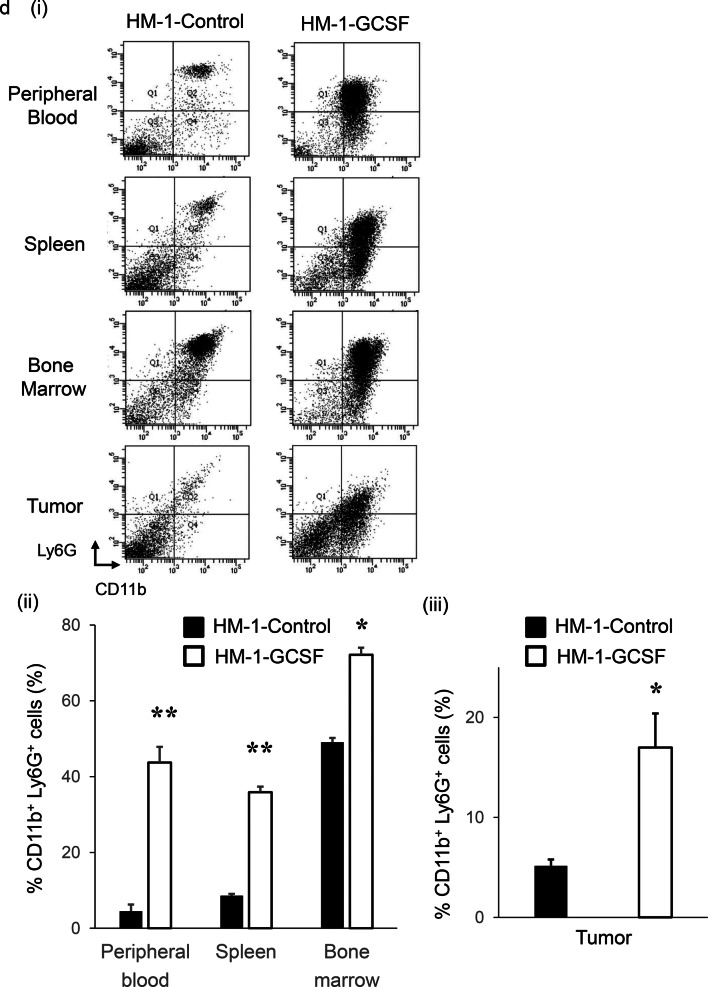
To investigate the potential effects of tumor-derived G-CSF on granulopoiesis, we established mouse experimental models in which mice were inoculated with ovarian cancer cells that had been stably transfected with G-CSF or control vector (Fig. 2a). The expression of G-CSF in these cells was confirmed in vivo (Fig. 2b). As expected, HM-1-GCSF-derived tumor-bearing mice had significantly higher leukocyte counts and neutrophil counts than HM-1-Control-derived tumor-bearing mice (Fig. 2c). Collectively, these results strongly suggested the involvement of a G-CSF-mediated pathway in the development of leukocytosis in epithelial ovarian cancer.
Fig. 2.
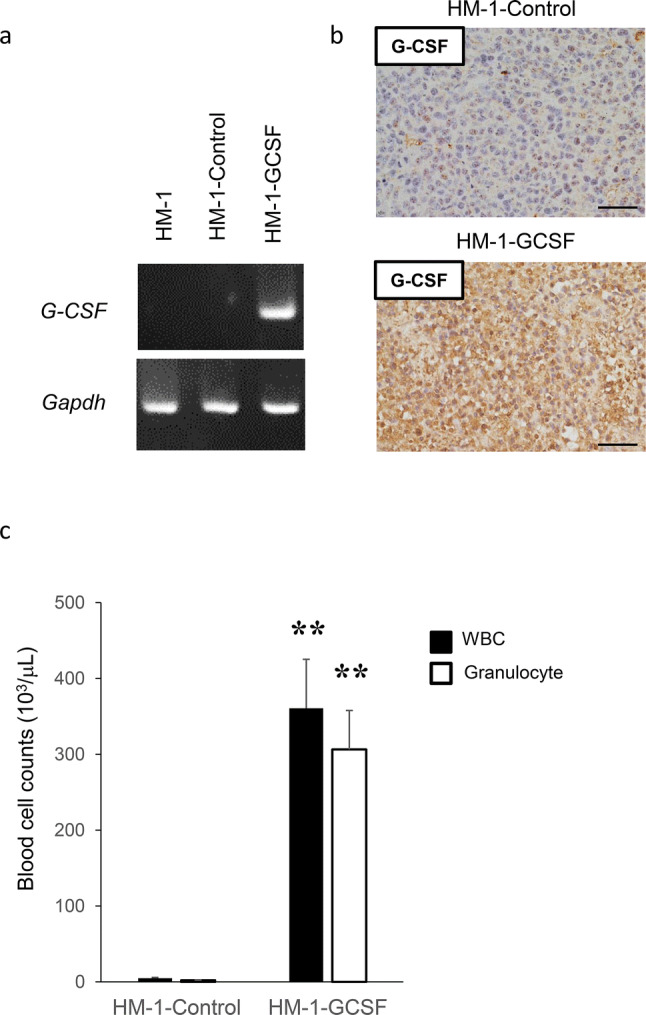
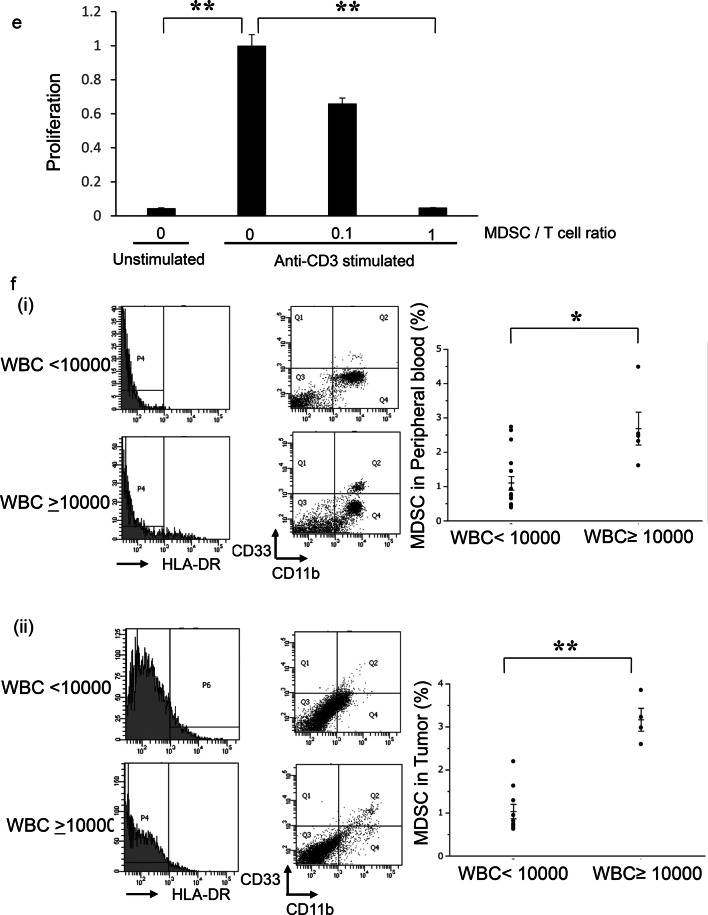
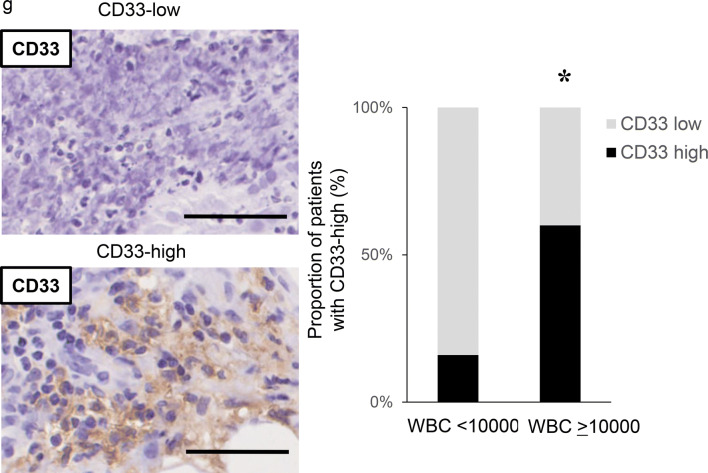
The role of tumor-derived G-CSF in the induction of MDSC in ovarian cancer. a Establishment of G-CSF-producing ovarian cancer cell lines assessed by RT-PCR. b–d Effects of tumor-derived G-CSF on the induction of MDSC in mice models of ovarian cancer. Mice were subcutaneously inoculated with HM-1-Control or HM-1-GCSF cells. Three weeks after inoculation, the spleen, bone marrow, blood and tumors were collected for analyses (five mice per group). b G-CSF expression in HM-1-Control cell- or HM-1-GCSF cell-derived tumors. Scale bar, 50 μm. c WBC/granulocyte counts of HM-1-Control-derived tumor-bearing mice and HM-1-GCSF-derived tumor-bearing mice. Bars, mean SD. **p < 0.01, according to Welch’s t test. d MDSC in the peripheral blood, spleen, bone marrow and tumor of HM-1-Control cell- or HM-1-GCSF cell-inoculated mice. CD11b+Ly6G+ cell populations detected in the peripheral blood, spleen, bone marrow and tumor by flow cytometry. (i) Representative dot plots. (ii) and (iii) Graphs depicting the proportion of CD11b+Ly6G+ cells. Bars, mean SD. *p < 0.05, **p < 0.01, according to Welch’s t test. e Ability of CD11b+Ly6G+ cells to suppress CD8+ T cell assessed by T cell proliferation assay. CD11b+ Ly6G+ cells (MDSC) were isolated from spleens of HM-1-GCSF-derived tumor-bearing mice. CD8+ T cells (2 × 10⁵ cells/well) were isolated from spleens of no-tumor-bearing mice and co-cultured with MDSC at the indicated ratios. Cells were incubated for 72 h, after which BrdU was added for an additional 24 h. T cell proliferation was assessed by BrdU incorporation. Bars, SD. **p < 0.01, according to two-sided Student’s t test. f MDSC in peripheral blood and tumor of ovarian cancer patients according to leukocyte counts. (i) Circulating MDSC numbers in the ovarian cancer patients. Peripheral blood samples were obtained from ovarian cancer patients with and without leukocytosis (leukocytosis, n = 5; non-leukocytosis, n = 16). Human MDSC, defined as CD11b+ CD33+ HLA-DR− cells, were counted using flow cytometry. Bars, SD. *p < 0.05, according to Welch’s t test. (ii) Tumor-infiltrating MDSC in the ovarian cancer patients. Primary tumor samples were obtained from ovarian cancer patients with and without leukocytosis (leukocytosis, n = 4; non-leukocytosis, n = 10). Tumor-infiltrating MDSC were counted using flow cytometry. Bars, SD. **p < 0.01, according to Welch’s t test. g CD33 expression in ovarian cancer patients according to leukocyte counts. Photographs; representative CD33-stained primary tumor sections from ovarian cancer patients. Graph; proportion of patients with strong CD33 immunoreactivity (CD33-high). Scale bars, 50 μm. *p < 0.05, according to Fisher’s exact test
The role of tumor-derived G-CSF in the induction of MDSC in tumor-related leukocytosis-positive epithelial ovarian cancer
We next investigated the mechanism responsible for the aggressive and chemo-resistant nature of epithelial ovarian cancer exhibiting leukocytosis. We previously reported that tumor-derived G-CSF induces MDSC and stimulates the progression of uterine cervical cancer [25]. Consistent with this, HM-1-GCSF-derived tumor-bearing mice had markedly higher numbers of CD11b+ Ly6G+ cells in their blood, spleens, bone marrow and tumors than HM-1-Control-derived tumor-bearing mice (Fig. 2d). Experiments in which A2780 cells were employed yielded the same results (Supplementary Fig. 1a–d). Of note, MDSC isolated from the spleen of these tumor-bearing mice significantly inhibited CD8+ T cell proliferation (Fig. 2e), consistent with their immunosuppressive nature. Consistent with the findings obtained in mice, the peripheral blood of the ovarian cancer patients with leukocytosis had significantly higher numbers of MDSC, i.e., CD11b+ CD33+ HLA-DR− cells, than of those without leukocytosis (Fig. 2f). Moreover, epithelial ovarian cancer patients with leukocytosis had significantly more tumor-infiltrating CD33+ cells than those without leukocytosis (Fig. 2g).
Role of MDSC-derived PGE2 in the induction of ovarian CSCs in vitro
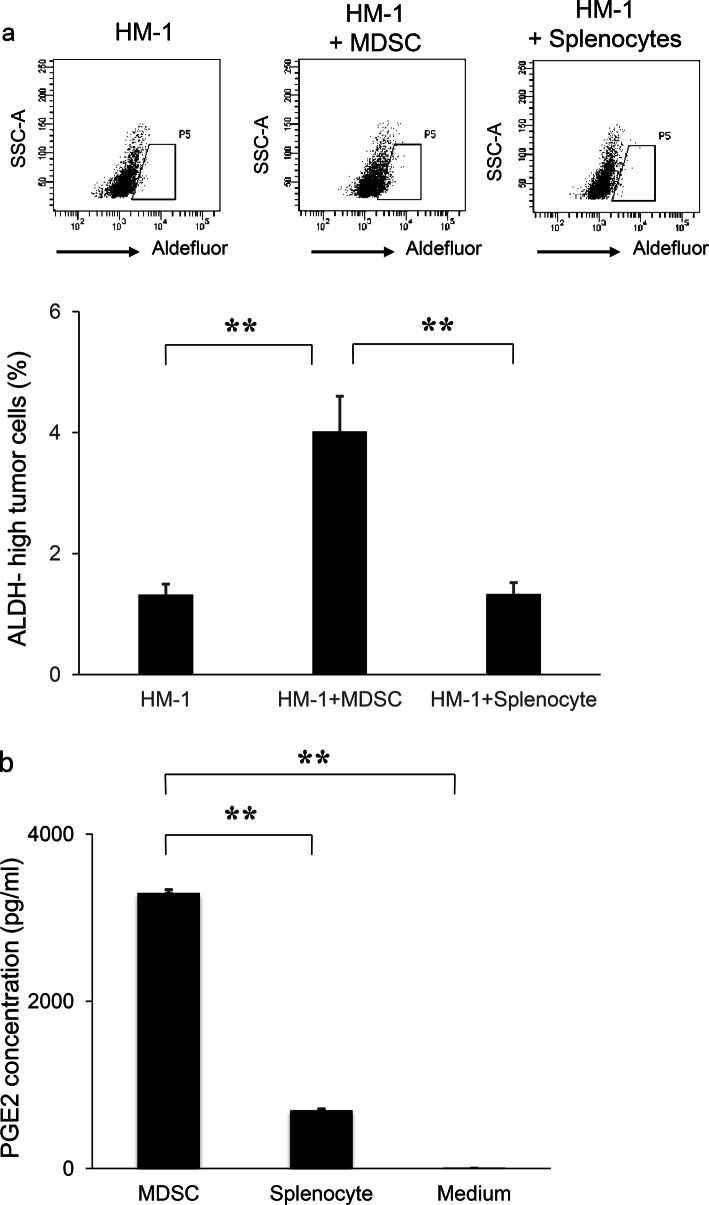
We next investigated the mechanism by which ovarian cancer exhibiting leukocytosis shows chemo-resistance, with a focus on CSC. We employed ALDH1 as a CSC marker and confirmed CSC-like properties of ALDH-high ovarian cancer cells in vitro (Supplementary Fig. 2a–d). We then investigated the role of MDSC in the enhancement of ALDH activity in ovarian cancer cells in vitro. Using MDSC that has been extracted from the spleens of HM-1-GCSF-derived tumor-bearing mice, we conducted co-culture experiments. When HM-1 cells were co-cultured with MDSC, the frequency of ALDH-high HM-1 cells was significantly increased (Fig. 3a).
Fig. 3.
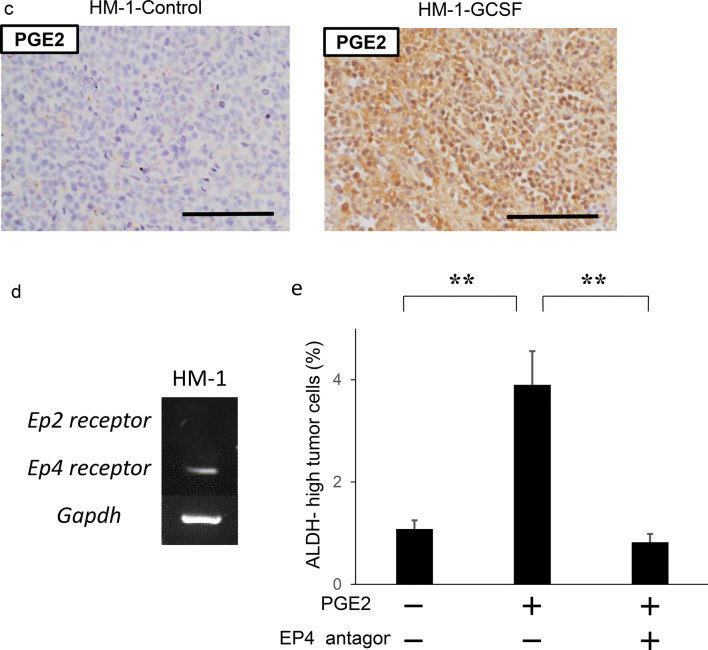
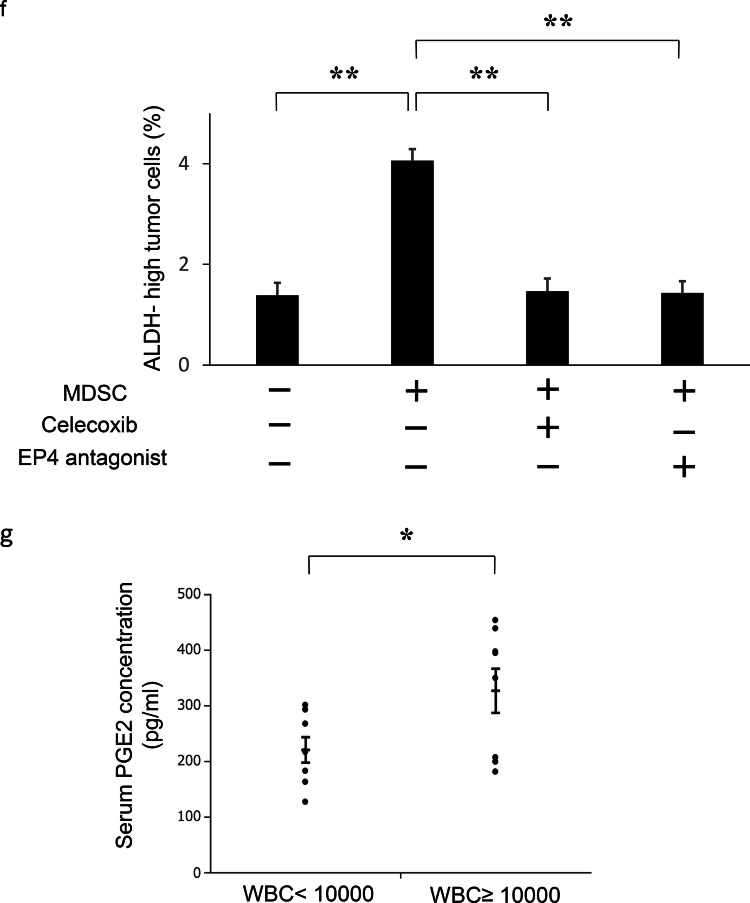
The mechanism responsible for the increased stemness by MDSC. a Effects of MDSC on the induction of CSC in vitro. HM-1 cells (3 × 10⁵ cells /well) were cultured with MDSC or splenocytes (excluding MDSC) (3 × 10⁴ cells /well) in the presence of 0.1% FBS for 18 h in 6-well dishes. The mouse EpCAM+ CD45− cells were gated using flow cytometry and then the percentages of ALDH-high cells were assessed using the Aldefluor assay (n = 5). Bars, SD. **p < 0.01, according to two-sided Student’s t test. b Production of PGE2 by MDSC. MDSC that had been isolated from spleens of mice bearing HM-1-GCSF-derived tumors were cultured in serum-free medium. Splenocytes (excluding MDSC) were also used for comparison. The PGE2 concentrations in the culture media were measured by the Prostaglandin E2 Express ELISA Kit (n = 3). Bars, SD. **p < 0.01, according to two-sided Student’s t test. c PGE2 expression in HM-1-Control cell- or HM-1-GCSF cell-derived tumors. Scale bar, 50 μm. d Expression levels of EP2 and EP4 receptors in HM-1 cells. Ep2 and Ep4 receptors and Gapdh mRNA levels in HM-1 cells assessed by RT-PCR. e Effects of PGE2 on the induction of CSC in vitro. HM-1 cells were treated with PGE2 (50 ng/mL) with or without EP4 antagonist (200 nM) in the presence of 0.1% FBS for 18 h. The frequencies of ALDH-high HM-1 cells were assessed using an Aldefluor assay (n = 5) Bars, SD. **p < 0.01, according to two-sided Student’s t test. f Effect of PGE2-inhibition on the MDSC-mediated CSC induction. HM-1 cells (3 × 10⁵ cells /well) and MDSC (3 × 10⁴ cells /well) were co-cultured in 6-well dishes and treated either with celecoxib (20 μm) or EP4 antagonist (200 nM) in the presence of 0.1% FBS for 18 h in vitro. The mouse EpCAM+ CD45− cells were gated using flow cytometry and then the percentages of ALDH-high cells were assessed using the Aldefluor assay (n = 5). Bars, SD. **p < 0.01, according to two-sided Student’s t test. g Serum PGE2 concentrations in ovarian cancer patients with or without leukocytosis were measured using the Prostaglandin E2 Express ELISA Kit. *p < 0.05, according to Welch’s t test
Prostaglandin E2 (PGE2) has recently been reported not only to develop inflammation but also to enhance the stemness of cervical, colorectal or bladder cancer cells [20, 28, 29]. Therefore, we first assessed whether MDSC express PGE2 in vitro. As shown in Fig. 3b, MDSC extracted from the spleens of HM-1-GCSF-derived tumor-bearing mice expressed PGE2, which was in clear contrast to splenocytes (excluding MDSC) extracted from the same mice. We then confirmed higher PGE2 expression in HM-1-GCSF-derived tumors than in HM-1-Control-derived tumors in vivo (Fig. 3c). Experiments using A2780 cells yielded the same results (Supplementary Fig. 3a, b). We next investigated the role played by MDSC-derived PGE2 in the enhancement of the stemness of ovarian cancer cells. As shown in Fig. 3d and Supplementary Fig. 3c, HM-1 cells expressed EP4 receptor, and A2780 cells expressed EP2 and EP4 receptors. When HM-1 cells and A2780 cells were treated with PGE2, the numbers of ALDH-high HM-1 and A2780 cells were significantly increased (Fig. 3e; Supplementary Fig. 3d). Moreover, PGE2-mediated induction of ALDH-high cells was significantly inhibited by the treatment with an EP antagonist (Fig. 3e; Supplementary Fig. 3d). To further investigate the role of MDSC and PGE2 in inducing CSC, co-culture experiments were conducted. As shown (Fig. 3f; Supplementary Fig. 3e), when ovarian cancer cells (HM-1 or A2780) were co-cultured with MDSC, the numbers of ALDH-high cells were significantly increased. Importantly, MDSC-mediated induction of ALDH-high cells was significantly inhibited by the treatment with celecoxib or EP antagonist. Consistent with the findings from in vitro investigations, when the serum PGE2 concentration of ovarian cancer patients were examined, the PGE2 level was significantly higher in patients with leukocytosis than in those without (Fig. 3g).
In vivo effects of MDSC-derived PGE2 in the induction of ovarian cancer stem cells
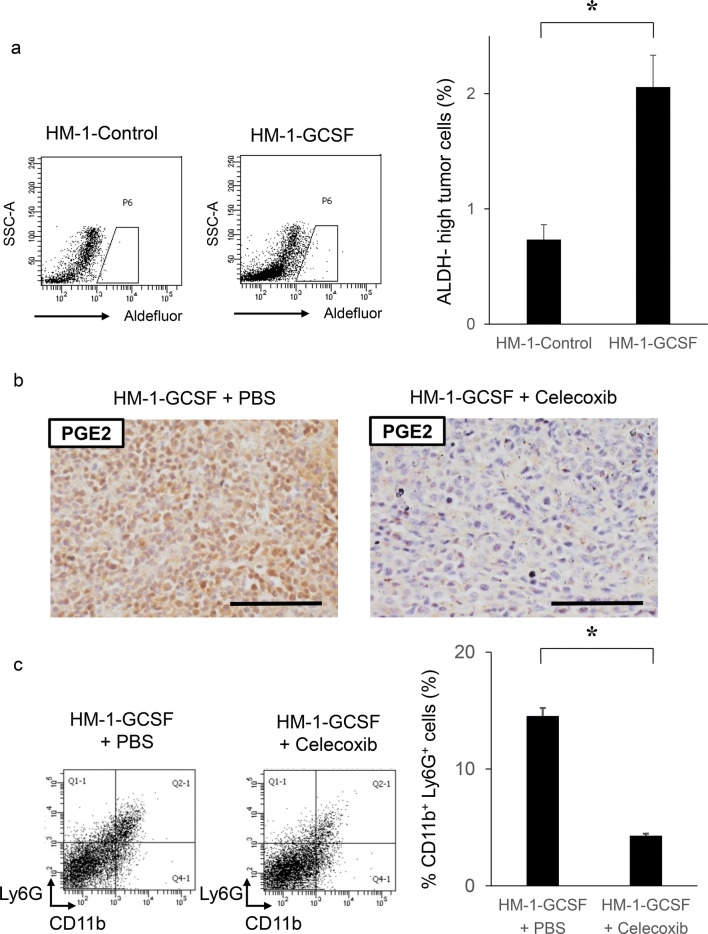
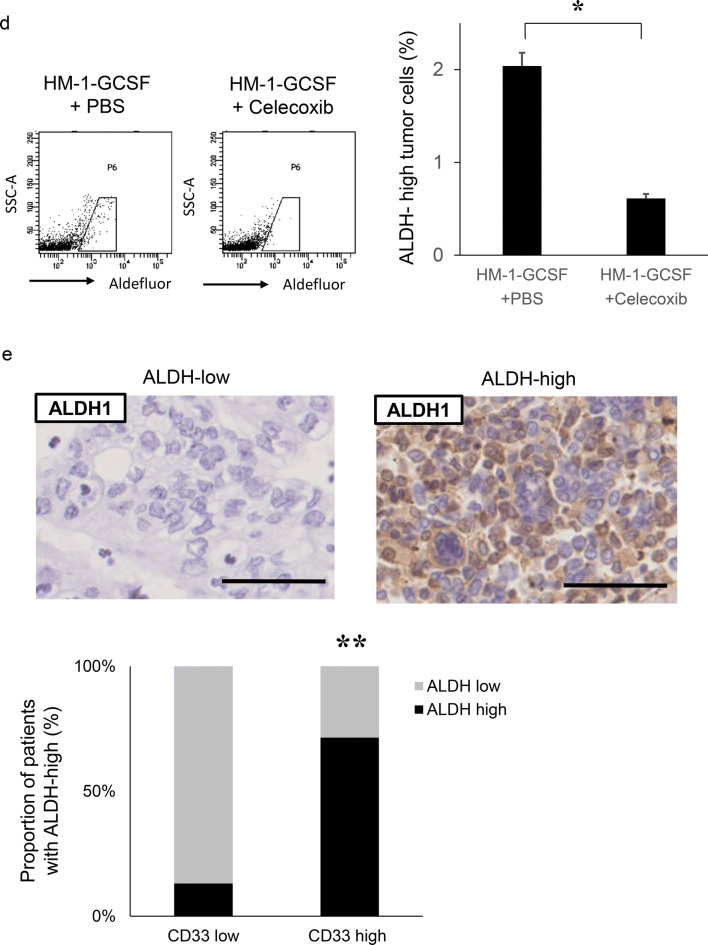
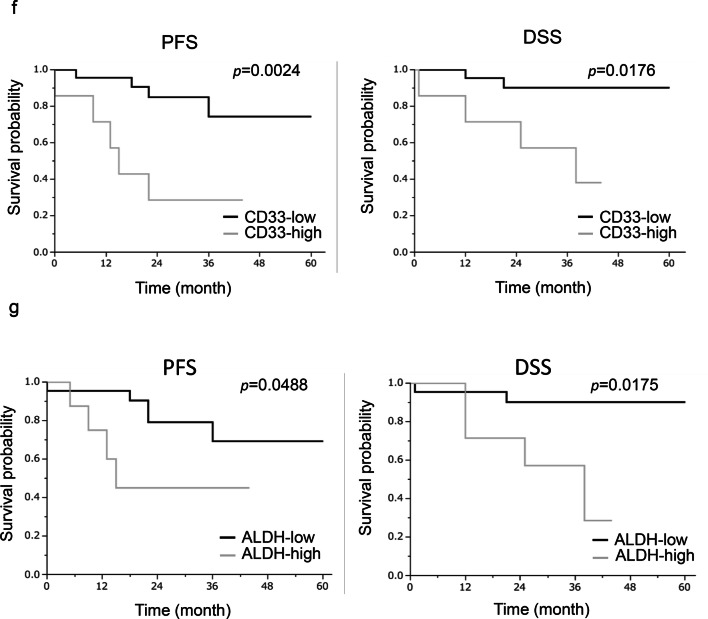
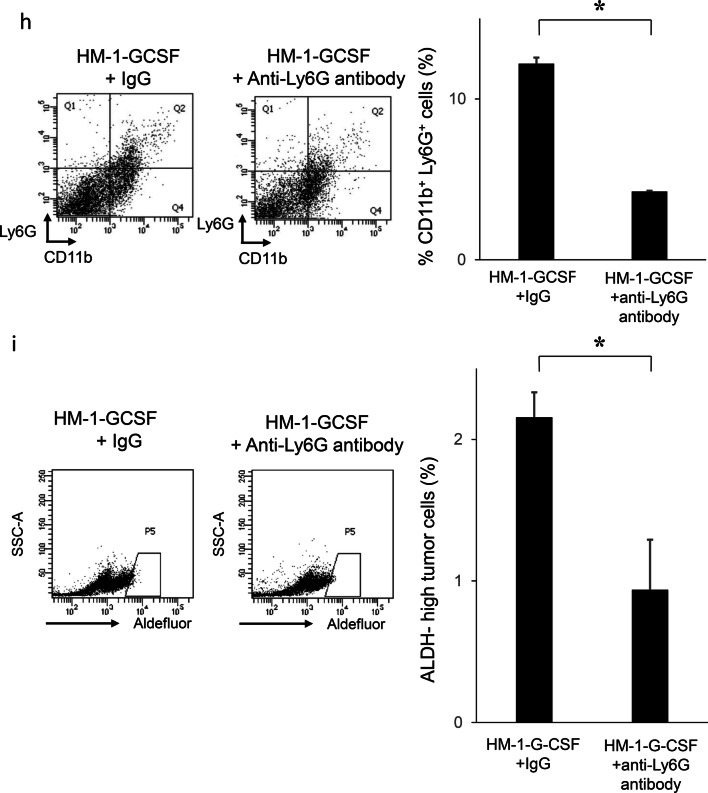
We next investigated whether MDSC increased the stemness of ovarian cancer cells in vivo. As shown in Fig. 4a, ALDH-high ovarian cancer cells were more frequently observed in HM-1-GCSF-derived tumors than in HM-1-Control-derived tumors. A previous study has demonstrated that prostaglandin E2 (PGE2) induces the differentiation of MDSC from bone marrow and stimulate cancer progression [30]. Moreover, celecoxib reduced serum PGE2 level and the number of MDSC in murine models of ovarian cancer [31]. Consistent with these, as shown (Fig. 4b–d), treatment mice with celecoxib significantly reduced the number of MDSC and ALDH-high cells in tumors. Experiments using A2780 cells yielded the same results (Supplementary Fig. 4a–d). We then examined the association between MDSC and ALDH-high tumor cells in epithelial ovarian cancer specimens obtained from the primary debulking surgery. As shown in Fig. 4e, tumors that exhibited higher numbers of tumor-infiltrating CD33+ cells demonstrated significantly greater immunoreactivity for ALDH1. Moreover, patients with epithelial ovarian cancer who exhibited strong immunoreactivity for CD33 and ALDH1 had a significantly shorter PFS and DSS than those who exhibited weak immunoreactivity for CD33 or ALDH1 (Fig. 4f, g).
Fig. 4.
The correlation between tumor-derived G-CSF, MDSC and ALDH activity in vivo. a Induction of CSC by tumor-derived G-CSF. Mice were inoculated with HM-1-GCSF cells or HM-1-Control cells (five mice per group). Three weeks after inoculation, subcutaneous tumors were collected and assessed. The mouse EpCAM+ CD45− cells in the tumors were gated using flow cytometry and then the percentages of ALDH-high cells were assessed using the Aldefluor assay. Bars, SD. *p < 0.01, using two-sided Student’s t test. b–d In vivo effects of PGE2-inhibition on the induction of MDSC and CSC. Mice were inoculated with HM-1-GCSF cells. Mice bearing HM-1-GCSF-derived tumors were randomly assigned into treatment groups: 5 mg/kg of daily celecoxib or PBS starting 1 day after inoculation (five mice per group). Three weeks after inoculation, their subcutaneous tumors were collected for evaluation. b PGE2 expression in HM-1-GCSF cell-derived tumors treated with celecoxib or PBS. Scale bar, 50 μm. c Effects of celecoxib on the induction of MDSC in tumors. CD11b+Ly6G+ cell populations were detected in tumors by flow cytometry. Bars, SD. *p < 0.05, according to two-sided Student’s t test. d Effects of PGE2-inhibition using celecoxib on the induction of CSC in tumors. ALDH-high cells assessed using an Aldefluor assay. Bars, SD. *p < 0.05, according to two-sided Student’s t test. e ALDH1 expression in ovarian cancer patients according to CD33 expression. Photographs; representative ALDH1-stained primary tumor sections from ovarian cancer patients. Graph; proportion of patients with strong ALDH-1 immunoreactivity (ALDH-high). Scale bars, 50 μm. **p < 0.01, according to Fisher’s exact test. f Kaplan–Meier estimates of progression-free survival (PFS) and disease-specific survival (DSS) of patients with ovarian cancer according to CD33 immunoreactivity. The log-rank test was used to assess significance (PFS, CD33-low vs CD33-high, p = 0.0024; DSS, CD33-low vs CD33-high, p = 0.0176). g Kaplan–Meier estimates of PFS and DSS of patients with ovarian cancer according to ALDH1 immunoreactivity (PFS, ALDH-low vs ALDH-high, p = 0.0488; DSS, ALDH-low vs ALDH-high, p = 0.0175). The log-rank test was used to assess significance. h, i Effects of an anti-Ly6G neutralizing antibody on MDSC recruitment and CSC induction in HM-1-GCSF-derived tumors. Mice bearing HM-1-GCSF-derived tumors were randomly assigned to treatment groups: anti-Ly6G neutralizing antibody (200 μg/mouse) or isotype control every 2 days starting 1 day after inoculation (five mice per group). Three weeks after inoculation, their subcutaneous tumors were collected for evaluation. h CD11b+ Ly6G+ cell populations in tumor cells assessed using flow cytometry. *p < 0.05, according to two-sided Student’s t test. i ALDH-high cells assessed using an Aldefluor assay. Bars, SD. *p < 0.05, according to two-sided Student’s t test
Furthermore, we investigated the effects of MDSC depletion using an anti-Ly6G antibody in a mouse model of ovarian cancer. When HM-1-GCSF-derived tumor-bearing mice were treated with an anti-Ly6G neutralizing antibody, G-CSF-mediated increases in MDSC and ALDH-high ovarian cancer cells were significantly inhibited (Fig. 4h, i). Experiments using A2780 cells yielded the same results (Supplementary Fig. 4e, f). It has been previously demonstrated that anti-Ly6G antibody reduce the PGE2 levels in a mouse model of endometrial cancer [21]. Thus, the results provided in Figs. 3, 4 demonstrated that G-CSF-induced MDSC and MDSC-derived PGE2 induced ovarian cancer stem cells.
The expression of PD-L1 in CSC is higher than that in non-CSC
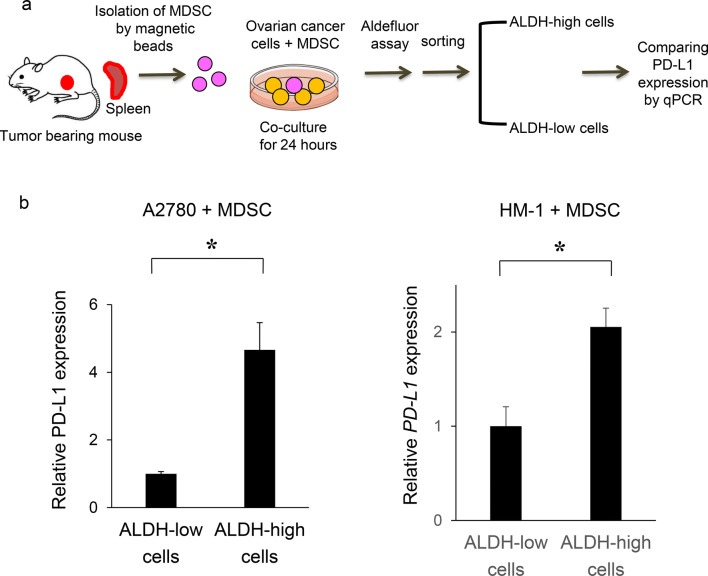
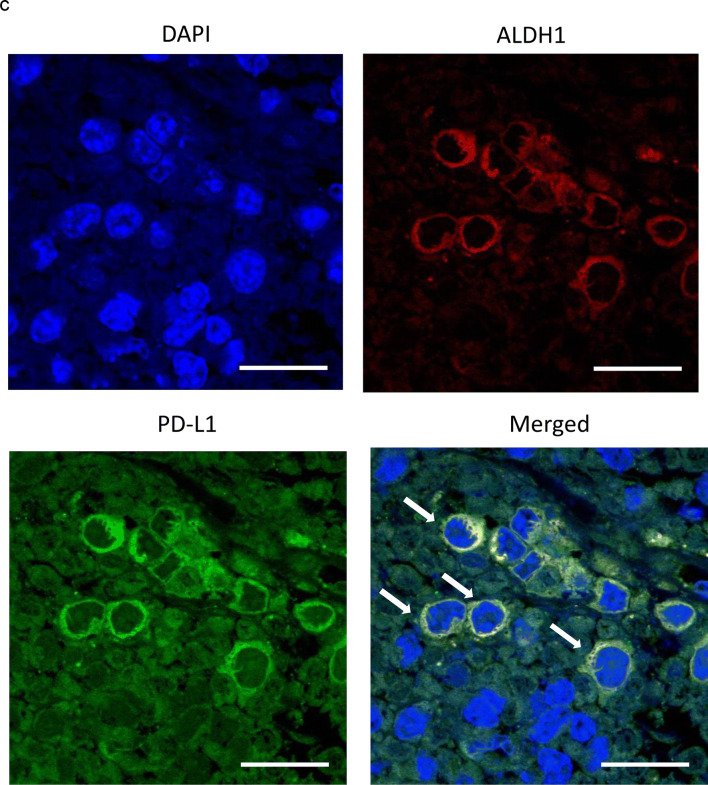
It was recently reported that the expression of PD-L1 is higher in CSC [15, 16], suggesting that CSC have ability to escape from immune surveillance, leading to recurrence or metastasis after existing anti-cancer therapies. Therefore, we compared the expression of PD-L1 in CSC with that in non-CSC. As shown in Fig. 5a and b, higher expression of PD-L1 was observed in ALDH-high cells compared with in ALDH-low cells.
Fig. 5.
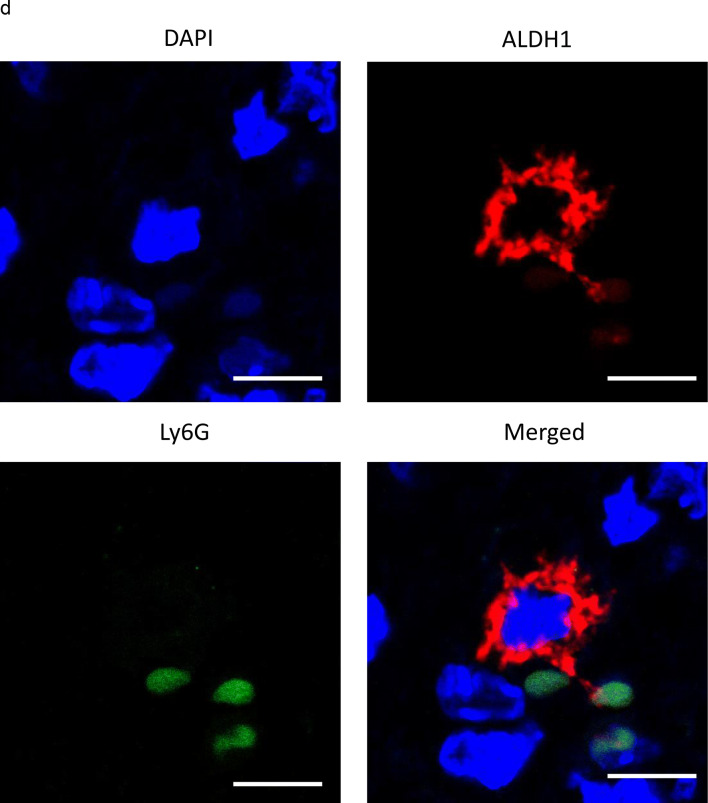
PD-L1 expression in CSC increases in the presence of MDSC in vitro and in vivo. a, b In vitro PD-L1 expression in ovarian cancer cells according to ALDH activity. Ovarian cancer cells were co-cultured with MDSC that had been isolated from spleens of mice bearing HM-1-GCSF-derived tumors. The EpCAM+ CD45− cells were gated using flow cytometry and ALDH-high cells were then detected using an Aldefluor assay. After ALDH-high cells and ALDH-low cells were separately sorted by flow cytometry, the PD-L1 expression was compared by qRT-PCR. a Experimental schema. b PD-L1 expression assessed by qRT-PCR (n = 5). Bars, SD. *p < 0.05, according to two-sided Student’s t test. c The expression of ALDH1 and PD-L1 in ovarian cancer (mice model). The expression of ALDH1 (red) and PD-L1 (green) in HM-1-GCSF-derived tumors was assessed by immunofluorescence staining. The nuclei were stained with DAPI (blue). Images show typical co-expression of ALDH1 and PD-L1 (indicated with arrows). Bar, 20 μm. d The interactions between CSC and MDSC in the ovarian tumor microenvironment in mice. The expression of ALDH1 (red) and Ly6G (green) in HM-1-GCSF-derived tumors was assessed by immunofluorescence staining. The nuclei were stained with DAPI (blue). ALDH-high cells were located close to the Ly6G-positive cells in HM-1-GCSF-derived tumors. Bar, 20 μm
To confirm these results in vivo, immunofluorescence staining for ALDH and PD-L1 in mouse ovarian tumors was performed using immunocompetent mouse models. As shown in Fig. 5c, co-expression of ALDH and PD-L1 in tumor cells of HM-1-GCSF-derived tumor-bearing mice was observed. Moreover, to investigate the interactions between CSC and MDSC in the tumor microenvironment, immunofluorescence staining for ALDH and Ly6G was performed. As shown in Fig. 5d, ALDH-high cells were located close to the Ly6G-positive cells in the ovarian tumor. This suggested that ALDH-high cells have significant immunoreactivity for PD-L1, which may be mediated by tumor-infiltrated MDSC.
PGE2 produced by MDSC increased tumor PD-L1 expression via the mammalian target of rapamycin (mTOR) pathway in ovarian cancer cells
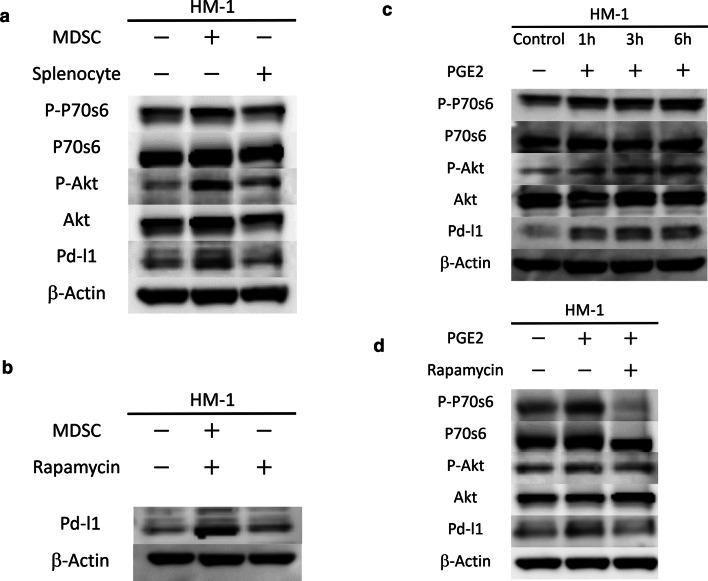
To directly demonstrate that MDSC induce PD-L1 expression in ovarian cancer cells, we performed a co-culture experiment. When HM-1 cells were co-cultured with MDSC extracted from the spleens of HM-1-GCSF-derived tumor-bearing mice, the PD-L1 expression of HM-1 cells was significantly increased (Fig. 6a). It was previously reported that the induction of PD-L1 expression is regulated by the PI3K-AKT-mTOR pathway [32, 33]. As PGE2 is known to activate the PI3K-AKT-mTOR pathway during cancer cell growth and invasion [34, 35], we examined the involvement of PGE2-mediated PI3K-AKT-mTOR pathway activation in the expression of PD-L1 expression. As shown in Fig. 6a, when HM-1 cells were co-cultured with MDSC or treated with PGE2, PI3K-AKT-mTOR pathway was significantly activated. Treatment HM-1 cells with rapamycin significantly inhibited this MDSC-mediated increase in PD-L1 expression (Fig. 6b). Moreover, HM-1 cells treated with PGE2 increased their PD-L1 expression in a time-dependent manner (Fig. 6c). Furthermore, co-treatment with rapamycin inhibited this PGE2-mediated increase (Fig. 6d). Experiments using A2780 cells yielded the same results (Supplementary Fig. 5a–d). Collectively, these results demonstrated that PGE2 produced by MDSC increase tumor PD-L1 expression via the PI3K-AKT-mTOR pathway in ovarian cancer cells.
Fig. 6.
PGE2 produced by MDSC increased tumor PD-L1 expression via the mammalian target of rapamycin (mTOR) pathway in ovarian cancer cells. a The role of mTOR signaling in MDSC-mediated PD-L1 expression. HM-1 cells were seeded in the bottom chamber and MDSC were seeded in the top chamber of a 6-well plate (5:1 ratio of HM-1: MDSC) in the presence of 0.1% FBS for 6 h. Then, total protein of the bottom chamber was extracted, and the expression of p70S6 kinase, p-p70S6 kinase, Akt, p-Akt and PD-L1 was examined by Western blotting. Splenocytes (excluding MDSC) were also used for comparison. b The effects of mTOR inhibition using rapamycin on MDSC-mediated increase in PD-L1 expression. HM-1 cells were seeded in the bottom chamber and MDSC were seeded in the top chamber of a 6-well plate (5:1 ratio of HM-1: MDSC) with or without 50 nM rapamycin in the presence of 0.1% FBS for 6 h. Then, total protein of the bottom chamber was extracted, and the expression of PD-L1 was examined by Western blotting. c The role of PGE2 in the mTOR-dependent PD-L1 expression in HM-1 cells. HM-1 cells were treated with 0.25 μm PGE2 in the presence of 0.1% FBS in a time-dependent manner. Total protein was extracted, and the expression of p70S6 kinase, p-p70S6 kinase, Akt, p-Akt and PD-L1 was examined by Western blotting. d The effects of mTOR inhibition using rapamycin on the PGE2-mediated increase in PD-L1 expression. HM-1 cells were treated with 0.25 μm PGE2 with or without 50 nM rapamycin in the presence of 0.1% FBS for 6 h. Total protein of the bottom chamber was extracted, and the expression of p70S6 kinase, p-p70S6 kinase, Akt, p-Akt and PD-L1 was examined by Western blotting
Discussion
Our clinical investigation including 340 ovarian cancer patients demonstrated that pretreatment leukocytosis is an indicator of a poor prognosis. Thus far, two previous studies have investigated the prognostic significance of leukocytosis in ovarian cancer patients: both studies demonstrated leukocytosis to indicate a poor prognosis in ovarian cancer [4, 5]. However, the mechanism responsible for the development of TRL or for its poor prognosis in ovarian cancer is not fully understood.
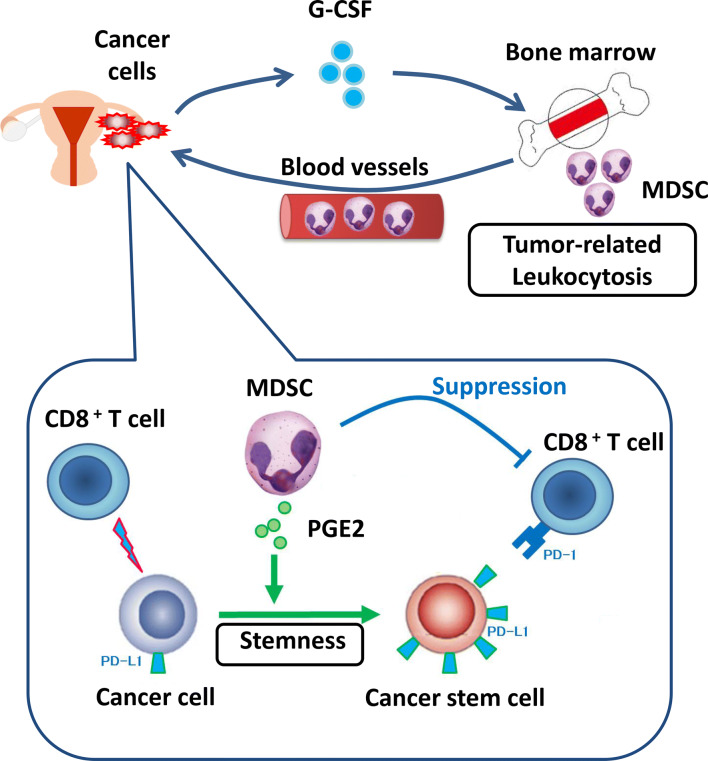
Our mechanistic investigations using in vitro and in vivo experimental models demonstrated that tumor-derived G-CSF is responsible for the development of leukocytosis. Moreover, we clarified that G-CSF-induced MDSC are involved in the progression of TRL-positive ovarian cancer; MDSC inhibit CD8+ T cells and increase the stemness of ovarian cancer cells, in addition to increasing tumor PD-L1 expression via the PI3K-AKT-mTOR pathway through the production of PGE2 (Fig. 7).
Fig. 7.
Proposed mechanism in TRL-positive ovarian cancer. Tumor-derived G-CSF is responsible for the development of leukocytosis. G-CSF-induced MDSC are involved in the progression of TRL-positive ovarian cancer. MDSC inhibit CD8+ T cells and increase the stemness of ovarian cancer cells, in addition to increasing tumor PD-L1 expression
The current study may aid in future research. It was recently reported that higher MDSC numbers are associated with a poorer clinical outcome following treatment with checkpoint inhibitors [36, 37], the reason and solution for which remain unknown. However, the increased PD-L1 expression induced by MDSC-derived PGE2 demonstrated in the current study may be a possible explanation. The combination of PD-L1-targeting checkpoint inhibitors along with MDSC-inhibition therapy may, therefore, represent a novel approach to cancer immunotherapy [38]. Although our mechanistic investigations focused on the “tumor-derived G-CSF” and G-CSF-induced MDSC”, other tumor-derived factors may also play roles in the development of TRL. In addition, we cannot exclude the possibility that other stromal cells in the tumor microenvironment are stimulated by tumor-derived G-CSF. Moreover, although the current study focused on the “MDSC-PGE2-CSC axis”, MDSC are known to produce many mediators, including cytokines, chemokines and growth factors. Thus, we cannot exclude the possibility that other MDSC-derived factors also function in the induction of CSC. Accordingly, the mechanism of CSC-induction in TRL-positive ovarian cancer should be investigated further.
Our study has several important clinical implications. First, by performing simple and low-cost peripheral blood examinations, it may be possible to identify patients who have a greater risk of recurrence, which will enable careful pretreatment work-up or post-treatment follow-up examinations. Second, our mechanistic investigations suggested that MDSC-targeting therapy may help to improve the prognosis of cancer patients who exhibit TRL. Currently, no specific inhibitors of human MDSC are available. However, considering the mechanisms involved in the activity of MDSC, PGE2-inhibition may be a therapeutic option in this patient population.
Several limitations of the current study need to be considered. Clinical investigations in our study were retrospective and conducted at a single institution. Therefore, we intend to confirm our clinical findings in a prospective multi-institutional settings. Another limitation is that we employed ALDH1 as a CSC marker, although it has not yet been clearly established in solid tumors. Furthermore, although we employed an anti-Ly6G neutralizing antibody to deplete MDSC, we cannot exclude the possibility that other cells such as neutrophils were affected by the anti-Ly6G neutralizing antibody. Moreover, although we employed CD33 for identify human MDSC based on the previous reports [10, 19], CD33-positive cells cannot always display MDSC. Accordingly, we need to clarify phenotypic characterization of human MDSC by immunohistochemistry in future studies.
In conclusion, we demonstrated that pretreatment leukocytosis is an indicator of a poor prognosis in ovarian cancer patients. We also revealed that tumor-derived G-CSF is responsible for the development of leukocytosis and stimulates the production of MDSC from bone marrow. Moreover, we found that tumor-infiltrating MDSC do not only inhibit CD8+ T cells and increase the stemness of ovarian cancer cells, but they also increase tumor PD-L1 expression via the PI3K-AKT-mTOR pathway through the production of PGE2, all of which may lead to the progression of TRL-positive ovarian cancer. We believe that our study provides scientific rationale for future clinical trials of MDSC-inhibition therapy in this patient population.
Electronic supplementary material
Below is the link to the electronic supplementary material.
Acknowledgements
The authors thank Hirofumi Hamada (Sapporo Medical University) for providing information regarding the G-CSF expression plasmids. We also thank Moe Matsui for her secretarial assistance and Ayako Okamura for her technical assistance.
Abbreviations
- ALDH-1
Aldehyde dehydrogenase 1
- CSC
Cancer stem-like cells
- mTOR
The mammalian target of rapamycin
- PD-L1
Programmed death ligand 1
- TRL
Tumor-related leukocytosis
Author contributions
NK designed and performed the experiments, collected, analyzed and interpreted data, and wrote the manuscript. SM designed the experiments, interpreted data, and wrote the manuscript. KS, EY, KK, and HK performed the experiments and acquired the clinical data. RT, TS, MK, and YM contributed to development of methodology. MK, KH, and KS provided conceptual advice and interpreted data. TK edited the manuscript.
Funding
This study was funded by Grants-in-aid for General Scientific Research from the Ministry of Education, Culture, Sports, Science, and Technology of Japan (Grant Numbers: T17K112760, A19K213480 and A19K186410).
Compliance with ethical standards
Conflict of interest
The authors declare that they have no conflict of interest.
Ethical approval
All procedures performed in studies involving human participants were in accordance with the ethical standards of the institutional research committee and with the 1964 Helsinki Declaration and its later amendments or comparable ethical standards (Osaka University Hospital, Approval Number: 10302).
Footnotes
Publisher's Note
Springer Nature remains neutral with regard to jurisdictional claims in published maps and institutional affiliations.
References
- 1.Bray F, Ferlay J, Soerjomataram I, et al. Global cancer statistics 2018: GLOBOCAN estimates of incidence and mortality worldwide for 36 cancers in 185 countries. CA Cancer J Clin. 2018;68:394–424. doi: 10.3322/caac.21492. [DOI] [PubMed] [Google Scholar]
- 2.Matulonis UA, Sood AK, Fallowfield L, Howitt BE, Sehouli J, Karlan BY. Ovarian cancer. Nat Rev Dis Primers. 2016;2:16061. doi: 10.1038/nrdp.2016.61. [DOI] [PMC free article] [PubMed] [Google Scholar]
- 3.Jayson GC, Kohn EC, Kitchener HC, Ledermann JA. Ovarian cancer. Lancet. 2014;384:1376–1388. doi: 10.1016/S0140-6736(13)62146-7. [DOI] [PubMed] [Google Scholar]
- 4.So KA, Hong JH, Jin HM, et al. The prognostic significance of preoperative leukocytosis in epithelial ovarian carcinoma: a retrospective cohort study. Gynecol Oncol. 2014;132:551–555. doi: 10.1016/j.ygyno.2014.01.010. [DOI] [PubMed] [Google Scholar]
- 5.Chen Y, Zhang L, Liu WX, Liu XY. Prognostic significance of preoperative anemia, leukocytosis and thrombocytosis in chinese women with epithelial ovarian cancer. Asian Pac J Cancer Prev. 2015;16:933–939. doi: 10.7314/APJCP.2015.16.3.933. [DOI] [PubMed] [Google Scholar]
- 6.Polyak K, Weinberg RA. Transitions between epithelial and mesenchymal states: acquisition of malignant and stem cell traits. Nat Rev Cancer. 2009;9:265–273. doi: 10.1038/nrc2620. [DOI] [PubMed] [Google Scholar]
- 7.Magee JA, Piskounova E, Morrison SJ. Cancer stem cells: impact, heterogeneity, and uncertainty. Cancer Cell. 2012;21:283–296. doi: 10.1016/j.ccr.2012.03.003. [DOI] [PMC free article] [PubMed] [Google Scholar]
- 8.Visvader JE, Lindeman GJ. Cancer stem cells in solid tumours: accumulating evidence and unresolved questions. Nat Rev Cancer. 2008;8:755–768. doi: 10.1038/nrc2499. [DOI] [PubMed] [Google Scholar]
- 9.Ayub TH, Keyver-Paik MD, Debald M, et al. Accumulation of ALDH1-positive cells after neoadjuvant chemotherapy predicts treatment resistance and prognosticates poor outcome in ovarian cancer. Oncotarget. 2015;6:16437–16448. doi: 10.18632/oncotarget.4103. [DOI] [PMC free article] [PubMed] [Google Scholar]
- 10.Cui TX, Kryczek I, Zhao L, et al. Myeloid-derived suppressor cells enhance stemness of cancer cells by inducing microRNA101 and suppressing the corepressor CtBP2. Immunity. 2013;39:611–621. doi: 10.1016/j.immuni.2013.08.025. [DOI] [PMC free article] [PubMed] [Google Scholar]
- 11.Zhang L, Conejo-Garcia JR, Katsaros D, et al. Intratumoral T cells, recurrence, and survival in epithelial ovarian cancer. N Engl J Med. 2003;348:203–213. doi: 10.1056/NEJMoa020177. [DOI] [PubMed] [Google Scholar]
- 12.Topalian SL, Hodi FS, Brahmer JR, et al. Safety, activity, and immune correlates of anti-PD-1 antibody in cancer. N Engl J Med. 2012;366:2443–2454. doi: 10.1056/NEJMoa1200690. [DOI] [PMC free article] [PubMed] [Google Scholar]
- 13.Brahmer JR, Tykodi SS, Chow LQ, et al. Safety and activity of anti-PD-L1 antibody in patients with advanced cancer. N Engl J Med. 2012;366:2455. doi: 10.1056/NEJMoa1200694. [DOI] [PMC free article] [PubMed] [Google Scholar]
- 14.Hamid O, Robert C, Daud A, et al. Safety and tumor responses with lambrolizumab (anti-PD-1) in melanoma. N Engl J Med. 2013;369:134–144. doi: 10.1056/NEJMoa1305133. [DOI] [PMC free article] [PubMed] [Google Scholar]
- 15.Lee Y, Shin JH, Longmire M, et al. CD44+ cells in head and neck squamous cell carcinoma suppress T-cell-mediated immunity by selective constitutive and inducible expression of PD-L1. Clin Cancer Res. 2016;22:3571–3581. doi: 10.1158/1078-0432.CCR-15-2665. [DOI] [PMC free article] [PubMed] [Google Scholar]
- 16.Wu Y, Chen M, Wu P, Chen C, Xu ZP, Gu W. Increased PD-L1 expression in breast and colon cancer stem cells. Clin Exp Pharmacol Physiol. 2017;44:602–604. doi: 10.1111/1440-1681.12732. [DOI] [PubMed] [Google Scholar]
- 17.Talmadge JE, Gabrilovich DI. History of myeloid-derived suppressor cells. Nat Rev Cancer. 2013;13:739–752. doi: 10.1038/nrc3581. [DOI] [PMC free article] [PubMed] [Google Scholar]
- 18.Mabuchi S, Yokoi E, Komura N, Kimura T. Myeloid-derived suppressor cells and their role in gynecological malignancies. Tumour Biol. 2018;40:1010428318776485. doi: 10.1177/1010428318776485. [DOI] [PubMed] [Google Scholar]
- 19.Peng D, Tanikawa T, Li W, et al. Myeloid-derived suppressor cells endow stem-like qualities to breast cancer cells through IL6/STAT3 and NO/NOTCH cross-talk signaling. Cancer Res. 2016;76(11):3156–3165. doi: 10.1158/0008-5472.CAN-15-2528. [DOI] [PMC free article] [PubMed] [Google Scholar]
- 20.Kuroda H, Mabuchi S, Yokoi E, et al. Prostaglandin E2 produced by myeloid-derived suppressive cells induces cancer stem cells in uterine cervical cancer. Oncotarget. 2018;9:36317–36330. doi: 10.18632/oncotarget.26347. [DOI] [PMC free article] [PubMed] [Google Scholar]
- 21.Yokoi E, Mabuchi S, Komura N, et al. The role of myeloid-derived suppressor cells in endometrial cancer displaying systemic inflammatory response: clinical and preclinical investigations. Oncoimmunology. 2019;8:e1662708. doi: 10.1080/2162402X.2019.1662708. [DOI] [PMC free article] [PubMed] [Google Scholar]
- 22.Mabuchi S, Matsumoto Y, Kawano M, et al. Uterine cervical cancer displaying tumor-related leukocytosis: a distinct clinical entity with radioresistant feature. J Natl Cancer Inst. 2014;106:dju147. doi: 10.1093/jnci/dju147. [DOI] [PubMed] [Google Scholar]
- 23.Yoshida Y, Sadata A, Zhang W, Saito K, Shinoura N, Hamada H. Generation of fiber-mutant recombinant adenoviruses for gene therapy of malignant glioma. Hum Gene Ther. 1998;9:2503. doi: 10.1089/hum.1998.9.17-2503. [DOI] [PubMed] [Google Scholar]
- 24.Samulski RJ, Srivastava A, Berns KI, Muzyczka N. Rescue of adeno-associated virus from recombinant plasmids: gene correction within the terminal repeats of AAV. Cell. 1983;33:135–143. doi: 10.1016/0092-8674(83)90342-2. [DOI] [PubMed] [Google Scholar]
- 25.Kawano M, Mabuchi S, Matsumoto Y, et al. The significance of G-CSF expression and myeloid-derived suppressor cells in the chemoresistance of uterine cervical cancer. Sci Rep. 2015;5:18217. doi: 10.1038/srep18217. [DOI] [PMC free article] [PubMed] [Google Scholar]
- 26.Sasano T, Mabuchi S, Kozasa K, et al. The highly metastatic nature of uterine cervical/endometrial cancer displaying tumor-related leukocytosis: clinical and preclinical investigations. Clin Cancer Res. 2018;24:4018–4029. doi: 10.1158/1078-0432.CCR-17-2472. [DOI] [PubMed] [Google Scholar]
- 27.Mabuchi S, Altomare DA, Cheung M, et al. RAD001 inhibits human ovarian cancer cell proliferation, enhances cisplatin-induced apoptosis, and prolongs survival in an ovarian cancer model. Clin Cancer Res. 2007;13:4261–4270. doi: 10.1158/1078-0432.CCR-06-2770. [DOI] [PubMed] [Google Scholar]
- 28.Wang D, Fu L, Sun H, Guo L, DuBois RN. Prostaglandin E2 promotes colorectal cancer stem cell expansion and metastasis in mice. Gastroenterology. 2015;149:1884–95.e4. doi: 10.1053/j.gastro.2015.07.064. [DOI] [PMC free article] [PubMed] [Google Scholar]
- 29.Kurtova AV, Xiao J, Mo Q, et al. Blocking PGE2-induced tumour repopulation abrogates bladder cancer chemoresistance. Nature. 2015;517:209–213. doi: 10.1038/nature14034. [DOI] [PMC free article] [PubMed] [Google Scholar]
- 30.Sinha P, Clements VK, Fulton AM, Ostrand-Rosenberg S. Prostaglandin E2 promotes tumor progression by inducing myeloid-derived suppressor cells. Cancer Res. 2007;67(9):4507–4513. doi: 10.1158/0008-5472.CAN-06-4174. [DOI] [PubMed] [Google Scholar]
- 31.Obermajer N, Muthuswamy R, Lesnock J, Edwards RP, Kalinski P. Positive feedback between PGE2 and COX2 redirects the differentiation of human dendritic cells toward stable myeloid-derived suppressor cells. Blood. 2011;118(20):5498–5505. doi: 10.1182/blood-2011-07-365825. [DOI] [PMC free article] [PubMed] [Google Scholar]
- 32.Garcia-Diaz A, Shin DS, Moreno BH, et al. Interferon receptor signaling pathways regulating PD-L1 and PD-L2 expression. Cell Rep. 2017;19:1189–1201. doi: 10.1016/j.celrep.2017.04.031. [DOI] [PMC free article] [PubMed] [Google Scholar]
- 33.Sun C, Mezzadra R, Schumacher TN. Regulation and function of the PD-L1 checkpoint. Immunity. 2018;48:434–452. doi: 10.1016/j.immuni.2018.03.014. [DOI] [PMC free article] [PubMed] [Google Scholar]
- 34.Vo BT, Morton D, Jr, Komaragiri S, Millena AC, Leath C, Khan SA. TGF-β effects on prostate cancer cell migration and invasion are mediated by PGE2 through activation of PI3K/AKT/mTOR pathway. Endocrinology. 2013;154:1768–1779. doi: 10.1210/en.2012-2074. [DOI] [PMC free article] [PubMed] [Google Scholar]
- 35.Dufour M, Faes S, Dormond-Meuwly A, Demartines N, Dormond O. PGE2-induced colon cancer growth is mediated by mTORC1. Biochem Biophys Res Commun. 2014;451:587–591. doi: 10.1016/j.bbrc.2014.08.032. [DOI] [PubMed] [Google Scholar]
- 36.Weber J, Gibney G, Kudchadkar R, et al. Phase I/II study of metastatic melanoma patients treated with nivolumab who had progressed after ipilimumab. Cancer Immunol Res. 2016;4:345–353. doi: 10.1158/2326-6066.CIR-15-0193. [DOI] [PMC free article] [PubMed] [Google Scholar]
- 37.Martens A, Wistuba-Hamprecht K, Geukes Foppen M, et al. Baseline peripheral blood biomarkers associated with clinical outcome of advanced melanoma patients treated with ipilimumab. Clin Cancer Res. 2016;22:2908–2918. doi: 10.1158/1078-0432.CCR-15-2412. [DOI] [PMC free article] [PubMed] [Google Scholar]
- 38.Smyth MJ, Ngiow SF, Ribas A, Teng MW. Combination cancer immunotherapies tailored to the tumour microenvironment. Nat Rev Clin Oncol. 2016;13:143–158. doi: 10.1038/nrclinonc.2015.209. [DOI] [PubMed] [Google Scholar]
Associated Data
This section collects any data citations, data availability statements, or supplementary materials included in this article.


