

Abstract
Mitochondrial genomes have provided significant insights into the evolution of several insects. A typical mitogenome contains 37 genes, and variations in gene order can indicate evolutionary relationships between species. In this study, we have assembled the first complete mitogenomes of Endecous chape and E. onthophagus and analyzed the phylogenetic implications for the Gryllidea infraorder. We performed DNA extractions and genome sequencing for both Endecous species. Subsequently, we searched for raw data in the Sequence Read Archive (SRA) in NCBI. Using the SRA data, we assembled the partial mitogenome of Dianemobius nigrofasciatus and annotated the protein-coding genes (PCGs) for nine species. Phylogenomic relationships were reconstructed using Maximum Likelihood (ML) and Bayesian Inference (BI), utilizing the PCGs from 49 Gryllidea species. The mitogenome lengths of E. chape and E. onthophagus are 16,266 bp and 16,023 bp, respectively, while D. nigrofasciatus has a length of 15,359 bp. Our results indicate that species within the infraorder exhibit four types of gene order arrangements that align with their phylogenetic relationships. Both phylogenomic trees displayed strong support, and the ML corroborated with the literature. Gryllidea species have significantly contributed to various fields, and studying their mitogenomes can provide valuable insights into this infraorder evolution.
Keywords: Insect, mitogenome, arrangement, Gryllidae, Phylogenetics
Introduction
Mitochondrial genomes can provide significant insights into organisms and genome evolution (Boore and Brown, 1998; Boore, 1999). These sequences encompass conserved genes and serve as valuable sources for genetic and molecular analysis, providing informative details on gene rearrangements, insertion, or deletion, and essential phylogenetic markers (Boore and Brown, 1998; Rokas and Holland, 2000; Fenn et al., 2008). The increased number of mitogenome sequencing has been facilitated due to their compact size, viable assembly from Next-Generation Sequencing (NGS) data, and accessible analysis in comparison to whole genomes (Fenn et al., 2008; Cameron, 2014; Barroso Lima and Prosdocimi, 2018).
Insects mitogenomes typically exhibit a circular structure, ranging from 14 to 19 kilobases, containing 37 genes. These genes comprise 13 protein-coding genes (PCGs), 22 transfer RNAs (tRNA), two ribosomal RNA (rRNA), and a T+A-rich region (Flook et al., 1995; Boore, 1999; Kim et al., 2005; Sheffield et al., 2010). This region is the site for replication and transcription initiation and displays high variability across insect species (Boore and Brown, 1998; Fenn et al., 2008; Gaugel et al., 2023). Mitogenomes are generally haploid with maternal inheritance and exhibit a pronounced AT-bias, characterized by a high percentage of thymine and adenine (Flook et al., 1995; Fenn et al., 2007; Erler et al., 2010; Sheffield et al., 2010).
Mitochondrial phylogenomics provides a practical framework that supports evolutionary and comparative studies, including investigations into the frequency of gene rearrangements (Boore and Brown, 1998; Song et al., 2016 Cameron, 2014). In insects, diverse arrangements have been observed and that may assist in species definition. However, the full taxonomic extent of these rearrangements remains incompletely understood (Cameron, 2014).
Orthoptera has a worldwide distribution with almost 30,000 valid species, subdivided into the suborders Caelifera (grasshoppers) and Ensifera (crickets and katydids) (Song et al., 2015; Cigliano et al., 2023). Given the occurrence of large and complex genomes within these taxa, mitochondrial genomes have emerged as a valuable source for understanding evolution (Fenn et al., 2008). The first assembled orthopteran mitogenome was of Locusta migratoria (Caelifera), characterized by a 76% AT content (Flook et al., 1995). Despite limited knowledge about many groups of Orthoptera, events such as inversions, transpositions, and gene duplications and losses have been documented (Ma and Li, 2018; Yang et al., 2021; Gaugel et al., 2023).
Mitogenomes of Ensifera typically have lower AT content than those of Caelifera (Sheffield et al., 2010). Moreover, significant changes in mitochondrial gene order have been identified in Ensifera lineages, leading to the classification of distinct arrangement types (Fenn et al., 2008; Dan et al., 2022). Within the suborder Ensifera, there is the infraorder Gryllidea, encompassing the superfamilies Grylloidea (which comprises the families Gryllidae, Mogoplistidae, Trigonidiidae, Phalangopsidae, and Oechantidae) and Gryllotalpoidea (with two families, Gryllotalpidae and Myrmecophilidae) (Desutter-Grandcolas, 2003; Zhou et al., 2017; Cigliano et al., 2023). In phylogenetic analyses, some incongruences within the infraorder arise due to data combinations, such as the insertion of the third codon position, which can influence support values and topology (Ma and Miao, 2022).
Gryllotalpoidea mitogenomes demonstrate the preservation of ancestral gene arrangements (Yang et al., 2021). Meanwhile, within Grylloidea, two tRNA gene rearrangements are reported concerning chromosome synteny: 1) the transposition of trnV to the site between 12S and the T+A-rich region and 2) the local inversion of the ancestral trnN-trnS1-trnE to trnE-trnS1-trnN (Song et al., 2016; Yang et al., 2016; Zhou et al., 2017; Ma and Li, 2018). The former is described in Trigonidiidae and one Mogoplistidae species, and the second occurs in Gryllidae, Trigonidiidae, and Phalangopsidae (Ma and Li, 2018; Yang et al., 2021). The inversion may represent a synapomorphy of the three families, arising in a common ancestor after the divergence of Mogoplistidae (Ma and Li, 2018).
The clade Ensifera , one of the most studied, has been employed in many studies, including cytogenetics, evolution, and embryogenesis (Donoughe and Extavour, 2016; Kataoka et al., 2022; Silva et al., 2022). Nevertheless, in Phalangopsidae, only two species possess complete mitogenomes, Cacoplistes rogenhoferi and Meloimorpha japonica, featuring the local inversion (Ma and Li, 2018).
The genus Endecous (Phalangopsidae) exhibits a restricted distribution, occurring only in South America (Cigliano et al., 2023). This clade encompasses 24 species differentiated by morphological characteristics of phallic sclerites, bioacoustics, and karyotypes, with diploid numbers ranging from 2n=14 to 21 and male sexual mechanisms of X0 or X1X20 (Zefa et al., 2014; Castro-Souza et al., 2017; Souza-Dias et al., 2017). Most Endecous species inhabit caves, creating gene flow between cave and surface populations, contributing significantly to cave community dynamics (Castro-Souza et al., 2017; Souza-Dias et al., 2017).
In this study, we described the first complete mitogenomes of the Phalangopsinae subfamily and compared the mitochondrial characteristics of two species of the same genus. Additionally, we analyzed gene rearrangements and inferred relationships among species of Gryllidea with available sequence data. After that, we provided the complete mitochondrial genomes for the Endecous chape and Endecous onthophagus, along with the partial mitogenome of Dianemobius nigrofasciatus. Obtained sequences of PCGs for nine species from raw transcriptome data available in the National Center for Biotechnology Information (NCBI). Using the 13 PCGs, we reconstructed the phylogenetic relationships of 49 species within the Gryllidea infraorder. Our results revealed that the infraorder exhibits four arrangement types, with one being unique to a single species. The analysis of mitochondrial sequences indicated that gene order rearrangements preserve phylogenetic signals, highlighting the need for deeper investigation in further studies concerning the origins and evolution of these rearrangements.
Material and Methods
Species samples and DNA extraction
Individuals of E. chape and E. onthophagus were provided by Laboratório de Invertebrados at Universidade Federal de Pelotas. Endecous chape was collected in Iguaçu National Park, Foz do Iguaçu, Paraná, Brazil (25°37’6.16”S, 54°28’56.34”W). Endecous onthophagus were collected in the district of Colônia Maciel, Pelotas, Rio Grande do Sul, Brazil (31º28’32”S; 52º34’09”W). The specimens were maintained in a constant temperature chamber with a 12:12h photoperiod cycle before being selected for molecular analysis.
DNA extraction was performed using the hind femora of a female from each species with the DNeasy Blood & Tissue (Qiagen) kit following the manufacturer’s protocols. Low-coverage Next-Generation Sequencing of PE150 reads was performed by Macrogen Inc. (Seoul, South Korea) using the Illumina NovaSeq platform (Figure S1a). This generated reads with 151 bp and about 22 million and 32 million sequences (forward and reverse) for E. chape and E. onthophagus, respectively.
Sequence analysis
Endecous chape and E. onthophagus: Raw reads underwent quality control assessment using FastQC v.0.11.9 (2019). Adapters and low-quality bases were removed using FastP tools. Mitogenome assemblies were executed using the GetOrganelle pipeline (Jin et al., 2020), employing approximately 16 million reads, resulting in a mitogenome coverage of ~1,550X for E. chape and 25 million reads, yielding ~1,075X of coverage for E. onthophagus. Then, gene annotation was conducted using Mitofinder (Allio et al., 2020) (Figure S1).
Dianemobius nigrofasciatus: Partial mitogenome obtained from raw data of transcriptome available in the Sequence Read Archive (SRA) of NCBI (2023) (accession number: DRR140412). Assembling was performed using the MITGARD pipeline (Nachtigall et al., 2021), with a reference mitogenome, and gene annotation was carried out with Mitofinder (Allio et al., 2020) (Figure S1b).
Nucleotide composition and the strand asymmetry (AT-Skew = (A − T)/(A + T) and GC-Skew = (G − C)/(G + C)) (Perna and Kocher, 1995) were calculated in the three mitogenomes using MEGA version 11 (Tamura et al., 2021). The asymmetry indicates the richness of the bases, then positive GC-Skew suggests an abundance of G over C, while a negative GC-Skew an excess of C over G. Similarly, a positive AT-Skew indicates an abundance of A, whereas a negative AT-Skew suggests an excess of T (Perna and Kocher, 1995).
The relative synonymous codon usage (RSCU) was determined using PhyloSuite (Zhang D et al., 2020). Synonymous codons refer to different sets of nucleotides that encode the same amino acid and may exhibit a codon usage bias, where certain codons are notably more frequent than others (Sharp et al., 1986; Subramanian et al., 2022). This is calculated by dividing the actual frequency of a codon by the frequency expected if all synonymous codons for the same amino acid were used uniformly (Sharp et al., 1986).
Mitochondrial DNA maps for E. chape and E. onthophagus were generated using the Circular Genome Viewer (CGView) (Stothard et al., 2019). Strand annotation was followed as described by Barroso Lima and Prosdocimi (2018), and for nucleic acid nomenclature, the IUPAC system was used.
NCBI sequences: We used 37 species of Gryllidea infraorder with complete mitochondrial genomes available in the NCBI (accessed on January 19th, 2023). In addition, nine species had sequences of PCGs obtained from raw data of transcriptomes available in the Sequence Read Archive (SRA) of NCBI (2023) (Table S1). The PCGs assembling and annotation were performed as it was for D. nigrofasciatus (described above). Except for Marinemobius asahinai, whose raw data came from a whole genome sequence, the assembly and annotation followed the procedures used for Endecous (described above) (Figure S1b).
All gene sequences were checked for the presence of nuclear copies of mitochondrial DNA (numts). They were translated and visually inspected for the presence of stop codons. Additionally, the ratio between the number of nonsynonymous substitutions per nonsynonymous sites (dN) and the number of synonymous substitutions per synonymous sites (dS) was analyzed using MEGA version 11 (Tamura et al., 2021). For dN/dS, sequences were evaluated both pairwise and overall, using the codon-based Z-test of Selection with the Nei-Gojobori method (Nei and Gojobori, 1986; Tamura et al., 2021). The new sequences obtained in this study have been submitted to the GenBank database, including the complete mitogenomes for E. chape (OQ935836) and E. onthophagus (OQ935837), as well as the partial mitogenome for D. nigrofasciatus (BK063406) (Table S1). Additionally, all annotated PCGs from the nine species used in the phylogenomic analysis are available in Table S2.
Rearrangement analysis
The arrangements of 38 species with complete mitochondrial genomes were analyzed and classified according to the types determined by Dan et al. (2022). We used the web server Quantifying Mitochondrial Genome Rearrangement (qMGR) (Zhang J et al., 2020) to calculate the rearrangement of genes compared to a reference arrangement (benchmark). Determining the rearrangement frequency (RF) for each gene and assigning a rearrangement score (RS) to each mitogenome within a species group, evaluating them against the selected reference (Zhang J et al., 2020). Our reference for this analysis was the established mitochondrial gene order specific to invertebrates, available on the web server.
Phylogenomics analysis
Inferred phylogenies were reconstructed based on the 13 PCGs from 49 species of Gryllidea and two of Tettigoniidea (Anabrus simplex and Phlugiolopsis punctata) as outgroups (Table S1). Each PCG was aligned using MAFFT v.7 (Katoh et al., 2019) and trimmed with the program TrimAl v.1.3 (Capella-Gutiérrez et al., 2009) in Phylemon2 (Sánchez et al., 2011). We conducted substitution saturation tests using DAMBE (Xia, 2017) for three codon site schemes: sites 1+2; only site 3; and all sites.
The alignments were concatenated, and the best partitioning schemes and nucleotide substitution models were estimated based on a greedy algorithm and Akaike information criteria (AIC), with PartitionFinder2 (Lanfear et al., 2017) in PhyloSuite (Zhang D et al., 2020). The gene sequences unavailable for certain species were considered missing data. Phylogenomic relationships were inferred by: (i) Maximum Likelihood (ML) analysis using IQ-Tree (Guindon et al., 2010; Nguyen et al., 2015), with an Edge-linked partition model, and 1,000 ultrafast bootstraps (UFboot) (Minh et al., 2013) replicates to estimate node supports; and (ii) Bayesian Inference (BI) analysis in MrBayes 3.2.7 (Ronquist et al., 2012) with two parallel runs of 50 million MCMC generations each, sampling every 5,000 and discarding the first 25% samples as burn-in.
Results
Mitogenome and sequence characterizations
The mitogenome lengths for E. chape and E. onthophagus were 16,266 bp and 16,023 bp, respectively. They have the usual gene content, with 13 PCGs, two rRNAs, and 22 tRNAs genes (Figure 1). The 13 PCGs are compounds by two ATPase subunits (Atp6 and Atp8), the cytochrome C oxidase subunits COI, COII, and COIII, one cytochrome b gene (CYTB), and seven NADH dehydrogenase subunits (ND1-6 and ND4l). The ribosomal RNAs 12S and 16S, and the 22 tRNAs, the trnA, trnR, trnN, trnD, trnC, trnQ, trnE, trnG, trnH, trnI, trnL1, trnL2, trnK, trnM, trnF, trnP, trnS1, trnS2, trnT, trnW, trnY, and trnV (Figure 1 and Table S3). The partial genome of D. nigrofasciatus, assembled using raw data from NCBI, comprises 15,359 bp, including all PCGs and all rRNAs, but lacks tRNA-Glutamic acid (trnE) as indicated in Table S3.
Figure 1 - . Complete mitochondrial genome maps of Endecous chape and E. onthophagus. Representative picture of specimens. Legend indicates CDs (Protein-coding genes), RNAs (transfer RNA), and rRNAs (ribosomal RNA) using the IUPAC system of nomenclature.
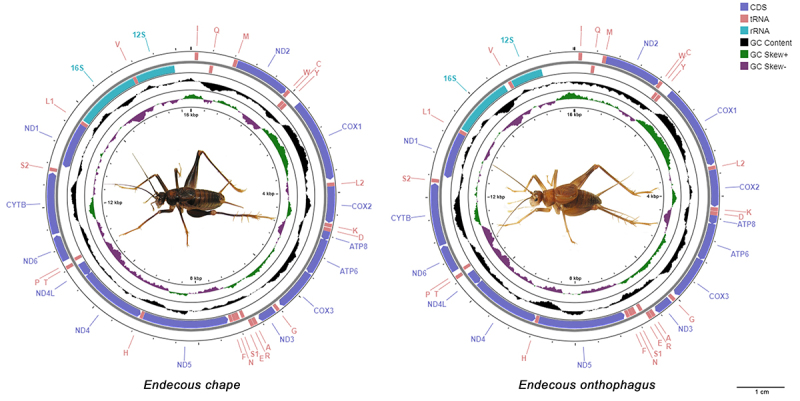
The PCGs displayed substantial size diversity, from 162 - 171 bp in ATP8 to 1,725 - 1,734 bp in ND5. Regarding rRNAs, sizes varied between 627 - 785 bp in 12S and 1,193 - 1,375 bp in 16S. Similarly, the 22 tRNAs exhibited a consistent length range of 48 - 71 bp (Table S3).
Endecous chape, E. onthophagus, and D. nigrofasciatus mitogenomes showed a GC content ranging from 27.3% to 29.3% (Table 1). When analyzing each mitochondrial gene, the GC content was consistently lower than the AT content (Table 1). According to the nucleotide composition, most genes displayed a higher percentage of thymine than adenine (Table S3).
Table 1 - . Percentage of AT and GC, and the AT-Skew and GC-Skew of the mitochondrial genome of Dianemobius nigrofasciatus, Endecous chape, and E. onthophagus and each gene.
| Mitogenome | AT% | GC% | AT-Skew | GC-Skew |
|---|---|---|---|---|
| a D. nigrofasciatus | 71.5 | 27.3 | -0.011 | -0.331 |
| E. chape | 72.4 | 27.6 | 0.044 | -0.332 |
| E. onthophagus | 70.7 | 29.3 | 0.063 | -0.345 |
| bGenes | ||||
| ATP6 | 71.6/69.5/68.4 | 28.3/30.4/31.6 | -0.131/-0.113/-0.073 | -0.392/-0.356/-0.398 |
| ATP8 | 79.0/76.0/74.6 | 21.0/24.0/25.4 | 0.062/0.000/-0.041 | -0.412/-0.707/-0.714 |
| COI | 65.7/65.4/64.8 | 34.3/34.6/35.3 | -0.146/-0.080/-0.093 | -0.131/-0.126/-0.137 |
| COII | 70.1/67.6/68.9 | 29.9/32.5/31.2 | -0.012/-0.026/-0.054 | -0.269/-0.300/-0.289 |
| COIII | 68.9/66.8/64.3 | 31.1/33.2/35.8 | -0.147/-0.131/-0.057 | -0.208/-0.221/-0.241 |
| CytB | 68.2/68.0/65.3 | 31.9/31.9/34.8 | -0.135/-0.129/-0.078 | -0.260/-0.286/-0.288 |
| NAD1 | 71.8/72.6/68.7 | 28.2/27.5/31.3 | -0.235/-0.298/-0.348 | 0.402/0.347/0.399 |
| NAD2 | 74.5/75.8/75.3 | 25.4/24.2/24.7 | -0.213/-0.066/-0.082 | -0.392/-0.410/-0.377 |
| NAD3 | 75.1/70.4/71.9 | 24.8/29.7/28.1 | -0.203/-0.148/-0.123 | -0.409/-0.340/-0.283 |
| NAD4 | 73.8/72.9/72.2 | 26.3/27.1/27.8 | -0.147/-0.254/-0.258 | 0.455/0.455/0.432 |
| NAD4L | 79.0/73.6/72.1 | 21.0/26.4/27.9 | -0.174/-0.291/-0.337 | 0.770/0.644/0.688 |
| NAD5 | 74.2/74.1/71.4 | 25.8/25.9/28.6 | -0.134/-0.206/-0.289 | 0.434/0.367/0.431 |
| NAD6 | 75.2/77.7/73.4 | 24.7/22.4/26.6 | -0.098/-0.105/-0.032 | -0.554/-0.418/-0.597 |
| 12S | 71.0/69.9/68.4 | 29.0/30.1/31.6 | -0.006/-0.056/-0.072 | 0.385/0.314/0.384 |
| 16S | 74.4/67.9/72.7 | 25.7/32.2/27.3 | -0.013/-0.049/-0.119 | 0.457/0.292/0.405 |
| tRNAs(L) | 75.3/75.5/75.6 | 24.7/24.5/24.4 | 0.041/0.065/0.077 | 0.051/0.056/0.022 |
| tRNAs(H) | 72.4/73.2/72.5 | 27.6/26.8/27.4 | -0.018/-0.073/-0.028 | 0.422/0.374/0.363 |
The mitochondrial genome is incomplete. bData of genes are given as D. nigrofasciatus/ E. chape/ E. onthophagus. tRNAs: concatenated tRNA genes. (L) light strand. (H) heavy strand.
Concerning strand asymmetry, the AT-skew values for E. chape and E. onthophagus (0.044 and 0.063) were positive and negative for D. nigrofasciatus (-0.011), and all showed negative values of GC-skew (-0.345 to -0.332) (Table 1). Most of the PCGs showed negative AT-skew, except ATP8 in D. nigrofasciatus (0.062) and E. chape (0.000), and GC-skew also has negative values, except for the genes ND1, ND4, ND4l, and ND5. The two rRNAs showed negative AT-skew and positive GC-skew values. For tRNAs, the light strand has AT-skew and GC-skew positive, and the heavy AT-skew negative and GC-skew positive (Table 1).
In all three species, most PCGs start with ATN codons, except for COI, which starts with CAA in D. nigrofasciatus and ACG in E. onthophagus. Additionally, ND1 consistently starts with TTG across all three mitogenomes (Table S3). Concerning stop codons, the predominant one is TAA, yet variations exist, such as TAG found in CytB and ND3 of D. nigrofasciatus, as well as in ND4l of E. onthophagus (Table S3).
We recovered and annotated the PCGs for Acheta domesticus, Gryllus assimilis, G. firmus, G. pennsylvanicus, G. rubens, G. texensis, M. asahinai, Phaeophilacris bredoides, and Teleogryllus commodus (Table S2). Mitogenome length ranged from 15,791 bp in M. asahinai to 16,066 bp in G. pennsylvanicus (Table S1).
The saturation tests were applied in each aligned gene with all species to analyze codon site 1+2, only site 3, and with all the sites, considering significant values of p>0.05. In the test on-site 3, most sequences showed high saturation and were classified as useless. In the test on sites 1+2, the genes ATP6, COII, COIII, ND1, ND3, and ND6 showed p<0.05 and little saturation. Then, for the other genes, the best results were observed in the test involving all codon positions (Table S4).
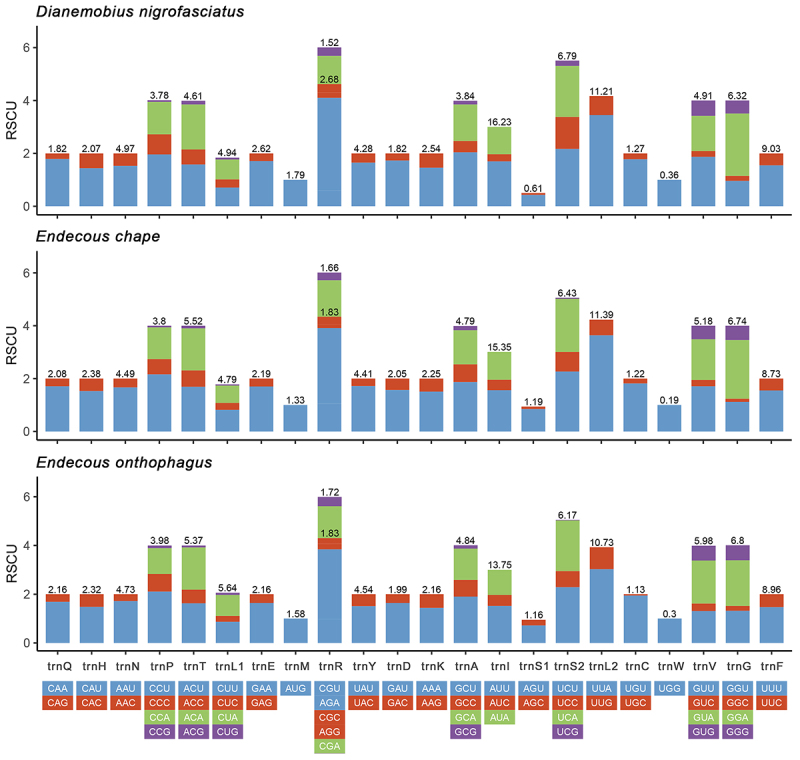
The relative synonymous codon usage (RSCU) of both Endecous and D. nigrofasciatus showed similar values (Figure 2). The codons most frequently used for de amino acids are trnL2 (UUA), trnS2 (UCU), trnR (AGA), and trnG (GGA), and the trnP (CCU) and trnS2 (UCA) only in E. chape and E. onthophagus. These codons showed RSCU values higher than 2.00 (Figure 2 and Table S5).
Figure 2 - . Relative synonymous codon usage (RSCU) of Dianemobius nigrofasciatus, Endecous chape, and E. onthophagus mitogenomes. The numbers above the colored columns indicate the frequencies of amino acids in the mitochondrial genomes.
Rearrangements
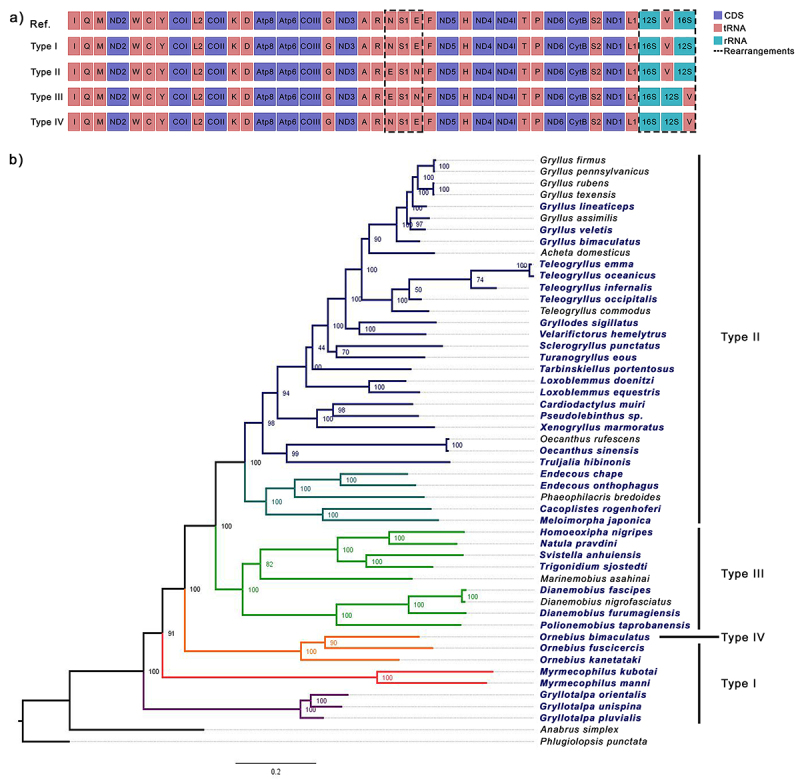
We identified four arrangements from 38 complete mitogenomes analyzed and compared these gene orders with the mitochondrial gene order established for invertebrates available on the web server qMGR (Zhang J et al., 2020) (Figure 3). Type I occurs in seven species within the subfamilies Gryllotalpidae, Myrmecophilidae, and Mogoplistidae. We observed modification in the typical gene order of 12S-trnV-16S to 16S-trnV-12S. The group Type II consists of 23 species that belong to Gryllidae and Phalangopsidae. Compared with the reference mitogenome, it shows an inversion of the gene order trnN-trnS1-trnE to trnE-trnS1-trnN. Seven species of Trigonidiidae were classified in Type III and showed the inversion trnE-trnS1-trnN and the modification of 12S-V-16S to 16S-12S-trnV. Finally, the Type IVG (Gryllidea infraorder) occurred only in the scaly cricket Ornebius bimaculatus and consisted of the 16S-12S-trnV (Figure 3a ).
Figure 3 - . Representation of mitochondrial gene rearrangements in Gryllidea species, distribution, and relationship in the Maximum Likelihood (ML). a) Gene order of reference (Ref.) mitogenome and arrangement types. Legend indicates the CDs (Protein-coding genes), RNAs (transfer RNA), rRNAs (ribosomal RNA), and dot line rearrangement’s location. b) Phylogenomic tree inferred with the 13 PCGs, values next to the nodes indicate the bootstrap support. Each branch color indicates the species family: purple Gryllotalpidae, orange Mogoplistidae, red Myrmecophilidae, green Trigonidiidae, dark green Phalangopsidae, and dark blue Gryllidae. Species names in bold/blue have their mitogenome complete and were used to analyze the rearrangements.
The total rearrangement frequency (RF) and rearrangement score (RS) were calculated for each gene and the groups of arrangements, respectively (Figure S2). We found the highest RF value for 16S (100), followed by 12S and trnV (89.47), then the trnN, trnS1, and trnE with 78.94. All the PCGs showed RF equal to zero, so they have the same position as the typical invertebrate mitogenome (Figure S2a). The RS test indicated that Type II is the most active rearrangement with a score of 16, followed by Type III with 14, Type I with eight, and Type IVG with six (Figure S2b).
Phylogenomic reconstructions
The best nucleotide substitution model was GTR+I+G for all genes, and the partitioning scheme clustered them in eleven partitions (ND1, ND2, ND3, ND5+ND4, ATP6, ATP8+ND6, COI, COII, COIII, CYTB, ND4l). According to the saturation test, we obtained good results for codon positions 1+2 and all sites. Then, for the genes Atp6, COII, COIII, ND1, ND3, and ND6, we selected only the codon sites 1+2 (Table S4).
The ML and BI consensus trees exhibited variations in species relationships and displayed high node support (Figure 3b and Figure S3, respectively). Species of the same genus were consistently clustered in both analyses, indicating their close relationships. The first discrepancy between the results is the position of the clade containing Myrmecophilus and Ornebius; however, the BI had stronger support (PP = 1.00 and PP = 0.9). Subsequently, in the BI tree, Tarbinskiellus portentosus showed a close relationship with Loxoblemmus (PP = 1.00). Following, while the ML tree showed a close relationship between Sclerogryllus punctatus and Turanogryllus eous (UFboot = 70), this association was not corroborated by the BI analysis (PP = 1.00 and PP = 0.92, respectively). Finally, the different placements of Teleogryllus occipitalis and T. commodus, with better support in the BI tree (Figure 3b and Figure S3).
Discussion
Mitogenomes and characterizations
We sequenced and characterized the complete mitogenomes of E. chape and E. onthophagus, with lengths of 16,266 bp and 16,023 bp, respectively. They contain 37 genes (13 PCGs, 22 tRNAs, and two rRNAs) and represent the first fully assembled mitogenomes for the Phalangopsinae subfamily. Additionally, we obtained the partial mitogenome of D. nigrofasciatus, with 15,359 bp and 36 genes, lacking the trnE. This is the third characterized assembly for the Dianemobius genus (Ma et al., 2019).
The mitogenomes assembled and inferred in this study showed sizes similar to those typically observed in insects (Flook et al., 1995; Boore, 1999; Kim et al., 2005; Sheffield et al., 2010). The length of complete mitogenomes among Phalangopsidae species varies from 15,880 bp in M. japonica to 16,266 bp in E. chape (Ma and Li, 2018).
The PCGs consistently feature the standard ATN start codons, except for COI in D. nigrofasciatus and E. onthophagus, as well as ND1 in E. chape, E. onthophagus, and D. nigrofasciatus. Similar variations in COI start codons have been observed in several species such as C. rogenhoferi, M. japonica, Ornebius fuscicercis, and others (Ma and Li, 2018). Likewise, ND1 variations have been noted in C. rogenhoferi, M. japonica, and Polionemobius taprobanensis (Ma and Li, 2018; Ma et al., 2019).
The use of synonymous codons to encode most amino acids often displays a bias towards specific codons over others. This selective preference can be influenced by different factors, including nucleotide composition (Subramanian et al., 2022). Species with genomes rich in AT content typically favor codons ending in A/T, such as Gryllotalpa orientalis, where 79.2% of the third codon position ends in A/T (Kim et al., 2005; Dan et al., 2022; Subramanian et al., 2022). Furthermore, a higher frequency of A/T-ending genes positively impacts the AT bias of mitogenomes (Ma and Miao, 2022).
The amino acids most frequently used in Endecous and D. nigrofasciatus are Leucine (UUA) and Serine (UCU), which are common among other orthopterans. In G. orientalis, these amino acid frequencies were 15.79% and 9.58%, respectively (Kim et al., 2005). However, these findings slightly differ from the commonly considered most frequent amino acids in other Ensifera mitogenomes, including Isoleucine (AUU), Phenylalanine (UUU), and Leucine (UUA) (Ma and Miao, 2022; Dan et al., 2022). Regarding the methionine tRNA, we did not observe either duplications or deletions.
All three cricket mitogenomes exhibit strong GC-skew values ranging from -0.345 to -0.332, a characteristic shared with species of Eneopterinae and Gryllinae (Ensifera) (Dong et al., 2017). These negative GC skew values indicate an excess of C relative to G in these mitogenomes (Dong et al., 2017; Ma et al., 2019). The AT-skew values ranged between Endecous (0.044 and 0.063) and D. nigrofasciatus (-0.011). Despite these differences, the values found for Endecous align with those observed in Phalangopsidae, while those for D. nigrofasciatus are according to Nemobiinae (Ma et al., 2019). So, it is possible to infer the presence of an A excess in Phalangopsidae and of T in Nemobiinae (Ma et al., 2019).
Rearrangements
Type I through Type IVG arrangements have previously been documented in Ensifera species (Kim et al., 2005; Ma and Li, 2018; Dan et al., 2022). Type I, Type II, and Type III were previously classified by Dan et al. (2022). However, the Type IVG rearrangement, exclusively found in O. bimaculatus had not been categorized before (Ma and Li, 2018; Dan et al., 2022) therefore, we categorize it for the first time in this study.
The Type I classification encompasses G. orientalis, G. pluvialis of Gryllotalpinae, and Myrmecophilus manni of Myrmecophilinae (Dan et al., 2022). Expanding this group are G. unispina, M. kubotai, O. fuscicercis, and O. kanetataki of the Mogoplistinae subfamily, which was not included previously (Ma and Li, 2018; Dan et al., 2022; Ma and Miao, 2022). Regarding the standard gene order in invertebrates, both Caelifera and Ensifera exhibit different rearrangements. In Ensifera, Type I shows the rearrangement 16S-trnV-12S, whereas species of Caelifera, such as L. migratoria, exhibit a translocation of tRNAs K and D (Flook et al., 1995; Kim et al., 2005; Dan et al., 2022). Consequently, it can be inferred that the observed rearrangements in Caelifera and Ensifera evolved independently after the split of the Orthoptera stem lineage (Kim et al., 2005; Cameron et al., 2006).
Type II shows the inversion trnN-trnS1-trnE to trnE-trnS1-trnN (Figure 3a ), and it is most prevalent among the described complete mitogenomes (Ma and Li, 2018; Dan et al., 2022). The inversion observed in C. rogenhoferi and M. japonica was also found in both Endecous species, confirming the position of the Phalangopsidae as a Type II (Ma and Li, 2018). Additionally, we added S. punctatus of the Sclerogryllinae subfamily to this group (Yu et al., 2022). Type II has been proposed to occur in the Gryllinae species, although it might be a feature of the Gryllidae family (Yang et al., 2016). It is necessary to examine a larger number of samples to correctly characterize the inversion and determine its prevalence among species.
Type III comprises the species described by Dan et al. (2022) from the Nemobiinae and Trigonidiinae subfamilies (Ma et al., 2019). Lastly, Type IVG found exclusively in O. bimaculatus, stands as a distinct category within the Gryllidea infraorder (Ma and Li, 2018). This type is characterized by featuring the typical trnN-trnS1-trnE gene order and the transposition of trnV to the site between 12S and the T+A-rich region (Ma and Li, 2018). The trnV relocation is also observed in Trigonidiidae, implying that it occurred independently in these two branches (Gaugel et al., 2023). Moreover, Type IVG differs from Type IV described by Dan et al. 2022, which occurs only in Comicus campestris (Tettigoniidea) and involves the deletion of trnI.
Concerning the total rearrangement score (RS), our analysis revealed a decrease of Type II > Type III > Type I > Type IVG, which could reflect the number of described mitogenomes. Type II includes seven subfamilies covering 23 species, Type III includes seven species across two subfamilies, Type I encompasses seven species from three subfamilies, and Type IVG contains a single species. The RS of each mitogenome within a species group can be applied as rearrangement features for comparative studies and may provide a reference for comprehending rearrangement evolution. Furthermore, each rearrangement frequency (RF) is crucial for understanding evolutionary dynamics within a group (Zhang J et al., 2020; Zhang et al., 2021). Our findings emphasize the importance of additional research on Gryllidea including species of different clades and from the same genus, which may reveal new rearrangements, as demonstrated in Ma and Li’s (2018) study on Ornebius.
Phylogenomics
The phylogenomic analysis recovered E. chape and E. onthophagus as sister species, closely related to P. bredoides. This clade clustered with C. rogenhoferi and M. japonica, positioning them all within Phalangopsidae. This relationship was expected since the first three belong to Phalangopsinae, and both C. rogenhoferi and M. japonica to Cachoplistinae (Cigliano et al., 2023).
Within Gryllidae, certain correlations were confirmed, including the close relationship between the genus Oecanthus and Truljalia hibinonis, and Gryllodes sigillatus and V. hemelytrus (Ma et al., 2019; Yang et al., 2021; Dan et al., 2022; Ma and Miao, 2022). The close relationship between A. domesticus and Gryllus was also supported, consistent with previous studies involving A. domesticus and G. bimaculatus (Ma and Miao, 2022).
The species Gryllus rubens and G. texensis are closely related, as are G. firmus and G. pennsylvanicus, and they still interact creating hybrid zones within the USA. The first two species diverged around 500,000 years ago, and COI and transcriptome-based SNP data analysis revealed that a bidirectional gene flow persisted until approximately 18,000 years ago (Blankers et al., 2018; Kataoka et al., 2022). In the case of G. firmus and G. pennsylvanicus, their divergence occurred about 200,000 years ago, and gene flow continues at the present (Maroja et al., 2009; Larson et al., 2013; Kataoka et al., 2022).
The cluster containing Ornebius has shown variations in previous phylogenetic inferences according to the method applied (Ma et al., 2019; Yang et al., 2021; Yu et al., 2022). However, our analysis strongly supported the clustering of O. fuscicercis and O. bimaculatus, with O. kanetataki as their sister group.
In our study, we observed discrepancies between the ML and BI analyses, and as previously observed, the BI trees exhibited higher support (Ma and Miao, 2022). However, one discrepancy involves the positioning of the Myrmecophilus and Ornebius genera, where the ML tree was consistent with findings from previous studies (Yang et al., 2021; Dan et al., 2022; Ma and Miao, 2022; Gaugel et al., 2023). Incorporating the third codon position might lead to more robust tree topologies (Ma and Miao, 2022). Therefore, its selective inclusion across certain genes could have influenced the phylogenomic relationships.
Conclusion
Phylogenetic investigations have confirmed that the distribution of gene rearrangements aligns with phylogenetic relationships. Our findings indicate that the four observed rearrangements may be a distinctive feature related to phylogenomic relationships. It is crucial to continue examining mitogenomes to verify the consistent occurrence of these rearrangements and to uncover potential new variations, as exemplified by the unique case of O. bimaculatus. Additionally, species within Gryllidea hold significant ecological and social importance, making them ideal model organisms for diverse fields of study.
Acknowledgements
We thank CAPES and CNPq for their financial support. The Programa de Pós-Graduação em Genética e Biologia Molecular for the opportunity to perform and publish this study. We also thank the Universidade Federal do Rio Grande do Sul and Universidade Federal de Pelotas for the infrastructure.
Supplementary material.
The following online material is available for this article:
References
- Allio R, Schomaker‐Bastos A, Romiguier J, Prosdocimi F, Nabholz B, Delsuc F. MitoFinder: Efficient automated large‐scale extraction of mitogenomic data in target enrichment phylogenomics. Mol Ecol Resour. 2020;20:892–905. doi: 10.1111/1755-0998.13160. [DOI] [PMC free article] [PubMed] [Google Scholar]
- Barroso Lima NC, Prosdocimi F. The heavy strand dilemma of vertebrate mitochondria on genome sequencing age: number of encoded genes or G+ T content? Mitochondrial DNA A DNA Mapp Seq Anal. 2018;29:300–302. doi: 10.1080/24701394.2016.1275603. [DOI] [PubMed] [Google Scholar]
- Blankers T, Vilaça ST, Waurick I, Gray DA, Hennig RM, Mazzoni CJ, Mayer F, Berdan EL. Demography and selection shape transcriptomic divergence in field crickets. Evolution. 2018;72:553–567. doi: 10.1111/evo.13435. [DOI] [PubMed] [Google Scholar]
- Boore JL. Animal mitochondrial genomes. Nucleic Acids Res. 1999;27:1767–1780. doi: 10.1093/nar/27.8.1767. [DOI] [PMC free article] [PubMed] [Google Scholar]
- Boore JL, Brown WM. Big trees from little genomes: mitochondrial gene order as a phylogenetic tool. Curr Opin Genet Dev. 1998;8:668–674. doi: 10.1016/s0959-437x(98)80035-x. [DOI] [PubMed] [Google Scholar]
- Cameron SL. Insect mitochondrial genomics: implications for evolution and phylogeny. Annu Rev Entomol. 2014;59:95–117. doi: 10.1146/annurev-ento-011613-162007. [DOI] [PubMed] [Google Scholar]
- Cameron SL, Beckenbach A, Dowton M, Whiting M. Evidence from mitochondrial genomics on interordinal relationships in insects. Arthropod Syst Phylogeny. 2006;64:27–34. [Google Scholar]
- Capella-Gutiérrez S, Silla-Martínez JM, Gabaldón T. trimAl: a tool for automated alignment trimming in large-scale phylogenetic analyses. Bioinformatics. 2009;25:1972–1973. doi: 10.1093/bioinformatics/btp348. [DOI] [PMC free article] [PubMed] [Google Scholar]
- Castro-Souza RA, Zefa E, Ferreira RL. Two new species of cave crickets Endecous (Notoendecous) Gorochov, 2014 (Orthoptera: Grylloidea: Phalangopsidae) from northeastern Brazil. Zootaxa. 2017;4318:474–498. [Google Scholar]
- Dan ZC, Guan DL, Jiang T, Wang H, Zhao L, Xu SQ. Evolution of gene Arrangements in the mitogenomes of Ensifera and characterization of the complete mitogenome of Schizodactylus jimo. Int J Mol Sci. 2022;23:12094. doi: 10.3390/ijms232012094. [DOI] [PMC free article] [PubMed] [Google Scholar]
- Desutter‐Grandcolas L. Phylogeny and the evolution of acoustic communication in extant Ensifera (Insecta, Orthoptera) Zool Scr. 2003;32:525–561. [Google Scholar]
- Dong J, Vicente N, Chintauan-Marquier I, Ramadi C, Dettai A, Robillard T. Complete mitochondrial genome and taxonomic revision of Cardiodactylus muiri Otte, 2007 (Gryllidae: Eneopterinae: Lebinthini) Zootaxa. 2017;4268:101–116. doi: 10.11646/zootaxa.4268.1.6. [DOI] [PubMed] [Google Scholar]
- Donoughe S, Extavour CG. Embryonic development of the cricket Gryllus bimaculatus. Dev Biol. 2016;411:140–156. doi: 10.1016/j.ydbio.2015.04.009. [DOI] [PubMed] [Google Scholar]
- Erler S, Ferenz HJ, Moritz RF, Kaatz HH. Analysis of the mitochondrial genome of Schistocerca gregaria gregaria (Orthoptera: Acrididae) Biol J Linn Soc Lond. 2010;99:296–305. [Google Scholar]
- Fenn JD, Cameron SL, Whiting MF. The complete mitochondrial genome sequence of the Mormon cricket (Anabrus simplex: Tettigoniidae: Orthoptera) and an analysis of control region variability. Insect Mol Biol. 2007;16:239–252. doi: 10.1111/j.1365-2583.2006.00721.x. [DOI] [PubMed] [Google Scholar]
- Fenn JD, Song H, Cameron SL, Whiting MF. A preliminary mitochondrial genome phylogeny of Orthoptera (Insecta) and approaches to maximizing phylogenetic signal found within mitochondrial genome data. Mol Phylogenet Evol. 2008;49:59–68. doi: 10.1016/j.ympev.2008.07.004. [DOI] [PubMed] [Google Scholar]
- Flook PK, Rowell CHF, Gellissen G. The sequence, organization, and evolution of the Locusta migratoria mitochondrial genome. J Mol Evol. 1995;41:928–941. doi: 10.1007/BF00173173. [DOI] [PubMed] [Google Scholar]
- Gaugel SM, Hawlitschek O, Dey LS, Husemann M. Evolution of mitogenomic gene order in Orthoptera. Insect Mol Biol. 2023;32:387–399. doi: 10.1111/imb.12838. [DOI] [PubMed] [Google Scholar]
- Guindon S, Dufayard JF, Lefort V, Anisimova M, Hordijk W, Gascuel O. New algorithms and methods to estimate maximum-likelihood phylogenies: assessing the performance of PhyML 3.0. Syst Biol. 2010;59:307–321. doi: 10.1093/sysbio/syq010. [DOI] [PubMed] [Google Scholar]
- Jin JJ, Yu WB, Yang JB, Song Y, DePamphilis CW, Yi TS, Li DZ. GetOrganelle: A fast and versatile toolkit for accurate de novo assembly of organelle genomes. Genome Biol. 2020;21:241. doi: 10.1186/s13059-020-02154-5. [DOI] [PMC free article] [PubMed] [Google Scholar]
- Kataoka K, Togawa Y, Sanno R, Asahi T, Yura K. Dissecting cricket genomes for the advancement of entomology and entomophagy. Biophys Rev. 2022;14:75–97. doi: 10.1007/s12551-021-00924-4. [DOI] [PMC free article] [PubMed] [Google Scholar]
- Katoh K, Rozewicki J, Yamada KD. MAFFT online service: Multiple sequence alignment, interactive sequence choice, and visualization. Brief Bioinform. 2019;20:1160–1166. doi: 10.1093/bib/bbx108. [DOI] [PMC free article] [PubMed] [Google Scholar]
- Kim I, Cha SY, Yoon MH, Hwang JS, Lee SM, Sohn HD, Jin BR. The complete nucleotide sequence and gene organization of the mitochondrial genome of the oriental mole cricket, Gryllotalpa orientalis (Orthoptera: Gryllotalpidae) Gene. 2005;353:155–168. doi: 10.1016/j.gene.2005.04.019. [DOI] [PubMed] [Google Scholar]
- Lanfear R, Frandsen PB, Wright AM, Senfeld T, Calcott B. PartitionFinder 2: New methods for selecting partitioned models of evolution for molecular and morphological phylogenetic analyses. Mol Biol Evol. 2017;34:772–773. doi: 10.1093/molbev/msw260. [DOI] [PubMed] [Google Scholar]
- Larson EL, Guilherme Becker C, Bondra ER, Harrison RG. Structure of a mosaic hybrid zone between the field crickets Gryllus firmus and G. pennsylvanicus. Ecol Evol. 2013;3:985–1002. doi: 10.1002/ece3.514. [DOI] [PMC free article] [PubMed] [Google Scholar]
- Ma C, Li J. Comparative analysis of mitochondrial genomes of the superfamily Grylloidea (Insecta, Orthoptera) reveals phylogenetic distribution of gene rearrangements. Int J Biol Macromol. 2018;120:1048–1054. doi: 10.1016/j.ijbiomac.2018.08.181. [DOI] [PubMed] [Google Scholar]
- Ma C, Wang Y, Zhang L, Li J. Mitochondrial genome characterization of the family Trigonidiidae (Orthoptera) reveals novel structural features and nad1 transcript ends. Sci Rep. 2019;9:19092. doi: 10.1038/s41598-019-55740-4. [DOI] [PMC free article] [PubMed] [Google Scholar]
- Maroja LS, Andrés JA, Harrison RG. Genealogical discordance and patterns of introgression and selection across a cricket hybrid zone. Evolution. 2009;63:2999–3015. doi: 10.1111/j.1558-5646.2009.00767.x. [DOI] [PubMed] [Google Scholar]
- Ma Y, Miao Y. Mitogenomic comparison of the mole crickets Gryllotalpidae with the phylogenetic implications (Orthoptera: Ensifera) Insects. 2022;13:919. doi: 10.3390/insects13100919. [DOI] [PMC free article] [PubMed] [Google Scholar]
- Minh BQ, Nguyen MA, von Haeseler A. Ultrafast approximation for phylogenetic bootstrap. Mol Biol Evol. 2013;30:1188–1195. doi: 10.1093/molbev/mst024. [DOI] [PMC free article] [PubMed] [Google Scholar]
- Nachtigall PG, Grazziotin FG, Junqueira-de-Azevedo IL. MITGARD: An automated pipeline for mitochondrial genome assembly in eukaryotic species using RNA-seq data. Brief Bioinform. 2021;22:429. doi: 10.1093/bib/bbaa429. [DOI] [PubMed] [Google Scholar]
- Nei M., Gojobori T. Simple methods for estimating the numbers of synonymous and nonsynonymous nucleotide substitutions. Mol Biol Evol. 1986;3:418–426. doi: 10.1093/oxfordjournals.molbev.a040410. [DOI] [PubMed] [Google Scholar]
- Nguyen LT, Schmidt HA, von Haeseler A, Minh BQ. IQ-TREE: A fast and effective stochastic algorithm for estimating maximum-likelihood phylogenies. Mol Biol Evol. 2015;32:268–274. doi: 10.1093/molbev/msu300. [DOI] [PMC free article] [PubMed] [Google Scholar]
- Perna NT, Kocher TD. Patterns of nucleotide composition at fourfold degenerate sites of animal mitochondrial genomes. J Mol Evol. 1995;41:353–358. doi: 10.1007/BF00186547. [DOI] [PubMed] [Google Scholar]
- Rokas A, Holland PW. Rare genomic changes as a tool for phylogenetics. Trends Ecol Evol. 2000;15:454–459. doi: 10.1016/s0169-5347(00)01967-4. [DOI] [PubMed] [Google Scholar]
- Ronquist F, Teslenko M, Van Der Mark P, Ayres DL, Darling A, Höhna S, Larget B, Liu L, Suchard MA, Huelsenbeck JP. MrBayes 3.2: Efficient Bayesian phylogenetic inference and model choice across a large model space. Syst Biol. 2012;61:539–542. doi: 10.1093/sysbio/sys029. [DOI] [PMC free article] [PubMed] [Google Scholar]
- Sánchez R, Serra F, Tárraga J, Medina I, Carbonell J, Pulido L, Ade María, Capella-Gutíerrez S, Huerta-Cepas J, Gabaldón T, Dopazo J, Dopazo H. Phylemon 2.0: A suite of web-tools for molecular evolution, phylogenetics, phylogenomics and hypotheses testing. Nucleic Acids Res. 2011;39:W470–W474. doi: 10.1093/nar/gkr408. [DOI] [PMC free article] [PubMed] [Google Scholar]
- Sharp PM, Tuohy TM, Mosurski KR. Codon usage in yeast: cluster analysis clearly differentiates highly and lowly expressed genes. Nucleic Acids Res. 1986;14:5125–5143. doi: 10.1093/nar/14.13.5125. [DOI] [PMC free article] [PubMed] [Google Scholar]
- Sheffield NC, Hiatt KD, Valentine MC, Song H, Whiting MF. Mitochondrial genomics in Orthoptera using MOSAS. Mitochondrial DNA. 2010;21:87–104. doi: 10.3109/19401736.2010.500812. [DOI] [PubMed] [Google Scholar]
- Silva AF, Oliveira TDD, Bertocchi NÁ, Valente VLDS, Zefa E, Deprá M. Study of four Neotropical species of tree crickets Oecanthus Serville, 1831 (Orthoptera, Gryllidae) using cytogenetic and molecular markers. Genet Mol Biol. 2022;45:e20210213. doi: 10.1590/1678-4685-GMB-2021-0213. [DOI] [PMC free article] [PubMed] [Google Scholar]
- Song H, Amédégnato C, Cigliano MM, Desutter‐Grandcolas L, Heads SW, Huang Y, Otte D, Whiting MF. 300 million years of diversification: Elucidating the patterns of orthopteran evolution based on comprehensive taxon and gene sampling. Cladistics. 2015;31:621–651. doi: 10.1111/cla.12116. [DOI] [PubMed] [Google Scholar]
- Song N, Li H, Song F, Cai W. Molecular phylogeny of Polyneoptera (Insecta) inferred from expanded mitogenomic data. Sci Rep. 2016;6:36175. doi: 10.1038/srep36175. [DOI] [PMC free article] [PubMed] [Google Scholar]
- Souza-Dias PG, Szinwelski N, Fianco M, Oliveira EC, Mello FA, Zefa E. New species of Endecous (Grylloidea, Phalangopsidae, Luzarinae) from the Iguaçu National Park (Brazil), including bioacoustics, cytogenetic and distribution data. Zootaxa. 2017;4237:4237.3.2. doi: 10.11646/zootaxa.4237.3.2. [DOI] [PubMed] [Google Scholar]
- Stothard P, Grant JR, Van Domselaar G. Visualizing and comparing circular genomes using the CGView family of tools. Brief Bioinform. 2019;20:1576–1582. doi: 10.1093/bib/bbx081. [DOI] [PMC free article] [PubMed] [Google Scholar]
- Subramanian K, Payne B, Feyertag F, Alvarez-Ponce D. The codon statistics database: a database of codon usage bias. Mol Biol Evol. 2022;39:msac157. doi: 10.1093/molbev/msac157. [DOI] [PMC free article] [PubMed] [Google Scholar]
- Tamura K, Stecher G, Kumar S. MEGA11: Molecular Evolutionary Genetics Analysis version 11. Mol Biol Evol. 2021;38:3022–3027. doi: 10.1093/molbev/msab120. [DOI] [PMC free article] [PubMed] [Google Scholar]
- Xia X. DAMBE6: New tools for microbial genomics, phylogenetics, and molecular evolution. J Hered. 2017;108:431–437. doi: 10.1093/jhered/esx033. [DOI] [PMC free article] [PubMed] [Google Scholar]
- Yang J, Dong H, He M, Gao J. Mitochondrial genome characterization of Gryllodes sigillatus (Orthoptera: Gryllidae) and its phylogenetic implications. Mitochondrial DNA B Resour. 2021;6:1056–1058. doi: 10.1080/23802359.2021.1899078. [DOI] [PMC free article] [PubMed] [Google Scholar]
- Yang J, Ren Q, Huang Y. Complete mitochondrial genomes of three crickets (Orthoptera: Gryllidae) and comparative analyses within Ensifera mitogenomes. Zootaxa. 2016;4092:529–547. doi: 10.11646/zootaxa.4092.4.4. [DOI] [PubMed] [Google Scholar]
- Yu Z, Xie H, Liu Y, Li K, He Z. The complete mitochondrial genome of cricket Sclerogryllus punctatus (Orthoptera: Gryllidae) and phylogenetic analysis. J Asia Pac Entomol. 2022;25:101933 [Google Scholar]
- Zefa E, Redu DR, Costa MKMD, Fontanetti CS, Gottschalk MS, Padilha GB, Silva AF, Martins LPD. A new species of Endecous Saussure, 1878 (Orthoptera, Gryllidae) from northeast Brazil with the first X1X20 chromosomal sex system in Gryllidae. Zootaxa. 2014;3847:125–132. doi: 10.11646/zootaxa.3847.1.7. [DOI] [PubMed] [Google Scholar]
- Zhang D, Gao F, Jakovlić I, Zou H, Zhang J, Li WX, Wang GT. PhyloSuite: An integrated and scalable desktop platform for streamlined molecular sequence data management and evolutionary phylogenetics studies. Mol Ecol Resour. 2020;20:348–355. doi: 10.1111/1755-0998.13096. [DOI] [PubMed] [Google Scholar]
- Zhang J, Kan X, Miao G, Hu S, Sun Q, Tian W. qMGR: A new approach for quantifying mitochondrial genome rearrangement. Mitochondrion. 2020;52:20–23. doi: 10.1016/j.mito.2020.02.004. [DOI] [PubMed] [Google Scholar]
- Zhang J, Miao G, Hu S, Sun Q, Ding H, Ji Z, Guo P, Yan S, Wang C, Kan X, Nie L. Quantification and evolution of mitochondrial genome rearrangement in amphibians. BMC Ecol Evol. 2021;21:19. doi: 10.1186/s12862-021-01755-3. [DOI] [PMC free article] [PubMed] [Google Scholar]
- Zhou Z, Zhao L, Liu N, Guo H, Guan B, Di J, Shi F. Towards a higher-level Ensifera phylogeny inferred from mitogenome sequences. Mol Phylogenet Evol. 2017;108:22–33. doi: 10.1016/j.ympev.2017.01.014. [DOI] [PubMed] [Google Scholar]
Internet Resources
- FastQC - Quality control tool for high throughput sequence data. Babraham Bioinformatics; 2019. [20 January 2023]. FastQC - Quality control tool for high throughput sequence data (2019) Babraham Bioinformatics, https://www.bioinformatics.babraham.ac.uk/projects/fastqc/ [Google Scholar]
- National Center of Biotechnology Information (NCBI) Welcome to NCBI. 2023. [19 January 2023]. National Center of Biotechnology Information (NCBI) (2023) Welcome to NCBI, https://www.ncbi.nlm.nih.gov/
- Cigliano MM, Braun H, Eades DC, Otte D. Orthoptera Species File Version 5.0/5.0. 2023. [17 April 2023]. OSF Online. 0, OSF Online, http://Orthoptera.SpeciesFile.org .
- Quantifying Mitochondrial Genome Rearrangement. qMGR; 2023. [15 March 2023]. Quantifying Mitochondrial Genome Rearrangement (2023) qMGR, https://qmgr.hnnu.edu.cn/index.php . [Google Scholar]
Associated Data
This section collects any data citations, data availability statements, or supplementary materials included in this article.