

Abstract
Background
Individuals with schizophrenia spectrum disorders (SSD) often demonstrate cognitive impairments, associated with poor functional outcomes. While neurobiological heterogeneity has posed challenges when examining social cognition in SSD, it provides a unique opportunity to explore brain-behavior relationships. The aim of this study was to investigate the relationship between individual variability in functional connectivity during resting state and the performance of a social task and social and non-social cognition in a large sample of controls and individuals diagnosed with SSD.
Methods
Neuroimaging and behavioral data were analyzed for 193 individuals with SSD and 155 controls (total n = 348). Individual variability was quantified through mean correlational distance (MCD) of functional connectivity between participants; MCD was defined as a global ‘variability score’. Pairwise correlational distance was calculated as 1 – the correlation coefficient between a given pair of participants, and averaging distance from one participant to all other participants provided the mean correlational distance metric. Hierarchical regressions were performed on variability scores derived from resting state and Empathic Accuracy (EA) task functional connectivity data to determine potential predictors (e.g., age, sex, neurocognitive and social cognitive scores) of individual variability.
Results
Group comparison between SSD and controls showed greater SSD MCD during rest (p = 0.00038), while no diagnostic differences were observed during task (p = 0.063). Hierarchical regression analyses demonstrated the persistence of a significant diagnostic effect during rest (p = 0.008), contrasting with its non-significance during the task (p = 0.50), after social cognition was added to the model. Notably, social cognition exhibited significance in both resting state and task conditions (both p = 0.01).
Conclusions
Diagnostic differences were more prevalent during unconstrained resting scans, whereas the task pushed participants into a more common pattern which better emphasized transdiagnostic differences in cognitive abilities. Focusing on variability may provide new opportunities for interventions targeting specific cognitive impairments to improve functional outcomes.
Keywords: Individual variability, Schizophrenia Spectrum Disorders, Heterogeneity, Functional connectivity, Empathic accuracy, Resting state, Social cognition, Neurocognition
1. Introduction
Schizophrenia spectrum disorders (SSD) are characterized by remarkable interindividual variability in clinical symptoms (Tsuang, Lyons, and Faraone 1990), treatment response (Malhotra 2015), prognosis (Huber 1997), and pronounced cognitive and neurobiological heterogeneity (Van Rheenen et al. 2017; Viviano et al. 2018; Hawco et al. 2019). Cognitive deficits represent a core feature of SSD (Mesholam-Gately et al. 2009; Green, Horan, and Lee 2015); they are associated with functional outcomes (Nuechterlein et al. 2008), and with social cognitive impairments mediating the relationship between real-world functioning and neurocognition (Fett et al. 2011; Oliver et al. 2019; Schmidt, Mueller, and Roder 2011). Most studies thus far have treated variability as noise, and our understanding of the neurobiology of SSD has been constrained by case-control study designs that fail to consider within-group heterogeneity (Carruthers et al. 2019). However, individual variability is an important by-product of meaningful individual differences (MacDonald, Nyberg, and Bäckman 2006; Van Horn, Grafton, and Miller 2008).
Recently, our group has examined individual variability of brain activation (Hawco et al. 2020; Gallucci, Tan, et al. 2022; Gallucci, Pomarol-Clotet, et al. 2022). Individuals with SSD have exhibited greater overall individual variability than typically developing controls (TDC) in functional brain activity during cognitive tasks, with more idiosyncratic patterns related to illness duration (Gallucci, Pomarol-Clotet, et al. 2022; Gallucci, Tan, et al. 2022). The range and heterogeneity of behavior and neural circuit activation in SSD frequently exhibits overlap with behavior and activation patterns observed in TDC and may account for the inconsistencies in case-control findings (Oliver et al. 2021; Hawco et al. 2019). Previous findings have shown individuals with SSD make use of the same neural networks as TDC but generally, though not always, fall into the ‘poor performing’ side of the spectrum (Sheffield et al. 2017; Oliver et al. 2021). Examining cases and controls with a dimensional as opposed to categorical approach may lead to important insights into common and distinct neural circuits and better consider heterogeneity in clinical samples (Hajdúk et al. 2018; Hawco et al. 2019; Gallucci, Tan, et al. 2022).
Individual brains are characterized by underlying intrinsic functional connectivity profiles that are unique to the individual (Finn et al. 2015). Functional brain systems are defined by this underlying network architecture (Yeo et al. 2011; Ji et al. 2019), which is modified as necessary in response to cognitive demands (Cole et al. 2014; Mennes et al. 2010). While the majority of the literature on functional connectivity has focused on ‘task-free’ resting state fMRI (Smith et al. 2013; Yang, Gohel, and Vachha 2020), examining connectivity during task states provides additional information on the relationship between connectivity and cognition (Cole et al. 2021; Finn and Bandettini 2021; Stevens 2016; Gratton et al. 2018; Ito et al. 2020). A prior study from our group has shown that participants with SSDs fall along a similar spectrum as controls in network connectivity during a social cognitive task (Oliver et al. 2021), while another found that resting state connectivity may be more predictive of social and non-social cognitive outcomes than task-based connectivity (Viviano et al. 2018). This suggests task and resting state connectivity may provide different information regarding the relationship between cognition, functional networks, and diagnostic groups (Finn 2021).
The Empathic Accuracy (EA) task is a naturalistic social task (Kern et al. 2013; Olbert et al. 2013; Zaki et al. 2009) that probes both higher-level social cognition (“mentalizing”) and lower-level social cognition (“simulation”). EA task performance has been shown to be behaviourally and neurally impaired in SSD compared to controls (Harvey et al. 2013). The naturalistic EA task is specifically well suited for background connectivity analysis, which involves removing the stimulus-evoked response and focusing on residual activation (Al-Aidroos, Said, and Turk-Browne 2012; Norman-Haignere et al. 2012; Oliver et al. 2021). This approach provides better discrimination of individual variability as it pertains to state-related functional connectivity versus stimulus-driven coactivation.
The aim of this study was to investigate the relationship between individual variability in functional connectivity during resting state and EA task performance and social and non-social cognition in a large sample of TDC and individuals diagnosed with SSD. We hypothesised that individuals with SSD would display greater heterogeneity in functional connectivity than TDC, and that worse cognitive performance would be associated with greater individual variability (Gallucci, Tan, et al. 2022). The EA task will capture variability that pertains to higher-level social cognitive circuitry, while the resting state will represent more unconstrained functional connectivity variability. We used hierarchical regression analysis to examine predictors of individual variability (e.g., age, sex, diagnostic group, and neurocognitive and social cognitive scores) dimensionally across individuals with SSD and TDC.
2. Methods and Materials
2.1. Participants
Previously collected data was analyzed from the National Institute of Mental Health (NIMH)-funded “Social Processes Initiative in the Neurobiology of Schizophrenia(s) (SPINS)” multicenter study, which, in the context of the Research Domain Criteria (RDoC) framework, investigates the clinical, behavioral, and neural correlates of social cognition in SSD (Viviano et al. 2018; Oliver et al. 2021; Hawco et al. 2019). Recruitment occurred at three sites: the Centre for Addiction and Mental Health (Toronto), Zucker Hillside Hospital (New York), and the Maryland Psychiatric Research Center (Maryland) from 2014 to 2020. Participants with SSD met DSM-5 criteria for schizophrenia, schizoaffective disorder, schizophreniform disorder, delusional disorder, or psychotic disorder not otherwise specified, assessed using the Structured Clinical Interview for DSM-IV-TR (First et al. 2002). Information regarding participant medication was collected, and chlorpromazine (CPZ) equivalents were calculated for the SSD group (Leucht et al. 2016). Individuals with SSD were symptomatically stable, and had no change in antipsychotic medication or decrement in functioning/support level during the 30 days prior to enrollment. TDC did not have a current or past Axis I psychiatric disorder, excepting adjustment disorder, phobic disorder, and past major depressive disorder (over two years prior; presently unmedicated), or a first degree relative with a history of psychotic mental disorder. Additional exclusion criteria included a history of head trauma resulting in unconsciousness, a substance use disorder (confirmed by urine toxicology screening), intellectual disability, debilitating or unstable medical illness, or other neurological diseases. All participants provided written informed consent and the protocol was approved by the respective research ethics and institutional review boards. All research was conducted in accordance with the Declaration of Helsinki.
2.2. Clinical and Behavioral Assessments
Psychiatric symptoms were evaluated in the SSD sample using the Brief Psychiatric Rating Scale (BPRS; (Overall and Gorham 1962)) and an adapted version of the Scale for the Assessment of Negative Symptoms (SANS; (Buchanan et al. 2007; Andreasen 1982)). The Birchwood Social Functioning Scale (BSFS; (Birchwood et al. 1990)) was administered to evaluate social functioning (omitting Employment) and the Wechsler Test of Adult Reading (WTAR; (Wechsler 2001)) as a measure of premorbid IQ.
Cognitive assessments consisted of social cognitive measures and a neurocognitive battery. Out-of-scanner social cognitive measures included the Penn Emotion Recognition Test (ER40; (Kohler et al. 2000)), the Reading the Mind in the Eyes Test (RMET; (Baron-Cohen et al. 2001)), and the Awareness of Social Inference Test–Revised (TASIT), parts 1, 2, and 3 (McDonald, Flanagan, and Rollins 2011). A ‘mentalizing’ factor score representing higher level social cognition (e.g., sarcasm detection, theory of mind) was computed as previously described (Oliver et al. 2019), from subscales of the TASIT; specifically the TASIT 2 simple sarcasm, TASIT 2 paradoxical sarcasm, and TASIT 3 sarcasm scores. While this factor analysis also identified a lower level ‘simulation’ factor, the two factors were highly correlated, and mentalizing is preferentially associated with functional outcomes and negative symptoms (Oliver et al. 2019). Thus, only the mentalizing factor score was utilized in this study. Mentalizing refers to the cognitive ability of ascribing mental states, such as thoughts, beliefs, and intentions, to individuals (Schurz et al. 2014). Impairments in mentalizing remain a notable and enduring symptom in schizophrenia, persisting even among patients in remission, hinting at its potential as a trait marker (Bora, Yucel, and Pantelis 2009).
The self-report empathic concern subscale of the Interpersonal Reactivity Index (IRI; (Davis 1983)) was also included as a metric for emotional empathy, which is distinct from cognitive empathy captured by the mentalizing score (Davis 1983; Shamay-Tsoory, Aharon-Peretz, and Perry 2009). Finally, neurocognition was assessed using the Measurement and Treatment Research to Improve Cognition in Schizophrenia (MATRICS) Consensus Cognitive Battery (MCCB, (Nuechterlein et al. 2008)).
2.3. Empathic Accuracy (EA) Task
The EA task (Zaki et al. 2009) was completed during fMRI (Kern et al. 2013; Olbert et al. 2013). Participants watched 9 short videos (average length = 2.05 min, range 2.00 to 2.50 mins), presented in three runs. During each video, actors describe autobiographical events with a range of emotional valence while the participants provide continuous ratings of how positive or negative the individuals in the video are feeling (ranging from 1 (very negative) to 9 (very positive) using a button box). An EA score was calculated for each participant by correlating their ratings with self-ratings provided by the actors in the videos, providing a measure of interpersonal understanding (Zaki et al. 2009). A control condition was presented between videos, twice per run (40 s each), in which participants provide continuous ratings of the relative light or darkness of a grayscale circle as it changes shades. This was included to ensure that participants are engaged in the task and comprehend it. See the Supplement for additional details.
2.4. MRI Data Acquisition
Scanning was conducted using harmonised scanning parameters on six 3T scanners (see Supplementary Material). The EA task was part of a longer multimodal MRI protocol, as previously described (Viviano et al. 2018). Three EA fMRI runs were acquired using an echo-planar imaging (EPI) sequence (TR = 2000 ms, TE = 30 ms, flip angle = 77°, field of view = 218 mm, in-plane resolution = 3.4 mm2, slice thickness = 4 mm). One seven-minute resting state scan was acquired using an accelerated EPI sequence (TR = 2000 ms, TE = 30 ms, flip angle = 77°, field of view = 200 mm, in-plane resolution = 3.125 mm2, slice thickness = 4 mm, no slice gap) where participants were instructed to let their mind wander with their eyes closed for the duration of the scan. Anatomical T1-weighted scans were collected using a fast-gradient sequence (CMH and ZHH used a BRAVO sequence in sagittal plane with TR = 6.4/6.7 ms, TE = 2.8/3 ms, flip angle = 8°, voxel-size =0.9 mm; CMP, MRC, MRP and ZHP used a MPRAGE sequence in sagittal plane with TR =2300 ms, TE = 2.9 ms, flip angle = 9°, voxel-size = 0.9mm) for use in the preprocessing pipeline.
All scans underwent quality control using an in-house quality control system dashboard (https://github.com/TIGRLab/dashboard). Participants were excluded for excessive motion (average framewise displacement (FD) > 0.5 mm) and EA or control task performance indicative of disengagement or a lack of comprehension (see Figure 2 and Supplementary Material).
Figure 2. Stepwise Depiction of Mean Correlational Distance Analysis:

1) Timeseries data is extracted from parcellated brains, including 360 cortical and 32 subcortical ROIs for each participant. Functional connectivity matrices are constructed for 392 regions by calculating the Pearson correlation of all regional timeseries values. 2) Median absolute deviation is used as a dimensionality reduction method to identify the top 10% most variable connections. 3) The upper triangle of the matrix is selected. 4) The upper triangle connectivity values are extracted, vectorized, and stored in a subject by connectivity value dataframe (N participants x N connectivity values). 5) Pairwise correlational distance is calculated across all individuals, expressed as 1 - correlation coefficient. 6) Finally, mean correlation distance values are calculated by averaging each subjects pairwise correlational distance across the matrix rows.
2.5. fMRI Preprocessing
Scans were preprocessed using fMRIPrep 1.5.8 (Esteban et al. 2019), based on Nipype 1.4.1 (K. J. Gorgolewski et al. 2018). Full details of the preprocessing pipeline are presented in the supplemental materials. In brief, fMRI data underwent fieldmapless distortion correction, were realigned for motion, and slice time corrected. Data was then registered to the cortical surface in the Human Connectome CIFTI space by coregistering to the T1 scan following tissue segmentation in freesurfer and nonlinear registration (Dickie et al. 2019). Scans were surface smoothed at 2mm. For both resting state and EA data, the nuisance regression model included regressors for the six head motion correction parameters, mean white matter signal, mean cerebral spinal fluid signal, the square, derivative, and square of the derivative for each of these regressors, and global brain signal (generated by fMRIPrep) (Muschelli et al. 2014; Satterthwaite et al. 2013). For the EA task, an amplitude-modulated general linear model was performed using AFNI’s 3dDeconvolve module in Nipype (Abraham et al. 2014; Cox and Hyde 1997; K. Gorgolewski et al. 2011). To model the stimulus-evoked response, the regressors were fit to each voxel and the residual activation was retained for background connectivity analysis (see Supplementary Material; (Oliver et al. 2021; Al-Aidroos, Said, and Turk-Browne 2012)). Background connectivity allows an examination of state-related connectivity rather than stimulus-driven coactivation (Al-Aidroos, Said, and Turk-Browne 2012; Norman-Haignere et al. 2012).
2.6. Connectivity Matrix Construction
The average time series was extracted from MNI-space fMRI data using the 360 cortical region surface based Multimodal Parcellation (MMP) 1.0 atlas (Glasser et al. 2016; Ji et al. 2019). The Melbourne Subcortex Atlas (Scale II) (Tian et al. 2020) was used to extract 32 subcortical regions. A mean time series was extracted for each of the 392 regions for both resting state and EA residual data. Only time points during the EA videos were retained. Functional connectivity matrices for each participant were generated by calculating a Fisher z transform of the Pearson correlation coefficients between each pair of regions to generate a 392 × 392 connectivity matrix, separately for rest and EA.
2.7. Dimensionality Reduction
Data was analyzed using RStudio v1.4.1717. The dimensionality reduction was used for both resting state and EA task fMRI data. To address the motion confound in the EA task, edge-wise correlations with FD were calculated and connectivity values that had a correlation of greater than ± 0.30 with FD were removed from the analysis (10,454 edges removed). This allowed the motion effects to be thoroughly removed from the EA task data while preserving relationships with other behavioral variables (see Supplementary table S1). This step was not performed for the resting state data as no connectivity values had a correlation of greater than ± 0.30 with FD. The upper triangle of each matrix was extracted and vectorized to provide 76,636 unique connectivity values per participant for resting state and 66,182 connectivity values per participant for the EA task. Since we were interested in investigating individual variability, our analysis of connectivity data was limited to the top ten percent of most variable connections (Xia et al. 2018). This was measured by median absolute deviation (MAD), which has been proven to be more robust against outliers than standard deviation (Xia et al. 2018). MAD was used for dimensionality reduction (see Supplementary Figure S1); the final input data consisted of 7664 unique connections for rest and 6618 connections for the EA task (Figure 1).
Figure 1. Matrix Dimensionality Reduction:

Representative examples of connectivity feature selection using median absolute deviation, defined as the median of the difference between each element and the median in a vector. From the full connectivity matrix (left image), the top 10% (7664 for resting state; 6618 for EA task) of connectivity features that were the most variable across the sample were selected as a data reduction method (right matrix), and used for further analysis.
2.8. Individual Variability in Connectivity via Correlational Distance
The described approach was used for both resting state and EA task fMRI data, as depicted in Figure 2. Each participant’s connectivity values were combined into a matrix (Resting state = participants x 7664 connectivity values; EA task = participants x 6618 connectivity values). Harmonisation of multi-site imaging data was accomplished using the neuroCombat package in RStudio, to account for scanner effects using an empirical Bayes framework (Johnson, Li, and Rabinovic 2007; Fortin et al. 2018; Yu et al. 2018). Age, sex, diagnostic group, framewise displacement, and clinical and behavioral scores were included in a design matrix specifying covariates, to ensure that variance related to those measures was preserved during data harmonization. A correlational distance matrix was generated, measuring the dissimilarity in connectivity across each pair of participants. The mean pairwise correlation distance for each participant to all other participants represents individual variability - a single value used as a metric to evaluate how similar or different each participant is compared to the entire group. Lower mean correlational distances indicated participants with connectivity patterns that were more similar to the overall group, and higher mean correlational distances indicated more idiosyncratic connectivity (Hawco et al. 2020; Gallucci, Tan, et al. 2022). Each participant in the study received mean correlational distance values for their EA task background connectivity and for their resting state functional connectivity. A Wilcoxon rank-sum test between SSD and TDC was performed to compare mean correlational distance across groups for both resting state and EA task mean correlational distance. Additionally, a Wilcoxon signed-rank test between each participant’s mean correlational distance values was run to determine if participants displayed different individual variability during the EA task when compared to the same participants at rest.
2.9. Hierarchical Regression Analysis
Hierarchical regression analysis was conducted separately for resting state and EA task individual variability. Hierarchical regression analyses were conducted to examine predictors of individual variability for resting state connectivity and EA background connectivity. Six blocks of independent variables were entered subsequently into seven regression models. A 10-fold cross validation was performed to evaluate the performance of our final predictive model to assess the model’s predictive accuracy and generalizability in capturing the underlying patterns in the individual variability. The observed R2 was compared against a null distribution generated by permuting the target and predictor variable labels 1000 times, and fitting the model on the permuted data. We conducted an analysis involving two sets of models with varying orders for entering diagnostic information. Initially, we employed a hierarchical regression where diagnosis was included early in the model with minimal covariates. This aimed to assess the significance of diagnosis while minimizing the influence of other variables. Subsequently, we explored models in which diagnosis was introduced after cognitive and functional outcome variables. This was done to evaluate whether any residual effects of diagnosis remained once cognition was accounted for. The original model included the covariates of age, sex, average FD, and MRI scanner. The second model examined diagnosis, and the third model included a mentalizing factor score (Oliver et al. 2019). Model four added emotional empathy (the IRI empathic concern), model five added the MCCB composite score (Nuechterlein et al. 2008; Keefe et al. 2011), and model six examined functional outcome via subscores of the BSFS. The final model seven added interaction terms, age*sex, age*diagnosis, diagnosis*mentalizing, diagnosis*sex, and mentalizing*sex. We then repeated these hierarchical regressions, entering diagnosis after BSFS scores, but prior to interactions. Examining the change in adjusted-R2 statistics between models depicted the amount of variance contributed between steps, accounting for the increased number of variables included in subsequent models. ANOVAs were run between each model to determine if the added factors explained significantly more variance in the dependent variable (mean correlational distance).
Two additional hierarchical regression analyses were conducted using only the SSD sample (n = 193) to examine the effects of antipsychotics (CPZ equivalents; (Leucht et al. 2016)), negative symptoms (SANS) and positive symptoms (BPRS) on individual variability, in addition to the independent variables considered in the two previous hierarchical regressions. All independent variables were entered subsequently into ten regression models that were corresponding to ten blocks of independent variables.
2.10. Division of Sample Based on Task Performance and Permutation Testing
A post-hoc analysis was performed using group-based comparisons to examine variability in network connectivity profiles between poor versus good social cognitive and neurocognitive performers, as well between SSD and TDC. The top 33% of mentalizing performers were assigned to the “good mentalizing performers” (total n = 116; SSD = 33, TDC = 83) and the bottom 33% were assigned to the “poor mentalizing performers” (total n = 116; SSD = 98, 18 TDC). This was replicated for neurocognitive performance, whereby participants were grouped based on their MCCB composite score (good neurocognitive performers = 26 SSD, 90 TDC, total n = 116; poor neurocognitive performers = 95 SSD, 21 TDC, total n = 116). Given that we observed a strong effect of mentalizing on variability in the EA background connectivity, and neurocognition on resting state connectivity variability, mentalizing score and MCCB composite score were chosen to assess differences in network connectivity variability related to social and non-social cognition.
To assess the statistical significance in variability differences between poor and good social cognitive/neurocognitive performers and diagnosis, permutation tests were used to identify areas of significant between- and within-network variability for the EA task and resting state. Networks were defined according to the Cole-Anticevic functional network organization (Ji et al. 2019). Across 1000 permutations, participants were randomly assigned to two groups, the top 10% most variable connections were recomputed, and standard deviation (SD) of surviving connections within and between each network were calculated. A null distribution for SD differences was created as the difference between these two randomly permuted groups across permutations. The variability differences of good and poor performers were compared to the null distribution of variability differences to generate p-values for between- and within-network variability corrected for multiple comparisons using false discovery rate (FDR).
2.11. Code Sharing
Code used in the analysis of this dataset has been made available (https://github.com/tsecara/Predictors_of_Individual_Variability_SSD)
3. Results
3.1. Participant Inclusion and Characteristics
Data from 193 individuals with SSD and 155 TDC (total n = 348) were included from the SPINS study (Figure 3). Participant demographics and clinical characteristics, as well as social cognitive factor scores, are shown in Table 1.
Figure 3. Consort Flow Diagram:

Participant data was evaluated for eligibility based on a quality-control (QC) criteria. The initial data from 180 TDC and 286 SSD (n = 466) participants were assessed for available MRI data; 25 participants were excluded. Following, data was controlled for excessive motion and resting state and EA task QC criteria; 87 participants were excluded. Lastly, data was assessed for cognitive score availability; 8 participants were excluded. The resulting data from 155 TDC, 193 SSD individuals EA task data, and 191 SSD individuals with RS data were included for analysis.
Table 1.
Participant Demographic and Clinical Characteristics by Diagnostic Group
| Group | SSD (n=193) | TDC (n=155) | P-value |
|---|---|---|---|
|
| |||
| Age (years) | 31.4 (9.6) [18.0, 55.0] | 32.4 (10.6) [18.0, 55.0] | 0.369 |
| Sex | 131M (67.9%) | 82M (52.9%) | 0.00618 ** |
| Education (years) | 13.8 (2.1) | 15.9 (2.0) | < 2.2e-16 *** |
| Motion (FD) | 0.169 (0.094) | 0.138 (0.067) | 0.000361*** |
| WTAR (standard score) | 107.30 (14.31) | 113.50 (11.20) | 7.53e-06 *** |
| BSFS Score | |||
| Social engagement/withdrawal | 10.63 (2.33) | 12.50 (1.85) | 1.877e-15 *** |
| Interpersonal | 19.19 (5.35) | 24.78 (3.00) | < 2.2e-16 *** |
| Independence – compliance | 18.09 (10.46) | 32.89 (10.49) | < 2.2e-16 *** |
| Independence – performance | 20.08 (6.58) | 25.55 (7.11) | 1.426e-12 *** |
| Recreation | 28.26 (5.20) | 32.35 (4.19) | 8.575e-15 *** |
| Pro-social | 36.16 (3.14) | 38.35 (1.32) | < 2.2e-16 *** |
| BPRS Score | |||
| Positive symptoms | 7.86 (3.93) | - | - |
| Anxiety and depression | 7.74 (3.53) | - | - |
| Total Score | 31.29 (7.93) | - | - |
| SANS Score | |||
| Affective Flattening | 8.44 (6.02) | - | - |
| Alogia | 1.45 (1.83) | - | - |
| Avolition apathy | 8.57 (5.08) | - | - |
| Anhedonia asociality | 6.70 (4.21) | - | - |
| Total Score | 25.08 (12.55) | - | - |
| CPZ Equivalents (mg/day) | 459.10 (397.29) | - | - |
| MCCB Score | |||
| Processing Speed | 40.49 (12.70) | 53.37 (12.71) | < 2.2e-16 *** |
| Attention Vigilance | 39.97 (11.11) | 48.16 (12.14) | 3.214e-10 *** |
| Working Memory | 41.84 (11.18) | 49.61 (11.33) | 5.515e-10 *** |
| Verbal Learning | 41.36 (8.95) | 50.68 (9.23) | < 2.2e-16 *** |
| Visual Learning | 39.98 (12.05) | 48.95 (9.53) | 1.046e-13 *** |
| Reasoning and Problem Solving | 43.83 (10.94) | 48.98 (9.33) | 3.211e-06 *** |
| Total Score | 36.59 (12.19) | 50.12 (10.91) | < 2.2e-16 *** |
| Scog IRI – Empathic Concern Score | 20.64 (4.96) | 21.37 (3.86) | 0.126 |
| Lower-Level Social Cognitive Score (simulation) | −0.342 (0.86) | 0.378 (0.65) | < 2.2e-16 *** |
| Higher-Level Social Cognitive Score (mentalizing) | −0.381 (0.88) | 0.462 (0.62) | < 2.2e-16 *** |
Note. Where appropriate variables are displayed as Mean (Standard Deviation). Range presented in square brackets. WTAR= Wechsler Test of Adult Reading, BSFS= Birchwood Social Functioning Score, BPRS= Brief Psychiatric Rating Scale, SANS= Scale for the Assessment of Negative Symptoms, CPZ= Chlorpromazine, MCCB= MATRICS Consensus Cognitive Battery, Scog IRI = Interpersonal Reactivity Index, FD = framewise displacement
p < 0.05
p < 0.01
p < 0.001
3.2. Variability in Network Connectivity
In order to visualise the spatial pattern of regions retained in the analysis, connectivity strength from each region for all retained connections was plotted on the cortical surface parcellated regions, separately for positive and negative connections (Figure 4). The twelve Cole-Anticevic resting-state networks (Ji et al. 2019) were used to identify networks most contributing to the included data. For the EA task, the networks contributing the most to positive background connectivity variability are the default mode, frontoparietal, cingulo-opercular and visual networks (Fig. 4A). For resting state, the visual, default mode and frontoparietal networks display the most variable positive functional connectivity (Fig. 4B). Both the EA task and resting state show similar variability in negative connectivity, with regions overlapping with the cingulo-opercular and default mode being the most implicated (Fig. 4A & Fig. 4B).
Figure 4. Most Variable Regions of Connectivity:
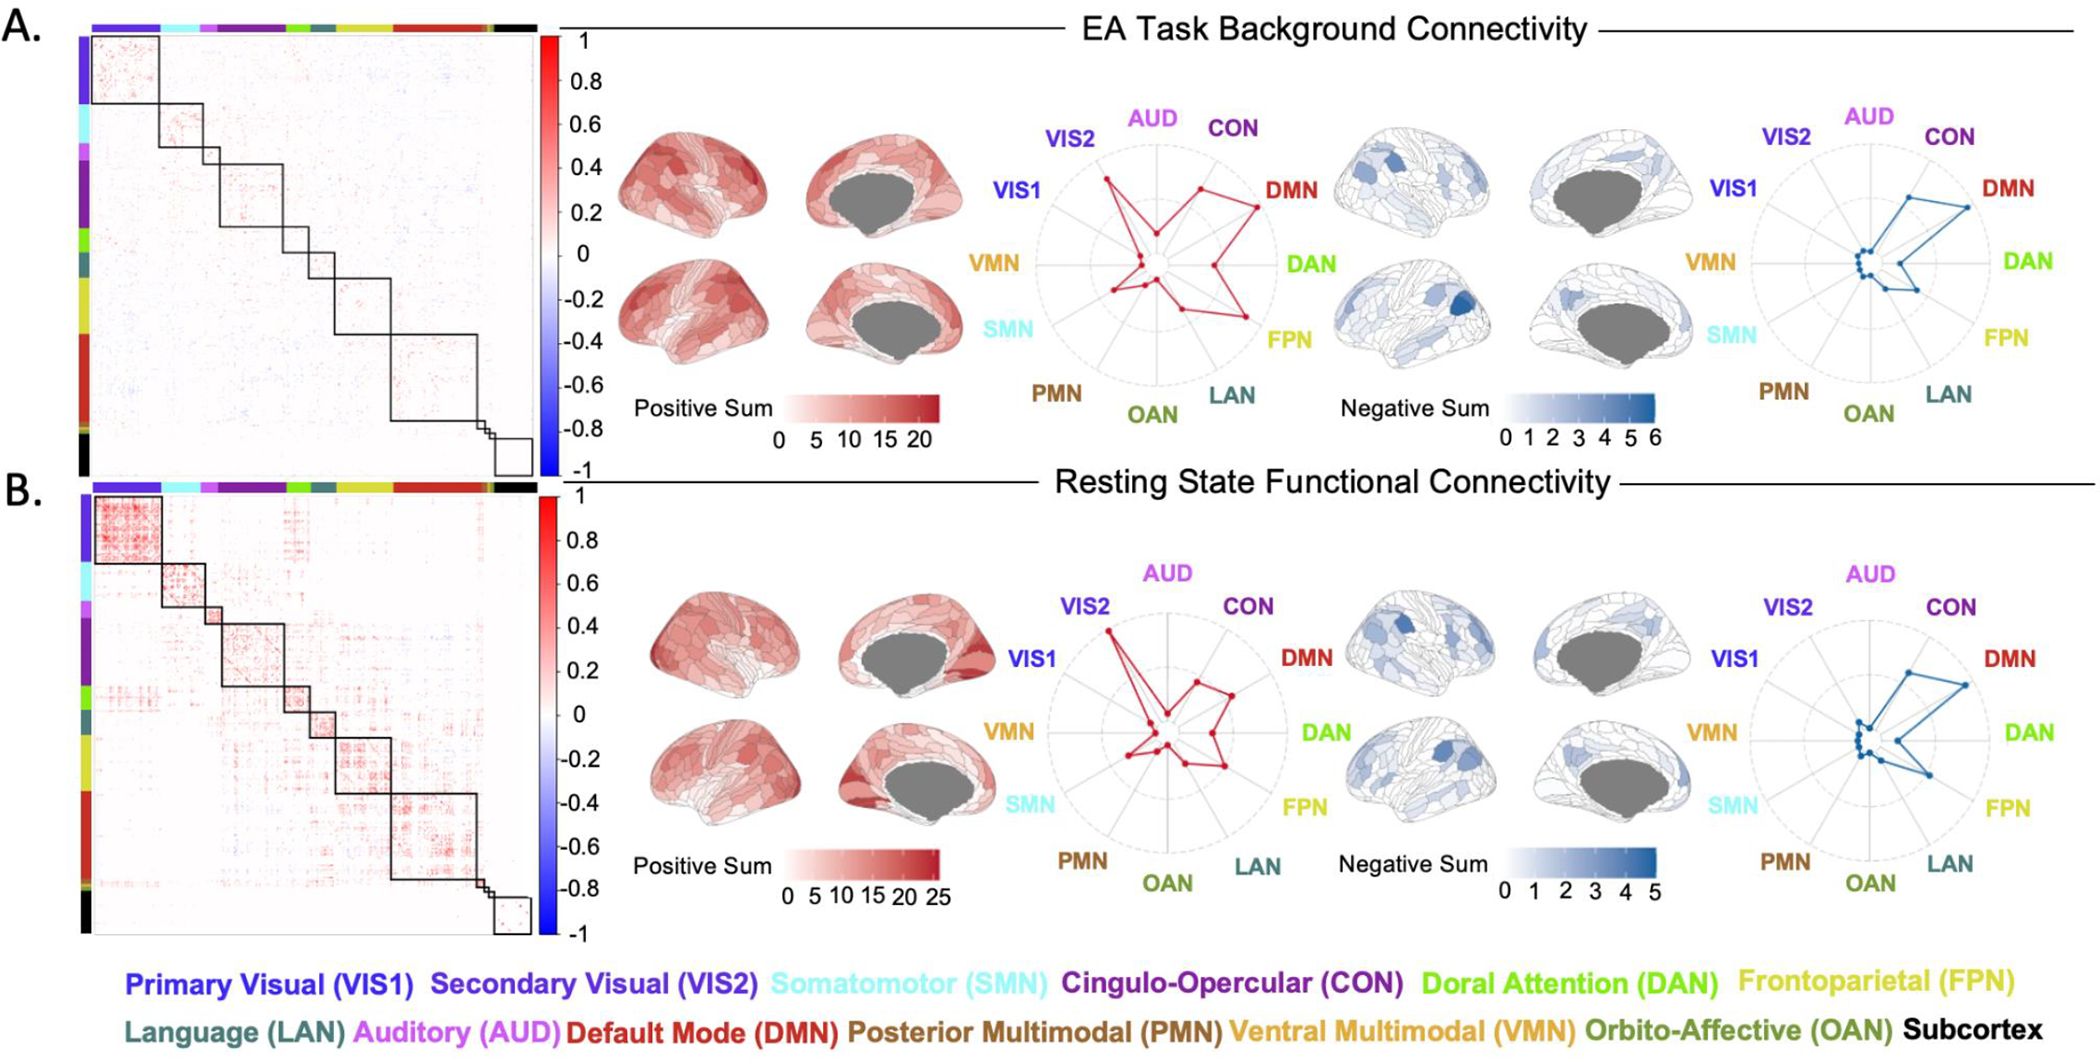
A) Background connectivity matrix depicting the top 10% of most variable connections for EA task. Brain visualisations and radar plots depicting the connectivity strength of each network with other retained brain regions, displaying contributions to positive and negative connectivity. B) Functional connectivity matrix depicting the top 10% of most variable connections during resting state. Brain visualisations and radar plots depicting the connectivity strength of each network with other retained brain regions, displaying contributions to positive and negative connectivity.
3.3. Resting State and EA Task Correlational Distance
Individual correlational distances are plotted in Fig. 5A & 5B. Mean correlational distance of EA task background brain connectivity across SSD (0.5060 ± 0.0042) was not significantly different than TDC (0.5026 ± 0.0040) (Fig. 5C; W = 16691, p = 0.063, Cohen’s d = 0.24). This finding differed from the resting state data, where mean correlational distance of brain connectivity across SSD (0.5483 ± 0.0019) was significantly higher than TDC (0.5431 ± 0.0018) (Fig. 5D; W = 18091, p = 0.00038, Cohen’s d = 0.41). Plotting the distribution of mean correlational distance (Fig. 5C & 5D) suggests that SSD and TDC share a substantially overlapping range of mean correlational distance. Mean correlational distance was also significantly lower in EA than in rest (Wilcoxon signed-rank test; V = 10, p = <2.2e-16), demonstrating participants entered into a more similar connectivity pattern while performing the EA task. Additionally, the relationship between mean correlational distance and DSM-5 diagnosis of schizophrenia, schizophreniform disorder, schizoaffective disorder, and psychotic disorder not otherwise specified was visualized during EA task and rest (See Supplementary Figure S2).
Figure 5. Correlational distance across participants:

A&B) Pairwise correlational distance between participant pairs was calculated (each row/column represents a single participant, with TDC on the top/left and SSD on the bottom/right). Participants were ordered by mean distance, with TDC in descending and SSD in ascending order, positioning those with the lowest mean distance in the centre of the graph. C&D) Violin plots demonstrate between-group differences in mean correlational distance.
3.4. Hierarchical Regression Analysis
3.4.1. EA Task
Model 1 included age, sex, average FD, and scanner. These predictors collectively account for 11.58% (adjusted R2 = 0.1158) of the variance observed in mean correlational distance (Table 2). Model 2 (diagnostic group) was significant, accounting for an additional 0.95% of variance (adjusted R2 = 0.1253, p = 0.031), and Model 3 (mentalizing score) significantly explains an additional 1.44% (adjusted R2 = 0.1397, p = 0.010) variance. Model 3 demonstrated that mentalizing (p = 0.016) better accounts for the variability; diagnosis was no longer significant (p = 0.50) when mentalizing was added to the model. Model 4 (IRI empathic concern) is significant and accounts for an additional 1.16% of variance (adjusted R2 = 0.1513, p = 0.019). Model 5 (MCCB composite score) and Model 6 (functional outcome scores) did not account for any additional statistically significant variance and was therefore not significant. Model 7 includes interaction terms which account for an additional 1.30% (adjusted R2 = 0.1661, p = 0.075), and the final model explains 16.61% of variance in mean correlational distance. Similar results were found in the alternative model with diagnosis added later, after BFSF (Supplemental Table S2). In the final model (Table 2 & Supplemental Table S3), age (F(1, 324) = 10.29, β = 0.00016, p = 0.0015), average framewise displacement (F(1, 324) = 5.12, β = 0.022, p = 0.024), IRI empathic concern (Fig.6A; F(1, 324) =3.94, β =0.00033, p = 0.048) and an age by sex interaction term (Fig.6B; F(1, 324) = 4.31, β = −0.00031, p = 0.039) are the only predictor variables that remain significant. The cross-validation results for the final model yielded an R2 of 0.132 and an RMSE of 0.0132. The observed R2 was significant relative to the permuted null distribution (See Supplemental Figure S3A; p < 0.001).
Table 2:
Hierarchical Regression Analysis for EA Task
| Model 1 | Model 2 | Model 3 | Model 4 | Model 5 | Model 6 | Model 7 | |||||||||
|---|---|---|---|---|---|---|---|---|---|---|---|---|---|---|---|
| Diagnosis | Higher-level Social Cognition | Emotional Empathy | Neurocognition | Functional Outcome | Interaction Terms | ||||||||||
|
| |||||||||||||||
| t | P | t | P | t | P | t | P | t | P | t | P | t | P | ||
|
| |||||||||||||||
| Age | 4.273 | 2.504C-05 | 4.453 | 1.152e-05 | 4.453 | 9.83e-05 | 3.767 | 0.000195 | 3.824 | 0.000157 | 3.347 | 0.000912 | 1.099 | 0.00147 | Age |
| Sex | 0.311 | 0.756 | 0.016 | 0.987 | 0.016 | 0.934 | 0.678 | 0.498 | 0.670 | 0.503 | 0.450 | 0.653 | −2.032 | 0.555 | Sex |
| Average FD | 3.018 | 0.00274 | 2.433 | 0.0155 | 2.433 | 0.0264 | 4.458 | 0.0354 | 2.012 | 0.0450 | 2.035 | 0.0426 | 2.263 | 0.0243 | Average FD |
| Scanner * | 1.255 | 0.283 | 1.400 | 0.224 | 1.371 | 0.235 | 1.620 | 0.154 | 1.657 | 0.144 | 1.739 | 0.125 | 1.674 | 0.140 | Scanner * |
|
|
|||||||||||||||
| Diagnosis | −2.166 | 0.0310 | −0.673 | 0.501 | −0.611 | 0.541 | −0.248 | 0.804 | −0.492 | 0.623 | 0.341 | 0.693 | Diagnosis | ||
|
|
|||||||||||||||
| Mentalizing | −2.579 | 0.01032 | −2.921 | 0.00372 | −2.065 | 0.0397 | −1.717 | 0.0869 | −1.769 | 0.152 | Mentalizing | ||||
|
|
|||||||||||||||
| IRI Empathic Concern | 2.363 | 0.0187 | 2.418 | 0.0162 | 2.175 | 0.0303 | 1.985 | 0.048 | IRI Empathic Concern | ||||||
|
|
|||||||||||||||
| MCCB Composite Score | −1.165 | 0.245 | −1.325 | 0.186 | 1.985 | 0.147 | MCCB Composite Score | ||||||||
|
|
|||||||||||||||
| BSFS 1 | −0.265 | 0.791 | −0.059 | 0.953 | BSFS 1 | ||||||||||
| BSFS2 | −1.149 | 0.251 | −1.157 | 0.248 | BSFS 2 | ||||||||||
| BSFS 3 | 1.500 | 0.135 | 1.435 | 0.152 | BSFS 3 | ||||||||||
| BSFS 4 | −1.274 | 0.203 | −0.801 | 0.424 | BSFS 4 | ||||||||||
| BSFS 5 | 1.641 | 0.102 | 1.355 | 0.176 | BSFS 5 | ||||||||||
| BSFS 6 | −0.601 | 0.549 | −0.870 | 0.385 | BSFS 6 | ||||||||||
|
|
|||||||||||||||
| Age*Sex | 2.077 | 0.0386 | Age*Sex | ||||||||||||
| Age*Diagnosis | −0.952 | 0.342 | Age*Diagnosis | ||||||||||||
| Diagnosis*Mentalizing | −0.106 | 0.916 | Diagnosis*Mentalizing | ||||||||||||
| Diagnosis*Sex | 0.771 | 0.441 | Diagnosis*Sex | ||||||||||||
| Ment alizing*Sex | 1.429 | 0.154 | Mentalizing*Sex | ||||||||||||
|
| |||||||||||||||
| Adjusted R2 | 0.1158 | 0.1253 | 0.1397 | 0.1513 | 0.1522 | 0.1531 | 0.1661 | ||||||||
| Adjusted ΔR2 | - | 0.0095 | 0.0144 | 0.0116 | 0.0009 | 0.009 | 0.013 | ||||||||
| Model Significance ** | - | 0.03099 | 0.01032 | 0.01872 | 0.2449 | 0.3863 | 0.07452 | ||||||||
FD= framewise displacement, MCCB= MATRICS Consensus Cognitive Battery, BSFS= Birchwood Social Functioning Score, BSFS 1= Social Engagement/Withdrawal, BSFS 2= Interpersonal, BSFS 3= Independence - compliance, BSFS 4= Independence – performance, BSFS 5= Recreation, BSFS 6= Pro-social, IRI = Social Cognitive Interpersonal Reactivity Index,
Scanner= coded as a factor, reporting the F-value alternatively
Model significance = ANOVA of the delta R-squared comparing the two models.
Figure 6. Correlation between predictor variables and EA mean correlational distance:

Significant predictor variables and mean correlational distance. Dots represent individual data points, and the darker grey ribbon indicates 95% confidence interval. A) Higher mean correlational distance was associated with higher IRI Empathic Concern score. B) Increased age was significantly associated with higher mean correlational distance, and this effect was more pronounced in males.
3.4.2. Resting State Data
Model 1 (age, sex, average FD, and scanner) accounted for 8.37% (adjusted R2 = 0.8367) of the variance observed in mean correlational distance (Table 3). Model 2 (diagnostic group) was statistically significant and accounted for an additional 4.94% of variance (adjusted R2 = 0.1331, p = 0.0000096). Model 3 (mentalizing score) was significant as well (adjusted R2 = 0.1467, p = 0.012). In contrast to the EA task, diagnosis was still significant in Model 3 (p=0.008), suggesting that diagnostic differences in variability at rest were not accounted for by mentalizing. Model 4 (IRI empathic concern) did not account for any additional statistically significant variance. Model 5 (MCCB composite scores) accounted for an additional 1.17% of variance (adjusted R2 = 0.1569, p = 0.018). Model 6 (functional outcome scores) and Model 7 (including interaction terms), both do not significantly account for additional variance. Interestingly, when diagnosis was entered after cognition and BFSF, mentalizing and MCCB composite score both explained significant additional variance while diagnosis was no longer significant in the hierarchical model (Supplemental Table S4; p = 0.000014 for mentalizing, p = 0.0023 for MCCB composite, and p = 0.42). This suggests similar variance is captured by diagnosis and cognition. The final model explains 16.17% of variance in mean correlational distance. In the final model (Table S5), the BSFS Social Engagement/Withdrawal (Fig. 7A; F(1, 322) = 4.90, β = 0.00077, p = 0.028) and MCCB composite score (Fig. 7B; F(1, 322) = 4.90, β 5.47, β = −0.00015, p = 0.020) were the only predictor variables that remained significant. The cross-validation results for the final model yielded an R2 of 0.144 and an RMSE of 0.0123. The observed R2 was significant relative to the permuted null distribution (See Supplemental Figure S3B; p < 0.001).
Table 3.
Hierarchical Regression Analysis for Resting State Data
| Model 1 | Model 2 | Model 3 | Model 4 | Model 5 | Model 6 | Model 7 | |||||||||
|---|---|---|---|---|---|---|---|---|---|---|---|---|---|---|---|
| Diagnosis | Higher-level Social Cognition | Emotional Empathy | Neurocognition | Functional Outcome | Interaction Terms | ||||||||||
|
| |||||||||||||||
| t | P | t | P | t | P | t | P | t | P | t | P | t | P | ||
|
| |||||||||||||||
| Age | 2.914 | 0.003807 | 3.176 | 0.00163 | 2.625 | 0.00906 | 2.551 | 0.0112 | 2.628 | 0.00899 | 2.091 | 0.0373 | 1.816 | 0.0519 | Age |
| Sex | −1.009 | 0.314 | −1.636 | 0.103 | −1.585 | 0.114 | −1.362 | 0.174 | −1.382 | 0.168 | −1.114 | 0.266 | −0.969 | 0.422 | Sex |
| Average FD | 2.245 | 0.0254 | 1.964 | 0.0504 | 2.085 | 0.0379 | 2.049 | 0.0412 | 2.133 | 0.0336 | 2.062 | 0.0401 | 1.913 | 0.0566 | Average FD |
| Scanner * | 1.536 | 0.178 | 1.955 | 0.0848 | 1.708 | 0.132 | 1.656 | 0.145 | 1.368 | 0.236 | 1.251 | 0.285 | 1.277 | 0.274 | Scanner * |
|
|
|||||||||||||||
| Diagnosis | −4.496 | 9.561e-06 | −2.649 | 0.00845 | −2.623 | 0.00911 | −1.773 | 0.0772 | −0.807 | 0.420 | 0.846 | 0.425 | Diagnosis | ||
|
|
|||||||||||||||
| Mentalizing | −2.518 | 0.0123 | −2.581 | 0.0103 | −1.210 | 0.227 | −0.918 | 0.359 | −0.486 | 0.522 | Mentalizing | ||||
|
|
|||||||||||||||
| IRI Empathic Concern | 0.662 | 0.509 | 0.771 | 0.441 | 0.824 | 0.411 | 0.867 | 0.386 | IRI Empathic Concern | ||||||
|
|
|||||||||||||||
| MCCB Composite Score | −2.376 | 0.0181 | −2.321 | 0.0209 | −2.340 | 0.0199 | MCCB Composite Score | ||||||||
|
|
|||||||||||||||
| BSFS 1 | 2.124 | 0.0344 | 2.213 | 0.0276 | BSFS 1 | ||||||||||
| BSFS 2 | −1.032 | 0.303 | −0.964 | 0.336 | BSFS 2 | ||||||||||
| BSFS 3 | −1.431 | 0.153 | −1.615 | 0.107 | BSFS 3 | ||||||||||
| BSFS 4 | 0.279 | 0.780 | 0.717 | 0.474 | BSFS 4 | ||||||||||
| BSFS 5 | 0.249 | 0.803 | 0.158 | 0.875 | BSFS 5 | ||||||||||
| BSFS 6 | −0.872 | 0.384 | −0.899 | 0.369 | BSFS 6 | ||||||||||
|
|
|||||||||||||||
| Age*Sex | 0.480 | 0.631 | Age*Sex | ||||||||||||
| Age*Diagnosis | −1.854 | 0.0647 | Age*Diagnosis | ||||||||||||
| Diagnosis*Mentalizing | 0.488 | 0.626 | Diagnosis*Mentalizing | ||||||||||||
| Diagnosis*Sex | 0.880 | 0.379 | Diagnosis*Sex | ||||||||||||
| MentaIizing*Sex | −0.024 | 0.981 | MentaIizing*Sex | ||||||||||||
|
| |||||||||||||||
| Adjusted R2 | 0.08367 | 0.1331 | 0.1467 | 0.1452 | 0.1569 | 0.1602 | 0.1617 | ||||||||
| Adjusted ΔR2 | - | 0.04943 | 0.0136 | −0.0015 | 0.0117 | 0.0033 | 0.0015 | ||||||||
| Model Significance ** | - | 9.561e-06 | 0.01226 | 0.5087 | 0.01806 | 0.2973 | 0.3535 | ||||||||
FD= framewise displacement, MCCB= MATRICS Consensus Cognitive Battery, BSFS= Birchwood Social Functioning Score, BSFS 1= Social Engagement/Withdrawal, BSFS 2= Interpersonal, BSFS 3= Independence - compliance, BSFS 4= Independence - performance, BSFS 5= Recreation, BSFS 6= Pro-social, IRI = Social Cognitive Interpersonal Reactivity Index
Scanner= coded as a factor, reporting the F-value alternatively
Model significance = ANOVA of the delta R-squared comparing the two models.
Figure 7. Correlation between predictor variables and resting state mean correlational distance:

Significant predictor variables and mean correlational distance. Dots represent individual data points, and the darker grey background indicates 95% confidence interval. A) Higher mean correlational distance was significantly associated with higher BSFS Social Engagement/Withdrawal score. B) Higher mean correlational distance was associated with lower MCCB composite score.
3.4.3. Clinical Scores and Medication Effects in the SSD group
When examining the effects of medication (CPZ equivalents) and clinical scores (SANS negative symptoms, and BPRS positive symptoms and depression/anxiety) in the SSD group, medication effects and clinical scores did not contribute additional variance (See Supplementary tables S6 and S7).
3.5. Network-Specific Permutation Test Across SSD and TDC and between Good vs Poor Performance Groups
Given that we observed a strong effect of mentalizing on variability in the EA background connectivity, and cognition (MCCB Composite Score) on resting state connectivity variability, we performed a post-hoc analysis to identify regions that were more variable in those with lower cognitive scores, as well as across diagnosis. Permutation analysis revealed within- and between-network functional connectivity variability in poor versus good task performers independent of diagnostic category (Fig. 8; See Supplementary Tables S8–S10), as well as diagnosis-specific results. No significant within-or between-network variability differences were found across mentalizing performers during the EA task. However, there were pervasive network-specific variability differences between SSD and TDC during the EA task; six within-network variability differences and thirty six between-network variability differences (Fig.8D; See Supplementary Table S9), all of which were characterized by the SSD group displaying higher variability in background connectivity.
Figure 8. Network-Specific Variability Differences Across during Resting State and EA Task:

Permutation test results depicting areas of significant between- and within-network variability in background connectivity in good versus poor performers. Differences in standard deviation of averaged Pearson correlation coefficients per network (referred to as the “variability difference”) were compared between good versus poor performers, as well as between TDC and SSD. Blue regions depict areas in which poor performers/SSD display higher variability compared to good performers/controls, and red regions represent areas of decreased variability in poor performers/SSD compared to good performers/TDC. A) A plot of mean correlational distance across networks, comparing EA task and resting state. B) EA task permutation results in good versus poor mentalizing performers. C) Resting state permutation test results in good versus poor neurocognitive performers. D) EA task permutation results comparing TDC and SSD. E) Resting state permutation test results comparing TDC and SSD. P-values are FDR corrected (*p < 0.05, **p < 0.01).
Poor neurocognitive performers displayed increased within-network variability during resting state in the default mode network (Fig.8C difference sd good vs poor = −0.0125, pFDR = 0.013), and significant increased between-network variability between the frontoparietal and default mode network (Fig.8C difference sd good vs poor = −0.0157, pFDR = 0.013), the frontoparietal and cingulo-opercular networks (Fig.8C difference sd good vs poor = −0.0165, pFDR = 0.013), and the somatomotor and language networks (Fig.8C difference sd good vs poor = −0.0242, pFDR = 0.013), where poor performers had greater variability than good neurocognitive performers. Furthermore, there were no significant within-network variability differences between TDC and SSD during resting state (Fig.8E). One significant between-network variability difference remained between the frontoparietal and cingulo-opercular networks (Fig.8E; difference sd TDC vs SSD = −0.0119, p = 0.048), where participants with SSD displayed increased variability in these networks.
4. Discussion
In the present study, we investigated predictors of individual variability in task and resting functional connectivity in a large sample of SSD and TDC. Individuals displayed greater average variability during resting state compared to the EA task; the observed increase in individual variability may be attributed to the unconstrained nature of resting state, where participants engage in mind wandering and spontaneous, internally directed cognitive processes (Diaz et al. 2013; Marchetti et al. 2015), whereas the task may produce a more constrained state (Cole et al. 2014). Initial comparisons revealed diagnostic differences in mean correlational distance between SSD and TDC during rest, but not during the EA task. Hierarchical regression analysis revealed that variability in EA task background connectivity was related to mentalizing score and empathy, but not diagnostic group, while resting state variability was predominantly related to diagnostic differences. Lower neurocognitive scores were also related to increased variability during rest, suggesting that poor performers exhibit an underlying pattern of globally unstable connectivity or dysconnectivity (Cole et al. 2011). This distinction showing diagnostic differences in resting state but not in EA when mentalizing is included in the model suggest that unconstrained resting fMRI emphasizes diagnostic differences in SSD, while cognitive tasks map onto the relevant behaviors.
Studying individual variability during resting state emphasizes diagnostic differences in functional connectivity between SSD and TDC. Several hypotheses have suggested dysconnectivity in SSD due to abnormal functional integration (K. J. Friston and Frith 1995; Weinberger 1993; K. Friston et al. 2016), or global dysconnectivity linked to symptomology in SSD (Cole et al. 2011). The dysconnectivity hypothesis may extend to the internally directed cognitive processes and self-referential nature of resting state, directly translating to the disorganized and increased variability observed in the SSD sample. Individuals with SSD display greater variability during resting state compared to TDC, while during the EA task diagnostic effects were not present once mentalizing was included in the model. This suggests that resting state is an suitable modality for studying diagnostic differences and a powerful tool for observing the consistent abnormalities in the functional organization and variability that characterizes SSD (Sheffield and Barch 2016; Woodward, Rogers, and Heckers 2011), and should be considered alongside task-based functional connectivity to further enhance interpretability and sensitivity to brain–behaviour relationships (Finn 2021).
While group differences in EA task variability between SSD and TDC were found, aligning with recent work examining variability in task fMRI showing greater variability in SSD (Hawco et al. 2020; Gallucci, Tan, et al. 2022; Gallucci, Pomarol-Clotet, et al. 2022), no significant group differences were observed when social cognition was accounted for in the EA task analysis. The current results fall in line with our recent work suggesting that social cognitive functional task-activity or connectivity in SSD falls along a similar spectrum of connectivity as controls (Oliver et al. 2021; Viviano et al. 2018; Hawco et al. 2019), with SSD more likely to be on the ‘impaired’ end of the spectrum. When performing group comparisons across SSD and TDC, factors such as cognition may represent confounds given that cognitive differences in neurobiology can masquerade as diagnostic differences if not accounted for in the analyses. The EA task engages brain regions within the mentalizing network (Oliver et al. 2021; Zaki et al. 2009; Harvey et al. 2013), which shows overlap with the default mode network (Alcalá-López et al. 2019). Differences in mentalizing were significantly related to variability differences during the EA task. The EA task shifts connectivity into more constrained social cognitive brain states elicited by neural strategies underlying emotional-processing (Cole et al. 2014; Oliver et al. 2021). Original work by (Zaki et al. 2009) suggests that the EA task evokes activity in multiple networks, proposing that parallel activation of both mirror neuron and mental state attribution systems correspond to EA. Poorer social cognitive performers may show social network impairments, necessitating the use of alternate pathways to complete the task. Alternatively, poor performers may use less efficient task strategies during the task performance, corresponding to different neural networks, resulting in greater variability (Oliver et al. 2021; Kanske et al. 2016; Hawco et al. 2019).
Brain variability during resting state relates more to general cognitive performance across social cognition (mentalizing score) and neurocognition (MCCB composite score) between SSD and TDC, while social cognitive performance specifically contributes predominantly to brain variability during the EA task. In accordance with previous studies examining brain-behavior relationships across schizophrenia during rest (Sheffield and Barch 2016), we have found that increased variability during rest may reflect a more general cognitive deficit found in SSD. Specifically, the MCCB composite score is sensitive to the extent of impairment across seven domains, such as processing speed, working memory, and attention vigilance, and is related to important aspects of functional outcome (August et al. 2012). When examining network specific variability across good and poor neurocognitive performers during rest, poor performers displayed increased variability within the default mode network, as well as increases between-network variability in frontoparietal and cingulo-opercular networks and the frontoparietal and default mode networks. When examining diagnostic differences in network specific variability, increased between-network variability in the frontoparietal and default mode networks in the SSD group remains significant. This falls in line with the finding that resting state networks are differentially affected in schizophrenia, and that the increased variability between these networks could be characterized by reduced segregation between the default mode and frontoparietal network, as mediated by the prefrontal cortex (Woodward, Rogers, and Heckers 2011). Furthermore, the DLPFC has been implicated as a highly globally connected “hub” (Fox and Greicius 2010; Modha and Singh 2010), and exhibits extensive functional integration with the rest of the brain to implement a variety of complex cognitive control processes (Cole and Schneider 2007). Increased variability in these networks and underlying brain regions may offer insights into altered functional integration as it relates to SSD-specific cognitive deficits underlying brain-behavior relationships.
We found that poor neurocognitive performers during rest and the SSD group during the EA task displayed widespread increased between- and within-network variability (Fig.8), suggesting that these participants exhibit inter-individual variability that may be indicative of an underlying pattern of wide-spread dysconnectivity and lack of network segregation. The default mode, frontoparietal and cingulo-opercular networks displayed extensive within- and between-network variability, with the SSD group having highest variability in these networks during the EA task (Fig. 8D), and poor neurocognitive performers during rest (Fig. 8C). Previous work from our group identified three social cognitive networks during the EA task across SSDs and controls that overlap with these networks (Schurz, Maliske, and Kanske 2020), where reduced network segregation was associated with worse social cognitive performance across SSDs and controls (Oliver et al. 2021). Loss of segregation between the frontoparietal, default mode and cingulo-opercular networks have been linked to psychopathological dimensions across transdiagnostic categories (Xia et al. 2018; Sha et al. 2019; Lefort-Besnard et al. 2018; Cole, Repovš, and Anticevic 2014). Greater default mode within- and between-network variability may be indicative of the failure of the default mode network to engage in efficient functional integration as a result of potential underlying dysconnectivity and lack of network segregation. Building on existing literature describing frontoparietal and default network dysconnectivity (Menon 2011; Tu et al. 2013; Chang et al. 2014; Jia et al. 2020; Harikumar et al. 2023), our study establishes a significant association between frontoparietal and default mode between and within-network variability and decreased neurocognitive performance that exists dimensionally across SSD and TDC.
Several limitations of our study should be noted. Motion continues to be a challenge in many studies of brain structure and function (Savalia et al. 2017; Van Dijk, Sabuncu, and Buckner 2012). Our study aimed to account for this confound by correcting for motion at several stages of the analysis. Furthermore, there are additional potential sources of variability that were not examined here, which include but are not limited to: body mass index (Kullmann et al. 2012), genetic variants (Gilman et al. 2012), fluid and crystalized intelligence (Kruschwitz et al. 2018), personality domains (Hsu et al. 2018), sleep quality (Sämann et al. 2010), and illness duration (Gallucci, Pomarol-Clotet, et al. 2022). This may account for the large proportion of variance that remains unexplained in the resting state and EA task hierarchical regression.
5. Conclusion
To our knowledge, this study was the first to use mean correlational distance as a global metric of individual variability during resting state and social cognitive task-based fMRI in SSD. Apparent diagnostic differences in functional connectivity variability in SSD and TDC were driven by differences in cognitive abilities during the EA task, in line with previous findings by our group (Oliver et al. 2021), while resting state strongly elucidated diagnostic differences in variability. Examining connectivity during a social cognitive processing task state allowed for better delineation of the relationship between variability and higher level social cognitive performance, while resting state emphasized diagnostic differences related to variability. Additionally, when examining network-specific variability, our results suggest that widespread increased between- and within-network variability is present during resting state for poor neurocognitive performers and for SSD participants during the EA task, and may represent reduced functional efficacy and aberrant connectivity. Future work should consider both resting state and task-state connectivity when examining variability. Further validation of the variability underlying brain-behavior relationships could guide targeted treatment development for those exhibiting cognitive deficits, and future studies should consider individualized patterns of variability during task and rest to optimize individualized treatment.
Supplementary Material
Highlights.
Neuroimaging and behavioral data from 193 individuals with SSD and 155 controls were analyzed.
Mean correlational distance was used as a global ‘variability score’ for functional connectivity.
Individuals with SSD displayed greater average variability during resting state compared to the Empathic Accuracy (EA) task. Resting state fMRI emphasizes diagnostic differences in functional connectivity, reflecting a disorganized and more variable pattern in SSD.
Social cognitive functional connectivity in SSD falls along a similar spectrum as controls, but SSD tends to be on the ‘impaired’ end. Variability during the EA task is related to mentalizing and empathy, indicating task-induced shifts into more constrained social cognitive brain states.
Widespread increased between- and within-network variability during resting state and the EA task may indicate reduced functional efficacy and aberrant connectivity in SSD group and poor noncognitive performers.
Future studies should explore individualized patterns of variability during task and rest for optimizing personalized treatment approaches and targeted treatment development for those exhibiting cognitive deficits.
Acknowledgements
We express our gratitude to all those who contributed to this project in various capacities: Lindsay D. Oliver, Julia Gallucci, Thomas Tan, Salim Mansour, Erin W. Dickie, George Foussias, James Gold, Anil K. Malhotra, Robert W. Buchanan, Aristotle N. Voineskos, and Colin Hawco. Lastly, we extend our appreciation to the study participants for their cooperation and patience.
Funding Source
This project was funded by the National Institute of Mental Health (Grant Nos. 1/3R01MH102324-01 to ANV, 2/3R01MH102313-01 to AKM, and 3/3R01MH102318-01 to RWB).
Footnotes
Declaration of Interest
LDO receives grant support from the Brain & Behavior Research Foundation (BBRF). EWD has received funding from BBRF, National Institute of Mental Health (NIMH), Canadian Institutes of Health Research (CIHR), and Centre for Addiction and Mental Health (CAMH) Foundation. GF currently receives funding from the CIHR, the CAMH Foundation, and the University of Toronto, and has served on an advisory board for AbbVie. AKM receives grant support from the NIMH (R01 MH109508, R01 MH108654, R61 MH120188). RWB has consulted for Boehringer-Ingelheim, serves on the Data Safety and Monitoring Boards of Roche, Merck, and Newron, and has served on the Advisory Boards of Merck, Acadia, Karuna, and Neurocrine. ANV currently receives funding from the NIMH (1/3R01 MH102324, 1/5R01 MH114970), CIHR, Canada Foundation for Innovation, CAMH Foundation, and University of Toronto. CH receives grant support from the NIMH, CIHR, and the CAMH Foundation. All other authors have no interests to declare.
Ethical Statement
According to the Declaration of Helsinki, the study was approved by the local ethics committee and carried out at the Centre for Addiction and Mental Health in Toronto, Canada, at the Zucker Hillside Hospital, Glen Oaks, USA, and at the Maryland Psychiatric Research Center, Baltimore. All participants provided verbal and written informed consent.
Publisher's Disclaimer: This is a PDF file of an unedited manuscript that has been accepted for publication. As a service to our customers we are providing this early version of the manuscript. The manuscript will undergo copyediting, typesetting, and review of the resulting proof before it is published in its final form. Please note that during the production process errors may be discovered which could affect the content, and all legal disclaimers that apply to the journal pertain.
References
- Abraham Alexandre, Pedregosa Fabian, Eickenberg Michael, Gervais Philippe, Mueller Andreas, Kossaifi Jean, Gramfort Alexandre, Thirion Bertrand, and Varoquaux Gaël. 2014. “Machine Learning for Neuroimaging with Scikit-Learn.” Frontiers in Neuroinformatics 8 (February): 14. [DOI] [PMC free article] [PubMed] [Google Scholar]
- Al-Aidroos Naseem, Said Christopher P., and Turk-Browne Nicholas B.. 2012. “Top-down Attention Switches Coupling between Low-Level and High-Level Areas of Human Visual Cortex.” Proceedings of the National Academy of Sciences of the United States of America 109 (36): 14675–80. [DOI] [PMC free article] [PubMed] [Google Scholar]
- Alcalá-López Daniel, Vogeley Kai, Binkofski Ferdinand, and Bzdok Danilo. 2019. “Building Blocks of Social Cognition: Mirror, Mentalize, Share?” Cortex; a Journal Devoted to the Study of the Nervous System and Behavior 118 (September): 4–18. [DOI] [PubMed] [Google Scholar]
- Andreasen NC 1982. “Negative Symptoms in Schizophrenia. Definition and Reliability.” Archives of General Psychiatry 39 (7): 784–88. [DOI] [PubMed] [Google Scholar]
- August Sharon M., Kiwanuka Jacqueline N., McMahon Robert P., and Gold James M.. 2012. “The MATRICS Consensus Cognitive Battery (MCCB): Clinical and Cognitive Correlates.” Schizophrenia Research 134 (1): 76–82. [DOI] [PMC free article] [PubMed] [Google Scholar]
- Baron-Cohen Simon, Wheelwright Sally, Hill Jacqueline, Raste Yogini, and Plumb Ian. 2001. “The ‘Reading the Mind in the Eyes’ Test Revised Version: A Study with Normal Adults, and Adults with Asperger Syndrome or High-Functioning Autism.” Journal of Child Psychology and Psychiatry, and Allied Disciplines 42 (2): 241–51. [PubMed] [Google Scholar]
- Birchwood M, Smith J, Cochrane R, Wetton S, and Copestake S. 1990. “The Social Functioning Scale. The Development and Validation of a New Scale of Social Adjustment for Use in Family Intervention Programmes with Schizophrenic Patients.” The British Journal of Psychiatry: The Journal of Mental Science 157 (December): 853–59. [DOI] [PubMed] [Google Scholar]
- Bora Emre, Yucel Murat, and Pantelis Christos. 2009. “Theory of Mind Impairment in Schizophrenia: Meta-Analysis.” Schizophrenia Research 109 (1–3): 1–9. [DOI] [PubMed] [Google Scholar]
- Buchanan Robert W., Javitt Daniel C., Marder Stephen R., Schooler Nina R., Gold James M., McMahon Robert P., Heresco-Levy Uriel, and Carpenter William T.. 2007. “The Cognitive and Negative Symptoms in Schizophrenia Trial (CONSIST): The Efficacy of Glutamatergic Agents for Negative Symptoms and Cognitive Impairments.” The American Journal of Psychiatry 164 (10): 1593–1602. [DOI] [PubMed] [Google Scholar]
- Carruthers Sean P., Van Rheenen Tamsyn E., Gurvich Caroline, Sumner Philip J., and Rossell Susan L.. 2019. “Characterising the Structure of Cognitive Heterogeneity in Schizophrenia Spectrum Disorders. A Systematic Review and Narrative Synthesis.” Neuroscience and Biobehavioral Reviews 107 (December): 252–78. [DOI] [PubMed] [Google Scholar]
- Chang Xiao, Shen Hui, Wang Lubin, Liu Zhening, Xin Wei, Hu Dewen, and Miao Danmin. 2014. “Altered Default Mode and Fronto-Parietal Network Subsystems in Patients with Schizophrenia and Their Unaffected Siblings.” Brain Research 1562 (May): 87–99. [DOI] [PubMed] [Google Scholar]
- Cole Michael W., Anticevic Alan, Repovs Grega, and Barch Deanna. 2011. “Variable Global Dysconnectivity and Individual Differences in Schizophrenia.” Biological Psychiatry 70 (1): 43–50. [DOI] [PMC free article] [PubMed] [Google Scholar]
- Cole Michael W., Bassett Danielle S., Power Jonathan D., Braver Todd S., and Petersen Steven E.. 2014. “Intrinsic and Task-Evoked Network Architectures of the Human Brain.” Neuron 83 (1): 238–51. [DOI] [PMC free article] [PubMed] [Google Scholar]
- Cole Michael W., Ito Takuya, Cocuzza Carrisa, and Sanchez-Romero Ruben. 2021. “The Functional Relevance of Task-State Functional Connectivity.” The Journal of Neuroscience: The Official Journal of the Society for Neuroscience 41 (12): 2684–2702. [DOI] [PMC free article] [PubMed] [Google Scholar]
- Cole Michael W., Repovš Grega, and Anticevic Alan. 2014. “The Frontoparietal Control System: A Central Role in Mental Health.” The Neuroscientist: A Review Journal Bringing Neurobiology, Neurology and Psychiatry 20 (6): 652–64. [DOI] [PMC free article] [PubMed] [Google Scholar]
- Cole Michael W., and Schneider Walter. 2007. “The Cognitive Control Network: Integrated Cortical Regions with Dissociable Functions.” NeuroImage 37 (1): 343–60. [DOI] [PubMed] [Google Scholar]
- Cox RW, and Hyde JS. 1997. “Software Tools for Analysis and Visualization of fMRI Data.” NMR in Biomedicine 10 (4–5): 171–78. [DOI] [PubMed] [Google Scholar]
- Davis Mark H. 1983. “Measuring Individual Differences in Empathy: Evidence for a Multidimensional Approach.” Journal of Personality and Social Psychology 44 (1): 113–26. [Google Scholar]
- Diaz B. Alexander, Van Der Sluis Sophie, Moens Sarah, Benjamins Jeroen S., Migliorati Filippo, Stoffers Diederick, Braber Anouk Den, et al. 2013. “The Amsterdam Resting-State Questionnaire Reveals Multiple Phenotypes of Resting-State Cognition.” Frontiers in Human Neuroscience 7 (August): 446. [DOI] [PMC free article] [PubMed] [Google Scholar]
- Dickie Erin W., Anticevic Alan, Smith Dawn E., Coalson Timothy S., Manogaran Mathuvanthi, Calarco Navona, Viviano Joseph D., Glasser Matthew F., Van Essen David C., and Voineskos Aristotle N.. 2019. “Ciftify: A Framework for Surface-Based Analysis of Legacy MR Acquisitions.” NeuroImage 197 (August): 818–26. [DOI] [PMC free article] [PubMed] [Google Scholar]
- Esteban Oscar, Markiewicz Christopher J., Blair Ross W., Moodie Craig A., Isik A. Ilkay, Erramuzpe Asier, Kent James D., et al. 2019. “fMRIPrep: A Robust Preprocessing Pipeline for Functional MRI.” Nature Methods 16 (1): 111–16. [DOI] [PMC free article] [PubMed] [Google Scholar]
- Fett Anne-Kathrin J., Viechtbauer Wolfgang, Dominguez Maria-de-Gracia, Penn David L., van Os Jim, and Krabbendam Lydia. 2011. “The Relationship between Neurocognition and Social Cognition with Functional Outcomes in Schizophrenia: A Meta-Analysis.” Neuroscience and Biobehavioral Reviews 35 (3): 573–88. [DOI] [PubMed] [Google Scholar]
- Finn Emily S. 2021. “Is It Time to Put Rest to Rest?” Trends in Cognitive Sciences 25 (12): 1021–32. [DOI] [PMC free article] [PubMed] [Google Scholar]
- Finn Emily S., and Bandettini Peter A.. 2021. “Movie-Watching Outperforms Rest for Functional Connectivity-Based Prediction of Behavior.” NeuroImage 235 (July): 117963. [DOI] [PMC free article] [PubMed] [Google Scholar]
- Finn Emily S., Shen Xilin, Scheinost Dustin, Rosenberg Monica D., Huang Jessica, Chun Marvin M., Papademetris Xenophon, and Constable R. Todd. 2015. “Functional Connectome Fingerprinting: Identifying Individuals Using Patterns of Brain Connectivity.” Nature Neuroscience 18 (11): 1664–71. [DOI] [PMC free article] [PubMed] [Google Scholar]
- First Michael B., Spitzer Robert L., Gibbon Miriam, Williams Janet B. W., and Others. 2002. “Structured Clinical Interview for DSM-IV-TR Axis I Disorders, Research Version, Patient Edition.” SCID-I/P New York, NY, USA: [Google Scholar]
- Fortin Jean-Philippe, Cullen Nicholas, Sheline Yvette I., Taylor Warren D., Aselcioglu Irem, Cook Philip A., Adams Phil, et al. 2018. “Harmonization of Cortical Thickness Measurements across Scanners and Sites.” NeuroImage 167 (February): 104–20. [DOI] [PMC free article] [PubMed] [Google Scholar]
- Fox Michael D., and Greicius Michael. 2010. “Clinical Applications of Resting State Functional Connectivity.” Frontiers in Systems Neuroscience 4 (June): 19. [DOI] [PMC free article] [PubMed] [Google Scholar]
- Friston Karl, Brown Harriet R., Siemerkus Jakob, and Stephan Klaas E.. 2016. “The Dysconnection Hypothesis (2016).” Schizophrenia Research 176 (2–3): 83–94. [DOI] [PMC free article] [PubMed] [Google Scholar]
- Friston KJ, and Frith CD. 1995. “Schizophrenia: A Disconnection Syndrome?” Clinical Neuroscience 3 (2): 89–97. [PubMed] [Google Scholar]
- Gallucci Julia, Edith Pomarol-Clotet Aristotle N. Voineskos, Amalia Guerrero-Pedraza Silvia Alonso-Lana, Vieta Eduard, Salvador Raymond, and Hawco Colin. 2022. “Longer Illness Duration Is Associated with Greater Individual Variability in Functional Brain Activity in Schizophrenia, but Not Bipolar Disorder.” NeuroImage. Clinical 36 (November): 103269. [DOI] [PMC free article] [PubMed] [Google Scholar]
- Gallucci Julia, Tan Thomas, Schifani Christin, Dickie Erin W., Voineskos Aristotle N., and Hawco Colin. 2022. “Greater Individual Variability in Functional Brain Activity during Working Memory Performance in Schizophrenia Spectrum Disorders (SSD).” Schizophrenia Research 248 (July): 21–31. [DOI] [PubMed] [Google Scholar]
- Gilman Sarah R., Chang Jonathan, Xu Bin, Bawa Tejdeep S., Gogos Joseph A., Karayiorgou Maria, and Vitkup Dennis. 2012. “Diverse Types of Genetic Variation Converge on Functional Gene Networks Involved in Schizophrenia.” Nature Neuroscience 15 (12): 1723–28. [DOI] [PMC free article] [PubMed] [Google Scholar]
- Glasser Matthew F., Coalson Timothy S., Robinson Emma C., Hacker Carl D., Harwell John, Yacoub Essa, Ugurbil Kamil, et al. 2016. “A Multi-Modal Parcellation of Human Cerebral Cortex.” Nature 536 (7615): 171–78. [DOI] [PMC free article] [PubMed] [Google Scholar]
- Gorgolewski KJ, Esteban O, Markiewicz CJ, and Ziegler E. 2018. “Nipype.” Software: Practice & Experience. https://scholar.google.ca/scholar?cluster=11178294646725244524&hl=en&as_sdt=0,5&sciodt=0,5. [Google Scholar]
- Gorgolewski Krzysztof, Burns Christopher D., Madison Cindee, Clark Dav, Halchenko Yaroslav O., Waskom Michael L., and Ghosh Satrajit S.. 2011. “Nipype: A Flexible, Lightweight and Extensible Neuroimaging Data Processing Framework in Python.” Frontiers in Neuroinformatics 5 (August): 13. [DOI] [PMC free article] [PubMed] [Google Scholar]
- Gratton Caterina, Laumann Timothy O., Nielsen Ashley N., Greene Deanna J., Gordon Evan M., Gilmore Adrian W., Nelson Steven M., et al. 2018. “Functional Brain Networks Are Dominated by Stable Group and Individual Factors, Not Cognitive or Daily Variation.” Neuron 98 (2): 439–52.e5. [DOI] [PMC free article] [PubMed] [Google Scholar]
- Green Michael F., Horan William P., and Lee Junghee. 2015. “Social Cognition in Schizophrenia.” Nature Reviews. Neuroscience 16 (10): 620–31. [DOI] [PubMed] [Google Scholar]
- Hajdúk Michal, Harvey Philip D., Penn David L., and Pinkham Amy E.. 2018. “Social Cognitive Impairments in Individuals with Schizophrenia Vary in Severity.” Journal of Psychiatric Research 104 (September): 65–71. [DOI] [PubMed] [Google Scholar]
- Harikumar Amritha, Solovyeva Kseniya P., Misiura Maria, Iraji Armin, Plis Sergey M., Pearlson Godfrey D., Turner Jessica A., and Calhoun Vince D.. 2023. “Revisiting Functional Dysconnectivity: A Review of Three Model Frameworks in Schizophrenia.” Current Neurology and Neuroscience Reports 23 (12): 937–46. [DOI] [PMC free article] [PubMed] [Google Scholar]
- Harvey Philippe-Olivier, Zaki Jamil, Lee Junghee, Ochsner Kevin, and Green Michael F.. 2013. “Neural Substrates of Empathic Accuracy in People with Schizophrenia.” Schizophrenia Bulletin 39 (3): 617–28. [DOI] [PMC free article] [PubMed] [Google Scholar]
- Hawco Colin, Buchanan Robert W., Calarco Navona, Mulsant Benoit H., Viviano Joseph D., Dickie Erin W., Argyelan Miklos, et al. 2019. “Separable and Replicable Neural Strategies During Social Brain Function in People With and Without Severe Mental Illness.” The American Journal of Psychiatry 176 (7): 521–30. [DOI] [PubMed] [Google Scholar]
- Hawco Colin, Yoganathan Laagishan, Voineskos Aristotle N., Lyon Rachael, Tan Thomas, Daskalakis Zafiris J., Blumberger Daniel M., et al. 2020. “Greater Individual Variability in Functional Brain Activity during Working Memory Performance in Young People with Autism and Executive Function Impairment.” NeuroImage. Clinical 27 (April): 102260. [DOI] [PMC free article] [PubMed] [Google Scholar]
- Hsu Wei-Ting, Rosenberg Monica D., Scheinost Dustin, Constable R. Todd, and Chun Marvin M.. 2018. “Resting-State Functional Connectivity Predicts Neuroticism and Extraversion in Novel Individuals.” Social Cognitive and Affective Neuroscience 13 (2): 224–32. [DOI] [PMC free article] [PubMed] [Google Scholar]
- Huber G 1997. “The Heterogeneous Course of Schizophrenia.” Schizophrenia Research 28 (2–3): 177–85. [DOI] [PubMed] [Google Scholar]
- Ito Takuya, Brincat Scott L., Siegel Markus, Mill Ravi D., He Biyu J., Miller Earl K., Rotstein Horacio G., and Cole Michael W.. 2020. “Task-Evoked Activity Quenches Neural Correlations and Variability across Cortical Areas.” PLoS Computational Biology 16 (8): e1007983. [DOI] [PMC free article] [PubMed] [Google Scholar]
- Jia Wenbin, Zhu Hong, Ni Yinmei, Su Jie, Xu Rui, Jia Hongxiao, and Wan Xiaohong. 2020. “Disruptions of Frontoparietal Control Network and Default Mode Network Linking the Metacognitive Deficits with Clinical Symptoms in Schizophrenia.” Human Brain Mapping 41 (6): 1445–58. [DOI] [PMC free article] [PubMed] [Google Scholar]
- Ji Jie Lisa, Spronk Marjolein, Kulkarni Kaustubh, Repovš Grega, Anticevic Alan, and Cole Michael W.. 2019. “Mapping the Human Brain’s Cortical-Subcortical Functional Network Organization.” NeuroImage 185 (January): 35–57. [DOI] [PMC free article] [PubMed] [Google Scholar]
- Johnson W. Evan, Li Cheng, and Rabinovic Ariel. 2007. “Adjusting Batch Effects in Microarray Expression Data Using Empirical Bayes Methods.” Biostatistics 8 (1): 118–27. [DOI] [PubMed] [Google Scholar]
- Kanske Philipp, Anne Böckler Fynn-Mathis Trautwein, Lesemann Franca H. Parianen, and Singer Tania. 2016. “Are Strong Empathizers Better Mentalizers? Evidence for Independence and Interaction between the Routes of Social Cognition.” Social Cognitive and Affective Neuroscience 11 (9): 1383–92. [DOI] [PMC free article] [PubMed] [Google Scholar]
- Keefe Richard S. E., Fox Kolleen Hurley, Harvey Philip D., Cucchiaro Josephine, Siu Cynthia, and Loebel Antony. 2011. “Characteristics of the MATRICS Consensus Cognitive Battery in a 29-Site Antipsychotic Schizophrenia Clinical Trial.” Schizophrenia Research 125 (2–3): 161–68. [DOI] [PubMed] [Google Scholar]
- Kern Robert S., Penn David L., Lee Junghee, Horan William P., Reise Steven P., Ochsner Kevin N., Marder Stephen R., and Green Michael F.. 2013. “Adapting Social Neuroscience Measures for Schizophrenia Clinical Trials, Part 2: Trolling the Depths of Psychometric Properties.” Schizophrenia Bulletin 39 (6): 1201–10. [DOI] [PMC free article] [PubMed] [Google Scholar]
- Kohler CG, Bilker W, Hagendoorn M, Gur RE, and Gur RC. 2000. “Emotion Recognition Deficit in Schizophrenia: Association with Symptomatology and Cognition.” Biological Psychiatry 48 (2): 127–36. [DOI] [PubMed] [Google Scholar]
- Kruschwitz JD, Waller L, Daedelow LS, Walter H, and Veer IM. 2018. “General, Crystallized and Fluid Intelligence Are Not Associated with Functional Global Network Efficiency: A Replication Study with the Human Connectome Project 1200 Data Set.” NeuroImage 171 (May): 323–31. [DOI] [PubMed] [Google Scholar]
- Kullmann Stephanie, Heni Martin, Veit Ralf, Ketterer Caroline, Schick Fritz, Häring Hans-Ulrich, Fritsche Andreas, and Preissl Hubert. 2012. “The Obese Brain: Association of Body Mass Index and Insulin Sensitivity with Resting State Network Functional Connectivity.” Human Brain Mapping 33 (5): 1052–61. [DOI] [PMC free article] [PubMed] [Google Scholar]
- Lefort-Besnard Jérémy, Bassett Danielle S., Smallwood Jonathan, Margulies Daniel S., Derntl Birgit, Gruber Oliver, Aleman Andre, et al. 2018. “Different Shades of Default Mode Disturbance in Schizophrenia: Subnodal Covariance Estimation in Structure and Function.” Human Brain Mapping 39 (2): 644–61. [DOI] [PMC free article] [PubMed] [Google Scholar]
- Leucht Stefan, Samara Myrto, Heres Stephan, and Davis John M.. 2016. “Dose Equivalents for Antipsychotic Drugs: The DDD Method.” Schizophrenia Bulletin 42 Suppl 1 (July): S90–94. [DOI] [PMC free article] [PubMed] [Google Scholar]
- MacDonald Stuart W. S., Nyberg Lars, and Bäckman Lars. 2006. “Intra-Individual Variability in Behavior: Links to Brain Structure, Neurotransmission and Neuronal Activity.” Trends in Neurosciences 29 (8): 474–80. [DOI] [PubMed] [Google Scholar]
- Malhotra Anil K. 2015. “Dissecting the Heterogeneity of Treatment Response in First-Episode Schizophrenia.” Schizophrenia Bulletin 41 (6): 1224–26. [DOI] [PMC free article] [PubMed] [Google Scholar]
- Marchetti Antonella, Baglio Francesca, Costantini Isa, Dipasquale Ottavia, Savazzi Federica, Nemni Raffaello, Intra Francesca Sangiuliano, et al. 2015. “Theory of Mind and the Whole Brain Functional Connectivity: Behavioral and Neural Evidences with the Amsterdam Resting State Questionnaire.” Frontiers in Psychology 6 (December): 1855. [DOI] [PMC free article] [PubMed] [Google Scholar]
- McDonald S, Flanagan S, and Rollins J. 2011. “The Awareness of Social Inference Test (revised).” Sydney, Australia: Pearson Assessment. [Google Scholar]
- Mennes Maarten, Kelly Clare, Zuo Xi-Nian, Di Martino Adriana, Biswal Bharat B., Castellanos F. Xavier, and Milham Michael P.. 2010. “Inter-Individual Differences in Resting-State Functional Connectivity Predict Task-Induced BOLD Activity.” NeuroImage 50 (4): 1690–1701. [DOI] [PMC free article] [PubMed] [Google Scholar]
- Menon Vinod. 2011. “Large-Scale Brain Networks and Psychopathology: A Unifying Triple Network Model.” Trends in Cognitive Sciences 15 (10): 483–506. [DOI] [PubMed] [Google Scholar]
- Mesholam-Gately Raquelle I., Giuliano Anthony J., Goff Kirsten P., Faraone Stephen V., and Seidman Larry J.. 2009. “Neurocognition in First-Episode Schizophrenia: A Meta-Analytic Review.” Neuropsychology 23 (3): 315–36. [DOI] [PubMed] [Google Scholar]
- Modha Dharmendra S., and Singh Raghavendra. 2010. “Network Architecture of the Long-Distance Pathways in the Macaque Brain.” Proceedings of the National Academy of Sciences of the United States of America 107 (30): 13485–90. [DOI] [PMC free article] [PubMed] [Google Scholar]
- Muschelli John, Nebel Mary Beth, Caffo Brian S., Barber Anita D., Pekar James J., and Mostofsky Stewart H.. 2014. “Reduction of Motion-Related Artifacts in Resting State fMRI Using aCompCor.” NeuroImage 96 (August): 22–35. [DOI] [PMC free article] [PubMed] [Google Scholar]
- Norman-Haignere Samuel V., McCarthy Gregory, Chun Marvin M., and Turk-Browne Nicholas B.. 2012. “Category-Selective Background Connectivity in Ventral Visual Cortex.” Cerebral Cortex 22 (2): 391–402. [DOI] [PMC free article] [PubMed] [Google Scholar]
- Nuechterlein Keith H., Green Michael F., Kern Robert S., Baade Lyle E., Barch Deanna M., Cohen Jonathan D., Essock Susan, et al. 2008. “The MATRICS Consensus Cognitive Battery, Part 1: Test Selection, Reliability, and Validity.” The American Journal of Psychiatry 165 (2): 203–13. [DOI] [PubMed] [Google Scholar]
- Olbert Charles M., Penn David L., Kern Robert S., Lee Junghee, Horan William P., Reise Steven P., Ochsner Kevin N., Marder Stephen R., and Green Michael F.. 2013. “Adapting Social Neuroscience Measures for Schizophrenia Clinical Trials, Part 3: Fathoming External Validity.” Schizophrenia Bulletin 39 (6): 1211–18. [DOI] [PMC free article] [PubMed] [Google Scholar]
- Oliver Haltigan, Gold, and Foussias. 2019. “Lower-and Higher-Level Social Cognitive Factors across Individuals with Schizophrenia Spectrum Disorders and Healthy Controls: Relationship with Neurocognition and ….” Schizophrenia Research. https://academic.oup.com/schizophreniabulletin/article-abstract/45/3/629/5069546. [DOI] [PMC free article] [PubMed] [Google Scholar]
- Oliver Lindsay D., Hawco Colin, Homan Philipp, Lee Junghee, Green Michael F., Gold James M., DeRosse Pamela, et al. 2021. “Social Cognitive Networks and Social Cognitive Performance Across Individuals With Schizophrenia Spectrum Disorders and Healthy Control Participants.” Biological Psychiatry. Cognitive Neuroscience and Neuroimaging 6 (12): 1202–14. [DOI] [PMC free article] [PubMed] [Google Scholar]
- Overall John E., and Gorham Donald R.. 1962. “The Brief Psychiatric Rating Scale.” Psychological Reports 10 (3): 799–812. [Google Scholar]
- Sämann Philipp G., Tully Carolin, Spoormaker Victor I., Wetter Thomas C., Holsboer Florian, Wehrle Renate, and Czisch Michael. 2010. “Increased Sleep Pressure Reduces Resting State Functional Connectivity.” Magma 23 (5–6): 375–89. [DOI] [PubMed] [Google Scholar]
- Satterthwaite Theodore D., Elliott Mark A., Gerraty Raphael T., Ruparel Kosha, Loughead James, Calkins Monica E., Eickhoff Simon B., et al. 2013. “An Improved Framework for Confound Regression and Filtering for Control of Motion Artifact in the Preprocessing of Resting-State Functional Connectivity Data.” NeuroImage 64 (January): 240–56. [DOI] [PMC free article] [PubMed] [Google Scholar]
- Savalia Neil K., Agres Phillip F., Chan Micaela Y., Feczko Eric J., Kennedy Kristen M., and Wig Gagan S.. 2017. “Motion-Related Artifacts in Structural Brain Images Revealed with Independent Estimates of in-Scanner Head Motion.” Human Brain Mapping 38 (1): 472–92. [DOI] [PMC free article] [PubMed] [Google Scholar]
- Schmidt Stefanie J., Mueller Daniel R., and Roder Volker. 2011. “Social Cognition as a Mediator Variable between Neurocognition and Functional Outcome in Schizophrenia: Empirical Review and New Results by Structural Equation Modeling.” Schizophrenia Bulletin 37 Suppl 2 (September): S41–54. [DOI] [PMC free article] [PubMed] [Google Scholar]
- Schurz Matthias, Maliske Lara, and Kanske Philipp. 2020. “Cross-Network Interactions in Social Cognition: A Review of Findings on Task Related Brain Activation and Connectivity.” Cortex; a Journal Devoted to the Study of the Nervous System and Behavior 130 (September): 142–57. [DOI] [PubMed] [Google Scholar]
- Schurz Matthias, Radua Joaquim, Aichhorn Markus, Richlan Fabio, and Perner Josef. 2014. “Fractionating Theory of Mind: A Meta-Analysis of Functional Brain Imaging Studies.” Neuroscience and Biobehavioral Reviews 42 (May): 9–34. [DOI] [PubMed] [Google Scholar]
- Shamay-Tsoory Simone G., Aharon-Peretz Judith, and Perry Daniella. 2009. “Two Systems for Empathy: A Double Dissociation between Emotional and Cognitive Empathy in Inferior Frontal Gyrus versus Ventromedial Prefrontal Lesions.” Brain: A Journal of Neurology 132 (Pt 3): 617–27. [DOI] [PubMed] [Google Scholar]
- Sha Zhiqiang, Wager Tor D., Mechelli Andrea, and He Yong. 2019. “Common Dysfunction of Large-Scale Neurocognitive Networks Across Psychiatric Disorders.” Biological Psychiatry 85 (5): 379–88. [DOI] [PubMed] [Google Scholar]
- Sheffield Julia M., and Barch Deanna M.. 2016. “Cognition and Resting-State Functional Connectivity in Schizophrenia.” Neuroscience and Biobehavioral Reviews 61 (February): 108–20. [DOI] [PMC free article] [PubMed] [Google Scholar]
- Sheffield Julia M., Kandala Sridhar, Tamminga Carol A., Pearlson Godfrey D., Keshavan Matcheri S., Sweeney John A., Clementz Brett A., Lerman-Sinkoff Dov B., Kristian Hill S, and Barch Deanna M.. 2017. “Transdiagnostic Associations Between Functional Brain Network Integrity and Cognition.” JAMA Psychiatry 74 (6): 605–13. [DOI] [PMC free article] [PubMed] [Google Scholar]
- Smith Stephen M., Vidaurre Diego, Beckmann Christian F., Glasser Matthew F., Jenkinson Mark, Miller Karla L., Nichols Thomas E., et al. 2013. “Functional Connectomics from Resting-State fMRI.” Trends in Cognitive Sciences 17 (12): 666–82. [DOI] [PMC free article] [PubMed] [Google Scholar]
- Stevens Michael C. 2016. “The Contributions of Resting State and Task-Based Functional Connectivity Studies to Our Understanding of Adolescent Brain Network Maturation.” Neuroscience and Biobehavioral Reviews 70 (November): 13–32. [DOI] [PubMed] [Google Scholar]
- Tian Ye, Margulies Daniel S., Breakspear Michael, and Zalesky Andrew. 2020. “Topographic Organization of the Human Subcortex Unveiled with Functional Connectivity Gradients.” Nature Neuroscience 23 (11): 1421–32. [DOI] [PubMed] [Google Scholar]
- Tsuang MT, Lyons MJ, and Faraone SV. 1990. “Heterogeneity of Schizophrenia. Conceptual Models and Analytic Strategies.” The British Journal of Psychiatry: The Journal of Mental Science 156 (1): 17–26. [DOI] [PubMed] [Google Scholar]
- Tu Pei-Chi, Lee Ying-Chiao, Chen Ying-Shiue, Li Cheng-Ta, and Su Tung-Ping. 2013. “Schizophrenia and the Brain’s Control Network: Aberrant within- and between-Network Connectivity of the Frontoparietal Network in Schizophrenia.” Schizophrenia Research 147 (2–3): 339–47. [DOI] [PubMed] [Google Scholar]
- Dijk Van, Koene RA, Sabuncu ert R., and Buckner Randy L.. 2012. “The Influence of Head Motion on Intrinsic Functional Connectivity MRI.” NeuroImage 59 (1): 431–38. [DOI] [PMC free article] [PubMed] [Google Scholar]
- Horn Van, Darrell John, Grafton Scott T., and Miller Michael B.. 2008. “Individual Variability in Brain Activity: A Nuisance or an Opportunity?” Brain Imaging and Behavior 2 (4): 327–34. [DOI] [PMC free article] [PubMed] [Google Scholar]
- Van Rheenen TE, Lewandowski KE, Tan EJ, Ospina LH, Ongur D, Neill E, Gurvich C, et al. 2017. “Characterizing Cognitive Heterogeneity on the Schizophrenia–bipolar Disorder Spectrum.” Psychological Medicine 47 (10): 1848–64. [DOI] [PubMed] [Google Scholar]
- Viviano Joseph D., Buchanan Robert W., Calarco Navona, Gold James M., Foussias George, Bhagwat Nikhil, Stefanik Laura, et al. 2018. “Resting-State Connectivity Biomarkers of Cognitive Performance and Social Function in Individuals With Schizophrenia Spectrum Disorder and Healthy Control Subjects.” Biological Psychiatry. 10.1016/j.biopsych.2018.03.013. [DOI] [PMC free article] [PubMed] [Google Scholar]
- Wechsler David. 2001. Wechsler Test of Adult Reading: WTAR. Psychological Corporation. [Google Scholar]
- Weinberger DR 1993. “A Connectionist Approach to the Prefrontal Cortex.” The Journal of Neuropsychiatry and Clinical Neurosciences 5 (3): 241–53. [DOI] [PubMed] [Google Scholar]
- Woodward Neil D., Rogers Baxter, and Heckers Stephan. 2011. “Functional Resting-State Networks Are Differentially Affected in Schizophrenia.” Schizophrenia Research 130 (1–3): 86–93. [DOI] [PMC free article] [PubMed] [Google Scholar]
- Xia Cedric Huchuan, Ma Zongming, Ciric Rastko, Gu Shi, Betzel Richard F., Kaczkurkin Antonia N., Calkins Monica E., et al. 2018. “Linked Dimensions of Psychopathology and Connectivity in Functional Brain Networks.” Nature Communications 9 (1): 3003. [DOI] [PMC free article] [PubMed] [Google Scholar]
- Yang Jackie, Gohel Suril, and Vachha Behroze. 2020. “Current Methods and New Directions in Resting State fMRI.” Clinical Imaging 65 (September): 47–53. [DOI] [PMC free article] [PubMed] [Google Scholar]
- Yeo B. T. Thomas, Krienen Fenna M., Sepulcre Jorge, Sabuncu Mert R., Lashkari Danial, Hollinshead Marisa, Roffman Joshua L., et al. 2011. “The Organization of the Human Cerebral Cortex Estimated by Intrinsic Functional Connectivity.” Journal of Neurophysiology 106 (3): 1125–65. [DOI] [PMC free article] [PubMed] [Google Scholar]
- Yu Meichen, Linn Kristin A., Cook Philip A., Phillips Mary L., McInnis Melvin, Fava Maurizio, Trivedi Madhukar H., Weissman Myrna M., Shinohara Russell T., and Sheline Yvette I.. 2018. “Statistical Harmonization Corrects Site Effects in Functional Connectivity Measurements from Multi-Site fMRI Data.” Human Brain Mapping 39 (11): 4213–27. [DOI] [PMC free article] [PubMed] [Google Scholar]
- Zaki Jamil, Weber Jochen, Bolger Niall, and Ochsner Kevin. 2009. “The Neural Bases of Empathic Accuracy.” Proceedings of the National Academy of Sciences of the United States of America 106 (27): 11382–87. [DOI] [PMC free article] [PubMed] [Google Scholar]
Associated Data
This section collects any data citations, data availability statements, or supplementary materials included in this article.