Abstract
Fluctuations in reproductive hormone levels are associated with mood disruptions in women such as postpartum depression. However, the neural circuit mechanisms remain unclear. Here, we report that medial preoptic area (MPOA) GABAergic neurons mediate multifaceted depressive-like behaviors in female mice following ovarian hormone withdrawal (HW), which can be attributed to down-regulation of activity in GABAergic neurons expressing estrogen-receptor-1 (Esr1). Enhancing activity of these neurons ameliorates depressive-like behaviors in HW-treated mice, whereas reducing their activity results in expression of these behaviors. Two separate subpopulations mediate different symptoms: a subpopulation projecting to the ventral tegmental area (VTA) mediates anhedonia and another projecting to the periaqueductal grey mediates immobility. These projections enhance activity of dopaminergic neurons in VTA and serotonergic neurons in dorsal raphe, respectively, with increased release of dopamine and serotonin, possibly through disinhibition mechanisms. Thus, the MPOA is a hub that mediates depressive-like behaviors resulting from transitions in reproductive hormone levels.
Introduction
Fluctuations of reproductive hormone levels have been closely linked to changes in women’s mental health. For example, rapid drops in estrogen levels have been associated with a significantly increased risk of major depressive disorders (MDD) in women, especially in postpartum and perimenopausal conditions1. Common to MDD, the depressive state related to the hormonal fluctuations is characterized by a combination of different symptoms, including anhedonia and helplessness, and is often accompanied by social withdrawal and anxiety 2,3. These symptoms are likely regulated by broadly distributed neural networks in the brain 4,5. To understand the neural circuitry mechanisms that underlie the depressive effects specifically caused by fluctuations in reproductive hormone levels, it is critical to identify which brain structures and associated circuits are susceptible to the hormonal fluctuations and how their abnormal activity can result in depressive-like behaviors. Previous studies have suggested that the hippocampus and amygdala, two structures of the limbic system that express estrogen receptors, may play a role in responding to reproductive-hormone fluctuations 6,7, and that oxytocin signaling in the paraventricular hypothalamus and dorsal raphe may change after estrogen withdrawal 8. Despite these studies, the neural circuit mechanisms for the induction and expression of distinct depression-related phenotypes associated with reproductive hormone fluctuations remain largely unclear.
The medial preoptic area (MPOA) in the anterior hypothalamus is a sexually dimorphic structure with dense expression of estrogen receptors 9. Exogenously applied estradiol has been found to be highly enriched in MPOA via binding to estrogen receptors 10. This provides a cellular basis for MPOA to respond to estrogen fluctuations. Indeed, one subpopulation of MPOA neurons has been shown to be sensitive to changes in estrogen levels and alter their social cue-induced responses according to the reproductive state, and has been suggested to serve as a substrate for hormonal regulation of the reward circuitry 11. In addition, MPOA also plays a role in mediating anxiety-like behaviors associated with aversive sensory experience or stress 12. Stress has long been recognized as an important risk factor in the development of depression 5. Moreover, the MPOA is an evolutionarily conserved brain region, and its different neuronal subpopulations have been implicated in the control of various social behaviors 11–15 including parenting, mating, and within-sex social interactions 13–19, as well as in the regulation of fundamental physiological functions such as core body temperature 20, sleep 21 and feeding 22. Abnormalities in many of these functions can be associated with depressive states in human subjects and animal models 2,3. Based on these findings, we hypothesized that MPOA circuits can maladapt to reproductive-hormone fluctuations and play a role in regulating diverse features of depressive-like behaviors.
Indeed, our results in this study reveal that MPOA plays an essential role in mediating multifaceted depressive-like behaviors in a female mouse model of reproductive-hormone withdrawal. This can be attributed primarily to a down-regulation of spiking activity specifically in its GABAergic (but not glutamatergic) neurons. Enhancing the activity of the MPOA GABAergic neurons substantially ameliorates depressive-like behaviors, whereas reducing their activity alone results in the expression of depressive-like symptoms in naïve mice. Moreover, two separate subpopulations of the GABAergic neurons, through their respective projections to the ventral tegmental area (VTA) and periaqueductal grey (PAG), mediate distinct depressive-like symptoms. While both contribute to reduced sociability, the projection to the VTA mediates anhedonia and the projection to the PAG mediates immobility and anxiety-like behavior. These separate MPOA GABAergic outputs lead to enhanced midbrain dopaminergic and serotonergic activities, respectively. Finally, the behavioral effects of the MPOA GABAergic hypoactivity can be largely ascribed to an estrogen-receptor-1 expressing (Esr1+) subpopulation of the GABAergic neurons. Together, these results elucidate an important and comprehensive role of MPOA GABAergic circuits in responding to reproductive-hormone withdrawal in females and in regulating the resulting depressive-like state.
Results
MPOA GABAergic neurons respond to ovarian hormone withdrawal
To examine the role of MPOA circuits in affective effects resulting from reproductive-hormone fluctuations, we exploited a well-established rodent model of ovarian hormone withdrawal (HW) 7,23,24 (see Methods). As shown in Extended Data Fig. 1a–g, ovariectomized female mice treated with HW exhibited an array of depressive-like behaviors, as measured with a battery of behavioral tests. These included sucrose preference test (SPT) to measure anhedonia, tail suspension (TST) and forced swimming (FST) tests to measure immobility 4, elevated plus maze (EPM) and open field (OPT) tests to measure anxiety-like behavior 25, as well as sociability related parenting and social preference tests26,27. Compared to sham and non-hormone-withdrawal (NHW, with continuous estrogen administration) controls, the HW-treated animals exhibited reduced sucrose preference in SPT (i.e. anhedonia), increased immobility in TST and FST (i.e. helplessness), reduced time spent in open arms of EPM and the center of OFT (i.e. enhanced anxiety-like behavior), as well as reduced pup grooming and social preference (i.e. reduced sociability), consistent with previous studies 7,23,8.
We wondered whether MPOA neurons could respond to the HW treatment with activity changes. To address this question, we performed optrode recordings (see Methods) from optogenetically tagged GABAergic neurons as well as untagged (presumably glutamatergic) neurons in MPOA of awake Vgat-Cre::Ai27 mice (Fig. 1a–c and Extended Data Fig. 2a–c). We found that the baseline firing rate of tagged (GABAergic) neurons was significantly lower in HW-treated than NHW-control animals (Fig. 1d–e). In contrast, the untagged neurons did not show a significant difference between HW-treated and NHW-control groups (Fig. 1f–g). These results suggest that HW results in hypoactivity of specifically the GABAergic but not glutamatergic population of MPOA neurons.
Fig. 1. MPOA GABAergic activity is modulated by hormone withdrawal and correlated with depressive-like phenotypes.
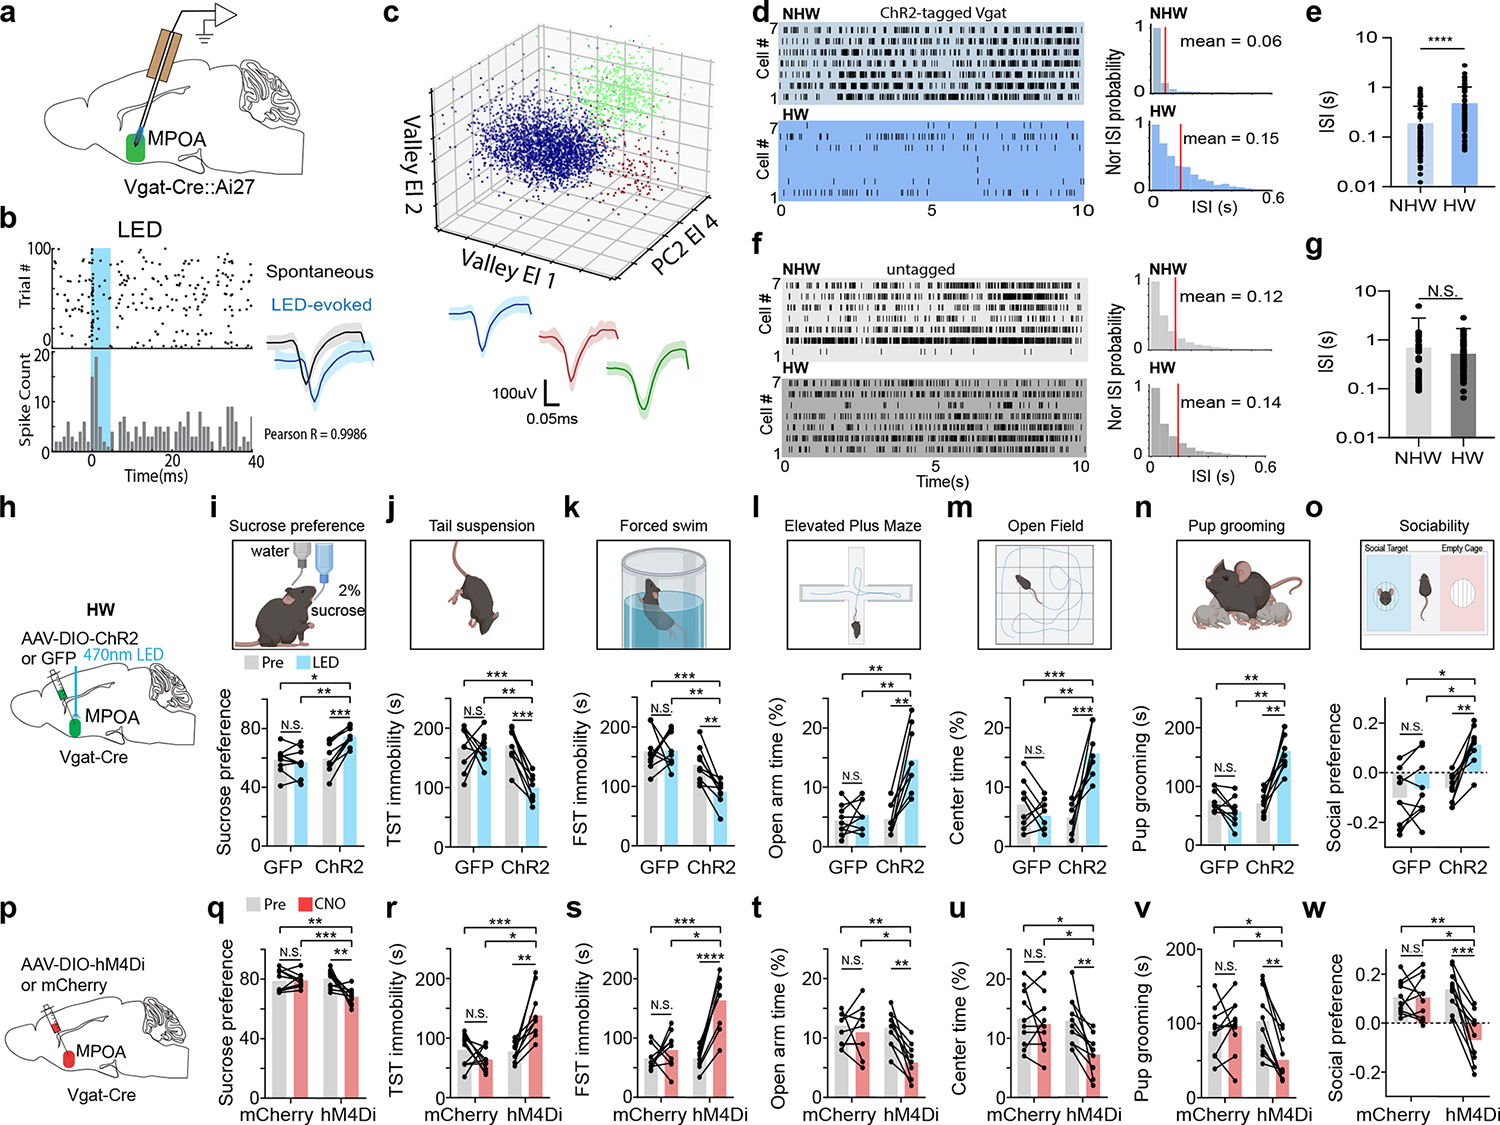
a, Schematic of optrode recording in MPOA of a female Vgat-Cre crossed with Cre-dependent ChR2 mouse. b, Left, raster plot (upper) and peristimulus spike time histogram (PSTH, lower) for spikes evoked by a LED light pulse (blue shade) in a ChR2-tagged cell. Right, similarity between spontaneous and LED-evoked spikes of the same unit. Blue band represents 5ms LED stimulation. c, Example spike sorting. Different colors label different units. Bottom, average spike shapes of three units. d, Left, raster plots of spontaneous spikes of seven ChR2-tagged neurons in NHW-control and HW-treated groups. Right, distribution of inter-spike-interval (ISI) for example cells. e, Mean ISIs of all the recorded ChR2-tagged cells in NHW-control and HW-treated groups (n = 87 and 74 cells respectively, from 3 animals in each group). ****P < 0.0001, two-tailed t-test. Error bar, s.d. f-g, ISI analysis for untagged cells (n = 80 cells for NHW and 96 cells for HW, 3 animals in each group). N.S., P = 0.4455, two-tailed t-test. Error bar, s.d. h, Schematic of viral injection and photo-stimulation of MPOA Vgat+ neurons. i, Percentage sucrose water consumption in SPT with (blue) and without (grey) photo-stimulation in ChR2- or GFP-expressing HW-treated animals. j, Immobility time in TST. k, Immobility time in FST. l, Percentage time spent in open arms in EPM test. m, Percentage time spent in the center in OFT. n, Total time of pup grooming. o, Social preference index (difference in time between two chambers divided by the total time) in the sociability test. i-o, n = 9 animals for each group. p-w, Similar to h-o but for chemogenetic silencing of MPOA Vgat+ neurons in normal female Vgat-Cre animals. n = 10 animals for each group. Statistics for i-w, *P < 0.05, **P < 0.01, ***P < 0.001, ****P < 0.0001, two-way repeated measures ANOVA test with multiple comparisons. For exact P values, see Figure 1 Source Data.
MPOA GABAergic neurons mediate depressive-like behaviors
We next examined whether the hypoactivity of MPOA GABAergic neurons could contribute to the observed depressive-like behaviors. In HW-treated female Vgat-Cre mice, we selectively expressed channelrhodopsin2 (ChR2) (or GFP as control) in MPOA GABAergic neurons by injecting Cre-dependent adeno-associated viral (AAV) vectors (Fig. 1h and Extended Data Fig. 2d–f). Application of 10-Hz blue LED light pulses increased sucrose preference (Fig. 1i), reduced immobility (Fig. 1j–k), reduced anxiety-like behavior (Fig. 1l–m), as well as increased pup grooming and social preference (Fig. 1n–o), compared to the LED-off condition as well as to GFP control animals in the same light application condition. These data suggest that enhancing the activity of MPOA GABAergic neurons can alleviate the depressive-like behaviors following HW treatment.
Moreover, we examined the behavioral effects of directly suppressing the activity of MPOA GABAergic neurons using chemogenetics. In intact female Vgat-Cre animals, we injected AAV encoding Cre-dependent inhibitory DREADD receptor, hM4Di (or mCherry as control), into MPOA (Fig. 1p). With slice recording, we confirmed that hM4Di-expressing MPOA neurons could be suppressed by the ligand, clozapine-N-oxide (CNO) (Extended Data Fig. 3a–b). After intraperitoneal (i.p.) administration of CNO, depressive-like behaviors were increased in hM4Di-expressing mice as compared to the pre-administration condition as well as to the mCherry control, as manifested by reduced sucrose preference, increased immobility and anxiety-like behavior, and reduced pup grooming and social preference (Fig. 1q–w). Suppressing MPOA GABAergic activity in naïve male mice also resulted in enhanced expression of various depressive-like behaviors with the exception of pup grooming (Extended Data Fig. 1h–o). These data suggest that acutely attenuating the activity of MPOA GABAergic neurons alone is sufficient for the expression of depressive-like behaviors. Together, our results support a causal link between the reduced MPOA GABAergic activity and the expression of depressive-like behaviors in HW-treated animals.
Cellular and synaptic changes of MPOA associated with HW
To explore changes in synaptic input and/or intrinsic membrane properties potentially contributing to the reduced spiking of MPOA GABAergic neurons in vivo, we carried out whole-cell patch clamp recording in brain slices obtained from HW-treated or NHW-control Vgat-Cre::Ai14 mice (Fig. 2a and Extended Data Fig. 3c–e). Selective recording from fluorescence-labeled GABAergic neurons revealed a significantly lower spontaneous spike rate in HW-treated than NHW-control groups (Fig. 2b–c), consistent with the in vivo observation, although the level of resting membrane potential or spike threshold was not significantly altered (Extended Data Fig. 3f–g). On the contrary, the non-GABAergic neurons did not show a significant difference between HW-treated and NHW-control groups (Fig. 2d–e).
Fig. 2. Cellular changes underlying the hypoactivity of MPOA GABAergic neurons.
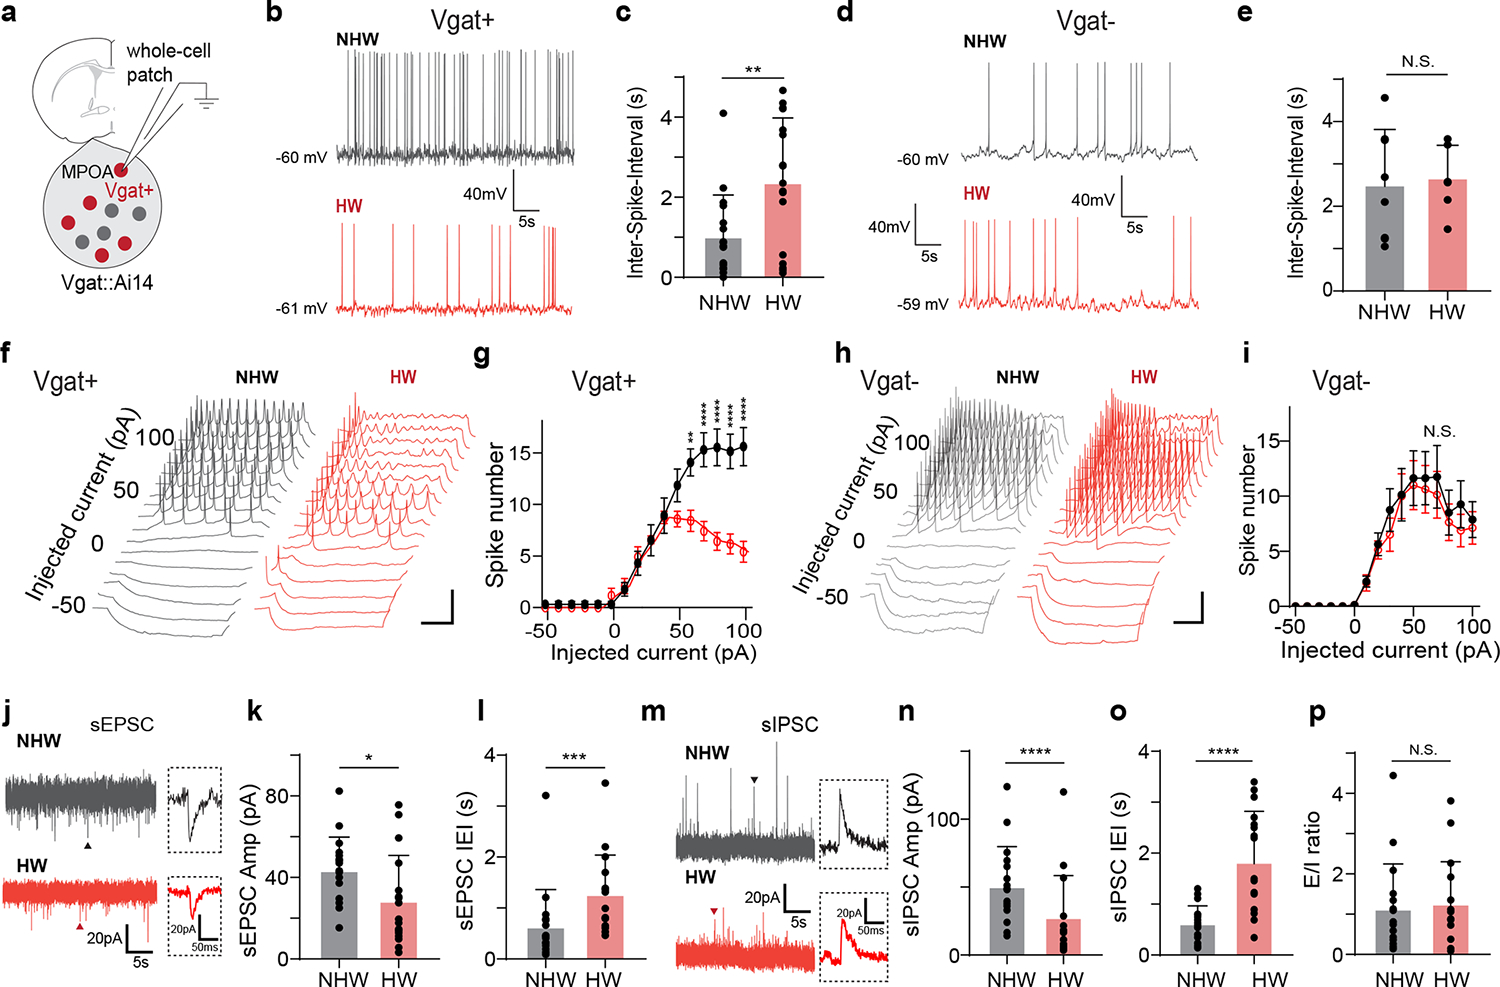
a, Whole-cell patch clamp recording from MPOA Vgat+ neurons (tdTomato+) in brain slices of female Vgat-Cre::Ai14 mice. b, Example recorded traces of spontaneous spikes from a NHW (gray) and HW (red) Vgat+ neuron. Resting membrane potential is indicated. Scale: 40mV, 5s. c, Mean ISIs in NHW-control and HW-treated groups (n = 17 and 17 cells respectively, from 4 animals in each group). **P = 0.0067, two-tailed t-test. Error bar, s.d. d-e, Mean ISI analysis for Vgat- neurons (n = 8 for cells NHW and 8 cells for HW, 4 animals in each group). N.S. P = 0.7576, two-tailed t-test. Error bar, s.d. f, Example traces of membrane potential responses to step current injections in a NHW (gray) and HW (red) Vgat+ neuron. Scale: 20mV, 200ms. g, Average input-output function of Vgat+ neurons in NHW-control (n = 13 cells, grey,) and HW-treated groups (n = 13 and12 cells respectively, from 4 animals in each group). Error bar represents s.e.m. P < 0.0001, two-way ANOVA, interaction F15,368 = 46.91. 60pA, **P = 0.0016; 70–100pA, ****P < 0.0001, Sidak’s multiple comparisons. h-i, The input-output function of MPOA Vgat- neurons in NHW-control (gray) and HW-treated (red) groups (n = 8 and 8 cells respectively, from 4 animals in each group) animals. Scale: 20mV, 200ms. P = 0.7162, two-way ANOVA. Error bar, s.e.m. j, Example recorded traces of sEPSCs in Vgat+ neurons in NHW (gray) and HW (red) slices. Scale: 20mV, 200ms. k-l, Mean amplitudes (k) and inter-event-intervals (IEIs) (l) of sEPSCs in NHW-control and HW-treated slices (n = 17 and 17 cells respectively, from 4 animals in each group). *P = 0.0333 (k), ***P = 0.0006 (l), two-tailed t-test. Error bar, s.d. m-o, Similar to k-l but for sIPSCs (n = 17 and 17 cells for NHW and HW respectively, from 4 animals in each group) recording. Scale: 20mV, 200ms. ****P < 0.0001 (n), ****P < 0.0001 (o), two-tailed t-test. p, Overall E/I ratio. N.S., P = 0.7614, two-tailed t-test, n= 17 cells from 4 animals in each group. Error bar, s.d. For exact P values, see Figure 2 Source Data.
To examine the cell intrinsic excitability, we injected a series of step currents (1-s duration) at different amplitudes into the recorded cell in current-clamp mode (Fig. 2f). We found that the evoked spike number in GABAergic neurons of NHW slices increased linearly with increasing current amplitudes before reaching a plateau (Fig. 2g, black), whereas in the neurons of HW slices it was reduced after reaching a peak (Fig. 2g, red), attributable to a depolarization block. In contrast, the non-GABAergic neurons did not show a difference in the input-output function between HW and NHW mice (Fig. 2h–i). Moreover, spikes were wider and the trough voltage between two spikes was less negative in HW than NHW neurons (Extended Data Fig. 3h–k), consistent with a reduced ability to generate subsequent spikes. Wider spikes and less efficient repolarization were also observed in spontaneously generated spikes (Extended Data Fig. 3l–o). These biophysical features are reminiscent of spiking of neurotensin (Nts) expressing MPOA neurons (95% of which were GABAergic) from ovariectomized mice without estrogen priming 11 and have been linked to lower intrinsic excitability in previous studies11,28.
We also explored synaptic inputs to the MPOA GABAergic neurons, using voltage-clamp recording. Spontaneous excitatory and inhibitory postsynaptic currents (sEPSCs and sIPSCs, respectively) were recorded by clamping the cell’s membrane potential at −70mV and 0mV, respectively (Fig. 2j,m). The mean amplitudes and frequencies of both sEPSCs and sIPSCs were attenuated in HW compared to NHW slices (Fig. 2k–l,n–o), although the overall excitation/inhibition (E/I) ratio based on the summed synaptic charge over a long duration (5 min) was not significantly altered (Fig. 2p). Notably, the frequency of relatively high-amplitude sEPSC events was markedly reduced in HW neurons (Extended Data Fig. 4a–c). Our integrate-and-fire neuron modeling suggested that generally reducing the amplitude of synaptic events but keeping the overall E/I ratio unchanged could contribute to a reduction of spontaneous firing rate (Extended Data Fig. 4d–g). While these data of cellular/synaptic changes are suggestive of reduced firing, potential differences between in vitro and in vivo conditions should be noted, and thus more extensive work is needed to establish a mechanistic link between HW and the reduced baseline firing of the GABAergic neurons in vivo.
Divergent GABAergic projections mediate distinct symptoms
How does the downregulation of MPOA GABAergic activity result in depressive-like behaviors? Previous studies have suggested that MPOA GABAergic projections to VTA and PAG contribute to different types of motivational behaviors 11,26. By injecting AAV encoding Cre-dependent GFP into MPOA of Vgat-Cre mice, we observed abundant fluorescence-labeled axonal projections mainly in the ventrolateral PAG (vlPAG), VTA as well as the lateral hypothalamic area (LHA) (Fig. 3a–b). We thus specifically examined the roles of these three major MPOA GABAergic projections in the expression of depressive-like behaviors by expressing Cre-dependent halorhodopsin (eNpHR) in MPOA of normal mice and optically inhibiting the MPOA GABAergic axons in each of the three target areas (Fig. 3c,k,s). Silencing the projection to VTA reduced sucrose preference, pup grooming and social preference, while having no effect on immobility or anxiety-like behavior (Fig. 3d–j). Silencing the projection to PAG increased immobility and anxiety-like behavior, and reduced pup grooming and social preference, while having no effect on sucrose preference (Fig. 3l–r). However, silencing the projection to LHA did not have effects on any of the behaviors tested (Fig. 3t–z). These data suggest that MPOA GABAergic projections to VTA and PAG may mediate different aspects of depressive-like symptoms, while those to LHA may not play a role.
Fig. 3. Silencing of MPOAGABA→VTA and MPOAGABA→PAG projections induces different effects on depressive-like behaviors.
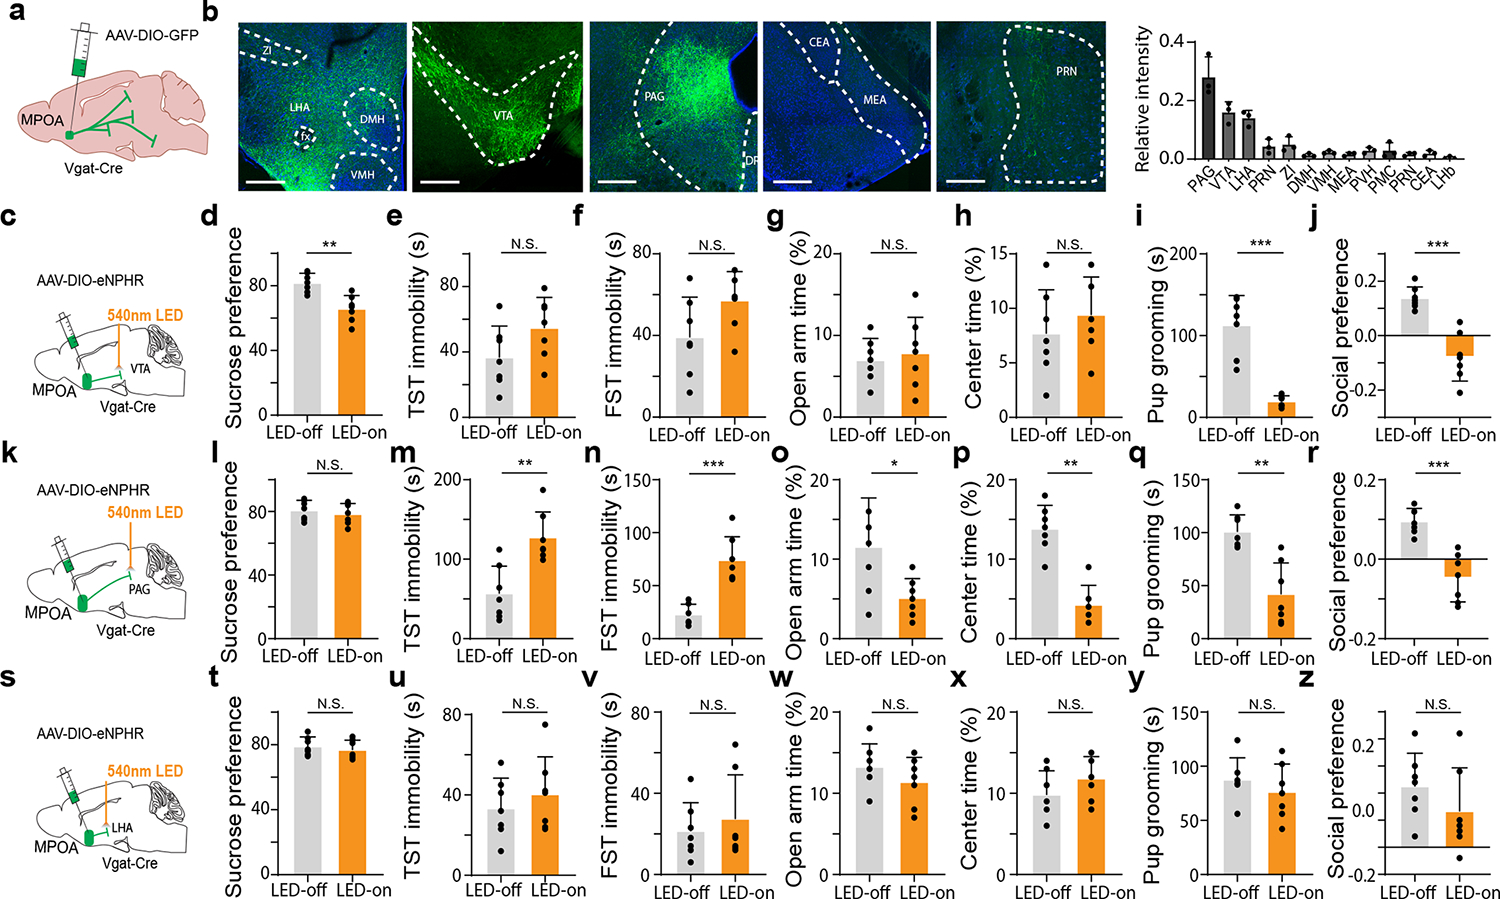
a, Schematic of anterograde tracing of MPOA Vgat+ axons. b, Left five panels, example images showing GFP-labeled axons in several different downstream regions. Right, quantification of relative fluorescence intensities in different targets (n = 3 animals). Scale bar, 500μm. Error bar, s.d. c, Schematic of viral injection and photo-inhibition of the MPOA GABAergic projection to VTA in normal female Vgat-Cre animals. d-j, Percentage sucrose water consumption in SPT (d), immobility time in TST (e) and FST (f), time spent in opened arms in EPM (g) and the center in OFT (h), time for pup grooming (i) and social preference index (j). Error bar, s.d. **P < 0.01, ***P < 0.001, two-tailed Mann-Whitney test, n = 7 mice. k-r, Similar to d-j but for photo-inhibition of the MPOA GABAergic projection to PAG. *P < 0.05, **P < 0.01, ***P < 0.001, two-tailed Mann-Whitney test, n = 7 mice. Error bar, s.d. s-z, Similar to d-j but for photo-inhibition of the MPOA GABAergic projection to LHA. N.S., P > 0.05, two-tailed Mann-Whitney test, n = 7 mice. Error bar, s.d. For exact P values, see Figure 3 Source Data.
To confirm the involvements of the MPOA projections to VTA and PAG in depressive-like behaviors, in HW-treated mice, we optogenetically stimulated the MPOA GABAergic axon terminals in VTA and PAG separately (Fig. 4a,j). The activation of the MPOAGABA→VTA pathway had no effect on immobility or anxiety-like behavior, but increased sucrose preference, pup grooming and social preference as compared to GFP controls (Fig. 4b–i). On the other hand, the activation of the MPOAGABA→PAG pathway did not affect sucrose preference, but reduced immobility and anxiety-like behavior, and increased pup grooming and social preference (Fig. 4k–r). These results are opposite to the optogenetic silencing effects and further suggest that while both of the MPOA GABAergic outputs contribute to social motivation, the one to the PAG mainly mediates the immobility and anxiety aspects whereas the one to the VTA mainly mediates the anhedonia aspect of HW-induced depressive-like phenotypes.
Fig. 4. Activation of MPOAGABA→PAG and MPOAGABA→VTA projections alleviates different features of depressive-like behaviors.
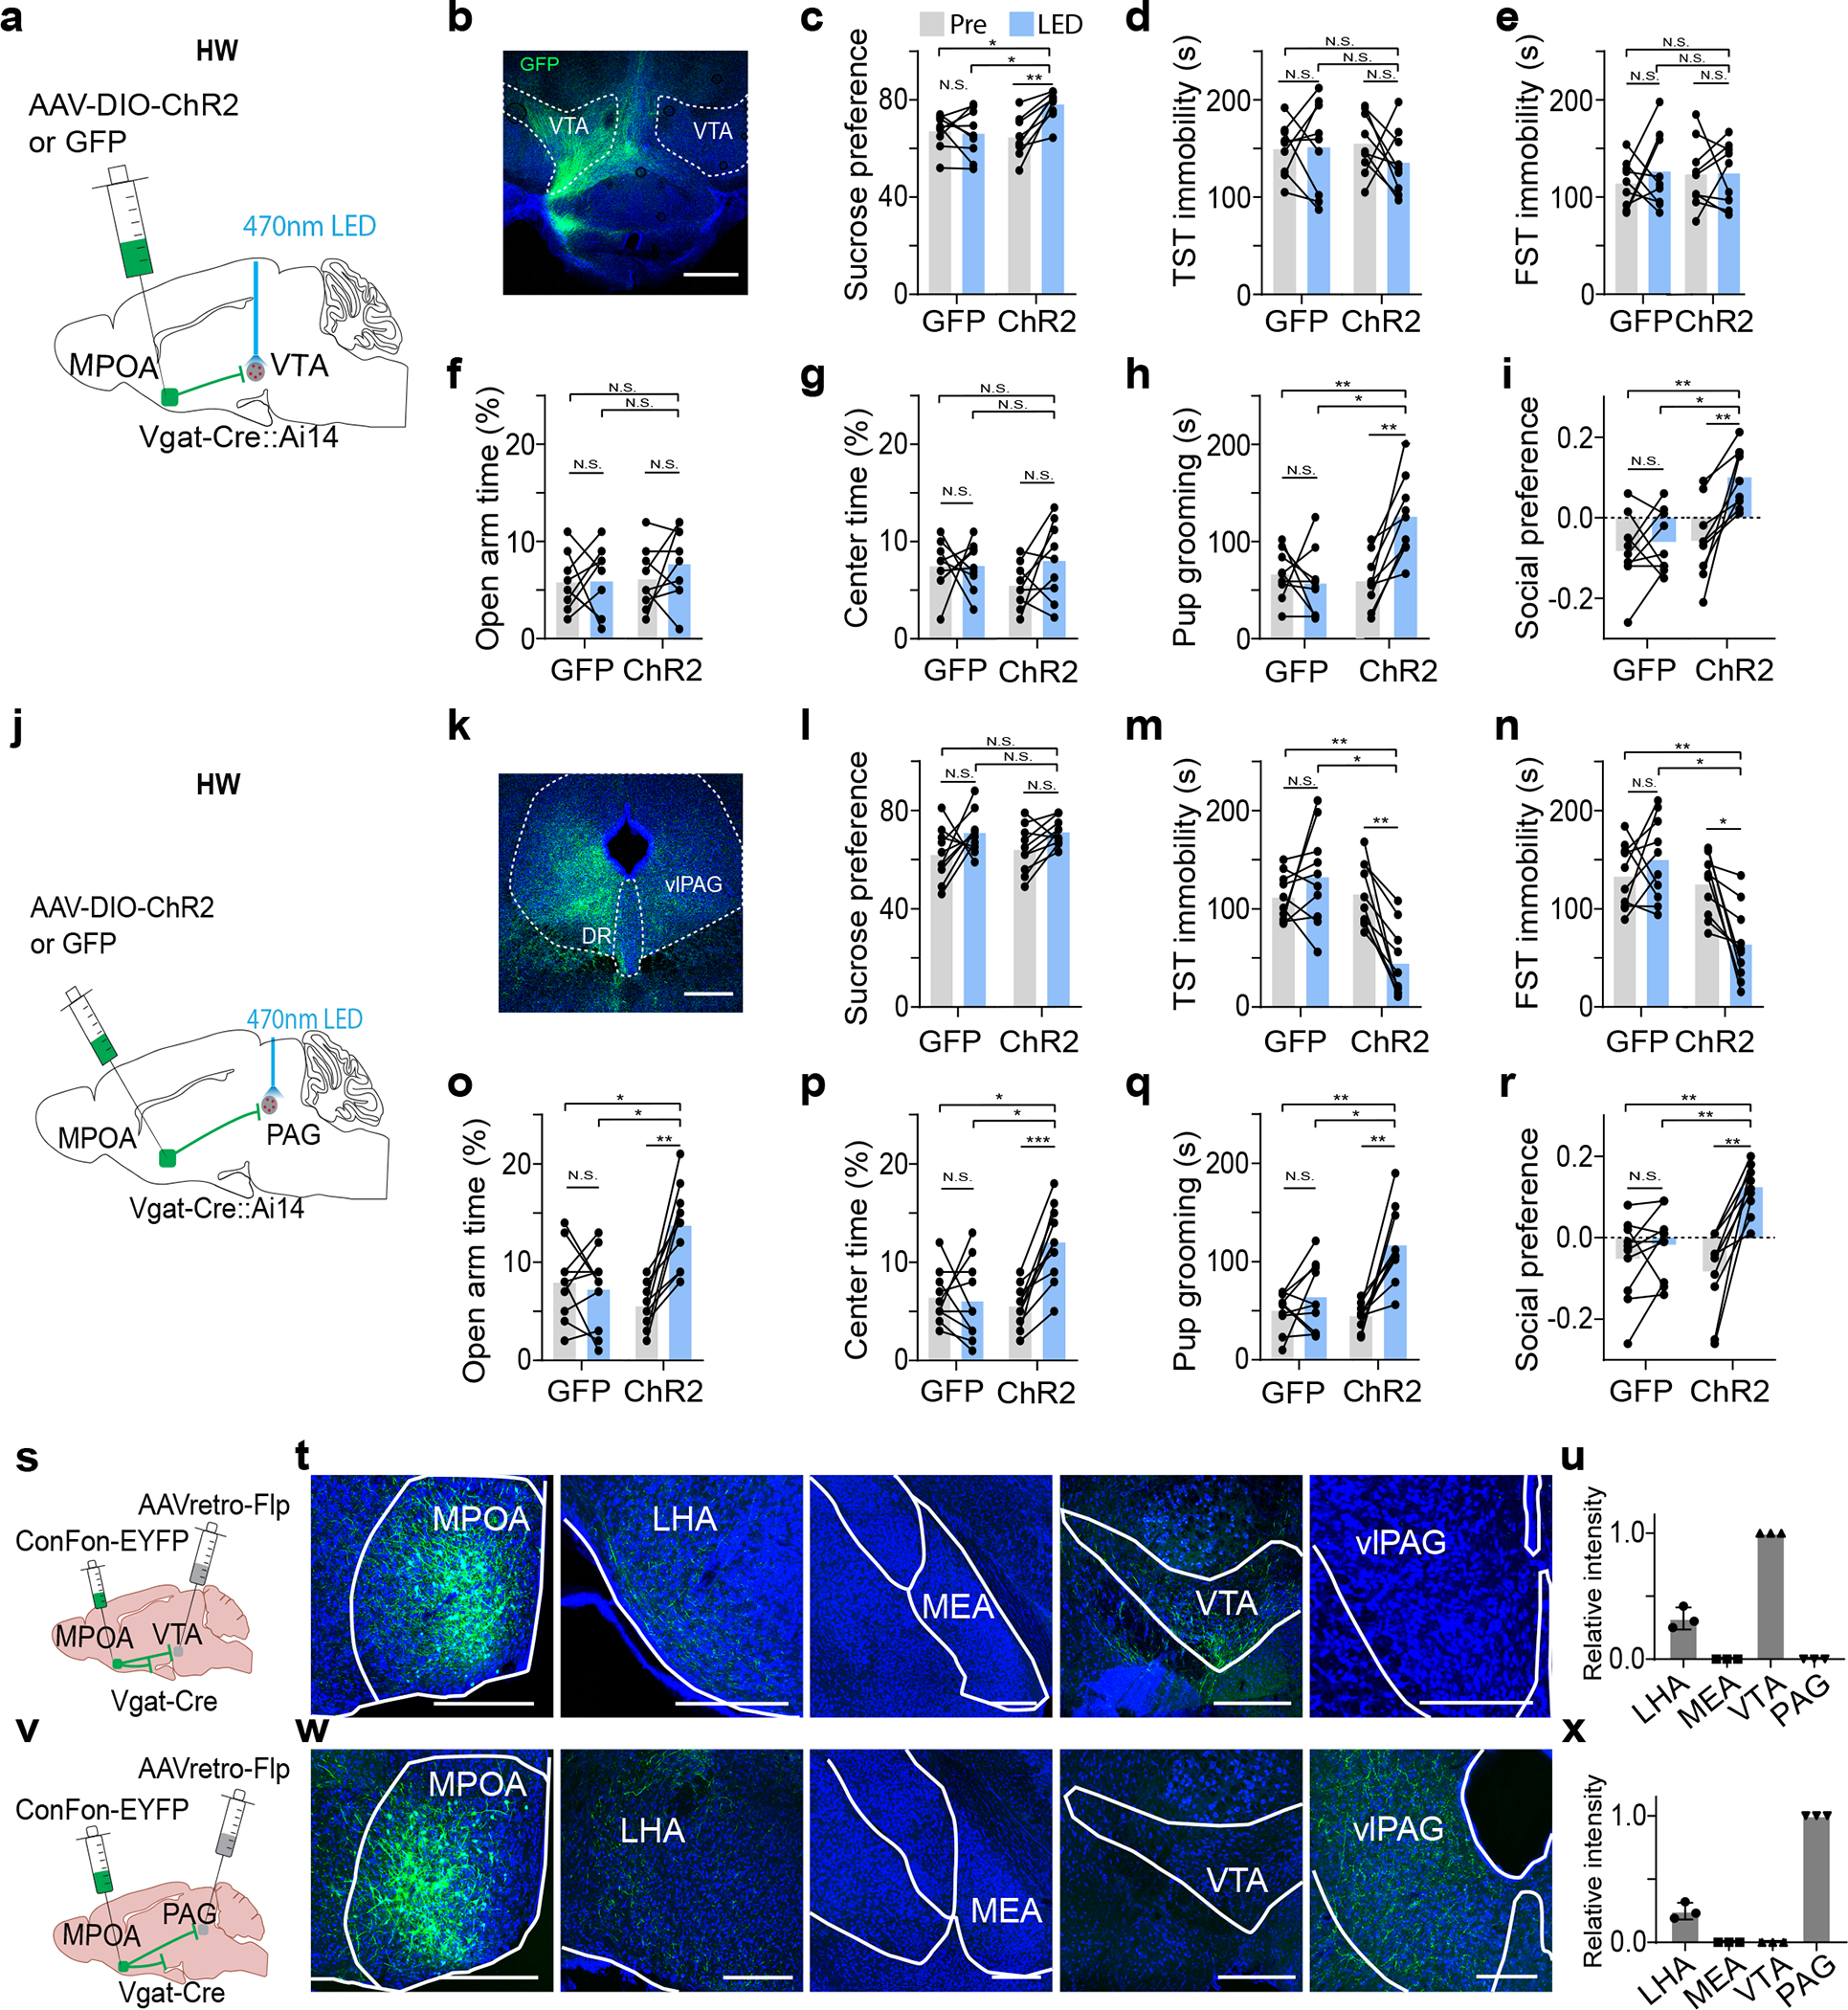
a, Schematic of photo-activation of MPOA→VTA GABAergic terminals in HW-treated animals. b, Example image showing GFP-labeled axonal terminals in VTA. Scale bar, 500μm. c-i, Percentage sucrose water consumption (c), immobility time in TST (d) and FST (e), percentage time spent in opened arms in EPM (f) and the center in OFT (g), time for pup grooming (h) and social preference index (i). N.S., P > 0.05, *P < 0.05, **P < 0.01, repeated measures one-way ANOVA test with multiple comparisons, n = 9 and 9 mice for GFP and ChR2 groups respectively. j-r, Similar to a-i but for photo-activation of MPOA→PAG GABAergic terminals. Scale bar, 500μm. *P < 0.05, **P < 0.01, ***P < 0.001, two-way repeated measures ANOVA test with multiple comparisons, n = 9 and 9 mice for GFP and ChR2 groups respectively. s, Schematic of collateral tracing of VTA-projecting MPOA Vgat+ neurons. t, Images showing EYFP-labeled axons in different areas. Scale bar, 500μm. u, Quantification of relative fluorescence intensity (mean ± s.d., n = 3 animals). v-x, Similar to s-u but for collateral tracing of PAG-projecting MPOA Vgat+ neurons (mean ± s.d., n = 3 animals). For exact P values, see Figure 4 Source Data.
We further examined whether the MPOA GABAergic neurons projecting to VTA and PAG were separate or overlapping cell populations by injecting retrograde tracers (CTB) of different colors into VTA and vlPAG respectively in Vgat-Cre:Ai14 mice (Extended Data Fig. 5a–b). In MPOA, subsets of tdTomato-labeled GABAergic neurons were retrogradely labeled by CTB of either color, but the number of cells co-labeled by CTB of both colors was negligible (Extended Data Fig. 5c). Furthermore, we examined the axon collaterals of VTA- or PAG-projecting MPOA GABAergic neurons by injecting AAVretro-Flp into VTA or vlPAG and AAV-Con/Fon-EYFP into MPOA of Vgat-Cre mice (Fig. 4s,v). The VTA-projecting neurons have collaterals in LHA but none in PAG (Fig. 4t–u). Similarly, the PAG-projecting neurons have collaterals in LHA but none in VTA (Fig. 4w–x). These results further indicate that MPOA GABAergic neurons projecting to VTA and vlPAG are separate populations. Considering that the collaterals to LHA do not contribute to the behaviors under study (Fig. 3t–z), we thus conclude that the alleviating effect of silencing MPOA GABAergic neurons can be attributed to their projections to VTA and PAG.
MPOA GABAergic output to VTA enhances dopaminergic activity
The VTA in the midbrain is well documented to mediate reward-related behaviors through releasing dopamine (DA) to its various targets 29,30. To investigate how MPOA GABAergic neurons might modulate DA neuronal activity, we directly recorded from DA neurons in VTA while optogenetically activating MPOA GABAergic neurons in awake head-fixed animals (see Methods). To this end, we injected AAV-fDIO-ChR2 into MPOA and AAV-DIO-ChrimsonR into VTA of female Vgat-Flp::Dat-Cre mice (Fig. 5a–b). Optrode recordings were performed in VTA to identify photo-tagged dopaminergic (Dat+) neurons (with red light activation) and to record their responses to the activation of MPOA GABAergic neurons (by blue light). We observed that the activation of MPOA GABAergic neurons significantly increased and decreased firing rates in 43% and 3% of the identified Dat+ neurons, respectively (Fig. 5c,d,f). In comparison, in the untagged group, only 12% increased their firing rates upon activation of MPOA GABAergic neurons, while 39% were suppressed (Fig. 5e,g). Control experiments with EYFP expression in MPOA or with red light applied to MPOA had no effect on the activity of Dat+ neurons (Extended Data Fig. 6a–f), excluding any possibility of non-specific effects of light application.
Fig. 5. MPOA GABAergic activity promotes VTA dopaminergic activity.
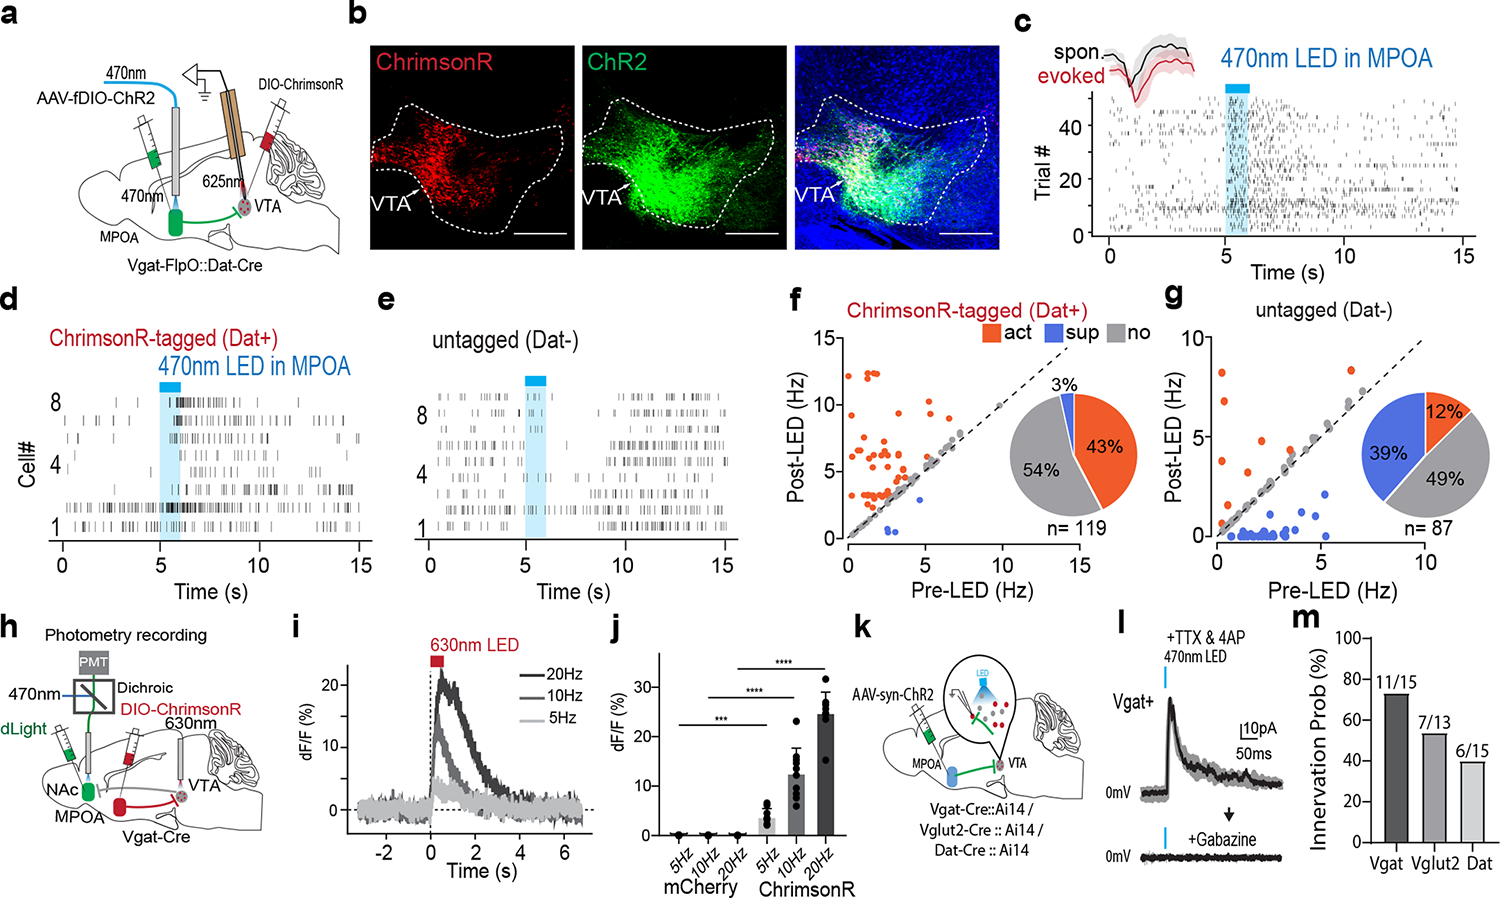
a, Schematic of recording from VTA dopaminergic (Dat+) neurons tagged with ChrimsonR while photo-activating MPOA GABAergic neurons. b, Images showing ChrimsonR-expressing neurons and ChR2-expressing MPOA axons in VTA. Scale, 500μm. c, Raster plot for spikes of an example photo-identified Dat+ neuron in response to activation of MPOA GABAergic neurons (blue shade, 1s of 20-Hz photostimulation). Insert, similarity between spontaneous and LED-evoked spikes of the recorded unit. d-e, Raster plots for 8 tagged (d) and 9 untagged (e) VTA neurons in response to activation of MPOA GABAergic neurons. f, Comparison of firing rates in the pre- and post-LED periods (5-s) for all tagged cells (n = 119 from 4 animals). Red and green label cells with significantly increased (activation)and decreased (suppression) firing rates respectively. Gray labels cells with no change in firing rates (no response). Inset, fraction of tagged VTA neurons showing different types of responses. g, Similar to f but for untagged VTA neurons (n = 87 from 4 animals). h, Fiber photometry recording of dLight signals in NAc while activating MPOA GABAergic terminals (expressing ChrimsonR) in VTA. i, Average dLight signals in response to red light activation at different stimulation frequencies in an example animal. j, Mean peak amplitudes of relative fluorescence change at different stimulation frequencies for mCherry control (n = 3) and ChrimsonR (n = 3) animals. Error bar, s.d. ***P < 0.001, ****P < 0.0001, two-way repeated measures ANOVA test with post hoc multiple comparison, n = 10 trials in total. For exact P values, see Figure 5 Source Data. k, Slice whole-cell recording of VTA Vgat+, Vglut2+ or Dat+ neurons in response to activation of MPOA axon terminals. The recorded cells were identified by crossing different Cre lines with Cre-dependent tdTomato reporter. l, Light-evoked IPSCs in an example VTA Vgat+ neuron, recorded at 0mV and in the presence of TTX and 4-AP. The IPSC was blocked by gabazine. m, Innervation probability for Vgat+ (n = 15 cells from 3 Vgat-Cre::Ai14 mice), Vglut2+ (n = 13 cells from 3 Vglut2-Cre::Ai14 mice) and Dat+ (n = 15 cells from 4 Dat-Cre::Ai14 mice) neurons.
We further tested whether the increase in firing activity of Dat+ neurons could result in an increase of dopamine release. A fluorescence DA indicator, dLight 31, was expressed in the nucleus accumbens (NAc), which is one of the major targets of DA projections 29,30. Fiber photometry was performed in NAc while MPOA GABAergic axon terminals in VTA were optogenetically activated (Fig. 5h). An increase in the fluorescence signal was observed in responding to the activation of the MPOAGABA→VTA projection, and its amplitude increased with increasing stimulation frequencies (Fig. 5i–j). These results demonstrate that increasing the activity of MPOA GABAergic neurons can lead to enhanced VTA dopaminergic neuronal activity and DA release, with the latter consistent with a previous report11.
Since GABA release in general suppresses firing activity in the recipient neurons, we explored whether the apparently excitatory effect of MPOA GABAergic axons on VTA DA neurons could be accounted for by disinhibition. Using cell-type specific Cre mice crossed with Ai14 reporter, we selectively recorded from VTA DA, GABAergic and glutamatergic neurons in slice whole-cell recording, while optogenetically activating ChR2-expressing axons from MPOA (Fig. 5k). Light-evoked monosynaptic IPSCs were observed, which could be blocked by a GABAA receptor antagonist, gabazine (Fig. 5l and Extended Data Fig. 7a–c). We found that all the tested cell types in VTA could be innervated by MPOA GABAergic axons, with the highest innervation probability observed for the GABAergic neuron (Fig. 5m). Since previous studies have suggested that VTA GABAergic neurons can strongly suppress local DA neurons 32, inhibition of VTA GABAergic neurons by MPOA GABAergic axons (i.e. disinhibition) may be able to contribute to the observed enhanced DA activity. However, considering the complexity of interactions among the heterogenous VTA cell types innervated by the MPOA axons, disinhibition could be an oversimplified scenario to explain for the increased DA release.
MPOA GABAergic output to PAG enhances serotonergic activity
Serotoninergic neuromodulator system has been strongly implicated in depressive-like phenotypes 1,33. Since MPOA GABAergic axons terminate in the PAG region surrounding the dorsal raphe (DR), one of the major areas containing serotonergic neurons27, we examined whether MPOA GABAergic neurons could modulate DR serotonergic activity. AAV-fDIO-ChR2 was injected into MPOA and AAV-DIO-ChrimsonR into DR of Vgat-Flp::Sert-Cre mice (Fig. 6a–b). Optrode recording was performed in vlPAG/DR regions to identify serotonergic (Sert+) neurons (with red light activation) and to record their responses to the activation of MPOA GABAergic neurons (by blue light). We found that in the identified Sert+ neurons, 41% and 2% of them exhibited a significant increase and decrease of firing rate respectively upon the activation (Fig. 6c,d,f). On the other hand, in the untagged neurons, 49% decreased and 17% increased firing (Fig. 6e,g). Control experiments excluded possibilities of non-specific effects of light application (Extended Data Fig. 6g–l). In addition, by expressing a genetically encoded serotonin sensor, 5-HT1.0 34 in DR, we performed fiber photometry to monitor serotonin release in responding to the activation of ChrimsonR-expressing MPOA GABAergic neurons (Fig. 6h). We observed frequency-dependent increases of the fluorescence signal, which were absent in mCherry control animals (Fig. 6i–j). Together, our data demonstrate that similar to the dopaminergic activity, MPOA GABAergic neurons also positively modulate midbrain serotonergic activity.
Fig. 6. MPOA GABAergic activity promotes DR serotonergic activity.
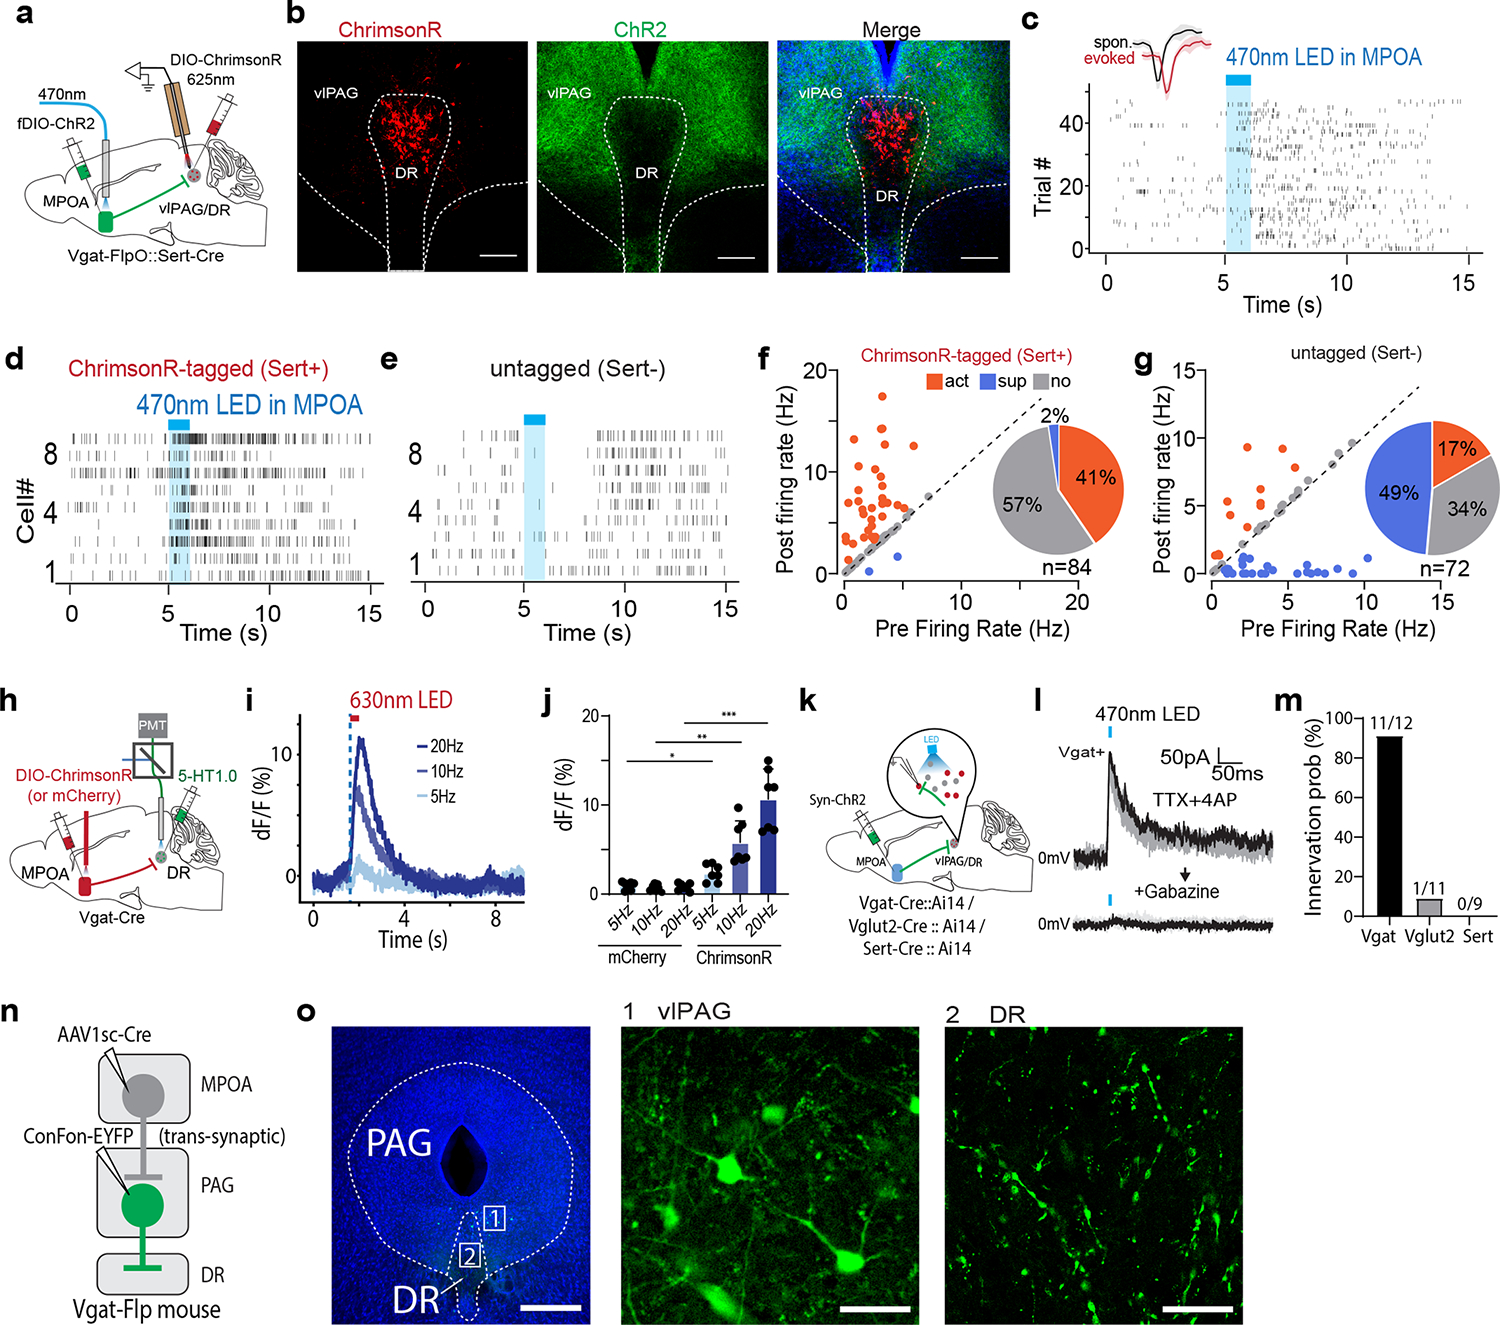
a, Schematic of recording from ChrimsonR-tagged serotonergic neurons in vlPAG/DR regions while activating MPOA GABAergic neurons. b, Images showing ChrimsonR-expressing neurons in DR and ChR2-expressing MPOA axons. Scale, 200μm. c, Raster plot of spikes of an example ChrimsonR-tagged neuron in response to activation of MPOA GABAergic neurons. Blue shade, 1s of 20-Hz photostimulation. Insert, similarity between spontaneous and LED-evoked spikes of the identified unit. d-e, Raster plots for 9 tagged (d) and 9 untagged (e) neurons in response to activation of MPOA GABAergic neurons. f, Fraction of tagged neurons (n = 84 from 3 animals) showing different types of responses. g, Fraction of untagged neurons (n = 72 from 3 animals) showing different types of responses. h, Fiber photometry recording of serotonin signals in DR while activating MPOA GABAergic neurons expressing ChrimsonR. i, Average 5-HT1.0 signals in response to light activation of MPOA neurons at different stimulation frequencies. j, Peak amplitude of relative fluorescence change at different stimulation frequencies for mCherry control (n = 2) and ChrimsonR (m = 2) animals. Error bar, s.d. *P < 0.05, **P < 0.01, ****P<0.0001, two-way repeated measures ANOVA test with post hoc multiple comparisons, n = 7 trials in total. For exact P values, see Figure 6 Source Data. k, Slice whole-cell recording of vlPAG Vgat+, vlPAG Vglut2+, or DR Sert+ neurons in response to activation of MPOA axon terminals. l, Light-evoked IPSCs in an example vlPAG Vgat+ neuron, which was blocked by gabazine. m, Innervation probability for vlPAG Vgat+ (n= 12 cells from 4 Vgat-Cre::Ai14 mice), Vglut2+ (n = 11 cells from 3 Vglut2-Cre::Ai14 mice) and Dat+ (n = 9 cells from 3 Dat-Cre::Ai14 mice) neurons. n, Schematic of transsynaptic and intersectional labelling of MPOA-recipient vlPAG Vgat+ neurons. o, Images showing the labeled MPOA-recipient vlPAG Vgat+ neurons (1) and their terminals in DR (2). Scale, 500μm (left) and 40μm (right two panels).
We further tested a possible role of disinhibition in the excitatory effect of MPOA GABAergic neurons on DR Sert+ neurons. In the slices from different cell-type specific Cre mice crossed with Ai14 reporter, we examined monosynaptic IPSCs responding to activation of MPOA axons in vlPAG GABAergic and glutamatergic neurons as well as in DR Sert+ neurons (Fig. 6k–l and Extended Data Fig. 7d–f). We found that MPOA GABAergic axons did not directly innervate Sert+ neurons, while they innervated vlPAG GABAergic neurons with a much higher probability than the glutamatergic neurons (Fig. 6m). Moreover, we employed an AAV1-based anterograde transsynaptic approach 35 to label MPOA-recipient vlPAG GABAergic neurons (Fig. 6n) and found that axons of these neurons terminated in DR (Fig. 6o). Together, these data suggest that a disinhibitory circuit via vlPAG GABAergic neurons may account for the excitatory effect of MPOA GABAergic output on DR serotonergic activity.
Increasing monoaminergic activity alleviates depressive state
MPOA GABAergic hypoactivity is expected to reduce dopaminergic and serotonergic activity. We next wondered whether enhancing dopaminergic/serotonergic activity could alleviate the depressive-like symptoms36,37. In HW-treated mice, we optogenetically activated DA and Sert+ neurons separately (Extended Data Fig. 8a,i) and observed different effects. Activating DA neurons increased sucrose preference, pup grooming and social preference, while having no effect on anxiety-like behavior (Extended Data Fig. 8b–h). It is worth noting that different from activating the MPOA→VTA projection, activating DA neurons directly reduced immobility. Activating Sert+ neurons did not have an effect on sucrose preference but improved all the other symptoms (Extended Data Fig. 8j–p). Together, these data suggest dopaminergic and serotonergic systems can play a role in ameliorating the HW-induced depressive-like behaviors.
Esr1+ GABAergic neurons play a major role
The MPOA GABAergic population contains molecularly diverse subpopulations 9. Among them, Esr1+ neurons are known to mediate social and reward-related behaviors and can be sensitive to changes in estrogen levels 11. We thus examined whether the observed behavioral effects of MPOA GABAergic hypoactivity could be mediated through Esr1+ neurons. Using RNAscope staining, we found that about half of the GABAergic neurons were Esr1+ and that about 80% of Esr1+ neurons were GABAergic (Extended Data Fig. 9a–b), consistent with previous studies 9,11. In addition, after injecting retrograde tracers (CTB) of two different colors in VTA and PAG respectively in Esr1-Cre::Ai14 mice, we found that about 60% of Esr1+ neurons in MPOA were labeled by CTB from either VTA or PAG (Extended Data Fig. 9c–e). This number tripled the percentage of GABAergic neurons labeled in a similar way (Extended Data Fig. 5c), suggesting that the Esr1+ population is likely a major subgroup of the MPOA GABAergic neurons projecting to PAG and VTA. The co-labeling by both tracers in the Esr1+ population however was nearly absent (Extended Data Fig. 9e), indicating that separate Esr1+ cell groups project to PAG and VTA. Furthermore, we compared the axonal targets of Esr1+ vs. Esr1- GABAergic subpopulations by injecting the Cre-on/Flp-on GFP virus in one side and Cre-off/Flp-on BFP virus in the other side of MPOA in Esr1-Cre::Vgat-Flp mice (Fig. 7a). While both subpopulations targeted VTA, only the Esr1+ subpopulation targeted PAG (Fig. 7b). These results raise the possibility that the Esr1+ subpopulation might primarily account for the observed multifaceted effects of the general GABAergic population.
Fig. 7. The Esr1+ subpopulation of GABAergic neurons mediates HW-induced depressive-like behaviors.
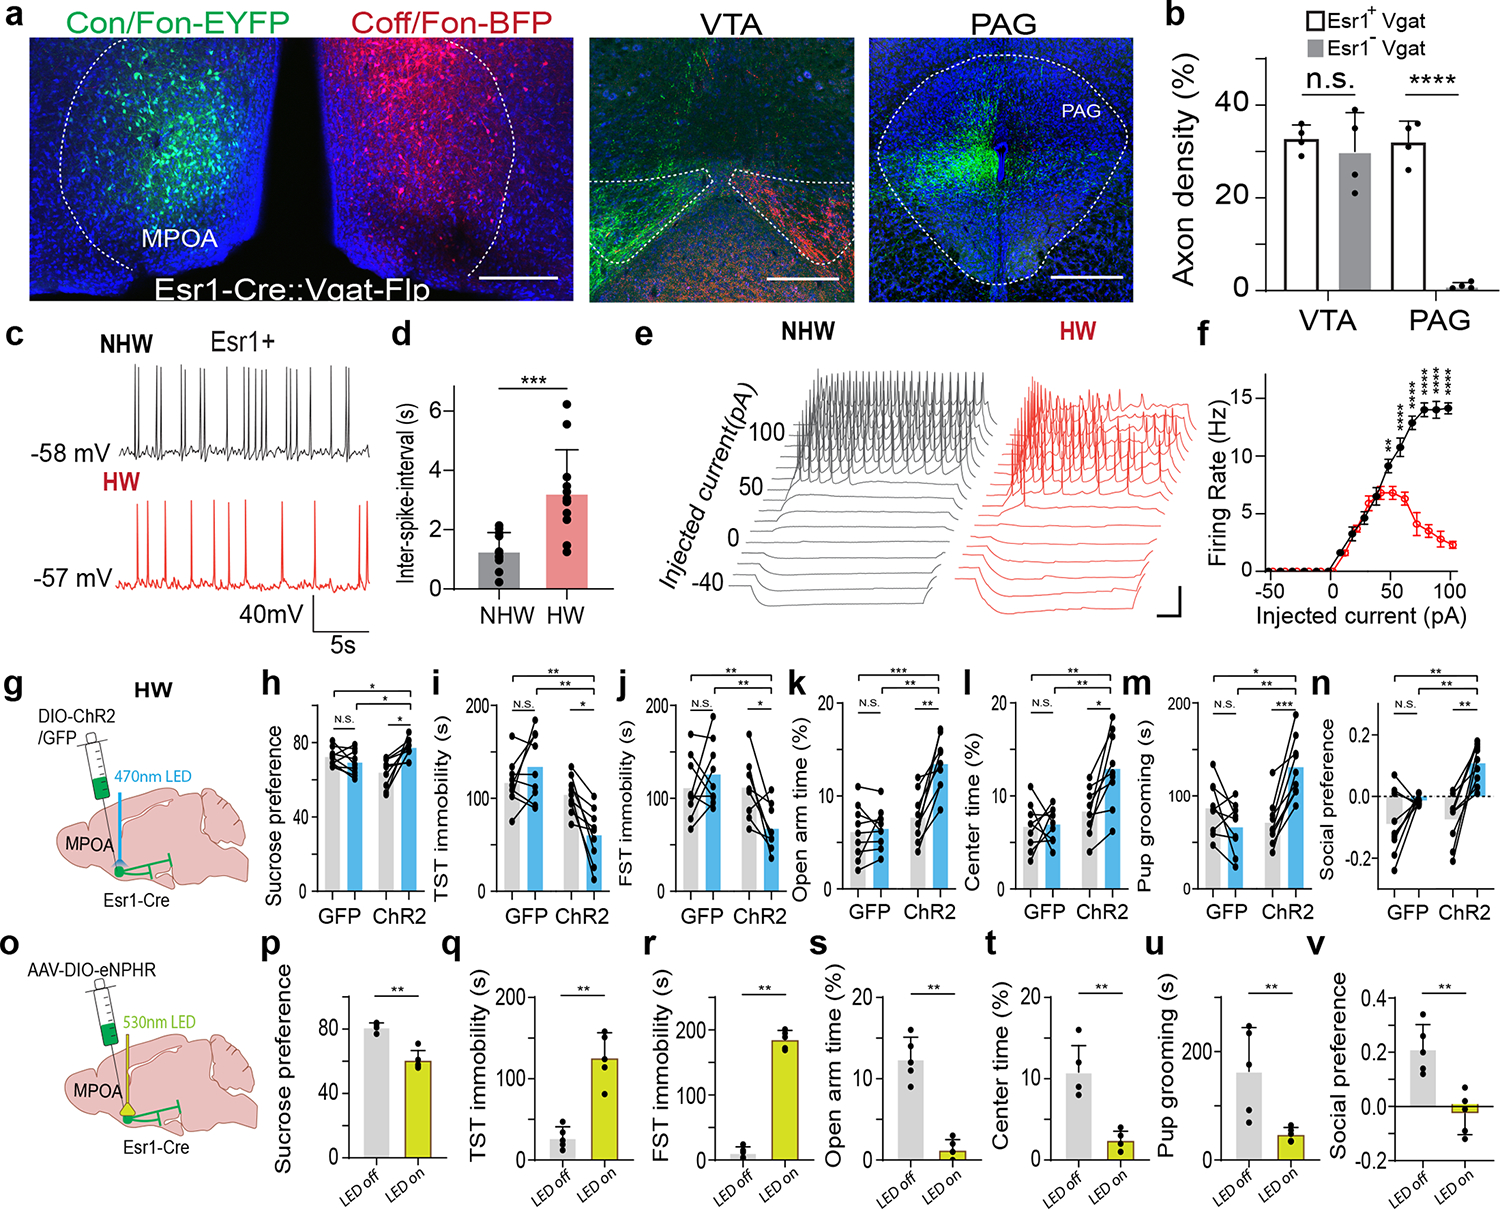
a, Intersectional labeling of Esr1+/Vgat+ (green) and Esr1-/Vgat+ (red) populations in MPOA. Images show the injection site (left) and axon terminals in VTA and PAG in both hemispheres. Scale, 500μm. b, Quantification of axonal density in VTA and PAG (n = 4 female mice). ****P < 0.0001, two-tailed t test. Error bar, s.d. c-d, Spontaneous spikes recorded from Esr1+ neurons in NHW control (n=13 cells from 3 animals, grey) and HW-treated (n = 12 cells from 3 animals, red) slices. c, Example traces. Scale: 40mV, 5s. d, Quantification of average ISIs. Error bar, s.d. ***P = 0.0002, two-tailed t-test. e, Example traces of membrane responses to step current injections in Esr1+ neurons. Scale: 20mV, 100ms. f, Average input-output functions of Esr1+ neurons in NHW-control (n =13 cells from 3 animals) and HW (n = 12 cells from 3 animals) groups. Error bar, s.e.m. P < 0.0001, two-way ANOVA. 50pA, **P = 0.0089; 60–100pA, ****P < 0.0001, Sidak’s multiple comparisons test. g, Schematic of optogenetic activation of MPOA Esr1+ neurons in HW animals. h-n, Percentage sucrose consumption (h), immobility time in TST (i) and FST (j), percentage time spent in opened arms in EPM (k) and the center in OFT (l), time of pup grooming (m) and social preference index (n). *P < 0.05, **P < 0.01, ***P < 0.001, two-way repeated measures ANOVA test with multiple comparisons, n = 9 animals for each group. Error bar, s.d. o-v, Similar to h-n but for optogenetic silencing of Esr1+ neurons in normal animals. **P < 0.01, two-tailed Mann-Whitney test, n = 5 animals. Error bar, s.d. For exact P values, see Figure 7 Source Data.
To directly test the involvement of MPOA Esr1+ neurons in the depressive-like behaviors, we performed slice whole-cell recording from these neurons of HW-treated and NHW-control Esr1-Cre::Ai14 mice. The spontaneous spike rate of Esr1+ neurons was largely reduced (Fig. 7c–d) and the number of spikes induced by current injections was greatly reduced at high current amplitudes (Fig. 7e–f) in HW compared to NHW slices. In addition, wider spikes and less negative trough voltages were observed in HW slices for both evoked and spontaneous spikes (Extended Data Fig. 9f–i). These changes of intrinsic membrane properties were consistent with what had been observed in the general GABAergic population. Next, in HW-treated mice, we specifically activated the Esr1+ neurons and found that the depressive-like behaviors were significantly ameliorated (Fig. 7g–n), similar to the activation of the general GABAergic population. Finally, in the intact Esr1-Cre mice, optogenetic silencing of the Esr1+ neurons directly led to the expression of depressive-like behaviors (Fig. 7o–v). Together, our results suggest that MPOA GABAergic hypoactivity mediates HW-induced depressive-like behaviors mainly through the Esr1+ subpopulation of the GABAergic neurons. Therefore, the Esr1+ neurons play an important role in mediating the HW-induced depressive-like state.
To further establish a link to estrogen signaling, we locally perfused estradiol into MPOA following HW treatment. We found that this effectively prevented the development of depressive-like behaviors (Extended Data Fig. 10a–h), suggesting a protective effect of activating estrogen signaling within MPOA. Local perfusion of an estrogen receptor antagonist into MPOA however blocked this protective effect of estradiol (Extended Data Fig. 10i–p), confirming that the effect is through estrogen receptors.
Discussion
A newly identified player in depression-related networks
Previous studies of depression-related circuits have revealed involvements of a multitude of brain regions. These include various cortical areas such as the prefrontal cortex, cingulate cortex, orbital frontal cortex and insula cortex 38. Meanwhile, structural and functional abnormalities in the amygdala, hippocampus and hypothalamus have been reported to be associated with depression 39–41. Reward-processing related circuits are generally thought to be critically involved in depressive-like behaviors. Changes in cellular activity in the lateral habenula (LHb) 42, NAc 43, VTA 44, DR 45 and ventral pallidum 46 have been reported in depression-related animal models. Such apparently broad network of depression-related circuits may reflect the fact that depression can be induced under a variety of different circumstances. However, the cellular and circuit mechanisms that underlie affective effects of fluctuations in reproductive hormone levels, an important risk factor of depression, are yet poorly investigated.
In the present study, our results have revealed that MPOA GABAergic neurons, more specifically the Esr1-expressing GABAergic subpopulation, play a critical role in mediating an array of depressive-like behaviors following HW treatment. Through their distinct projections to the VTA and PAG, these neurons modulate the activity of midbrain dopaminergic and serotonergic neurons, respectively. These findings suggest that MPOA may function as an important node in responding to ovarian hormone withdrawal and consequentially mediating the induction and expression of depressive-like behaviors. Our results have thus identified a new player in depression-related neural networks. These findings may enhance our understanding of depressive disorders associated with postpartum and perimenopausal conditions.
Role of MPOA GABAergic neurons in depressive-like states
Previously, various functional roles of molecularly identified subpopulations of MPOA GABAergic neurons have been documented 9. These neurons are involved in encoding positive valence 11,12, mediating social behaviors including parenting, sexual behavior and social preference 12,13,15,16,47, as well as in regulating fundamental physiological functions such as sleep and feeding 21,22. For example, both galanin (Gal)+ and Esr1+ neurons have been reported to promote rewarding phenotypes and parental behavior15, and Nts+ neurons to encode attractive male cues and promote social approach in females 11. In addition, activation of the general GABAergic population can generate anxiolytic effects 12. These previous results altogether imply that MPOA GABAergic neurons may play a general role in regulating motivational states and social behaviors, which could be impaired in affective disorders such as depression. Meanwhile, activity of the steroid-sensitive MPOA neuronal population can be regulated by the reproductive state 11, suggesting that MPOA could be a substrate for hormonal regulation of motivational states. In the present study, we found that ovarian hormone withdrawal results in hypoactivity of MPOA GABAergic neurons, which can account for the expression of depressive-like behaviors. Enhancing their activity acutely alleviates the negative affective phenotypes in HW-treated female mice, while suppressing their activity in normal female mice acutely results in the expression of depressive-like phenotypes. Interestingly, suppressing MPOA GABAergic activity in naïve male mice also results in enhanced expression of various depressive-like behaviors (Extended Data Fig. 1h–o), although under what natural conditions the GABAergic activity in male can be downregulated is unknown. Together, our findings are in line with previous reports that suppressing the activity of GABAergic subpopulations in MPOA can impair social behaviors such as social preference 11 and parental behavior 12. Therefore, MPOA GABAergic neurons can play a general role in promoting positive motivational behaviors, while disruptions of their activity could be associated with negative emotions relevant to mood disorders.
The estrogen receptor expression is enriched in MPOA, and general administration of estrogen has been shown to result in the enhanced GABA concentration in the preoptic area 48. In our study, we found that Esr1+ neurons, which are predominantly GABAergic, specifically show decreased activity with altered input-output functions and intrinsic conductances in HW-treated mice. Enhancing the activity of Esr1+ neurons alleviates the depressive-like behaviors in HW-treated animals similar to that of the general GABAergic population, while reducing their activity acutely results in the expression of depressive-like behaviors. These results suggest that MPOA could be an important node converging hormonal function and affective state and related behaviors via Esr1+ neurons. Indeed, local perfusion of estradiol into MPOA following HW treatment can effectively prevent the development of depressive-like behaviors (Extended Data Fig. 10a–h), while local perfusion of estrogen receptor antagonists into MPOA blocks the protective effect of estradiol (Extended Data Fig. 10i–p).
Divergent MPOA GABAergic projections and their roles
Our data indicate that distinct GABAergic projections from the MPOA mediate different aspects of the depressive-like behaviors: the one projecting to VTA mediates the anhedonia aspect, whereas the one projecting to PAG mediates the immobility aspect. The former promotes dopamine release, whereas the latter promotes serotonin release. Notably, these functionally distinct projections originate from separate MPOA GABAergic populations. Both can express estrogen receptors. This may allow estrogen to modulate the two discrete populations simultaneously. On the other hand, activation of either projection promotes social motivation, which is consistent with the previous understanding of a general role of dopamine 46 and serotonin 27 in promoting social behaviors. Moreover, the Esr1+ GABAergic population projects to both PAG and VTA, whereas the Esr1- GABAergic population projects to VTA but not to PAG (Fig. 7a–b). This finding implies that there are molecularly- and target-specific functional modules embedded within the MPOA circuits. Since MPOA receives multiple inputs from LS, BNST, PVH and NAc 12, all of which have been implicated in emotional regulation 5,49,50, it is possible that these functional modules, by linking distinct basal forebrain, hypothalamic and striatal structures to the midbrain reward systems, allow the MPOA structure to function as an integration node to orchestrate complex behavioral phenotypes under different contexts.
Involvements of midbrain neuromodulatory systems
The in vivo cell-type-specific optrode recordings reveal that activation of MPOA GABAergic neurons increases VTA dopaminergic activity and results in acute dopamine release in the NAc. The GABAergic axons from MPOA make synapses onto various types of cells in VTA, including GABAergic, glutamatergic, and dopaminergic neurons (Fig. 5m). Nevertheless, the GABAergic neurons, which can provide inhibition onto local DA neurons 32, receive the MPOA inhibitory input with the highest probability. These pieces of evidence suggest that inhibition of VTA GABAergic neurons might be able to contribute to the enhanced DA release upon activation of MPOA GABAergic neurons. However, we should be cautious about this proposed role of disinhibition since interactions among the different cell types in VTA innervated by the MPOA axons could be highly complex and remain to be investigated more carefully in future studies. Similarly, our electrophysiology and imaging data show that the MPOA GABAergic projection to PAG positively modulates the activity of DR Sert+ neurons and serotonin release. As the projection does not directly innervate Sert+ neurons in DR but synapses with a high probability onto GABAergic (but not glutamatergic) neurons in vlPAG, axons of which then terminate in DR (Fig. 6o), it is likely that a disinhibitory circuit through the vlPAG GABAergic neurons can account for the positive modulation of serotonergic activity by MPOA GABAergic neurons. Our data further demonstrate that directly activating either DA or Ser+ neurons can alleviate the depressive-like behaviors in HW-treated mice (Extended Data Fig. 8). These findings support the notion that MPOA GABAergic activity contributes to the expression of depressive-like behaviors at least partially through regulating DA and serotonin, which is in line with the previous understanding of the involvement of DA and serotonin function in depression3,36,37. Our results, however, do not exclude possible involvements of other neuromodulators, e.g. oxytocin8, in HW-induced behavioral changes.
In summary, our study has elucidated a previously unrecognized role of MPOA GABAergic neurons in mediating depressive-like behaviors induced by ovarian hormone withdrawal. Whether these neurons could also play a role in depressive states induced by other paradigms such as chronic stress exposure will be an open question for future studies, although our previous study has found no evidence that these neurons could be activated in responding to stress12. Our study also highlights the specific involvement of the Esr1+ subpopulation of MPOA GABAergic neurons and suggests that targeting these neurons might be a potentially powerful therapeutic strategy for treating the hormone-related depressive disorders.
Methods
Animals and surgeries
Subjects.
C57BL/6J, Vgat-IRES-Cre, Vglut2-IRES-Cre, Dat-IRES-Cre, Sert-IRES-Cre, Esr1-Cre, Cre-dependent tdTomato reporter [B6.Cg-Gt(ROSA)26Sortm14(CAG-tdTomato)Hze/J, or Ai14], Slc32a1–2A-FlpO-D (Vgat-Flp) mice were obtained from Jackson Laboratories. Cre-expressing or wild-type littermates were group housed according to sex after weaning until surgery or behavioral testing. All mice used in this study were 6–12 weeks old female, except Extended Fig.1 h–o (Vgat-Cre male mice). They were housed on a 12-h light cycle (lights off at 18:00) with ad libitum access to food and water unless specified during behavior test. Housing temperature is around 65–75 °F and humidity is 40–60%. All procedures were conducted in accordance with the Guide for the Care and Use of Laboratory Animals, as adopted by the NIH, and with approval of the Institutional Animal Care and Use Committee (IACUC) at the University of Southern California.
Subject history.
Wild-type animals were randomly assigned to groups. Cre positive transgenic mice were identified by genotyping and then randomly assigned to each group requiring the presence of Cre. Animals were naïve to experimental testings before the beginning of a study. There were four cohorts: 1) intact group (females that did not receive ovariectomy or sham surgery), 2) sham-control group (females having experienced a mock ovariectomy procedure and sham injections), 3) HW-treated group (ovariectomized females having experienced reproductive hormone supplementary administration and then withdrawal) and 4) NHW-control group (ovariectomized females having experienced reproductive hormone supplementary administration without withdrawal).
General procedures viral injection.
Mice were anesthetized with 1.5–2% isoflurane. A small cut was made on the skin at the craniotomy location, and the muscles were removed. One ∼0.25-mm2 craniotomy window was made for each region. AAVs (encoding ChR2, Cre51, Flp, eNpHR3.0, hM4D(Gi), GFP, EYFP, mCherry, GCamp6s, dLight, ChrimsonR, GRAB_5HT1.0) were injected, depending on the purpose of the experiment and the strain of mice. A beveled glass micropipette (pulled using Model P-97, Sutter Instrument; tip diameter, 10–20μm) loaded with viral solution was attached to a microsyringe pump (World Precision Instruments) to deliver the virus through either pressure injection or iontophoresis. For pressure injection, 50–80 nl of the viral solution was injected at a rate of 15–25 nl/min. For iontophoretic injection, a current was applied (3–5 μA, cycle of 7s on, 7s off) for 3–5min. After the injection, the pipette was allowed to rest for 5min before withdrawal. The scalp was then sutured. Before the surgery, buprenorphine (slow release, 0.5–1.0mg/kg) and ketoprofen (5mg/kg) was injected subcutaneously. Mice were allowed to recover for at least 2 weeks before cannula implantation, behavioral tests or recording experiments. After each experiment, the brain was sectioned and imaged under a confocal microscope to confirm viral expression. Data were excluded if there was mistargeting of viral injection or fiber implantation.
Stereotaxic coordination.
MPOA, AP +0.6 mm, ML +1.3 mm, DV −4.75 mm, with a 10° angle; vlPAG, AP −4.4, ML +1.5 mm, DV −2.2 mm; VTA, AP −3.18 mm, ML +1.2 mm, DV −4.0 mm, with a 10° angle. NAc, +1.3 mm, ML, +0.6 mm, DV −3.4mm, with a 0° angle.
Viral constructs.
AAV2/1-pEF1a-DIO-hChR2-eYFP (1.82×10¹³ genome copies (GC)ml−1, UPenn vector core), AAV1-CAG-FLEX-GFP-WPRE (2×10¹³GCml−1, UPenn vector core, Addgene, 51502), AAVretro-Cre (1.5×10¹⁴GCml−1, Vigene), AAV1-CAG-FLEX-ArchT-GFP (4×10¹²GCml−1, UNC vector core), pAAV-hSyn-DIO-hM3D(Gq)-mCherry (1.3×10¹³GCml−1, Addgene, 44361), pAAV-hSyn-DIO-hM4D(Gi)-mCherry (3×10¹³GCml−1, Addgene, 44362), pAAV-hSyn-DIO-mCherry (4.8×10¹³GCml−1, Addgene, 50459), AAV1-Syn-FLEX-GCamp6s-WPRE-SV4 (Addgene, 100845), AAV1-DIO-FLPo-WPRE-hGHpA (1.53×10¹⁴GCml−1, Addgene, 87306), AAV5-Syn-FLEX-rc[ChrimsonR-tdTomato] (8.5×10¹²GCml−1, Addgene, 62723-AAV5), AAV1-syn-FLEX-splitTVA-EGFP-tTA (1:200 dilution, Addgene 100799), AAV1-TREtight-mTagBFP2 (1:20 dilution, Addgene 100798), EnvA-RVΔG-4mCherry (2.18e10 infectious units/ml, Wickersham Lab)
Fiber and cannula implantation.
For optogenetic manipulations, animals were anesthetized two weeks post viral infection with isoflurane and optic cannulas (200 μm, 0.22NA, RWD, 1.25 mm ceramic ferrule, 6 mm length) were stereotactically implanted into the targeted region depending on the purpose of experiments (bilateral MPOA, bilateral VTA, bilateral vlPAG). Optic cannula (400 μm, 0.5NA, Thorlabs, 2.5 mm ceramic ferrule, 5mm length) was used for monitoring dopamine indicator signals in NAc (unilateral). The optic cannula was fixed with black dental cement. The mice were allowed to recover for at least one week before the behavior tests. After experiment, the brain was sectioned and imaged under a confocal microscope to confirm locations of viral expression and the implantation site. For pharmacological manipulations, animals were anesthetized with isoflurane and a drug cannula (RWD Inc., internal diameter: 140 μm) was stereotactically implanted into target region based on the purpose of experiments.
Ovariectomy and reproductive hormone withdrawal.
General anesthesia and analgesia were performed as described above. Females were ovariectomized through incision in bilateral flank areas. The ovarian fat pad was pulled out and the bilateral ovaries were removed. Muscle, abdominal wall and skin were sutured afterwards. Animals that would undergo optogenetic or chemogenetic manipulations received viral injection in the same surgery. Mice were monitored daily following surgery and recovered for at least 7 days. Then, estradiol (0.5μg) and progesterone (0.8 mg) in 0.03ml corn oil were administered subcutaneously for 16 days, followed by estradiol (10μg) administration for 7 days and the last 5 days without estradiol administration (i.e. with only vehicle injection). This regimen, referred to as reproductive hormone recession, has been shown to induce depressive-like behavior 24. For sham control, vehicle (0.03 ml corn oil) was injected throughout 28 days, and for NHW control, estradiol was continuously administered in the last 5 days. Behavioral testing or electrophysiological recording was conducted 5 days after the last dose of estradiol administration (on day 29). For local administration of estradiol (Extended Data Fig. 10a–h), animals were anesthetized with isoflurane and a drug cannula (RWD Inc., internal diameter: 140 μm) was stereotactically implanted into MPOA during the ovariectomy surgery. Mice were recovered for at least 7 days. Then, estradiol (0.5μg) and progesterone (0.8 mg) were administered subcutaneously for 16 days, followed by estradiol (10μg) administration for 7 days and vehicle injections for 5 days. In the next 5 days, the E2 group received local infusion of estradiol (150 nl, 1mM, dissolved in 0.5% DMSO in ACSF) bilaterally into MPOA, while the control group received local infusion of vehicle (150 nl, 0.5% DMSO in ACSF) into MPOA. For the local administration of antagonist (Extended Data Fig. 10i–p), after completing the HW procedure, E2 was i.p. administered during the next 5 days while the estrogen receptor antagonist, ICI 182,780 (150 nl, 7.5μM, dissolved in 0.5% DMSO in ACSF) (or vehicle as control) was locally infused into MPOA. Behavioral testing was conducted on the next day of the last dose of local infusion.
RNA in situ hybridization
Animals were deeply anesthetized and perfused with PBS and PFA (4%). Brains were dissected and fixed overnight. After dehydration, 30-μm thickness cryosections were collected on Superfrost Plus slides (VWR). RNAscope Multiplex Fluorescent Detection Assay V2 (Advanced Cell Diagnostics, 323100) was used for RNAscope staining following manufacture’s protocol52. Briefly, brain sections were hybridized with Esr1 (Advanced Cell Diagnostics, 478201), Vglut2 (Advanced Cell Diagnostics, 319171), Vgat (Advanced Cell Diagnostics, 319191) RNAscope probe mix, which were designed and validated by Adcanced Cell Diagostics. Signals were amplified and tagged with fluorescent dyes. Images were obtained with confocal microscopy and processed with ImageJ.
CTB retrograde tracing
Mice expressing tdTomato in Vgat+ neurons (Vgat-Cre::Ai14) or Esr1+ neurons (Esr1-Cre::Ai14) received dual injections of 80 nl of 0.5% (wt/vol) fluorescently labelled cholera toxin B subunit (CTB-488, Thermo Fisher C22841; CTB-647, Thermo Fisher C34778) in VTA and vlPAG, respectively. After 10 days, the animals were perfused with PBS and 4% PFA. Brains were dissected and post-fixed overnight, then embedded in 3% of agarose and sectioned into 150-μm slices using a vibratome (Leica Microsystems). The fraction of Vgat+/Esr1+, CTb488+, CTb647+, double-labelled in the MPOA was quantified.
Cell-type- and target-specific collateral tracing
To trace the axon collaterals of PAG-projecting Vgat+ neurons in MPOA, AAVretro-Flp (Addgene 55637-AAVrg) was stereotactically injected into PAG of Vgat-Cre mice. Meanwhile, AAV-Con/Fon-EYFP (Addgene 55650-AAV8) was stereotactically injected into MPOA of the same animal. To trace the collaterals of VTA-projecting Vgat+ neurons in MPOA, AAVretro-Flp was injected into VTA of Vgat-Cre mice. Meanwhile, AAV-Con/Fon-EYFP was injected into MPOA. After four-weeks’ expression, brain tissue was fixed, sectioned, and imaged under a confocal microscope.
Estrous cycle monitoring
Intact female mice are spontaneous ovulators and typically have a 4–6 day estrous cycle that consists of four stages: proestrus, estrus, metestrus and diestrus. Intact female mice were habituated to handling and vaginal smears before behavioral tests. Using a disposable pipette, 50μl sterile saline was flushed in the opening of the vaginal without insertion. The smear was displaced onto a glass slide and air dried. After the crystal violet staining 53, the sample was checked under a brightfield microscope. Estrous stage was identified by cell appearance across the cycle that reflects circulating gonadal steroids. Behavioral tests were performed on days when a clear smear was visible as proestrus stages. This estrous cycle tracking was only performed for the intact and sham groups.
Optogenetics
General procedures for light delivery.
Prior to behavioral testing, animals were habituated to handling and patch cable tethering in their home cage for at least three habituation sessions lasting 20min each. For optogenetic manipulations, light at about 5mW was delivered from a LED light source (470nm or 570nm or 625nm) through an optic cable. For photoactivation using ChR2, 470 nm light was pulsed at 10Hz with a pulse duration of 5 ms. For ChrimsonR based photo-tagging, 625 nm light was pulsed at 5, 10 and15Hz with a pulse duration of 5 ms. For photoinhibition, 570 nm light was delivered at 10s on and 5s off to minimize the channel habituation and rebound responses. Animals were able to move freely within the testing chambers or home cages. For each behavioral assay, customized python code and Arduino microcontrollers were used to control light delivery. Labview (v2021, National Instruments) was used to control the optical stimulation.
Chemogenetics
In vivo chemogenetic experiments.
Animals expressing hM4D(Gi) or hM3D(Gq) received intraperitoneal (IP) injection of clozapine-N-oxide (CNO) (1 mg/kg) 20 mins before the behavior test.
In vitro chemogenetic experiments.
To verify the efficiency and effect of the CNO on hM4D(Gi) or hM3D(Gq) expressing neurons, whole-cell patch clamp recording was performed and membrane potential responses were examined before and after perfusion of CNO (10 μM).
Behavioral tests
Sucrose Preference Test (SPT).
Animals were water deprived for 24 h before the test and then exposed to one bottle of 2% sucrose water and one bottle of pure water for 1 h in the dark phase. Bottle positions were switched after 30 min. For optogenetic manipulations, mice received light-stimulation (10Hz, 5ms pulse duration, 3–5mW) during the whole testing period. Sucrose consumption ratio was calculated by dividing the total consumption of sucrose water to the total consumption of both sucrose water and pure water.
Tail Suspension Test (TST).
The TST involved hanging the mouse by the tail using tape, where one end of the tape was secured to a horizontal bar 40 cm from the ground, thus ensuring that the animal could not climb on other objects during the assay. Over the course of the experiment (6 min), the mouse switched from vigorous struggling behavior to increasing immobility. For optogenetic manipulations, LED light stimulation (10Hz, 5ms pulse duration, 3–5mW) was delivered immediately after mice were placed in the testing chamber and lasted for 6 min. To minimize the impact of the optic cable on behavior, the cable was lifted by a helium balloon. The experiment was recorded on video and the time spent in immobility was measured by blind scoring of the video after testing was completed.
Forced Swimming Test (FST).
Animals were individually placed in a cylinder (12 cm diameter, 25 cm height for mice) of water (23–25 °C) and swam for 6 min under normal lighting condition (~110 lux). Water depth was set to prevent animals from touching the bottom with their tails or hind limbs. Animal behaviors were videotaped. The immobile time during the last 4 min was scored offline by an observer blinded to animal treatment. A mouse was judged to be immobile when it ceased struggling and remained floating motionless in the water making only movements necessary for keeping its head above the water. For optogenetic manipulations, LED light stimulation (10Hz, 5ms pulse duration, 3–5mW) was delivered immediately after mice were placed in the water and lasted for 6 min. To minimize the impact of the optogenetic cable on swimming behavior, the cable was lifted by a helium balloon.
Elevated Plus Maze test (EPM).
A crossed maze with two closed and two open arms was elevated 30 cm above the ground, with lighting condition of ~110 lux. The mouse was placed in the center of the crossed maze, and the locomotion of the animal was recorded with a video camera for 5 min. For optogenetic manipulations, LED light stimulation (10Hz, 5ms pulse duration, 3–5mW) was delivered immediately after mice were placed in the apparatus and lasted for 6 min. To minimize the impact of the optogenetic cable on locomotion, the cable was lifted by a helium balloon. Time spent on the open arm was automatically scored by our customized software.
Open Field Test (OFT).
A white behavior test box (60 cm×60 cm×30 cm, length×width×height) was divided into a center field (center, 30×30 cm) and a periphery field, with lighting condition of ~110 lux. For each test, the mouse was placed in the periphery, and the locomotion of the animal was recorded with a video camera for 20 min. Time spent in the center was automatically scored by our customized software.
Parental behavior test.
Testing was performed in the home cage. 30-min before the test, the home cage together with the testing female mouse was placed in the testing area. At the start of the test, a foreign pup younger than P5 was introduced and placed in the far end corner of the home cage relative to the nest. Test lasted for 15 min. Pup grooming time was scored by individuals blind to the allocation of the animals.
Social preference test.
A three-chamber testing box was used. Two clean, empty, inverted wire cups were placed in the two non-neighboring chambers. The testing mouse was habituated to the box for at least 20 min. An unfamiliar female juvenile mouse (4–5 weeks old) was introduced into the cup in one randomly chosen side. Test lasted for 10 min. The social preference index was calculated by dividing the difference in time spent in the social vs. non-social chamber over the total time spent in the two chambers. Time spent on either side was automatically scored by our customized software.
Behavioral tests followed the same sequence: 1) open field test, 2) elevated plus maze test, 3) pup grooming test, 4) social preference test, 5) sucrose preference test, 6) tail suspension test, 7) forced swimming test. Group order was counterbalanced during behavioral testing.
Electrophysiological recording and spike sorting
Multi-channel recording was carried out with a 16-channel silicone probe (A1×16-Poly2–5mm-50s-177-A16, 16 contacts separated by 50 μm, Neuronexus Technologies). Signals were recorded and filtered through a bandpass filter (0.3 – 3 kHz)54. The nearby four channels of the probe were grouped as tetrodes, and semiautomatic spike sorting was performed by using Offline Sorter (V4, Plexon Inc.). Semi-automated clustering was carried out based on the first three principal components of the spike waveform on each tetrode channel using a T-Dist E-M scan algorithm (scan over a range of 10–30 degree of freedom) and then evaluated with sort quality metrics. Clusters with isolation distance < 20 and L-Ratio > 0.1 were discarded. Spike clusters were classified as single units only if the waveform SNR (Signal to Noise Ratio) exceeded 4 (12 dB) and the inter-spike intervals exceeded 1.2 ms for > 99.5% of the spikes55.
Optrode recording
The Vgat+ neurons were genetically tagged by crossing Vgat-Cre with Ai27 (Cre-dependent ChR2 reporter line). The optrode (A1×16-Poly2–5mm-50s-177-OA16LP, 16 contacts separated by 50 μm, the distance between the tip of the optic fiber and the probes is 200 μm, NA 0.22, Neuronexus Technologies) was connected to a LED light source (480 nm, Thorlabs) with an optic fiber. To identify ChR2+ neurons, 5 or 10 Hz (5-ms pulse duration, 100-ms total duration, controlled via an Arduino microcontroller) LED pulse trains were delivered intermittently. To assess whether these units were driven directly by ChR2 or indirectly by synaptic connections, we analyzed the onset latency relative to each light pulse. Only spikes with latency < 4 ms were considered as being directly stimulated in this study. We analyzed the waveform similarity between LED-evoked and spontaneously generated spikes, and correlation coefficient > 0.9 was used as a criterion for determination of the same unit56.
Image acquisition
To check the expression of eYFP, GFP or mCherry, or electrode tracks (coated with DiI), the animals were deeply anesthetized using urethane (25%) and transcardially perfused with phosphate-buffered saline (PBS) and paraformaldehyde (4% in PBS). Coronal brain sections (150 μm) were made with a vibratome (Leica Microsystems) and stained with Nissl reagent (Deep red, Invitrogen) for 2 hours at room temperature. Each slice was imaged under a confocal microscope (Olympus).
Behavioral data analysis
Markerless body parts were extracted using machine learning based DeepLabCut 57 and our custom-made software (written by Guangwei Zhang, in Python 3.6). For the forced swimming and tail suspension tests, kicks frequency was extracted, based on which the time of immobility was calculated. Due to a batch process, behavior was blinded to the analysis. Some results were compared to analysis by human eyes to verify the accuracy.
Slice recording
To confirm the connectivity between MPOA GABAergic axons and VTA or vlPAG neurons, Vgat-IRES-Cre mice injected with Cre-inducible ChR2 in MPOA were used for slice recording. Three weeks following the injections, animals were decapitated following urethane anesthesia and the brain was rapidly removed and immersed in an ice-cold dissection buffer (composition: 60 mM NaCl, 3 mM KCl, 1.25 mM NaH2PO4, 25 mM NaHCO3, 115 mM sucrose, 10 mM glucose, 7 mM MgCl2, 0.5 mM CaCl2; saturated with 95% O2 and 5% CO2; pH = 7.4). Coronal slices at 350 μm thickness were sectioned by a vibrating microtome (Leica VT1000s) and recovered for 30 min in a submersion chamber filled with warmed (35°C) ACSF (composition:119 mM NaCl, 26.2 mM NaHCO3, 11 mM glucose, 2.5 mM KCl, 2 mM CaCl2, 2 mM MgCl2, and 1.2 NaH2PO4, 2 mM Sodium Pyruvate, 0.5 mM VC). PAG neurons surrounded by EYFP+ fibers were visualized under a fluorescence microscope (Olympus BX51 WI). Patch pipettes (~4–5 MΩ resistance) filled with a cesium-based internal solution (composition: 125 mM cesium gluconate, 5 mM TEA-Cl, 2 mM NaCl, 2 mM CsCl, 10 mM HEPES, 10 mM EGTA, 4 mM ATP, 0.3 mM GTP, and 10 mM phosphocreatine; pH = 7.25; 290 mOsm) were used for whole-cell recordings. Signals were recorded with an Axopatch 700B amplifier (Molecular Devices) under voltage clamp mode at a holding voltage of –70 mV for excitatory currents, filtered at 2 kHz and sampled at 10 kHz. Tetrodotoxin (TTX, 1 μM) and 4-aminopyridine (4-AP, 1 mM) were added to the external solution for recording monosynaptic responses to blue light stimulation (5 ms pulse, 3 mW power, 10–30 trials)58,59. CNQX (20 μM, Sigma-Aldrich) was added to the external solution to block glutamatergic currents. −50pA to +100pA current (at 10pA step) were injected to test the membrane responses.
For testing the efficacies of ChR2, ArchT and hM4D(Gi), hM3D(Gq), brain slices were prepared similarly, and whole-cell current clamp recordings were made from neurons expressing ChR2, ArchT, hM4D(Gi) or hM3D(Gq). A train of blue light pulses at different frequencies (1–20 Hz, 5-ms pulse duration) was applied to measure spike responses of ChR2-expressing neurons. Green light stimulation (10-s duration) was applied to measure hyperpolarization in ArchT-expressing neurons. For neurons expressing hM4D(Gi) or hM3D(Gq), spontaneous spikes were recorded before and after perfusion of CNO (10 μM) and after washing out CNO.
Noisy leaky integrate-and-fire neuron model
To investigate the relationship between synaptic input amplitudes and spike rate at a constant overall E/I ratio, we adopted a noisy leaky integrate-and-fire (LIF) model60 to simulate the membrane dynamics:
is the membrane capacitance, is the membrane potential, is the resting membrane potential, is the leak conductance, is the external input current, is the noise current. Once the membrane potential reaches the threshold (), a spike is counted and the membrane potential will be reset to the after the refractory period (2 ms). The excitatory and inhibitory input currents were simulated as a transient increase with an exponential decay with randomized input timing61. The excitatory and inhibitory synaptic ratio was set as 1 with a tolerance range of ±0.1, as calculated by the total input current ratio between E and I.
Statistics
No statistical methods were used to predetermine sample sizes. Sample sizes were selected based on previous experience from related research or literature11,15,49,50,54,55,56. All experiments were conducted using 2 to 4 cohorts of animals. The results were reproducible across cohorts and combined for the final analysis. Animals were randomly assigned to control and treatment groups. For animals with multiple assays, the sequence of assays was randomized. Investigators were not blinded to group allocation or data collection, but the analyses of behavioral data were performed blind to the conditions of experiments, as data obtained under different conditions were pooled together for an automatic batch analysis with computer software. Prism version 8 software (GraphPad) and R were used for statistical analysis. The Kolmogorov–Smirnov test was used to test for normality. The Mann–Whitney test was used for non-normally distributed data. One-way ANOVA and two-way ANOVA and post hoc Tukey’s multiple comparisons were used to test significance between samples. For two-group comparison of normal data, significance was determined by t-test.
Extended Data
Extended Data Fig. 1. Ovarian hormone withdrawal induced depressive-like behaviors in female mice and effects of silencing MPOA GABAergic neurons in male mice.
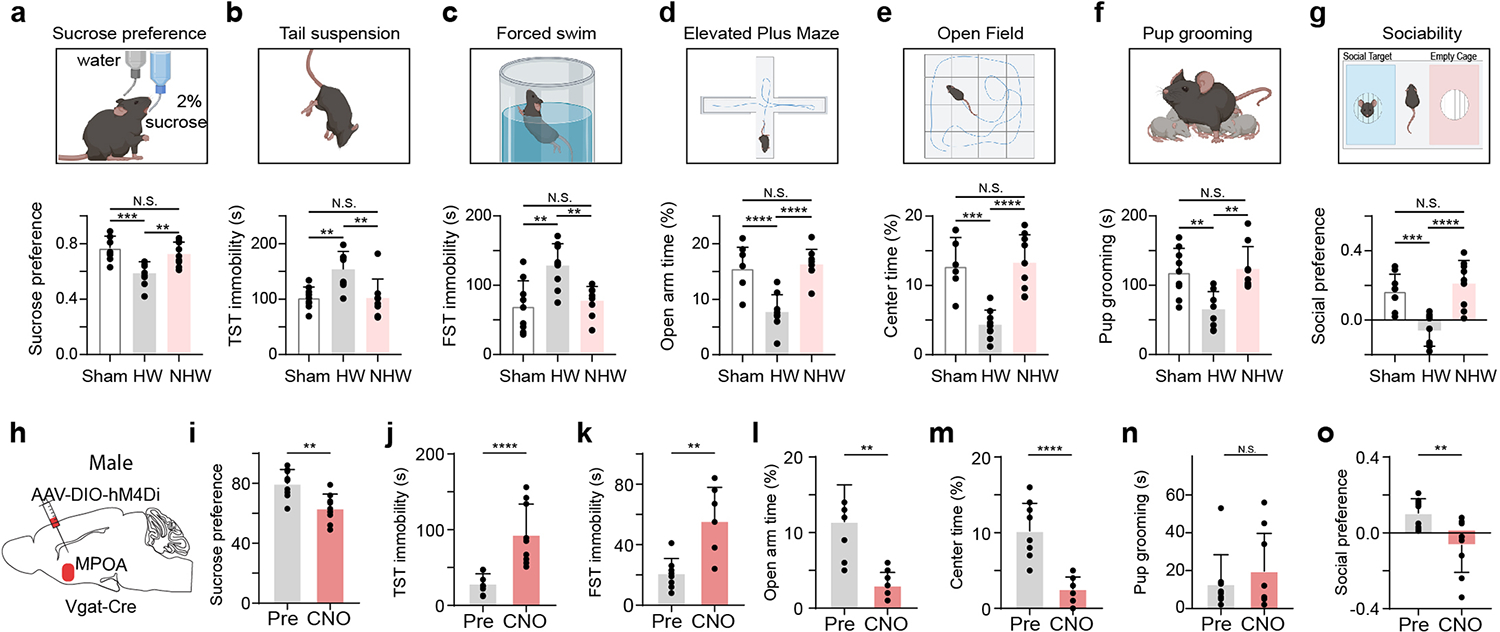
a, Top, schematic behavioral assay of sucrose preference test (SPT). Bottom, percentage sucrose water consumption. Sham vs HW, ***P = 0.0004, NHW vs HW, **P = 0.0048, Sham vs NHW, N.S., P = 0.6103, two-tailed one-way ANOVA with postdoc hoc test, n = 9 mice in each group. b, Immobility time in tail suspension test (TST). Sham vs HW, **P = 0.003, NHW vs HW, **P = 0.0028, Sham vs NHW, N.S., P = 0.9997, two-tailed one-way ANOVA with postdoc hoc test, n = 9 mice in each group. c, Immobility time in forced swimming test (FST). Sham vs HW, **P = 0.0012, NHW vs HW, **P = 0.0048, N.S., P =0.8448, two-tailed one-way ANOVA with postdoc hoc test, n = 9 mice in each group. d, Percentage time spent in open arms in the elevated plus maze (EPM). ****P < 0.0001, N.S., P = 0.8923, two-tailed one-way ANOVA with postdoc hoc test, n = 9 mice in each group. e, Percentage time spent in the center in the open field test (OFT). ***P = 0.0001, ****P < 0.0001, N.S., P = 0.9562, two-tailed one-way ANOVA with postdoc hoc test, n = 9 mice in each group. f, Time of pup grooming. Sham vs HW, **P = 0.0036, NHW vs HW, **P = 0.0016, N.S., P = 0.9434, two-tailed one-way ANOVA with postdoc hoc test, n = 9 mice in each group. g, Social preference index in the three-chamber sociability test. ***P = 0.0006, ****P < 0.0001, N.S., P = 0.6586, one-way ANOVA with postdoc hoc test, n = 9 mice in each group. Data are presented as mean values +/− s.d.. h, Chemogenetic suppression of MPOA Vgat+ neurons by injecting AAV-DIO-hM4Di (or DIO-mCherry as control) in normal Vgat-Cre male animals. i-o, Various behavioral tests. Statistics: **P = 0.0024 (i), ****P < 0.0001 (j), **P = 0.0015 (k), **P = 0.0002 (l), ****P < 0.0001 (m), N.S., P = 0.8111 (n), **P = 0.0085 (o), two-tailed Mann-Whitney test, n = 9 mice in each group, mean ± s.d...
Extended Data Fig. 2. Post hoc verification of recording position, viral expression and cannula implantation.
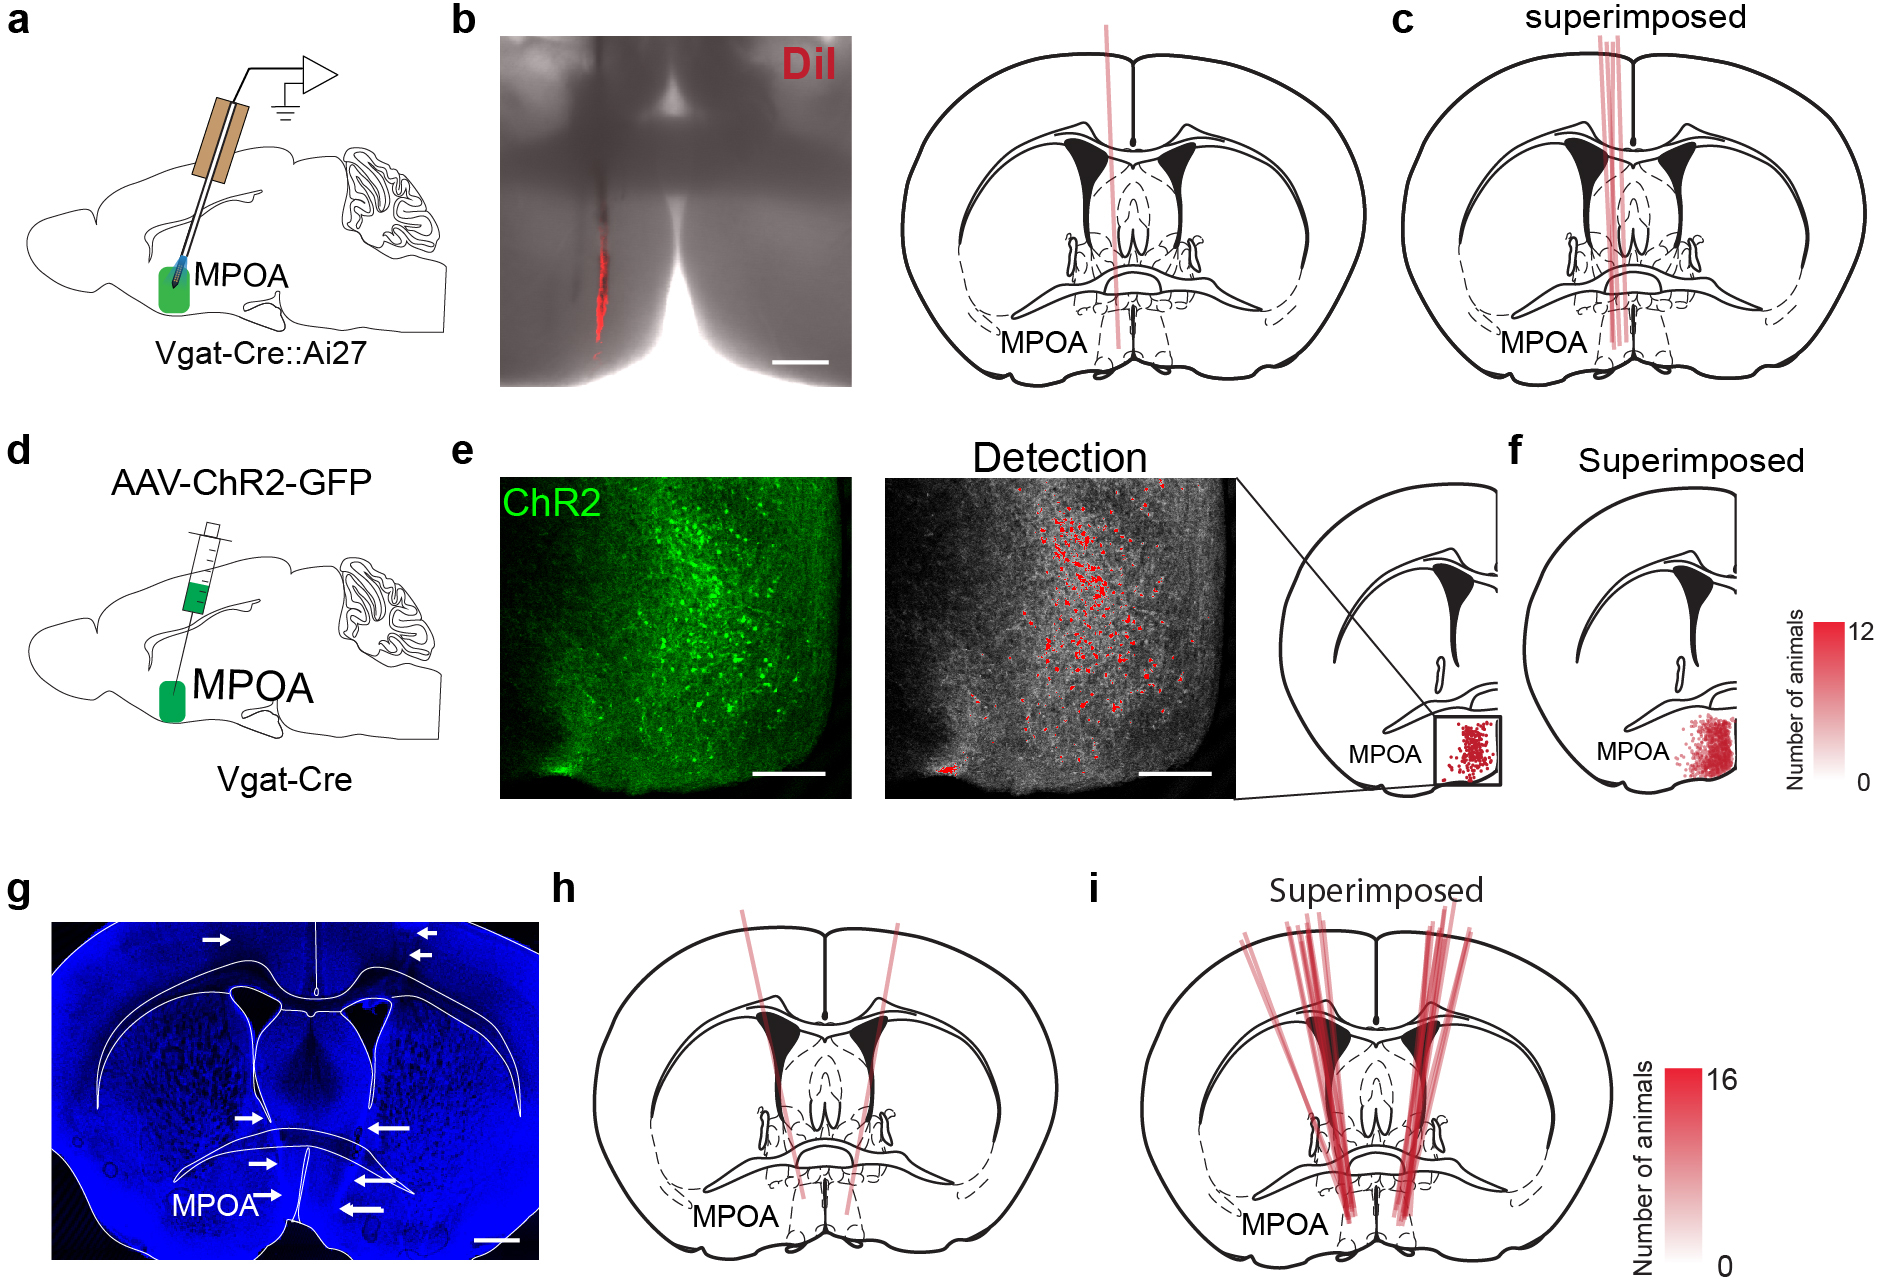
a, Schematic of optrode recording in MPOA. b, Left, an example image showing the electrode track marked by DiI. Scale bar, 200 μm. Right, registration of the electrode track with the mouse brain atlas. c, Superimposed optrode tracks in different experiments. d, Schematic of stereotactic injection of AAV-DIO-ChR2-EYFP into MPOA. e, Expression of ChR2-EYFP in MPOA. Each red dot represents an individual neuron. Scale bar, 200 μm. Position of each cell is registered to the mouse brain atlas. f, Superimposed ChR2-expressing cells in different experiments. Opacity of pink color is proportional to the number of mice expressing the desired channel in that location. g, An example image showing the track of implanted drug cannula, highlighted by white arrows. Blue, Nissl staining. Scale bar, 500 μm. h, Registration of the cannula implantation with the brain atlas. i, Superimposed cannula implantation tracks in different experiments..
Extended Data Fig. 3. Functional verification of chemogenetics and optogenetics approaches, slice whole-cell recording and spike features.
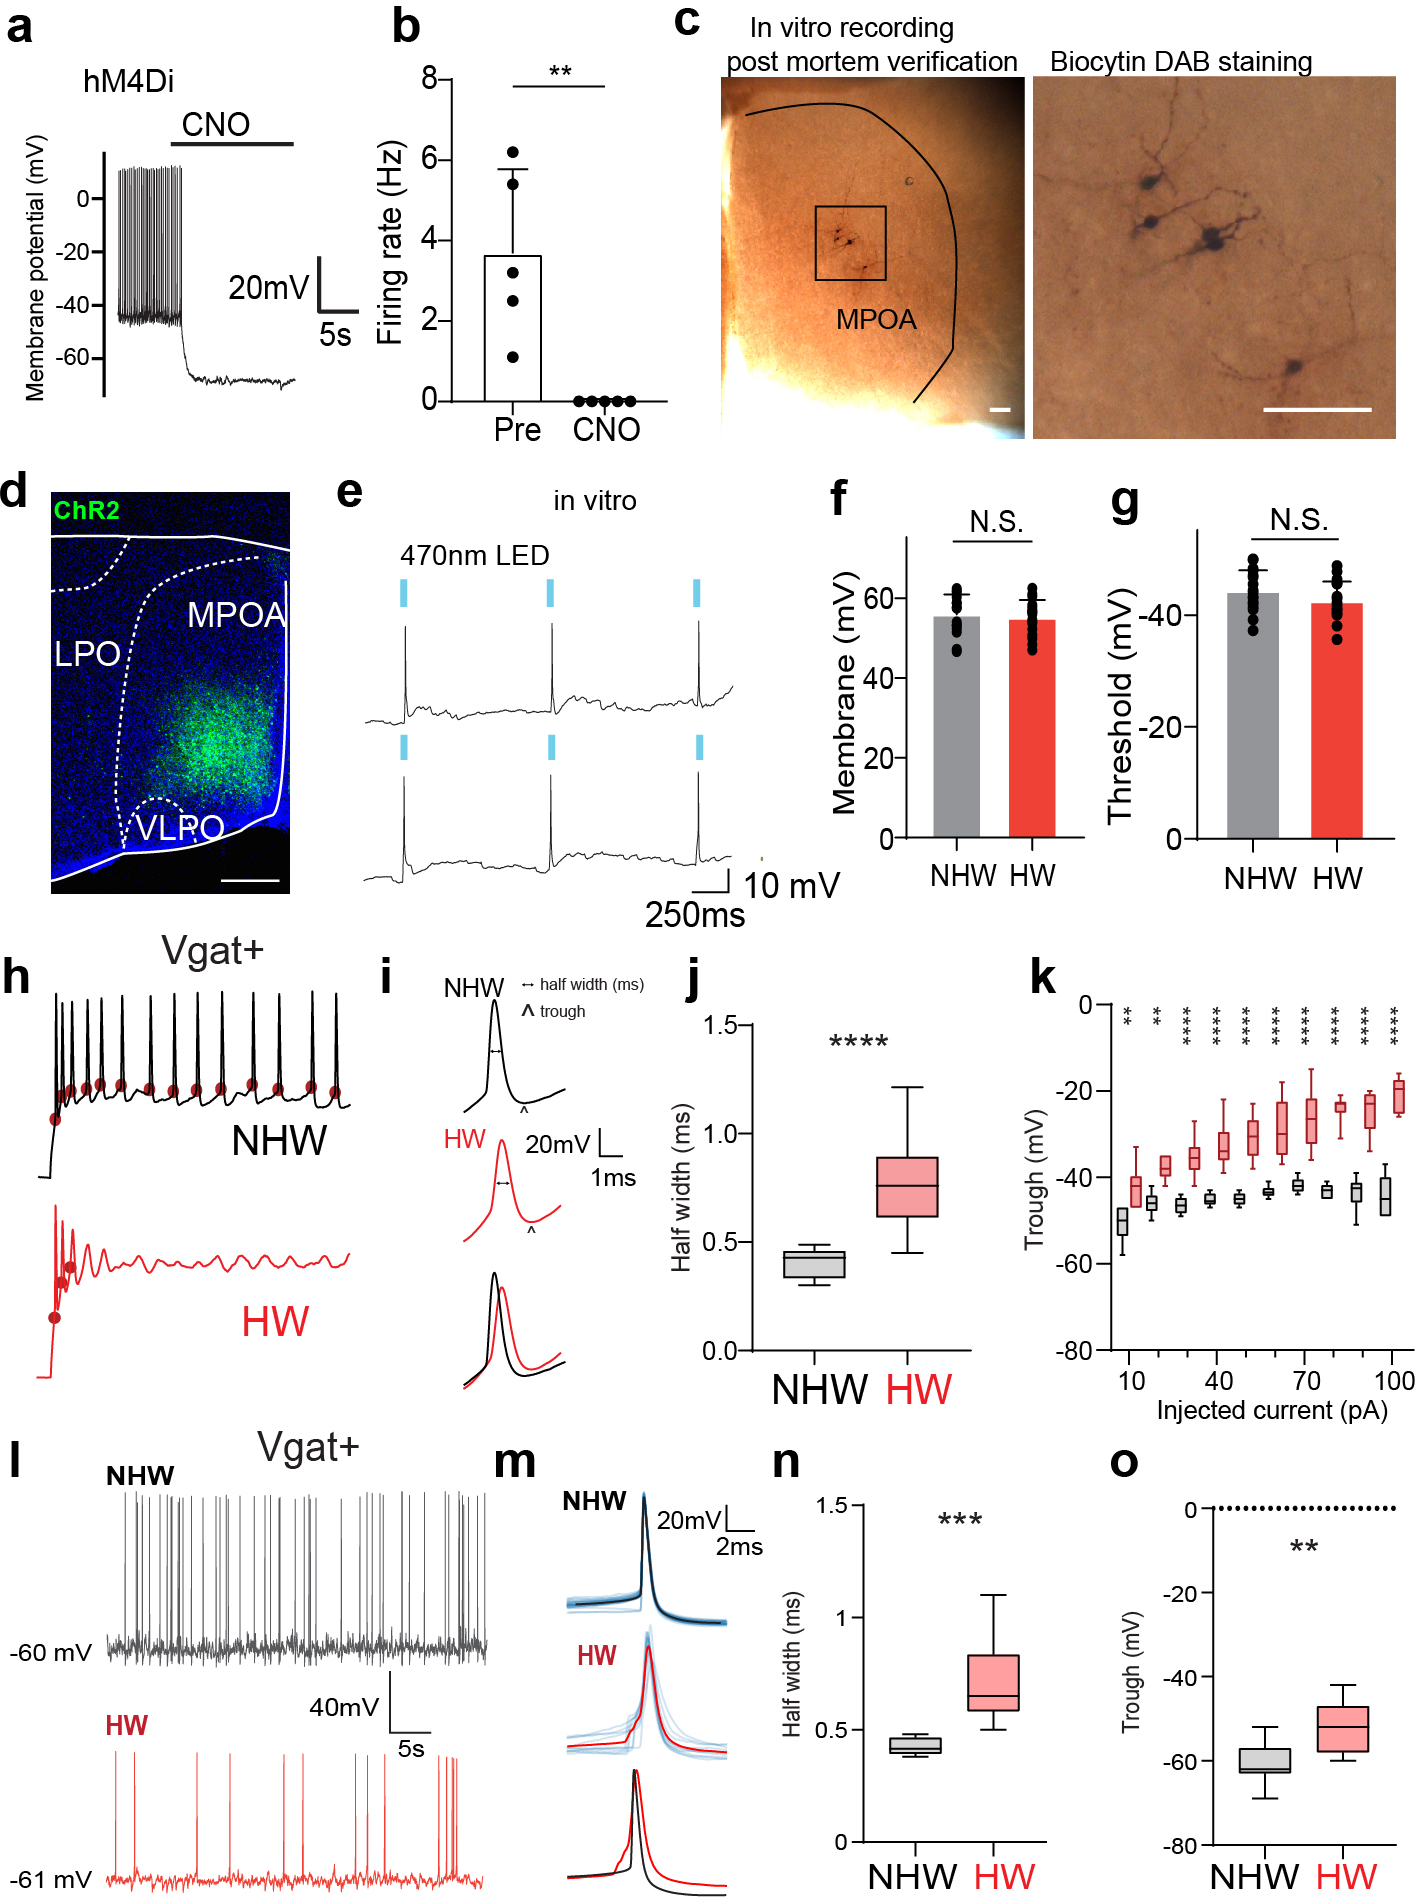
a, Membrane hyperpolarization in response to perfusion of CNO in an example cell. Whole-cell recording was performed in DREADD receptor expressing Vgat+ neurons in MPOA (labeled by mCherry). b, Spontaneous firing rates before and after perfusion of CNO. **P = 0.0079, Two-tailed Mann-Whitney test. n=5 cells from 2 animals. c, Images showing the morphology of recorded MPOA neurons after biocytin staining. Scale bar, 100 μm. d, An example image showing the expression of ChR2 in MPOA, Scale bar, 400 μm. e, Slice whole-cell recording from a ChR2-expressing neuron showing action potentials evoked by 470nm LED light pulses (marked by blue bars). f, Average resting membrane potentials of MPOA Vgat+ neurons in NHW and HW slices. N.S., P = 0.5689, Two-tailed Mann-Whitney test. g, Action potential threshold of MPOA Vgat+ neurons in NHW and HW slices. N.S., P = 0.1309, Two-tailed Mann-Whitney test. f-g, n = 17 and 17 cells for NHW and HW respectively, from 4 animals in each group. Error bar, s.d. h, Example traces of membrane potential response to 60pA current injection in MPOA Vgat+ neurons. Red dot marks the onset of action potential. i, Example spike shapes (2nd evoked spikes). Scale bar, 20mV, 2ms. The horizontal dotted line indicates the half-peak width of the spike and the arrow marks the trough voltage. j, Average half-peak spike width of MPOA Vgat+ neurons in NHW and HW slices. n = 14 cells from 4 animals. ****P < 0.0001, Two-tailed Mann-Whitney test. k, Average trough voltage at different injection current amplitudes. n=14 cells from 4 animals. **P <0.01; ****P <0.0001, two-way repeated measures ANOVA, for exact P values see Extended Data Table 1. l, Example traces of spontaneous spikes of MPOA Vgat+ neurons in NHW and HW slices. m, Average spike shapes (solid color) of MPOA Vgat+ neurons. Light colors label individual spikes. n, Average half-peak spike width of spontaneous spikes of MPOA Vgat+ neurons in NHW and HW slices. n=8 cells from 4 animals. ***P = 0.0002, Two-tailed Mann-Whitney test. o, Average trough voltage of spontaneous spikes. n=11 cells from 4 animals. **P = 0.0015, Two-tailed Mann-Whitney test. For boxplot, centerline, mean, upper and lower end, 90 and 10 percentile.
Extended Data Fig. 4. Changes in sEPSC frequency and effects of changes in synaptic event amplitude on spike rate.
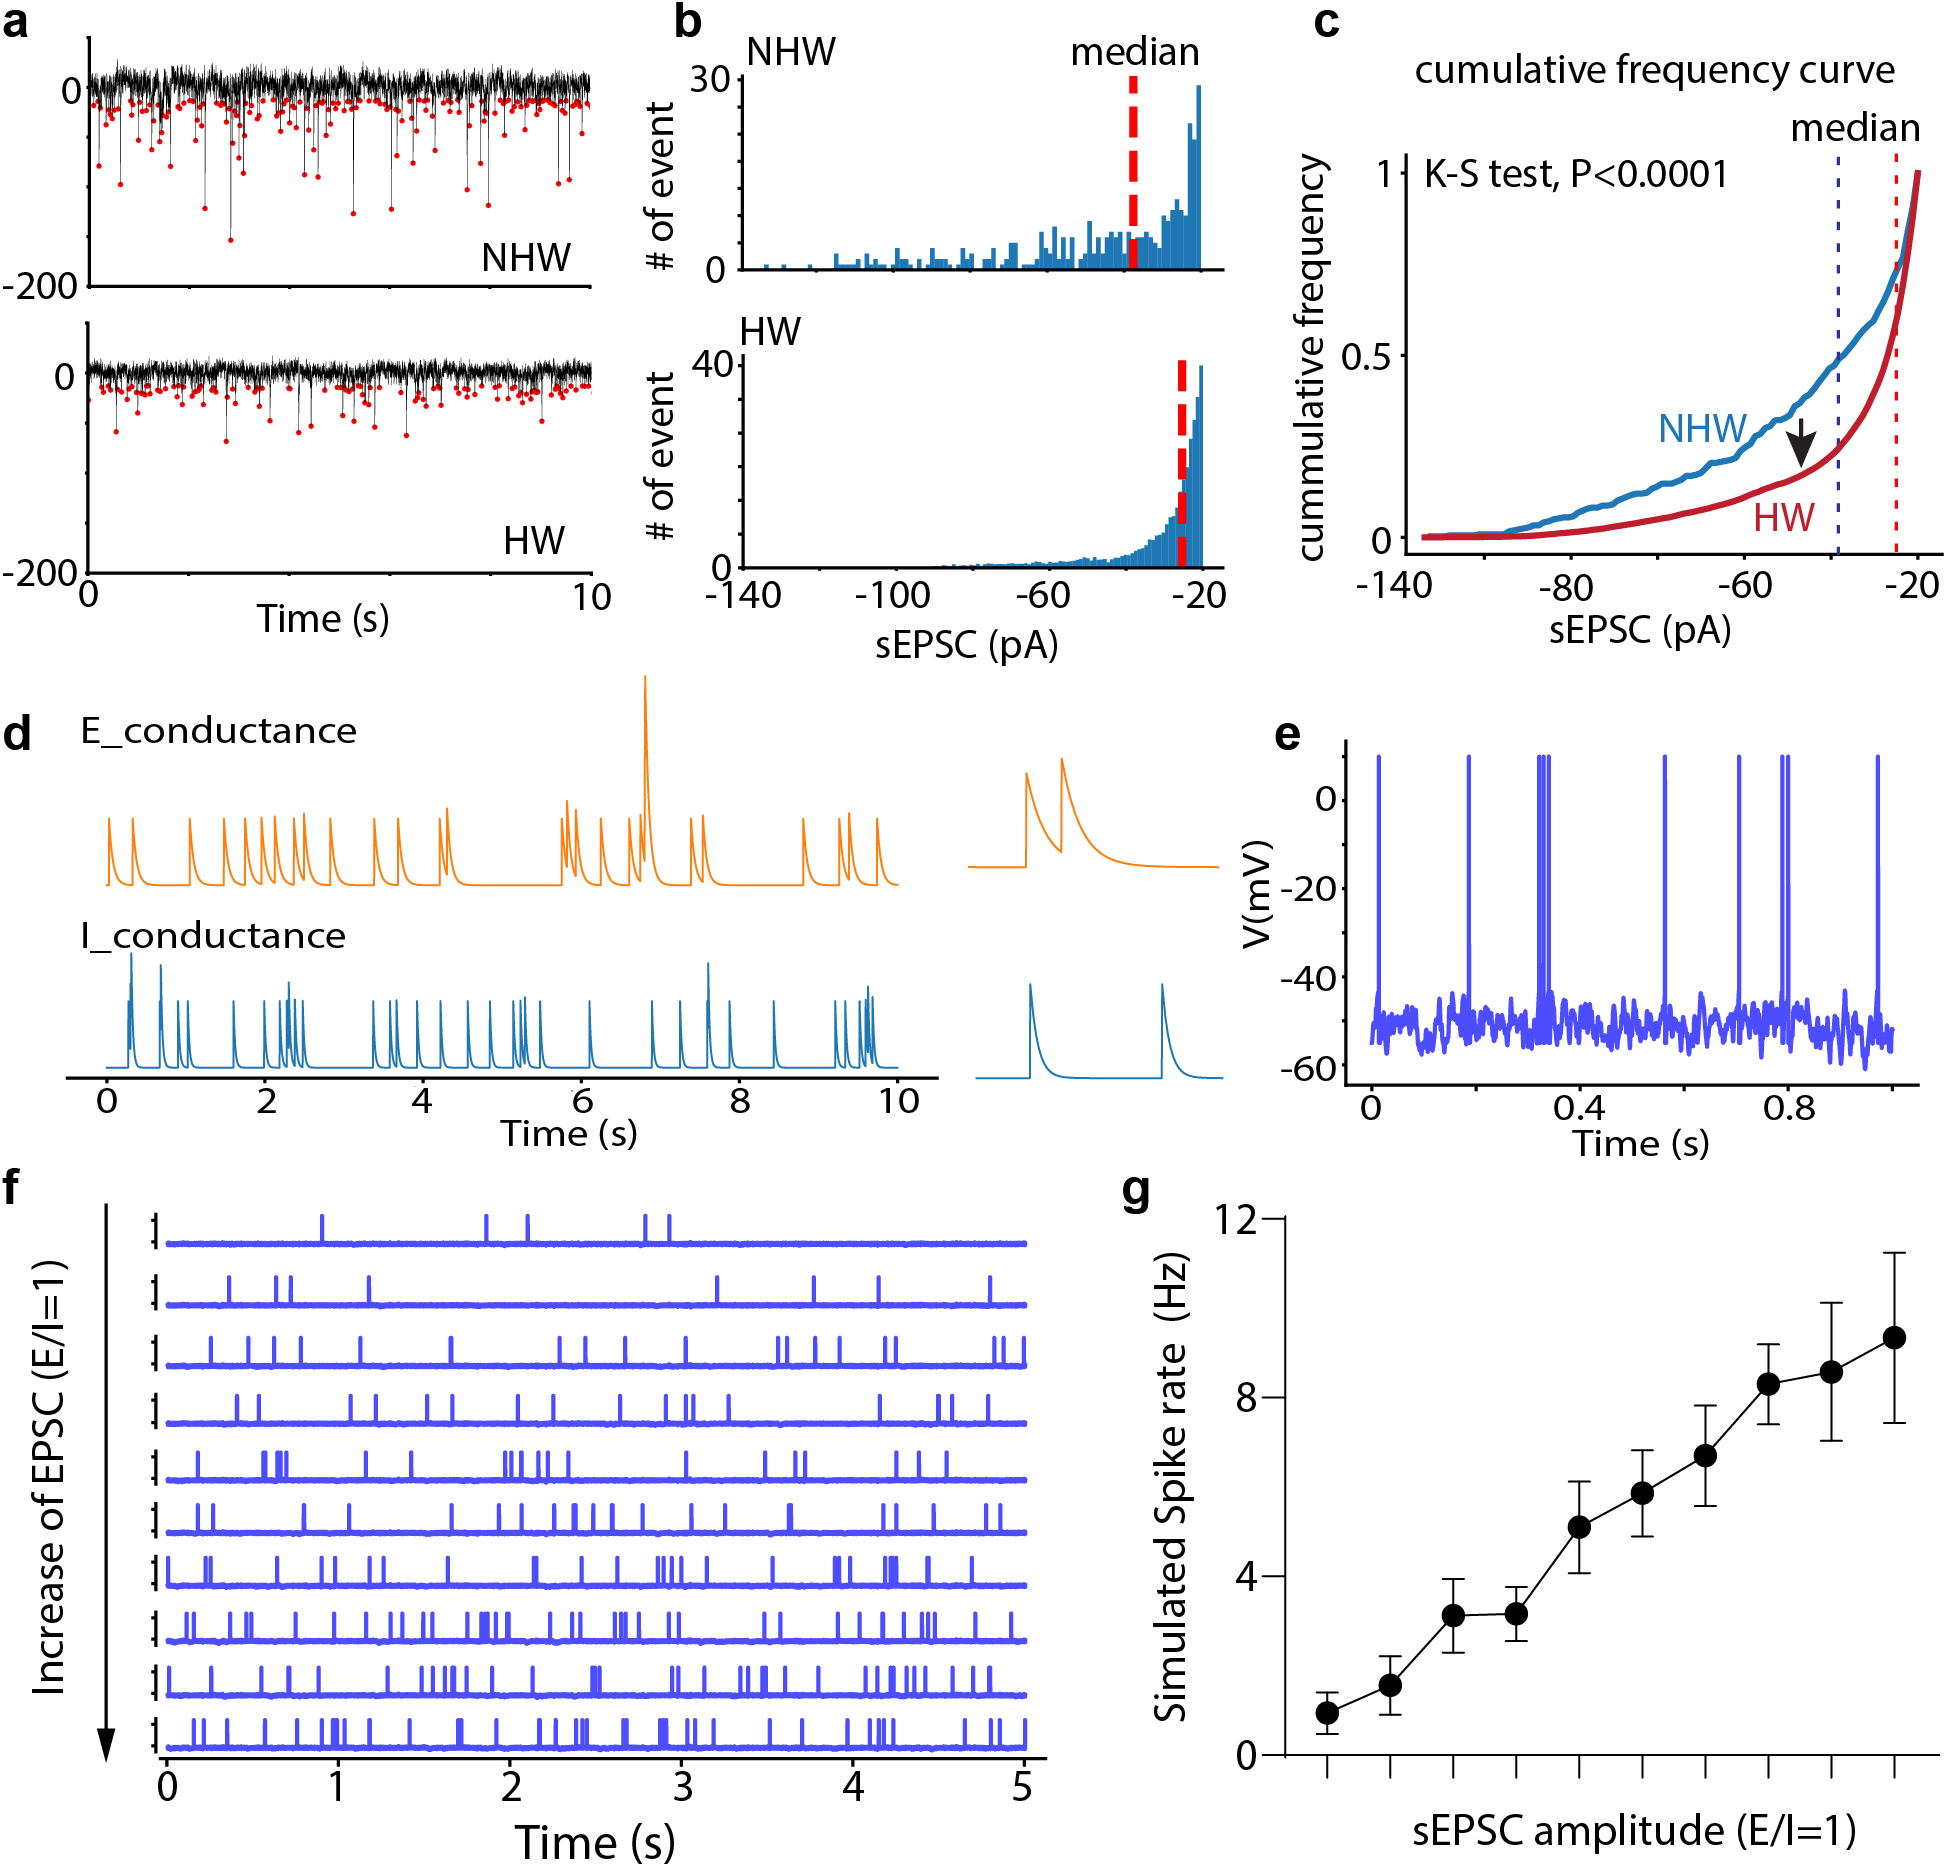
a, Example sEPSC events within a 10-sec window, red dot indicates the peak. b, Distribution of sEPSC amplitudes shown in (a), red dashed line represents the median value. c, Cumulative distribution of sEPSC amplitudes shown in (a). P<0.0001, two-tailed K-S test. d, Simulated conductances of spontaneous excitatory and inhibitory events. e, Spikes generated from integrating spontaneous excitatory and inhibitory events using the leaky integrate-and-fire neuron model (see Methods). f, Raster plots of spontaneous spikes with increasing excitatory synaptic strength, with a constant overall E/I ratio. g, Simulated spike rate versus the mean amplitude of sEPSCs. Note that the E/I ratio was kept the same. n = 10 trials, error bar represents s.d..
Extended Data Fig. 5. Dual color retrograde labeling of VTA- or PAG-projecting MPOA Vgat neurons.

a, Schematic of injections of CTB in Vgat-Cre::Ai14 mice. b, Images showing CTb647-labeled (PAG-targeting), CTb488-labeled (VTA-targeting), and Vgat+ (tdTomato expressing) neurons in MPOA. Scale bar, 100μm. c, Percentage of MPOA Vgat+ neurons showing single and double CTB labeling (mean ± s.d., n = 3 animals)..
Extended Data Fig. 6. Control experiments for the dual optical stimulation.
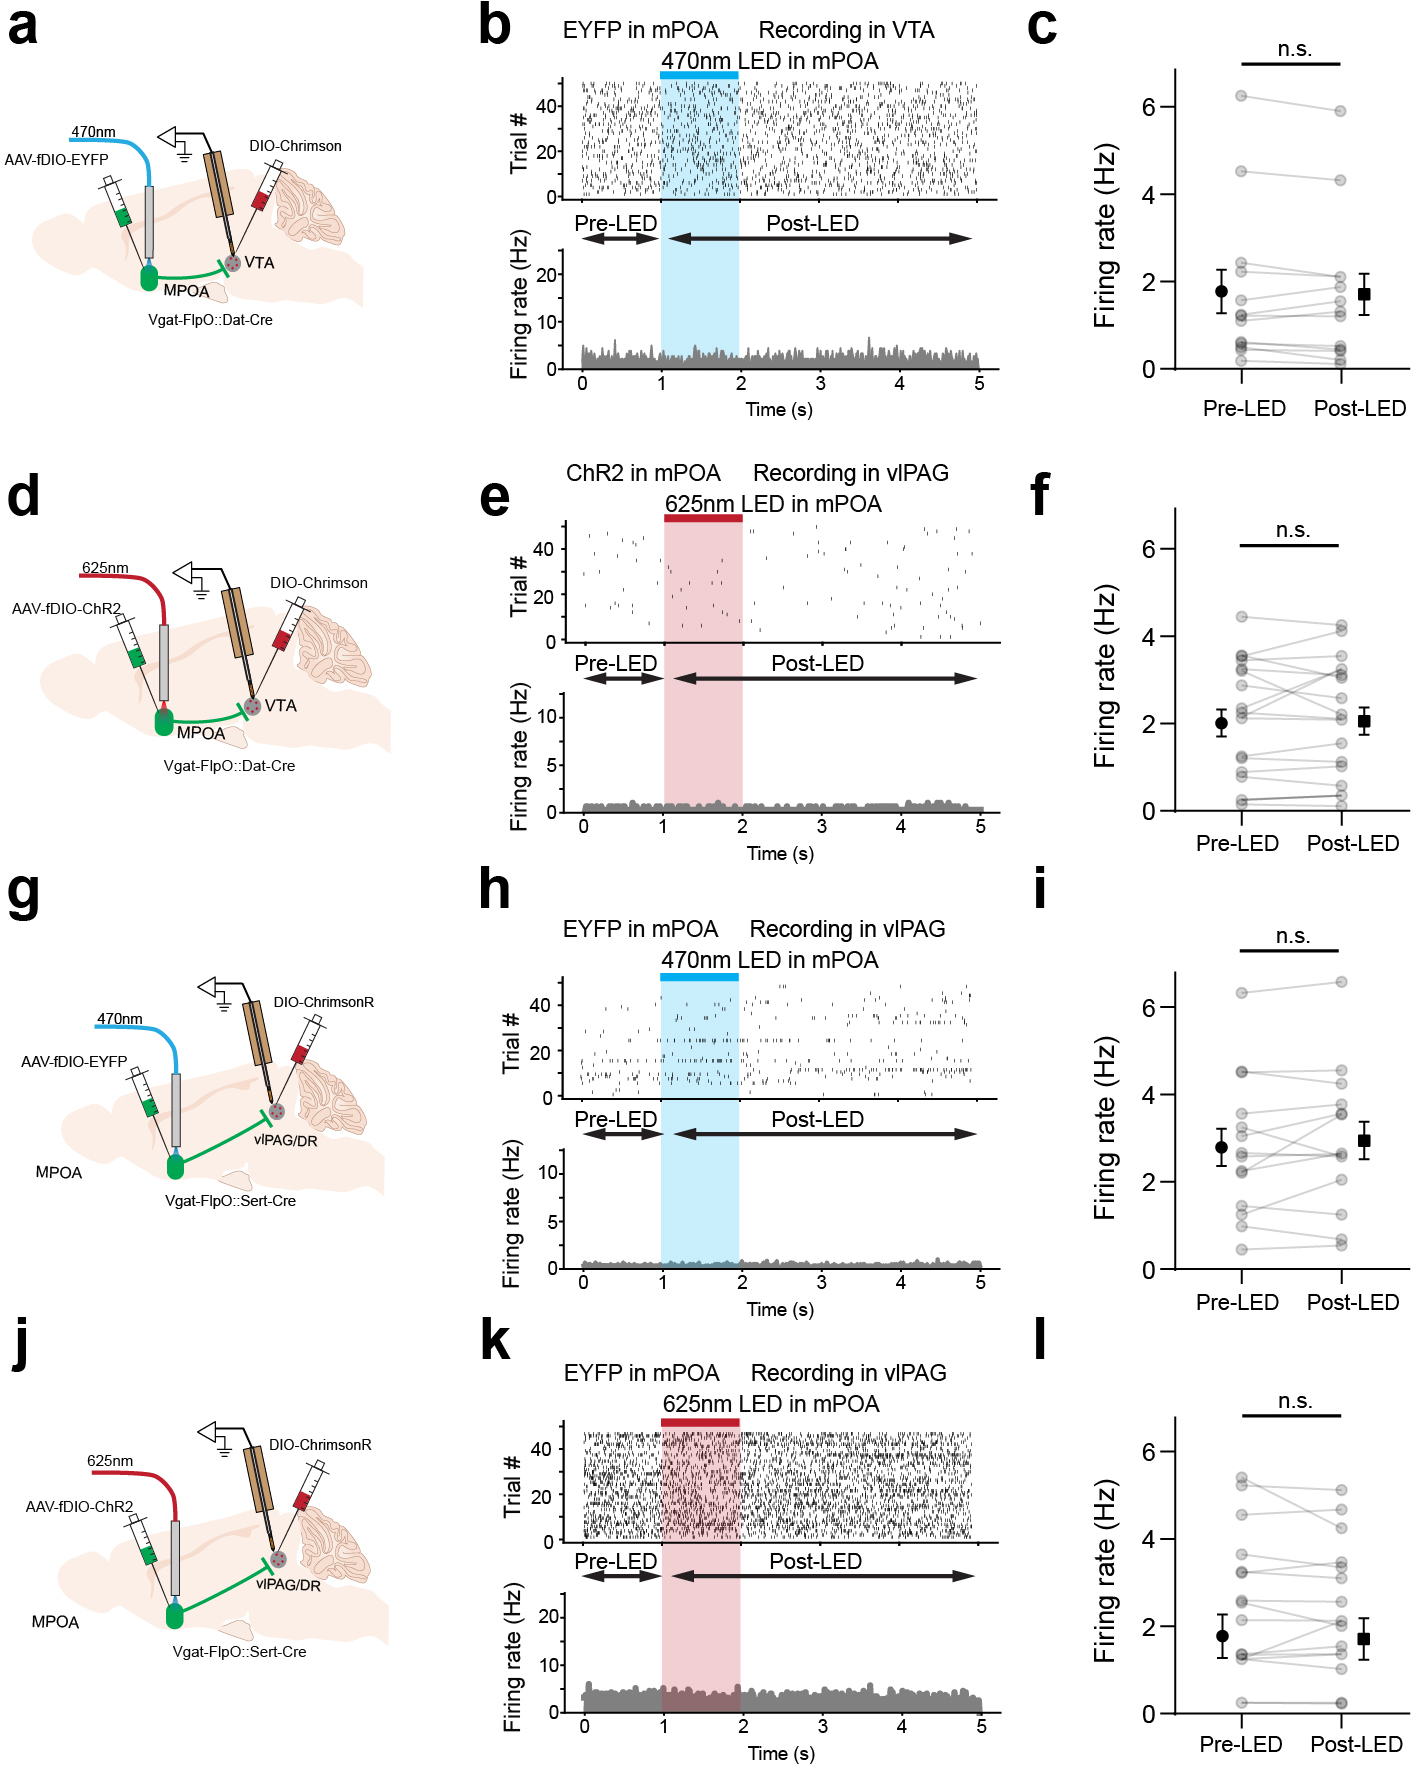
a, Experimental strategy: expressing EYFP in MPOA Vgat+ neurons and ChrimsonR in VTA Dat+ neurons, while delivering 470nm LED light stimulation in MPOA. b, Raster plot (upper) and PSTH (lower) for an example VTA Dat+ neuron in response to 470nm light stimulation. c, Firing rates before and after the onset of light stimulation. n = 13 cells from 2 animals. N.S., P = 0.3421, two-tailed paired t test. Error bar, s.d. d-f, Similar to a-c but for expressing ChR2 in MPOA Vgat+ neurons and ChrimsonR in VTA Dat+ neurons, while delivering 625nm light stimulation in MPOA. n = 19 cells from 2 animals. N.S., P = 0.7076, two-tailed paired t test. Error bar, s.d. g-i, Similar to a-c but for expressing EYFP in MPOA Vgat+ neurons and ChrimsonR in DR Sert+ neurons, while delivering 470nm light stimulation in MPOA. n = 14 cells from 2 animals. N.S., P = 0.2668, two-tailed paired t test. Error bar, s.d. j-l, Similar to d-f but for expressing ChR2 in MPOA Vgat+ neurons and ChrimsonR in DR Sert+ neurons, while delivering 625nm LED light stimulation in MPOA. n = 16 cells from 2 animals. N.S., P = 0.5587, two-tailed paired t test. Error bar, s.d..
Extended Data Fig. 7. Verification of monosynaptic connections between MPOA and VTA/PAG.
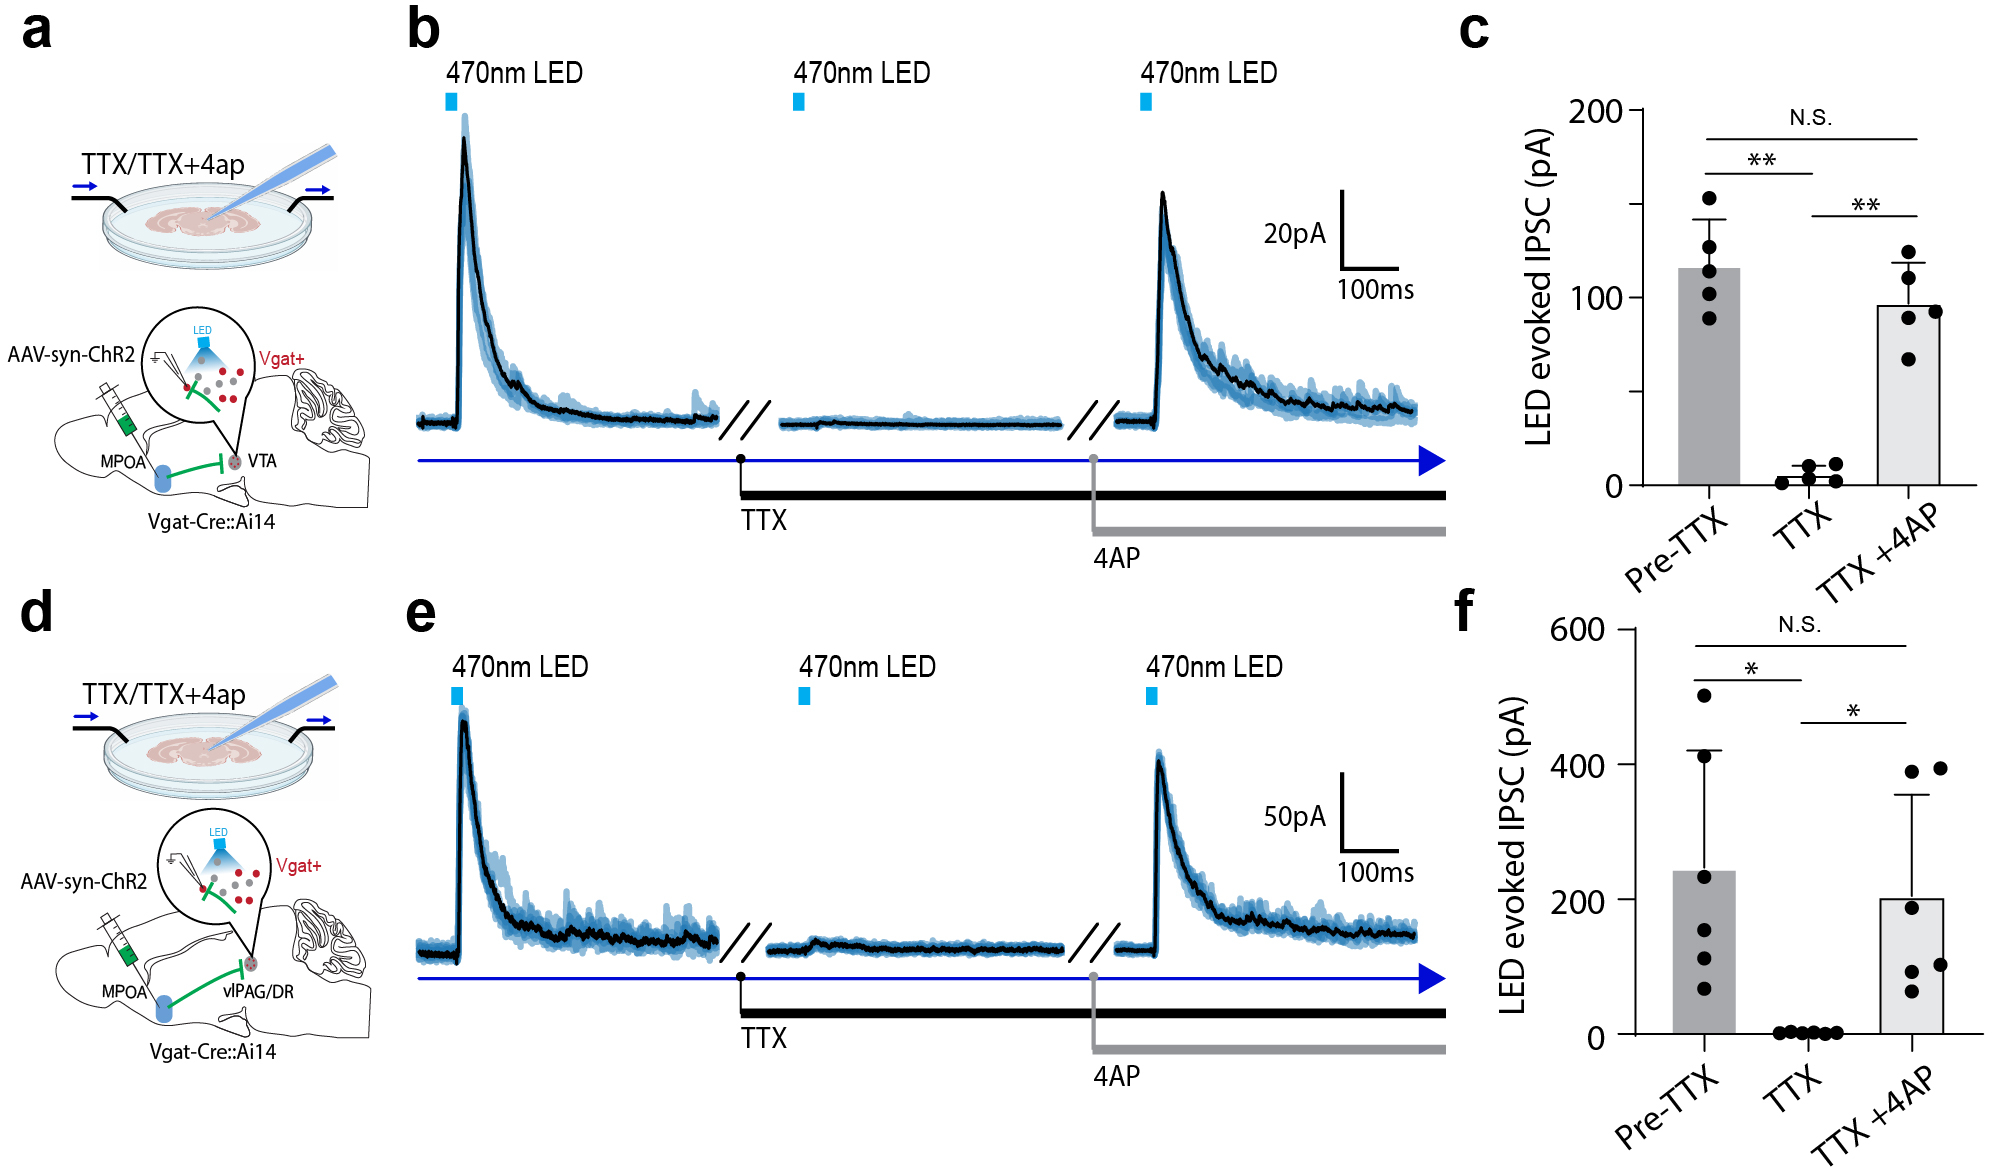
a, Whole-cell patch clamp recording from Vgat+ neurons in VTA of Vgat-Cre::Ai14 mice. AAV-syn-ChR2 was injected into MPOA. b, Averaged trace (black, n = 5 trials) of light-evoked inhibitory synaptic responses (recorded at 0mV) in the control condition, after application of TTX and after co-application of TTX and 4AP. Blue shade represents raw traces. c, Mean IPSC amplitudes in the three conditions. Pre-TTX vs TTX, **P = 0.0013. Pre-TTX vs TTX+4AP, N.S. P = 0.1518, TTX vs TTX+4AP, **P =0.0017, repeated measures one-way ANOVA with multiple comparisons, n = 5 cells in each group, from 2 animals. Error bar, s.d. d, Whole-cell recording from Vgat+ neurons in vlPAG of Vgat-Cre::Ai14 mice. AAV-syn-ChR2 was injected into MPOA. e, Averaged trace (black, n = 5 trials) of light-evoked inhibitory synaptic responses (recorded at 0mV) in the control condition, after application of TTX and after co-application of TTX and 4AP. Blue shade represents raw traces. f, Mean IPSC amplitudes in the three conditions. Pre-TTX vs TTX, *P = 0.0401. Pre-TTX vs TTX+4AP, P = 0.1151, TTX vs TTX+4AP, n = 6 cells from 3 animals in each group. Error bar, s.d., **P = 0.0468. Repeated measures one-way ANOVA with multiple comparisons.
Extended Data Fig. 8. Activation of VTA Dat+ neurons and DR Sert+ neurons in HW-treated mice.
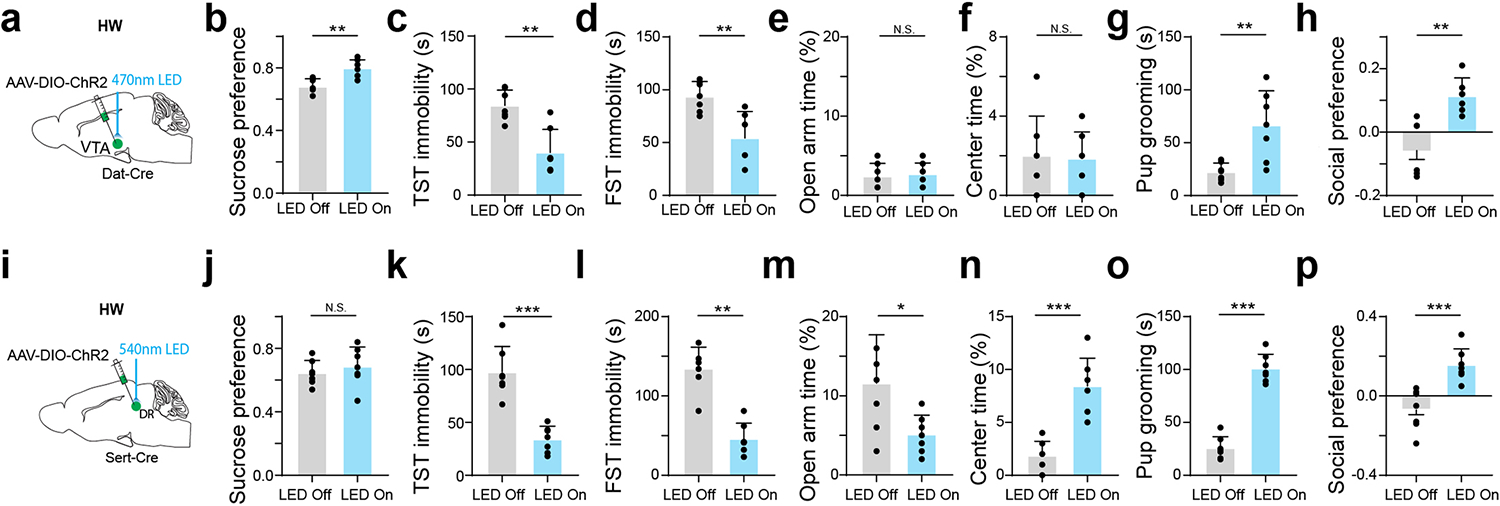
a, Schematic injection of AAV-DIO-ChR2 in VTA of Dat-Cre female HW animals. b, Percentage sucrose water consumption in SPT. **P = 0.0029, two-tailed Mann-Whitney test. c, Immobility time in TST. **P = 0.0041, two-tailed Mann-Whitney test. d, Immobility time in FST. **P = 0.0035, two-tailed Mann-Whitney test. e, Percentage time spent in open arms in EPM. P = 0.6737, two-tailed Mann-Whitney test. f, Percentage time spent in the center in OFT. P = 0.8945, two-tailed Mann-Whitney test. g, Pup grooming time. **P = 0.0082, two-tailed Mann-Whitney test. h, Social preference index in the three-chamber sociability test. **P = 0.0012, two-tailed Mann-Whitney test. b-h, n = 7 mice in each group, mean ± s.d. i-p, Similar to a-h but for photo-activation of DR Sert+ neurons. n = 7 mice in each group, Mean ± s.d. Statistics: P = 0.40214 (j), ***P = 0.0006 (k), **P = 0.0012 (l), *P = 0.0437 (m), ***P = 0.0006 (n), ***P = 0.0006 (o), ***P = 0.0006 (p), two-tailed Mann-Whitney test..
Extended Data Fig. 9. Esr1+ neurons in MPOA and their target specificity and spike features.
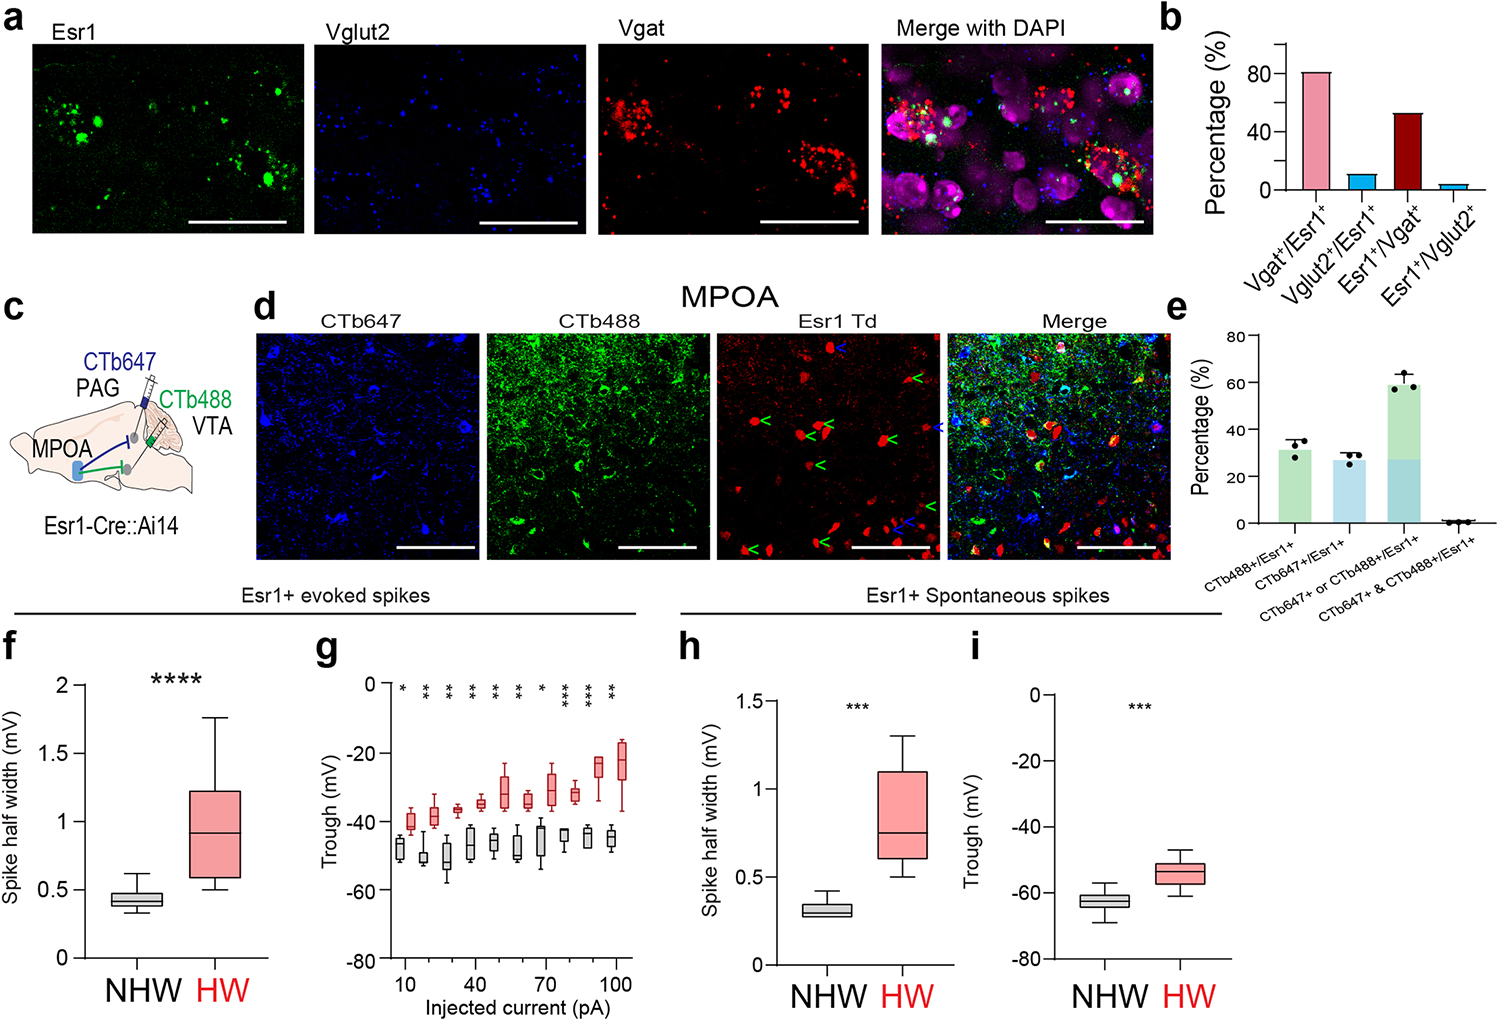
a, RNAscope staining of Esr1, Vglut2 and Vgat in MPOA. Scale bar, 50um. b, Percentage of neurons in different specific categories. 80% of Esr1+ neurons were Vgat+. c, Dual-color CTb retrograde tracing of MPOA neurons projecting to VTA and PAG in Esr1-Cre::Ai14 mice. d, Images in MPOA. Arrows indicate Esr1+ (tdTomato+) neurons co-labelled with CTb647 (blue, from PAG) or CTb488 (green, from VTA). Scale bar, 100μm. e, Percentage of neurons in specific categories. 60% of Esr1+ neurons were labeled by either CTB647 or CTb488. Mean ± s.d., n = 3 animals. f, Average half-peak spike width of MPOA Vgat+ neurons for spikes evoked by current injections in NHW and HW slices. n=14 cells for NHW group and 12 cells for HW group, from 3 animals in each group. ****P < 0.0001, two-tailed Mann-Whitney test. g, Average trough voltage at different injection current amplitudes. n = 6, 6 cells for NHW and HW group, from 3 animals respectively. *P < 0.05, **P < 0.01, ***P < 0.001, two-way repeated measures ANOVA. h, Average half-peak spike width of spontaneous spikes of MPOA Esr1+ neurons in NHW (n=10 cells from 3 animals) and HW (n=10 cells from 3 animals) slices. ***P = 0.0002, two-tailed Mann-Whitney test. i, Average trough voltage of spontaneous spikes. n=10,10 cells for NHW and HW group, from 3 animals for each group. ***P = 0.0002, two-tailed Mann-Whitney test. For boxplot, centerline, mean, upper and lower end, 90 and 10 percentiles.
Extended Data Fig. 10. Suppressing MPOA Vgat neurons in male mice, local administration of estrogen in MPOA and local administration of an estrogen receptor antagonist in MPOA.
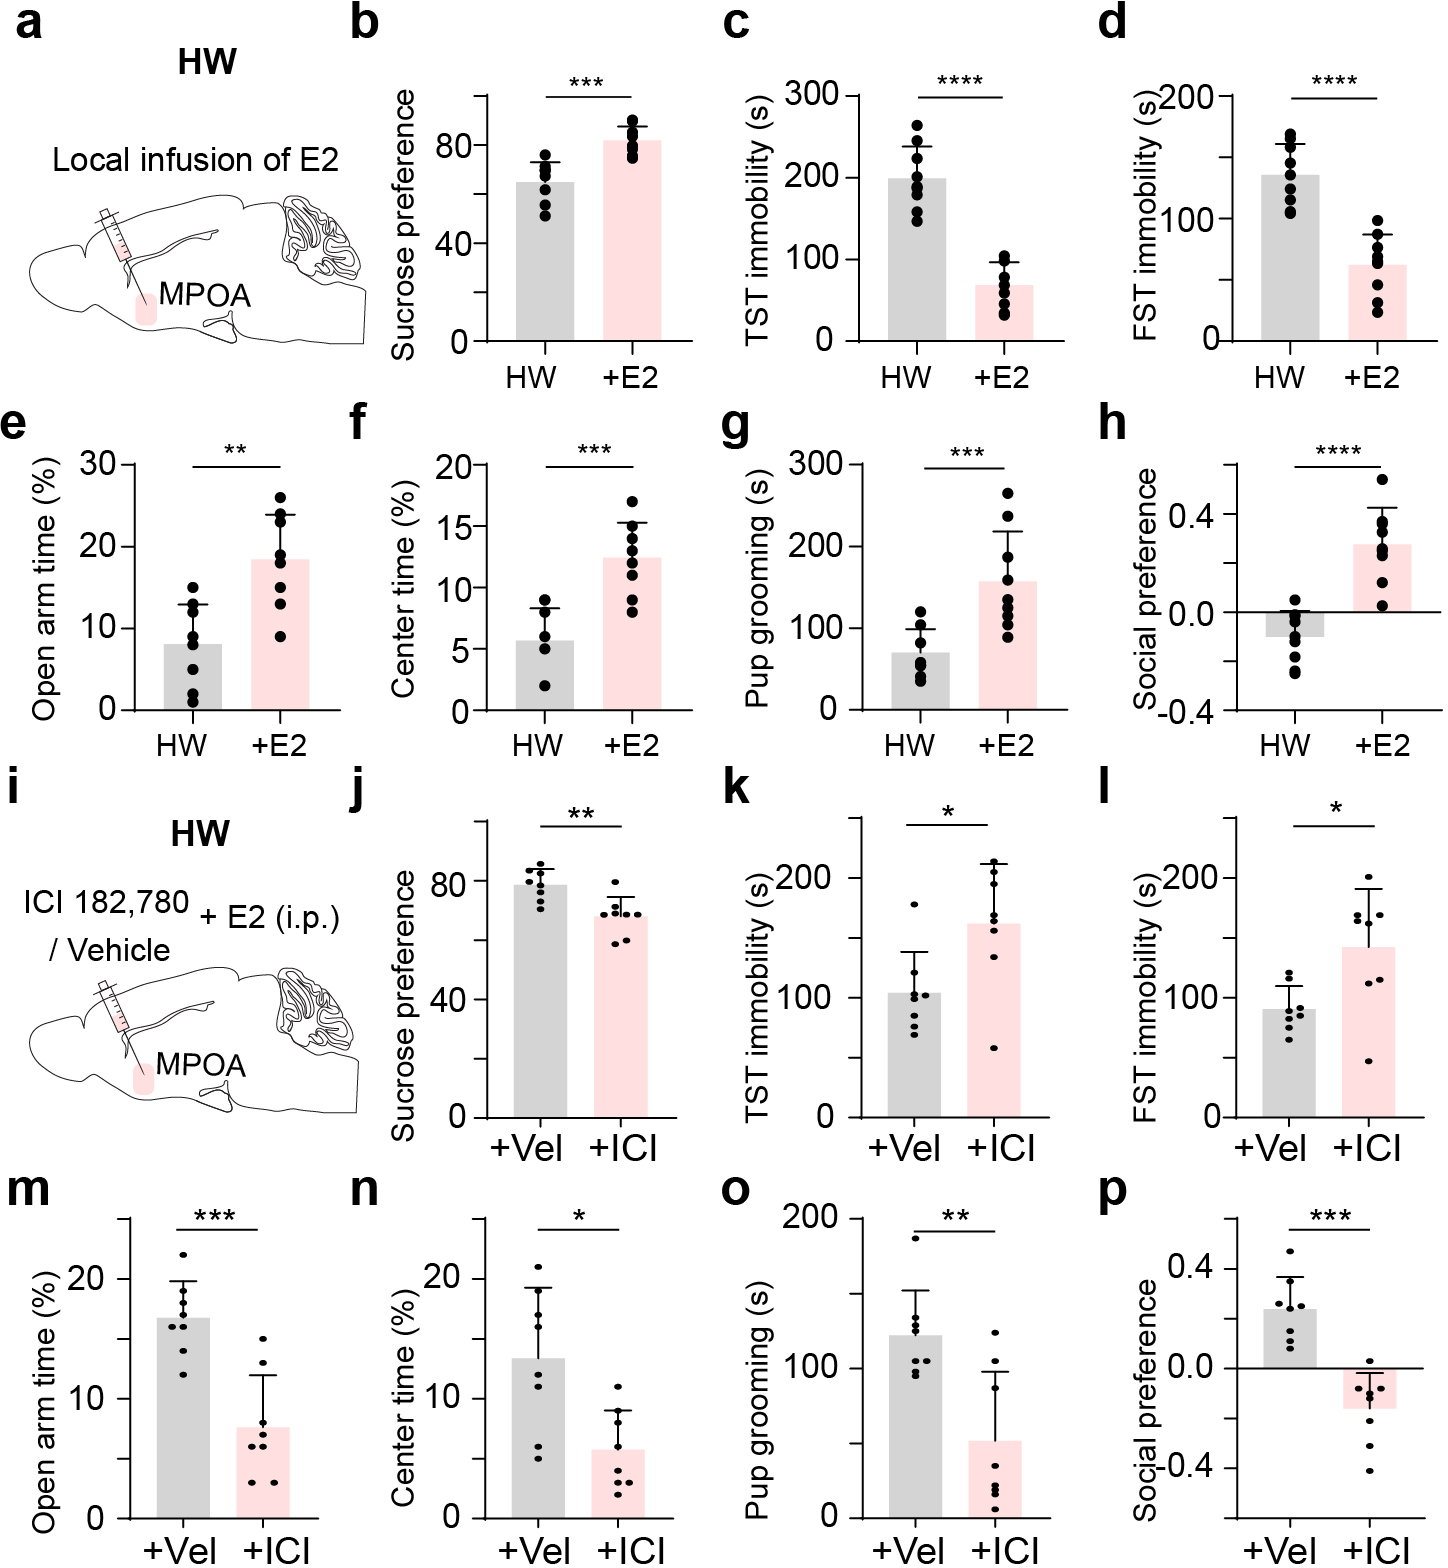
a-h, Local administration of estradiol (E2) (or vehicle) in MPOA following the HW procedure in female mice. N=8 animals for each group. Mean ± s.d. Statistics: ***P = 0.0002 (b), ****P < 0.0001 (c), ****P < 0.0001 (d), **P = 0.0011 (e), ***P = 0.0004 (f), ***P = 0.0005 (g), ****P < 0.0001 (h), two-tailed Mann-Whitney test, n = 9 mice in each group. i-p, I.p. administration of estradiol (E2) and local administration of estrogen receptor antagonist (ICI 182,780) (or vehicle) in MPOA following the HW procedure in female mice. n = 9 mice in each group, Mean ± s.d. Statistics: **P = 0.0097 (j), *P = 0.0379 (k), *P = 0.0362 (l), ***P = 0.0009 (m), *P = 0.0101 (n), **P = 0.0068 (o), ***P = 0.0002 (p), two-tailed Mann-Whitney test..
Acknowledgements
This work was supported by grants from the US National Institutes of Health to L.I.Z. (R01DC008983; R01DC020887; MH116990) and H.W.T. (EY019049 and MH116990).
Footnotes
Competing interests
The authors declare no competing interests.
Code availability
The code that used for animal detection are available on https://github.com/GuangWei-Zhang/TraCon-Toolbox. Other code that supports the findings of this study is available from the corresponding author upon request.
Data availability
All the source data for the results of this study are provided.
References
- 1.Lokuge S, Frey BN, Foster JA, Soares CN & Steiner M Depression in women: Windows of vulnerability and new insights into the link between estrogen and serotonin. J. Clin. Psychiatry 72, 1563–1569 (2011). [DOI] [PubMed] [Google Scholar]
- 2.O’Hara MW & Mc Cabe JE Postpartum depression: Current status and future directions. Annu. Rev. Clin. Psychol. 9, 379–407 (2013). [DOI] [PubMed] [Google Scholar]
- 3.Malhi GS & Mann JJ Depression. Lancet 392, 2299–2312 (2018). [DOI] [PubMed] [Google Scholar]
- 4.Hu H, Cui Y & Yang Y Circuits and functions of the lateral habenula in health and in disease. Nat. Rev. Neurosci. 21, 277–295 (2020). [DOI] [PubMed] [Google Scholar]
- 5.Russo SJ, Murrough JW, Han MH, Charney DS & Nestler EJ Neurobiology of resilience. Nat. Neurosci. 15, 1475–1484 (2012). [DOI] [PMC free article] [PubMed] [Google Scholar]
- 6.Walf AA & Frye CA A review and update of mechanisms of estrogen in the hippocampus and amygdala for anxiety and depression behavior. Neuropsychopharmacology 31, 1097–1111 (2006). [DOI] [PMC free article] [PubMed] [Google Scholar]
- 7.Zhang Z et al. Postpartum estrogen withdrawal impairs hippocampal neurogenesis and causes depression- and anxiety-like behaviors in mice. Psychoneuroendocrinology 66, 138–149 (2016). [DOI] [PubMed] [Google Scholar]
- 8.Hedges VL et al. Estrogen Withdrawal Increases Postpartum Anxiety via Oxytocin Plasticity in the Paraventricular Hypothalamus and Dorsal Raphe Nucleus. Biol Psychiatry 89, 929–938 (2021). [DOI] [PMC free article] [PubMed] [Google Scholar]
- 9.Moffitt JR et al. Molecular, spatial, and functional single-cell profiling of the hypothalamic preoptic region. Science (80-. ). 362, (2018). [DOI] [PMC free article] [PubMed] [Google Scholar]
- 10.Pfaff D & Keiner M Atlas of estradiol‐concentrating cells in the central nervous system of the female rat. J. Comp. Neurol. 151, 121–157 (1973). [DOI] [PubMed] [Google Scholar]
- 11.McHenry JA et al. Hormonal gain control of a medial preoptic area social reward circuit. Nat. Neurosci. 20, 449–458 (2017). [DOI] [PMC free article] [PubMed] [Google Scholar]
- 12.Zhang GW et al. Medial preoptic area antagonistically mediates stress-induced anxiety and parental behavior. Nat. Neurosci. 24, 516–528 (2021). [DOI] [PMC free article] [PubMed] [Google Scholar]
- 13.Hu RK et al. An amygdala-to-hypothalamus circuit for social reward. Nat. Neurosci. 24, 831–842 (2021). [DOI] [PMC free article] [PubMed] [Google Scholar]
- 14.Wei YC et al. Medial preoptic area in mice is capable of mediating sexually dimorphic behaviors regardless of gender. Nat. Commun. 9, (2018). [DOI] [PMC free article] [PubMed] [Google Scholar]
- 15.Wu Z, Autry AE, Bergan JF, Watabe-Uchida M & Dulac CG Galanin neurons in the medial preoptic area govern parental behaviour. Nature 509, 325–330 (2014). [DOI] [PMC free article] [PubMed] [Google Scholar]
- 16.Fang YY, Yamaguchi T, Song SC, Tritsch NX & Lin D A Hypothalamic Midbrain Pathway Essential for Driving Maternal Behaviors. Neuron 98, 192–207.e10 (2018). [DOI] [PMC free article] [PubMed] [Google Scholar]
- 17.Karigo T et al. Distinct hypothalamic control of same- and opposite-sex mounting behaviour in mice. Nature 589, (2020). [DOI] [PMC free article] [PubMed] [Google Scholar]
- 18.Stolzenberg DS & Numan M Hypothalamic interaction with the mesolimbic DA system in the control of the maternal and sexual behaviors in rats. Neurosci. Biobehav. Rev. 35, 826–847 (2011). [DOI] [PubMed] [Google Scholar]
- 19.Tsuneoka Y et al. Functional, anatomical, and neurochemical differentiation of medial preoptic area subregions in relation to maternal behavior in the mouse. J. Comp. Neurol. 521, 1633–1663 (2013). [DOI] [PubMed] [Google Scholar]
- 20.Zhao ZD et al. A hypothalamic circuit that controls body temperature. Proc. Natl. Acad. Sci. U. S. A. 114, 2042–2047 (2017). [DOI] [PMC free article] [PubMed] [Google Scholar]
- 21.Chung S et al. Identification of preoptic sleep neurons using retrograde labelling and gene profiling. Nature 545, 477–481 (2017). [DOI] [PMC free article] [PubMed] [Google Scholar]
- 22.Yang S et al. An mPOA-ARCAgRP pathway modulates cold-evoked eating behavior. Cell Rep. 36, (2021). [DOI] [PubMed] [Google Scholar]
- 23.Galea LAM, Wide JK & Barr AM Estradiol alleviates depressive-like symptoms in a novel animal model of post-partum depression. Behav. Brain Res. 122, 1–9 (2001). [DOI] [PubMed] [Google Scholar]
- 24.Stoffel EC & Craft RM Ovarian hormone withdrawal-induced ‘depression’ in female rats. Physiol. Behav. 83, 505–513 (2004). [DOI] [PubMed] [Google Scholar]
- 25.Calhoon GG & Tye KM Resolving the neural circuits of anxiety. Nat. Neurosci. 18, 1394–1404 (2015). [DOI] [PMC free article] [PubMed] [Google Scholar]
- 26.Kohl J et al. Functional circuit architecture underlying parental behaviour. Nature 556, 326–331 (2018). [DOI] [PMC free article] [PubMed] [Google Scholar]
- 27.Walsh JJ et al. 5-HT release in nucleus accumbens rescues social deficits in mouse autism model. Nature 560, 589–594 (2018). [DOI] [PMC free article] [PubMed] [Google Scholar]
- 28.Kim CS, Chang PY & Johnston D Enhancement of dorsal hippocampal activity by knockdown of hcn1 channels leads to anxiolytic- and antidepressant-like behaviors. Neuron 75, 503–516 (2012). [DOI] [PMC free article] [PubMed] [Google Scholar]
- 29.Beier KT et al. Circuit Architecture of VTA Dopamine Neurons Revealed by Systematic Input-Output Mapping. Cell 162, 622–634 (2015). [DOI] [PMC free article] [PubMed] [Google Scholar]
- 30.Russo SJ & Nestler EJ The brain reward circuitry in mood disorders. Nat. Rev. Neurosci. 14, 609–625 (2013). [DOI] [PMC free article] [PubMed] [Google Scholar]
- 31.Patriarchi T et al. Ultrafast neuronal imaging of dopamine dynamics with designed genetically encoded sensors. Science (80-. ). 360, (2018). [DOI] [PMC free article] [PubMed] [Google Scholar]
- 32.Van Zessen R, Phillips JL, Budygin EA & Stuber GD Activation of VTA GABA Neurons Disrupts Reward Consumption. Neuron 73, 1184–1194 (2012). [DOI] [PMC free article] [PubMed] [Google Scholar]
- 33.Cools R, Roberts AC & Robbins TW Serotoninergic regulation of emotional and behavioural control processes. Trends Cogn. Sci. 12, 31–40 (2008). [DOI] [PubMed] [Google Scholar]
- 34.Wan J et al. A genetically encoded sensor for measuring serotonin dynamics. Nat. Neurosci. 24, 746–752 (2021). [DOI] [PMC free article] [PubMed] [Google Scholar]
- 35.Zingg B et al. AAV-Mediated Anterograde Transsynaptic Tagging: Mapping Corticocollicular Input-Defined Neural Pathways for Defense Behaviors. Neuron 93, 33–47 (2017). [DOI] [PMC free article] [PubMed] [Google Scholar]
- 36.Tye KM et al. Dopamine neurons modulate neural encoding and expression of depression-related behaviour. Nature 493, 537–541 (2013). [DOI] [PMC free article] [PubMed] [Google Scholar]
- 37.Ren J et al. Anatomically Defined and Functionally Distinct Dorsal Raphe Serotonin Sub-systems. Cell 175, 472–487.e20 (2018). [DOI] [PMC free article] [PubMed] [Google Scholar]
- 38.Labonté B et al. Sex-specific transcriptional signatures in human depression. Nat. Med. 23, 1102–1111 (2017). [DOI] [PMC free article] [PubMed] [Google Scholar]
- 39.Cullen KR et al. Abnormal amygdala resting-state functional connectivity in adolescent depression. JAMA Psychiatry 71, 1138–1147 (2014). [DOI] [PMC free article] [PubMed] [Google Scholar]
- 40.Frodl T et al. Hippocampal changes in patients with a first episode of major depression. Am. J. Psychiatry 159, 1112–1118 (2002). [DOI] [PubMed] [Google Scholar]
- 41.Vreeburg SA et al. Major Depressive Disorder and Hypothalamic-Pituitary-Adrenal Axis Activity. Arch. Gen. Psychiatry 66, 617 (2009). [DOI] [PubMed] [Google Scholar]
- 42.Li B et al. Synaptic potentiation onto habenula neurons in the learned helplessness model of depression. Nature 470, 535–541 (2011). [DOI] [PMC free article] [PubMed] [Google Scholar]
- 43.Cheng J, Umschweif G, Leung J, Sagi Y & Greengard P HCN2 Channels in Cholinergic Interneurons of Nucleus Accumbens Shell Regulate Depressive Behaviors. Neuron 101, 662–672.e5 (2019). [DOI] [PubMed] [Google Scholar]
- 44.Krishnan V et al. Molecular Adaptations Underlying Susceptibility and Resistance to Social Defeat in Brain Reward Regions. Cell 131, 391–404 (2007). [DOI] [PubMed] [Google Scholar]
- 45.Warden MR et al. A prefrontal cortex-brainstem neuronal projection that controls response to behavioural challenge. Nature 492, 428–432 (2012). [DOI] [PMC free article] [PubMed] [Google Scholar]
- 46.Knowland D et al. Distinct Ventral Pallidal Neural Populations Mediate Separate Symptoms of Depression. Cell 170, 284–297.e18 (2017). [DOI] [PMC free article] [PubMed] [Google Scholar]
- 47.Chen P & Hong W Neural Circuit Mechanisms of Social Behavior. Neuron 98, 16–30 (2018). [DOI] [PMC free article] [PubMed] [Google Scholar]
- 48.Herbison AE Estrogen regulation of GABA transmission in rat preoptic area. Brain Res. Bull. 44, 321–326 (1997). [DOI] [PubMed] [Google Scholar]
- 49.Anthony TE et al. Control of stress-induced persistent anxiety by an extra-amygdala septohypothalamic circuit. Cell 156, 522–536 (2014). [DOI] [PMC free article] [PubMed] [Google Scholar]
- 50.Jennings JH et al. Distinct extended amygdala circuits for divergent motivational states. Nature 496, 224–228 (2013). [DOI] [PMC free article] [PubMed] [Google Scholar]
- 51.Zingg B, Peng B, Huang J, Tao HW & Zhang LI Synaptic Specificity and Application of Anterograde Transsynaptic AAV for Probing Neural Circuitry. J. Neurosci. 40, 3250–3267 (2020). [DOI] [PMC free article] [PubMed] [Google Scholar]
- 52.Wang F et al. RNAscope: A novel in situ RNA analysis platform for formalin-fixed, paraffin-embedded tissues. J. Mol. Diagnostics 14, 22–29 (2012). [DOI] [PMC free article] [PubMed] [Google Scholar]
- 53.McLean AC, Valenzuela N, Fai S & Bennett SAL Performing vaginal lavage, crystal violet staining, and vaginal cytological evaluation for mouse estrous cycle staging identification. J. Vis. Exp. 4–9 (2012) doi: 10.3791/4389. [DOI] [PMC free article] [PubMed] [Google Scholar]
- 54.Zhang GW et al. A Non-canonical Reticular-Limbic Central Auditory Pathway via Medial Septum Contributes to Fear Conditioning. Neuron 97, 406–417.e4 (2018). [DOI] [PMC free article] [PubMed] [Google Scholar]
- 55.Zhang GW et al. Transforming Sensory Cues into Aversive Emotion via Septal-Habenular Pathway. Neuron 99, 1016–1028 (2018). [DOI] [PMC free article] [PubMed] [Google Scholar]
- 56.Shen L et al. A bottom-up reward pathway mediated by somatostatin neurons in the medial septum complex underlying appetitive learning. Nat. Commun. 13, 1–15 (2022). [DOI] [PMC free article] [PubMed] [Google Scholar]
- 57.Mathis A et al. DeepLabCut: markerless pose estimation of user-defined body parts with deep learning. Nat. Neurosci. 21, 1281–1289 (2018). [DOI] [PubMed] [Google Scholar]
- 58.Xiong XR et al. Auditory cortex controls sound-driven innate defense behaviour through corticofugal projections to inferior colliculus. Nat. Commun. 6, (2015). [DOI] [PMC free article] [PubMed] [Google Scholar]
- 59.Chou XL et al. Inhibitory gain modulation of defense behaviors by zona incerta. Nat. Commun. 9, 1–12 (2018). [DOI] [PMC free article] [PubMed] [Google Scholar]
- 60.Burkitt AN A review of the integrate-and-fire neuron model: I. Homogeneous synaptic input. Biol. Cybern. 95, 1–19 (2006). [DOI] [PubMed] [Google Scholar]
- 61.Liu BH et al. Intervening inhibition underlies simple-cell receptive field structure in visual cortex. Nat. Neurosci. 13, 89–96 (2010). [DOI] [PMC free article] [PubMed] [Google Scholar]
Associated Data
This section collects any data citations, data availability statements, or supplementary materials included in this article.
Data Availability Statement
All the source data for the results of this study are provided.


