Abstract
Mesolimbic dopamine activity occasionally exhibits ramping dynamics, reigniting debate on theories of dopamine signaling. This debate is ongoing partly because the experimental conditions under which dopamine ramps emerge remain poorly understood. Here, we show that during Pavlovian and instrumental conditioning, mesolimbic dopamine ramps are only observed when the inter-trial interval is short relative to the trial period. These results constrain theories of dopamine signaling and identify a critical variable determining the emergence of dopamine ramps.
Mesolimbic dopamine activity was classically thought to operate in either a “phasic” or a “tonic” mode(1–3). Yet, recent evidence points to a “quasi-phasic” mode in which mesolimbic dopamine activity exhibits ramping dynamics(4–16). This discovery reignited debate on theories of dopamine function as it appeared inconsistent with the dominant theory that dopamine signaling conveys temporal difference reward prediction error (RPE)(17). Recent work has hypothesized that dopamine ramps reflect the value of ongoing states(1, 4–6), RPE under some assumptions(8, 10, 18, 19), or a causal influence of actions on rewards in instrumental tasks(11). This debate has been exacerbated in part because there is no clear understanding of why dopamine ramps appear only under some experimental conditions. Accordingly, uncovering a unifying principle of the conditions under which dopamine ramps appear will provide important constraints on theories of dopamine function(1, 11, 18, 20–39).
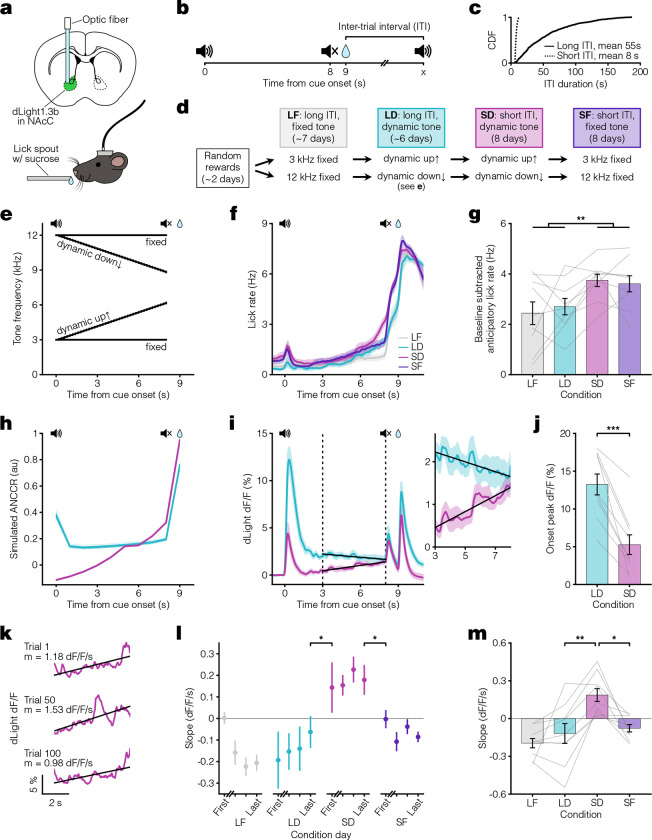
In our recent work proposing that dopamine acts as a teaching signal for causal learning by representing the Adjusted Net Contingency for Causal Relations (ANCCR)(20, 34, 40), simulated ANCCR depends on the duration of a memory trace of past events (i.e., on the “eligibility trace” time constant) (illustrated in Extended Data Fig 1). Accordingly, we successfully simulated dopamine ramping dynamics assuming two conditions: a dynamic progression of cues that signal temporal proximity to reward, and a small eligibility trace time constant relative to the trial period(20). However, whether these conditions are sufficient to experimentally produce mesolimbic dopamine ramps in vivo remains untested. To test this prediction in Pavlovian conditioning, we measured mesolimbic dopamine release in the nucleus accumbens core using a dopamine sensor (dLight1.3b)(41) in an auditory cue-reward task. We varied both the presence or absence of a progression of cues indicating reward proximity (“dynamic” vs “fixed” tone) and the inter-trial interval (ITI) duration (short vs long ITI). Varying the ITI was critical because our theory predicts that the ITI is a variable controlling the eligibility trace time constant, such that a short ITI would produce a small time constant relative to the cue-reward interval (Supplementary Note 1) (Fig 1a–e). In all four task conditions, head-fixed mice learned to anticipate the sucrose reward, as reflected by anticipatory licking (Fig 1f–g). In line with our earlier work, we showed that simulations of ANCCR exhibit a larger cue onset response when the ITI is long and exhibit ramps only when the ITI is short (Fig 1h). Consistent with these simulated predictions, experimentally measured mesolimbic dopamine release had a much higher cue onset response for long ITI (Fig 1i–j). Furthermore, dopamine ramps were observed only when the ITI was short and the tone was dynamic (Fig 1i, k–m). The presence of dopamine ramps during the last five seconds of the cue could not be explained by variations in behavior, as anticipatory licking during this period was similar across all conditions (Extended Data Fig 2, Supplementary Note 2). Indeed, dopamine ramps—quantified by a positive slope of dopamine response vs time within trial over the last five seconds of the cue—appeared on the first day after transition from a long ITI/dynamic tone condition to a short ITI/dynamic tone condition and disappeared on the first day after transition from a short ITI/dynamic tone condition to a short ITI/fixed tone condition (Fig 1l). These results confirm the key prediction of our theory in Pavlovian conditioning.
Fig. 1. Pavlovian conditioning dopamine ramps depend on ITI.
a. Top, fiber photometry approach schematic for nucleus accumbens core (NAcC) dLight recordings. Bottom, head-fixed mouse. b. Pavlovian conditioning task setup. Trials consisted of an 8 s auditory cue followed by sucrose reward delivery 1 s later. c. Cumulative Distribution Function (CDF) of ITI duration for long (solid line, mean 55 s) and short ITI (dashed line, mean 8 s) conditions. d. Experimental timeline. Mice were divided into groups receiving either a 3 kHz fixed and dynamic up↑ tone or a 12 kHz fixed and dynamic down↓ tone. e. Tone frequency over time. f. Peri-stimulus time histogram (PSTH) showing average licking behaviors for the last 3 days of each condition (n = 9 mice). g. Average anticipatory lick rate (baseline subtracted) for 1 s preceding reward delivery (two-way ANOVA: long ITI vs short ITI F(1) = 9.3, **p = 0.0045). h. ANCCR simulation results from an 8 s dynamic cue followed by reward 1 s later for long ITI (teal) and short ITI (pink) conditions. Bold lines show the average of 20 iterations. i. Left, average dLight dopamine signals. Vertical dashed lines represent the ramp window from 3 to 8 s after cue onset, thereby excluding the influence of the cue onset and offset responses. Solid black lines show linear regression fit during window. Right, closeup of dopamine signal during window. j. Average peak dLight response to cue onset for LD and SD conditions (paired t-test: t(8) = 6.3, ***p = 2.3×10⁻⁴). k. dLight dopamine signal with linear regression fit during ramp window for example SD trials. Reported m is slope. l. Session average per-trial slope during ramp window for the first day and last 3 days of each condition (one-sided [last day LD < first day SD] paired t-test: t(8) = −2.1, *p = 0.036; one-sided [last day SD > first day SF] paired t-test: t(8) = 2.4, *p = 0.023). m. Average per-trial slope for last 3 days of each condition (Tukey HSD test: q = 3.8, LD vs SD **p = 0.0027, SD vs SF *p = 0.011). All data presented as mean ± SEM. See Supplementary Table 1 for full statistical details.
Given the speed with which dopamine ramps appeared and disappeared, we next tested whether the slope of dopamine ramps in the short ITI/dynamic tone condition depended on the previous ITI duration on a trial-by-trial basis. We found that there was indeed a statistically significant trial-by-trial correlation between the previous ITI duration and the current trial’s dopamine response slope in the short ITI/dynamic condition with ramps, but not in the long ITI/dynamic condition without ramps (Fig 2, Extended Data Fig 3). The dependence of a trial’s dopamine response slope with previous ITI was significantly negative, meaning that a longer ITI correlates with a weaker ramp on the next trial. This finding held when analyzing either animal-by-animal (Fig 2a–b) or the pooled trials across animals while accounting for mean animal-by-animal variability (Fig 2c). These results suggest that the eligibility trace time constant adapts rapidly to changing ITI in Pavlovian conditioning.
Fig. 2. Per-trial dopamine ramps correlate with previous ITI.
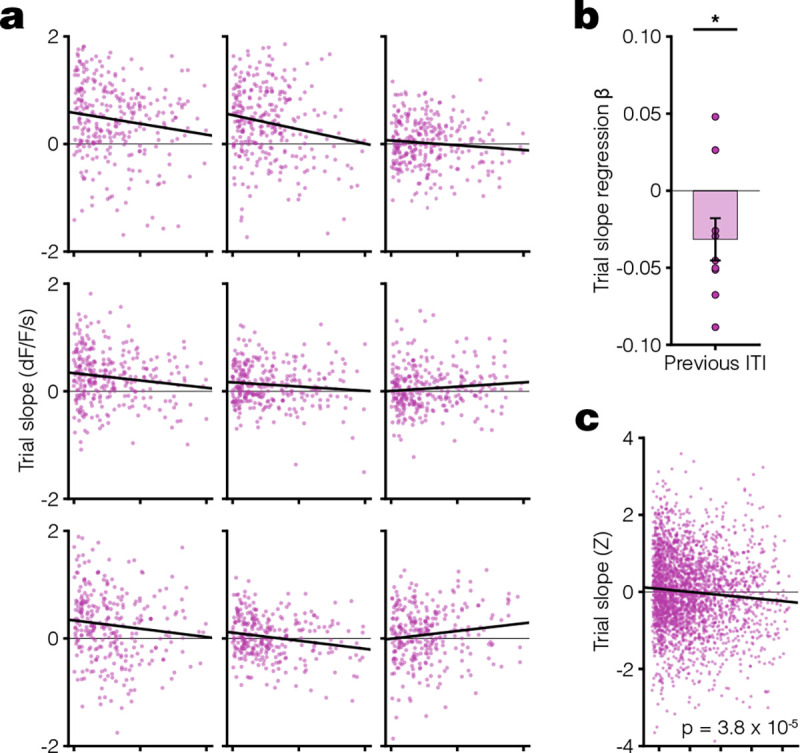
a. Scatter plots showing the relationship between dopamine response slope within a trial and previous ITI for all trials in the last 3 days of SD condition. Each animal plotted individually with linear regression fit (black line). b. Linear regression β coefficients for previous ITI vs. trial slope calculated per animal (one-sided [< 0] one sample t-test: t(8) = −2.2, *p = 0.031). c. Scatter plot of Z-scored trial slope vs. previous ITI pooled across mice for all trials in the last 3 days of LD condition (linear regression: t(2671) = −4.1, R2 = 0.0063, ***p = 3.8 ×10⁻⁵). The Z-scoring per animal removes the effect of variable means across animals on the slope of the pooled data. All data presented as mean ± SEM. See Supplementary Table 1 for full statistical details.
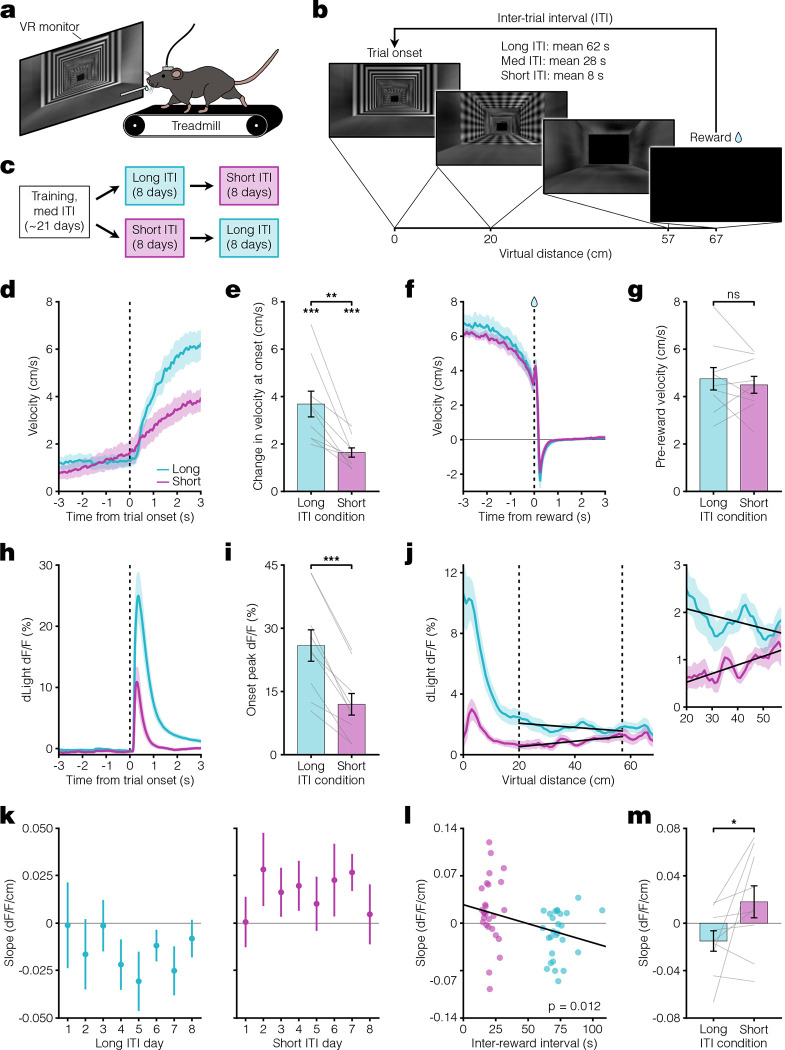
We next tested whether the results from Pavlovian conditioning could be reproduced in an instrumental task. In keeping with prior demonstrations of dopamine ramps in head-fixed mice, we used a virtual reality (VR) navigational task in which head-fixed mice had to run towards a destination in a virtual hallway to obtain sucrose rewards (8, 10, 18, 42) (Fig 3a–b, Extended Data Fig 4). At reward delivery, the screen turned blank during the ITI and remained so until the next trial onset. After training animals in this task using a medium ITI, we changed the ITI duration to short or long for eight days before switching to the other (Fig 3c). We found evidence that mice learned the behavioral requirement during the trial period, as they significantly increased their running speed during trial onset (Fig 3d–e) and reached a similarly high speed prior to reward in both ITI conditions (Fig 3f–g). Consistent with the results from Pavlovian conditioning, the dopamine response to the onset of the hallway presentation was larger during the long ITI compared to the short ITI condition (Fig 3h–i), and dopamine ramps were observed only in the short ITI condition (Fig 3j–m). Unlike the Pavlovian conditioning, the change in the ITI resulted in a more gradual appearance or disappearance of ramps (Fig 3k), but there was still a weak overall correlation between dopamine response slope on a trial and the previous inter-reward interval (Extended Data Fig 5). These results are consistent with a more gradual change in the eligibility trace time constant in this instrumental task. Collectively, the core finding from Pavlovian conditioning that mesolimbic dopamine ramps are present only during short ITI conditions was reproduced in the instrumental VR task.
Fig. 3. VR navigation dopamine ramps depend on ITI.
a. Head-fixed VR approach schematic. b. VR navigation task setup. Trials consisted of running down a patterned virtual hallway to receive sucrose reward. VR monitor remained black during the ITI. c. Experimental timeline. Following training, mice were assigned to either long or short ITI conditions for 8 days before switching. d. Velocity PSTH aligned to trial onset for long (teal) and short (pink) ITI conditions (n = 9 mice). e Average change in velocity at trial onset. Bottom asterisks indicate both conditions significantly differ from zero (one-sided [> 0] one sample t-test: long ITI t(8) = 6.4, ***p = 1.0 ×10⁻⁴; short ITI t(8) = 7.9, ***p = 2.3 ×10⁻⁵). Top asterisks indicate significant difference between conditions (paired t-test: t(8) = 4.3, **p = 0.0028). f. Velocity PSTH aligned to reward delivery. g. Average velocity during 1 s preceding reward (paired t-test: t(8) = 0.71, p = 0.50). h. PSTH showing average dLight dopamine signal aligned to trial onset. i. Comparison of peak dLight onset response (paired t-test: t(8) = 7.6, ***p = 6.3 ×10⁻⁵). j. Left, average dLight dopamine signal across distances spanning the entire virtual corridor. Vertical dashed lines represent the ramp window from 20 to 57 cm (10 cm before end of track). Solid black lines show linear regression fit during window. Right, closeup of dopamine signal during window. k. Session average per-trial slope during ramp window for all days of each condition. l. Scatter plot showing relationship between average per-session slope and inter-reward interval for the last 3 days in long (teal) and short (pink) ITI conditions. Black line indicates linear regression fit (linear regression: t(53) = −2.6, R2 = 0.12, *p = 0.012). m. Comparison of average per-trial slope during ramp window for last 3 days of both conditions (one-sided [long < short] paired t-test: t(8) = −2.1, *p = 0.035). All data presented as mean ± SEM. See Supplementary Table 1 for full statistical details.
Our results provide a general framework for understanding past results on dopamine ramps. According to ANCCR, the fundamental variable controlling the presence of ramps is the eligibility trace time constant. Based on first principles, this time constant depends on the ITI in common task designs (Supplementary Note 1). Thus, the ITI is a simple proxy to manipulate the eligibility trace time constant, thereby modifying dopamine ramps. In previous navigational tasks with dopamine ramps, there was no explicitly programmed ITI (4, 7, 13). As such, the controlling of the pace of trials by these highly motivated animals likely resulted in short effective ITI compared to trial duration. An instrumental lever pressing task with dopamine ramps similarly had no explicitly programmed ITI(9), and other tasks with observed ramps had short ITIs(8, 10, 12, 15, 16). One reported result that does not fit with a simple control of ramps by ITI is that navigational tasks produce weaker ramps with repeated training(7). These results are generally inconsistent with the stable ramps that we observed in Pavlovian conditioning across eight days (Fig 1l). A speculative explanation might be that when the timescales of events vary considerably (e.g., during early experience in instrumental tasks due to variability in action timing), animals use a short eligibility trace time constant to account for the potential non-stationarity of the environment. With repeated exposure, the experienced stationarity of the environment might increase the eligibility trace time constant, thereby complicating its relationship with the ITI. Alternatively, as suggested previously(7), repeated navigation may result in automated behavior that ignores the progress towards reward, thereby minimizing the calculation of associations of spatial locations with reward. Another set of observations superficially inconsistent with our assumption of the necessity of a sequence of external cues signaling proximity to reward for ramping to occur is that dopamine ramping dynamics can be observed even when only internal states signal reward proximity (e.g., timing a delayed action) (7, 12, 15). In these cases, however, animals were required to actively keep track of the passage of time, which therefore strengthens an internal progression of neural states signaling temporal proximity to reward. Once learned, these internal states could serve the role of external cues in the ANCCR framework (Supplementary Note 3).
Though the current experiments in this study were motivated by the ANCCR framework, they were not conducted to discriminate between theories. As such, though the data are largely consistent with ANCCR, they should not be treated as evidence explicitly for ANCCR (Supplementary Note 4). It may also be possible that these results can be explained by other theories of dopamine function. For instance, temporal discounting may depend on overall reward rate(23, 43, 44), and such changes in temporal discounting may affect predictions in alternative theories such as temporal difference value or RPE dopamine signaling. Regardless of such considerations, the current results provide a clear constraint for dopamine theories and demonstrate that an underappreciated experimental variable determines the emergence of mesolimbic dopamine ramps.
Methods
Animals
All experimental procedures were approved by the Institutional Animal Care and Use Committee at UCSF and followed guidelines provided by the NIH Guide for the Care and Use of Laboratory Animals. A total of eighteen adult wild-type C57BL/6J mice (000664, Jackson Laboratory) were divided between experiments: nine mice (4 females, 5 males) were used for Pavlovian conditioning, and nine mice (6 females, 3 males) were used for the VR task. Following surgery, mice were single housed in a reverse 12-hour light/dark cycle. Mice received environmental enrichment and had ad libitum access to standard chow. To increase motivation, mice underwent water deprivation. During deprivation, mice were weighed daily and given enough fluids to maintain 85% of their baseline weight.
Surgeries.
Surgical procedures were always done under aseptic conditions. Induction of anesthesia was achieved with 3% isoflurane, which was maintained at 1–2% throughout the duration of the surgery. Mice received subcutaneous injections of carprofen (5 mg/kg) for analgesia and lidocaine (1 mg/kg) for local anesthesia of the scalp prior to incision. A unilateral injection (Nanoject III, Drummond) of 500 nL of dLight1.3b (AAVDJ-CAG-dLight1.3b, 2.4 × 10¹³ GC/mL diluted 1:10 in sterile saline) was targeted to the NAcC using the following coordinates from bregma: AP 1.3, ML ±1.4, DV −4.55. The glass injection pipette was held in place for 10 minutes prior to removal to prevent the backflow of virus. After viral injection, an optic fiber (NA 0.66, 400 μm, Doric Lenses) was implanted 100 μm above the site of injection. Subsequently, a custom head ring for head-fixation was secured to the skull using screws and dental cement. Mice recovered and were given at least three weeks before starting behavioral experiments. After completion of experiments, mice underwent transcardial perfusion and subsequent brain fixation in 4% paraformaldehyde. Fiber placement was verified using 50 μm brain sections under a Keyence microscope.
Behavioral Tasks.
All behavioral tasks took place during the dark cycle in dark, soundproof boxes with white noise playing to minimize any external noise. Prior to starting the Pavlovian conditioning task, water-deprived mice underwent 1–2 days of random rewards training to get acclimated to our head-fixed behavior setup(45). In a training session, mice received 100 sucrose rewards ( 3 μL, 15% in water) at random time intervals taken from an exponential distribution averaging 12 s. Mice consumed sucrose rewards from a lick spout positioned directly in front of their mouths. This same spout was used for lick detection. After completing random rewards, mice were trained on the Pavlovian conditioning task. An identical trial structure was used across all conditions of the task, consisting of an auditory tone lasting 8 s followed by a delay of 1 s before sucrose reward delivery. Two variables of interest were manipulated—the length of the ITI (long or short) and the type of auditory tone (fixed or dynamic)—resulting in four conditions: long ITI/fixed tone (LF), long ITI/dynamic tone (LD), short ITI/dynamic tone (SD), and short ITI/fixed tone (SF). Mice began with the LF condition (mean 7.4 days, range 7–8) before progressing to the LD condition (mean 6.1 days, range 5–11), the SD condition (8 days), and finally the SF condition (8 days). The ITI was defined as the period between reward delivery and the subsequent trial’s cue onset. In the long ITI conditions, the ITI was drawn from a truncated exponential distribution with a mean of 55 s, maximum of 186 s, and minimum of 6 s. The short ITIs were similarly drawn from a truncated exponential distribution, averaging 8 s with a maximum of 12 s and minimum of 6 s. While mice had 100 trials per day in the short ITI conditions, long ITI sessions were capped at 40 trials due to limitations on the amount of time animals could spend in the head-fixed setup. For the fixed tone conditions, mice were randomly divided into groups presented with either a 3 kHz or 12 kHz tone. While the 12 kHz tone played continuously throughout the entire 8 s, the 3 kHz tone was pulsed (200 ms on, 200 ms off) to make this lower frequency tone more obvious to the mice. For the dynamic tone conditions, the tone frequency either increased (dynamic up↑ starting at 3 kHz) or decreased (dynamic down↓ starting at 12 kHz) by 80 Hz every 200ms, for a total change of 3.2 kHz across 8 s. Mice with the 3 kHz fixed tone had the dynamic up↑ tone, whereas mice with the 12 kHz fixed tone had the dynamic down↓ tone. This dynamic change in frequency across the 8 s was intentionally designed to indicate to the mice the temporal proximity to reward, which is thought to be necessary for ramps to appear in a Pavlovian setting.
For the VR task, water-deprived mice were head fixed above a low-friction belt treadmill46. A magnetic rotary encoder attached to the treadmill was used to measure the running velocity of the mice. In front of the head-fixed treadmill setup, a virtual environment was displayed on a high-resolution monitor (20” screen, 16:9 aspect ratio) to look like a dead-end hallway with a patterned floor, walls, and ceiling. The different texture patterns in the virtual environment were yoked to running velocity such that it appeared as though the animal was travelling down the hallway. Upon reaching the end of the hallway, the screen would turn fully black and mice would receive sucrose reward delivery from a lick spout positioned within reach in front of them. The screen remained black for the full duration of the ITI until the reappearance of the starting frame of the virtual hallway signaled the next trial onset. To train mice to engage in this VR task, they began with a 10 cm long virtual hallway. This minimal distance requirement was chosen to make it relatively easy for the mice to build associations between their movement on the treadmill, the corresponding visual pattern movement displayed on the VR monitor, and reward deliveries. Based on their performance throughout training, the distance requirement progressively increased by increments of 5–20 cm across days until reaching a maximum distance of 67 cm. Training lasted an average of 21.4 days (range 11–38 days), ending once mice could consistently run down the full 67 cm virtual hallway for three consecutive days. The ITIs during training (“med ITI”) were randomly drawn from a truncated exponential distribution with a mean of 28 s, maximum of 90 s, and minimum of 6 s. Following training, mice were randomly divided into two groups with identical trials but different ITIs (long or short). Again, both ITIs were randomly drawn from truncated exponential distributions: long ITI (mean 62 s, max 186 s, min 6 s) and short ITI (mean 8 s, max 12 s, min 6 s). After 8 days of the first ITI condition, mice switched to the other condition for an additional 8 days. There were 50 trials per day in both the long and short ITI conditions.
Fiber Photometry.
Beginning three weeks after viral injection, dLight photometry recordings were performed with either an open-source (PyPhotometry) or commercial (Doric Lenses) fiber photometry system. Excitation LED light for wavelengths of 470 nm (dopamine dependent dLight signal) and 405 nm (dopamine independent isosbestic signal) were sinusoidally modulated via an LED driver and integrated into a fluorescence minicube (Doric Lenses). The same minicube was used to detect incoming fluorescent signals at a 12 kHz sampling frequency before demodulation and downsampling to 120 Hz. Excitation and emission light passed through the same low autofluorescence patchcord (400 μm, 0.57 NA, Doric Lenses). Light intensity at the tip of this patchcord was consistently 40 μW across days. For Pavlovian conditioning, the photometry software received a TTL signal for the start and stop of the session to align the behavioral and photometry data. For alignment in the VR task, the photometry software received a TTL signal at each reward delivery.
Data Analysis.
Behavior:
Licking was the behavioral readout of learning used in Pavlovian conditioning. The lick rate was calculated by binning the number of licks every 100 ms. A smoothed version produced by Gaussian filtering is used to visualize lick rate in PSTHs (Fig 1f, Ext Data Fig 4d). Anticipatory lick rate for the last three days combined per condition was calculated by subtracting the average baseline lick rate during the 1 s before cue onset from the average lick rate during the trace period 1 s before reward delivery (Fig 1g). The same baseline subtraction method was used to calculate the average lick rate during the 3 to 8 s post cue onset period (Ext Data Fig 2d).
Running velocity, rather than licking, was the primary behavioral readout of learning for the VR task. Velocity was calculated as the change in distance per time. Distance measurements were sampled every 50 ms throughout both the trial and ITI periods. Average PSTHs from the last three days per condition were used to visualize velocity aligned to trial onset (Fig 3d) and reward delivery (Fig 3f). The change in velocity at trial onset was calculated by subtracting the average baseline velocity (baseline being 1 s before trial onset) from the average velocity between 1–2 s after trial onset (Fig 3e). Pre-reward velocity was the mean velocity during the 1 s period before reward delivery (Fig 3g). In addition to analyzing velocity, the average lick rate for the 1 s before reward delivery was used to quantify the modest anticipatory lick rate in the VR task (Ext Data Fig 4e). The inter-trial interval (ITI) used throughout is defined as the time period between the previous trial reward delivery and the current trial onset (Fig 1c, Fig 2a, Ext Data Fig 3, Ext Data Fig 4b). The inter-reward interval (IRI) is defined as the time period between the previous trial reward delivery and the current trial reward delivery (Fig 3l, Ext Data Fig 4b, Ext Data Fig 5). For the previous IRI vs trial slope analysis (Ext Data Fig 5), IRI outliers were removed from analysis if they were more than three standard deviations away from the mean of the original IRI distribution. Finally, trial durations in the VR task were defined as the time it took for mice to run 67 cm from the start to the end of the virtual hallway (Ext Data Fig 4b–c).
Dopamine:
To analyze dLight fiber photometry data, first a least-square fit was used to scale the 405 nm signal to the 470 nm signal. Then, a percentage dF/F was calculated as follows: dF/F = (470 − fitted 405) / (fitted 405) * 100. This session-wide dF/F was then used for subsequent analysis. The onset peak dF/F (Figs 1j, 3i) was calculated by finding the maximum dF/F value within 1 s after onset and then subtracting the average dF/F value during the 1 s interval preceding onset (last three days per condition combined). For each trial in Pavlovian conditioning, the time aligned dLight dF/F signal during the “ramp window” of 3 to 8 s after cue onset was fit with linear regression to obtain a per-trial slope. These per-trial slopes were then averaged for each day separately (Fig 1l) or for the last three days in each condition (Fig 1m) for subsequent statistical analysis. A smoothing Gaussian filter was applied to the group average (Fig 1i) and example trial (Fig 1k) dLight traces for visualization purposes. Distance, rather than time, was used to align the dLight dF/F signal in the VR task. Virtual distances were sampled every 30 ms, while dF/F values were sampled every 10 ms. To sync these signals, the average of every three dF/F values was assigned to the corresponding distance value. Any distance value that did not differ from the previous distance value was dropped from subsequent analysis (as was its mean dF/F value). This was done to avoid issues with averaging if the animal was stationary. For each trial in the VR task, the distance aligned dLight dF/F signal during the “ramp window” of 20 to 57 cm from the start of the virtual hallway was fit with linear regression to obtain a per-trial slope. These per-trial slopes were then averaged for each day separately (Fig 3k–l) or for the last three days in each condition (Fig 3m) for subsequent statistical analysis. To visualize the group averaged distance aligned dF/F trace (Fig 3j), the mean dF/F was calculated for every 1 cm after rounding all distance values to the nearest integer.
Simulations.
We previously proposed a learning model called Adjusted Net Contingency of Causal Relation (ANCCR)(20), which postulates that animals retrospectively search for causes (e.g., cues) when they receive a meaningful event (e.g., reward). ANCCR measures this retrospective association, which we call predecessor representation contingency (PRC), by comparing the strength of memory traces for a cue at rewards (; Equation 1) to the baseline level of memory traces for the same cue updated continuously (; Equation 2).
| (1) |
| (2) |
| (3) |
and are learning rates and the baseline samples are updated every dt seconds. represents eligibility trace of cue (c) at the time of event and represents eligibility trace of cue (c) at baseline samples updated continuously every dt seconds. The eligibility trace (E) decays exponentially over time depending on decay parameter (Equation 4).
| (4) |
where denotes the moments of past occurrences of event . In Supplementary Note 1, we derived a simple rule for the setting of based on event rates. For the tasks considered here, this rule translated to a constant multiplied by IRI. We have shown in a revised version of a previous study(20) that during initial learning. To mimic the dynamic tone condition, we simulated the occurrence of 8 different cues in a sequence with a 1 s interval between each cue. We used 1 s intervals between cues because real animals are unlikely to detect the small change in frequency occurring every 200ms in the dynamic tone, and we assumed that a frequency change of 400 Hz in 1 s was noticeable to the animals. We included the offset of the last cue as an additional cue. This is based on observation of animal behavior, which showed a sharp rise in anticipatory licking following the offset of the last cue (Fig 1f–g). Inter-trial interval was matched to the actual experimental conditions, averaging 2 s for the short dynamic condition and 49 s for long dynamic condition, with an additional 6 s fixed consummatory period. This resulted in 17 s IRI for short dynamic condition and 64 s IRI for long dynamic condition on average. 1000 trials were simulated for each condition, and the last 100 trials were used for analysis. Following parameters were used for simulation: , threshold=0.2, .
Statistics.
All statistical tests were run on Python 3.11 using the scipy (version 1.10) package. Full details related to statistical tests are included in Supplementary Table 1. Data presented in figures with error bars represent mean ± SEM. Significance was determined using 0.05 for . * p < 0.05, ** p < 0.01, ***p < 0.001, ns p > 0.05.
Extended Data
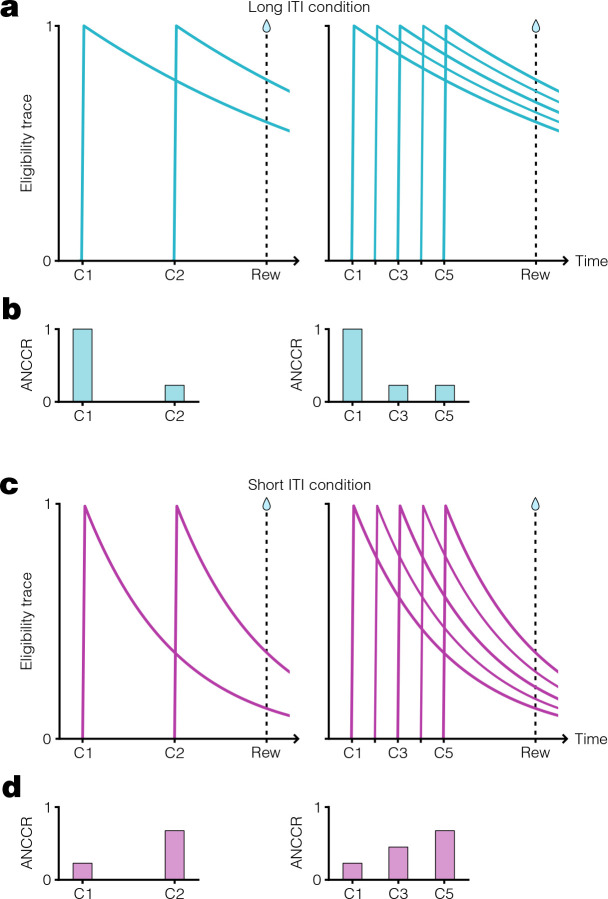
Extended Data Figure 1. Dependence of ANCCR on eligibility trace time constant.
a. Schematic showing exponential decay of cue eligibility traces for a two-cue sequential conditioning task (left) and a multi-cue conditioning task (right) with a long inter-trial interval (ITI). In this case, a long ITI results in a proportionally large eligibility trace time constant, T, producing slow eligibility trace decay (Supplementary Note 1). Reward delivery time indicated by vertical dashed line. b. Schematized ANCCR magnitudes (arbitrary units) for cues in the two-cue (left) and multi-cue (right) conditioning tasks with a long ITI. Since the eligibility trace for the first cue is still high at reward time, there is a large ANCCR at this cue. The remaining cues are preceded consistently by earlier cues associated with the reward, thereby reducing their ANCCR. c. Same conditioning task trial structure as in a, but with a short ITI and smaller T, producing rapid eligibility trace decay. d. Schematized ANCCR magnitudes for cues in both conditioning tasks with a short ITI. Since the eligibility trace for the first cue is low at reward time, there is a small ANCCR at this cue. Though the remaining cues are preceded consistently by earlier cues associated with the reward, the eligibility traces of these earlier cues decay quickly, thereby resulting in a higher ANCCR for the later cues.
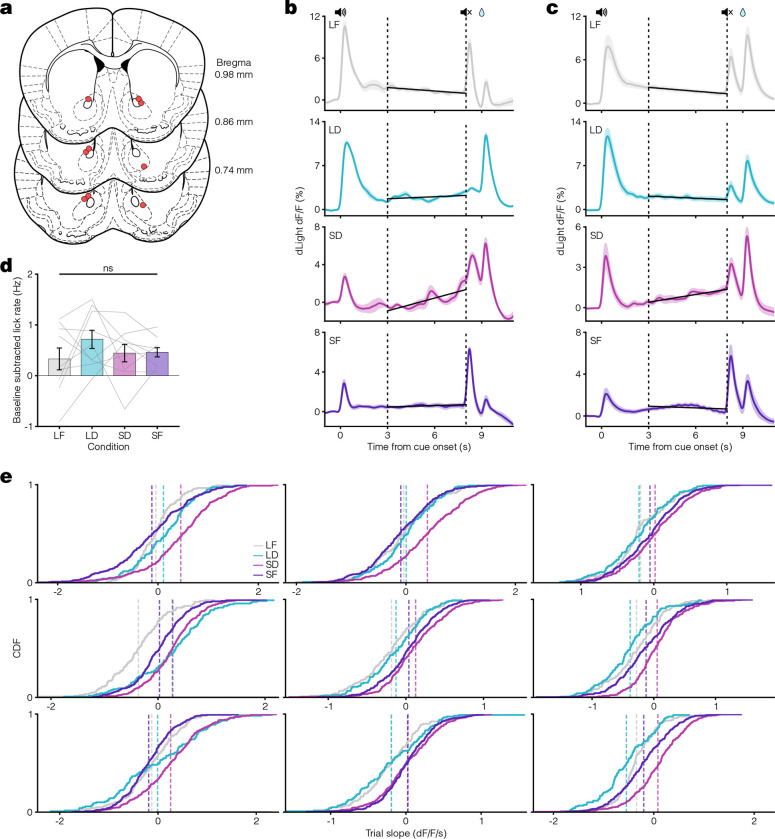
Extended Data Figure 2. Pavlovian conditioning histology and responses.
a. Mouse coronal brain sections showing reconstructed locations of optic fiber tips (red circles) in NAcC for Pavlovian conditioning task. b. Example average dLight traces for the last three days of all conditions. Vertical dashed lines at 3 and 8 s represent the ramp window period. Black lines display the linear regression fit during this period. c. Same as in b but for the average dLight traces across all animals. d. Comparison of average baseline subtracted lick rate during the ramp window across all conditions (one-way ANOVA: F(3) = 0.81, p = 0.50). e. Individual plots for each mouse displaying the cumulative distribution of per-trial slopes for the last three days in all conditions. Vertical dashed lines indicate the average trial slope for LF (grey), LD (teal), SD (pink), and SF (purple) conditions.
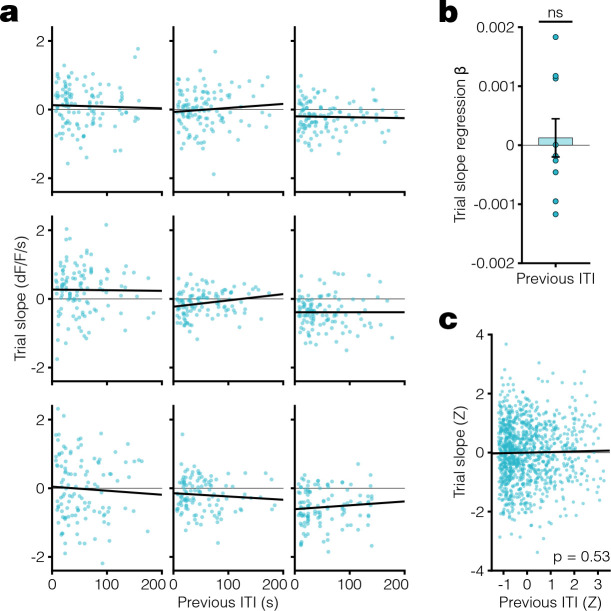
Extended Data Figure 3. Trial-by-trial correlations for long ITI/dynamic tone condition.
a. Scatter plots showing the relationship between dopamine response slope within a trial and previous ITI for all trials in the last 3 days of LD condition. Each animal plotted individually with linear regression fit (black line). b. Linear regression β coefficients for previous ITI predicting trial slope (one-sided [< 0] one sample t-test: t(8) = 0.36, p = 0.64). c. Scatter plot of Z-scored trial slope vs. previous ITI pooled across mice for all trials in the last 3 days of LD condition (linear regression: t(1050) = 0.64, R2 = 3.9 ×10⁻⁴, p = 0.53).
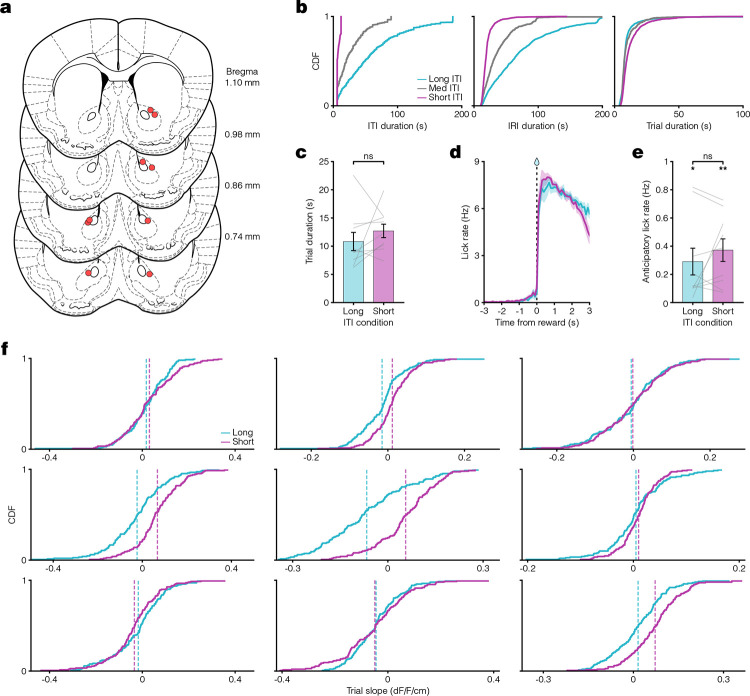
Extended Data Figure 4. VR task histology and responses.
a. Mouse coronal brain sections showing reconstructed locations of optic fiber tips (red circles) in NAcC for VR navigation task. b. Left, CDF of ITI duration for long (teal), medium (grey), and short (pink) ITI conditions. Middle, CDF plot of inter-reward interval (IRI) durations for each condition. Right, CDF plot of trial durations for each condition. c. Comparison of average trial duration for long and short ITI conditions (paired t-test: t(8) = 1.0, p = 0.34). d. Lick rate PSTH aligned to reward delivery indicates minimal anticipatory licking behavior. e. Quantification of average anticipatory lick rate 1 s before reward delivery. Bottom asterisks indicate a positive anticipatory lick rate for both ITI conditions (one-sided [> 0] one sample t-test: long ITI t(8) = 2.9, *p = 0.010; short ITI t(8) = 4.4, **p = 0.0012), though there was no significant difference between conditions (paired t-test: t(8) = 1.1, p = 0.31) f. CDF plots for each mouse separately showing the distribution of per-trial slopes for the last three days in both conditions. Vertical dashed lines indicate the average trial slope for long (teal) and short (pink) ITI conditions.
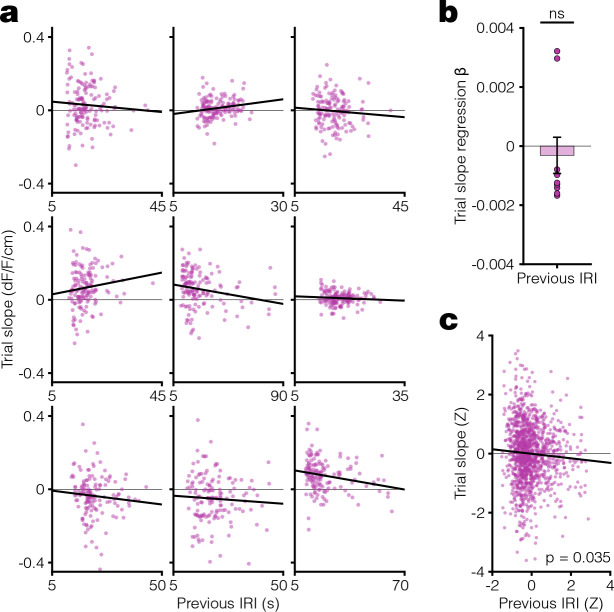
Extended Data Figure 5. Trial-by-trial correlation of dopamine response slope vs previous inter-reward interval (IRI) in the VR task.
a. Scatter plot of dopamine response slope on a trial and the previous IRI for individual animals in the VR task during the short ITI condition. Here, we are measuring the environmental timescale using IRI instead of ITI because the trial duration in this task (see Supplementary Note 1) depends on the running speed of the animals, which varies trial to trial. Thus, IRI measures the net time interval between successive trial onsets. In the Pavlovian conditioning task, IRI and ITI differ by a constant since the trial duration is fixed. b. Linear regression β coefficients for previous IRI vs trial slope calculated per animal (one-sided [< 0] one sample t-test: t(8) = −0.48, p = 0.32). c. Scatter plot of Z-scored trial slope vs. previous IRI pooled across mice for all trials in the last 3 days of the Short ITI condition (linear regression: t(1301) = −2.11, R2 = 0.0034, *p = 0.035).
Supplementary Material
ACKNOWLEDGEMENTS
We thank J. Berke and members of the Namboodiri laboratory for helpful discussions. This project was supported by the NIH (grants R00MH118422 and R01MH129582 to V.M.K.N.), the NSF (graduate research fellowship to J.R.F.), the UCSF Discovery Fellowship (J.R.F.), and the Scott Alan Myers Endowed Professorship (V.M.K.N.). The authors have no competing interests.
Bibliography
- 1.Berke Joshua D. What does dopamine mean? Nature Neuroscience, 21(6):787–793, 2018. [DOI] [PMC free article] [PubMed] [Google Scholar]
- 2.Grace Anthony A. Phasic versus tonic dopamine release and the modulation of dopamine system responsivity: a hypothesis for the etiology of schizophrenia. Neuroscience, 41(1):1–24, 1991. [DOI] [PubMed] [Google Scholar]
- 3.Niv Yael, Daw Nathaniel D, J Daphna oel, and Dayan Peter. Tonic dopamine: opportunity costs and the control of response vigor. Psychopharmacology, 191:507–520, 2007. [DOI] [PubMed] [Google Scholar]
- 4.Howe Mark W, Tierney Patrick L, Sandberg Stefan G, Phillips Paul EM, and Graybiel Ann M. Prolonged dopamine signalling in striatum signals proximity and value of distant rewards. Nature, 500(7464):575–579, 2013. [DOI] [PMC free article] [PubMed] [Google Scholar]
- 5.Hamid Arif A, Pettibone Jeffrey R, Mabrouk Omar S, Hetrick Vaughn L, Schmidt Robert, Vander Weele Caitlin M, Kennedy Robert T, Aragona Brandon J, and Berke Joshua D. Mesolimbic dopamine signals the value of work. Nature Neuroscience, 19(1):117–126, 2016. [DOI] [PMC free article] [PubMed] [Google Scholar]
- 6.Mohebi Ali, Pettibone Jeffrey R, Hamid Arif A, Wong Jenny-Marie T, Vinson Leah T, Patriarchi Tommaso, Tian Lin, Kennedy Robert T, and Berke Joshua D. Dissociable dopamine dynamics for learning and motivation. Nature, 570(7759):65–70, 2019. [DOI] [PMC free article] [PubMed] [Google Scholar]
- 7.Guru Akash, Seo Changwoo, Post Ryan J, Kullakanda Durga S, Schaffer Julia A, and Warden Melissa R. Ramping activity in midbrain dopamine neurons signifies the use of a cognitive map. bioRxiv, pages 2020–05, 2020. [Google Scholar]
- 8.Kim HyungGoo R, Malik Athar N, Mikhael John G, Bech Pol, Tsutsui-Kimura Iku, Sun Fangmiao, Zhang Yajun, Li Yulong, Watabe-Uchida Mitsuko, Gershman Samuel J, et al. A unified framework for dopamine signals across timescales. Cell, 183(6):1600–1616, 2020. [DOI] [PMC free article] [PubMed] [Google Scholar]
- 9.Collins Anne L, Greenfield Venuz Y, Bye Jeffrey K, Linker Kay E, Wang Alice S, and Wassum Kate M. Dynamic mesolimbic dopamine signaling during action sequence learning and expectation violation. Scientific Reports, 6(1):20231, 2016. [DOI] [PMC free article] [PubMed] [Google Scholar]
- 10.Farrell Karolina, Lak Armin, and Saleem Aman B. Midbrain dopamine neurons signal phasic and ramping reward prediction error during goal-directed navigation. Cell Reports, 41(2), 2022. [DOI] [PMC free article] [PubMed] [Google Scholar]
- 11.Hamid Arif A, Frank Michael J, and Moore Christopher I. Wave-like dopamine dynamics as a mechanism for spatiotemporal credit assignment. Cell, 184(10):2733–2749, 2021. [DOI] [PMC free article] [PubMed] [Google Scholar]
- 12.Hamilos Allison E, Spedicato Giulia, Hong Ye, Sun Fangmiao, Li Yulong, and Assad John A. Slowly evolving dopaminergic activity modulates the moment-to-moment probability of reward-related self-timed movements. eLife, 10:e62583, 2021. [DOI] [PMC free article] [PubMed] [Google Scholar]
- 13.Krausz Timothy A, Comrie Alison E, Kahn Ari E, Frank Loren M, Daw Nathaniel D, and Berke Joshua D. Dual credit assignment processes underlie dopamine signals in a complex spatial environment. Neuron, 111(21):3465–3478, 2023. [DOI] [PMC free article] [PubMed] [Google Scholar]
- 14.Engelhard Ben, Finkelstein Joel, Cox Julia, Fleming Weston, Jang Hee Jae, Ornelas Sharon, Koay Sue Ann, Thiberge Stephan Y, Daw Nathaniel D, Tank David W, et al. Specialized coding of sensory, motor and cognitive variables in vta dopamine neurons. Nature, 570 (7762):509–513, 2019. [DOI] [PMC free article] [PubMed] [Google Scholar]
- 15.Gao Zilong, Wang Hanqing, Lu Chen, Lu Tiezhan, Froudist-Walsh Sean, Chen Ming, Wang XiaoJing, Hu Ji, and Sun Wenzhi. The neural basis of delayed gratification. Science Advances, 7(49):eabg6611, 2021. [DOI] [PMC free article] [PubMed] [Google Scholar]
- 16.Syed Emilie CJ, Grima Laura L, Magill Peter J, Bogacz Rafal, Brown Peter, and Walton Mark E. Action initiation shapes mesolimbic dopamine encoding of future rewards. Nature Neuroscience, 19(1):34–36, 2016. [DOI] [PMC free article] [PubMed] [Google Scholar]
- 17.Niv Yael. Dopamine ramps up. Nature, 500(7464):533–535, 2013. [DOI] [PubMed] [Google Scholar]
- 18.Mikhael John G, Kim HyungGoo R, Uchida Naoshige, and Gershman Samuel J. The role of state uncertainty in the dynamics of dopamine. Current Biology, 32(5):1077–1087, 2022. [DOI] [PMC free article] [PubMed] [Google Scholar]
- 19.Morita Kenji and Kato Ayaka. A neural circuit mechanism for the involvements of dopamine in effort-related choices: decay of learned values, secondary effects of depletion, and calculation of temporal difference error. eNeuro, 5(1), 2018. [DOI] [PMC free article] [PubMed] [Google Scholar]
- 20.Jeong Huijeong, Taylor Annie, Floeder Joseph R, Lohmann Martin, Mihalas Stefan, Wu Brenda, Zhou Mingkang, Burke Dennis A, and Namboodiri Vijay Mohan K. Mesolimbic dopamine release conveys causal associations. Science, 378(6626):eabq6740, 2022. [DOI] [PMC free article] [PubMed] [Google Scholar]
- 21.Coddington Luke T, Lindo Sarah E, and Dudman Joshua T. Mesolimbic dopamine adapts the rate of learning from action. Nature, 614(7947):294–302, 2023. [DOI] [PMC free article] [PubMed] [Google Scholar]
- 22.Kutlu Munir Gunes, Zachry Jennifer E, Melugin Patrick R, Cajigas Stephanie A, Chevee Maxime F, Kelly Shannon J, Kutlu Banu, Tian Lin, Siciliano Cody A, and Calipari Erin S. Dopamine release in the nucleus accumbens core signals perceived saliency. Current Biology, 31(21):4748–4761, 2021. [DOI] [PMC free article] [PubMed] [Google Scholar]
- 23.Sousa Margarida, Bujalski Pawel, Cruz Bruno F, Louie Kenway, McNamee Daniel, and Paton Joseph J. Dopamine neurons encode a multidimensional probabilistic map of future reward. bioRxiv, pages 2023–11, 2023. [Google Scholar]
- 24.Gardner Matthew PH, Schoenbaum Geoffrey, and Gershman Samuel J. Rethinking dopamine as generalized prediction error. Proceedings of the Royal Society B, 285(1891):20181645, 2018. [DOI] [PMC free article] [PubMed] [Google Scholar]
- 25.Sharpe Melissa J, Batchelor Hannah M, Mueller Lauren E, Chang Chun Yun, Maes Etienne JP, Niv Yael, and Schoenbaum Geoffrey. Dopamine transients do not act as model-free prediction errors during associative learning. Nature Communications, 11(1):106, 2020. [DOI] [PMC free article] [PubMed] [Google Scholar]
- 26.Carter Francis, Cossette Marie-Pierre, Trujillo-Pisanty Ivan, Pallikaras Vasilios, Breton Yannick-André, Conover Kent, Caplan Jill, Solis Pavel, Voisard Jacques, Yaksich Alexandra, et al. Does phasic dopamine release cause policy updates? European Journal of Neuroscience, 2023. [DOI] [PubMed] [Google Scholar]
- 27.Hughes Ryan N, Bakhurin Konstantin I, Petter Elijah A, Watson Glenn DR, Kim Namsoo, Friedman Alexander D, and Yin Henry H. Ventral tegmental dopamine neurons control the impulse vector during motivated behavior. Current Biology, 30(14):2681–2694, 2020. [DOI] [PMC free article] [PubMed] [Google Scholar]
- 28.Waddell Scott. Reinforcement signalling in drosophila; dopamine does it all after all. Current Opinion in Neurobiology, 23(3):324–329, 2013. [DOI] [PMC free article] [PubMed] [Google Scholar]
- 29.Markowitz Jeffrey E, Gillis Winthrop F, Jay Maya, Wood Jeffrey, Harris Ryley W, Cieszkowski Robert, Scott Rebecca, Brann David, Koveal Dorothy, Kula Tomasz, et al. Spontaneous behaviour is structured by reinforcement without explicit reward. Nature, 614(7946):108–117, 2023. [DOI] [PMC free article] [PubMed] [Google Scholar]
- 30.Tang Jonathan CY, Paixao Vitor, Carvalho Filipe, Silva Artur, Klaus Andreas, da Silva Joaquim Alves, and Costa Rui M. Dynamic behaviour restructuring mediates dopamine-dependent credit assignment. Nature, 626(7999):583–592, 2024. [DOI] [PMC free article] [PubMed] [Google Scholar]
- 31.Berridge Kent C. The debate over dopamine’s role in reward: the case for incentive salience. Psychopharmacology, 191:391–431, 2007. [DOI] [PubMed] [Google Scholar]
- 32.Sias Ana C, Jafar Yousif, Goodpaster Caitlin M, Ramírez-Armenta Kathia, Wrenn Tyler M, Griffin Nicholas K, Patel Keshav, Lamparelli Alexander C, Sharpe Melissa J, and Wassum Kate M. Dopamine projections to the basolateral amygdala drive the encoding of identity-specific reward memories. Nature Neuroscience, pages 1–9, 2024. [DOI] [PMC free article] [PubMed] [Google Scholar]
- 33.Maes Etienne J P, Sharpe Melissa J, Usypchuk Alexandra A, Lozzi Megan, Chang Chun Yun, Gardner Matthew PH, Schoenbaum Geoffrey, and Iordanova Mihaela D. Causal evidence supporting the proposal that dopamine transients function as temporal difference prediction errors. Nature Neuroscience, 23(2):176–178, 2020. [DOI] [PMC free article] [PubMed] [Google Scholar]
- 34.Garr Eric, Cheng Yifeng, Jeong Huijeong, Brooke Sara, Castell Laia, Bal Aneesh, Magnard Robin, Namboodiri Vijay Mohan K, and Janak Patricia H. Mesostriatal dopamine is sensitive to specific cue-reward contingencies. bioRxiv, pages 2023–06, 2023. [DOI] [PMC free article] [PubMed] [Google Scholar]
- 35.Jakob Anthony, Mikhael John G, Hamilos Allison E, Assad John A, and Gershman Samuel J. Dopamine mediates the bidirectional update of interval timing. Behavioral Neuroscience, 136(5):445, 2022. [DOI] [PMC free article] [PubMed] [Google Scholar]
- 36.Saunders Benjamin T, Richard Jocelyn M, Margolis Elyssa B, and Janak Patricia H. Dopamine neurons create pavlovian conditioned stimuli with circuit-defined motivational properties. Nature Neuroscience, 21(8):1072–1083, 2018. [DOI] [PMC free article] [PubMed] [Google Scholar]
- 37.Takahashi Yuji K, Stalnaker Thomas A, Mueller Lauren E, Harootonian Sevan K, Langdon Angela J, and Schoenbaum Geoffrey. Dopaminergic prediction errors in the ventral tegmental area reflect a multithreaded predictive model. Nature Neuroscience, 26(5):830–839, 2023. [DOI] [PMC free article] [PubMed] [Google Scholar]
- 38.Redgrave Peter and Gurney Kevin. The short-latency dopamine signal: a role in discovering novel actions? Nature Reviews Neuroscience, 7(12):967–975, 2006. [DOI] [PubMed] [Google Scholar]
- 39.Bromberg-Martin Ethan, Matsumoto Masayuki, and Hikosaka Okihide. Dopamine in motivational control: rewarding, aversive, and alerting. Neuron, 68(5):815–834, 2010. [DOI] [PMC free article] [PubMed] [Google Scholar]
- 40.Burke Dennis A, Jeong Huijeong, Wu Brenda, Lee Seul Ah, Floeder Joseph R, and Namboodiri Vijay Mohan K. Few-shot learning: temporal scaling in behavioral and dopaminergic learning. bioRxiv, 2023. [Google Scholar]
- 41.Patriarchi Tommaso, Cho Jounhong Ryan, Merten Katharina, Howe Mark W, Marley Aaron, Xiong Wei-Hong, Folk Robert W, Broussard Gerard Joey, Liang Ruqiang, Jang Min Jee, et al. Ultrafast neuronal imaging of dopamine dynamics with designed genetically encoded sensors. Science, 360(6396):eaat4422, 2018. [DOI] [PMC free article] [PubMed] [Google Scholar]
- 42.Lopes Gonçalo, Farrell Karolina, Horrocks Edward AB, Lee Chi-Yu, Morimoto Mai M, Muzzu Tomaso, Papanikolaou Amalia, Rodrigues Fabio R, Wheatcroft Thomas, Zucca Stefano, et al. Creating and controlling visual environments using bonvision. eLife, 10:e65541, 2021. [DOI] [PMC free article] [PubMed] [Google Scholar]
- 43.Namboodiri Vijay Mohan K, Mihalas Stefan, and Shuler Marshall GH. Rationalizing decision-making: understanding the cost and perception of time. Timing & Time Perception Reviews, 1, 2014. [Google Scholar]
- 44.Williams Douglas A, Todd Travis P, Chubala Chrissy M, and Ludvig Elliot A. Intertrial unconditioned stimuli differentially impact trace conditioning. Learning & Behavior, 45:49–61, 2017. [DOI] [PubMed] [Google Scholar]
- 45.Zhou Mingkang, Wu Brenda, Jeong Huijeong, Burke Dennis A, and Namboodiri Vijay Mohan K. An open-source behavior controller for associative learning and memory (b-calm). Behavior Research Methods, pages 1–16, 2023. [DOI] [PMC free article] [PubMed] [Google Scholar]
- 46.Namboodiri Vijay Mohan K. How do real animals account for the passage of time during associative learning? Behavioral Neuroscience, 136(5):383, 2022. [DOI] [PMC free article] [PubMed] [Google Scholar]
Associated Data
This section collects any data citations, data availability statements, or supplementary materials included in this article.


