

Abstract
Metformin is a widely prescribed anti-diabetic medicine that also reduces body weight. There is ongoing debate about the mechanisms that mediate metformin’s effects on energy balance. Here, we show that metformin is a powerful pharmacological inducer of the anorexigenic metabolite N-lactoyl-phenylalanine (Lac-Phe) in cells, in mice and two independent human cohorts. Metformin drives Lac-Phe biosynthesis through the inhibition of complex I, increased glycolytic flux and intracellular lactate mass action. Intestinal epithelial CNDP2+ cells, not macrophages, are the principal in vivo source of basal and metformin-inducible Lac-Phe. Genetic ablation of Lac-Phe biosynthesis in male mice renders animals resistant to the effects of metformin on food intake and body weight. Lastly, mediation analyses support a role for Lac-Phe as a downstream effector of metformin’s effects on body mass index in participants of a large population-based observational cohort, the Multi-Ethnic Study of Atherosclerosis. Together, these data establish Lac-Phe as a critical mediator of the body weight-lowering effects of metformin.
Metformin is a widely prescribed anti-diabetic medicine1,2. In addition to its glucose-lowering activity, many clinical studies have also demonstrated that metformin reduces body weight3–5. The effects of metformin on body weight appear to be associated with suppression of food intake rather than changes in nutrient absorption or energy expenditure6,7. In recent years, focus has turned to the GDF15–GFRAL pathway as a potential mediator of the effects of metformin on body weight8–10. However, data in this area have been conflicting11,12. As a result, there remains ongoing debate about the precise molecular mechanisms that mediate the anorexigenic and anti-obesity effects of metformin.
We recently reported that a blood-borne, exercise-inducible metabolite called Lac-Phe that suppresses food intake and body weight13. Genetic ablation of CNDP2, the principal biosynthetic enzyme for Lac-Phe, reduces basal and exercise-inducible Lac-Phe levels and renders mice hyperphagic and obese after a combination of a high-fat diet and treadmill running training. In humans, exercise-inducible Lac-Phe predicts adipose tissue loss during endurance training in overweight and obese individuals14.
Here, we identify metformin as a powerful pharmacological stimulator of Lac-Phe levels in mice and humans. Mechanistically, metformin acts in the gut to increase Lac-Phe biosynthesis by inhibition of complex I. The induction of Lac-Phe by metformin is critical for its anorexigenic and anti-obesity effects. Finally, statistical mediation analyses support a role for Lac-Phe in metformin-associated weight loss in a large population-based observational cohort. These data demonstrate that Lac-Phe is a critical mediator of metformin’s effects on energy balance.
Results
Metformin increases plasma Lac-Phe in humans and mice
We examined Lac-Phe levels in metformin-treated individuals because of the well-established reciprocal relationship between reduced oxidative phosphorylation and increased glycolytic flux; such a metabolic shift would potentially be expected to increase Lac-Phe as a downstream metabolic consequence. We used banked plasma samples from a prior study at Stanford Medicine that consisted of participants with type 2 diabetes who had not received metformin previously (n = 31, mean age 58 ± 10 years; mean body mass index (BMI), 29.4 ± 4.6 kg m−2)15; a sub-sample of n = 21 was used for liquid chromatography–mass spectrometry (LC–MS) analysis. Robust increases in Lac-Phe levels were observed in individuals after 12 weeks of metformin therapy (mean ± s.e.m., pre, 0.09 ± 0.03 μM; post, 0.32 ± 0.11 μM, P = 0.023) (Fig. 1a,b). Lac-Phe was validated by the correct retention time (Extended Data Fig. 1a) and the correct transition 236.1 > 88.0 (Extended Data Fig. 1b). We observed a modest correlation of metformin and Lac-Phe levels (Extended Data Fig. 1c). No changes were found in plasma lactate levels (P = 0.12; Extended Data Fig. 1d).
Fig. 1 |. Metformin increases Lac-Phe levels in vivo and in vitro.
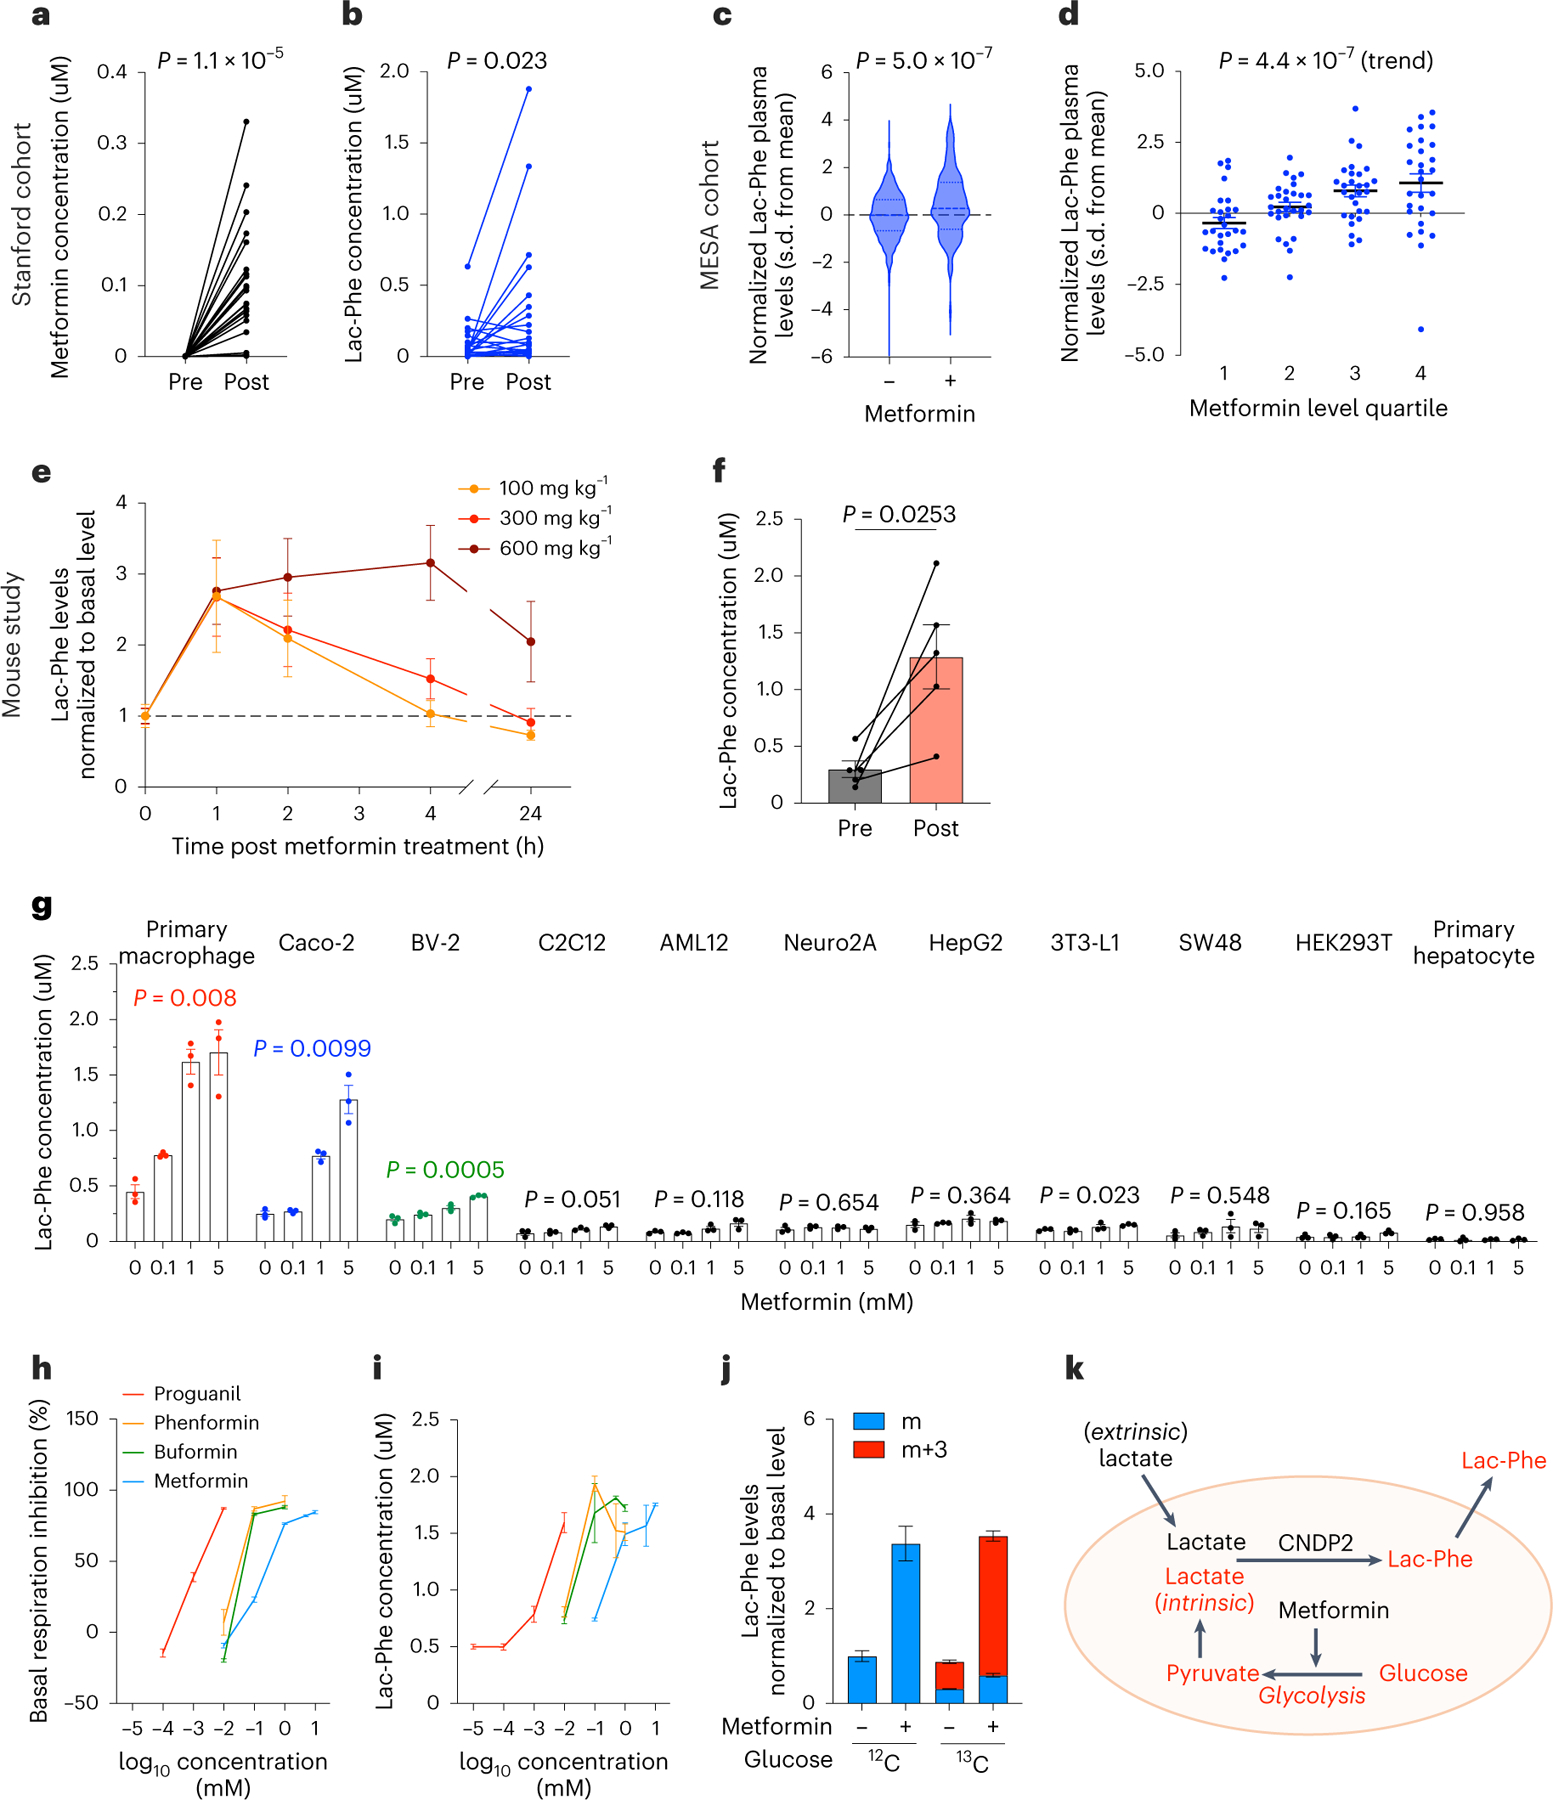
a,b, Plasma levels of metformin (a) and Lac-Phe (b) before and after 3 months of metformin treatment in the Stanford cohort (n = 21). c, Plasma levels of Lac-Phe in participants of MESA on metformin (n = 179) compared to participants not on metformin (n = 3,477). Dashed lines indicate medians and quartiles. d, Plasma levels of Lac-Phe by increasing quartiles of metformin use among the 179 participants on metformin. e, Relative plasma Lac-Phe levels in 12–14-week-old male C57BL/6J DIO mice at the indicated time point after administration of metformin by oral gavage (n = 5 per group). f, Absolute quantitation of plasma Lac-Phe concentrations in 12–14 week-old male C57BL/6J DIO mice before and 1 h after 300 mg kg−1 metformin oral gavage (n = 5); 100 mg kg−1, 300 mg kg−1 and 600 mg kg−1 corresponds to 0.60 × 10⁶ nmol kg−1, 1.81 × 10⁶ nmol kg−1 and 3.62 × 10⁶ nmol kg−1, respectively. g, Lac-Phe concentrations in conditioned media from the indicated cell lines and primary cells when treated with metformin overnight at doses indicated (n = 3 per concentration). h,i, Percentage inhibition of basal respiration (n = 5 per concentration) (h) and Lac-Phe concentration in media (n = 3 per concentration) (i) following overnight treatment of primary macrophages with the indicated biguanide at the indicated concentrations. j, Fold-change of labeled and unlabeled media Lac-Phe levels in primary macrophage (n = 3 per condition) using either 12C-labeled or 13C-labeled glucose. k, Schematic illustration of intracellular glycolysis-derived lactate as a source for metformin-induced Lac-Phe production. P values in a, b and f were calculated with two-sided paired t-tests. P value in c was generated using linear regression models adjusting for age, sex, fasting plasma glucose, total cholesterol and hypertension status. P value in d was generated using the one-sided Jonckheere–Terpstra test for trend. P values in g were calculated with a two-sided Welch’s ANOVA test. The n numbers in g–j represent independent biological samples. Error bars, s.e.m.
We next analyzed the association of metformin use with plasma Lac-Phe levels in participants of the population-based Multi-Ethnic Study of Atherosclerosis (MESA; n = 3,656)16. The baseline characteristics of the MESA study participants are detailed in Supplementary Table 1 and included 179 participants on metformin. In multivariable regression analyses (adjusted for age, sex, fasting glucose, total cholesterol and hypertension status), participants on metformin had significantly higher circulating levels of Lac-Phe compared to participants who were not on metformin (β = 0.53, P = 5.0 × 10⁻⁷) (Fig. 1c). In addition, Lac-Phe levels exhibited a significant step-wise increase across increasing quartiles of plasma metformin levels (z = 5.05, P(trend) = 4.4 × 10⁻⁷) (Fig. 1d). In this cohort, lactate was once again unchanged with metformin use (P = 0.47; Extended Data Fig. 1e).
Finally, we administered metformin (100, 300 or 600 mg kg−1 per os (PO)) to wild-type (WT) C57BL/6J diet-induced obese (DIO, 12–14 weeks old) mice and performed LC–MS on blood plasma. These metformin doses are similar to those used in a large body of previously published mouse studies of metformin treatment8–10,17–21. Metformin levels reached ~2–10 μM in plasma and ~650 μM in intestine tissues (Extended Data Fig. 1f,g). Metformin administration once again increased plasma Lac-Phe levels (Fig. 1e,f). Blood lactate levels in mice were unchanged after metformin treatment (Extended Data Fig. 1h). We also observe that Lac-Phe levels are reduced by fasting and increased by re-feeding (Extended Data Fig. 1i). We conclude that metformin administration increases plasma Lac-Phe levels in both mice and humans.
Metformin inhibits complex I to drive Lac-Phe biosynthesis
To determine the biochemical mechanisms by which metformin increases Lac-Phe levels, we measured Lac-Phe levels in conditioned media across a large panel of cell lines and primary cells after overnight treatment with increasing concentrations of metformin. The strongest induction of Lac-Phe by metformin was seen in primary mouse macrophages, followed by Caco-2, a human gut epithelial cell line, and BV-2, a mouse microglial cell line (Fig. 1g). Little metformin-stimulated Lac-Phe production was observed in the other cells tested (Fig. 1g).
Metformin is a direct inhibitor of mitochondrial complex I. Such a mechanism and molecular target might explain metformin’s induction of Lac-Phe owing to the subsequent glycolytic shift and increased lactate flux from intracellular lactate13,22. Consistent with this mechanism23,24, in primary macrophages metformin dose-dependently inhibited cellular respiration (Extended Data Fig. 2a) at concentrations that paralleled those required to increase Lac-Phe levels (~0.1–1 mM). A similar dose-dependent correspondence of respiratory inhibition and Lac-Phe induction was also observed for the structurally related biguanides buformin, phenformin and proguanil (Fig. 1h,i and Extended Data Fig. 2b). In addition, other inhibitors of mitochondrial oxidative phosphorylation also increased Lac-Phe levels (Extended Data Fig. 2c).
We previously showed that in the context of sprint exercise, Lac-Phe biosynthesis is driven by mass action through increases in extracellular, muscle-derived lactate. The absence of a robust increase in circulating lactate after metformin treatment suggests that a potentially distinct source of lactate drives Lac-Phe biosynthesis under these conditions. Using 13C-labeled glucose, the majority (>80%) of the metformin-inducible increase in Lac-Phe was of the m+3 isotope, which is consistent with a predominant contribution of intracellular lactate (derived from 13C-labeled glucose) to Lac-Phe biosynthesis (Fig. 1j). Further supporting the intracellular lactate flux model, tracing experiments using 13C-labeled lactate failed to demonstrate a major contribution of extracellular lactate to Lac-Phe production following metformin treatment (Extended Data Fig. 2d). We therefore conclude that whereas sprintexercise drives Lac-Phe production through extracellular lactate mass action, metformin drives Lac-Phe production through intracellular lactate mass action by glycolysis-derived lactate (Fig. 1k).
Lastly, we performed detailed studies of metformin and other oxidative phosphorylation inhibitors on Lac-Phe induction in the human gut epithelial Caco-2 cell line. Caco-2 cells treated with increasing concentrations of metformin or other biguanides also exhibited a dose-dependent suppression of respiration that coincided with inducible Lac-Phe production (Extended Data Fig. 3a–d). Rotenone, antimycin and azide treatment of Caco-2 cells also resulted in 10–50-fold increases in Lac-Phe levels (Extended Data Fig. 3e). Isotope tracing again showed a principal contribution of carbons from 13C-labeled glucose, not 13C-labeled lactate, to metformin-inducible Lac-Phe production Caco-2 cells (Extended Data Fig. 3f,g). Lastly, Lac-Phe itself did not exhibit any negative effects on cellular viability as measured using a CCK8 assay (Extended Data Fig. 3h). Therefore, metformin inhibition of complex I drives intracellular lactate mass action to increase Lac-Phe in the gut epithelial Caco-2 cell line as well.
Lac-Phe is produced from gut epithelial CNDP2+ cells in vivo
CNDP2 is the principal biosynthetic enzyme for basal and exercise-inducible Lac-Phe. In CNDP2-knockout (KO) primary macrophages (Extended Data Fig. 4a), Lac-Phe production was reduced by ~50% in the basal state and further reduced by ~80% in metformin-stimulated conditions (Fig. 2a). A similarly large diminution of metformin-stimulated Lac-Phe production was also observed in CNDP2-KO Caco-2 and BV-2 cell lines (Extended Data Fig. 4a and Fig. 2b,c). In global CNDP2-KO mice, plasma Lac-Phe levels were reduced by ~70% compared to WT mice and also remained unchanged after a single dose of metformin (300 mg kg−1, PO) (Fig. 2d). Lactate levels remained the same after metformin treatment in both genotypes (Extended Data Fig. 4b). Therefore, CNDP2 is the principal biosynthetic enzyme responsible for the increase in Lac-Phe following metformin treatment in cells and in mice.
Fig. 2 |. Gut epithelial CNDP2+ cells are primary sources of basal and metformin-inducible Lac-Phe.
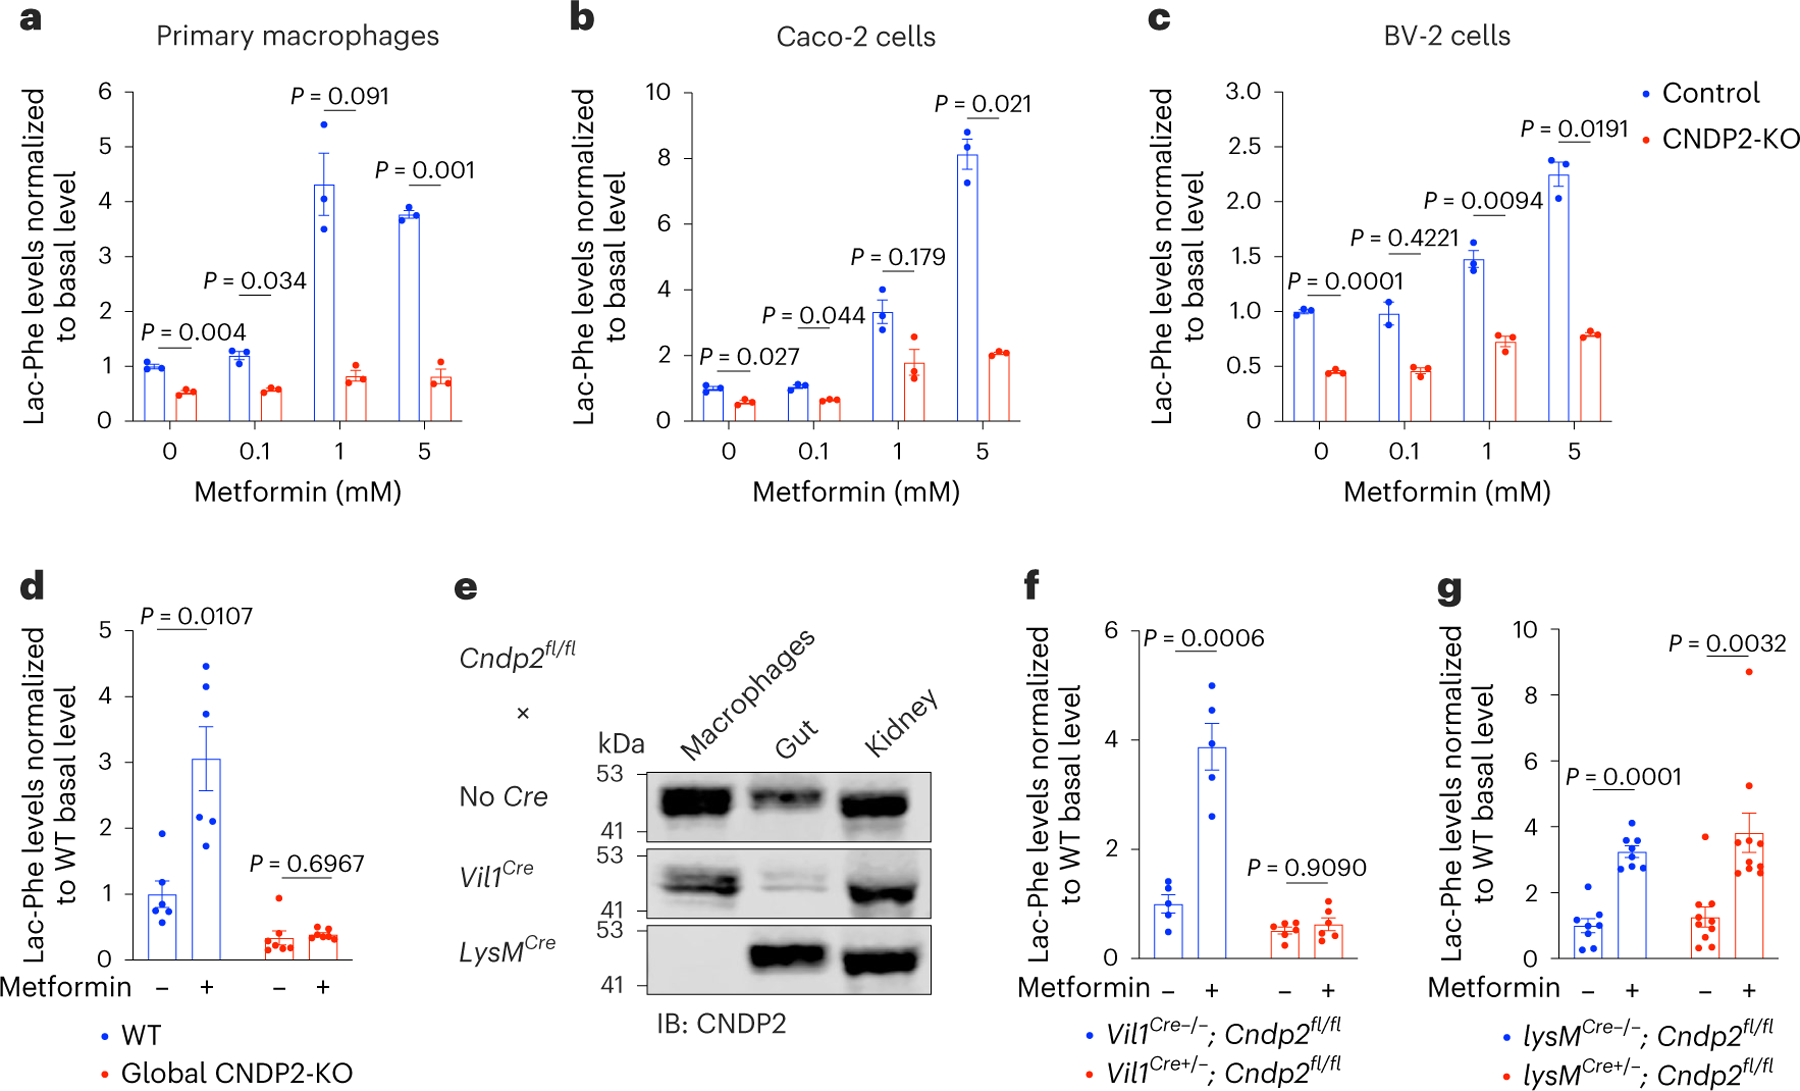
a–c, Relative Lac-Phe levels in media of WT or CNDP2-KO in primary macrophages (a), Caco-2 cells (b) or BV-2 cells (c) after overnight treatment with metformin at the indicated concentration (n = 3 per condition). d, Relative plasma Lac-Phe levels in 12–14-week-old male WT or global CNDP2-KO DIO mice in the basal state or 1 h after treatment with metformin (300 mg kg−1, PO) (n = 6 for WT; n = 7 for CNDP2-KO). e, Western blotting using an anti-CNDP2 antibody in peritoneal macrophages, gut or kidney tissues isolated from mice of the indicated genotypes. f–g, Relative plasma Lac-Phe levels in the basal state or 1 h after treatment with metformin (300 mg kg−1, PO) in the indicated genotypes (n = 5 for Vil1Cre−/−; Cndp2fl/fl; n = 6 for Vil1Cre+/−; Cndp2fl/fl; 7–8 weeks old, mixed sexes; n = 8 for lysMCre−/−; Cndp2fl/fl; n = 10 for lysMCre+/−; Cndp2fl/fl; 18 weeks old, male). P values in a–c were calculated with two-sided multiple unpaired t-tests with Welch and Bonferroni–Dunn corrections. P values in d, f and g were calculated with two-sided multiple paired t-tests with Holm–Šídák corrections. The n numbers in a–c represent independent biological samples. Western blot experiments in e were done twice with similar results obtained. Error bars, s.e.m.
We generated conditional Cndp2 floxed mice to determine the specific cell types responsible for the production of Lac-Phe in vivo (Extended Data Fig. 4c). Gut-specific CNDP2-KO mice were produced by crossing the conditional Cndp2 allele with the Villin-cre driver line25, a cre that expresses broadly in the intestinal epithelium25–28. Specific loss of CNDP2 protein in the gut of Vil1-cre; Cndp2fl/fl mice was confirmed by western blotting (Fig. 3e and Extended Data Fig. 4d,e). Basal Lac-Phe levels in Vil1-cre; Cndp2fl/fl mice were reduced by 50% compared to littermate Cndp2fl/fl controls (Fig. 2f; P = 0.0168). In addition, Vil1-cre; Cndp2fl/fl mice were completely resistant to metformin-inducible increases in plasma Lac-Phe (Fig. 2f). Next, we generated macrophage-specific CNDP2-KO mice using the LysM-cre driver line29 (Fig. 2e and Extended Data Fig. 4d,e). Unlike Vil1-cre; Cndp2fl/fl mice, lysM-cre; Cndp2fl/fl mice exhibited identical plasma Lac-Phe levels compared to control animals in both the basal state and following metformin treatment (Fig. 2g). We conclude that the gut, and specifically intestinal epithelial cells, but not macrophages, are the primary source of basal and metformin-inducible circulating Lac-Phe in vivo.
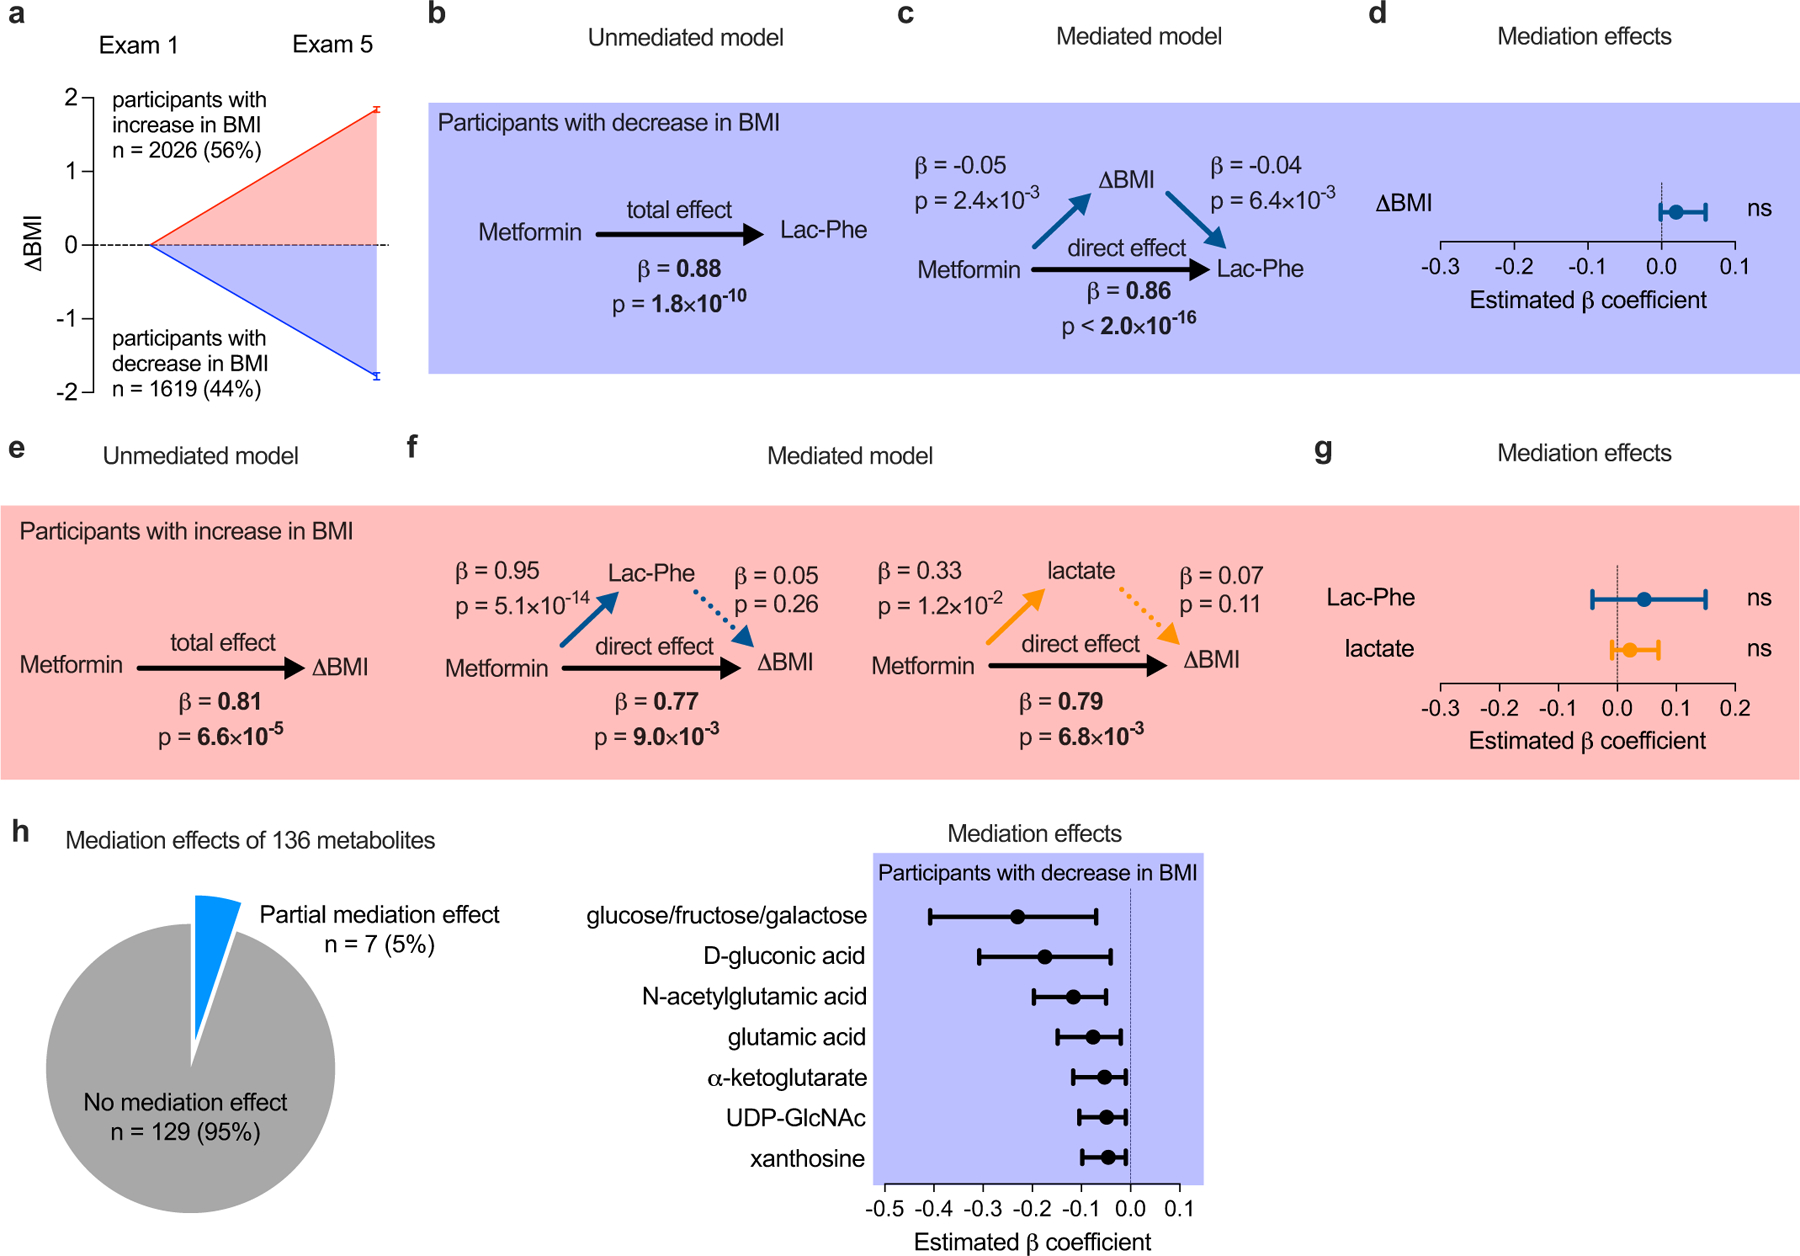
Fig. 3 |. Lac-Phe mediates the effect of metformin on ΔBMI in a post-hoc subgroup analysis of MESA participants.
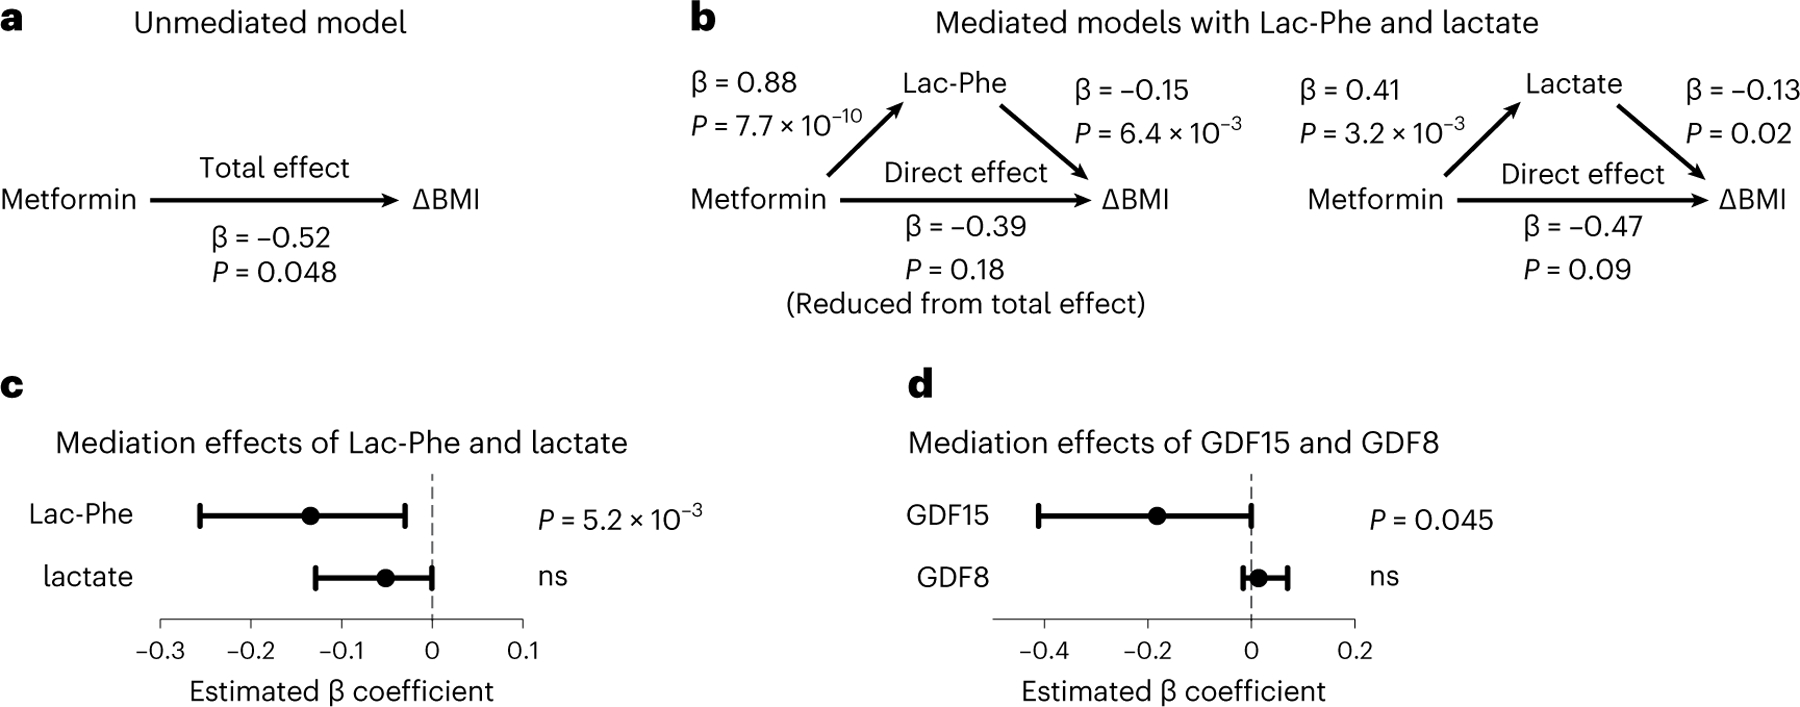
a, The total effect of metformin use on ΔBMI in an ‘unmediated model’ using an age-adjusted and sex-adjusted linear regression model. b, Mediated models with Lac-Phe and lactate on the association of metformin use and ΔBMI. The direct effect of metformin use on ΔBMI was assessed using an age-adjusted and sex-adjusted linear regression model adjusted for either Lac-Phe (left) or lactate (right). Individual associations of metformin use, Lac-Phe, lactate and ΔBMI were assessed using linear regression models as described in the Methods. c–d, Graph showing the confidence intervals and statistical significance of the mediation effects of Lac-Phe and lactate (n = 1,184) (c) and GDF15 and GDF8 (n = 909) (d) on the association of metformin use and ΔBMI. Values are plotted as median with 95% confidence intervals. For c and d, the confidence intervals and statistical significance (unadjusted P values) were calculated using a nonparametric bootstrapping with the percentile method as described in the Methods; ns, not significant.
Contribution of Lac-Phe to metformin’s BMI effects in humans
Next, we used statistical mediation methods to investigate whether Lac-Phe might mediate, at least in part, the effects of metformin on body weight in participants of MESA. Specifically, we sought to examine the contribution of Lac-Phe to the relationship between baseline metformin use (exposure) and change in BMI (outcome) over the study period (mean follow-up of 9.46 years).
The population-based observational design of MESA presented a limitation to a straightforward application of mediation methods to the entire cohort. This was because the heterogeneity present in MESA participant lifestyle patterns and baseline characteristics included comorbidities, medication use and lifestyle habits expected to influence ΔBMI trajectories and overshadow the effects of metformin-associated biology. For example, 12% of participants in MESA with available Lac-Phe and lactate levels who were on metformin had ΔBMI > +4.0 kg m−2 (range, +4.1 to +14.0 kg m−2; mean, +6.8 ± 0.89 kg m−2), which probably underscore metabolic factors that are unrelated to the modest weight reduction effects of metformin. To isolate metformin-associated biology from these competing weight-gain mechanisms in MESA, we conducted a post-hoc subgroup analysis stratified by weight loss (ΔBMI −1.78 ± 0.05 kg m−2, n = 1,619) and weight gain (ΔBMI + 1.84 ± 0.04 kg m−2, n = 2,026) (Extended Data Fig. 5a). Baseline characteristics of participants in each subgroup are detailed in Supplementary Table 2.
Among MESA participants who lost weight during the study period and who had available metformin, Lac-Phe and lactate levels measured by LC–MS (n = 1,184), we observed a significant association between metformin use and ΔBMI using age-adjusted and sex-adjusted linear regression models (β = −0.52, P = 4.8 × 10⁻²; Fig. 3a). We next constructed a ‘mediated model’ that connected metformin use to ΔBMI through the effect of Lac-Phe levels by using age-adjusted and sex-adjusted linear regression models (Fig. 3b). Consistent with a mediation effect of Lac-Phe, we observed that the effect of metformin use on ΔBMI was weakened when Lac-Phe was included in the regression compared to the effect of metformin on ΔBMI in the unmediated model (β = −0.39, P = 0.18) (Fig. 3b). In addition, using a bootstrapping method, we detected a significant mediation effect of Lac-Phe in the relationship between metformin use and ΔBMI (Fig. 3c; β = −0.13; 95% CI, −0.03 to −0.26; P = 5.2 × 10⁻³).
Control analyses demonstrated that the mediation effect of Lac-Phe on metformin-associated ΔBMI was specific. For example, we did not detect a significant mediation effect of lactate on metformin-associated ΔBMI (Fig. 3b, right). When we used the same set of pairwise associations but reordered the mediation model to test whether ΔBMI partially mediates the relationship between metformin use (exposure) and Lac-Phe levels (outcome), we obtained the expected null result (Extended Data Fig. 5b–d). Among the subgroup of MESA participants who gained weight during the study period, we also did not detect a significant mediation effect of Lac-Phe or lactate on metformin-associated ΔBMI (Extended Data Fig. 5e–g). Finally, we were unable to detect a mediation effect on metformin-associated ΔBMI for the majority of other metformin-associated metabolites (129 out of 136; 95%).
Lastly, we applied a similar mediation analysis in the subgroup of MESA participants who lost weight to determine the contribution of GDF15 to the effects of metformin on body weight. A partial mediation effect of GDF15 was observed for metformin-associated ΔBMI (Fig. 3d). In addition, the GDF15 mediation effect was also specific because we detected no significant mediation effect of the related hormone GDF8 (myostatin) on metformin-associated ΔBMI. Taken together, these post-hoc subgroup analyses support a role for Lac-Phe, as well as GDF15, in mediating the effects of metformin on body weight in humans.
Effects of metformin on body weight in CNDP2-KO mice
To perform a direct functional test of the causal role of Lac-Phe in the body weight-lowering effects of metformin, we used WT and global CNDP2-KO mice. After 8 weeks of high-fat-diet feeding, body weights in WT and CNDP2-KO mice were not different (mean ± s.e.m, 38.4 ± 1.5 g for WT, 36.2 ± 1.6 g for CNDP2-KO mice, P = 0.32). Metformin treatment in WT mice (300 mg kg−1 d–1, PO) resulted in a durable suppression of food intake (mean ± s.e.m., 2.2 ± 0.1 g d−1), resulting in a 2.1 ± 0.4 g (mean ± s.e.m.) reduction in total body weight at the end of the experiment (Fig. 4a,b). By contrast, CNDP2-KO mice exhibited food intake (mean ± s.e.m., 2.9 ± 0.2 g d−1) and body weight change (mean ± s.e.m., −0.1 ± 0.5 g) that were identical to saline-treated mice (P > 0.05; Fig. 4a,b).
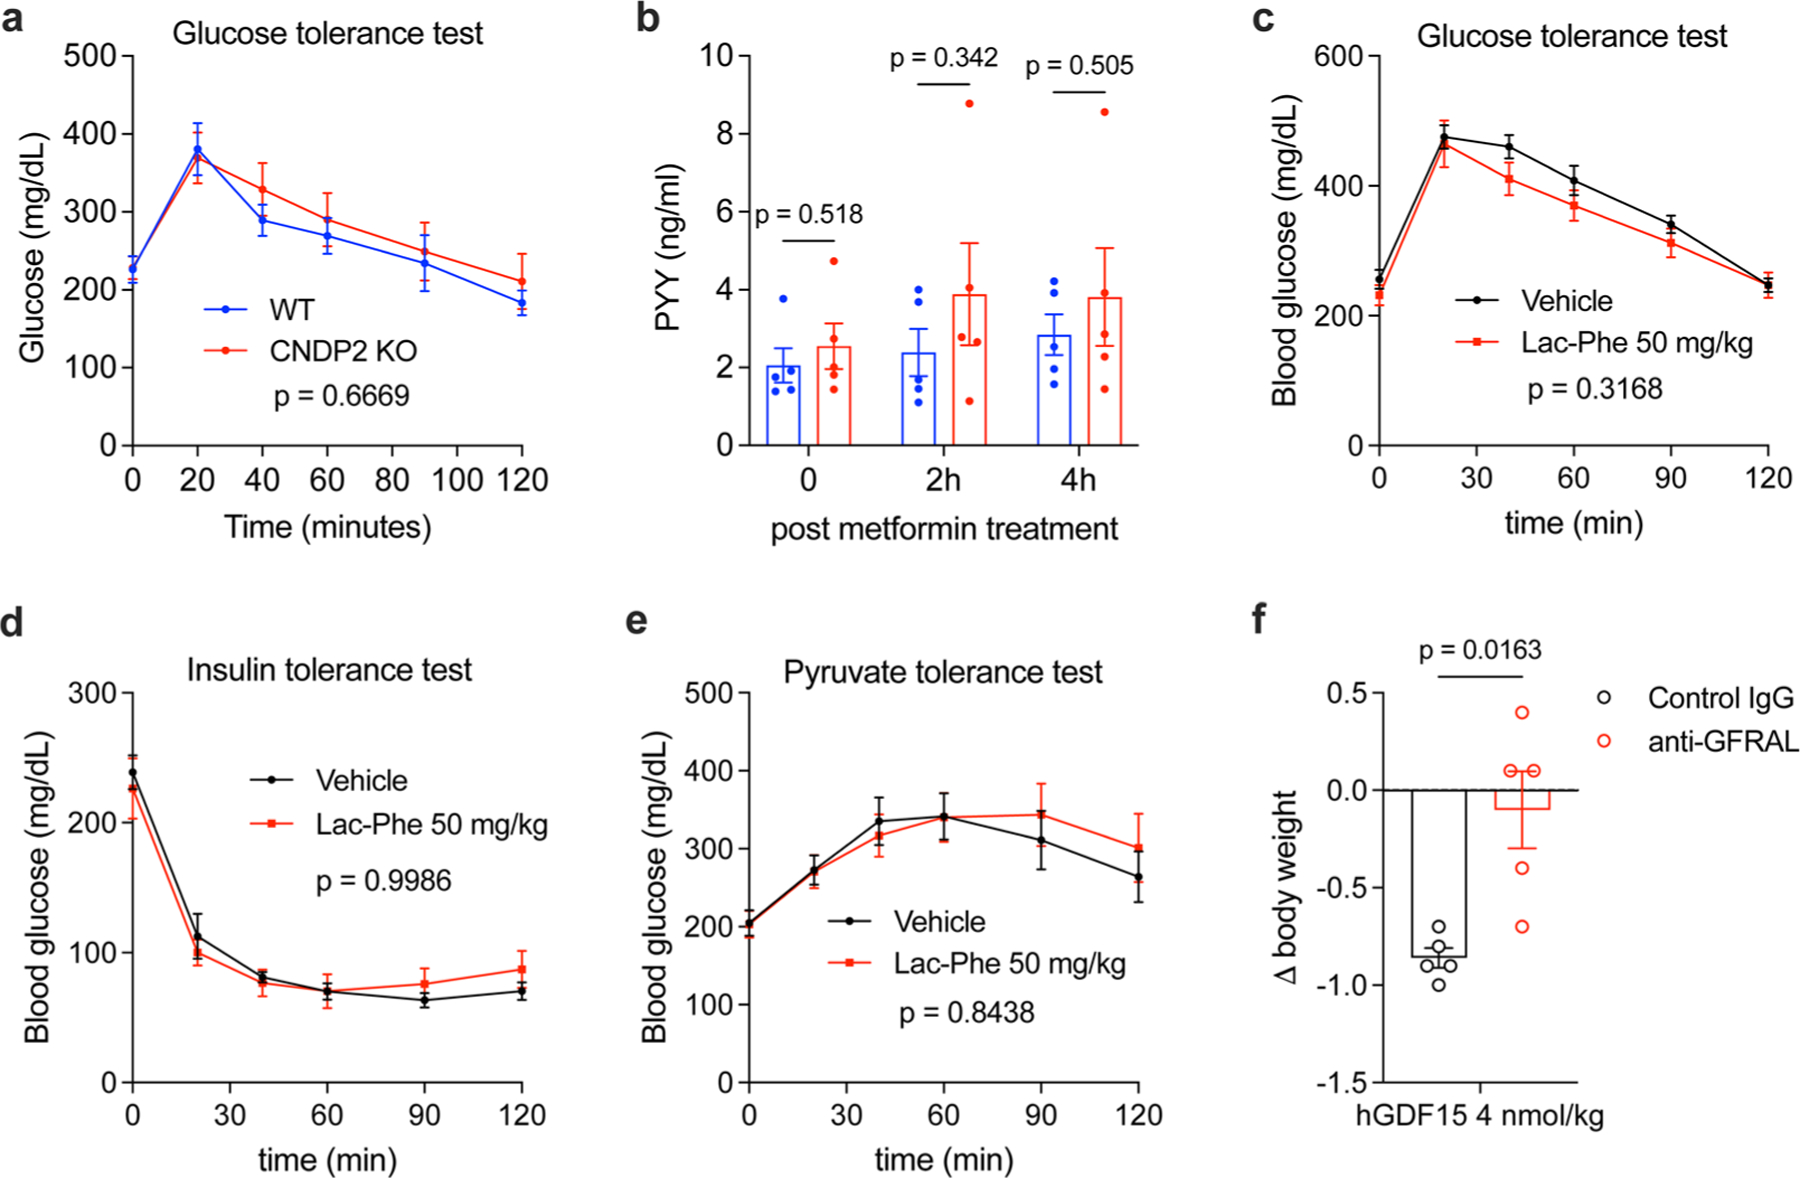
Fig. 4 |. Effects of metformin on body weight in CNDP2-KO mice.
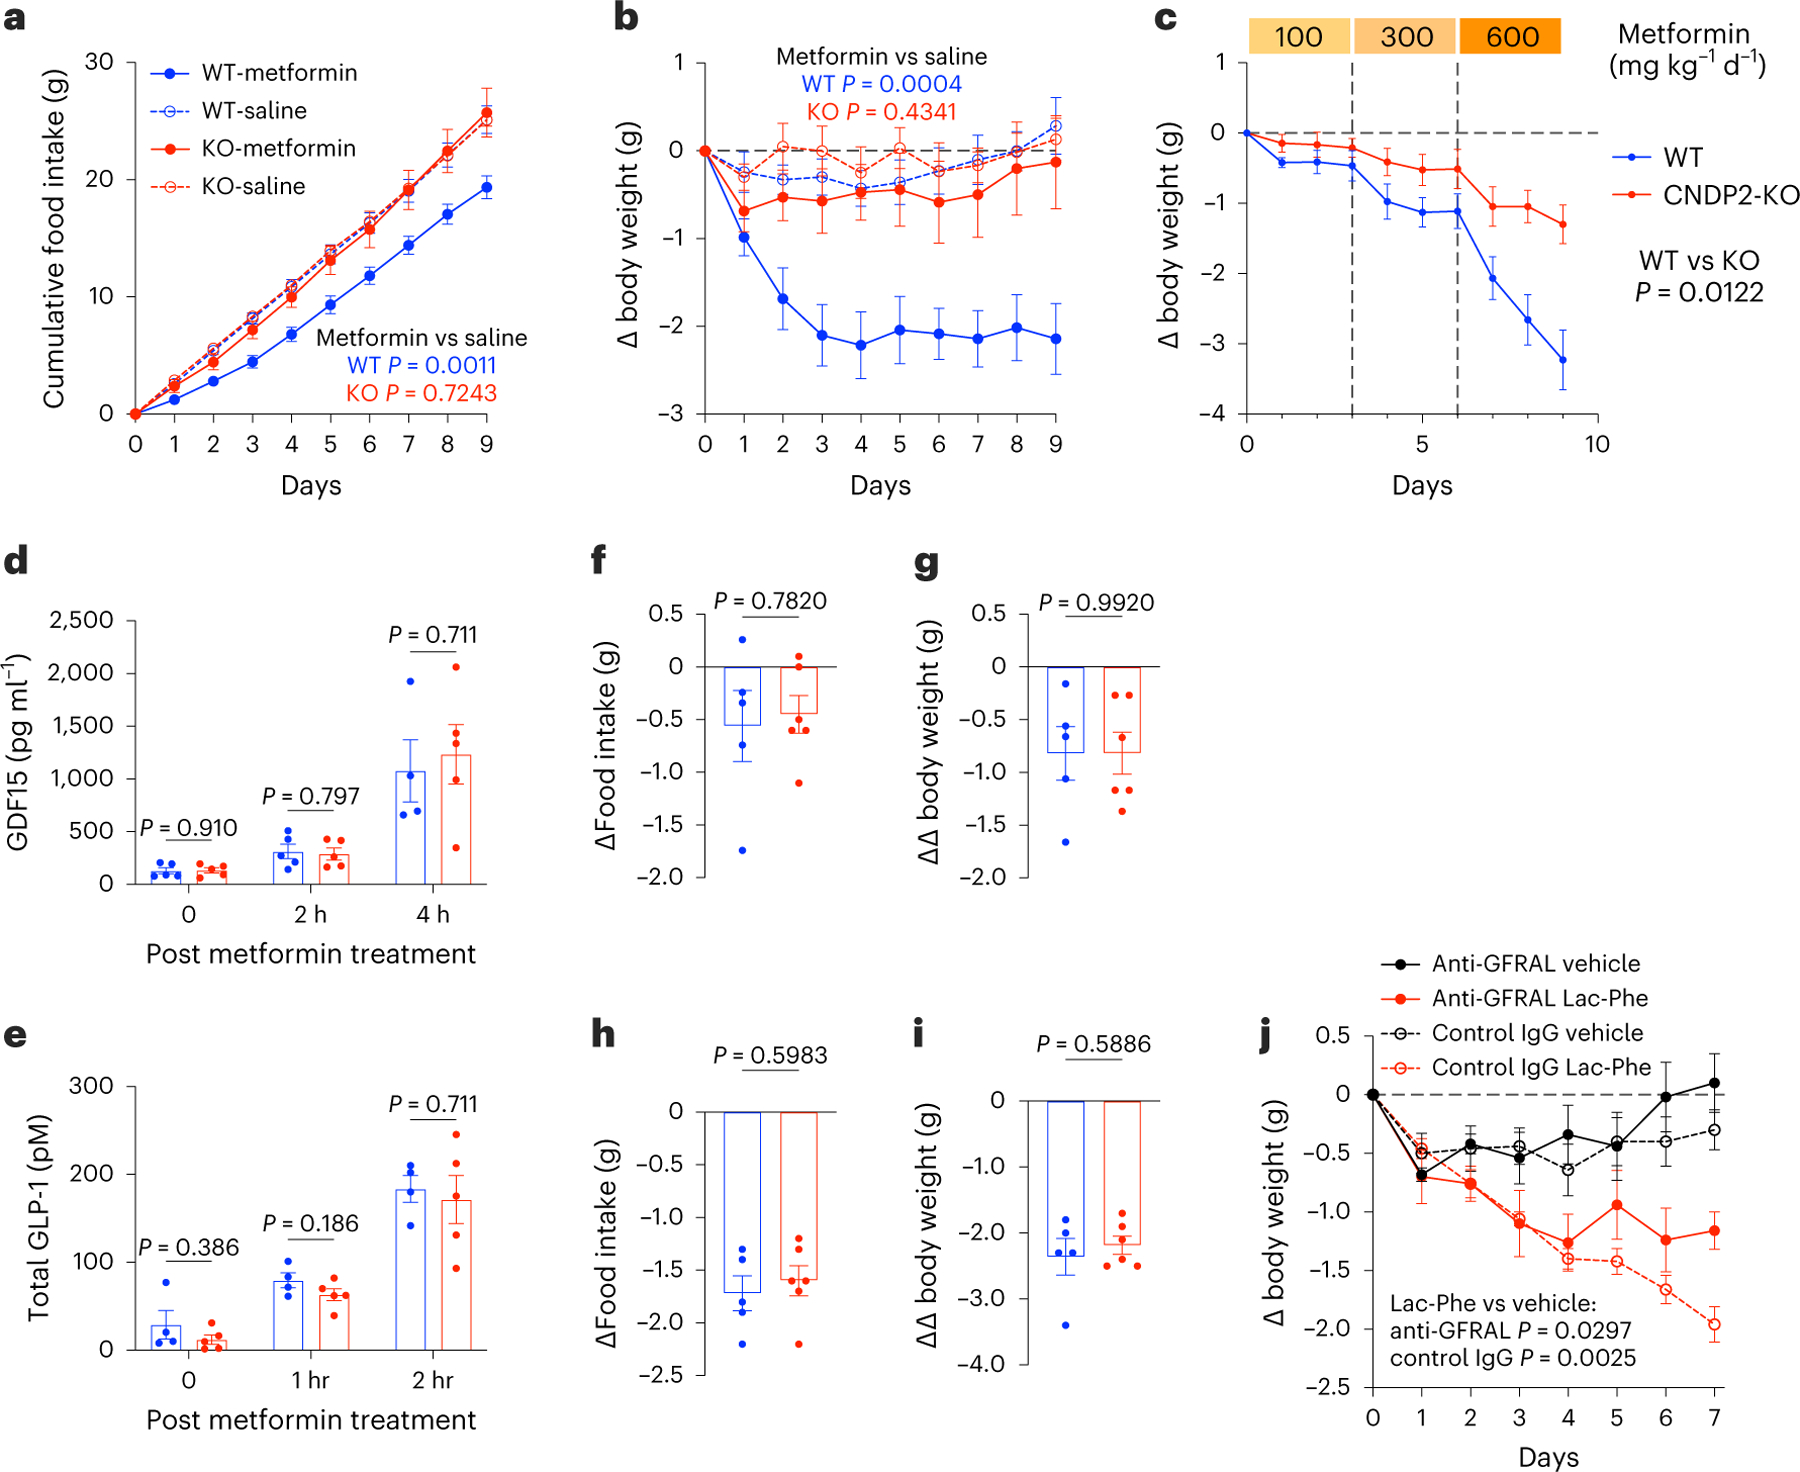
a,b, Cumulative food intake (a) and change in body weight (b) in 10–14-week-old male WT and CNDP2-KO DIO mice following chronic metformin treatment (300 mg kg–1 daily, PO); n = 6 for KO-saline, n = 7 for other groups. c, Change in body weight of 14–16-week-old male WT and CNDP2-KO DIO mice with increasing doses of metformin treatment (100 mg kg−1, PO, 3 days; 300 mg kg−1, PO, 3 days; 600 mg kg−1, PO, 3 days); n = 11 for WT, n = 9 for CNDP2-KO. d,e, Plasma GDF15 (d) or GLP-1 (e) at the indicated time point in 12–14-week-old male WT and CNDP2-KO DIO mice after a single administration of metformin (300 mg kg−1, PO). For GDF15, n = 5 except for WT, 4 h (n = 4); for GLP-1, n = 5. f–i, Change in food intake (f,h) and the delta change in body weight (g,i) in 12–16-week-old male WT and CNDP2-KO mice 24 h after a single administration of GDF15 (4 nmol kg−1, subcutaneous; f and g) or 24 h after a single administration of semaglutide (10 nmol kg−1, subcutaneous; h and i); n = 5 for WT, n = 6 for CNDP2-KO. For g and i, the delta values were calculated relative to the effect of vehicle treatment within the same mouse. j, Change in body weight of 12–14-week-old male DIO mice following the indicated treatment. The following dosages were used: Lac-Phe (50 mg kg−1 d−1, i.p.); anti-GFRAL or control IgG (10 mg kg−1 on days 0, 3 and 6); n = 5 per group. P values in a–c and j were calculated with two-way ANOVA. P values in d–i were calculated with two-sided Welch t-tests. Error bars, s.e.m.
We subjected a second cohort of high-fat diet-fed WT and CNDP2-KO mice to a metformin dose-escalation protocol. Here, metformin was administered daily at increasing doses (100 mg kg−1, PO, 3 days; 300 mg kg−1, PO, 3 days; 600 mg kg−1, PO, 3 days) and body weights were monitored. At all doses tested, CNDP2-KO mice exhibited blunted weight loss in response to metformin compared to WT controls (Fig. 4c). We conclude that CNDP2-KO mice are resistant to the effects of metformin on body weight and food intake.
To determine whether Lac-Phe and CNDP2 also contribute to the anti-diabetic effect of metformin, we performed intraperitoneal glucose tolerance tests (GTTs). WT and CNDP2-KO mice were once again placed on a high-fat diet for 8 weeks. Basal body weights between genotypes were not significantly different (mean ± s.e.m., WT, 41.1 ± 1.6 g; CNDP2-KO, 38.9 ± 1.5 g). After a 6 h fast, all mice received a single dose of metformin (300 mg kg−1, PO) simultaneously with glucose (1 g kg−1, i.p) and blood glucose was measured over a 2 h period. WT and CNDP2-KO mice showed equivalent glucose levels at all time points (Extended Data Fig. 6a). We conclude that the anti-diabetic effect of metformin is not affected in CNDP2-KO mice.
Metformin has been shown to induce the expression of multiple hormones that are involved in appetite control8–10,30–32. However, levels of GDF15, GLP-1 and PYY were not different between WT and CNDP2-KO mice after metformin administration (Fig. 4d,e and Extended Data Fig. 6b). Therefore, the blunted effects of metformin on body weight in CNDP2-KO mice are not caused by differences between genotypes in levels of these other feeding-regulating peptide hormones.
To rule out the possibility that CNDP2-KO mice are more broadly resistant to any and all anorexigenic and anti-obesity stimuli, we treated WT and CNDP2-KO mice with a single dose of recombinant GDF15 protein (4 nmol kg−1, subcutaneous injection) or a single dose of the GLP-1 receptor agonist semaglutide (10 nmol kg−1, subcutaneous injection)33. In each experiment, CNDP2-KO mice showed a comparable reduction in food intake (Fig. 4f,h) and body weight (Fig. 4g,i) as WT controls. These data demonstrate that CNDP2-KO mice are fully sensitive to the anorexigenic agents that do not stimulate glycolytic flux.
We performed additional mouse studies to understand the physiologic effects of Lac-Phe. An acute administration of Lac-Phe did not alter glucose homeostasis or insulin sensitivity as measured by a GTT or insulin tolerance test, respectively (Extended Data Fig. 6c,d). In addition, administration of Lac-Phe did not alter gluconeogenesis in a pyruvate tolerance test (Extended Data Fig. 6e).
Lastly, we sought to determine whether the effect of Lac-Phe requires a functional GFRAL receptor. We first verified that the neutralizing anti-GFRAL antibody (mIgG1 GFRAL 8A2, Eli Lilly & Co.)34, but not an IgG control, completely abolished the anorexigenic effect of recombinant GDF15 (Extended Data Fig. 6f). Lac-Phe equally reduced body weight in control IgG and anti-GFRAL antibody-treated mice (mean ± s.e.m., IgG/Lac-Phe, −1.66 ± 0.15 g; anti-GFRAL/Lac-Phe, −1.26 ± 0.16 g, P = 0.1059). A comparison of the final change in body weights at the end of the experiment nevertheless revealed a significant difference between IgG/Lac-Phe and anti-GFRAL/Lac-Phe groups (mean ± s.e.m., IgG/Lac-Phe, −1.96 ± 0.15 g; anti-GFRAL/Lac-Phe, −1.16 ± 0.15 g, P = 0.0066), which was attributable to the baseline increase in body weights observed in the anti-GFRAL-treated control mice (mean ± s.e.m., IgG/saline, −0.30 ± 0.17 g; anti-GFRAL/saline, +0.1 ± 0.25 g). We conclude that the effects of Lac-Phe on body weight are largely independent of GDF15–GFRAL signaling.
Discussion
Here, we show multiple lines of evidence demonstrating that Lac-Phe is a key downstream mediator of the effects of metformin on energy balance: (1) metformin is a strong pharmacological inducer of Lac-Phe levels in both mice and humans; (2) metformin increases Lac-Phe levels in a cell-autonomous, CNDP2-dependent manner; (3) intestinal CNDP2+ epithelial cells are a principal source of circulating Lac-Phe in vivo; (4) CNDP2-KO mice are resistant to metformin-inducible increases in Lac-Phe and also resistant to the anti-obesity effects of metformin therapy; and (5) mediation analysis supports a role for Lac-Phe as a downstream effector of metformin on body weight in humans.
Our data, along with our previous study13, shows that CNDP2-KO mice are resistant to both the anti-obesity effects of exercise as well as that of metformin. Increased glycolytic flux and lactate metabolism, therefore, appear to be hallmarks of the types of stimuli where Lac-Phe-dependent suppression of food intake is operational. Further supporting the context-dependent activation of anorexigenic Lac-Phe signaling, CNDP2-KO mice remain fully sensitive to the anorexigenic effects of recombinant GDF15 and semaglutide.
Using conditional CNDP2-KO mice, we demonstrate that the gut epithelium is the primary in vivo source of plasma Lac-Phe levels. Surprisingly, macrophages did not appear to be an important contributor to Lac-Phe levels, despite their high Cndp2 mRNA expression. This observation may be explained by the much higher number of total intestinal epithelial cells compared to macrophages. In addition, the concentrations of metformin needed to inhibit complex I are not reached systemically, but clearly are sufficiently high in the local environment of the gut.
That Lac-Phe is increased in humans on metformin therapy directly demonstrates that the level of respiratory inhibition achieved by metformin, which is within the therapeutic range of this drug, is sufficient to increase Lac-Phe levels. In addition, mediation analysis in MESA supports a role for Lac-Phe in metformin-associated weight loss. However, it is important to note that these post-hoc analyses should be considered exploratory and should be validated in future studies.
Finally, there are some limitations of this study and remaining open questions. Whether gut-specific CNDP2-KO mice are resistant to the body-weight-lowering effects of metformin is not known. In addition, whether gut CNDP2+ cells are also responsible for Lac-Phe biosynthesis in response to exercise, or potentially other stimuli, remains undetermined. Finally, the precise relationship between GDF15, Lac-Phe and metformin in energy balance currently remains unknown. The eventual identification of the molecular targets and neuronal circuits involved in the anorexigenic effects of Lac-Phe would also help to answer this question.
Concurrent with this work, a parallel manuscript35 shows that Lac-Phe is increased postprandially and also following metformin administration in humans, thereby confirming and extending the findings reported here.
Methods
Chemicals
Metformin hydrochloride (MW: 165.62 g mol−1) (cat. no. 13118), buformin hydrochloride (cat. no. 18507), phenformin (cat. no. 14997) and semaglutide acetate (cat. no. 29969) were purchased from Cayman Chemical. Proguanil hydrochloride (cat. no. PHR1713), d-Glucose-13C6 (cat. no. 389374), sodium L-lactate-13C3 (cat. no. 485926) 2,4-dinitrophenol (cat. no. D198501), rotenone (cat. no. R8875), 2-thenoyltrifluoroacetone (cat. no. T27006) and sodium azide (cat. no. S2002) were purchased from Sigma-Aldrich. Oligomycin (cat. no. AAJ61898MA) was purchased from Fisher Scientific. Recombinant GDF15 (cat. no. 957-GD) was purchased from R&D systems. The GFRAL neutralizing antibody and control IgG34 were obtained from Eli Lilly, a gift generously provided by P. J. Emmerson.
Cell culture
Cell lines used in this study were obtained from the American Type Culture Collection (ATCC) and grown at 37 °C with 5% CO2. BV-2 cells were a gift from T. Wyss-Coray. Caco-2, BV-2, C2C12, 3T3-L1, SW48, HEK293T and AML12 cells were grown in DMEM (Corning, cat. no. 10-017-CV) with 10% FBS (Corning, cat. no. 35-010-CV) and 1% penicillin–streptomycin (Pen–Strep, Gibco, cat. no. 15140). AML12 cells were also supplemented with Insulin-Transferrin-Selenium (ITS-G, Gibco, cat. no. 41400). Neuro2A and HepG2 cells were grown in EMEM (Corning, cat. no. 10-009-CV) with 10% FBS and 1% Pen–Strep.
Primary peritoneal macrophages were collected as previously described36, with slight modifications. In brief, peritoneal macrophages were collected with ice-cold PBS 3–5 days post-intraperitoneal (i.p.) injection of 1 ml of 3% Brewer thioglycolate medium. The cells were later plated in DMEM/F-12 (Gibco, cat. no. 11320) medium supplemented with 10% FBS, 1% Pen–Strep and 10 mM L-glutamine (ATCC, cat. no. 30-2214). Primary peritoneal macrophages were used without any induction and therefore we presume are largely in the M0 state. Primary hepatocytes were isolated following perfusion, digestion and 90% Percoll gradient centrifugation as previously described37 and were plated in Williams E media (Quality Biological, cat. no. 112-033-101) supplemented with 10% FBS, 1% Pen–Strep, 2 mM sodium pyruvate, 1 μM dexamethasone and 0.1 μM insulin. The media were switched to maintenance media (Williams E media supplemented with 0.2% BSA, 1% Pen–Strep, 2 mM sodium pyruvate, 0.1 μM dexamethasone and 1 nM insulin) 4 h after plating. Primary hepatocytes were used within 48 h of isolation. Primary cells were isolated from both sexes and no difference was observed.
Generation of CNDP2-KO cell lines
CNDP2-KO Caco-2 and BV-2 cells were generated using the pLentiCRISPRv2 system38. For the mouse cell lines, the single-guide RNA (sgRNA) used was 5′-CAGTGAAATGAGATCCGTCA-3′. For human cell lines, the sgRNA used was 5′-ACAGAAACTCGCAAAATGGG-3′. As per previously described protocols38, oligonucleotides for the sgRNA and reverse complement sequences were synthesized and cloned into the plentiCRISPRv2 vector. For the mouse cell lines, the following oligonucleotides were used: Fwd, 5′-CACCGCAGTGAAATGAGATCCGTCA-3′; Rev, 5′-AAACTGACGGATCTCATTTCACTGC-3′. For the human cell lines, the following oligonucleotides were used: Fwd, 5′-CAC-CGACAGAAACTCGCAAAATGGG-3′; Rev, 5′-AAACCCCATTTTGCG-AGTTTCTGTC-3′. Lentivirus particles were generated in the HEK293T cell line using Polyfect for the co-transfection of the cloned plentiCRISPRv2 plasmid with the viral packing psPAX2 plasmid and the viral envelope pMD2.G plasmid. A parental plentiCRISPRv2 plasmid was used as a control. Lentiviral supernatants were collected after 24 h and filtered through a 0.45 μM filter. The supernatant was then mixed in a 1:1 ratio with polybrene to a final concentration of 8 μg ml–1 polybrene. This mixture was added to cells at 40–50% confluence in six-well plates. Transduced cells were transferred to a 10 cm plate followed by selection by puromycin (Caco-2, 10 μg ml–1; BV-2, 5 μg ml–1) for 1 week. Knockout of CNDP2 was verified by western blot with rabbit anti-CNDP2 (Proteintech, cat. no. 14925-1-AP; 1:1000), rabbit anti-beta tubulin (Origene, cat. no. TA301569; 1:1000) and goat anti-rabbit IgG (LI-COR Biosciences, cat. no. 926-32211; 1:1000).
Lac-Phe in vitro production
For cell lines, cells were plated in 12-well plates at 70–80% confluence. The next day, cells were washed two times with PBS and incubated in 0.5 ml of medium supplemented with various concentrations of metformin as indicated. After overnight incubation, 400 μl of the medium was transferred to a new Eppendorf tube and 20 μl 1 M hydrochloric acid was added to acidify the medium and to protonate Lac-Phe. Then, 1:1 v:v ethyl acetate was added to each sample and vortexed for 30 s to extract Lac-Phe into the organic layer. A total of 300 μl from the top layer was transferred to a new Eppendorf tube and dried down under a stream of nitrogen. The residue was re-suspended in 100 μl of a 2:1:1 mixture of acetonitrile:methanol:water. The mixture was centrifuged at 4 °C for 10 min at 21,130×g and the supernatant was transferred to an LC–MS vial.
Cellular respiration measurements
Cellular oxygen consumption rates were determined using an Agilent XF96 Analyzer. The assay was performed following the Agilent Seahorse XF Cell Mito Stress Test Kit manual, with slight modifications. In brief, cells were plated at 100,000 per well in the XF96 cell culture plate and incubated with metformin at various concentrations in growth media overnight. The next morning, the cells were washed with PBS and incubated with Seahorse assay buffer (8.3 g l−1 DMEM (Sigma, cat. no. D5030), 1.8 g l−1 NaCl, 1 mM pyruvate, 20 mM glucose, 1% Pen–Strep, pH 7.4). Final concentrations of compounds were used as follows: oligomycin, 10 μM; DNP, 100 μM; rotenone, 3 μM.
Lactate and Lac-Phe tracing using Glucose-13C6
13C glucose or 12C glucose of the same molar concentration was added to glucose-free DMEM (Gibco, cat. no. A1443001) supplemented with 10% FBS, 1% Pen–Strep and 10 mM L-glutamine. Cells plated in 12-well plates were washed with PBS twice and cultured in 13C or 12C glucose media overnight. Lactate and Lac-Phe with various numbers of 13C isotopes were detected with the following m/z values: 0, 89.0244, 236.0928; 1: 90.0278, 237.0962; 2: 91.0311, 238.0995; 3: 92.0345, 239.1029; 4: 93.0378, 240.1062.
Lac-Phe measurement adding 13C3-lactate
Cells were plated in 12-well plates and incubated with 10 mM 13C-labeled sodium lactate, with or without 5 mM metformin overnight. 13C3-lacate was provided as a 45–55% water solution and was used as approximately 4 M stock. Lac-Phe with different numbers of isotopes was detected with LC–MS as above.
General animal information
All animal experiments were performed according to procedures approved by the Stanford University Administrative Panel on Laboratory Animal Care. All mice used were maintained in 12 h light–dark cycles at 22 °C with 50% relative humidity and fed a standard rodent chow diet (18% protein and 6% fat; Envigo Teklad 2018). Where indicated, a high-fat diet (60% kcal from fat; Research Diets, cat. no. D12492) was used. C57BL/6J (strain no. 000664) and C57BL/6J DIO (strain no. 380050) mice were purchased from the Jackson Laboratory. CNDP2-KO mice were as previously described39 and originally obtained from the Mutant Mouse Regional Resource Center, a National Center for Research Resources–National Institutes of Health (NCRR–NIH) funded repository. CNDP2-KO mice used in this study were generated by heterozygous breeding crosses. Progeny pups were genotyped with the following genotyping primers: WT allele (Fwd, 5′-CAGATGGCTCGGAGATACCAC-3′; Rev, 5′-TTCCCGCTCCACCAAGGTGAAG-3′); KO allele (Fwd, 5′-GCTCT-GTAAGGGAAAGAGATGACCC-3′; Rev, 5′-AATAGGACATACCCA-GTTCTGTGAGG-3′). Conditional Cndp2 floxed mice were generated by Applied StemCell (Milpitas, CA). Exon 3 of Cndp2 was floxed by two loxP sites. The following genotyping primers were used: Fwd, 5′-GAGCGGACTTCTGGAAAGTG-3′; Rev, 5′-GAGAAACT-TCCAGAACCC-3′. Vil1-cre mice ( Jackson Laboratory, strain no. 021504) and LysM-cre mice ( Jackson Laboratory, strain no. 004781) were genotyped accordingly using the primers suggested by the Jackson Laboratory: Vil1-cre (Fwd, 5′-GCCTTCTCCTCTAGGCTCGT-3′; Rev, 5′-AGGCAAATTTTGGTGTACGG-3′), LysM-cre (Fwd, 5′-AAGGAG-GGACTTGGAGGATG-3′; Rev, 5′-ACCGGTAATGCAGGCAAAT-3′).
Mouse plasma sample preparation for LC–MS analysis
Blood was collected from mice through submandibular bleeding into lithium heparin tubes (BD, cat. no. 365985) and immediately kept on ice. The blood was then centrifuged at 4 °C for 5 min at 2,348×g. Plasma was transferred into new Eppendorf tubes and frozen at −80 °C if not used immediately. Metabolites for LC–MS analysis were extracted by adding 150 μl of 2:1 mixture of acetonitrile:methanol to 50 μl plasma. The mixture was then mixed by vortex and centrifugated at 4 °C for 10 min at 21,130×g. The supernatant was transferred to an LC–MS vial.
Study populations
The Stanford cohort of participants in Studies of Insulin Resistance and Diabetes has been described in detail previously15. The original study was conducted from 1998 to 2004. The study was approved by the Stanford Institutional Review Board, and each individual provided written informed consent to participate in the study. Of the 31 participants in the original study, 21 had plasma samples available and were included in the current study. All participants had type 2 diabetes with fasting plasma glucose concentrations greater than 170 mg dl−1 and were being treated with medical nutrition therapy alone (n = 10) or with sulfonylurea monotherapy (glipizide or glyburide 10–20 mg daily; n = 11). The dose of metformin started at 500 mg twice daily, with slow uptitration to a final dose of 2 g daily. All patients received metformin treatment for 12 weeks. Baseline and post-treatment samples were collected after an overnight fast. The metformin treatment group consisted of 8 females and 13 males. Of those individuals, 13 participants were White, 4 were East Asian, 2 were Black and 2 were South Asian. At baseline, the mean ± s.d. age of participants was 58 ± 10 years; BMI was 29.4 ± 4.6 kg m−2; weight was 87.7 ± 25.1 kg; and fasting glucose was 234 ± 39 mg dl−1. After 12 weeks of treatment with metformin, the mean fasting glucose level had decreased to 182 ± 48 mg dl−1 (P < 0.001) but weight remained unchanged.
MESA is a US community-based cohort study that recruited 6,814 individuals who self-identified as White, African American, Hispanic or Chinese American, as previously described16. Included in the present study are 3,656 individuals across all four racial and ethnic groups with metabolomic profiling at the baseline examination (2000–2002). Baseline characteristics are described in Supplementary Table 1. In total, 3,645 individuals had available follow-up BMI values from exam five (2010–2012) with a mean follow-up of 9.46 years. The MESA human protocol was approved by The Lundquist Institute (formerly Los Angeles BioMedical Research Institute) at Harbor-University of California, Los Angeles Medical Center, University of Washington, Wake Forest School of Medicine, Northwestern University, University of Minnesota, Columbia University, Johns Hopkins University and University of California, Los Angeles Institutional Review Boards, and all participants provided written informed consent.
Metabolite measurements by LC–MS
In murine studies and the Stanford cohort human studies, plasma samples were collected and kept at −80 °C until preparation for LC–MS. A total of 150 μl of a 2:1 mixture of acetonitrile:methanol was added to 50 μl plasma. The mixture was then mixed by vortex and centrifugated at 4 °C for 10 min at 21,130×g. The supernatant was transferred to an LC–MS vial. Untargeted metabolomics measurements were performed using an Agilent 6520 or 6545 Quadrupole time-of-flight LC–MS instrument. For lactate and Lac-Phe, MS analysis was performed using electrospray ionization (ESI) in negative mode. The dual ESI source parameters were set as follows: the gas temperature was set at 250 °C with a drying gas flow of 12 l min−1 and the nebulizer pressure at 20 psi; the capillary voltage was set to 3,500 V; and the fragmentor voltage set to 100 V. Separation of metabolites was conducted using a Luna 5 μm NH2 100 Å LC column (Phenomenex, 00B-4378-E0) with normal phase chromatography. Mobile phases were as follows: buffer A, 95:5 water:acetonitrile with 0.2% ammonium hydroxide and 10 mM ammonium acetate; buffer B, acetonitrile. The LC gradient started at 100% buffer B with a flow rate of 0.2 ml min−1 from 0 to 2 min. The gradient was then linearly increased to 50% buffer A and 50% buffer B at a flow rate of 0.7 ml min−1 from 2 to 20 min. From 20 to 25 min, the gradient was maintained at 50% buffer A and 50% buffer B at a flow rate of 0.7 ml min−1.
For metformin, MS analysis was performed using ESI in positive mode. The dual ESI source parameters were set as follows: the gas temperature was set at 325 °C with a drying gas flow of 5 l min−1 and the nebulizer pressure at 30 psi; the capillary voltage was set to 3,500 V; and the fragmentor voltage set to 175 V. Separation of metabolites was conducted using a Luna 5 μm C5 100 Å LC column (Phenomenex, 00B-4043-E0) with reverse phase chromatography. Mobile phases were as follows: buffer A, water with 0.1% formic acid; buffer B, acetonitrile with 0.1% formic acid. The LC gradient started at 95% buffer A and 5% buffer B with a flow rate of 0.2 ml min−1 from 0 to 2 min. The gradient was then linearly decreased to 5% buffer A and 95% buffer B at a flow rate of 0.7 ml min−1 from 2 to 7 min. From 7 to 12 min, the gradient was maintained at 5% buffer A and 95% buffer B at a flow rate of 0.7 ml min−1.
Quantification of the metabolite concentrations was performed by generating a standard curve with known concentrations of each metabolite. Metabolite standards were analyzed alongside the samples using the same method. A standard curve generated from the metabolite concentrations and extracted ion intensities was used to calculate the concentrations of each metabolite.
In MESA, metabolomics profiling was performed using LC–MS on fasting baseline plasma samples, as previously described40,41. In brief, the concentration of metformin and other polar metabolites was measured using a Nexera X2 U-HPLC (Shimadzu) equipped with a 150 × 2 mm, 3 μm Atlantis hydrophilic interaction LC column (Waters) coupled to a Q Exactive hybrid quadrupole Orbitrap MS (Thermo Fisher Scientific). Metabolites were extracted from 10 μl plasma by adding 90 μl of acetonitrile:methanol:formic acid (74.9:24.9:0.2, v/v/v) solution spiked with valine-d8 (Sigma) and phenylalanine-d8 (Cambridge Isotope Laboratories). The metabolites were eluted at 0.25 ml min−1 with 5% buffer A (10 mM ammonium-formate, 0.1% formic acid in water) for 0.5 min followed by a linear gradient to 40% buffer B (0.1% formic acid in acetonitrile) over 10 min. MS analyses were carried out using ESI in the positive mode, and full scan spectra were acquired over 70–800 m/z. Raw data were processed using Trace Finder (v.3.3; Thermo Fisher Scientific) and Progenesis QI (v.3.0; Waters). Lac-Phe, lactate and other intermediary metabolites were measured using a 1290 Infinity LC system (Agilent Technologies) equipped with a 100 × 2.1 mm XBridge amide column (Waters) coupled to a 6490 Triple Quad MS (Agilent Technologies) in negative ionization mode by multiple reaction monitoring scanning. Data were quantified using MassHunter Quantitative Analysis software (v.10.1; Agilent).
To ensure quality control, a mixture of ~150 reference standards was analyzed before, during periodic intervals throughout and after each MS run to ensure reproducibility of LC retention times, LC peak shapes and MS sensitivity. Isotope-labeled internal standards were monitored in each sample throughout the duration of each run. Pooled plasma samples were monitored after every ten participant samples to standardize for MS drift over time using ‘nearest neighbor’ normalization and between batches. Separate pooled plasma samples were monitored after every 20 participant samples to determine the coefficient of variation for each metabolite. Metabolite identities were confirmed using authentic reference standards. All metabolite peaks were manually reviewed for peak quality in a blinded manner. None of the included metabolites had poor peak quality or coefficients of variation of ≥30% averaged across batches
GDF15 and GDF8 measurement in MESA
In MESA, proteomic profiling was performed using the Olink Explore platform, as previously described42. Relative quantification of GDF15 (OID20251) and GDF8 (OID20115) using the Olink Explore 3072 platform were available in 2,131 participants from the baseline exam that were randomly selected across all four racial–ethnic groups and that had available BMI values from the baseline exam and exam five.
Animal experiments
Effect of 300 mg kg−1 metformin treatment on food intake and body weight in WT and CNDP2-KO mice.
Male WT and CNDP2-KO mice were generated by heterozygous breeding crosses. At 4–6 weeks of age, mice were switched from a chow diet to a high-fat diet. At 10–14 weeks of age, mice were single-housed and mock-gavaged with saline for 3–5 days until their body weights stabilized to reduce stress-induced loss of food intake and body weight. Male WT and CNDP2-KO were body-weight matched and received either saline or 300 mg kg−1 metformin hydrochloride. Body weight and food intake were measured daily for 9 days.
Effect of 4 nmol kg−1 GDF15 treatment on food intake and body weight in WT and CNDP2-KO mice.
Male 12–16-week-old DIO WT and CNDP2-KO mice were single-housed and mock-injected subcutaneously with vehicle (8:1:1 saline:DMSO:kolliphor) for 2 days. On the experiment day, mice received either vehicle or 4 nmol kg−1 GDF15 subcutaneously. Food intake and body weight were measured before and 24 h after the treatment.
Effect of 10 nmol kg−1 semaglutide treatment on food intake and body weight in WT and CNDP2-KO mice.
Male 12–16-week-old DIO WT and CNDP2-KO mice used in the GDF15 study were allowed to recover for 3 days. The mice were then mock-injected subcutaneously once. On the experiment day, mice received either vehicle or 10 nmol kg−1 semaglutide subcutaneously. Food intake and body weight were measured before and 24 h after the treatment.
Hormone measurements after metformin treatment.
Male 12–14-week-old WT and CNDP2-KO mice were treated with one single dose of 300 mg kg−1 metformin hydrochloride, and blood was taken at the time points indicated in the corresponding figures. Levels of hormones were measured with commercial ELISA kits (PYY, Crystal Chem 81501; GLP-1, Sigma-Aldrich EZGLP1T; GDF15, R&D systems DY6385) following the manufacturers’ instructions. GLP-1 was measured after 4 h of fasting.
GTT in WT and CNDP2-KO mice.
Male 12–14-week-old WT and CNDP2-KO mice were single-housed and fasted for 6 h. The mice were gavaged with metformin 30 min before the glucose injection (1 g kg−1, i.p.). Blood glucose was measured at 0, 20, 40, 60, 90 and 120 min post glucose injection.
Insulin tolerance test and pyruvate tolerance test.
Male 14–15-week-old C57BL/6J DIO male mice were single-housed and fasted for 6 h. The mice were then injected i.p. with 1 U kg−1 insulin or 2.5 g kg−1 sodium pyruvate; 30 min prior to these injections, the mice were injected with Lac-Phe (50 mg kg−1, i.p.) to assess the effects of acute administration. Blood glucose was measured for up to 2 h.
Effect of 4 nmol kg−1 GDF15 or 50 mg kg−1 Lac-Phe on body weight in mice injected with GFRAL neutralizing antibody.
Male 12–14-week-old C57BL/6J DIO mice were injected with 10 mg kg−1 GFRAL neutralizing antibody or control IgG34 once every 3 days for chronic treatments. Then, 4 nmol kg−1 GDF15 or 50 mg kg−1 Lac-Phe was injected and the effect on body weight was measured.
Statistical analyses
In MESA, metabolite levels were log transformed and standardized to have a mean of zero and a standard deviation of one within each batch. Metformin use was assessed as a categorical variable and defined by self-reported use of an oral hypoglycemic agent by study participants and validated by the detection of plasma metformin levels by LC–MS during the baseline exam (AU > 50). Mediation analyses were performed using a previously described framework43–45. In brief, a sequence of linear regressions was performed to test whether Lac-Phe or lactate levels were predicted to partially mediate the effect of metformin use (exposure) on BMI (outcome) in each MESA subgroup (participants who lost weight and participants who gained weight during the study period). Participants who had available metformin, Lac-Phe and lactate levels measured by LC–MS during exam one, as well as BMI values at exam one and exam five were included in the analyses. ΔBMI was quantified as the difference between BMI at exam one and exam five. In step one of the analysis, the association between metformin use and BMI was assessed using age-adjusted and sex-adjusted linear regression models. This association formed the basis for the total effect between metformin use and BMI in an ‘unmediated model’. In step 2, Lac-Phe or lactate levels were related to metformin use using an age-adjusted and sex-adjusted linear regression model. In step 3, Lac-Phe or lactate levels were related to the difference in BMI between exams one and five using an age-adjusted and sex-adjusted linear regression model that was further adjusted for baseline metformin use. This additional adjustment for metformin use was included to identify the association between Lac-Phe (or lactate) and ΔBMI that was independent of the shared correlation between each variable and the exposure of metformin use. To perform a mediation analysis, each association between exposure and outcome, exposure and mediator, and mediator and outcome was required to be significant (P ≤ 0.05). Mediation analyses were conducted by regressing ΔBMI (outcome) on metformin use (exposure) with adjustment for the mediator (for example, Lac-Phe or lactate levels). The difference between the effect of metformin use on ΔBMI in the unmediated and mediated models represented the mediation effect. The 95% confidence interval and statistical significance (unadjusted P values) of the mediation effect were calculated using nonparametric bootstrapping with the percentile method as previously described46,47, using the R package mediate48.
All other statistical analyses were performed with GraphPad Prism (v.10.0.3).
Extended Data
Extended Data Fig. 1 |. Additional characterization of metabolites after metformin treatment.
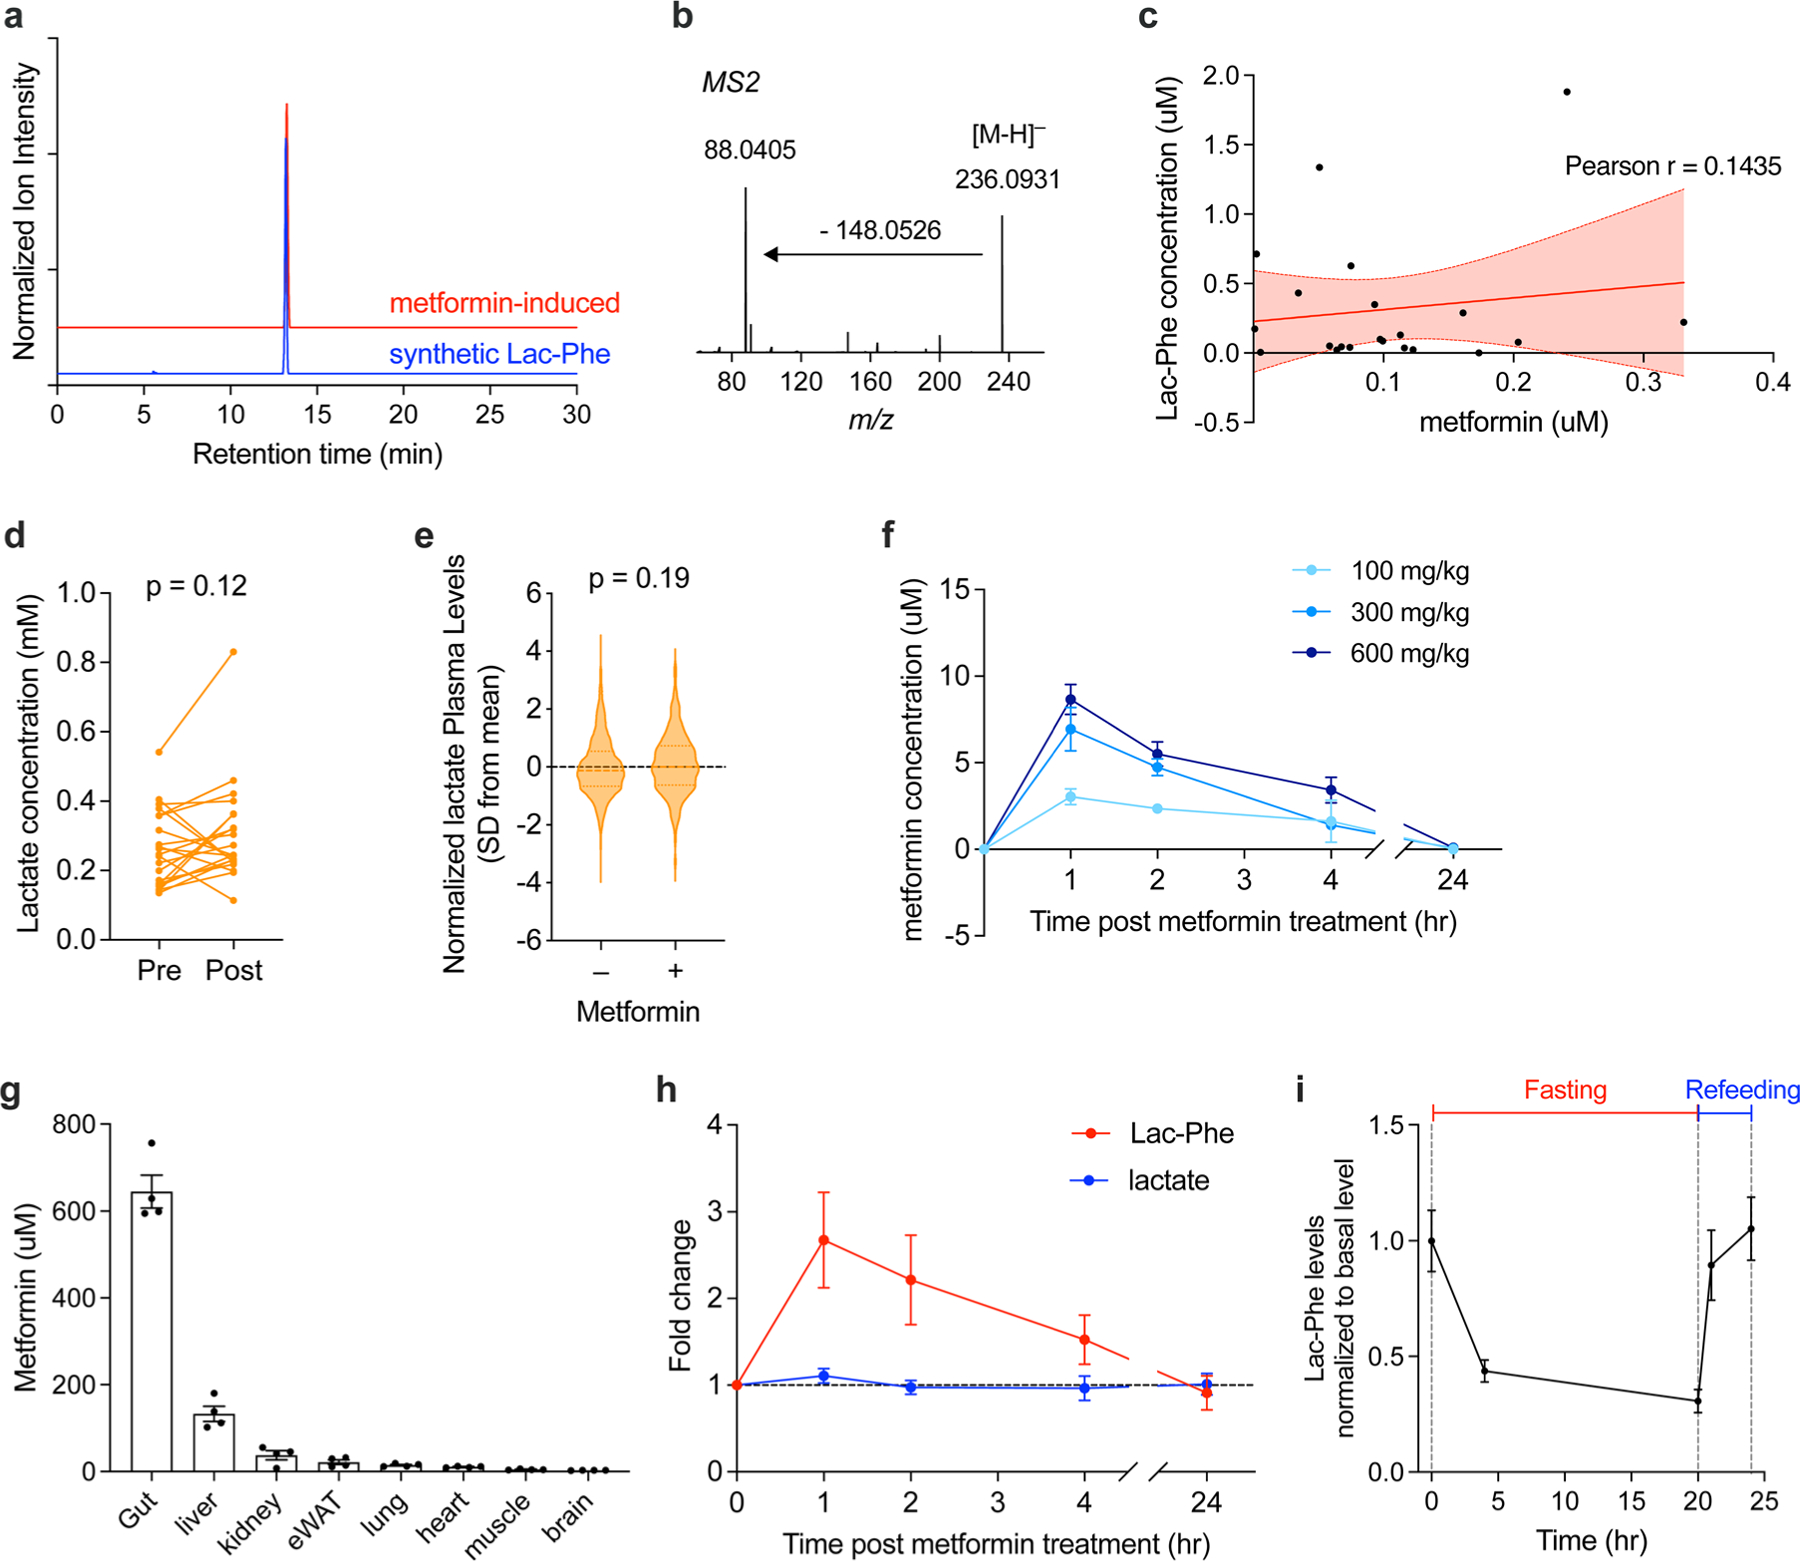
(a) Retention time of metformin-induced Lac-Phe (red trace) and an authentic Lac-Phe standard (blue trace) with a 30-min LC method. (b) MS2 profile of metformin-induced Lac-Phe with 10 eV collision energy. Note a characteristic transition from 236.1 to 88.0 characteristic of the lactamide daughter ion of Lac-Phe. (c) Correlation of plasma metformin and Lac-Phe levels in the Stanford Cohort (N = 21). Pearson r = 0.1435, R2 = 0.0206, p = 0.5350 (two-sided). Error bands represent 95% confidence intervals. (d) Plasma levels of lactate pre- and post-3 months of metformin treatment in the Stanford cohort (n = 21). (e) Plasma levels of lactate in MESA participants on metformin (n = 179) compared to participants not on metformin (n = 3477). Dashed lines indicate medians and quartiles. (f) Metformin levels in the plasma of 12–14 week-old C57BL/6J DIO male mice treated with metformin at indicated doses, PO (n = 5, except for 100 mg/kg and 300 mg/kg at 24 h where n = 4). 100 mg/kg, 300 mg/kg, and 600 mg/kg corresponds to 0.60 × 10⁶nmol/kg, 1.81 × 10⁶nmol/kg, 3.62 × 10⁶nmol/kg, respectively. (g) Metformin levels in tissues of 14–15 week-old C57BL/6J DIO male mice treated with metformin (300 mg/kg, PO) (n = 4). (h) Fold changes of lactate and Lac-Phe in plasma of 12–14 week-old C57BL/6J DIO male mice treated with metformin (300 mg/kg, PO) (n = 5, except for 100 mg/kg and 300 mg/kg at 24 h where n = 4). (i) Fold changes of Lac-Phe in plasma of 14–15 week-old C57BL/6J DIO male mice 4 h and 24 h after fasting and 1 h and 4h after refeeding. (n = 5, except for the 4h fasting time point where n = 4). P values in (a-b), and (f) were calculated with two-sided paired t tests. P value in (c) was generated using linear regression models adjusting for age, sex, fasting plasma glucose, total cholesterol, and hypertension status. All error bars in (f-i) are SEM.
Extended Data Fig. 2 |. Metformin inhibits complex I to drive Lac-Phe production in primary macrophages.
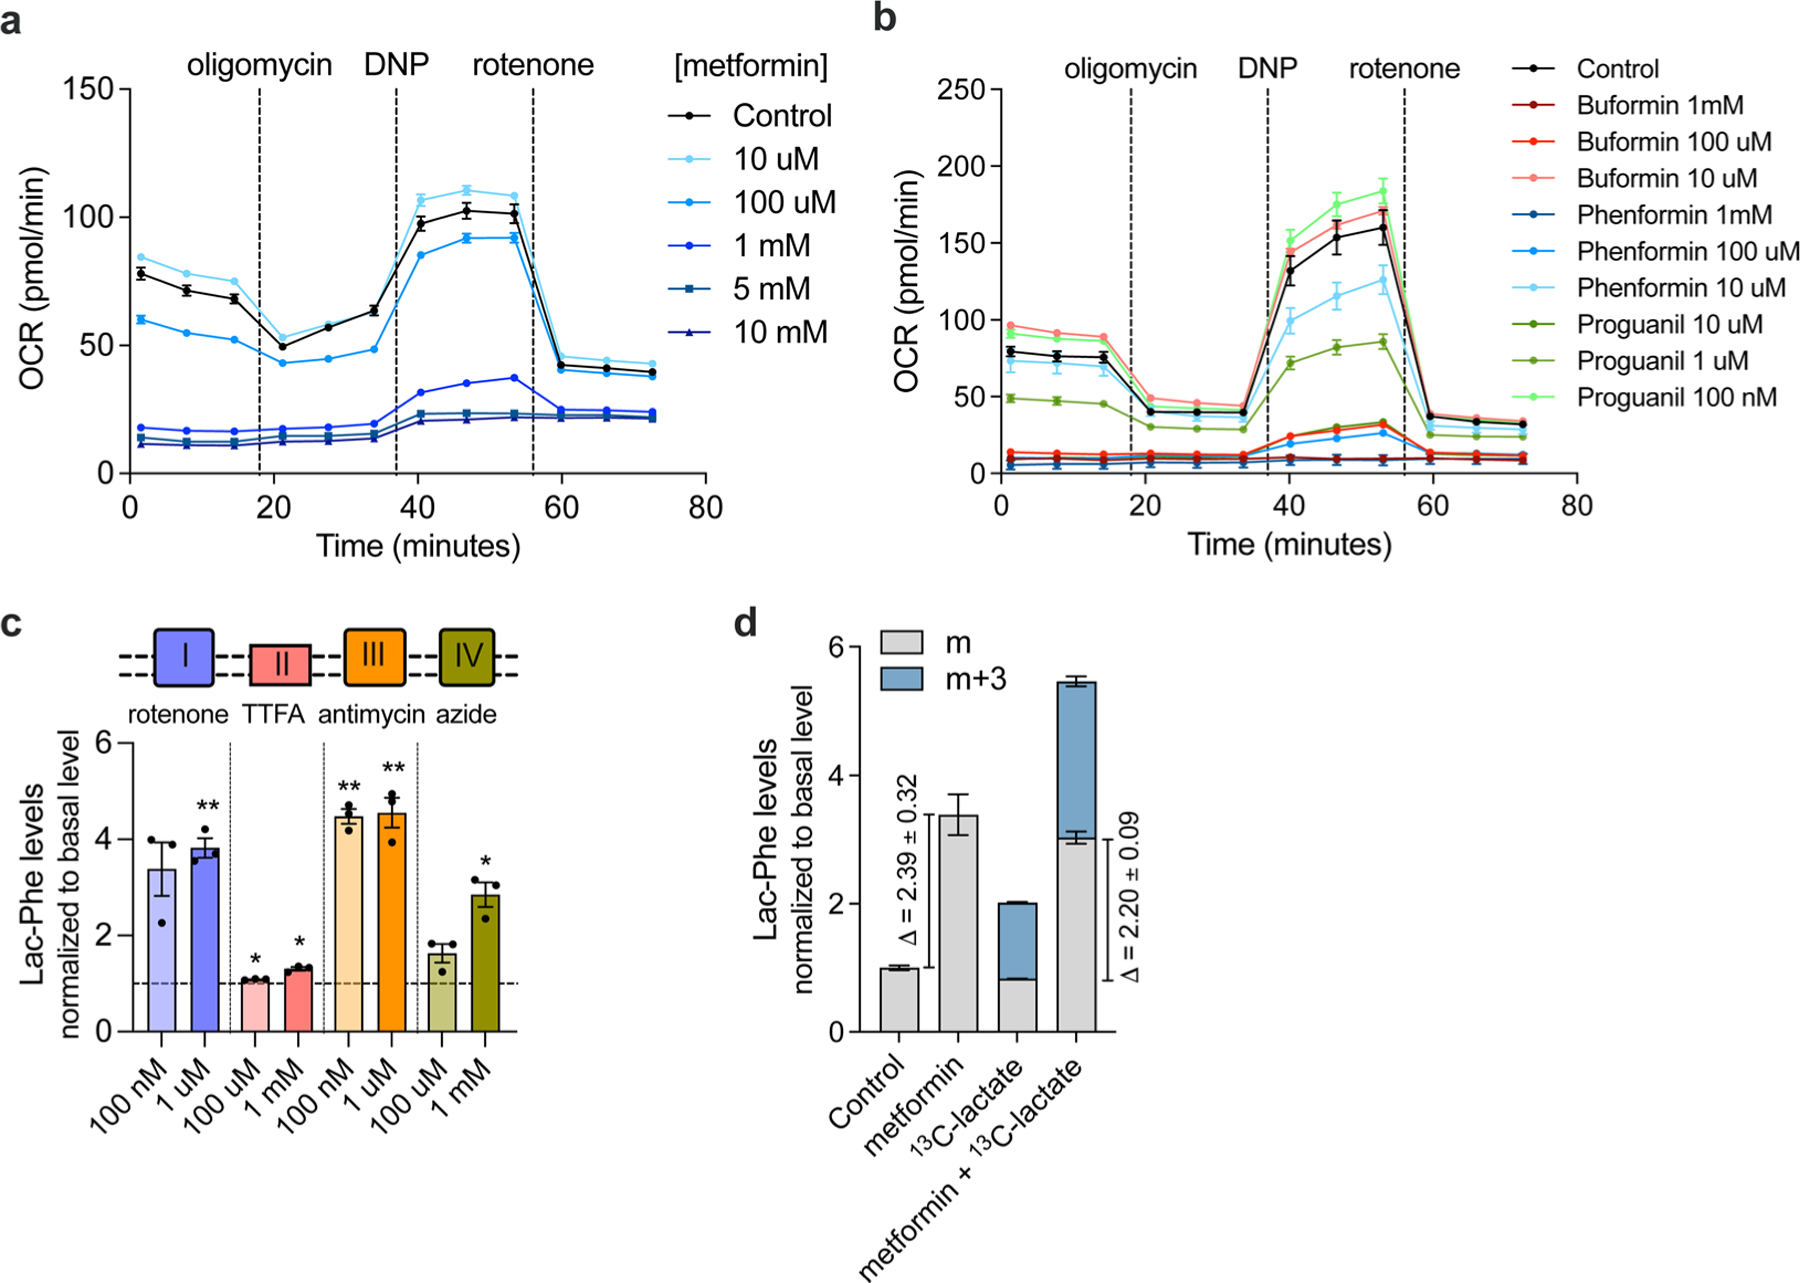
(a) Cellular respiration following treatment of primary macrophages with the indicated concentrations of metformin (n = 5/concentration). (b) Cellular respiration of primary macrophages following treatment with the indicated concentrations of biguanides overnight (n = 5/concentration for biguanides, N = 6/concentration for control). (c) Fold-change in media Lac-Phe levels in primary macrophages following overnight treatment with the indicated inhibitor of oxidative phosphorylation at the indicated concentration (n = 3/concentration) (d) Fold-change in media Lac-Phe levels or 13C-labeled Lac-Phe levels in primary macrophage (n=3/condition) using 13C-labeled lactate. P values in (c) were calculated using two-sided one sample t test. *p < 0.05, **p < 0.01. The exact p values in (c) are: 0.051, 0.005, 0.011, 0.014, 0.002, 0.008, 0.084, 0.018. N values from (a-d) represent biological independent samples. All error bars are SEM.
Extended Data Fig. 3 |. Metformin inhibits complex I to drive Lac-Phe production in Caco-2 cells.
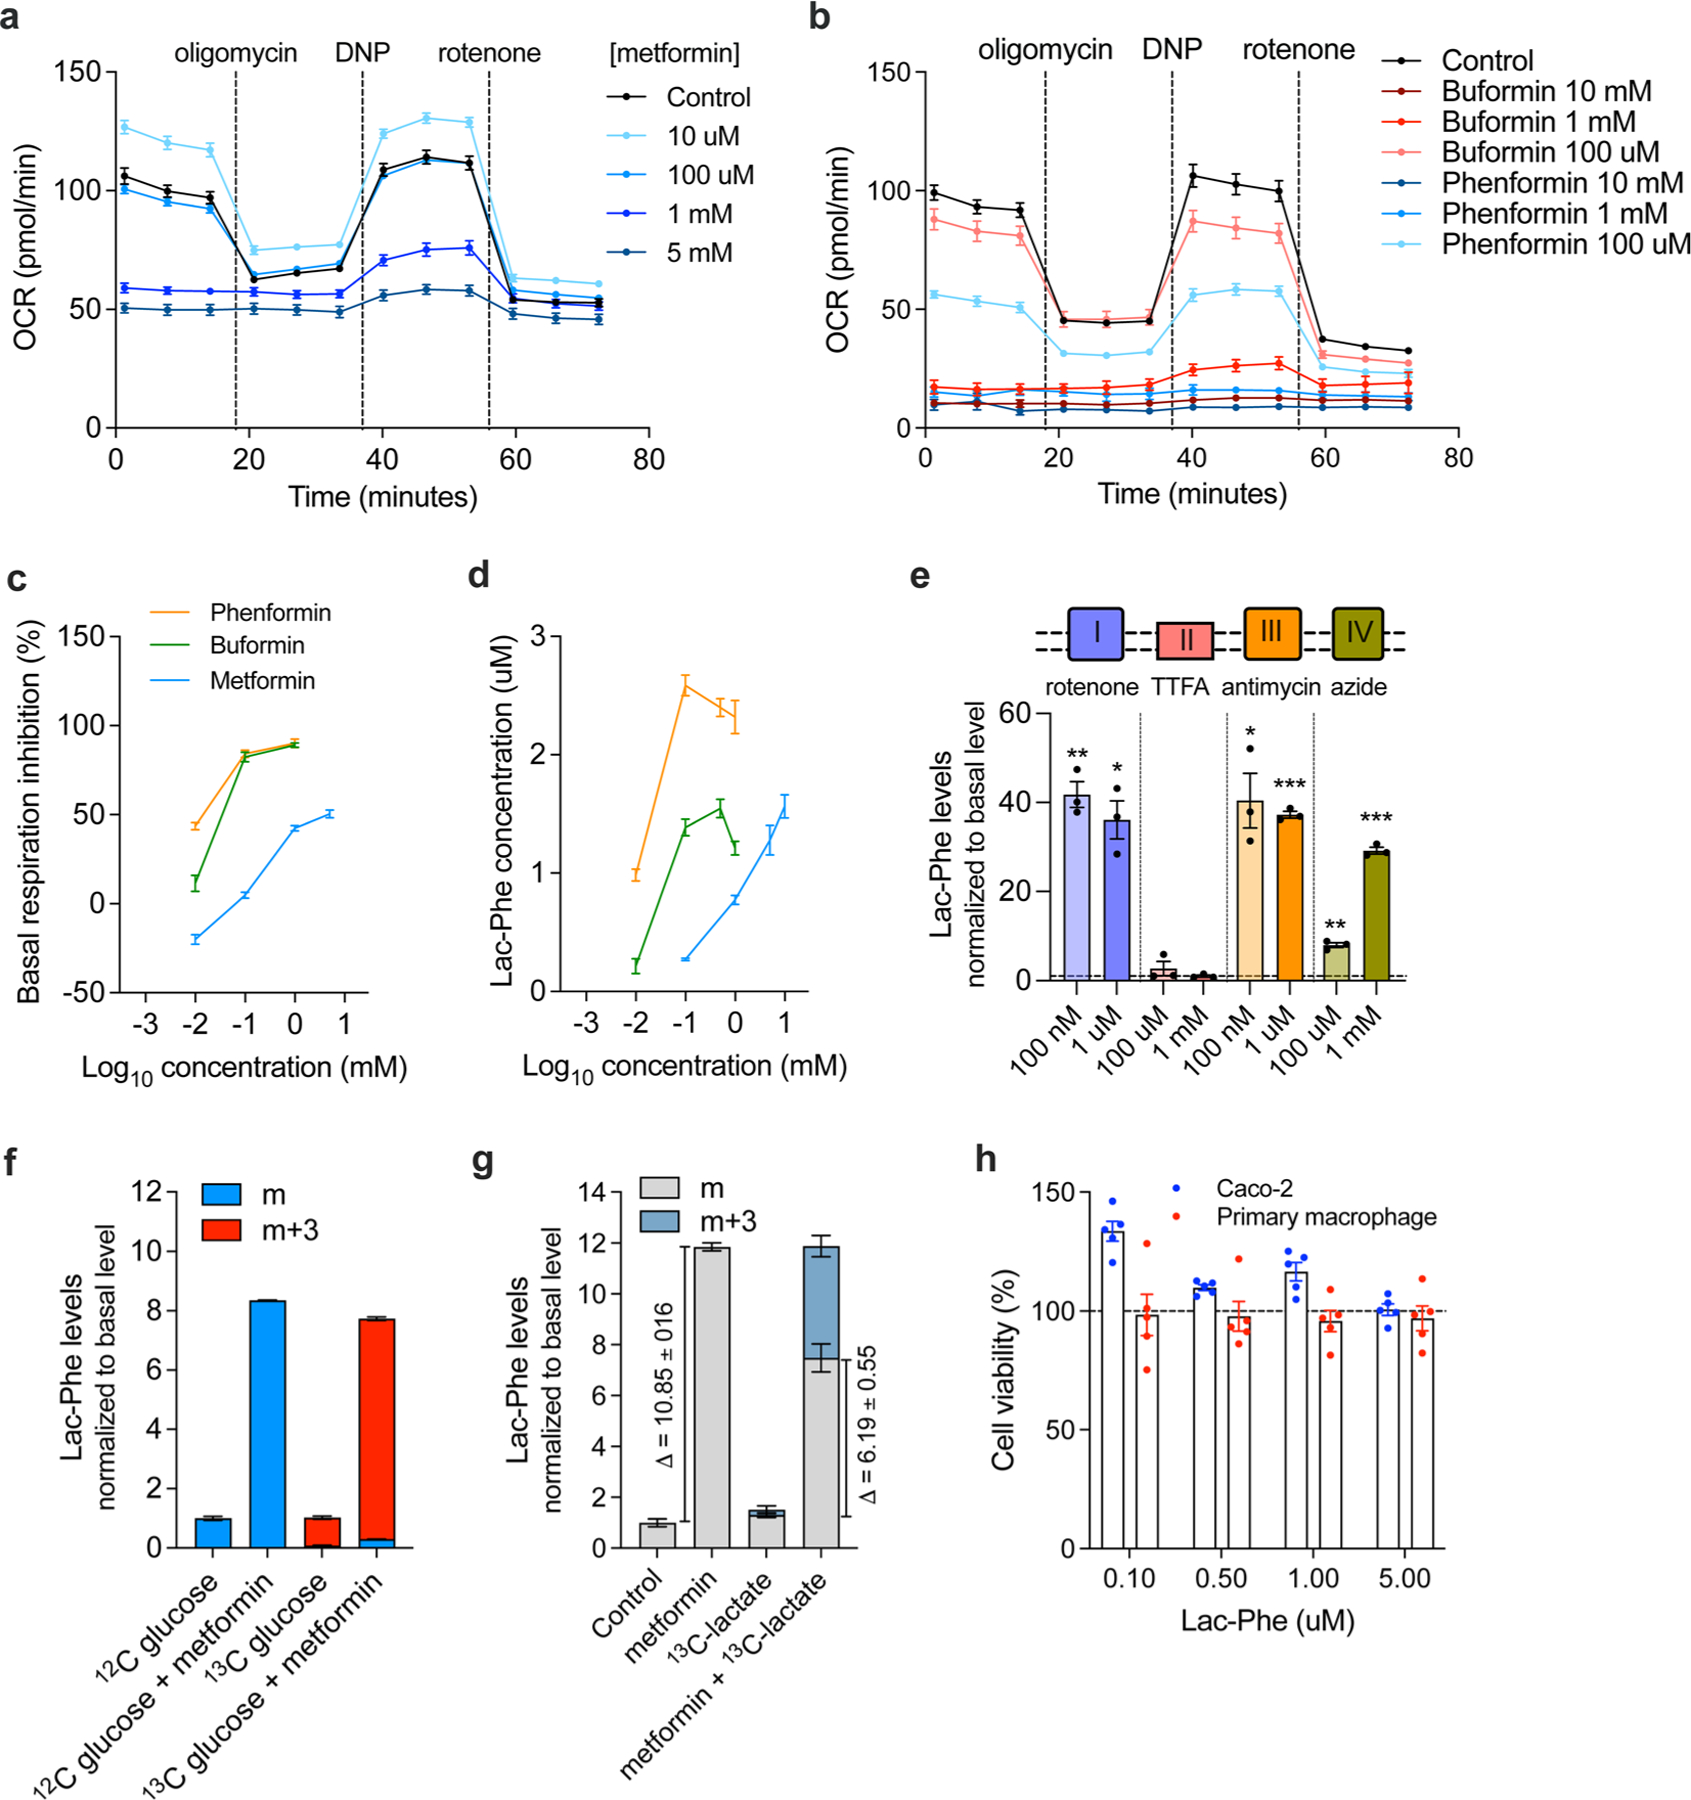
(a-b) Cellular respiration of Caco-2 cells following treatment with the indicated concentrations of metformin (a, n = 5/concentration) or biguanide (b, n = 6/concentration) overnight. (c-d) Percent inhibition of basal respiration (c, n = 5/concentration for metformin; n = 6/concentration for buformin and phenformin) and Lac-Phe concentration in media (d, n = 3/concentration) following overnight treatment of Caco-2 cells with the indicated biguanide at the indicated concentrations. (e) Fold-change in media Lac-Phe levels in Caco-2 cells following overnight treatment with the indicated oxidative phosphorylation inhibitor at the indicated concentration (n = 3/concentration) (f-g) Fold-change in media Lac-Phe levels or 13C-labeled Lac-Phe levels in Caco-2 cells (n = 3/condition) using either 13C-labeled glucose (f) or 13C-labeled lactate (g). (h) Cell viability after treated with Lac-Phe at indicated concentrations overnight as revealed by CCK-8 assay (n = 5/concentration). P values in (e) were calculated using two-sided one sample t test. *p < 0.05, **p < 0.01, *** p < 0.001. The exact p values in (e) are: 0.0050, 0.0144, 0.3965, 0.9973, 0.0232, 0.0004, 0.0064, 0.0007. N numbers in (a-h) represent biological independent samples. All error bars are SEM.
Extended Data Fig. 4 |. Additional characterization of cells and mice with genetic ablation of CNDP2.
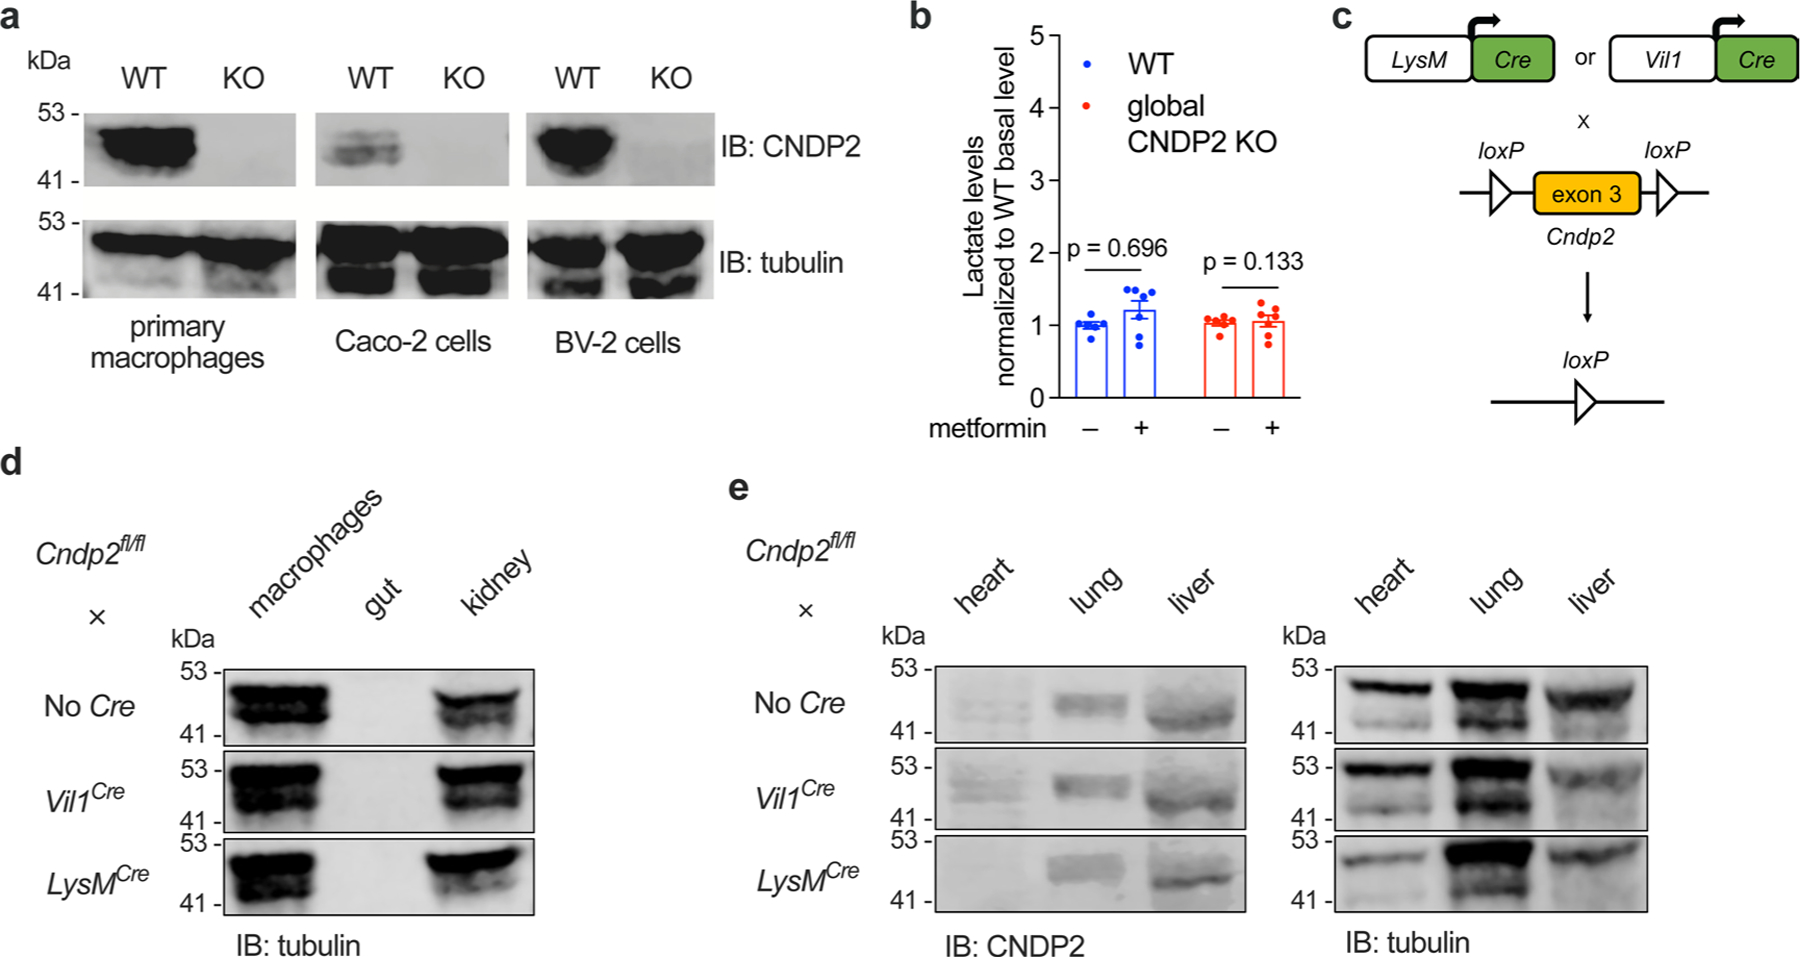
(a) Western blotting using anti-CNDP2 and anti-β-tubulin antibodies of WT and CNDP2-KO primary macrophages, Caco-2 cells, and BV-2 cells. (b) Relative plasma lactate levels in 12–14 week-old male WT or global CNDP2-KO DIO mice in the basal state or 1 h after treatment with metformin (300 mg/kg, PO) (n = 6 for WT; n = 7 for CNDP2-KO mice). Error bars are SEM. (c) Schematic illustration of conditional knockout of Cndp2 in macrophage or gut. (d) Western blotting using an anti-β-tubulin antibody in peritoneal macrophages, gut, or kidney tissues isolated from the indicated genotypes. (e) Western blotting using anti-CNDP2 and anti-β-tubulin antibodies in heart, lung, liver tissues isolated from the indicated genotypes. P values in (b) were calculated with two-sided multiple paired t tests with Holm-Šídák corrections. Western Blot experiments in (a), (d), and (e) have been done twice, similar results obtained.
Extended Data Fig. 5 |. Additional control analyses for the mediation effect of Lac-Phe on metformin-associated BMI reduction.
(a) Schematic of the two subgroups of MESA in the post-hoc subgroup analysis stratified by ΔBMI. The change in BMI of the complete MESA sample prior to subgroup analysis was 0.24 ± 0.04 kg/m2, n = 3645. Participants with increased BMI are shown in red; participants with decreased BMI are shown in blue. (b-d) The mediation model in Fig. 3b was reordered to test if ΔBMI partially mediates the relationship between metformin use (exposure) and Lac-Phe levels (outcome). (b) Among MESA participants with decreased BMI, the total effect of metformin use on Lac-Phe levels was assessed in an ‘unmediated model’ using an age- and sex-adjusted linear regression model. (c) To construct mediation models, the individual associations of metformin use, lac-phe, lactate, and ΔBMI were assessed using linear regression models as described in Methods. The direct effect of metformin use on Lac-Phe levels was then assessed using an age- and sex-adjusted linear regression model adjusted for ΔBMI. No reduction in the direct effect of metformin on Lac-Phe levels was appreciated compared to the total effect of metformin on Lac-Phe in the unmediated model suggesting no meditation. (d) The mediation effect of ΔBMI derived from the mediation models in (c), n = 1184. Values are median with 95% confidence intervals. Statistical significance were calculated using nonparametric bootstrapping with the percentile method. (e-g) The mediation effects of Lac-Phe and lactate on the effect of metformin-associated BMI increase. (e) Among MESA participants with increased BMI, the total effect of metformin use on ΔBMI was assessed in an ‘unmediated model’ using an age- and sex-adjusted linear regression model. (f) To construct mediation models, the individual associations of metformin use, Lac-Phe, lactate, and ΔBMI were assessed using linear regression models as described in Methods. The direct effect of metformin use on ΔBMI was then assessed using an age- and sex-adjusted linear regression model adjusted for either Lac-Phe (left) or lactate (right). No reduction in the direct effects of metformin on ΔBMI compared to the total effect of metformin on ΔBMI in the unmediated model suggested no meditation effect of either Lac-Phe or lactate. (g) The mediation effects of Lac-Phe and lactate. derived from the mediation models in (f), n = 1460. Values are plotted as mean with 95% confidence intervals. Confidence intervals and statistical significance (unadjusted p values) were calculated using nonparametric bootstrapping with the percentile method, as described in Methods. (h) The mediation effects of additional 136 metabolites measured in MESA participants with decreased BMI using the amide negative LC-MS method. Seven out of the 136 tested metabolites were found to have a predicted mediation effect with unadjusted p-value ≤ 0.05 (right). Values are median values with 95% confidence intervals. The confidence intervals and statistical significance of the predicted mediation effects for these seven metabolites were calculated using nonparametric bootstrapping with the percentile method (n = 1619), as described in Methods.
Extended Data Fig. 6 |. Physiological effects of metformin and Lac-Phe treatments in DIO mice.
(a) Glucose levels of WT and CNDP2-KO DIO mice (12–14 week-old, male) during GTT after receiving metformin (300 mg/kg, PO) 30 minute before receiving glucose (1 g/kg, i.p.). N = 5 per group. (b) Circulating PYY levels in WT and CNDP2-KO DIO mice (12–14 week-old, male) after metformin treatment (300 mg/kg, PO). N = 5 per group. (c) Glucose levels of C57BL/6J DIO mice (14–15 week-old, male) during GTT after receiving Lac-Phe (50 mg/kg, i.p.) or vehicle control 30 minute before receiving glucose (1 g/kg, i.p.). N = 6 per group. (d) Glucose levels of C57BL/6J DIO mice (14–15 week-old, male) during ITT after receiving Lac-Phe (50 mg/kg, i.p.) or vehicle control 30 minute before receiving insulin (1 U/kg, i.p.). N = 6 per group. (e) Glucose levels of C57BL/6J DIO mice (14–15 week-old, male) during PTT after receiving Lac-Phe (50 mg/kg, i.p.) or vehicle control 30 minute before receiving sodium pyruvate (2.5 g/kg, i.p.). N = 7 per group. (f) Effect of GDF15 on body weight in C57BL/6J DIO mice (12–14 week-old, male) after receiving anti-GFRAL antibody or control IgG. N = 5 per group. P values in (a) and (c-e) were measured with two-sided two-way ANOVA. P values in (b) and (f) were calculated with two-sided Welch t tests. All error bars are SEM.
Supplementary Material
Acknowledgements
We thank members of the Long and Svensson lab for helpful discussions. We thank T. Wyss-Coray for sharing the BV-2 microglial cell line. We thank P. J. Emmerson for sharing the GFRAL neutralizing antibody and control IgG. We thank L. Liu from the Wu lab for helping with Seahorse assays. S.X. is supported by the Stanford School of Medicine Dean’s Fellowship and a Postdoctoral Fellowship from the American Heart Association (24POST1200064). V.L.L. is supported by the NIH (GM113854) and a Bio-X SIGF Graduate Student Fellowship. This work was supported by the NIH (K08HL145095 to M.B., DK124265 and DK136526 to J.Z.L.). This study was also supported in part by the National Heart, Lung and Blood Institute (NHLBI) TOPMed MESA Multi-Omics (HHSN2682015000031/HSN26800004). MESA projects are conducted and supported by the NHLBI in collaboration with MESA investigators. Support for MESA is provided by contracts 75N92020D00001, HHSN268201500003I, N01-HC-95159, 75N92020D00005, N01-HC-95160, 75N92020D00002, N01-HC-95161, 75N92020D00003, N01-HC-95162, 75N92020D00006, N01-HC-95163, 75N92020D00004, N01-HC-95164, 75N92020D00007, N01-HC-95165, N01-HC-95166, N01-HC-95167, N01-HC-95168, N01-HC-95169, UL1-TR-000040, UL1-TR-001079, UL1-TR-001420, UL1TR001881, DK063491 and R01HL105756. We thank the other investigators, the staff and the participants of the MESA study for their valuable contributions. A full list of participating MESA investigators and institutes can be found at http://www.mesa-nhlbi.org. Supported in part by the NIH, NHLBI contract 1R01HL151855 and the National Institute of Diabetes and Digestive and Kidney Diseases contract UM1DK078616.
Footnotes
Reporting summary
Further information on research design is available in the Nature Portfolio Reporting Summary linked to this article.
Competing interests
The authors declare no competing interests.
Additional information
Extended data is available for this paper at https://doi.org/10.1038/s42255-024-00999-9.
Supplementary information The online version contains supplementary material available at https://doi.org/10.1038/s42255-024-00999-9.
Peer review information Nature Metabolism thanks Tara TeSlaa, Gary Churchill and the other, anonymous, reviewer(s) for their contribution to the peer review of this work. Primary Handling Editor: Christoph Schmitt, in collaboration with the Nature Metabolism team.
Data availability
All data are available within the main and Extended Data files. Source data are provided with this paper.
References
- 1.LaMoia TE & Shulman GI Cellular and molecular mechanisms of metformin action. Endocr. Rev 42, 77–96 (2021). [DOI] [PMC free article] [PubMed] [Google Scholar]
- 2.Foretz M, Guigas B, Bertrand L, Pollak M & Viollet B Metformin: from mechanisms of action to therapies. Cell Metab 20, 953–966 (2014). [DOI] [PubMed] [Google Scholar]
- 3.Diabetes Prevention Program Research Group. Long-term safety, tolerability, and weight loss associated with metformin in the Diabetes Prevention Program Outcomes Study. Diabetes Care 35, 731–737 (2012). [DOI] [PMC free article] [PubMed] [Google Scholar]
- 4.Knell G, Li Q, Pettee Gabriel K & Shuval K Long-term weight loss and metabolic health in adults concerned with maintaining or losing weight: findings from NHANES. Mayo Clin. Proc 93, 1611–1616 (2018). [DOI] [PMC free article] [PubMed] [Google Scholar]
- 5.Apolzan JW et al. Long-term weight loss with metformin or lifestyle intervention in the Diabetes Prevention Program Outcomes Study. Ann. Intern. Med 170, 682–690 (2019). [DOI] [PMC free article] [PubMed] [Google Scholar]
- 6.Yerevanian A & Soukas AA Metformin: mechanisms in human obesity and weight loss. Curr. Obes. Rep 8, 156–164 (2019). [DOI] [PMC free article] [PubMed] [Google Scholar]
- 7.Lee A & Morley JE Metformin decreases food consumption and induces weight loss in subjects with obesity with type II non-insulin-dependent diabetes. Obes. Res 6, 47–53 (1998). [DOI] [PubMed] [Google Scholar]
- 8.Day EA et al. Metformin-induced increases in GDF15 are important for suppressing appetite and promoting weight loss. Nat. Metab 1, 1202–1208 (2019). [DOI] [PubMed] [Google Scholar]
- 9.Coll AP et al. GDF15 mediates the effects of metformin on body weight and energy balance. Nature 578, 444–448 (2020). [DOI] [PMC free article] [PubMed] [Google Scholar]
- 10.Zhang S-Y et al. Metformin triggers a kidney GDF15-dependent area postrema axis to regulate food intake and body weight. Cell Metab 35, 875–886.e5 (2023). [DOI] [PMC free article] [PubMed] [Google Scholar]
- 11.Klein AB et al. The GDF15-GFRAL pathway is dispensable for the effects of metformin on energy balance. Cell Rep 40, 111258 (2022). [DOI] [PubMed] [Google Scholar]
- 12.Klein AB, Kleinert M, Richter EA & Clemmensen C GDF15 in appetite and exercise: Essential player or coincidental bystander? Endocrinology 163, bqab242 (2022). [DOI] [PubMed] [Google Scholar]
- 13.Li VL et al. An exercise-inducible metabolite that suppresses feeding and obesity. Nature 606, 785–790 (2022). [DOI] [PMC free article] [PubMed] [Google Scholar]
- 14.Hoene M et al. Exercise-induced N-lactoylphenylalanine predicts adipose tissue loss during endurance training in overweight and obese humans. Metabolites 13, 15 (2022). [DOI] [PMC free article] [PubMed] [Google Scholar]
- 15.Abbasi F et al. Effect of metformin treatment on multiple cardiovascular disease risk factors in patients with type 2 diabetes mellitus. Metabolism 53, 159–164 (2004). [DOI] [PubMed] [Google Scholar]
- 16.Bild DE et al. Multi-Ethnic Study of Atherosclerosis: objectives and design. Am. J. Epidemiol 156, 871–881 (2002). [DOI] [PubMed] [Google Scholar]
- 17.Lévy J et al. Intestinal inhibition of Atg7 prevents tumour initiation through a microbiome-influenced immune response and suppresses tumour growth. Nat. Cell Biol 17, 1062–1073 (2015). [DOI] [PubMed] [Google Scholar]
- 18.He L et al. Metformin and insulin suppress hepatic gluconeogenesis through phosphorylation of CREB binding protein. Cell 137, 635–646 (2009). [DOI] [PMC free article] [PubMed] [Google Scholar]
- 19.Wheaton WW et al. Metformin inhibits mitochondrial complex I of cancer cells to reduce tumorigenesis. eLife 3, e02242 (2014). [DOI] [PMC free article] [PubMed] [Google Scholar]
- 20.Chandel NS et al. Are metformin doses used in murine cancer models clinically relevant? Cell Metab 23, 569–570 (2016). [DOI] [PubMed] [Google Scholar]
- 21.Howell JJ et al. Metformin inhibits hepatic mTORC1 signaling via dose-dependent mechanisms involving AMPK and the TSC complex. Cell Metab 25, 463–471 (2017). [DOI] [PMC free article] [PubMed] [Google Scholar]
- 22.Jansen RS et al. N-lactoyl-amino acids are ubiquitous metabolites that originate from CNDP2-mediated reverse proteolysis of lactate and amino acids. Proc. Natl Acad. Sci. USA 112, 6601–6606 (2015). [DOI] [PMC free article] [PubMed] [Google Scholar]
- 23.LaMoia TE et al. Metformin, phenformin, and galegine inhibit complex IV activity and reduce glycerol-derived gluconeogenesis. Proc. Natl Acad. Sci. USA 119, e2122287119 (2022). [DOI] [PMC free article] [PubMed] [Google Scholar]
- 24.Owen MR, Doran E & Halestrap AP Evidence that metformin exerts its anti-diabetic effects through inhibition of complex 1 of the mitochondrial respiratory chain. Biochem. J 348, 607–614 (2000). [PMC free article] [PubMed] [Google Scholar]
- 25.Madison BB et al. cis Elements of the villin gene control expression in restricted domains of the vertical (crypt) and horizontal (duodenum, cecum) axes of the intestine. J. Biol. Chem 277, 33275–33283 (2002). [DOI] [PubMed] [Google Scholar]
- 26.Yao Y et al. Mucus sialylation determines intestinal host–commensal homeostasis. Cell 185, 1172–1188.e28 (2022). [DOI] [PMC free article] [PubMed] [Google Scholar]
- 27.Servin-Vences MR et al. PIEZO2 in somatosensory neurons controls gastrointestinal transit. Cell 186, 3386–3399.e15 (2023). [DOI] [PMC free article] [PubMed] [Google Scholar]
- 28.Hayashi M et al. Enteroendocrine cell lineages that differentially control feeding and gut motility. eLife 12, e78512 (2023). [DOI] [PMC free article] [PubMed] [Google Scholar]
- 29.Clausen BE, Burkhardt C, Reith W, Renkawitz R & Förster I Conditional gene targeting in macrophages and granulocytes using LysMcre mice. Transgenic Res 8, 265–277 (1999). [DOI] [PubMed] [Google Scholar]
- 30.Gerstein HC et al. Growth differentiation factor 15 as a novel biomarker for metformin. Diabetes Care 40, 280–283 (2017). [DOI] [PubMed] [Google Scholar]
- 31.Mannucci E et al. Effect of metformin on glucagon-like peptide 1 (GLP-1) and leptin levels in obese nondiabetic subjects. Diabetes Care 24, 489–494 (2001). [DOI] [PubMed] [Google Scholar]
- 32.Sun EW et al. Metformin triggers PYY secretion in human gut mucosa. J. Clin. Endocrinol. Metab 104, 2668–2674 (2019). [DOI] [PubMed] [Google Scholar]
- 33.Lau J et al. Discovery of the once-weekly glucagon-like peptide-1 (GLP-1) analogue semaglutide. J. Med. Chem 58, 7370–7380 (2015). [DOI] [PubMed] [Google Scholar]
- 34.Emmerson PJ et al. The metabolic effects of GDF15 are mediated by the orphan receptor GFRAL. Nat. Med 23, 1215–1219 (2017). [DOI] [PubMed] [Google Scholar]
- 35.Scott B et al. Metformin and feeding increase levels of the appetite-suppressing metabolite Lac-Phe in humans. Nat. Metab 10.1038/s42255-024-01018-7 (2024). [DOI] [PMC free article] [PubMed] [Google Scholar]
- 36.Gonçalves R and Mosser DM The isolation and characterization of murine macrophages. Curr. Protoc. Immunol 111, 14.1.1–14.1.16 (2015). [DOI] [PMC free article] [PubMed] [Google Scholar]
- 37.Jung Y, Zhao M & Svensson KJ Isolation, culture, and functional analysis of hepatocytes from mice with fatty liver disease. STAR Protoc 1, 100222 (2020). [DOI] [PMC free article] [PubMed] [Google Scholar]
- 38.Sanjana NE, Shalem O & Zhang F Improved vectors and genome-wide libraries for CRISPR screening. Nat. Methods 11, 783–784 (2014). [DOI] [PMC free article] [PubMed] [Google Scholar]
- 39.Kim JT, Li VL, Terrell SM, Fischer CR & Long JZ Family-wide annotation of enzymatic pathways by parallel in vivo metabolomics. Cell Chem. Biol 26, 1623–1629.e3 (2019). [DOI] [PMC free article] [PubMed] [Google Scholar]
- 40.Tahir UA et al. Metabolomic profiles and heart failure risk in black adults: insights from the Jackson Heart Study. Circ. Heart Fail 14, e007275 (2021). [DOI] [PMC free article] [PubMed] [Google Scholar]
- 41.Tahir UA et al. Whole genome association study of the plasma metabolome identifies metabolites linked to cardiometabolic disease in black individuals. Nat. Commun 13, 4923 (2022). [DOI] [PMC free article] [PubMed] [Google Scholar]
- 42.Katz DH et al. Whole genome sequence analysis of the plasma proteome in black adults provides novel insights into cardiovascular disease. Circulation 145, 357–370 (2022). [DOI] [PMC free article] [PubMed] [Google Scholar]
- 43.Baron RM & Kenny DA The moderator–mediator variable distinction in social psychological research: conceptual, strategic, and statistical considerations. J. Personal. Soc. Psychol 51, 1173–1182 (1986). [DOI] [PubMed] [Google Scholar]
- 44.James LR & Brett JM Mediators, moderators, and tests for mediation. J. Appl. Psychol 69, 307–321 (1984). [Google Scholar]
- 45.Judd CM & Kenny DA Process analysis: estimating mediation in treatment evaluations. Eval. Rev 5, 602–619 (1981). [Google Scholar]
- 46.Bollen KA & Stine R Direct and indirect effects: classical and bootstrap estimates of variability. Sociol. Methodol 20, 115–140 (1990). [Google Scholar]
- 47.Shrout PE & Bolger N Mediation in experimental and nonexperimental studies: new procedures and recommendations. Psychol. Methods 7, 422–445 (2002). [PubMed] [Google Scholar]
- 48.Tingley D, Yamamoto T, Hirose K, Keele L & Imai K mediation: R package for causal mediation analysis. J. Stat. Soft 59, 1–38 (2014). [Google Scholar]
Associated Data
This section collects any data citations, data availability statements, or supplementary materials included in this article.
Supplementary Materials
Data Availability Statement
All data are available within the main and Extended Data files. Source data are provided with this paper.