The BH3 mimetic venetoclax, in combination with low-dose cytarabine, decitabine or azacitidine, has shown clinical efficacy in newly diagnosed acute myeloid leukemia (AML) patients over 75 years of age or those ineligible for intensive induction chemotherapy.1,2 This has been a significant advance, particularly in the treatment of older AML patients who historically have been difficult to treat.3-5 Venetoclax selectively inhibits the BCL2 protein which is over-expressed in AML to activate intrinsic apoptosis of AML cells. However, this treatment regime is associated with higher incidences of cytopenias, including clinically relevant neutropenia, febrile neutropenia and thrombocytopenia.2,6 The underlying cause of cytopenia in the context of venetoclax-treated AML patients remains unexplained. Here, we show that AML drives IL-3-dependent upregulation of BCL2 in non-malignant hematopoietic stem and progenitor cells (HSPC), which is targeted by venetoclax and causes cytopenias.
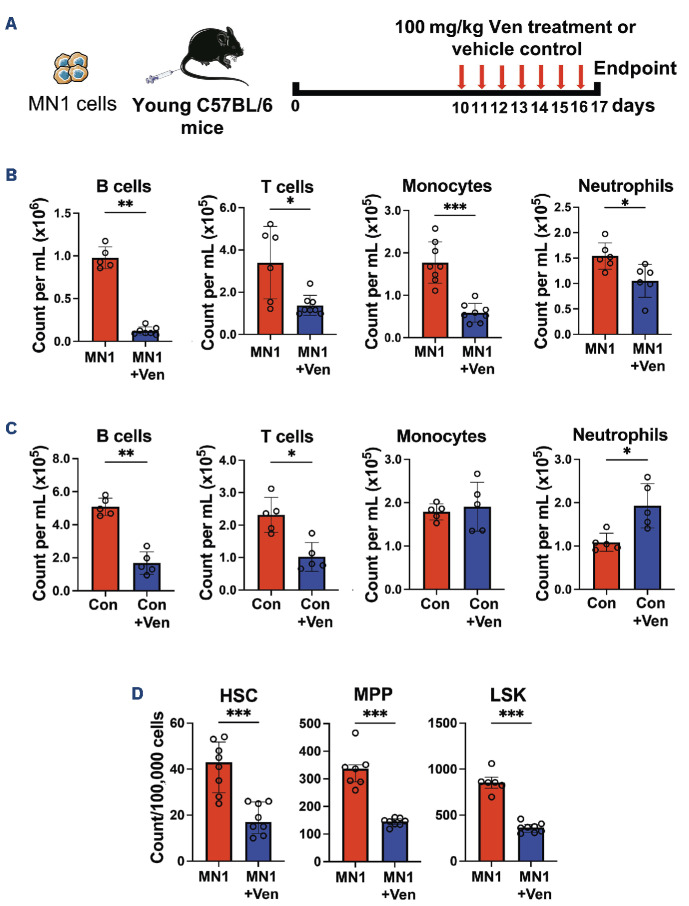
To model AML in vivo, we have previously used the syngeneic AML mouse model in which the MN1 oncogene is over-expressed in progenitor cells.7,8 All in vivo work in this study followed the institutional and national guidelines for the care and use of laboratory animals in accordance with UK Home Office regulations and the 1986 Animal Scientific Procedures Act. To determine if this model recapitulates the clinical cytopenias associated with venetoclax treatment, MN1 cells were engrafted into non-conditioned female C57BL/6 mice and 100 mg/ kg venetoclax or vehicle control were administered for seven consecutive days by oral gavage (Figure 1A). Blood and bone marrow (BM) samples were taken following sacrifice of mice and analyzed on BD FACSymphonyTM A1 (BD Biosciences, Berkshire, UK).
Flow cytometry analysis demonstrated that monocytes and neutrophils as well as B and T cells are depleted in venetoclax-treated MN1 engrafted mice compared to vehicle control-treated MN1-engrafted mice (Figure 1B and Online Supplementary Figure S1A). B- and T-cell depletion was also observed in control mice treated with venetoclax, but monocyte and neutrophil counts were not reduced (Figure 1C). We next investigated the effect of venetoclax on non-malignant HSPC in the BM, specifically hematopoietic stem cell (HSC), multipotent progenitor (MPP) and LSK (Lin- Sca1+ CD117+) populations (Online Supplementary Figure S1B). HSC, MPP and LSK populations were all depleted by venetoclax in MN1-engrafted mice compared to vehicle control-treated MN1-engrafted mice (Figure 1D).
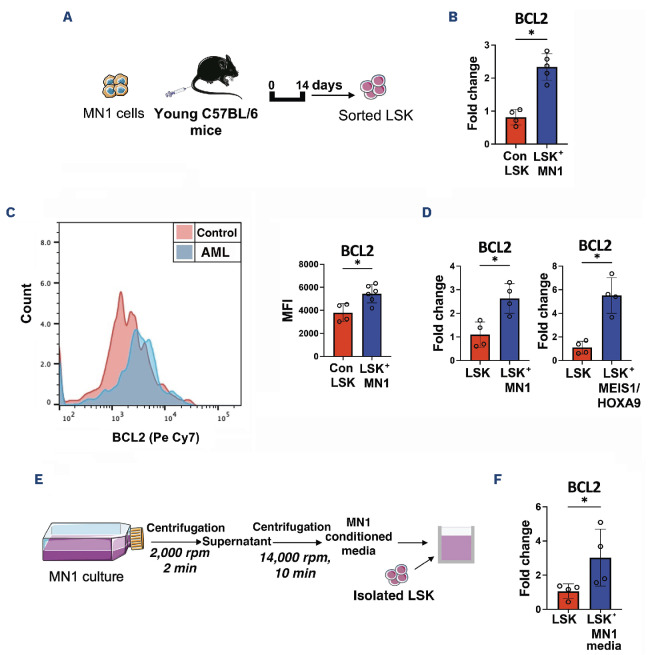
Further, we assessed the BCL2 expression profile in non-malignant LSK in the presence of AML. MN1 cells were injected into non-conditioned female C57BL/6 mice. At day 14, LSK were FACS purified from the BM (Figure 2A). Real-time qPCR analysis determined that LSK in MN1-engrafted mice exhibit increased BCL2 gene expression compared to control mice (Figure 2B). Elevated BCL2 protein expression was confirmed in LSK in MN1-engrafted mice relative to control mice using flow cytometry (Figure 2C). To determine the mechanism for increased BCL2 expression, these findings were modeled in vitro by co-culturing LSK with either MN1 or MEIS1/ HOXA9 AML subtypes. MEIS1/HOXA9 cells were retrovirally generated and labeled with mCherry, as previously described.7, 8 Real-time qPCR analysis confirmed that LSK have significantly elevated BCL2 gene expression under AML co-culture conditions (Figure 2D). This was further confirmed at the protein level using flow cytometry for BCL2 (Online Supplementary Figure S1C). To determine if a secretory factor from AML is responsible for inducing BCL2 upregulation in LSK, we cultured LSK with cell-free conditioned media from MN1 cells (Figure 2E). Real-time qPCR confirmed that BCL2 is up-regulated in LSK treated with AML-conditioned media (Figure 2F) and demonstrates that an AML-mediated secretory factor is triggering BCL2 overexpression in LSK.
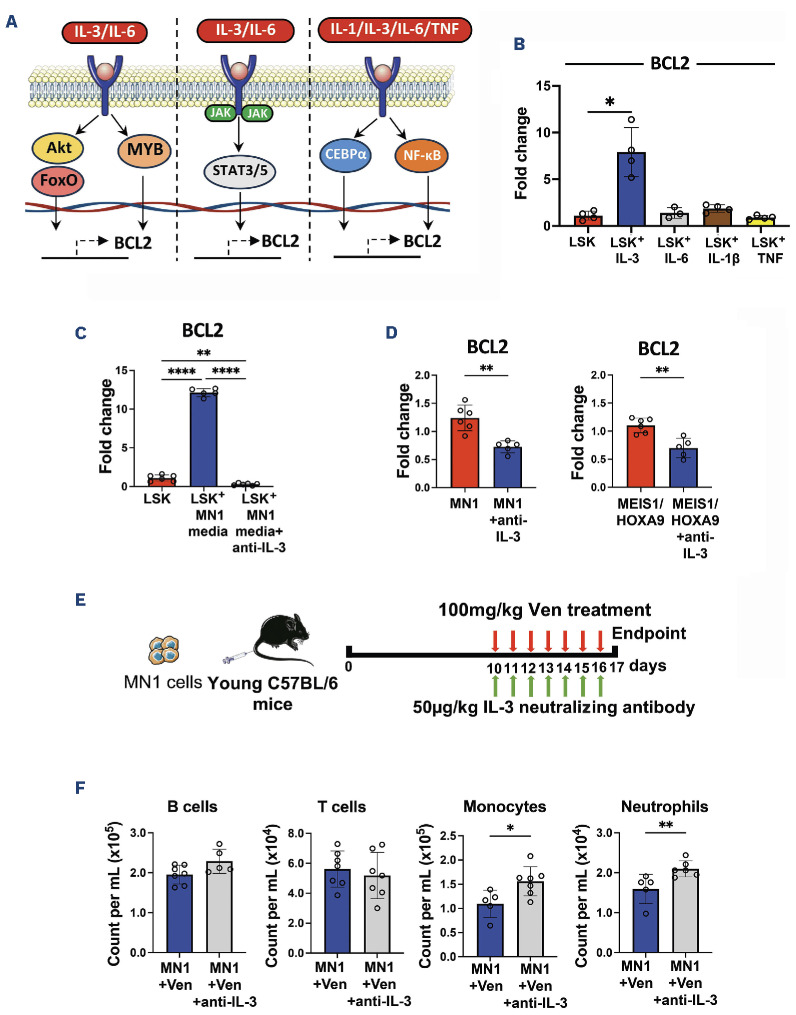
Previous research has suggested roles for interleukins (IL-) 1, 3 and 6 and tumor necrosis factor (TNF)9-12 as inducers of BCL2 transcription in different cell types11 (Figure 3A). Therefore, to investigate the mechanism, BCL2 expression was assessed in LSK treated with IL-3, IL-6, IL-1β and TNF by real-time qPCR. Notably, results showed that BCL2 was significantly up-regulated in LSK in response to an IL-3 stimulus (Figure 3B), but not IL-6, IL-1b or TNF. Studies have previously shown that IL-3 levels are increased in the serum of patients with AML.13 Furthermore, IL-3 has been shown to directly affect HSPC function, driving proliferation and differentiation but impairing long-term repopulation and self-renewal potential.14,15 IL-3, therefore, appears to play a role both in AML disease pathogenesis and in normal HSPC function. In this paper, we focus on the impact of IL-3 on BCL2 expression and the subsequent influence of venetoclax on HSPC function rather than the overall impact of IL-3 on HSPC function, which is beyond the scope of this paper. To determine the effect of IL-3 inhibition on BCL2 expression, LSK cultured with MN1-conditioned media were treated with IL-3 neutralizing antibody MP2-8F8 (Bio X Cell, NH, USA). Real-time qPCR analysis confirmed that IL-3 neutralization prevents upregulation of BCL2 in LSK cultured in MN1-conditioned media (Figure 3C). BCL2 gene expression was also reduced in MN1 and MEIS1/HOXA9 cells treated with IL-3 neutralizing antibody (Figure 3D), suggesting that the effect of IL-3 inhibition on BCL2 expression is non-specific. Despite this, blocking IL-3 does not make AML cells resistant to BCL2 inhibition (Online Supplementary Figure S1D). Next, to determine if IL-3 treatment results in post-translational changes in BCL2 in LSK, both total and phosphorylated BCL2 protein levels were measured by flow cytometry. Results demonstrate that both total and phosphorylated BCL2 levels are increased to similar levels after IL-3 treatment (Online Supplementary Figure S1E). Of note, venetoclax was found to have no direct effect on BCL2 expression in mature hematopoietic lineages in the presence of AML, suggesting that the observed cytopenias are driven by changes in the HSPC (Online Supplementary Figure S1F). Finally, to assess the effect of IL-3 inhibition on cytopenias secondary to venetoclax treatment in vivo, mice were engrafted with MN1 cells and treated with 100 mg/kg venetoclax and 50 μg/kg IL-3 neutralizing antibody daily for seven days (Figure 3E). Results show that both monocyte and neutrophil counts recovered in AML-engrafted mice treated with both venetoclax and IL-3 neutralizing antibody compared to venetoclax only treated-mice (Figure 3F). Taken together, we show that AML induces an IL-3-dependent upregulation of BCL2 in HSPC, which in turn increases HSPC sensitivity to venetoclax and causes cytopenias. Understanding of this mechanism could provide insight for a treatment strategy with venetoclax to reduce the incidence of cytopenias observed in AML patients.
Figure 1.
Venetoclax treatment causes depletion of neutrophils and monocytes in acute myeloid leukemia-engrafted mice. (A) Experimental schematic. MN1 cells were retrovirally generated and subsequently tagged with GFP to allow distinction from non-malignant cells, as previously described.7,8 2.5x10⁶ MN1 cells were injected into 12-14-week old female non-conditioned C57BL/6 mice. At day 10, 100 mg/kg venetoclax (Ven) or vehicle control was administered by oral gavage for seven days. Peripheral blood (PB) and bone marrow (BM) were assessed by flow cytometry following sacrifice. (B) Cell counts for B cells, T cells, monocytes and neutrophils per mL of PB in MN1-engrafted mice treated with Ven (N=8) compared to acute myeloid leukemia (AML) control mice (N=8). (C) Cell counts as above but in control mice with Ven treatment (N=5) and without (N=5). (D) Cell counts per 100,000 BM cells for hematopoietic stem cell (HSC), multipotent progenitor (MPP) and LSK (Lin- Sca1+ CD117+) in MN1-engrafted mice treated with Ven (N=8) compared to AML control mice (N=8). All data in (B-D) are represented as median + interquartile range. *P<0.05, **P<0.01, ***P<0.001 by Mann-Whitney U test.
Figure 2.
Acute myeloid leukemia drives an upregulation of BCL2 in non-malignant Lin- Sca1+ CD117+. (A) Experimental schematic. 2.5x10⁶ MN1 cells were injected into 12-14-week old female non-conditioned C57BL/6 mice. Lin- Sca1+ CD117+ (LSK) cells were sorted by FACS on day 14. (B) Real-time qPCR assessed BCL2 gene expression in LSK in MN1-engrafted mice (N=5) compared to control mice (N=5). qPCR assay was performed with the SYBR-green technology (PCR Biosystems, UK)8 on QuantStudio 5 PCR system using BCL2 (Mm_Bcl2_vb.1_SG QuantiTect Primer Assay, GeneGlobe ID QT01057224) and GAPDH (Mm_Gapdh_3_SG QuantiTect Primer Assay, GeneGlobe ID QT01658692) primers from Qiagen. (C) BCL2 protein level in LSK quantified by mean fluorescence intensity (MFI) in MN1-engrafted mice (N=6) and control mice (N=6) using flow cytometry. (D) LSK were isolated from bone marrow (BM) of young C57BL/6 mice and 5x10⁴ cells were co-cultured in transwells with either MN1 or MEIS1/HOXA9 cells for 48 hours (hr) in Dulbecco’s Modified Eagle’s Medium (DMEM) supplemented with 10% fetal bovine serum (FBS), 1% penicillin streptomycin (Pen-Strep). Real-time qPCR assessed BCL2 gene expression in LSK co-cultured with acute myeloid leukemia (AML) cells (N=4) compared to LSK-only controls (N=4). (E) Schematic for cell-free conditioned media extraction from MN1 cells. Isolated LSK were cultured with MN1-conditioned media for 48 hr. (F) Real-time qPCR assessed BCL2 gene expression in LSK with MN1-conditioned media (N=4) versus LSK-only controls (N=4). All data in (B-D) and (F) are represented as median + interquartile range. *P<0.05 by Mann-Whitney U test. min: minutes.
Figure 3.
Acute myeloid leukemia drives an IL-3-mediated overexpression of BCL2 in non-malignant Lin- Sca1+ CD117+ which is reversed by IL-3 neutralization, and restores neutrophil and monocyte counts in combination with venetoclax in acute myeloid leukemia-engrafted mice. (A) Schematic depicting potential mechanisms for BCL2 transcription in non-malignant Lin- Sca1+ CD117+ (LSK). (B) 5x10⁴ LSK were cultured in DMEM supplemented with 10% fetal bovine serum (FBS) and 1% penicillin streptomycin (PenStrep), and treated with 100 ng/mL IL-3, IL-6, IL-1β or TNF for 24 hours (hr). Real-time qPCR assessed BCL2 gene expression in treated LSK (N=4) compared to non-treated LSK (N=4). (C) 5x10⁴ LSK were next cultured with MN1-conditioned media and treated with 5 mg/mL anti-IL-3 (IL-3 neutralizing antibody MP2-8F8; Bio X Cell, NH, USA) for 48 hr. Real-time qPCR assessed BCL2 gene expression in LSK cultured with MN1-conditioned media and anti-IL-3 antibody (N=6), LSK cultured with MN1-conditioned media only (N=6) and LSK-only controls (N=6). (D) 3x10⁵ MN1 and MEIS1/HOXA9 cells were treated with 5 μg/mL anti-IL-3 for 48 hr. Real-time qPCR assessed BCL2 gene expression in anti-IL-3-treated AML cells (N=5) compared to non-treated AML cells (N=6). (E) Experimental schematic. 2.5x10⁶ MN1 cells were injected into 12-14-week old male non-conditioned C57BL/6 mice. At day 10, 100 mg/kg venetoclax (Ven) was administered by oral gavage alongside 50 mg/kg anti-IL-3 by intraperitoneal injection, both daily for seven days. Peripheral blood (PB) was assessed by flow cytometry following sacrifice. (F) Cell counts for B cells, T cells, monocytes and neutrophils per mL of PB in MN1-engrafted mice treated with Ven plus anti-IL-3 antibody (N=7) compared to Ven only (N=7). All data in (B-D) and (F) are represented as median + interquartile range. *P<0.05, **P<0.01, ****P<0.0001 by Mann-Whitney U test or Kruskal-Wallis test for multiple comparisons.
Supplementary Material
Acknowledgments
The authors thank the team at the Disease Modelling Unit at the University of East Anglia for support with the in vivo work. Schematic figures were partly produced using Servier Medical Art, provided by Servier, licensed under a Creative Commons Attribution 3.0 unported license.
Funding Statement
Funding: This work was supported by a Wellcome Trust Clinical Research Fellowship (220534/Z/20/Z) (to CH), the Medical Research Council project (MR/T02934X/1) (to SAR), a Sir Henry Welcome Postdoctoral Fellowship (213731/Z/18/Z) (to EEW), and the Biotechnology and Biological Sciences Research Council, part of UK Research and Innovation’s Core Capability (grant BB/CCG1720/1).
Data-sharing statement
Detailed data available on request.
References
- 1.DiNardo CD, Pratz K, Pullarkat V, et al. Venetoclax combined with decitabine or azacitidine in treatment-naive, elderly patients with acute myeloid leukemia. Blood. 2019;133(1):7-17. [DOI] [PMC free article] [PubMed] [Google Scholar]
- 2.Wei AH, Montesinos P, Ivanov V, et al. Venetoclax plus LDAC for newly diagnosed AML ineligible for intensive chemotherapy: a phase 3 randomized placebo-controlled trial. Blood. 2020;135(24):2137-2145. [DOI] [PMC free article] [PubMed] [Google Scholar]
- 3.Wang ES. Treating acute myeloid leukemia in older adults. Hematology Am Soc Hematol Educ Program. 2014;2014(1):14-20. [DOI] [PubMed] [Google Scholar]
- 4.Almeida AM, Ramos F. Acute myeloid leukemia in the older adults. Leuk Res Rep. 2016;6:1-7. [DOI] [PMC free article] [PubMed] [Google Scholar]
- 5.Dennis M, Copland M, Kaur H, et al. Management of older patients with frailty and acute myeloid leukaemia: a British Society for Haematology good practice paper. Br J Haematol. 2022;199(2):205-221. [DOI] [PubMed] [Google Scholar]
- 6.DiNardo CD, Jonas BA, Pullarkat V, et al. Azacitidine and venetoclax in previously untreated acute myeloid leukemia. N Engl J Med. 2020;383(7):617-629. [DOI] [PubMed] [Google Scholar]
- 7.Abdul-Aziz AM, Sun Y, Hellmich C, et al. Acute myeloid leukemia induces protumoral p16INK4a-driven senescence in the bone marrow microenvironment. Blood. 2019;133(5):446-456. [DOI] [PMC free article] [PubMed] [Google Scholar]
- 8.Moore JA, Mistry JJ, Hellmich C, et al. LC3-associated phagocytosis in bone marrow macrophages suppresses acute myeloid leukemia progression through STING activation. J Clin Invest. 2022;132(5):1-16. [DOI] [PMC free article] [PubMed] [Google Scholar]
- 9.Simonart T, Van Vooren JP. Interleukin-1 beta increases the BCL-2/BAX ratio in Kaposi’s sarcoma cells. Cytokine. 2002;19(6):259-266. [DOI] [PubMed] [Google Scholar]
- 10.Rinaudo MS, Su K, Falk LA, Halder S, Mufson RA. Human interleukin-3 receptor modulates bcl-2 mRNA and protein levels through protein kinase C in TF-1 cells. Blood. 1995;86(1):80-88. [PubMed] [Google Scholar]
- 11.Sepulveda P, Encabo A, Carbonell-Uberos F, Minana MD. BCL-2 expression is mainly regulated by JAK/STAT3 pathway in human CD34+ hematopoietic cells. Cell Death Differ. 2007;14(2):378-380. [DOI] [PubMed] [Google Scholar]
- 12.Genestier L, Bonnefoy-Berard N, Rouault JP, Flacher M, Revillard JP. Tumor necrosis factor-alpha up-regulates Bcl-2 expression and decreases calcium-dependent apoptosis in human B cell lines. Int Immunol. 1995;7(4):533-540. [DOI] [PubMed] [Google Scholar]
- 13.Elbaz O, Shaltout A. Implication of granulocyte-macrophage colony stimulating factor (GM-CSF) and interleukin-3 (IL-3) in children with acute myeloid leukaemia (AML); malignancy. Hematology. 2001;5(5):383-388. [PubMed] [Google Scholar]
- 14.Nitsche A, Junghahn I, Thulke S, et al. Interleukin-3 promotes proliferation and differentiation of human hematopoietic stem cells but reduces their repopulation potential in NOD/SCID mice. Stem Cells. 2003;21(2):236-244. [DOI] [PubMed] [Google Scholar]
- 15.Tajer P, Cante-Barrett K, Naber BAE, et al. IL3 has a detrimental effect on hematopoietic stem cell self-renewal in transplantation settings. Int J Mol Sci. 2022;23(21):1-8. [DOI] [PMC free article] [PubMed] [Google Scholar]
Associated Data
This section collects any data citations, data availability statements, or supplementary materials included in this article.
Supplementary Materials
Data Availability Statement
Detailed data available on request.


